Effects of hand movement path on motor cortical activity in awake, behaving rhesus monkeys
18
Exp Brain Res (1991) 83:285-302 E nResearch Springer-Verlag1991 Effects of hand movement path on motor cortical activity in awake, behaving rhesus monkeys S. Hocherman* and S.P. Wise Laboratory of Neurophysiology, National Institute of Mental Health, P.O. Box 289, Poolesville, MD 20837, USA Received November 2, 1989 / Accepted June 30, 1990 Summary. Neuronal activity was studied in the primary (M1), supplementary (M2), dorsal premotor (PMd), and ventral premotor (PMv) cortex of awake, behaving rhesus monkeys. The animals performed forelimb movements to three targets, each approached by three different types of trajectories. With one trajectory type, the monkey moved its hand straight to the target, with another, the path curved in a clockwise direction, and with a third, the path curved in a counter-clockwise direction. We examined whether neuronal activity in these areas exclusively reflects a hand movement's net distance and direction or, alter- natively, whether other factors also influence cortical activity. It was found that neuronal activity during all phases of a trial reflects aspects of movement in addition to target location. Among these aspects may be selection of an integrated motor act from memory, perhaps specifying the entirety of a path by which the hand moves to a target. Key words: Cerebral cortex - Motor system - Motor cortex Premotor cortex - Supplementary motor cortex- Frontal lobe - Movement trajectory - Monkey Introduction The earliest studies of motor cortical activity in awake, behaving primates showed that M1 neurons reflect the direction and force of forelimb movement (Evarts 1968, 1969; Humphrey et al. 1970). More recently, work in the same tradition has shown that the direction of an intended forelimb movement is coarsely "coded" in the activity of individual motor cortical neurons, and may be coded more precisely through the combined activity of neuronal populations (Georgopoulos et al. 1982). Although there * Present address: Department of Physiology, Faculty of Medicine, Technion Israel Institute of Technology, P.O. Box 964, Haifa, Israel. Offprint requests to: S.P. Wise (address see above) has been debate about whether such activity specifies or causes limb movements through space (Mussa-Ivaldi 1988; see discussion in Georgopoulos 1987), the phenom- enon is a robust one that has been repeated many times (Schwartz et al. 1988; Kalaska et al. 1989; Georgopoulos et al. 1989; Caminiti et al. 1989, 1990; Murray and Sessle 1989). Despite the success of this approach, the data available to date have certain limitations. First, they concern only straight movements to a target. There are many potential paths to a target even when a movement is constrained to two dimensions. Second, until recently (Crammond and Kalaska 1989a,b,c; Caminiti et al. 1989, Amos et al. 1988; Karluk and Ebner 1989), these studies have concentrated on M1 to the exclusion of M2 (Woolsey et al. 1952) and PM (Bucy and Fulton 1933; Fulton 1935). It has been proposed that nonprimary motor areas (M2 and PM) are necessary for the implementation of complex limb move- ments (Moll and Kuypers 1977). Third, despite the exis- tence, even within M1, of several different patterns of neuronal activity, each with distinctive properties (Evarts 1968, 1969; Tanji and Evarts 1976; Thach 1978; Weinrich et al. 1984; Kwan et al. 1981, 1985; Wannier et al. 1989), studies of neuronal directional properties have generally concentrated on modulation immediately before move- ment (but cf. Crammond and Kalaska 1989a,c; Geor- gopoulos et al. 1989). The present study extends previous work by examining neuronal activity (a) associated with curved as well as straight movements to a target, (b) during several phases of a visually instructed motor task, and (c) in four parts of motor cortex. Selected aspects of these data have been presented previously in preliminary form (Hocherman and Wise 1989, 1990). Material and methods Subjects and apparatus Two rhesus monkeys (Macaca mulatta), weighing 5.0 kg and 5.5 kg, were operantly conditioned to make three kinds of movement
-
Upload
independent -
Category
Documents
-
view
4 -
download
0
Transcript of Effects of hand movement path on motor cortical activity in awake, behaving rhesus monkeys

Exp Brain Res (1991) 83:285-302
E nResearch �9 Springer-Verlag 1991
Effects of hand movement path on motor cortical activity in awake, behaving rhesus monkeys
S. Hocherman* and S.P. Wise
Laboratory of Neurophysiology, National Institute of Mental Health, P.O. Box 289, Poolesville, MD 20837, USA
Received November 2, 1989 / Accepted June 30, 1990
Summary. Neuronal activity was studied in the primary (M1), supplementary (M2), dorsal premotor (PMd), and ventral premotor (PMv) cortex of awake, behaving rhesus monkeys. The animals performed forelimb movements to three targets, each approached by three different types of trajectories. With one trajectory type, the monkey moved its hand straight to the target, with another, the path curved in a clockwise direction, and with a third, the path curved in a counter-clockwise direction. We examined whether neuronal activity in these areas exclusively reflects a hand movement's net distance and direction or, alter- natively, whether other factors also influence cortical activity. It was found that neuronal activity during all phases of a trial reflects aspects of movement in addition to target location. Among these aspects may be selection of an integrated motor act from memory, perhaps specifying the entirety of a path by which the hand moves to a target.
Key words: Cerebral cortex - Motor system - Motor cortex Premotor cortex - Supplementary motor co r t ex - Frontal lobe - Movement trajectory - Monkey
Introduction
The earliest studies of motor cortical activity in awake, behaving primates showed that M1 neurons reflect the direction and force of forelimb movement (Evarts 1968, 1969; Humphrey et al. 1970). More recently, work in the same tradition has shown that the direction of an intended forelimb movement is coarsely "coded" in the activity of individual motor cortical neurons, and may be coded more precisely through the combined activity of neuronal populations (Georgopoulos et al. 1982). Although there
* Present address: Department of Physiology, Faculty of Medicine, Technion Israel Institute of Technology, P.O. Box 964, Haifa, Israel. Offprint requests to: S.P. Wise (address see above)
has been debate about whether such activity specifies or causes limb movements through space (Mussa-Ivaldi 1988; see discussion in Georgopoulos 1987), the phenom- enon is a robust one that has been repeated many times (Schwartz et al. 1988; Kalaska et al. 1989; Georgopoulos et al. 1989; Caminiti et al. 1989, 1990; Murray and Sessle 1989).
Despite the success of this approach, the data available to date have certain limitations. First, they concern only straight movements to a target. There are many potential paths to a target even when a movement is constrained to two dimensions. Second, until recently (Crammond and Kalaska 1989a,b,c; Caminiti et al. 1989, Amos et al. 1988; Karluk and Ebner 1989), these studies have concentrated on M1 to the exclusion of M2 (Woolsey et al. 1952) and PM (Bucy and Fulton 1933; Fulton 1935). It has been proposed that nonprimary motor areas (M2 and PM) are necessary for the implementation of complex limb move- ments (Moll and Kuypers 1977). Third, despite the exis- tence, even within M1, of several different patterns of neuronal activity, each with distinctive properties (Evarts 1968, 1969; Tanji and Evarts 1976; Thach 1978; Weinrich et al. 1984; Kwan et al. 1981, 1985; Wannier et al. 1989), studies of neuronal directional properties have generally concentrated on modulation immediately before move- ment (but cf. Crammond and Kalaska 1989a,c; Geor- gopoulos et al. 1989). The present study extends previous work by examining neuronal activity (a) associated with curved as well as straight movements to a target, (b) during several phases of a visually instructed motor task, and (c) in four parts of motor cortex. Selected aspects of these data have been presented previously in preliminary form (Hocherman and Wise 1989, 1990).
Material and methods
Subjects and apparatus
Two rhesus monkeys (Macaca mulatta), weighing 5.0 kg and 5.5 kg, were operantly conditioned to make three kinds of movement
286
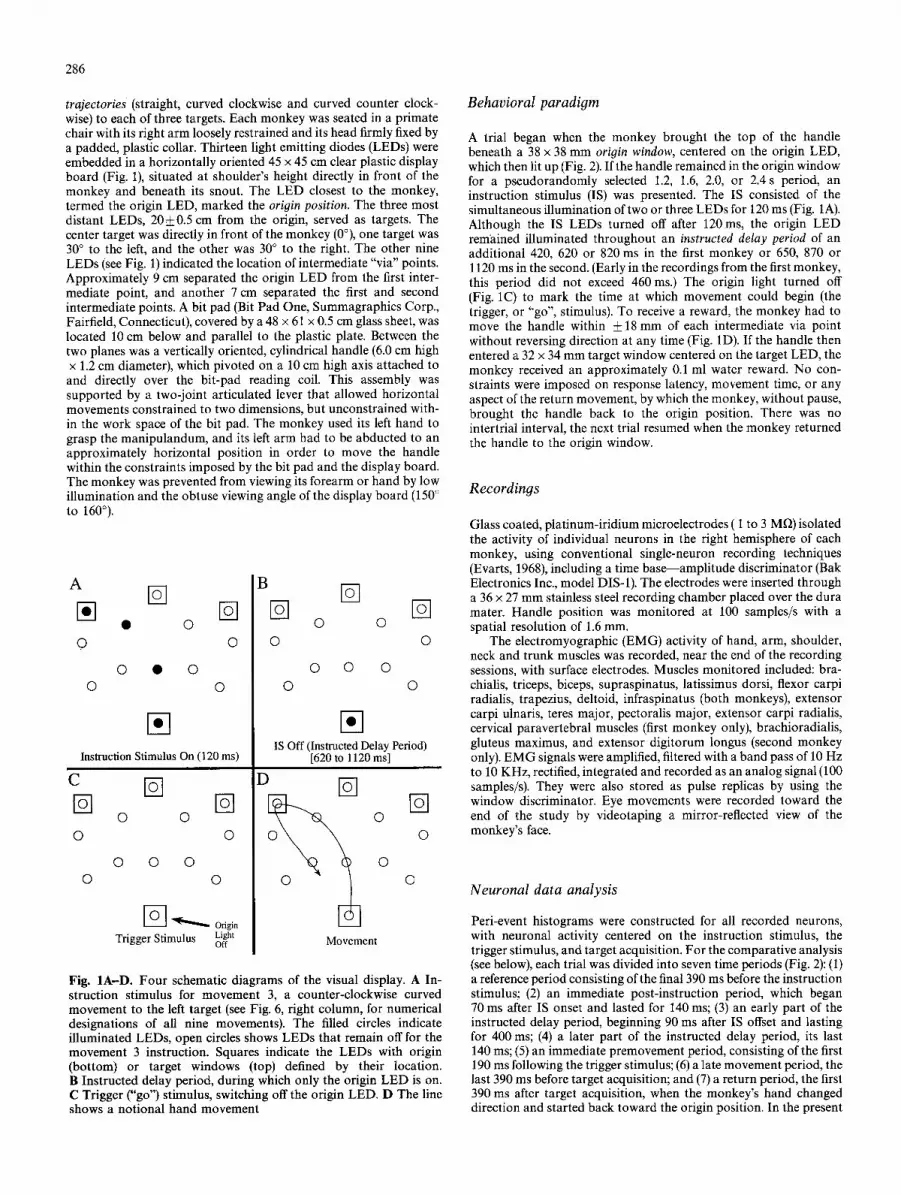
trajectories (straight, curved clockwise and curved counter clock- wise) to each of three targets. Each monkey was seated in a primate chair with its right arm loosely restrained and its head firmly fixed by a padded, plastic collar. Thirteen light emitting diodes (LEDs) were embedded in a horizontally oriented 45 x 45 cm clear plastic display board (Fig. 1), situated at shoulder's height directly in front of the monkey and beneath its snout. The LED closest to the monkey, termed the origin LED, marked the origin position. The three most distant LEDs, 20___0.5 cm from the origin, served as targets. The center target was directly in front of the monkey (0~ one target was 30 ~ to the left, and the other was 30 ~ to the right. The other nine LEDs (see Fig. 1) indicated the location of intermediate "via" points. Approximately 9 cm separated the origin LED from the first inter- mediate point, and another 7 cm separated the first and second intermediate points. A bit pad (Bit Pad One, Summagraphics Corp., Fairfield, Connecticut), covered by a 48 x 61 x 0.5 cm glass sheet, was located 10 cm below and parallel to the plastic plate. Between the two planes was a vertically oriented, cylindrical handle (6.0 cm high x 1.2 cm diameter), which pivoted on a 10 cm high axis attached to and directly over the bit-pad reading coil. This assembly was supported by a two-joint articulated lever that allowed horizontal movements constrained to two dimensions, but unconstrained with- in the work space of the bit pad. The monkey used its left hand to grasp the manipulandum, and its left arm had to be abducted to an approximately horizontal position in order to move the handle within the constraints imposed by the bit pad and the display board. The monkey was prevented from viewing its forearm or hand by low illumination and the obtuse viewing angle of the display board (150 ~ to 160~
g Io--1 �9 0
0
0 0 �9 0
Instruction Stimulus On (120 ms)
B
Io-1 Io---1 0
0 0
0 0 0
D D
0 0
0 0 0
c D Bq IN
0 0
0 0
0 0 0
0 0
['-0-'] ~ ' ' ' , ~ Origin Trigger Stimulus Light Off
IS Off (Instructed Delay Period) [620 to 1120 ms]
D D
O
O
O
Movement
Fig. l A D . Four schematic diagrams of the visual display. A In- struction stimulus for movement 3, a counter-clockwise curved movement to the left target (see Fig. 6, right column, for numerical designations of all nine movements). The filled circles indicate illuminated LEDs, open circles shows LEDs that remain off for the movement 3 instruction. Squares indicate the LEDs with origin (bottom) or target windows (top) defined by their location. B Instructed delay period, during which only the origin LED is on. C Trigger ("go") stimulus, switching off the origin LED. D The line shows a notional hand movement
Behavioral paradigm
A trial began when the monkey brought the top of the handle beneath a 38 x 38 mm origin window, centered on the origin LED, which then lit up (Fig. 2). If the handle remained in the origin window for a pseudorandomly selected 1.2, 1.6, 2.0, or 2.4 s period, an instruction stimulus (IS) was presented. The IS consisted of the simultaneous illumination of two or three LEDs for 120 ms (Fig. 1A). Although the IS LEDs turned off after 120 ms, the origin LED remained illuminated throughout an instructed delay period of an additional 420, 620 or 820 ms in the first monkey or 650, 870 or 1120 ms in the second. (Early in the recordings from the first monkey, this period did not exceed 460 ms.) The origin light turned off (Fig. 1C) to mark the time at which movement could begin (the trigger, or "go", stimulus). To receive a reward, the monkey had to move the handle within • 18 mm of each intermediate via point without reversing direction at any time (Fig. 1D). If the handle then entered a 32 x 34 mm target window centered on the target LED, the monkey received an approximately 0.1 ml water reward. No con- straints were imposed on response latency, movement time, or any aspect of the return movement, by which the monkey, without pause, brought the handle back to the origin position. There was no intertrial interval, the next trial resumed when the monkey returned the handle to the origin window.
Recordings
Glass coated, platinum-iridium microelectrodes ( 1 to 3 Mr2) isolated the activity of individual neurons in the right hemisphere of each monkey, using conventional single-neuron recording techniques (Evarts, 1968), including a time base--amplitude discriminator (Bak Electronics Inc., model DIS-I). The electrodes were inserted through a 36 x 27 mm stainless steel recording chamber placed over the dura mater. Handle position was monitored at 100 samples/s with a spatial resolution of 1.6 ram.
The electromyographic (EMG) activity of hand, arm, shoulder, neck and trunk muscles was recorded, near the end of the recording sessions, with surface electrodes. Muscles monitored included: bra- chialis, triceps, biceps, supraspinatus, latissimus dorsi, flexor carpi radialis, trapezius, deltoid, infraspinatus (both monkeys), extensor carpi ulnaris, teres major, pectoralis major, extensor carpi radialis, cervical paravertebral muscles (first monkey only), brachioradialis, gluteus maximus, and extensor digitorum longus (second monkey only). EMG signals were amplified, filtered with a band pass of 10 Hz to 10 KHz, rectified, integrated and recorded as an analog signal (100 samples/s). They were also stored as pulse replicas by using the window discriminator. Eye movements were recorded toward the end of the study by videotaping a mirror-reflected view of the monkey's face.
Neuronal data analysis
Peri-event histograms were constructed for all recorded neurons, with neuronal activity centered on the instruction stimulus, the trigger stimulus, and target acquisition. For the comparative analysis (see below), each trial was divided into seven time periods (Fig. 2): (1) a reference period consisting of the final 390 ms before the instruction stimulus; (2) an immediate post-instruction period, which began 70 ms after IS onset and lasted for 140 ms; (3) an early part of the instructed delay period, beginning 90 ms after IS offset and lasting for 400 ms; (4) a later part of the instructed delay period, its last 140 ms; (5) an immediate premovement period, consisting of the first 190 ms following the trigger stimulus; (6) a late movement period, the last 390 ms before target acquisition; and (7) a return period, the first 390 ms after target acquisition, when the monkey's hand changed direction and started back toward the origin position. In the present

287
Instruction Lights
Or ig in Light
I
I
Monkey ~ _ _ 1 . I
i
Init
Re f
390 140 I
I
Signal
Set
40O
/ /
/ / Instructed Delay
Period 620,870, or 1120 ms
/ / IS IS on of f
Set Mvt
140 190
late
Mvt Ret
390 390
TS acq
Fig. 2. Temporal events of a single trial and designation of task periods. Each trial begins as the handle is returned to the origin position to initiate the trial (Init), at which time the origin LED is switched on. After a reference period (Ref), the visuospatial instruc- tion is presented for 120 ms. IS on and IS off mark the presentation and removal of the instruction stimulus (IS). Switching off the origin
light served as the trigger stimulus (TS). Acquisition of the target (acq) indicates entry into the target window. The horizontal arrows at the top indicate the seven task periods, the number beneath each arrow is the duration in ms over which neuronal activity was averaged. The bottom trace shows a facsimile of handle position. Drawing not to scale
report, we refer to the activity from these periods as: (1) reference period activity, (2) signal-related activity, (3) early set-related activity (set a), (4) late set-related activity (set b), (5) premovement-related activity, (6) late movement-related activity, and (7) return period activity, respectively. These definitions differ somewhat from those used in the past (Weinrich and Wise 1982; Kurata and Wise 1988). For example, the activity designated as set a has been classed as late signal-related, rather than as set-related, activity in past reports from this laboratory. Further, movement-related activity has been pre- viously confined to the immediate premovement period, whereas later activity is also considered here. Accordingly, for the analysis of variance, we defined the task periods more consistently with past practice: (1) the reference period was measured during the final 500 ms before IS, (2) signal-related activity from 110 ms until 250 ms after the IS, (3) set-related activity during the 300 ms before the trigger signal, (4) the premovement related activity during the 200 ms before movement onset, and (5) the late movement-related activity in the first 300 ms after movement onset, i.e., during most of the movement toward the target.
Comparative analysis. The neuronal activity rate (Ax) within each task period was averaged, typically across 5 to 15 trials for each of the nine movements. The reference period activity (R), averaged across all nine movements for each neuron (N-~90), and the neuron's highest average discharge rate during any task period for any movement (Amax), were used to calculate a neuronal modulation index (M):
M = (Ax - R)/(nmax- R).
M thus ranged from 0 (no modulation) to 1 (maximal modulation) for neurons excited relative to their reference period activity. For inhibited neurons, there was no lower limit to modulation depth, but in practice they usually remained between 0 and - 1.
Neurons were classified as task-related if their neuronal modula- tion (M) during a task period exceeded (for excited neurons) or was less than (for inhibited neurons) that neuron's reference period activity by 1.96 x SD/[(N)~ where SD = the standard deviation of R, and N = t h e number of trials (p<0.01, assuming a normal
distribution of M and R). All subsequently described analysis was limited to task-related neurons, so defined.
A neuron was classed as trajectory selective by a comparative procedure, performed independently for each task period. A com- parison determined, for each of the three targets, which movement had the largest I M I. Note that because mrnax and R were constants for each neuron, their values could not affect this comparison. To be classed as trajectory selective the comparison had to either (a) select the same trajectory for all three targets (termed the strict criteria) or (b) select the same trajectory for at least two of the three targets (termed the relaxed criteria). For example, if l M I associated with the straight movements exceeded that for both the clockwise and counter-clockwise movements, and did so for the left, center, and right targets, it would be classed as trajectory selective for straight movements (strict criteria). Because we compared three movements to each target, the probability of a given movement being selected by chance is 0.333 for any one target. The probability, p, of the same trajectory type (e.g., straight movements) being selected for all three targets is 0.3333 (= 0.037). That is, 3.7% of neurons should meet the strict criteria for trajectory selectivity by chance alone for any task period. For the relaxed criteria, p equals the probability that only two of the three single-target comparisons would select the same trajectory type, 0.3332 x 0.667 x 3 (= 0.222), plus the probability that all three comparisons would point to the same trajectory (=0.037), which sums to p=0.259. The difference between the predicted and observed numbers of trajectory-selective neurons was tested by binomial approximation to a normal distribution:
[(x - np)/(npq) ~ ~ Z [ = N(0, 1)];
where q = (1 -p ) , n = the sample size, and x = the number of selective neurons observed.
A neuron was classed as target-selective if ] M J for movements to one target exceeded that for movements, of the same trajectory, to the other two targets and that comparison singled out the same target for all three trajectories (the strict criteria) or for at least two of the three trajectories (the relaxed criteria). The probability of a neuron meeting these criteria by chance alone was the same as for trajectory selectivity.

288
A neuron was classed as selective for initial direction, if I M I for movements that began similarly, but diverged to different targets (e.g., movements 2 and 4, see Fig. 6), exceeded that for the other two movements to the same target. For the left and right initial move- ment directions, only two comparisons could be performed, and the probability of cell meeting the initial direction selectivity criteria by chance alone was 0.3332 (=0.111). For straight initial movement direction, three comparisons could be made and the selection criteria and probabilities are the same as for trajectory and target selectivity at both the strict and relaxed criteria levels.
Analysis of variance. A repeated measures multiple analysis of variance (SYSTAT, Inc., Evanston, Illinois) was performed for two factors each with three levels, trajectories and targets, and their interactions. Univariate F tests were performed for each neuron sampled.
Histolooy
Near the end of recording single-neuron data from the first monkey, electrolytic lesions (10 #A for 10 s, cathodal current) were made at three sites in the precentral gyrus. In the second monkey, no electrolytic lesions were made. After the termination of the recording sessions, each monkey was deeply anesthetized with sodium pento- barbital and perfused through the heart with aldehyde fixatives. During the perfusion, steel pins were inserted at known coordinates in each monkey. For each monkey, the brain was photographed, sectioned on a freezing microtome at 40 #m thickness, mounted on glass slides, and stained for Nissl substance with thionin.
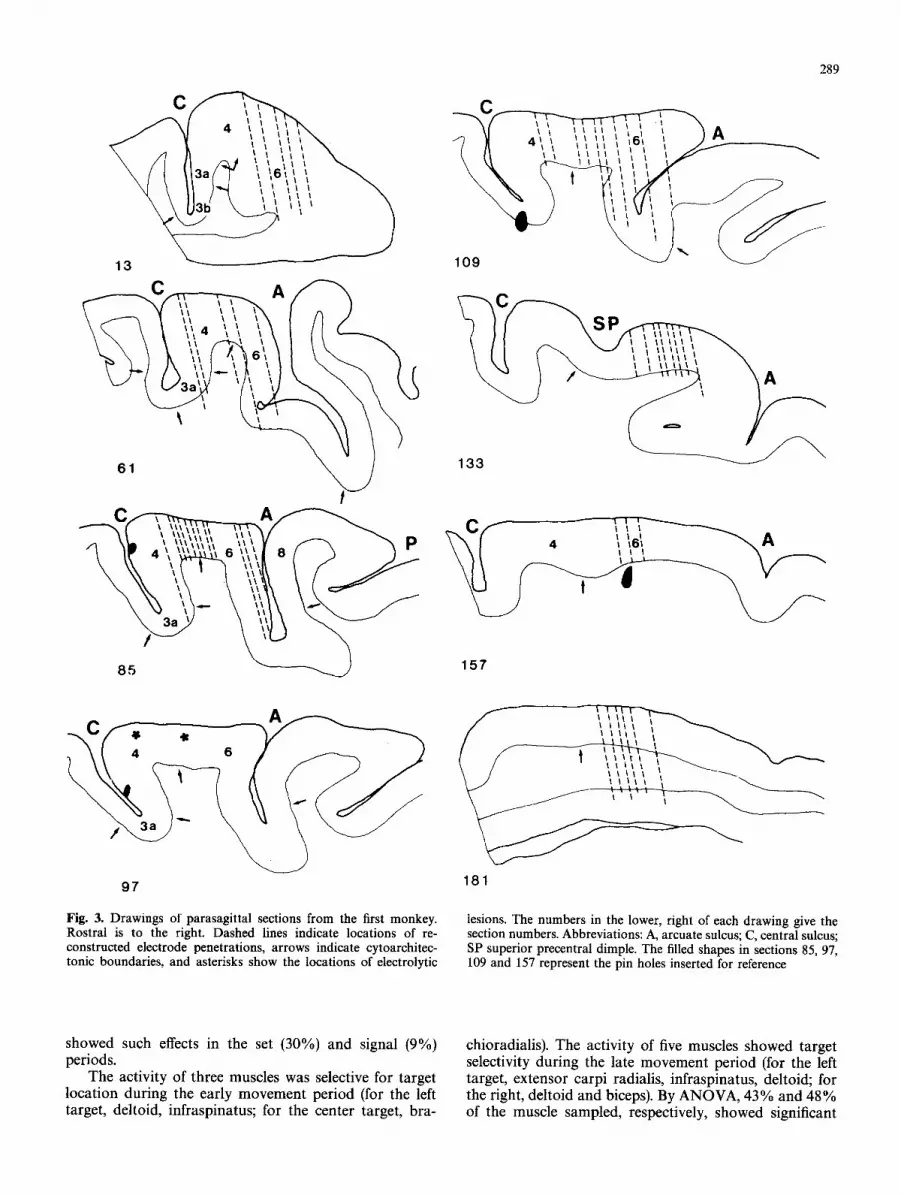
Surface projections of the recording sites and the estimated track of each penetration was plotted, for the first monkey, by reference to the three electrolytic lesions and to the pin holes (Fig. 3). In the second monkey, surface penetration sites could be related to the pin holes and surface landmarks. A composite reconstruction of the recording locations was created by plotting the data from the second monkey onto the sulcal map of the first monkey, using the qualitative best fit of the arcuate, central, and principal sulci. Most of the rostrally situated cells come from the second monkey and most caudally located neurons come from the first. In both monkeys, most of the data were collected from one area, then the next field was explored, ad seriatim. No attempt was made to identify each record- ing track in the histological material or to determine the depth of recording for any cell. Previously described (Weinrich and Wise 1982; Wise 1984, 1985) cytoarchitectonic criteria were used to distinguish PM (area 6) from M1 (area 4). Within area 6, the M2/PMd boundary was assumed to be the junction between the convexity of the hemisphere and its medial surface, whereas the PMd/PMv boundary was assumed to be the genu of the arcuate sulcus.
Results
Behavior
The first monkey had a mean performance of 89% correct (based on a sample of 670 trials), which was slightly better for clockwise (91%) and straight (92%) than for counter- clockwise (83%) trajectories. The second monkey had a mean performance of 83% correct (based on 591 trials), which was similar (82% to 86%) for all trajectories. On nearly 3% of the trials, each monkey made premature movements. All other errors resulted from inaccurate performance of the instructed movement, mainly by deviat- ing from the required path, or from moving along an incorrect trajectory. Correct movements averaged 37 to
51 cm/s in the first monkey and 49 to 68 cm/s in the second, with durations of 4 8 8 + 1 9 0 m s (S.D.) and 402 + 149 ms, respectively. The nine movements were clearly distinct (Fig. 4), and, as seen in a sample of averages presented in Fig. 5, the movements out to the target and back to the origin were executed rapidly and smoothly (Table 1). It can also be seen from Fig. 5 that a stable posture was maintained in the initial part of each trial, i.e., during the reference and instructed delay periods. The mean distance traversed by the handle during those periods was 0.44+0.33 m m in a 150 ms sampling period for the first monkey and 0.35 + 0.26 m m for the second (N = 45, five for each movement, from one session). The first monkey had shorter response latencies (151 _ 59 ms) than the second (254___ 93 ms), and the existence of some very short response latencies indicated that the first monkey was able to anticipate the time of trigger stimulus pre- sentation. Response latency and movement times for trials of different trajectories or different targets did not differ substantially for either monkey (Table 1).
Videotape analysis of eye position revealed that the animals maintained gaze in the general direction of the origin LED during the reference period. A saccade toward the area of the intermediate LEDs occurred soon after the instruction stimulus came on. Another saccade brought the eyes back toward the origin following the termination of the instruction stimulus. Gaze toward the origin was maintained until the trigger stimulus was presented, at which time the eyes usually followed the hand movement. Additional saccades and unrelated eye movements fre- quently occurred during the return movement. Many small saccades were superimposed on this general pattern, and gross variations were observed such as maintenance of gaze toward the origin throughout a trial or shifting gaze from the hand during movement.
Muscle activity
By the comparative analysis, the E M G activity of two muscles was found to be selective for straight (infraspina- tus) and clockwise (extensor carpi ulnaris) trajectories in the early part of the instructed delay period, using the same criteria as for the neuronal analysis. The activity of two additional muscles (deltoid and extensor carpi radialis) was found to be selective for clockwise trajectories in the late part of the instructed delay period. The number of muscles that met the strict criteria for trajectory selectivity increased to five in the period immediately before move- ment (for clockwise trajectories, infraspinatus, trapezius; for straight trajectories, extensor carpi ulnaris; for counter clockwise trajectories, cervical paravertebral and deltoid muscles) and nine in the late movement period (for clock- wise trajectories, brachialis, deltoid, infraspinatus; for counter-clockwise trajectories, triceps, cervical paraverte- bral, biceps, extensor carpi radialis, pectoralis major, and trapezius). By analysis of variance, performed for pulse- replica E M G data as for neuronal data, most muscles showed significant trajectory effects during the premove- ment (50%) and late movement periods (73%), but fewer
289
. ~ \
13
, C A
1 0 9
ii
C
SP A
C A
P
8 5 - ~ 1 7
97
' ( I I t V ~ r ~ . . . . . . . _
181
Fig. 3. Drawings of parasagittal sections from the first monkey. Rostral is to the right. Dashed lines indicate locations of re- constructed electrode penetrations, arrows indicate cytoarchitec- tonic boundaries, and asterisks show the locations of electrolytic
lesions. The numbers in the lower, right of each drawing give the section numbers. Abbreviations: A, arcuate sulcus; C, central sulcus, SP superior precentral dimple. The filled shapes in sections 85, 97, 109 and 157 represent the pin holes inserted for reference
showed such effects in the set (30%) and signal (9%) periods.
The activity of three muscles was selective for target location during the early movement period (for the left target, deltoid, infraspinatus; for the center target, bra-
chioradialis). The activity of five muscles showed target selectivity during the late movement period (for the left target, extensor carpi radialis, infraspinatus, deltoid; for the right, deltoid and biceps). By ANOVA, 43% and 48% of the muscle sampled, respectively, showed significant

290
o
> -
800o00 . . g ~ ~
+ o �9 4"+ o + o ~ +
�9 + ~100 o o + �9 ~ o + +
t + : o + o o ++ o 8 + : o § ~ 2 4 7 o
o
�9 '~ ~ - + 8 o ~ J: +" oO o:
" . . I:§ : o: �9 �9 ~176
. . . . n . . . . u . . . . i . . . . n . . . . u . . . . t . . . . i . . . .
X Distance
Fig. 4. Averaged hand movements along clockwise (filled circles), straight (+ signs) and counter-clockwise (open circles) trajectories. All movements begin at the origin position (bottom square) and end at one of the three target locations (top squares). Each average consists of five individual movement records sampled every 10 ms, aligned on target acquisition. Scale: each major division equals 3.8 cm
Table 1. Response latencies and movement times for each of the nine movements. Values are averages of six samples taken of each monkey's behavior
Response latency Movement time Movement Monkey 1 Monkey 2 Monkey 1 Monkey 2
1 158 ___ 57 275 • 92 539 ___ 92 478 • 160 2 143 +__ 56 244 • 87 412 ___ 152 347 -t- 124 3 127 -t- 53 234 • 99 490 _+ 197 347 • 149 4 135• 231• 474• 456• 5 164 -I- 55 287 • 92 510 __+ 171 367 • 121 6 145-t-62 241+ 100 432• 408_168 7 128• 225• 516_241 405• 8 181• 241_104 521• 335• 9 168 + 61 277 • 90 490 -I- 187 434 • 142
target effects in the premovement and late movement periods. Only 11% and 18% showed target effects in the signal and set periods, respectively.
Selectivity
A total of 324 task-related neurons were recorded in M1 (76), M2 (60), PMd (115), and PMv (73). Cells with trajectory (Figs 6 and 7), target (Fig. 8), and initial segment selectivity (not shown) were observed in all cortical fields examined and in all task periods. Figure 9 shows the proport ion of cells with the various kinds of selectivity in each cortical field and for each task period. Tables 2 and 3 show their numbers and compare the observed number of trajectory and target selective neurons with the number
X
. . . . . . . i
t acq
1 Y
2
3
4
5
7
8
9
0 .5s
?
t
Fig. 5. Averaged component movement traces. The X (left column) and Y (right column) components of movements 1 through 9 are displayed as a function of time. Each average is aligned on target acquisition (acq). (See Fig. 6, right column, for the numerical de- signation of each movement). Calibration bar: 19.5 cm
predicted to occur by chance variation. Those tables are based on the comparative analysis described in the Mate- rial and methods. Table 4 shows the results of a cell-by-cell analysis of variance with repeated measures. The cortical distribution of trajectory and target selective neurons, by the comparative analysis, is shown in Fig. 10. The distribu- tion of cells with trajectory or target effects by ANOVA did not differ appreciably from that shown in Fig. 10. Mean discharge amplitudes are given in Table 5.
The largest proport ion of trajectory-selective cells was found in M 1 (Tables 2 and 4). Target selectivity was less commonly observed in M 1 than was trajectory selectivity, though, with the exception of signal-related activity, target selectivity was generally more prevalent than in the other three areas (Tables 3 and 4). Initial-segment selectivity was relative rare (Fig. 9). Most instances of trajectory selectiv- ity reflected predominant modulation for curved rather than straight movements in M 1 (Table 2). As for cells with target selectivity, in some task periods there was a distinct preference for the left or right target rather than for the center target (Fig. 9, Table 3), though this pattern is not as prominent as the preference for curved vs. straight move- ments, and is not observed for movement-related activity.
In PMd there was a smaller proport ion of trajectory- selective set- and movement-related cells than in M 1, but the number was nevertheless significant for all task periods (Tables 2 and 4). There were more instances of selectivity for curved than for straight trajectories for signal-related activity, as in M1, but for set- and premovement-related activity this difference was not observed. Target and initial

B B B
�9 . o
�9 "
B
::,:,i ,,, :,,:
!ii , . . . . . . . . . : i !I , �9
291
!,,i ' : , : , " , , , ' , , , , : , ; " ; ; ,,,, : , , , , , , , , , : ' ,
, ' ' ,' ' , ' , ~ , , ; , , , , , , ; : , ; , , , , i , , ' ~ ....
: ..... . ' . .;'.~ :.':'.'"'".':' ".' :: i'.. '.. :" ": : , , , , ,,,:, ~,~ , , . ' . . . . , , , . , , ~ , , , ,
. . . . . . . . q . § . . . . . . . . . . . . . . . . . . : , § ,
, , , , ~ . . . . . . . . ~ t . . . . . . . . . . * , t . . . . . . . . . . . . . . * . . . . . . . .
i "
B
6 t ~2~ [] " ; , , ' / ' - ' , " , , i , ' , ' ','L ~":',, ', ' ,, ' ,, '~',
. . . . . . . . . . p . * . . . . . . . . . . . : , , **
' , ' : , , , ' , , ' , ",,, ; , , ; , ' , , ; ; , , ' , : : , , ' , ' i ' " ~. �9 �9
, , . P , t . . . . . . . . : *
'. ' . ' . " ' , :"+' '.:' : : '"': ' "'.': :: '. . . . . . i. ' . : .'. " , : , ~ *, ',,' i i ' , , ' , , ' , : : , ~ , , , 9 , * . . . . . . . . . . : , , * ,
' : ' , ' ? ' , ' , " , , ' i , " , , ' , , ~' ' : ,i,',,,,',,;,,.'.,.',,'~";',',"" '.i,,',,',', ',
. . . . . . . . ~ , * . . , . . . . . . . . . . . . . . . . . . . i . . . . . . . . . . . . . . . t , . . . . . .
:,,' ' " , ' , , , . . . . . . . ~ ,~, ,;/, ', ',,.,,:,",.". . . . . . . . . ~..;~,,~,,,,,,,~,,,,,,.;,, ,' ~,i ,", ,' ', ,'9 ' ~',',' ,; ~ "I'.',' ,",',':V~,'.':,;:",,N'.::':;'.'.~ ,',"~,',,~ ........
IS = ~ tg "~o f f '~ ~::::~mvt on TS
': '; ' '.'. '." . . = ~'":'"::'. ,,','i,'~,',::' :-:::::,:" . . . . . . . = . . . . . . . . . . . . , . . . . . . . . . . t ,
" " ' " *~ '?":':""'"'""" '" " ' '" 'i':":':'":;":":' 0 .5 S
Fig. 6. Set-related neuron from PMd that met the strict criteria for trajectory selectivity. Activity associated with each movement (1 through 9) is shown as rasters and reciprocal interval plots, aligned on the trigger stimulus (TS). The movement number is shown at the upper left of each plot. Activity scales are in impulses/s and are identical for all plots. The instruction stimulus onset (IS on) and
9 t 1 2 0
',',, , ':,, ',",,;, ' . . . . . ; ' ,; ' , ' ,,:, ' ',',',~,' ,, ; , P * , : §
'...'..:'..':.:...'.~' ..... ~ .:'.'..:..:..'.'i.'" : �9 " ' , , ' , ' ' , ' ; ' , , ' , , , i ' ~ ; ~ , ' , " , " , , ' : ' , ' , ' , ; ' , : , ' *
, : ,, ; , ,', ,, ,,,.,, ,~, ,+~',,;',:, , , ,,,:, ' , :,~ ,, , ,: :~ , ,
:'..' :.'. '.'.'..'i ~'::'. ;" :' "': ' .: ."~ "' . " �9
A [ ]
B [ ] c
Y offset (off) are marked beneath each raster line by squares and + signs, respectively. The movement onset (mvt) is also marked by a + sign, the one to the right of the TS. The trajectories represented in each column of plots are shown in a schematic drawing above that column. The target locations represented in each row of plots are shown to the right of that row
d i r ec t ion select ivi ty were f o u n d in m o s t task per iods (Tables 2 a n d 3, Fig. 9).
In P M v , ins tances of t ra jec tory , target a n d in i t ia l d i r ec t ion select ivi ty were f o u n d in m o s t t ask per iods (Tables 2 a n d 3, Fig. 9). However , c o m p a r e d to P M d , there was m u c h less ev idence of t ra jec tory select ivi ty in P M v set- re la ted activity. I n c o n t r a s t to M 1, i n s t ances of t r a jec to ry
select ivi ty in P M v showed little preference for cu rved (vs. s t ra ight) t ra jec tor ies (Fig. 9).
Several ins t ances of t ra jec tory select ivi ty were f o u n d in M 2 (Fig. 9, Tab les 2 a n d 4), a n d the p r o p o r t i o n of t rajec- to ry selective n e u r o n s was c o m p a r a b l e to tha t in P M v in m o s t t ask periods. In con t r a s t to M1, there was no p r e p o n d e r a n c e of t r a jec to ry select ivi ty for curved move -

292
A B
. . . . . . . .f .! .- . . . . . . . . . . : ~ . . . . . ~ : . . . . . . . . �9 ; , ' . . . ~ . . . . . . . . . ' ' ~ , . ,,
' .. .: i'-'.":'."~...; ........ :...*...."... . :i i:::~:::i ......... :il;": ." : ' '! "i!'"'.:':':L :.'" ~..~ "
B A ] c
" t J 4 ~
i:~::~::!ii : ..i.~ :'/:..:" ~ i'i':: '..' :. : . . . . . . ;:'..
B ~A C 9
i I �9 ,ii! . .
". '.' ~i .i . . . . ..~i~-.."
. : . ' ~ i. . ~' .'.'. ,. ,!~-.,: . . . : i : : . . . ~. - . . . . . . . . . :.,.,.... : . �9 ,, . ~.. . * . . . . . . . *. . . . . . . . . . . ,
. ? i . . . ~-;-.:..-. ~.'..i:..: . + ~ ' o , t . . . . . . .
' . . .* i ' , " , ' % . . . ' . . . . . . . . ~." ' : ,: . . . . " �9
B
' , . . . ~ . . ~ , . , ,
" ': i:':'.. : . . . . . . :'~:'.:~:ii:':.:: . t , . . . . . . " ' : . : . . . .
, s . . . I t ' ~:~ '~ . c . o n mvt
off
8 A t i , . . , ' ,,, ,..,:~.;,_.;.::.
','. * ** §
Fig. 7. Set-related, trajectory selective M1 neuron that met the relaxed, but not the strict, criteria. Format as in Fig. 6, except that activity displays are aligned on the offset of the instruction signal, the
ments. Instances of target selectivity and initial direction selectivity were similar to those found in other areas (Table 3, Fig. 9).
I n h i b i t e d n e u r o n s
Some target and trajectory selective neurons were inhib- ited during the relevant task period (Fig. 11). The largest p ropor t ion of inhibited neurons was located in P M d
0o .
onset of movement (mvt) is marked by the square and the IS onset (IS on) and target acquisition (acq) are marked by the left and right + signs, respectively
(Figs. 10D, 12); very few were located elsewhere (Fig. 10D) and very few showed initial direction selectivity (not shown). The mean inhibition (4- SD) for trajectory selec- tive neurons in P M d was: - 9 4 - 1 0 impulses/s (N = 9) for the early set-related activity; - 6 + 4 (N = 8) for the late set- related activity; - 1 0 + 9 ( N = 9 ) f o r the premovement- related activity; - 1 5 4 - 14 ( N = 5) for the late movement- related activity; and - 13 4-11 (N = 5) for return period activity (see Table 5 for the calculation algorithm).

293
. , . ~ �9 , ,
. . . . . . . . �9 , ~ . . . . . . . . . ~ ',' , , ; ; , . o , , , , ,,,; .... + § + H , o + § ' ' " ' + ' ' a . . . . § �9 , , , , , § , ,
, § § + , , , d . . . . , . % , , § + , , . , , , , ,
. . . . . ' " ', '**' .+ ' ,' ,', ,','t ',',,",'?. ,$,,',. ;,'. ' . . . . ~'"', ....
§ , , , + , , , . . . . , . , , ~ . . . . . . . . ,$,,, , , , , , ' , , ~,,
5 0
0 . 5 S
, ; ; " ~ ,,, ' '~ 'g , , , , : , ,, § § + , , , . , , , + + + , , ~ , , ,
, , , § 2 4 7 +, , , , i l l , , , , § + , , . . , , , , + , , p , , H ,
' : + . " ~ ' " " t , ' ~" , '
' ' " ' ++ '*+ § . . . . . . ~.t.. ' ' q . " ' + " " ' ' + ' ' , , 1 , ,
. . . . . . . :~ , ~ . . . . ~ , . ) ~ . . . . .
' , ' . t $ + . . . . . . . . . . ~ d , , , , , § , + , , , . , , ,
. . . . : : . , , ~ , , , ~ ....
A D .{
B C
D
U . . . . , ~...*.': ' . , : ." ,,..,~.,~ .......
' ' § § ' % o . . . . . . . . . , , ~ . . . . $ $
+ ' " o H , , , ' . ' ~ , , , �9 . . . . 0 . . . . . . . . . . . .
.,t. ., . .. ~,.;=,..;., ~ ' , ~ , ' , ' , , : , , , " : , ~ ~ , , . , , . . . . . . . . .
I S ~ ~' ' ~ ~ a c q o f f
o n T S
Fig. 8. Target selective neuron from M 1. The activity is combined for all movements to the left target (A, top), center target (B, middle), and right target (C, bottom). All displays are aligned on the trigger stimulus (TS), the instruction stimulus onset (IS on) and offset (off) are marked by + signs, and target acquisition (acq) is marked by open squares beneath each raster line. Trials from each movement trajectory contribute to each raster in the following numbers: 7, 4, 5, 7, 15, 6, 5, 7, and 1 for movements 1 to 9, respectively
C o m b i n a t i o n s o f s e l e c t i v i t y p a t t e r n s
The selectivity of each neuron was evaluated indepen- dently for each task period. Thus, a cell might be selective for one t rajectory in one task period, as well as for a different t rajectory in another (Fig. 13). Of the 106 trajec- tory-selective neurons (using the compara t ive analysis, strict criteria), 13 were selective for different types of trajectories in different task periods. Fo r eight neurons, selectivity for one t rajectory was found in their set-related activity and selectivity for a different t rajectory was found in their movement - re la ted activity. Of the 101 neurons with t a r g e t selectivity, 8 neurons showed selectivity for different targets in different periods.
A different kind of combina t ion involved selectivity for bo th target and t ra jectory in the same neuron. This could occur within or between task periods. Using the compa ra - tive analysis (strict criteria), 24 (of 163) neurons were found to be selective for bo th t rajectory and target for a given task period. When cross-period compar i sons were in- cluded, 46 (of 163) neurons were found to be selective for both trajectory and target. Seven (of 117) neurons were
selective for bo th t rajectory and for initial m o v e m e n t direction; five (of 114) cells were selective for bo th target and initial m o v e m e n t direction. Four (of 168) neurons were found to be selective for trajectory, target, and initial direction. N o striking differences were observed in these combina t ions among the cortical fields examined. Fo r example, in M1, 15 (of46) neurons showed both target and t rajectory selectivity at some point in the trial; in P M d 9 (of 34) did so.
Discussion
T r a j e c t o r y s e l e c t i v i t y
M o t o r cortical activity associated with m o v e m e n t to a given target exhibits wide and systematic variabil i ty de- pending on the pa th taken to that target, a p roper ty here termed trajectory selectivity. Thus, neuronal modula t ion in each of the four cortical fields examined and in each task per iod reflects m o v e m e n t details in addi t ion to the loca- tion of a h a n d - m o v e m e n t target or its net distance and

294
Table 2. Numbers of neurons observed and predicted to be trajectory selective, grouped according to cortical field for each task period
Field Task period Strict a Relaxed b Observed c Predicted N d
CW/S/CCW ~ CW/S/CCW Strict Relaxed Strict Relaxed
Signal 2/0/8 10/8/25 10"* 43** 2 16 63 Set a 10/0/10 24/5/18 20** 47** 2 16 64
M 1 Set b 7/1/9 20/9/14 17"* 43** 2 16 64 Premovement 6/0/3 23/3/16 9"* 42"* 2 16 65 Late movement 14/0/7 25/10/18 21"* 53** 3 18 71 Return 0/0/1 12/10/14 1 36** 2 16 64
Signal 5/0/3 24/1/33 8"* 58"* 4 25 99 Set a 2/0/4 8/14/16 6** 38** 3 18 72
PMd Set b 3/1/4 11/12/17 8** 40** 3 18 71 Premovement 0/2/0 12/12/11 2 35"* 3 19 74 Late movement 5/0/1 13/6/7 6** 26** 2 17 67 Return 1/1/3 9/9/19 5 37** 3 24 94
Signal 2/2/2 12/8/11 6 * * 3 l* * 2 15 60 Set a 0/0/1 7/4/1 1 12 2 14 55
PMv Set b 3/0/0 14/5/2 3 21"* 2 14 54 Premovement 3/1/4 9/6/10 8** 25** 2 14 54 Late movement 3/2/5 7/6/9 10"* 22** 2 14 68 Return 1/4/1 2/18/12 6** 32** 2 17 73
Signal 0/1/3 4/8/14 4 26** 2 13 53 Set a 0/1/4 3/3/10 5** 16"* 2 11 43
M 2 Set b 1/1/2 5/5/10 4** 20** 2 11 44 Premovement 2/4/1 6/11/7 7** 24** 1 10 38 Late movement 1/1/5 7/7/11 7** 25** 1 10 40 Return 1/2/1 5/8/4 4* 17 2 13 50
Strict criteria b Relaxed criteria c Statistical test: differs from number predicted by chance *, p < 0.05; **, p <0.01. See Material and methods for description of statistical
methods d The number of task-related neurons for that task period and that cortical field e Abbreviations: CW, clockwise trajectories; S, straight; CCW, counter clockwise
direction from the movement ' s origin. The present finding is consistent with the observat ion that movements to a given target f rom different directions are associated with distinctive patterns and amplitudes of neuronal modula- tion, rather than comparable activity, as would be predict- ed if the neuronal activity reflected target locat ion alone (Weinrich and Wise 1982; Weinrich et al. 1984; Geor- gopoulos et al. 1985). The present conclusion does not imply that movement direction and ampli tude (together) or the movement goal is unrepresented in m o t o r cortical activity (see Rizzolatti et al. 1987, 1988), but rather that such factors cannot completely account for mo to r cortical activity. Indeed, another finding of this study was that many neurons showed both trajectory and target selectiv- ity, and it was the rule, rather than the exception, that both target and trajectory influenced the neuronal modulat ion. Thus, it seems likely that a single neuron can reflect bo th targeting and other information pertinent to an impending or ongoing movemen t (for further discussion, see Hocher- man and Wise 1990).
The precise aspect of movement reflected in the trajec- tory selective activity cannot be determined from the present study. The trajectory selective activity may reflect: (1) the retrieval of an entire mo to r p rogram from memory (Moll and Kuypers 1977; Pass ingham 1988; Mitz et al. 1989), including the complete specification of force para-
meters as a function of time; (2) reflection of a less comprehensive aspect of the movement such as the final approach to the target, any instantaneous movement vector, or an average movement segment c o m m o n to a given trajectory (Georgopoulos et al. 1982; Schwartz et al. 1988; Schwartz and Anderson 1989; Kalaska et al. 1989); and/or (3) the pat tern of muscle activity or the activity of any subset of activated or inhibited muscles (Humphrey 1986). It should be noted that, because the monkey could not view its limb, the monkey had to execute the curved or straight movements on the basis of memory only, not by on-line moni tor ing of limb posit ion in relation to inter- mediate "via" points or targets. It should further be noted that since the monkey did not have to stop within the target zone, the set-related activity could reflect aspects of the whole movement , including the return. Similarly, late movement-rela ted activity could reflect the earliest phase of muscle activation for the return movement .
The possibility that trajectory selectivity simply re- flects muscle activity deserves further comment , especially for activity during the instructed delay period. Inherent in any study of the mo to r cortex is the possibility that direct involvement in muscle activation or corollary discharge may "explain" cell activity. Analysis of the monkeys ' E M G identified certain muscles in both monkeys showing tra- jectory selectivity during the delay period. Thus, the

295
~- o a- Traiectory Selectivity for all 3 Targets ~ 0.~-
= A .=o7 I- o~ ~ o~-
05 ! o5- (") 04 0.4" 'S
02 ~ 0,2"
0.1 & e O l .
00 . . . . . . . . r%'3 . . . . . . . . . I . . . . . . . . . ~. . . 0.0
Q_Q_ Q-Q- Q-Q- Q-Q- 0_O-
Trajectory Selectivity for 2 or 3 Targets
B
tliillllllitl CCW Curve Slraighl CW Curve
Q-Q- Q-Q- Q-Q- Q-Q- ~Q-
"• 081
,~ 0.7-
06-
05"
0 0.4-
= o3-
~ 0,1
~ ' 0 0 "
C Target Selectivity for r~ RighlTarget [ n Initial Direction Selectivity . . . . . II Center Target I 0,8 ~ [ ] Right Init Z o r / rajectorles ID LeflTarget ~'~ ] �9 Slralghl ,nit
0.7t IO Lefl ,nit
1 ~,~ 0.6
g 0.3
0 .2
g. 0.1
i o. . . . . . . . . . . . . . . . . . . . . . . . . . . . . . 0 .0
Q-Q. O-0- O_0- Q.Q- Q-Q- Q-Q- 0-0- Q.Q- Q-Q- Q-Q- Q-Q-
F i g . 9A-D. Proportion of neurons with the indicated selectivity features, calculated as the number of selective neurons divided by the number of task-related neurons for that task period and that cortical field. A Trajectory selectivity as identified by the strict criteria (see
Material and methods for description of criteria levels). B Trajectory selectivity identified by the relaxed criteria. C Target selectivity by the relaxed criteria. D Initial direction selectivity by the relaxed criteria level
trajectory selectivity observed in neurons may reflect a one to one correspondence of neuronal and muscle activity, without any appreciable time lag. Three arguments can be put forward against the view that all instructed delay- period activity is a simple reflection of muscle activation: (1) the wide cortical distribution of trajectory selective neurons (Fig. 10A and B) makes it unlikely that the entirety of this territory represents the minority of muscles that show such activity patterns, (2) there were no muscles selective for counter-clockwise trajectories, but all cortical fields, with the possible exception of PMv, showed neu- rons with that kind of trajectory selectivity; and (3) pre- vious explicit studies have shown that set-related activity can occur in the absence of consistent postural activity changes, at least as determined by a sample of the muscles most likely to evince such activity (Tanji and Evarts 1976;
Thach 1978; Weinrich and Wise 1982; Weinrich et al. 1984; Kurata and Wise 1988; Georgopoulos et al. 1989).
Alternative interpretations. One possible interpretation of trajectory (and target) selectivity is that such activity is somehow related to eye movements. Eye position was not controlled during the present study, but the monkeys occasionally looked away from the stimuli and targets, even before and during correctly executed movements. These eye movement did not seem to affect cell activity. Previous reports on neuronal activity in PMd and M1 have argued against an effect of eye position on set- and movement-related activity or an effect of that activity on eye movements (Weinrich and Wise 1982; Weinrich et al. 1984; Godschalk et al. 1985; Wise and Mauritz 1985). There is evidence for a similar lack of gaze effect in relation

296
Table 3. Numbers of neurons observed and predicted to in Table 2
be target selective, grouped according to cortical field for each task period. Format as
Field Task period Strict Relaxed Observed Predicted N b R/C/L a R/C/L Strict Relaxed Strict Relaxed
Signal 2/1/5 16/12/20 8"* 38"* 2 16 63 Set a 3/1/0 16/5/9 4 30** 2 16 64
M 1 Set b 4/0/1 12/9/10 5* 31"* 2 16 64 Premovement 3/2/2 21/11/9 7"* 41"* 2 16 65 Late movement 2/2/3 10/21/19 7** 50** 3 18 71 Return 1/0/8 14/5/22 9** 41"* 2 16 64
Signal 2/2/5 15/14/16 9"* 45"* 4 25 99 Set a 1/0/1 7/4/13 2 24 3 18 72
PMd Set b 2/2/1 13/5/14 5 32** 3 18 71 Premovement 2/1/3 12/9/16 6"* 37"* 3 19 74 Late movement 3/1/2 11/8/6 6** 25** 2 17 67 Return 3/0/4 10/9/17 7"* 36"* 3 24 94
Signal 4/2/2 9/10/8 8"* 27"* 2 15 60 Set a 3/1/1 10/4/6 5** 20** 2 14 55
PMv Set b 1/0/0 9/5/3 1 17 2 14 54 Premovement 0/0/2 8/4/12 2 24"* 2 14 54 Late movement 1/0/0 5/10/4 1 19 2 14 68 Return 2/1/8 8/9/32 11"* 49** 2 17 73
Signal 4/1/7 10/6/16 12"* 32** 2 13 53 Set a 5/0/3 9/4/9 8** 22** 2 11 43
M 2 Set b 0/0/2 7/3/6 2 16" 2 11 44 Premovement 2/2/2 7/4/8 6** 19"* 1 10 38 Late movement 2/1/2 8/4/8 5** 20** 1 10 40 Return 1/1/4 4/8/12 6** 24** 2 13 50
a Abbreviations: R, right target selectivity: C, center target; L, left target b The number of task-related neurons for that task period and that cortical field
Table 4. Trajectory and target effects using repeated measures analysis of variance. Percent- age of cells in each field with significant (19 < 0.05) main effects (for trajectory or for target) and interactive effects for each task period
Field Task period Trajectory Target Trajectory effects effects *target
Signal 56 30 35 M 1 Set 61 43 44
Premovement 61 46 41 Late movement 65 44 37
Signal 24 33 24 PMd Set 32 28 18
Premovement 25 25 20 Late movement 29 27 16
Signal 23 23 5 PMv Set 14 14 19
Premovement 23 16 9 Late movement 33 5 12
Signal 26 29 18 M 2 Set 18 18 15
Premovement 33 30 18 Late movement 33 24 14
to the receptive fields of signal-related neurons in P M v (Gentil lucci et al. 1983). These studies and the fact that the recordings were no t in k n o w n cortical eye movemen t fields make ocu lomotor in terpreta t ions of neu rona l activity unlikely. Nevertheless, for activity that appears so similar
to a visual response, any detailed considera t ion of signal- related activity in the present context should await a study in which eye posi t ion is controlled.
It is further possible that trajectory selectivity reflects the spatial locat ions of the targets, in termediate "via"

A
TRAJECTORY (3) TRAJECTORY (2)
i " . .1_~, \ - - - ' ~ - , : -
\ - . . / .ii! I X \ " ; : T ) i / g::~
...q_ \
B /
297
�9 . � 9
X i / L ) ..\. �9 .
�9 i
c ~ D / ~_~.~ TARGET (3) INHIBITED
Fig. 10AD. Cortical distribution of selective neurons: composite plots for the two monkeys. A Distribution of trajectory selective neurons as determined by the strict (3 target) criteria. The diameter of the filled circles indicates the number of neurons with the indicated property at the plotted location. B Trajectory selective cells using the relaxed (2 target) criteria. C Target selective neurons using the strict
(3 trajectory) criteria. Dashed lines indicate borders between M1, PMd and M2. The boundary between PMd and PMv is unmarked, but can be taken as the genu of the arcuate sulcus. D Inhibited neurons, relaxed criteria. Abbreviations: CE, central sulcus; AR, arcuate sulcus; PR, principal sulcus; SP, superior precentral sulcus. Inset: Dorsolateral view of the brain, first monkey
points, or the work space of the forelimb, in either retinocentric or craniocentric coordinates�9 Such a phe- nomenon has been observed for some set- and movement- related activity in M1 and M2 (Crutcher and Alexander 1988; Alexander and Crutcher 1990), and some of the trajectory selectivity may be explicable in such terms. However, the activity of at least some trajectory selective neurons serves to rule out these "spatial" interpretations�9
For example, Fig. 6 shows a set-related cell that is selective for clockwise movements to all of the targets regardless of their spatial location�9 By contrast, the cell is unmodula ted or inhibited for all of the other six movements, some of which begin over the same part of the work space and others of which end in the same parts of space as certain of the clockwise-curved movements�9 The selectivity proper- ties of the cell illustrated in Fig. 6 were inherent in the

298
B
. : , . ,!,. ,,, ,,,,,. L, , ; ' i : , ' , , , �9
, + , , : t . . . . . . . . . . ,~q~, .,:':. :,,!, .,. , ' '~:.,':"::; :: ~, ','.':,. " " " ' : ' ,,'i t , , :, " ' ; " ' ' ' ' ! "
i " ' , : i i : " ' } " ' :'
B A [ c
. . . . . . . , , " , ' , ' , " r , ' "; '" , ' , ' , " " ' ":i ,:'"' , . . . . . ~ , , *
/,
B
' , " , 2 , , ' ,,i':,i . . . . . ;~,",, , , j , , *, ',,
"':'~ ........ ":"'',""7:' :.!::::"'i':~ ':":: ' ' " " !~' " " " "
, : , , , , ; , : , , , , , ; , , , :~ , , ,~ , , , , , , , , , , , , , , , ; , ,
, , ~ , ,:,,,~
5
. . . . , , , , : , , , , , , , , , ~ , , , ~ . . . . . 1 , I ' ' " ' " " ' ' " " ' I . . . . " ~ ' * ' ' ' ' ' ' " ' "
i
,: i,'; ',"',:,',' ',"'."" ,,i',,i,, " ,".v,,:,':: , + ,
. 5
, '~' , , " , " , , : , . , " , ' , ' i , ~ : ' ~ , "
' " i " : . ' ':.i .... ' " : " ' '~: ~'~ T,," i ' ; .
i ' : . . . . : , : , , : ' , . . . . . ' i ' : ' , ' : , , ' , ; . , " . . . . ~ " ' " ,,..:,,.: ...... ',,.'.:,,..:.:,,'.i.'.L',., .% , 'v,. :
; ' ' ' . . . . . ' . . . . . . . . . . . . . . "~ : . . . . . . ' ' ~" " " "+~ 0 . 5 s
I n i t ~ ~ o f f *~ : : :~ T S ' § I S
011
: . . . . . ' ,,,', ...... ',!,~ , , '~ , , ' , 1:1
Fig. 11. An inhibited, trajectory selective neuron from PMd. Format as in Fig. 6, but the activity is aligned on the instruction onset (IS on) and the square indicates the trigger stimulus (TS) presentation. The + sign to the far left of each raster line indicates trial initiation (Init), the one to the far right indicates target acquisition
def ini t ion of t ra jec tory selectivity and, hence, representa- tive of the popu la t ion .
Final ly , t r a j ec to ry selectivity might reflect ei ther move- ments made in re la t ion to in te rmedia te targets or move- ment ampl i tude . The former in te rp re ta t ion is poss ible because all curved movemen t s i n c o r p o r a t e d in te rmedia te "via" points , bu t s t ra ight movemen t s d id no t necessar i ly do so. (An in te rmedia te ta rge t was presented for each s t ra ight movement , but the m o n k e y could have neglected
it.) The la t ter in t e rp re ta t ion is poss ible because curved movemen t s were, by necessity, longer than s t ra ight move- ments to a target . Curved movemen t s averaged approx i - ma te ly 23 cm, s t ra ight movement s a b o u t 20 cm. However , " in te rmedia te target" or ."ampli tude" in te rp re ta t ions are unl ikely since cells t ha t were t ra jec tory selective were identif ied as being selective for ei ther clockwise or counter - c lockwise t rajectories , for which such var iables are the same, ra ther than bo th kinds of curved trajectories. O u r

299
10
8
"6 6
2
0
Inhibited Trajectory Selective Cells 10
Straight CW Curve t/~ 8
=--
O 6
O
11 Ncoco ~ o �9 ~3mm z $ �9
Inhibited Target Selective Cells
B ~ RightTarg Center Left Targ
Fig. 12A, B. Distributi•n•finhibitedneur•nssh•wingtraject•ry(A)andtarget(B)se•ectivity•asidenti•edbythere•axedcriteria`Nurnbers•f neurons are distributed by cortical field, then by task period within each field
analytical methods would not have identified amplitude effects, were they present in the data. Further, in studies showing such effects on PM activity (Amos et al. 1988; Karluk and Ebner 1989; Kurata 1988; Reihle and Requin 1989), amplitude variability has greatly exceeded the 13% difference that distinguished the straight and curved move- ments involved in this study.
Curved vs. straight trajectories
In certain cortical fields, trajectory-selective neurons showed more instances of such selectivity for curved movements than for straight ones. This phenomenon was found for all task periods in M1 and for signal-related activity in PMd. Specialization for complex curved move- ments vs. direct target acquisition actions is consistent with the reports that lesions of certain motor areas cause deficits in complex movement patterns (Moll and Kuypers 1977) or sequences (Traverse and Latto 1986; Passingham 1987), but not straight movements (Moll and Kuypers 1977; Reae t al. 1987). Indeed, it has been proposed that curved movements consist of amalgamated sequences of individual segments (Abend et al. 1982), and the motor cortex would be likely to play an important role in the process by which such segments are synthesized and executed. In this context, the reversal of movement at a target might be viewed as movement sequence, and ab- lations of nonprimary motor cortex, which have subtle, if any, influence on the trajectory of a straight limb move- ment, have their greatest effect on the reversal of move- ment (Reaet al. 1987).
However, all of the aforementioned lesion effects have been observed after damage to either M2, PM, or both, whereas the bias toward curved vs. straight trajectories is found mainly in M 1. We know of no reports on the relative effects of M1 ablation on curved vs. straight movement trajectories, but the present findings at least suggest that
curved movement trajectories would be preferentially disrupted by damage to M1.
Target and initial direction selectivity
Neurons showing trajectory selectivity outnumbered those showing target or initial direction selectivity in the present sample. This outcome could simply reflect the fact the targets were only 60 ~ radially divergent, a rather small proportion of the 360 ~ available range for two- dimensionally constrained forelimb movements, whereas the trajectories may have been more distinct from each other. By rough comparison with the published data concerning directional tuning properties of set-related and movement-related activity in M1 (Georgopoulos et al. 1982; Schwartz et al. 1988; Kalaska et al. 1989) and PMd (Crammond and Kalaska 1989a,c), we found approxi- mately the proportion of target or initial direction selective neurons that would be predicted for targets of 60 ~ diver- gence.
Cortical field comparisons
All areas examined show trajectory, target and initial direction selectivity, but two differences among the cor- tical fields were most pronounced. First, the prominence of inhibition for both trajectory and target selectivity in PMd compared to the other areas examined was striking (Fig. 10D and 12), but remains difficult to interpret. Disinhibitory mechanisms are common in the motor system, and perhaps these neurons participate in such circuits. Second, M 1 has the largest proportion of trajec- tory selective cells in all task periods (Table 4). Thus, the conclusion that motor cortical activity reflects more than merely the specification of the final target, the goal of a

300
B
. .**+
A B C
= . . . . . : - : - , . ;
"+ . ~,, . . . . . . . . . 2 ~ . : 2 T
. ' . , . . . . . . ; 7 . ; .
B
A C ~ . 9 B
A [ ] C
i 17, ,"~: .:':'.'. '::.-":':,', ........ 6 t'~176 ~. :.......:::...~..-::..:::~.::.:..~.
, , . . . '"'2".22.'.2~'";".': ' j '2L'.2.~.'."~ ' '
B C
; ? ,! ! , ........ lO0 ,
" i , ,:':.',' .:,': ~:: :"::.': :.,,,,:':.~::v ::,. v:.,.:,:~.,,,::...,~ :,:.:.,2 , , ...... �9
IS =~O ~ ~ w, aeq ' "~:::::':'":'~:':"':::':::::'::"::'~':::' �9 on off mvt 0.5 s
Fig, 13, Activity of an M 1 neuron tb.at skews trajectory selectivity for clockwise trajectories during the late movement period {left column), as well as trajectory selectivity for counter-clockwise trajectories in the instructed delay period (right column). Format as in Fig. 7
movement , or the net distance and direction f rom the target to the origin, appears to hold for M1 as clearly as for the n o n p r i m a r y m o t o r areas.
Conclusion
On the basis of the present results, we can only speculate on the possibili ty tha t t ra jectory selectivity represents
curvature specification or "coding" in any causal sense. However , if pa th curvature is an abstract ly specified m o v e m e n t pa rame te r or m o t o r primitive, then exam- inat ion of m o t o r cortical activity in relat ion to sys- tematical ly varied degrees of pa th curvature m a y reveal whether any neurons show coarse curvature coding of the kind shown for direction (Georgopoulos et al. 1982, 1983, 1988; Schwartz et al. 1988) and ampl i tude (Amos et al.

Table 5. The mean modulation, for excited neurons only, grouped according to cortical field for each task period. The largest of the two or three values (I M I) that defined a cell's selectivity was determined. These maxima were then averaged for all neurons (N) showing trajectory selectivity in that cortical field and task period. The same calculation was performed for target selective neurons
Field/task period Trajectory Target Reference selective selective activity mean • SD a (N)
Signal 12 ___ 8 (42) 11 -I- 8 (38) Set a 21 __+ 19 (46) 17 • 18 (30)
M 1 Set b 22 + 18 (41) 15 + 11 (35) 4 + 6 (76) Premovement 24 + 20 (45) 16 + 19 (41) Late movement 27 ___ 26 (52) 19 _+ 19 (50) Return 18 _ 13 (33) 15 + 14 (41)
Signal 14 • 15 (57) 13 + 16 (45) Set a 12 ___ 12 (29) 7 + 6 (24)
PMd Set b 13 • 15 (32) 10 ___ 10 (28) 7 + 7 (115) Premovement 11 ___ 10 (26) 9 + 8 (32) Late movement 10 + 14 (21) 10 _ 14 (22) Return 18 + 15 (32) 14 _ 16 (34)
Signal 8 _+ 6 (31) 8 • 5 (27) Set a 11 + 10 (20) 8 + 9 (20)
PMv Set b 13 • 9 (20) 9 • 8 (16) 4 ___ 5 (73) Premovement 11 • 10 (24) 8 • 8 (24) Late movement 12 • 16 (21) 7 ___ 11 (19) Return 18 _ 15 (32) 17 • 15 (48)
Signal 11 • 5 (26) 12 • 7 (32) Set a 15 + 10 (15) 11 _ 9 (22)
M 2 Set b 12 • 8 (20) 7 • 5 (16) 7 + 6 (60) Premovement 11 • 6 (22) 7 _+ 3 (19) Late movement 12 ___ 9 (25) 12 • 11 (20) Return 22 • 17 (17) 8 • 9 (24)
" Impulses per second
301
1988; K a r l u k a n d E b n e r 1989; see a lso Rieh le a n d R e q u i n 1989; K u r a t a 1988).
Acknowledgements. The authors thank Mr. William Burriss and Dr. Andrew Mitz for their assistance. Dr. Hocherman was supported by the Fogarty Center for International Study and the National Institute of Mental Health Intramural Research Program.
References
Abend W, Bizzi E, Morasso P (1982) Human arm trajectory forma- tion. Brain 105:331-348
Alexander GE, Crutcher MD (1990) Neural representation of the target (goal) of visually guided arm movements in three motor areas of the monkey. J Neurophysiol 64:164-178
Amos TM, Vermeersch CH, Park S-K, Ebner, TJ (1988). Principle [sic] component analysis of the responses of premotor cortical neurons to movement in two dimensions. Soc Neurosci Abstr 14: 343
Bucy PC, Fulton JF (1933) Ipsilateral representation in the motor and premotor cortex of monkeys. Brain 56:318-342
Caminiti R, Johnson PB, Pastore RA, Urbano A (1989) The cortical representation of a coordinate system for the planning and execution of arm movements in space. In: Jeannerod M, Joseph JP (eds) Cortical control of sensory motor integration. Abstr EBBS workshop European Brain and Behavior Society, Lyon, France, p 25
Caminiti R, Johnson PB, Urbano A (1990) Making arm movements within different parts of space: dynamic aspects in the primate motor cortex. J Neurosei 10:2039-2058
Crammond DJ, Kalaska JF (1989a) Neuronal discharge during an instructed-delay period. II. Premotor area 6. In: Jeannerod M, Joseph JP (eds) Cortical control of sensory-motor integration. Abstr EBBS workshop European Brain and Behavior Society, Lyon, France, p 15
Crammond D J, Kalaska JF (1989b) Neuronal activity in primate parietal cortex area 5 varies with intended movement direction during an instructed-delay period. Exp Brain Res 76:458-462
Crammond DJ, Kalaska JF (198%) Comparison of cell activity in cortical areas 6, 4 and 5 recorded in an instructed delay task. Soc Neurosci Abstr 15:786
Crutcher MD, Alexander GE (1988) Supplementary motor area (SMA): coding of both preparatory and movement-related neural activity in spatial rather than joint coordinates. Soc Neurosci Abstr 14:342
Evarts EV (1968) Relation of pyramidal tract activity to force exerted during voluntary movement. J Neurophysiol 31:14-27
Evarts EV (1969) Activity of pyramidal tract neurons during postural fixation. J Neurophysiol 32:375-385
Fulton JF (1935) Definition of the motor and premotor areas. Brain 58:311-216
Gentilucci M, Scandolara C, Pigarev IN, Rizzolatti Q (1983) Visual responses in the postarcuate cortex (area 6) of the monkey that are independent of eye position. Exp Brain Res 50:464-468
Georgopoulos AP (1987) Cortical mechanisms subserving reaching. In: Bock G, O'Connor M, Marsh J (eds) Motor areas of the cerebral cortex. Ciba Foundation symposium 132. John Wiley & Sons, Chichester, pp 125 141

302
Georgopoulos AP, Kalaska JF, Caminiti R, Massey JT (1982) On the relations between the direction of two-dimensional arm movements and cell discharge in primate motor cortex. J Neuro- sci 11:1527 1537
Georgopoulos AP, Caminiti R, Kalaska JF, Massey JT (1983) Spatial coding of movement: a hypothesis concerning the coding of movement direction by motor cortical populations. Exp Brain Res Suppl 7:327 336
Georgopoulos AP, Kalaska JF, Caminiti R (1985) The relations between two dimensional arm movement and single-cell dis- charge in motor cortex and area 5: movement direction vs. movement end-point. Exp Brain Res Suppl 10:175 183
Georgopoulos AP, Kettner RE, Schwartz B (1988) Primate motor cortex and .free arm movements to visual targets in three- dimensional space. II. Coding of the direction of movement by a neuronal population. J Neurosci 8:2928-2937
Georgopoulos AP, Crutcher MD, Schwartz AB (1989) Cognitive spatial-motor processes. 3. Motor cortical prediction of move- ment direction during an instructed delay period. Exp Brain Res 75:183-194
Godschalk M, Lemon RN, Kuypers HGJM, van der Steen J (1985) The involvement of monkey premotor cortex neurones in pre- paration of visually cued arm movements. Behav Brain Res 18: 143-157
Hocherman S, Wise SP (1989) Movement trajectory or goal repre- sentation in primate premotor and primary motor cortex. Soc Neurosci Abstr 15:789
Hocherman S, Wise SP (1990) Trajectory-selective neuronal activity in the motor cortex of rhesus monkeys (Macaca mulatta). Behav Neurosci 104:495-499
Humphrey DR (1986) Representation of movements and muscles within the primate precentral motor cortex: historical and current perspective. Fed Proc 45:2687-2699
Humphrey DR, Schmidt EM, Thompson WD (1970) Predicting measures of motor performance from multiple cortical spike trains. Science 179:758 762
Kalaska JF, Cohen DAD, Hyde ML, Prud'homme M (1989) A comparison of movement direction-related versus load direction- related activity in primate motor cortex, using a two-dimensional reaching task. J Neurosci 9:2080-2102
Karluk D, Ebner TJ (1989) Spatial representation of movement distance and direction in the premotor cortex. Soc Neurosci Abstr 15:787
Kurata K (1988) Motor programming in premotor cortex of the monkeys. Abstr Twelfth International Symposium of the Tanig- uchi Foundation. Toyobo Co, Katata, Ohtsu, Japan, pp 13-14
Kurata K, Wise SP (1988) Premotor cortex of rhesus monkeys: set- related activity during two conditional motor tasks. Exp Brain Res 69:327-343
Kwan HC, MacKay WA, Murphy JT, Wong YC (1981) Distribution of responses to visual cues for movement in precentral cortex of awake primates. Neurosci Lett 24:123-128
Kwan HC, MacKay WA, Murphy JT, Wong YC (1985) Properties of visual cue responses in primate precentral cortex. Brain Res 343: 24 35
Mitz AR, Wise SP, Godschalk M (1989) Learning-dependent activity in premotor cortex of rhesus monkeys. Soc Neurosci Abstr 15:787
Moll L, Kuypers HGJM (1977) Premotor cortical ablations in monkeys: contralateral changes in visually guided reaching behavior. Science 198:317 319
Murray GM and Sessle BJ (1989) Coding of tongue movement direction by neurones in tongue region of motor cortex (MI) of
awake monkeys (M. fascicularis). Soc Neurosci Abstr 15:788 Mussa-Ivaldi FA (1988) Do neurons in the motor cortex encode
movement direction? An alternative hypothesis. Neurosic Lett 91:106-111
Passingham RE (1987) Two cortical systems for directing movement. In: Bock G, O'Connor M, Marsh J (eds) Motor areas of the cerebral cortex. Ciba Foundation Symposium 132. John Wiley & Sons, Chichester, pp 151-164
Passingham RE (1988) Premotor cortex and preparation for move- ment. Exp Brain Res 70:590-596
Rea GL, Ebner TJ, Bloedel JR (1987). Evaluations of combined premotor and supplementary motor cortex lesions on a visually guided arm movement. Brain Res 418:58 67
Riehle A, Requin J (1989) Monkey primary motor and premotor cortex: single-cell activity related to prior information about direction and extent of an intended movement. J Neurophysiol 61 : 534-549
Rizzolatti G, Gentilucci M, Fogassi L, Luppino G, Matelli M, Ponzoni-Maggi S (1987) Neurons related to goal-directed motor acts in inferior area 6 of the macaque monkey. Exp Brain Res 67: 220-224
Rizzolatti G, Camarda R, Fogassi L, Gentilucci M, Luppino G, Matelli M (1988) Functional organization of inferior area 6 in the macaque monkey. II. Area F5 and the control of distal move- ments. Exp Brain Res 71:491-507
Schwartz AB, Anderson BJ (1989) Motor cortical images of sinu- soidal trajectories. Soc Neurosci Abstr 15:788
Schwartz AB, Kettner RE, Georgopoulos AP (1988) Primate motor cortex and free arm movements to visual targets in three- dimensional space. I. Relations between single cell discharge and direction of movement. J Neurosci 8:2913-2927
Tanji J, Evarts EV (1976) Anticipatory activity of motor cortex neurons in relation to direction of an intended movement. J Neurophysiol 39:1062-1068
Thach WT (1978) Correlation of neural discharge with pattern and force of muscular activity, joint position, and direction of in- tended next movement in motor cortex and cerebellum. J Neuro- physiol 41:654-676
Traverse J, Latto R (1986) Impairments in route negotiation through a maze after dorsolateral frontal, inferior parietal or premotor lesions in cynomolgus monkeys. Behav Brain Res 20:203-215
Wannier TMJ, Maier MA, Hepp-Reymond M-C (1989) Responses of motor cortex neurons to visual stimulation in the alert monkey. Neurosic Lett 98:63-68
Weinrich M, Wise SP (1982) The premotor cortex of the monkey. J Neurosci 2:1329 1345
Weinrich M, Wise SP, Mauritz K-H (1984) A neurophysiological analysis of the premotor cortex of the monkey. Brain 107: 385-414
Wise SP (1984) Nonprimary motor cortex and its role in the cerebral control of movement. In: Edelman G, Cowan WM, Gall E (eds) Dynamic aspects of neocortical function. Wiley, New York, pp 525-555
Wise SP (1985) The primate premotor cortex: past, present, and preparatory. Ann Rev Neurosci 8:1 19
Wise SP, Mauritz K-H (1985) Set-related neuronal activity in the premotor cortex of rhesus monkeys: effects of changes in motor set. Proc R Soc Lond B 223:331-354
Woolsey CN, Settlage PH, Meyer DR, Sencer W, Pinto Hamuy T, Travis AM (1952) Patterns of localization in precentral and "supplementary" motor areas and their relation to the concept of a premotor area. Res Publ Assoc Res Nerv Ment Dis 30:238-264