Electrical stimulation of the anterior cingulate gyrus induces responses similar to K-complexes in...
10
Original Research Electrical Stimulation of the Anterior Cingulate Gyrus Induces Responses Similar to K-complexes in Awake Humans Zanna Voysey a, 1 , David Martín-López a, b, c,1 , Diego Jiménez-Jiménez a, b, d , Richard P. Selway e , Gonzalo Alarcón a, b, f, g, 2 , Antonio Valentín a, b, f, * , 2 a Department of Basic and Clinical Neuroscience, King’s College London, Institute of Psychiatry, Psychology and Neuroscience, UK b Department of Clinical Neurophysiology, King’s College Hospital NHS Trust, London, UK c West Surrey Clinical Neurophysiology, St Peter’s Hospital, Chertsey, UK d Universidad San Francisco de Quito, School of Medicine, Quito, Ecuador e Department of Neurosurgery, King’s College Hospital NHS Trust, London, UK f Departamento de Fisiología, Facultad de Medicina, Universidad Complutense, Madrid, Spain g Neurology Section, Medicine Department, Hamad Medical Corporation, Doha, Qatar article info Article history: Received 22 December 2014 Received in revised form 15 May 2015 Accepted 19 May 2015 Available online xxx Keywords: K-complex Single pulse electrical stimulation Sleep phenomena Cingulate gyrus abstract Background: The brain region responsible for the initiation of K-complexes has not been identified to date. Objective: To determine the brain region responsible for originating K-complexes. Methods: We reviewed all 269 patients assessed for epilepsy surgery with intracranial electrodes and single pulse electrical stimulation (SPES) at King’s College Hospital between 1999 and 2013. Intracranial EEG responses to electrical stimulation at orbitofrontal, frontal, cingulate, temporal and parietal loci were compared visually with each patient’s K-complexes and the degree of resemblance was quantified. Results: Among the 269 patients, K-complex-like responses were exclusively observed in all 6 patients who had depth electrodes in the cingulate cortex. In each patient, the stimulation site eliciting the response of greatest similarity to the patient’s K-complex was located within the dorso-caudal anterior cingulate. The K-complex like responses were evoked when the patients were awake. Conclusion: Our findings provide the first causal evidence that the cingulate gyrus initiates the wide- spread synchronous activity that constitutes the K-complex. The induction of K-complex-like responses during wakefulness suggests that the mechanisms required for the initiation of K-complexes are separate from those involved in sleep. Ó 2015 The Authors. Published by Elsevier Inc. This is an open access article under the CC BY-NC-ND license (http://creativecommons.org/licenses/by-nc-nd/4.0/). Introduction K-complexes are electroencephalographic (EEG) phenomena occurring during sleep, arising either spontaneously or in response to sensory stimulation. They are identified as a large biphasic negative-positive wave lasting for longer than 0.5 s, often preceded or followed by a sleep spindle [1]. Since K-complexes were first described in 1938 by Loomis et al. [2], they have become a marker of stage II sleep. Their physiological mechanisms are largely unknown, with evidence supporting both a sleep-protective role [3], and conversely, one of arousal [4]. Like- wise the axiom that they can arise spontaneously is under question, with some evidence to suggest that seemingly-spontaneous K-complexes may in fact be a response to unrecognized internal stimuli, such as borborygmi [5,6]. Above all, however, it is their generation that remains contro- versial. Studies combining multisite cellular, local field and scalp EEG recordings [7e12] suggest that K-complexes arise from syn- chronized activity across widespread cortical areas mediated by hyperpolarising currents in layer III of the cortex, such that they form a transient version of the on-going slow wave activity that Abbreviations: EEG, Electroencephalography; SPES, Single pulse electrical stimulation; r, Correlation coefficient; SI, Similarity index. This project did not have external funding. No author has a conflict of interest. * Corresponding author. Department of Clinical Neuroscience, Institute of Psy- chiatry, Psychology and Neuroscience, PO 43, De Crespigny Park, London SE5 8AF, UK. Tel.: þ44 20 7848 5161x5436; fax: þ44 20 73463725. E-mail addresses: [email protected], [email protected] (A. Valentín). 1 Drs Z. Voysey and D. Martín-López are joint first authors. 2 Drs G. Alarcón and A. Valentín are joint senior authors. Contents lists available at ScienceDirect Brain Stimulation journal homepage: www.brainstimjrnl.com http://dx.doi.org/10.1016/j.brs.2015.05.006 1935-861X/Ó 2015 The Authors. Published by Elsevier Inc. This is an open access article under the CC BY-NC-ND license (http://creativecommons.org/licenses/by-nc-nd/4.0/). Brain Stimulation xxx (2015) 1e10
Transcript of Electrical stimulation of the anterior cingulate gyrus induces responses similar to K-complexes in...

Contents lists available at ScienceDirect
Brain Stimulation
journal homepage: www.brainst imjrnl .com
Brain Stimulation xxx (2015) 1e10
Original Research
Electrical Stimulation of the Anterior Cingulate Gyrus InducesResponses Similar to K-complexes in Awake Humans
Zanna Voysey a,1, David Martín-López a,b,c,1, Diego Jiménez-Jiménez a,b,d, Richard P. Selwaye,Gonzalo Alarcón a,b,f,g,2, Antonio Valentín a,b,f,*,2
aDepartment of Basic and Clinical Neuroscience, King’s College London, Institute of Psychiatry, Psychology and Neuroscience, UKbDepartment of Clinical Neurophysiology, King’s College Hospital NHS Trust, London, UKcWest Surrey Clinical Neurophysiology, St Peter’s Hospital, Chertsey, UKdUniversidad San Francisco de Quito, School of Medicine, Quito, EcuadoreDepartment of Neurosurgery, King’s College Hospital NHS Trust, London, UKfDepartamento de Fisiología, Facultad de Medicina, Universidad Complutense, Madrid, SpaingNeurology Section, Medicine Department, Hamad Medical Corporation, Doha, Qatar
a r t i c l e i n f o
Article history:Received 22 December 2014Received in revised form15 May 2015Accepted 19 May 2015Available online xxx
Keywords:K-complexSingle pulse electrical stimulationSleep phenomenaCingulate gyrus
Abbreviations: EEG, Electroencephalography; SPstimulation; r, Correlation coefficient; SI, Similarity in
This project did not have external funding.No author has a conflict of interest.
* Corresponding author. Department of Clinical Nechiatry, Psychology and Neuroscience, PO 43, De CresUK. Tel.: þ44 20 7848 5161x5436; fax: þ44 20 73463
E-mail addresses: [email protected], a(A. Valentín).
1 Drs Z. Voysey and D. Martín-López are joint first a2 Drs G. Alarcón and A. Valentín are joint senior au
http://dx.doi.org/10.1016/j.brs.2015.05.0061935-861X/� 2015 The Authors. Published by Elsevier
a b s t r a c t
Background: The brain region responsible for the initiation of K-complexes has not been identified to date.Objective: To determine the brain region responsible for originating K-complexes.Methods: We reviewed all 269 patients assessed for epilepsy surgery with intracranial electrodes andsingle pulse electrical stimulation (SPES) at King’s College Hospital between 1999 and 2013. IntracranialEEG responses to electrical stimulation at orbitofrontal, frontal, cingulate, temporal and parietal loci werecompared visually with each patient’s K-complexes and the degree of resemblance was quantified.Results: Among the 269 patients, K-complex-like responses were exclusively observed in all 6 patientswho had depth electrodes in the cingulate cortex. In each patient, the stimulation site eliciting theresponse of greatest similarity to the patient’s K-complex was located within the dorso-caudal anteriorcingulate. The K-complex like responses were evoked when the patients were awake.Conclusion: Our findings provide the first causal evidence that the cingulate gyrus initiates the wide-spread synchronous activity that constitutes the K-complex. The induction of K-complex-like responsesduring wakefulness suggests that the mechanisms required for the initiation of K-complexes are separatefrom those involved in sleep.� 2015 The Authors. Published by Elsevier Inc. This is an open access article under the CC BY-NC-ND
license (http://creativecommons.org/licenses/by-nc-nd/4.0/).
Introduction
K-complexes are electroencephalographic (EEG) phenomenaoccurring during sleep, arising either spontaneously or in responseto sensory stimulation. They are identified as a large biphasic
ES, Single pulse electricaldex.
uroscience, Institute of Psy-pigny Park, London SE5 8AF,[email protected]
uthors.thors.
Inc. This is an open access article u
negative-positive wave lasting for longer than 0.5 s, often precededor followed by a sleep spindle [1].
Since K-complexes were first described in 1938 by Loomis et al.[2], they have become a marker of stage II sleep. Their physiologicalmechanisms are largely unknown, with evidence supporting both asleep-protective role [3], and conversely, one of arousal [4]. Like-wise the axiom that they can arise spontaneously is under question,with some evidence to suggest that seemingly-spontaneousK-complexes may in fact be a response to unrecognized internalstimuli, such as borborygmi [5,6].
Above all, however, it is their generation that remains contro-versial. Studies combining multisite cellular, local field and scalpEEG recordings [7e12] suggest that K-complexes arise from syn-chronized activity across widespread cortical areas mediated byhyperpolarising currents in layer III of the cortex, such that theyform a transient version of the on-going slow wave activity that
nder the CC BY-NC-ND license (http://creativecommons.org/licenses/by-nc-nd/4.0/).
Z. Voysey et al. / Brain Stimulation xxx (2015) 1e102
predominates in stage IIIeIV sleep [13]. This activity then propa-gates via cortico-cortical connections [7] in a predominantlyanterior-posterior direction [14,15]. It follows, however, that theremust be a region that orchestrates and synchronizes the initialhyperpolarising input towidespread cortical regions, the location ofwhich remains unknown.
The areas originating K-complexes are much debated. As longago as the 1950s, the cingulate gyrus was proposed as the areaoriginating K-complexes [16,17]. Initially this was based on source-localization from scalp EEG recordings, but such conclusions werelimited by poor spatial coverage and the tendency for traditionalsimple dipolemodels to attribute diffuse bilateral cortical activity toa deep midline source. More sophisticated contemporary source-localization techniques employing high definition EEG and distrib-uted sourcemodeling could not provide convincing evidence for theinvolvement of the cingulate gyrus in the generation of K-complexes[18,19]. EEG-fMRI studies [20,21] have implicated deep midlinestructures including the cingulate gyrus in some aspects of K-com-plex physiology, but the area responsible for initiating K-complexeswas not identified. Intracranial EEGhas providedmore direct insightinto this question. Early studies in cats [22] and monkeys [23]highlighted a cingulate generator for the K-complex, but the trans-ferability of such findings to humans is questionable. In contrast,intracranial EEG recordings in humans have suggested that thecingulate cortex and functionally related mesial frontal structuresappear uninvolved in generating the visible human K-complexwaveform [24], although the site of initiation of the K-complex couldnot be resolved at the level of EEG macroelectrodes.
At our center, we have developed a novel approach to investi-gate the generators of K-complexes. Patients studied with intra-cranial EEG recordings routinely undergo assessment with singlepulse electrical stimulation (SPES) to aid identification of epilep-togenic cortex [25e29]. Essentially, a single small electrical pulse(3e5 mA amplitude, 1 ms duration) is applied between contiguouselectrodes, and EEG responses are recorded by remaining elec-trodes. In the course of our practice, we observed that stimulationof some regions induced responses of marked similarity to thepatient’s K complexes. In the present work, we report these areas,and quantify the resemblance between SPES responses andK-complexes. To our knowledge, we provide the first causal evi-dence that K-complexes are initiated by the cingulate cortex.
Methods
Subjects
Records from all 269 patients assessed for epilepsy surgery withintracranial electrodes and SPES at King’s College Hospital (London)between January 1999 and December 2013 were reviewed. Thestudy included all patients who had:
1. Bihemispheric intracerebral (depth) electrodes.2. Frontal lobe intracerebral electrodes.3. Intracranial sleep stage II recordings.
Patients with the following criteria were excluded:
1. Previous resective neurosurgery.2. Continuous abnormalities in the background EEG precluding
identification of K-complexes and/or SPES responses.
The development of SPES was approved by the ethical com-mittee of King’s College Hospital (99e017). SPES is now part of theclinical protocol for presurgical assessment of patients withepilepsy with intracranial recordings.
Electrodes
In all patients, bilateral multicontact flexible bundles of depth(intracerebral) electrodes (AdTech Medical Instruments Corp., WI,USA) were implanted stereotactically under MRI guidance at siteswhich included frontal, parietal and temporal locations. Eachelectrode bundle contained 6e10 cylindrical 2.3 mm platinumelectrodes, with adjacent electrode centers separated by 5 mm. Thelocation of depth electrodes was verified by postimplantation skullX-ray, brain CT or MRI. The type, number and location of the elec-trodes were determined by the suspected location of the ictal onsetregion, according to non-invasive evaluation: clinical history, scalpEEG recordings obtained with the Maudsley system [30,31],neuropsychology [32] and neuroimaging. The selection criteria andimplantation procedure have been described elsewhere [25].
Recording protocol
Recording of intracranial EEG started when the patient hadrecovered from electrode implantation, usually 24e48 h after sur-gery. Cable telemetry with up to 64 recording channels was used fordata acquisition with simultaneous video monitoring. In two pa-tients, a Telefactor Beehive-Beekeeper system (Astro-Med, RI, USA)was used. Data were digitized at 200 Hz and band pass filtered(high pass cut-off frequency at 0.3 Hz and low pass cut-off fre-quency at 70 Hz). The system input range was 2 mV and data weredigitized with a 12 bit analog-to-digital converter (amplitude res-olution of 0.976 mV). In four patients, a Medelec-Profile systemwasused (Medelec, Oxford Instruments, United Kingdom). Data weredigitized at 256 Hz (two patients) or 1024 Hz (two patients) andband pass filtered (0.05e70 Hz). The input range was 10 mV anddata were digitized with a 22 bit analog-to-digital converter (anamplitude resolution of 0.153 mV). Interictal awake and sleep re-cordings in addition to ictal recordings were permanently stored inhard drives. Datawere recorded as common reference to Cz-Pz or toan intracranial electrode, and displayed in a variety of montages,including common average reference.
SPES protocol
SPES was applied sequentially between pairs of adjacent elec-trodes with a constant current neurostimulator (Medelec ST10Sensor, Oxford Instruments or Leadpoint, Medtronic) using mono-phasic single pulses (0.1e0.2 Hz, 1 ms, 3e5 mA). At least 20 stimuliwere delivered at for each stimulated site. Either all electrodes(patients 1, 3, 5 and 6) or only the electrodes located in grey matter(patients 2 and 4) were used to stimulate. EEG responses to eachpulse were recorded through the non-stimulating electrodes.Amore detailed description of the experimental protocol for SPES isdescribed elsewhere [26e29]. SPES protocol was always startedwith the patient awake. SPES responses resembling K-complexeswill be called “K-complex like” responses to emphasize that, despitetheir resemblance to K-complexes, SPES responses did not fulfill thestandard definition of K-complexes (occurrence during sleep eitherspontaneously or in response to sensory stimulation).
Identification of K-complexes
In contrast to scalp recordings, where K complexes are usuallybilaterally symmetrical and largest at the midline, there are notestablished criteria to identify K-complexes in intracranial re-cordings. We have followed some of the standard scalp criteria inaddition to those described by Wennberg [24] with simultaneousintracranial and scalp recordings. In essence, we identifiedK-complexes in our intracranial records as high amplitude (>50 mV)

Z. Voysey et al. / Brain Stimulation xxx (2015) 1e10 3
bilateral frontal biphasic waveforms lasting longer than 0.5 s, oftenpreceded or followed by a sleep spindle. The presence of bilateralintracranial frontal electrodes was required in our patient popula-tion because our cohort included patients with focal frontal epi-lepsy, who may show unilateral sleep-activated focal dischargesthat could be wrongly identified as K complexes.
Comparison of recordings
Intracranial EEG was analyzed using ASA4.8.1� in referentialmontage (reference to Cz or Pz). Researchers undertaking EEGanalysis were blinded to electrode placement and patient details.The first 20 K-complexes occurring during sleep were identifiedvisually, and 4 s epochs centered at the event were averaged tocreate a per-patient averaged K-complex. K-complex selection wasreviewed independently by authors AV and GA. Interictal awakerecordings were also reviewed for K-complex-like spontaneousinterictal epileptiform discharges. Where present, the first 20 ofsuch discharges were averaged using the same method. Similarly,for each pair of stimulating electrodes, 20 SPES responses wereaveraged in 4-s epochs and compared visually against the averageof K-complexes or spontaneous interictal epileptiform discharges.For each electrode bundle, the averaged responses of greatest visualsimilarity to the averaged K-complex and/or epileptiform dischargewere submitted for quantitative analysis as below.
Quantitative analysisComputer software was implemented in Matlab (The Math
Works Inc., USA) to quantify the similarity between averaged SPESresponses, averaged K complexes and averaged spontaneousinterictal epileptiform discharges.
For each patient, averaged K-complexes, responses to SPES andspontaneous interictal epileptiform discharges (where available)were compared to each other in one-to-one comparisons. Becausethere was no a priori synchronizing marker for recordings to becompared, an initial synchronizing time for all channels wasnecessary. This was achieved by calculating the compound ampli-tude at each latency. The compound amplitude was defined as thesummation of the absolute values of the amplitudes of each
Figure 1. Four samples of the signal processing steps. For each step, the correlation coefficieK-complex and an averaged SPES response are shifted and synchronized at initial synchrchronization (final synchronizing time) is calculated for each channel (C) and amplitudes arexample of high similarity between the K-complex and the SPES response. Sample 2 also shthat share a restricted similarity due to a positive deflection (downwards) in a segment of ththe limit of time shifting (step c).
recording channel at the latency in question. Further synchroniza-tion was then implemented for each recording channel in order toquantify the similarity between waveforms. Hence, for any tworecordings to be compared, synchronization was carried out in atwo stage process (Fig. 1):
1) The two recordings were shifted and synchronized at the timeof the largest compound amplitudes (“initial synchronizingtime”) (Fig. 1A). After that, SPES artifact was removed by flat-tening the record 150 ms before and after the peak of thestimulus artifact. The averagedwaveformswere smoothedwitha moving average of 20 ms (1/50 of the sample rate) (Fig. 1B).The initial synchronizing time provides a time baseline thattakes into account all channels from which the following stepwill start.
2) A second optimized synchronization was calculated for eachchannel with the data window between 500 ms before and1500 ms after the initial synchronizing time (Fig. 1C) in order toquantify the similarity between waveforms of homonymouschannels. For homonymous recording channels, the correlationcoefficients and their significance values were calculated aftersuccessive one-sample time shifts of one of the two recordingsto be compared. This was carried out for time shifts between175 ms before and after the initial synchronizing time. For eachchannel, the time shift used to yield the highest correlationcoefficient was the “final synchronizing time.” Values of thefinal synchronizing time between 70 ms before and 100 msafter the initial synchronizing time included all values between10th and 90th percentiles of all final synchronizing times.Homonymous channels with a final synchronizing time beyondthese limits were considered “dissimilar” channels.
In summary, the final synchronizing time is defined for eachchannel, and is an indication of the degree of time shifting from theoverall (initial) synchronizing time which is required to obtain thehighest correlation for each channel.
As the correlation coefficient does not take into account signalamplitude, traces markedly different in amplitude can misleadinglyyield a high correlation coefficient. To minimize this effect, once
nt (r) and the least square difference (LS) are shown. First, for each channel, an averagedonizing time (A). After that, SPES artifact is removed (B). The second optimized syn-e adjusted (D). Different situations are reflected in each sample. Sample 1 represents anows similar waveforms after some time shifting. Sample 3 reflects different waveformse recording. Sample 4 illustrates the case of very different waveforms that even reaches
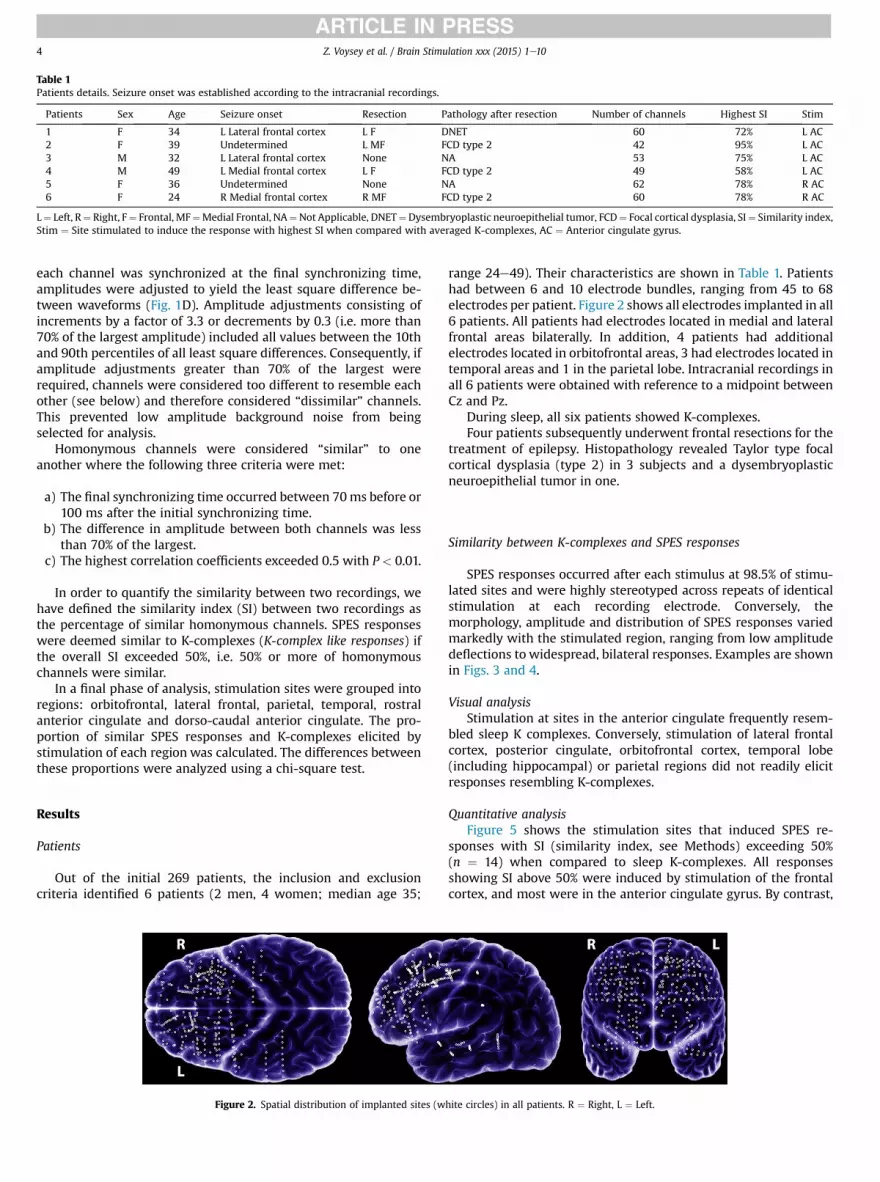
Table 1Patients details. Seizure onset was established according to the intracranial recordings.
Patients Sex Age Seizure onset Resection Pathology after resection Number of channels Highest SI Stim
1 F 34 L Lateral frontal cortex L F DNET 60 72% L AC2 F 39 Undetermined L MF FCD type 2 42 95% L AC3 M 32 L Lateral frontal cortex None NA 53 75% L AC4 M 49 L Medial frontal cortex L F FCD type 2 49 58% L AC5 F 36 Undetermined None NA 62 78% R AC6 F 24 R Medial frontal cortex R MF FCD type 2 60 78% R AC
L¼ Left, R¼ Right, F¼ Frontal, MF¼Medial Frontal, NA¼Not Applicable, DNET¼Dysembryoplastic neuroepithelial tumor, FCD¼ Focal cortical dysplasia, SI¼ Similarity index,Stim ¼ Site stimulated to induce the response with highest SI when compared with averaged K-complexes, AC ¼ Anterior cingulate gyrus.
Z. Voysey et al. / Brain Stimulation xxx (2015) 1e104
each channel was synchronized at the final synchronizing time,amplitudes were adjusted to yield the least square difference be-tween waveforms (Fig. 1D). Amplitude adjustments consisting ofincrements by a factor of 3.3 or decrements by 0.3 (i.e. more than70% of the largest amplitude) included all values between the 10thand 90th percentiles of all least square differences. Consequently, ifamplitude adjustments greater than 70% of the largest wererequired, channels were considered too different to resemble eachother (see below) and therefore considered “dissimilar” channels.This prevented low amplitude background noise from beingselected for analysis.
Homonymous channels were considered “similar” to oneanother where the following three criteria were met:
a) The final synchronizing time occurred between 70ms before or100 ms after the initial synchronizing time.
b) The difference in amplitude between both channels was lessthan 70% of the largest.
c) The highest correlation coefficients exceeded 0.5 with P < 0.01.
In order to quantify the similarity between two recordings, wehave defined the similarity index (SI) between two recordings asthe percentage of similar homonymous channels. SPES responseswere deemed similar to K-complexes (K-complex like responses) ifthe overall SI exceeded 50%, i.e. 50% or more of homonymouschannels were similar.
In a final phase of analysis, stimulation sites were grouped intoregions: orbitofrontal, lateral frontal, parietal, temporal, rostralanterior cingulate and dorso-caudal anterior cingulate. The pro-portion of similar SPES responses and K-complexes elicited bystimulation of each region was calculated. The differences betweenthese proportions were analyzed using a chi-square test.
Results
Patients
Out of the initial 269 patients, the inclusion and exclusioncriteria identified 6 patients (2 men, 4 women; median age 35;
Figure 2. Spatial distribution of implanted sites (w
range 24e49). Their characteristics are shown in Table 1. Patientshad between 6 and 10 electrode bundles, ranging from 45 to 68electrodes per patient. Figure 2 shows all electrodes implanted in all6 patients. All patients had electrodes located in medial and lateralfrontal areas bilaterally. In addition, 4 patients had additionalelectrodes located in orbitofrontal areas, 3 had electrodes located intemporal areas and 1 in the parietal lobe. Intracranial recordings inall 6 patients were obtained with reference to a midpoint betweenCz and Pz.
During sleep, all six patients showed K-complexes.Four patients subsequently underwent frontal resections for the
treatment of epilepsy. Histopathology revealed Taylor type focalcortical dysplasia (type 2) in 3 subjects and a dysembryoplasticneuroepithelial tumor in one.
Similarity between K-complexes and SPES responses
SPES responses occurred after each stimulus at 98.5% of stimu-lated sites and were highly stereotyped across repeats of identicalstimulation at each recording electrode. Conversely, themorphology, amplitude and distribution of SPES responses variedmarkedly with the stimulated region, ranging from low amplitudedeflections to widespread, bilateral responses. Examples are shownin Figs. 3 and 4.
Visual analysisStimulation at sites in the anterior cingulate frequently resem-
bled sleep K complexes. Conversely, stimulation of lateral frontalcortex, posterior cingulate, orbitofrontal cortex, temporal lobe(including hippocampal) or parietal regions did not readily elicitresponses resembling K-complexes.
Quantitative analysisFigure 5 shows the stimulation sites that induced SPES re-
sponses with SI (similarity index, see Methods) exceeding 50%(n ¼ 14) when compared to sleep K-complexes. All responsesshowing SI above 50% were induced by stimulation of the frontalcortex, and most were in the anterior cingulate gyrus. By contrast,
hite circles) in all patients. R ¼ Right, L ¼ Left.
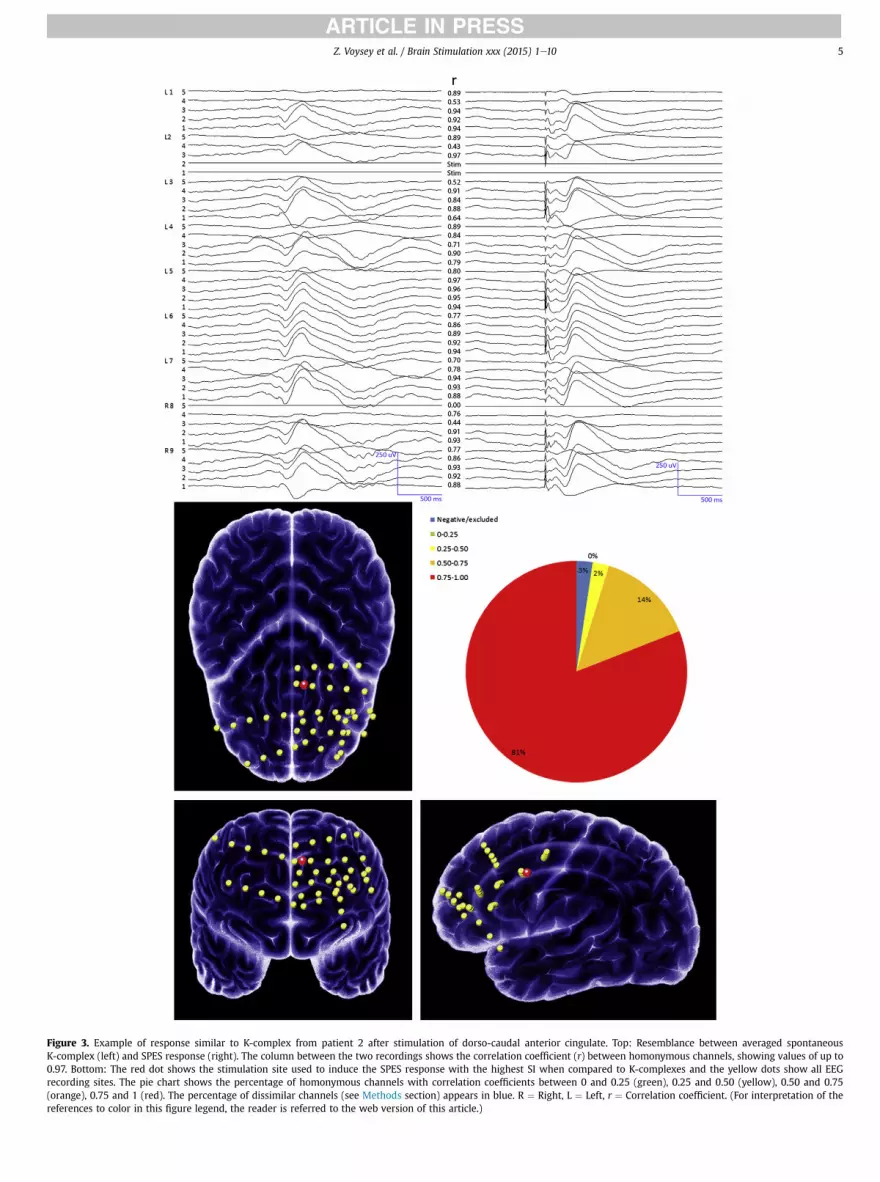
Figure 3. Example of response similar to K-complex from patient 2 after stimulation of dorso-caudal anterior cingulate. Top: Resemblance between averaged spontaneousK-complex (left) and SPES response (right). The column between the two recordings shows the correlation coefficient (r) between homonymous channels, showing values of up to0.97. Bottom: The red dot shows the stimulation site used to induce the SPES response with the highest SI when compared to K-complexes and the yellow dots show all EEGrecording sites. The pie chart shows the percentage of homonymous channels with correlation coefficients between 0 and 0.25 (green), 0.25 and 0.50 (yellow), 0.50 and 0.75(orange), 0.75 and 1 (red). The percentage of dissimilar channels (see Methods section) appears in blue. R ¼ Right, L ¼ Left, r ¼ Correlation coefficient. (For interpretation of thereferences to color in this figure legend, the reader is referred to the web version of this article.)
Z. Voysey et al. / Brain Stimulation xxx (2015) 1e10 5

Figure 4. Example of response not similar to K-complex from patient 2 after stimulation of rostral anterior cingulate. Top: Resemblance between averaged spontaneous K-complex(left) and SPES response (right). The column between the two recordings shows the correlation coefficient (r) between homonymous channels. Bottom: The red dot shows thestimulation site used to induce the SPES response with the highest SI when compared to K-complexes and the yellow dots show all EEG recording sites. The pie chart shows thepercentage of homonymous channels with correlation coefficients between 0 and 0.25 (green), 0.25 and 0.50 (yellow), 0.50 and 0.75 (orange), 0.75 and 1 (red). The percentage ofdissimilar channels (see Methods section) appears in blue. Note that most channels were considered dissimilar due to the amplitude or final synchronizing time criteria detailed inmethods, despite showing r values of up to 0.61. R ¼ Right, L ¼ Left, r ¼ Correlation coefficient. (For interpretation of the references to color in this figure legend, the reader isreferred to the web version of this article.)
Z. Voysey et al. / Brain Stimulation xxx (2015) 1e106

Figure 5. Sites whose stimulation induced SPES responses with SI above 50% (mean ¼ 69.49%, SD ¼ 10.37) when compared to averaged K-complexes in all patients. Red dotsrepresent stimulation sites which elicit the highest SI between SPES responses and K-complexes in each patient (mean ¼ 75.80%, SD ¼ 12.22). R ¼ Right, L ¼ Left. (For interpretationof the references to color in this figure legend, the reader is referred to the web version of this article.)
Z. Voysey et al. / Brain Stimulation xxx (2015) 1e10 7
no responses induced by stimulation of the posterior cingulate,temporal or parietal regions showed responses with SI above 50%.
Among the 14 recordings with SI above 50%, the median SI was69.49% (SD ¼ 10.37). In some cases, similarity to K-complexes wasas high as 81% of channels exhibiting correlation coefficients >0.75(Fig. 3). Moreover, for each patient, the stimulation site whichelicited the highest SI between SPES responses and K-complexeswas located in the anterior cingulate gyrus or in the underlyingwhite matter (Figs. 5 and 6); more specifically, in or by the dorso-caudal half of the anterior cingulate gyrus (red dots Fig. 5, SI:mean ¼ 75.80%, SD ¼ 12.22).
The median amplitude of K-complexes was 464.57 mV (range203.56e772.41 mV) and that of the most similar SPES responses was642.68 mV (range 192.07e793.77 mV).
All patients remained awake during stimulation of the regionsinducing K-complex-like responses.
Table 2 summarizes the degree of similarity between K com-plexes and SPES responses when stimulating at different regions.For each stimulated region, Table 2 shows the number and pro-portion of homonymous channels meeting the criteria for similarity(see Methods section). Responses to stimulation of the dorso-caudal anterior cingulate (n ¼ 24) showed the highest proportionof similar channels (63.33%). All other regions bore less than 35% ofchannels exhibiting similarity. Chi-square analysis revealed theexistence of differences in the proportion of similar channelsamong regions (P < 0.0001; 63.33% observed vs 35.88% expected),which attributable to the increased proportion of similar channelswhen stimulating at the dorso-caudal anterior cingulate.
Similarity between spontaneous interictal discharges and SPESresponses
Two patients (patients 2 and 6 in Table 2) exhibited interictalepileptiform discharges during wakefulness that resembled eachpatient’s K-complex (SI: 55.54% and 70.00% respectively). Of note,both were subsequently found to have histology-confirmed focalcortical dysplasia in the anterior cingulate gyrus, in contrast to theother four patients.
Discussion
We have found that electrical stimulation of the frontal lobeswhile awake can induce responses similar to sleep K-complexes.The responses of greatest similarity are elicited by stimulation ofthe anterior cingulate gyrus or its underlyingwhitematter (red dotsin Fig. 5). Their similarity is apparent both visually and quantita-tively. Stimulation of other regions including the posterior cingu-late, orbitofrontal, medial frontal, temporal, hippocampal orparietal areas did not induce such responses. Our findings areconsistent with a model in which the dorso-caudal anterior
cingulate initiates, and possibly coordinates, the widespread syn-chronous cortical process that constitutes the K-complex. Indeed,slow waves and K-complex-like responses can also be evoked bycortical transcranial magnetic stimulation over sensorimotor areas[33]. However, previous studies with intracranial EEG recordings inhumans have suggested that the cingulate cortex and functionallyrelated mesial frontal structures appear uninvolved in generatingthe visible human K-complex waveform [24]. This discrepancy ismost likely due to differences in methodology: whereas EEGlocalization identifies the generator of activity at a given time,electrical stimulation used in the present work identifies thestructure involved in “initiating” the course of events that willgenerate the K-complex.
K-complexes are thought to be related to sleep arousals ratherthan sleep generation. Therefore it is perhaps not surprising thatK-complex-like responses can be induced by unilateral stimulationin awake patients without inducing sleep. This suggests thatcingulate stimulation activates only part of the circuits involved insleep, probably sparing the subcortical loops. This supports thatK-complex generation largely relies on cortico-cortical connections.Indeed, the slow cortical oscillations involved in the genesis ofK-complexes [3] appear to be intrinsically generated in corticalneurons [10]. Moreover, there are profuse bilateral connectionsbetween medial frontal cortices [34], which may be responsible forthe bilateral cortical involvement seen during both, normal sleepK-complexes and electrically induced K-complexes [7]. In the gen-eration of normal sleep K-complexes, subcortical structures couldmodulate cortical excitability, allowing for neuronal synchroniza-tion similar to that induced by focal stimulation of the anteriorcingulate in our awake patients.
The neurochemical and electrophysiological state of the brain isvery different between sleep and awake states. The fact that we caninduce “sleep” phenomena while awake suggests that some sleepmechanisms are somehow present but “latent” during wakefulness,and can be activated by stimulation of the appropriate site whileawake. Moreover, it is possible that by stimulating the cingulategyrus we are activating only a sub-branch of the “K-complex”pathway. In that case wewould expect only a channel subset withinthe SPES response to simulate K-complexes in contrast to what wehave observed.
Other relatively large-amplitude evoked slow responses arisingfrom medial cortical structures (such as the P300) during wake-fulness have been proposed as a marker of conscious perception[35,36], a proposal that has been recently challenged by evidencesuggesting that these responses are absent when consciousperception is present [37,38]. Our results, showing that large slowresponses can be elicited by SPES of the frontal cortex withoutsubjects being conscious of the stimulus, provide new insight in thisdebate as they may represent a more general default-mode ofreactivity.

Figure 6. Averaged intracranial K-complexes from each 6 patients displayed in referential montages and topography of the electrodes used to induce the most similar K-complex-like responses. Each graph shows recordings from the electrode bundle used to stimulate the site that induced the responses resembling K-complexes the most. The electrodes usedto induce such responses are shown in red. For each electrode bundle, electrode 1 is the deepest, which is located at the anterior cingulate. In patient 1 electrode 4 was defective andtherefore the corresponding channel has been removed from the figure. (For interpretation of the references to color in this figure legend, the reader is referred to the web version ofthis article.)
Z. Voysey et al. / Brain Stimulation xxx (2015) 1e108

Table 2Stimulation sites and similarity between homonymous channels.
Stimulated region No. ofstimulationsites
Non-similarrecordingchannels
Similarrecordingchannels
Orbitofrontal 8 372 (80.69%) 89 (19.31%)Rostral anterior cingulate 29 1094 (74.78%) 369 (25.22%)Dorso-caudal anterior
cingulate24 454 (36.67%) 784 (63.33%)
Lateral frontal 4 115 (100%) 0 (0%)Parietal 2 291 (81.51%) 66 (18.49%)Temporal 6 162 (65.85%) 84 (34.15%)Total 73
Z. Voysey et al. / Brain Stimulation xxx (2015) 1e10 9
Anterior cingulate stimulation consistently induced K-complexlike responses but not sleep spindles. This suggests that the phys-iology of K-complexes is independent from that of sleep spindles. Incontrast to K-complexes, spindles are expressed in the cortex viathalamo-cortical excitatory projections [9] and K-complexes appearto trigger sleep spindles probably due to connections betweencortex and the reticular nucleus of the thalamus. However, ourfindings suggest that during wakefulness, cingulate stimulation isunable to activate these loops in a fashion which induces sleep orspindles.
This study with intracranial electrodes was necessarily limitedto patients with epilepsy. Anti-epileptic medication has beenshown to reduce the abundance of K-complexes [39e41] but to datethere is no evidence that their morphology or distribution is altered[24]. The question of whether epilepsy itself may have influencedour findings is more complex. In our series, seizure onset in 4 out of6 patients did not involve medial frontal cortex, suggesting that ourobservations are not necessarily due to abnormalities in cingulatecortex. Responses to SPES and spontaneous epileptiform dischargesshow similar characteristics in terms of cellular behavior [25], EEGmorphology [42,43] and cognitive effects [44]. Both appear to sharesimilar generic physiological mechanisms and spontaneous inter-ictal epileptiform discharges could be considered as triggered bysome form of endogenous stimulation or synchronization. There-fore, it is possible that lesions at the region whose stimulationinduces K-complexes can also originate interictal discharges similarto K-complexes, as observed in two of our patients with anteriorcingulate cortical dysplasia.
The beauty of this study is that the localizing power is not onlyprovided by the EEG itself, but also by the stimulation site, i.e. theinitiator of a spontaneous event is identified by the site whosestimulation induces a response similar to the spontaneous event inquestion, making localization independent from the montage used.
It could be argued that our patients had a predominance offrontal electrodes compared to other lobes (Fig. 2). Patients withbilateral frontal electrodes were deliberately chosen becausestimulating at extra-frontal structures in the total population of 269patients did not induce responses remotely similar to K-complexes.For instance, SPES responses to hippocampal stimulation inducesbilateral responses only in 5% of patients [34,45], and when theyoccur, they are grossly asymmetrical. Furthermore, even within thefrontal lobes, the similarity between SPES responses and K-com-plexes is highly specific of stimulation of the dorso-caudal anteriorcingulate or its underlying white matter (Table 2). In any case, thecortical region within the anterior cingulate responsible forK-complex like responses appears to be rather specific. For instance,in patients 1 and 6, stimulation of the deepest contacts of thebundle located at the anterior cingulate did not induce the re-sponses with highest similarity to K-complexes, despite beinglocated in regions apparently similar to those of the remaining fourpatients (Fig. 6). However, in these two patients, SPES responses
most similar to K-complexes were induced when stimulating thewhite matter underlying the anterior cingulate, which could beexplained by stimulation of axons projecting to the anteriorcingulate gyrus.
Conclusions
This study has implications for sleep physiology. Our findingsprovide the first causal evidence that the anterior cingulate gyrusinitiates widespread synchronous activity that resembles K-com-plexes. Moreover, cingulate stimulation can induce responsessimilar to K-complexes during wakefulness, suggesting thatsubcortical structures may not be required for initiatingK-complexes.
References
[1] Iber C, Ancoli-Israel S, Chesson AL, Quan SF. AASM e Manual for the scoring ofsleep and associated events. 2007.
[2] Loomis AL, Harvey EN, Hobart GA. Distribution of disturbance-patterns in thehuman electroencephalogram, with special reference to sleep. J Neurophysiol1938;1:413e30.
[3] Amzica F, Steriade M. The functional significance of K-complexes. Sleep MedRev 2002;6:139e49.
[4] Halász P, Pál I, Rajna P. K-complex formation of the EEG in sleep. A survey andnew examinations. Acta Physiol Hung 1985;65:3e35.
[5] Johnson LG, Karpan WE. Autonomic correlates of the spontaneous K-complex.Psychophysiology 1968;4:444e53.
[6] Niiyama Y, Satoh N, Kutsuzawa O, Hishikawa Y. Electrophysiological evidencesuggesting that sensory stimuli of unknown origin induce spontaneousK-complexes. Electroencephalogr Clin Neurophysiol 1996;98:394e400.
[7] Amzica F, Steriade M. Short- and long-range neuronal synchronization of theslow (<1 Hz) cortical oscillation. J Neurophysiol 1995;73:20e38.
[8] Cash SS, Halgren E, Dehghani N, et al. The human K-complex represents anisolated cortical down-state. Science 2009;324:1084e7.
[9] Contreras D, Esteriade M. Cellular basis of EEG slow rhythms: corticothalamicrelationships. J Neurosci 1995;15.
[10] Steriade M, Nuñez A, Amzica F. A novel slow (<1 Hz) oscillation of neocorticalneurons in vivo: depolarizing and hyperpolarizing components. J Neurosci1993;13:3252e65.
[11] Steriade M, Contreras D, Curró Dossi R, Nuñez A. The slow (<1 Hz) oscillationin reticular thalamic and thalamocortical neurons: scenario of sleep rhythmgeneration in interacting thalamic and neocortical networks. J Neurosci1993;13:3284e99.
[12] Steriade M, Nuñez A, Amzica F. Intracellular analysis of relations between theslow (<1 Hz) neocortical oscillation and other sleep rhythms of the electro-encephalogram. J Neurosci 1993;13:3266e83.
[13] Hirsch JC, Fourment A, Marc ME. Sleep-related variations of membrane po-tential in the lateral geniculate body relay neurons of the cat. Brain Res1983;259:308e12.
[14] Nir Y, Staba RJ, Andrillon T, et al. Regional slow waves and spindles in humansleep. Neuron 2011;70:153e69.
[15] Massimini M, Huber R, Ferrarelli F, Hill S, Tononi G. The sleep slow oscillationas a traveling wave. J Neurosci 2004;24:6862e70.
[16] Roth M, Shaw J, Green J. The form voltage distribution and physiologicalsignificance of the K-complex. Electroencephalogr Clin Neurophysiol1956;8:385e402.
[17] Gastaut H. Etude électrographique chez l’homme et chez l’animal desdécharges épileptiques dites psychomotrices. Rev Neurol 1953;88:310e52.
[18] Wennberg R, Cheyne D. On noninvasive source imaging of the humanK-complex. Clin Neurophysiol 2013;124:941e55.
[19] Murphy M, Riedner BA, Huber R, Massimini M, Ferrarelli F, Tononi G. Sourcemodeling sleep slow waves. Proc Natl Acad Sci U S A 2009;106:1608e13.
[20] Dang-Vu TT, Desseilles M, Laureys S, et al. Cerebral correlates of delta wavesduring non-REM sleep revisited. Neuroimage 2005;28:14e21.
[21] Czisch M, Wehrle R, Stiegler A, et al. Acoustic oddball during NREM sleep: acombined EEG/fMRI study. PLoS One 2009;25:e6749.
[22] Hughes JR, Mazurowski JA. Studies on the supracallosal mesial cortex of un-anesthetized, conscious mammals: I. Cat. B. Electrical activity. Electro-encephalogr Clin Neurophysiol 1959;11:459e69.
[23] Hughes JR, Mazurowski JA. Studies on the supracallosal mesial cortex of un-anesthetized, conscious mammals: II. Monkey. D. vertex sharp waves andepileptiform activity. Electroencephalogr Clin Neurophysiol 1964;16:561e74.
[24] Wennberg R. Intracranial cortical localization of the human K-complex. ClinNeurophysiol 2010;121:1176e86.
[25] Alarcón G, Martinez J, Kerai SV, et al. In vivo neuronal firing patterns duringhuman epileptiform discharges replicated by electrical stimulation. ClinNeurophysiol 2012;123:1736e44.
Z. Voysey et al. / Brain Stimulation xxx (2015) 1e1010
[26] Flanagan D, Valentín A, García Seoane JJ, Alarcón G, Boyd SG. Single-pulseelectrical stimulation helps to identify epileptogenic cortex in children. Epi-lepsia 2009;50:1793e803.
[27] Valentín A, Alarcón G, Honavar M, et al. Single pulse electrical stimulation foridentification of structural abnormalities and prediction of seizure outcomeafter epilepsy surgery: a prospective study. Lancet Neurol 2005;4:718e26.
[28] Valentín A, Alarcón G, García-Seoane JJ, et al. Single-pulse electrical stimula-tion identifies epileptogenic frontal cortex in the human brain. Neurology2005;65:426e35.
[29] Valentín A, Anderson M, Alarcón G, et al. Responses to single pulse electricalstimulation identify epileptogenesis in the human brain in vivo. Brain2002;125:1709e18.
[30] Kissani N, Alarcon G, Dad M, Binnie CD, Polkey CE. Sensitivity of recordings atsphenoidal electrode site for detecting seizure onset: evidence from scalp,superficial and deep foramen ovale recordings. Clin Neurophysiol2001;112:232e40.
[31] Fernández Torre JL, Alarcón G, Binnie CD, et al. Generation of scalp dischargesin temporal lobe epilepsy as suggested by intraoperative electrocorticographicrecordings. J Neurol Neurosurg Psychiatry 1999;67:51e8.
[32] Akanuma N, Koutroumanidis M, Adachi N, Alarcón G, Binnie CD. Presurgicalassessment of memory-related brain structures: the Wada test and functionalneuroimaging. Seizure 2003;12:346e58.
[33] Massimini M, Ferrarelli F, Esser SK, et al. Triggering sleep slow waves by trans-cranial magnetic stimulation. Proc Natl Acad Sci U S A 2007;104:8496e501.
[34] Lacruz ME, García Seoane JJ, Valentin A, Selway R, Alarcón G. Frontal andtemporal functional connections of the living human brain. Eur J Neurosci2007;26:1357e70.
[35] Sergent C, Baillet S, Dehaene S. Timing of the brain events underlyingaccess to consciousness during the attentional blink. Nat Neurosci2005;8:1391e400.
[36] Dehaene S, Changeux JP. Experimental and theoretical approaches toconscious processing. Neuron 2011;70:200e27.
[37] Melloni L, Schwiedrzik CM, Müller N, Rodriguez E, Singer W. Expectationschange the signatures and timing of electrophysiological correlates ofperceptual awareness. J Neurosci 2011;31:1386e96.
[38] Pitts MA, Metzler S, Hillyard SA. Isolating neural correlates of consciousperception from neural correlates of reporting one’s perception. Front Psychol2014;5:1e16.
[39] Colrain IM. The K-complex: a 7-decade history. Sleep 2005;28:255e73.[40] Johnson LC, Hanson K, Bickford RG. Effect of flurazepam on sleep spindles and
K-complexes. Electroencephalogr Clin Neurophysiol 1976;40:67e77.[41] Legros B, Bazil CW. Effects of antiepileptic drugs on sleep architecture: a pilot
study. Sleep Med 2003;4:51e5.[42] Nayak D, Valentín A, Selway RP, Alarcón G. Can single pulse electrical stim-
ulation provoke responses similar to spontaneous interictal epileptiformdischarges? Clin Neurophysiol 2014;125:1306e11.
[43] Valentin A, Lazaro M, Mullatti N, et al. Cingulate epileptogenesis in hypotha-lamic hamartoma. Epilepsia 2011;52:e35e9.
[44] Lacruz ME, Valentín A, Seoane JJG, Morris RG, Selway RP, Alarcón G. Singlepulse electrical stimulation of the hippocampus is sufficient to impair humanepisodic memory. Neuroscience 2010;170:623e32.
[45] Jiménez-Jiménez D, Abete-Rivas M, Martín-López D, et al. Incidence of func-tional bi-temporal connections in the human brain in vivo and their relevanceto epilepsy surgery. Cortex 2015;5:0e10.