Flock Size and Foraging Decisions in Central Place Foraging White Storks, Ciconia Ciconia
Systems/Circuits
Neurons in Dorsal Anterior Cingulate Cortex SignalPostdecisional Variables in a Foraging Task
Tommy C. Blanchard and Benjamin Y. HaydenDepartment of Brain and Cognitive Sciences and Center for Visual Science, University of Rochester, Rochester, New York 14618
The dorsal anterior cingulate cortex (dACC) is a key hub of the brain’s executive control system. Although a great deal is known about itsrole in outcome monitoring and behavioral adjustment, whether and how it contributes to the decision process remain unclear. Sometheories suggest that dACC neurons track decision variables (e.g., option values) that feed into choice processes and is thus “predeci-sional.” Other theories suggest that dACC activity patterns differ qualitatively depending on the choice that is made and is thus “postde-cisional.” To compare these hypotheses, we examined responses of 124 dACC neurons in a simple foraging task in which monkeysaccepted or rejected offers of delayed rewards. In this task, options that vary in benefit (reward size) and cost (delay) appear for 1 s;accepting the option provides the cued reward after the cued delay. To get at dACC neurons’ contributions to decisions, we focused onresponses around the time of choice, several seconds before the reward and the end of the trial. We found that dACC neurons signal theforegone value of the rejected option, a postdecisional variable. Neurons also signal the profitability (that is, the relative value) of the offer,but even these signals are qualitatively different on accept and reject decisions, meaning that they are also postdecisional. These resultssuggest that dACC can be placed late in the decision process and also support models that give it a regulatory role in decision, rather thanserving as a site of comparison.
IntroductionThe dorsal anterior cingulate cortex (dACC) is a key node in thebrain’s executive control system. It is situated at the interface ofthe reward and motor systems and thus likely plays an importantrole in using reward information to influence action (Paus,2001). There is a great deal of information on its role in monitor-ing and adjustment (Ito et al., 2003; Rushworth et al., 2004;Quilodran et al., 2008; Alexander and Brown, 2011; Bernacchia etal., 2011; Hayden et al., 2011a,b; Shenhav et al., 2013). It is sensi-tive to received rewards, errors, and to differences between ex-pected and obtained rewards (Amiez et al., 2005, 2006;Matsumoto et al., 2007; Hayden et al., 2011a). These signals ap-pear to summate to indicate the balance of evidence in favor ofadjustments to action or the need for control (Shima and Tanji,1998; Kerns et al., 2004; Hayden et al., 2011b; Shenhav et al.,2013).
There is relatively less information on the direct contribu-tions, if any, of dACC to the value representation and comparisonprocesses that constitute reward-based choice. On one hand (aswe will argue here), dACC may not be directly involved, andinstead function as a monitor and controller of both the decisions
we make and of their outcomes. If so, we would expect that itsresponses around the time of the decision to signal variables re-lated to the chosen option and to depend qualitatively on thechoice that is made (Cai and Padoa-Schioppa, 2012). On theother hand, dACC may represent values of offers. This informa-tion would presumably be used for a downstream comparisonprocess, to determine a choice (Wunderlich et al., 2009).
To test these ideas, we recorded activity of single dACC neu-rons in a diet selection task based on a famous problem fromforaging theory (Krebs et al., 1977; Stephens and Krebs, 1987).On each trial, monkeys accept or reject a delayed reward. To solvethis task, monkeys should compare the rate of the reward theyexpect to receive if they accept it (i.e., the profitability of the offer)to the rate of reward they would expect to receive in if they were toreject it (Krebs et al., 1977; Stephens and Krebs, 1987). The fun-damental logic of this idea, that decisions should be comparedwith the opportunity cost of the next best alternative, is the sameas the idea of economists that “all costs are opportunity costs”(Krugman et al., 2011). In the diet selection task, the foregonebenefit of accepting an offer is a linear function of its delay anddoes not depend on its reward size, whereas the foregone benefitof rejecting is a linear function of its reward size and does notdepend on its delay.
We find that around the time of the choice, neurons signalforegone benefit of rejected options. They also signal profitabil-ity, but do so in a different format (meaning neurons use differentresponse patterns) for accept and reject decisions. Thus, variablesencoded by dACC neurons around the time of the decision arepredominantly postdecisional. These findings suggest that dACCdoes not serve as a site of value comparison. We conjecture thatthe brain uses these variables to monitor and evaluate the out-
Received July 25, 2013; revised Oct. 19, 2013; accepted Nov. 25, 2013.Author contributions: T.C.B. and B.Y.H. designed research; T.C.B. performed research; B.Y.H. contributed unpub-
lished reagents/analytic tools; T.C.B. analyzed data; T.C.B. and B.Y.H. wrote the paper.This work was supported by an NSF Career Award, an R00 (DA027718), and a Sloan Foundation fellowship to
B.Y.H. We thank John Pearson and Alex Thome for useful discussions, Marc Mancarella for assistance in data collec-tion, and Caleb Strait for help with subject training.
The authors declare no competing financial interests.Correspondence should be addressed to Tommy Blanchard, Department of Brain and Cognitive Sciences, Univer-
sity of Rochester, Rochester, NY 14618. E-mail: [email protected]:10.1523/JNEUROSCI.3151-13.2014
Copyright © 2014 the authors 0270-6474/14/340646-10$15.00/0
646 • The Journal of Neuroscience, January 8, 2014 • 34(2):646 – 655

comes of decisions and perform strategic or regulatory adjust-ments, perhaps as it is being made. These results endorse the ideathat dACC is fundamentally a controller, both during and afterdecisions.
Materials and MethodsEthics statement. All procedures were approved by the University ofRochester Institutional Animal Care and Use Committee and were de-signed and conducted in compliance with the Public Health Service’sGuide for the Care and Use of Animals.
Task. On each trial of our task, an option appeared at the top of thescreen and moved smoothly at a constant rate downward. All optionswere horizontally oriented rectangles 80 pixels high and of variable width(60 –300 pixels; Fig. 1). Option color indicated reward value: orange(0.075 ml), gray (0.135 ml), green (0.212 ml), or cyan (0.293 ml). Inaddition to these four colors, one-fifth of options were divided horizon-tally into half-cyan and half-red portions; these offered a 50% chance ofreceiving a 0.293 ml reward, and 50% chance of receiving no reward.Option width indicated delay associated with that option. Option widthswere 60, 120, 180, 240, and 300 pixels and corresponded to delays of 2, 4,6, 8, or 10 s, respectively. Each possible option (30 options, 5 widths by 6colors) appeared with equal frequency; width and color were selectedrandomly and independently on each trial.
Two male rhesus macaques (Macaca mulatta; Monkeys B and J) per-formed the task. On each trial, a subject could select an option by fixatingit or reject the option by avoiding direct gaze on it. In the absence of anyaction, each option took 1 s to move vertically downward from the top ofthe display area of the computer monitor to the bottom, after which timeit disappeared and could no longer be chosen. In this case, the trial wouldend and a 1.5 s intertrial interval (ITI) would begin. If the monkey se-lected an option by fixating it, the option would stop moving wherever itwas and then would begin to shrink horizontally. Shrinking rate wasconstant (30 pixels/s) and thus option width served to identify totalremaining delay associated with each option.
If the monkey averted gaze from the option during the shrinkingphase, the option would (after a 0.25 s grace period) continue its move-ment toward the bottom of the screen. As it moved, its width wouldremain at what it had been when gaze was averted, and if it was fixated
upon again, it would again pause and beginshrinking from its new, smaller width. If at anypoint the monkey held an option until itshrunk entirely, the appropriate reward wouldbe delivered, the trial would end, and a 1.5 s ITIwould follow.
Behavioral techniques. Horizontal and verti-cal eye positions were sampled at 1000 Hz by aninfrared eye-monitoring camera system (Eye-Link 1000, SR Research). We wrote our exper-iments in MATLAB (MathWorks), using thePsychophysics and Eyelink Toolbox exten-sions. A standard solenoid valve (Parker)controlled the duration of water delivery. Im-mediately before recording, we performed acareful calibration of our solenoid system toestablish a precise relationship between sole-noid open time and water volume in our rigs.
Surgical procedures. Two male rhesus mon-keys (Macaca mulatta) served as subjects. Ini-tially, a head-holding mount was implantedusing standard techniques. Four weeks later,animals were habituated to laboratory condi-tions and trained to perform oculomotor tasksfor liquid reward. A second surgical procedurewas then performed to place a 19 mm plasticrecording chamber (Crist Instruments) overdorsal anterior cingulate cortex (32 mm ante-rior, 7 mm medial interaural). Animals re-ceived analgesics and antibiotics after allsurgeries. The chamber was kept sterile with
regular antibiotic washes and sealed daily with sterile plastic caps.Microelectrode recording techniques. Single electrodes (Frederick Haer;
impedance range 0.8 – 4 M�) were lowered using a microdrive (NANInstruments) until the waveform of one or more (1–3) neuron(s) wasisolated. Individual action potentials were identified by standard criteriaand isolated on a Plexon system. Neurons were selected for study solelybased on the quality of isolation and never on task-related responseproperties.
We approached dACC through a standard plastic recording grid (CristInstruments). dACC was identified by structural magnetic resonanceimages taken before the experiment and concatenated using Brainsight(Rogue Research). Neuroimaging was performed at the Rochester Centerfor Brain Imaging, on a Siemens 3T MAGNETOM Trio TIM using 0.5mm voxels. Chamber placement was reconciled with Brainsight. We alsoused Brainsight to guide placement of grids and to determine the locationof our electrodes. We confirmed recording locations by listening forcharacteristic sounds of white and gray matter during recording, whichin all cases matched the loci indicated by the Brainsight system with anerror of �1 mm. Our recordings came from areas 6/32 and 9/32 accord-ing to the Paxinos atlas.
Optimal foraging calculations. We based our estimates of the optimalthreshold for acceptance of an option off the algorithm described byStephens and Krebs, 1987. First, a ranked ordering of the possible kindsof options (4 reward sizes � 5 delay sizes) was generated based on eachoption’s profitability. We left out gamble options due to difficulties esti-mating the value of them (discussed in more detail at the end of thissection).
According to the Prey Algorithm (Stephens and Krebs, 1987), options
should be added to the diet as long as�i�1
j �iei
1 � �i�1j �ihi
�ej�i
hj�iwhere e is
reward size, h is handling time (or delay, as we refer to it), and thuse1
h1gives the profitability of option 1. l gives the option’s frequency,
which is equal for all options in our task. Options are sorted, such thate1
h1�
e2
h2� … �
en
hn. Thus, the algorithm dictates that one goes
through the options from most to least profitable, continually updating
75 mL135mL212mL293mL293mL (50% gamble)
2 seconds4 seconds6 seconds8 seconds10 seconds
reward sizes handling times
A
C
time
BdACC
1 second
2-10 seconds
Figure 1. Task and recording location. A, Task design. Options moved smoothly down the screen. Subjects fixated options tochoose them. Rewards were given if fixation was maintained for a fixed delay (indicated by option width). Color indicated rewardavailable. Two example trials are shown. In the first, the subject does not fixate (i.e., he rejects). In the second, the subject fixatesto completion and receives a reward (i.e., he accepts). B, Reward sizes and handling times used. C, Recording site in dACC.
Blanchard and Hayden • dACC Neurons Carry Postdecisional Signals J. Neurosci., January 8, 2014 • 34(2):646 – 655 • 647

the current strategy to include the option being considered until theabove inequality is no longer satisfied. At that point, the left side of the
inequality,�i�1
j �iei
1 � �i�1j �ihi
is the optimal threshold.
The model assumes that there is no cost to rejecting an option. In ourtask, this assumption does not hold true. Thus, our task violates oneof the assumptions of the prey model, so we made one small alteration tothe above algorithm. Rejecting an option imposes a small time cost of upto 1 s for the option to fall to the bottom of the screen, plus a 250 ms graceperiod where the option stays in place, plus time required to make adecision (and look away), which generally takes 500 ms. Thus, we esti-mated the time cost of rejection at 1.75 s. To take this cost into account,we simply subtracted it from the handling time, to get the added cost ofacceptance. This step never resulted in a negative handling time, as allhandling times were 2 or more seconds.
The exclusion of gambling options from this optimality analysis wasdue to the lack of a suitable method for including them. In principle, onecould use the expected profitability of the options (the expected rewardsize divided by the delay). However, we know from a large number ofprevious results (Hayden et al., 2008, 2011a; Hayden and Platt, 2009), aswell as the monkeys’ behavior in the present task that they overvaluegambles (see Results, Behavioral results). Thus using the profitabilityprovides a poor measure of the subjective value of these options. Alter-natively, we could use the monkeys’ own behavior to determine thesubjective value of these options. However, using this method wouldproduce spurious correlations between the estimated optimal behaviorand the animals’ behavior. Thus, we simply chose to exclude these op-tions from the optimality analysis. Note that doing so has no bearing onour major results presented in this paper.
ResultsBehavioral resultsBoth monkeys rapidly learned and mastered the diet selectiontask. They appeared to have an understanding of the task within afew dozen trials and developed a consistent strategy within 3 d oftraining. Both monkeys were trained for at least 3 weeks beforerecording began to ensure that preferences were stable. All datareported here come from well after the completion of this train-ing period. We continued to monitor and verify stabilitythroughout recordings
Normative behavior in this task demands sensitivity to bothreward size and delay of offers. Both monkeys showed sensitivityto reward size (Fig. 2A; linear regression, acceptance rate re-gressed onto reward size, in �l: b � 0.02165, t(49973) � 107.653,p � 0.0001) and delay length (linear regression, acceptance rateregressed onto time in seconds; b � �0.099, t(49973) � �147.3,p � 0.0001) in their choices. Although monkeys could, in theory,
abandon an option after it was chosen they seldom chose to dothis (they ended up abandoning after fixating for 750 ms on 6.6%of all trials, 8.3% in Monkey B and 4.0% in Monkey J).
According to foraging theory, profitability (defined as the re-ward size divided by the amount of time required to obtain it) isthe key variable foragers should use to make their decision in astable environment (Stephens and Krebs, 1987). Both monkeysshowed behavior that was consistent with normative foragingtheory: a strong relationship between acceptance rates and prof-itability (Fig. 2B; logistic regression, b � 141.56, z(49973) �103.0, p � 0.0001). The optimal policy in this task is to set aspecific fixed accept/reject threshold whose value depends on theaverage richness of the environment (Stephens and Krebs, 1987).Animals should therefore accept all prey items more profitablethan a specific value and reject all less profitable items.
Thus, we might expect a step–function shaped accept–rejectcurve. Foraging theory gives an the optimal threshold in this taskof 23.7 �l/s (see Materials and Methods for estimation method;Stephens and Krebs, 1987). The two animals’ transition point(the point at which we estimate a 0.5 acceptance rate) was 26.3�l/s, 11% above the optimal threshold (Fig. 2B). The transitionpoint for subject J is 23.6 �l/s, transition point for Monkey B is29.1 �l/s. Thus, Monkey B was biased to accept slightly moreoften than he should have; Monkey J nearly matched the optimalthreshold. Acceptance rates were not well fit by a step function,but instead showed a relatively shallow sigmoidal curve (Fig. 2B).This pattern is reminiscent of that observed in a well knownearlier testing of foraging preferences using a similar task (Krebset al., 1977). This is not surprising, given that stochasticity inpreference behavior is a general trait of biological decision-makers (Busemeyer and Townsend, 1993).
In addition to the four prey options with predictable out-comes, 20% of the prey options were gambles: these offered a50% chance of the largest reward size (293 �l) and 50% chance ofno reward (Fig. 1B). The monkeys’ acceptance rate for gambleoptions was much higher than would be predicted given theirexpected values (67.7% acceptance rate of all gamble options,where an acceptance rate of 53.4% is expected, this is highly sig-nificant, p � 0.0001, binomial test; Fig. 2C). Previous studieshave reported risk-seeking behavior in two-option choice con-texts; that is, monkeys are more likely to choose a risky optionthan one would predict based on its expected value (Hayden andPlatt, 2009; Hayden et al., 2010; O’Neill and Schultz, 2010; Soand Stuphorn, 2010; Heilbronner and Hayden, 2013). These data
1.0
A B
n=47309 trials0.2
0
0.4
0.60.81.0
acce
ptan
ce r
ate
2 4 6 8 10
handling time (sec)
75 mL135 mL212 mL293 mLgamble
Cpredicted based on EV
observed
n=9873 trials0.2
0
0.4
0.60.8
acce
ptan
ce r
ate
40 80 120 1600
profitability (µL/sec)
n=37436 trials
0.2
0
0.4
0.6
0.8
1.0
acce
ptan
ce r
ate
2 4 6 8 10
handling time (sec)
normative threshold
Figure 2. Behavior. A, Proportion of options accepted varied with both reward amount and delay. Colors indicate reward sizes as indicated by Figure 1B. B, Acceptance rate rose with profitabilityof option. Gamble options were excluded from this analysis. Blue line indicates best-fit logistic line. Red line is the optimal threshold (see Materials and Methods for optimality calculation details).C, Monkeys had a larger acceptance rate for gambles than would be expected based on the profitability of gambles. Blue line indicates the estimated acceptance rate for gamble options based online fit from B. Blue-red dashed line indicates actual gamble acceptance rate. For all panels, error bars are smaller than the lines.
648 • J. Neurosci., January 8, 2014 • 34(2):646 – 655 Blanchard and Hayden • dACC Neurons Carry Postdecisional Signals

thus indicate that monkeys’ risk-seeking bias extends beyond bi-nomial choice tasks to arguably more naturalistic foraging-linetasks, and thus demonstrate the robustness of monkeys’ risk-seekingness (Heilbronner and Hayden, 2013).
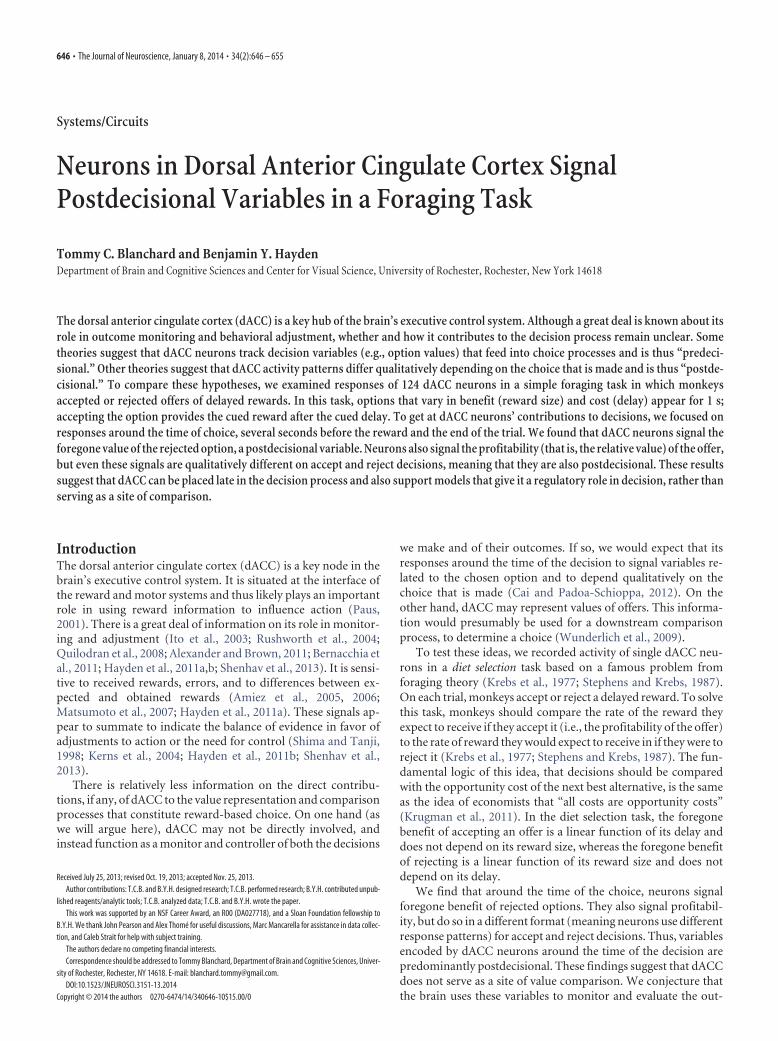
Time course of neural responsesWe recorded the activity of 124 neurons from dACC while mon-keys performed the diet selection task (74 neurons from MonkeyB, 50 from Monkey J). The recording location is shown in Figure1C and described in Materials and Methods. During each trial, wetypically observed an initial burst of spikes followed by an ex-tended period of low activity and then a second period of highactivity around the time of the reward (Fig. 3A). These basicpatterns are consistent with the perisaccadic activations we havereported previously in this region (Hayden et al., 2011b).
We first sought to estimate the amount of time it took themonkeys to make their decisions. Monkeys generally adopted astrategy of fixating the option as soon as it appeared and theneither maintaining gaze to accept it or averting their eyes to rejectit (the rare trials where the monkey never fixated the option werenot analyzed). Because the time of the accept decision is notobservable, we estimated decision time by measuring when theanimals typically looked away during reject trials. We found thatmean reject time was 495 �6 ms (SE). Given that oculomotorplanning and execution presumably takes at least 100 ms (Stanfordet al., 2010), we estimated that the decision generally occurred ap-proximately between 300 and 400 ms after stimulus onset.
We first looked at the population frequency of encoding of thetwo parameters that defined each option, its delay and its rewardsize (fluid volume). We reasoned that neurons encode a variableif their firing rates correlate with the value of that variable and soperformed a correlation with running boxcar (100 ms windows,10 ms step). Because spiking patterns are non-Gaussian (Dayanand Abbott, 2005), we used Poisson regression (including anestimated dispersion coefficient to account for overdispersion inour data) to relate the number of spikes onto z-scored values ofdelay and reward size (Fig. 3B).
We found that the proportion of neurons encoding either taskvariable peaked 500 ms, shortly after the estimated decisiontime, and then remain fairly stable for the next 500 ms. We there-fore used the epoch from 500 to 1000 ms after the onset of the
stimulus summarize the effects we see inthe boxcar analysis. (Similar althoughweaker patterns were found in other adja-cent epochs; data are not shown here). Ahigh proportion of neurons encoded ei-ther delay (37.9%, 47 of 124 neurons) orreward (42.7%, n � 53/124), and manyencoded both simultaneously (24.2%,n � 30/124).
Of those neurons significantly encod-ing reward size in the 500 –1000 ms epoch,64.1% (n � 34/53) correlated positivelywith reward size, and the remaining35.9% (n � 19/53) negatively correlatedwith reward size. This bias toward positiveencoding approaches, but does not reach,significance (p � 0.0534, two-sided bino-mial test). Of those significantly encodingdelay, 55.3% (n � 26/47) correlated posi-tively with delay, and the remaining44.7% (n � 21/47) correlated negativelywith delay. This bias toward positive en-
coding is not significant (p � 0.560, two-sided binomial test).
Neurons in dACC preferentially encode delay on accept trialsIn the diet selection task, accepting an option provides a rewardbut also imposes an opportunity cost in the form of a certaindelay. This delay is costly because monkeys lose the opportunityto harvest other rewards while they are waiting (Charnov, 1976;Stephens and Krebs, 1987). Given the well established role ofdACC in encoding fictive rewards and values of unchosen op-tions, we hypothesized that immediately following accept deci-sions, dACC neurons would encode the option’s delay but not itsreward size (Hayden et al., 2009; Boorman et al., 2011). We foundthis to be generally true (Fig. 4A,B; see example neurons).
We first used a running boxcar analysis (100 ms sliding win-dow, steps of 10 ms), only including the data from accept trials(Fig. 4C,E). We again used Poisson regression to relate the num-ber of spikes onto z-scored values of delay and reward size on eachwindow. We found that, at around the time of the decision, therewas a divergence between the number of neurons significantlysignaling reward size and the number significantly signaling de-lay, with more signaling delay (Fig. 4C). The strength of thissignaling, as measured by regression coefficients, followed thesame pattern (Fig. 4E). To quantify these effects, we again focusedon the 500 ms epoch beginning immediately after choice (t �500 –1000 ms). We found that on accept trials the regressioncoefficient for delay was significant for 37.1% of neurons (n �46/124; criterion for significance, � � 0.05). The coefficient forreward size was significant for only 24.2% (n � 30/124) neurons.This difference between the proportion of neurons encoding de-lay and reward size was significant (p � 0.028, z test for twopopulation proportions). These data indicate that, while neuronsencode both delay and reward information following choices,encoding of delay is more prevalent.
Of those neurons significantly encoding reward size in the500 –1000 ms epoch on accept trials, 50% (n � 15/30) correlatedpositively with reward size, and the remaining 50% (n � 15/30)negatively correlated with reward size. Of those significantly en-coding delay, 60.9% (n � 28/46) correlated positively with delay,and the remaining 39.1% (n � 18/46) correlated negatively withdelay. This bias toward positive encoding is not significant (p �0.184, two-sided binomial test).
0 0.5 10
time (sec)
% o
f cel
ls e
ncod
ing
Bn=124 neurons
delayreward8
12
16
20
firin
g ra
te (
spik
es/s
ec)
n = 161 trials
cell B55
2 sec 2 sec2-6 sec
A
both
~decisiontime
reward
10
40
30
20
Figure 3. General neural response properties. A, The typical time course of the firing rate of an example neuron. An initial periodof high activity follows the appearance of the option. Activity then stays steady for a fixed period, before ramping up in rewardanticipation. The gray box indicates the first second, which is the focus this paper. The middle period is condensed for higher delayoptions, to show trials on the same scale. Only trials that are accepted and have delays of 6 –10 s are included, to show the full timecourse leading up to reward. B, Percentage of cells that reach significant ( p�0.05) correlation between firing rate and delay (red),reward (green), and both (yellow) significant correlation for both delay and reward. Sliding boxcar analysis; window size is 100 ms,time 0 is the time of option appearance, and the green area indicates our best estimate of when the decision it being made.
Blanchard and Hayden • dACC Neurons Carry Postdecisional Signals J. Neurosci., January 8, 2014 • 34(2):646 – 655 • 649

We used the absolute value of the re-gression coefficient (i.e., �-weight) as ameasure of effect size. This rectified re-gression coefficient indicates how muchthe firing rate of a neuron changes as afunction of delay or reward size. Note thatthis definition is agnostic about the direc-tion of tuning; the goal of this analysis is toestimate how much information is avail-able in average neuronal firing rates, re-gardless of tuning direction. Our effectsize measure was consistent with ourprevalence measure. The average absolutevalues of the �-weights were stronger fordelay than reward size in accept trials (Fig.4C–F). Across all neurons, the average ofthe �-weights in the 500 –1000 ms timewindow was 0.157 for the delay coefficientand 0.105 for the reward size coefficient(note that, because the regressors werez-scored, these coefficients are directlycomparable and have no units). In otherwords, delay was 49.5% more effective indriving neural activity than was rewardsize. This difference was significant(paired sample t test on individual values,p � 0.001).
Neurons in dACC preferentially encodereward size on reject trialsIf dACC encodes foregone rewards, thenfollowing reject decisions, we should see apreferential encoding of reward size eventhough the reward is unavailable and isnot expected. We again used a runningboxcar analysis (100 ms window, 10 mssteps) including only data from reject tri-als (Fig. 4D,F). In a reversal of what wesaw in accept trials, around the time of thedecision, dACC neurons became moresensitive to reward size than to delay.
We again focused on the 500 –1000 msepoch to quantify these effects. The aver-age of the absolute values of the �-weightswas stronger for reward size than delay inreject trials (Fig. 4F). Across all neurons,the average of the �-weights in the 500 –1000 ms time window was 0.098 for thedelay coefficient and 0.129 for the rewardsize coefficient. This difference was signif-icant (p � 0.006, paired sample t test onindividual values). Thus, in contrast towhat we found on accept trials, rewardsize is more strongly encoded than delayon reject trials. We found that the coeffi-cient for reward size was significant in23.4% of neurons in our sample (n � 29/124). Encoding of reward size was morecommon than encoding of delay, whichachieved significance in 12.9% of neurons (n � 16/124; p � 0.05).This difference between the proportion of neurons encoding de-lay and reward size is significant (p � 0.032, z test for two popu-lation proportions).
Of those neurons significantly encoding reward size in the500 –1000 ms epoch on reject trials, 75.9% (n � 22/29) correlatedpositively with reward size, and the remaining 24.1% (n � 7/29)negatively correlated with reward size. This bias toward positive
50
DC
0 0.5 10
10
20
30
% o
f cel
ls e
ncod
ing
time (sec)
n=124 neurons
delayreward
accept trials reject trials
decisiontime
20
30
40
60
firin
g ra
te (
spik
es/s
ec)
time (sec)0-1 1 2 3
n=398 trials small delaylarge delay
5
10
20
15
0
small rewardlarge reward
n=460 trials
firin
g ra
te (
spik
es/s
ec)
time (sec)0-1 1 2 3
A Bcell J113cell B40
0 0.5 10
%
of c
ells
enc
odin
g
time (sec)
n=124 neurons
delayreward
decisiontime
FE
time (sec)
aver
age
abso
lute
βs
0 0.5 1
n=124 neurons
delayreward
accept trials reject trialstuning for
.10
.15
.25
.20
time (sec)
aver
age
abso
lute
βs
0 0.5 1
n=124 neurons
delayreward
tuning for
.10
.15
.25
.20
10
20
30
Figure 4. On accept trials neurons are biased toward encoding delay, on reject trials neurons are biased toward encodingreward size. A, B, Average trial onset-aligned firing rates from example neurons. Solid lines indicate accept trials, dashed indicatereject trials. Example cells show, A, sensitivity to delay size during accept trials but not reject trials, and B, sensitivity to reward sizeon reject trials but not accept trials. Vertical red line indicates option onset. C, D, The percentage of neurons encoding reward(green) and delay (red) on C, accept trials and D, reject trials. In all cases, time 0 indicates time of option onset. E, F, The averagestrength of the regression coefficients for reward and delay, separated by E, accepttrialsand F, rejecttrials. Inallcases,aplotteddashedline refers to reject trials and solid refers to accept trials. Sliding boxcar analysis: window size is 100 ms, time 0 is the time of optionappearance, and the green area indicates our best estimate of when the decision it being made. Green area indicates estimated decisiontime. Vertical black line indicates 0.5 s, the beginning of the 500 –1000 ms epoch analyzed and detailed in the text.
650 • J. Neurosci., January 8, 2014 • 34(2):646 – 655 Blanchard and Hayden • dACC Neurons Carry Postdecisional Signals

encoding is significant (p � 0.008, two-sided binomial test). Ofthose significantly encoding delay, 37.5% (n � 6/16) correlatedpositively with delay, and the remaining 62.5% (n � 10/16) cor-related negatively with delay. This bias toward positive encodingis not significant (p � 0.455, two-sided binomial test).
Foregone reward signals depend on whether monkeys chooseto accept or rejectOur results so far indicate that neurons preferentially encodedelays on accept trials and rewards on reject trials, and thus thattheir representational repertoires depend on the choice that ismade. To test this idea directly, we ran a Poisson regression on alltrials (as opposed to separating by accept and reject as doneabove). To compute regressors, we used a formal definition offoregone reward. For reject trials, this was simply defined as thereward of the rejected option; delay was irrelevant. For accepttrials, this was defined as the average reward that would be ex-pected to be gained during a time period as long as the delayperiod. Aside from its influence on the rate, any other cost of thedelay itself was ignored. This is a key variable used to make thedecision in foraging theory. To derive this measure empirically,we calculated (on a session-by-session basis) the total amount ofreward (in milliliters) the animal received during the full session,and divided this by the length of the session (in seconds), to getthe average rate of reward in milliliters per second during thissession. We then multiplied this by the delay to estimate thereward forsaken by accepting an option. (This regressor is a linearfunction of delay, and is therefore linearly related to the normal-ized delay regressor used above). We then used Poisson regres-sion to relate firing rate to these two opportunity cost measures, adecision term (coded as 1 for accept and 0 for reject), and twointeraction terms, decision � each of the two opportunity costterms. We again computed coefficients in a sliding boxcar anal-ysis (100 ms windows and 10 ms steps; Fig. 5) and on the longer500 –1000 ms epoch. To compare the strength of encoding of theopportunity cost variables, we analyzed the absolute values of theregression coefficients (adding the coefficients of the decisioninteraction terms to the opportunity cost coefficients to derivethe true coefficients for accept trials).
Consistent with our hypothesis, the foregone reward variablefor accepting is more strongly encoded on accept trials and fore-
gone reward of rejecting is more strongly encoded on reject trials.In the 500 –1000 ms epoch, we found that the regression coeffi-cient for the foregone reward of accepting was significantlyhigher for accept trials than reject trials (mean of 4.32 regressioncoefficient on accept trials versus 2.96 regression coefficient onreject trials, difference is significant, p � 0.001, paired sample ttest on individual values). By taking the exponential of thesecoefficients, we can determine that an increase in this cost by0.001 ml would modulate firing rate by 7.5% on accept trials, butonly 1.9% on reject trials. In the same epoch, the coefficient forthe foregone benefit of rejecting was significantly higher for rejecttrials than for accept trials (mean of 1.41 spikes/ml for accepttrials, 1.90 spikes/ml for reject trials, difference is significant, p �0.015, paired sample t test on individual values). An increase inthis opportunity cost by 0.001 ml would modulate firing rate by0.4% on accept trials and 0.7% on reject trials.
Note that with these non-normalized variables, it appears thatthe foregone benefit of accepting has a somewhat larger effectthan the foregone benefit of rejecting, although we would notexpect this based on our above analyses using the normalizedversions. This is likely an artifact of the conservative methods weused to calculate the foregone reward of accepting; we used theaverage reward gained through an entire session, which includesperiods where the animal is not engaged. Thus, this average re-ward gained is likely a low estimate and the regression coefficientmust be larger to compensate for this.
Firing rate does not predict behavior on following trialWe have previously shown a that there is a relationship betweenfiring rates and changes in strategy on the subsequent trial(Hayden et al., 2009, 2011a). We next examined whether theseforegone reward signals predicted future choices. Using logisticregression, we regressed choice on a trial (accept or reject) ontofiring rate during the 500 –1000 ms epoch of the previous trial.We found no evidence that firing rate on the previous trial pre-dicts choice. Specifically, only 4/124 neurons reached signifi-cance; this proportion is not significant (p � 0.504, binomialtest). This lack of correlation between firing rate and choicesmirrors the lack of an observed correlation between the foregonereward variable on this trial and choice on the next trial (logisticregression, p 0.10). Thus, it appears that choices in the dietselection task are, to the limits of our analyses’ ability to detect,independent across trials. We have previously speculated thatpostdecisional variables in dACC are encoded to the extent thatthey influence behavior (Hayden et al., 2011a). However, thepresent results suggest that, at least in this case, we find strongencoding of foregone cost in dACC even though this does notaffect trial-to-trial variations in performance. These findings sug-gest that encoding of foregone reward is so basic that it is ob-served even when it is not measurably affecting behavior, andsuggests that monitoring signals in dACC are subject to a down-stream gating process (Hayden et al., 2011b).
Encoding of profitabilityFormally speaking, decisions in this task should be based solelyon profitability, or the ratio of reward to delay (Stephens andKrebs, 1987). Because profitability is a function of both rewardand delay, it is difficult to distinguish profitability encoding fromencoding of either of these two variables. Perhaps the most con-servative test for profitability encoding is to examine the correla-tion between regression coefficients for reward and delay. Asignificant negative correlation at the population level would
1
2
3
4
0 0.5 1 time (sec)
n=124 neurons~decision
time
accept opportunity costreject opportunity cost
aver
age
abso
lute
βs
Figure 5. A plot of the regression coefficients from the boxcar analysis of reject and acceptopportunity costs. Dashed lines indicate reject trial coefficients, solid indicate accept trial coef-ficients. Sliding boxcar analysis; window size is 100 ms, time 0 is the time of option appearance,and the green area indicates our best estimate of when the decision it being made.
Blanchard and Hayden • dACC Neurons Carry Postdecisional Signals J. Neurosci., January 8, 2014 • 34(2):646 – 655 • 651

support the idea that dACC neurons, as agroup, encode profitability.
This is indeed what we find. Using thereward size and delay coefficients fromour initial 500 –1000 ms Poisson regres-sions, we see a negative correlation be-tween delay and reward size coefficientswhen looking at all trials together (r ��0.40, p � 0.0001; Fig. 6A), accept trialsalone (r � �0.29, p � 0.0001; Fig. 6B),and reject trials alone (r � �0.47, p �0.0001; Fig. 6C). This strong negative cor-relation is consistent with the idea that, inaddition to opportunity cost, dACC alsocarries a profitability signal across bothaccept and reject conditions.
To provide a more rigorous test of thisidea, we ran further Poisson regressionsusing delay, reward size, and profitability(reward size divided by delay) as regres-sors. We regressed these variables againstfiring rate on accept and reject trials sepa-rately, and compared the deviance (agoodness of fit measure) of this modelagainst a model that included delay andreward size, but did not include profit-ability (Fig. 6D). We then used a � 2 test(df � 1) on the difference in deviance todetermine whether profitability signifi-cantly improved the fit of the model forthat neuron. We found that profitabilitywas encoded in both accept and reject tri-als, though more strongly in accept trials.In the 500 –1000 ms epoch, we found thatprofitability improved the fit of the modelfor 29.0% of neurons (n � 36/124) for reject trials, and 46.0% ofneurons (n � 57/124) for accept trials. This difference is signifi-cant (p � 0.006, z test for two population proportions). Of those57 neurons that encoded profitability on accept trials, 43.9% (n �25/57) positively encoded profitability and 56.1% (32/57) nega-tively encoded profitability. This difference between positive andnegative encoding is not significant (p � 0.427, two-sided bino-mial test). Of those 36 neurons that encoded profitability onaccept trials, 36.1% (n � 13/36) positively encoded profitabilityand 63.9% (23/36) negatively encoded profitability. This differ-ence between positive and negative encoding is not significant(p � 0.133, two-sided binomial test). Our sliding boxcar analysissuggests that the time when profitability is encoded most stronglyoccurs at 420 – 450 ms.
We were curious to see whether the neurons that encodedprofitability were more or less likely to also encode the other taskvariables, reward size, and delay. Because profitability is highlycorrelated with reward size and delay, we decided to again usedeviance to see whether the same neurons that are modeled betterby including profitability are more or less likely to be better mod-eled with profitability alone, or the full model (profitability, re-ward size, and delay). First, we tested how many neurons hadtheir fits significantly improved by the addition of reward anddelay to a model initially including only profitability, using thesame procedure we used to look for improvements in model fitfor profitability (� 2 test with df � 2, on the difference in deviance,using the 500 –1000 ms epoch). We found that more neuronswere significantly improved by going from a profitability-only
model to the full model than were significantly improved by go-ing from a reward size and delay model to the full model (onreject trials, of the population of 124 neurons, 62 neurons weresignificantly improved going from profitability to the full model,compared with the 36 being significantly improved going fromreward size and delay to the full model; 85 neurons comparedwith 57 on accept trials; � 2 test on the difference in deviance,significance cutoff of p � 0.05). These differences were significant(p � 0.001 for both accept and reject, z test for two populationproportions), suggesting reward size and delay are more impor-tant for modeling the neural responses than profitability is. Next,we looked at the relationship between how much the full modelimproved the fit of neurons over a model without profitabilityversus how much the full model improved the fit of neurons overa model without reward size and delay using the difference indeviance as a measure of the improvement in fit. We found theimprovement gained by adding reward size and delay to a neu-ron’s model was positively correlated with the improvement ac-quired by adding profitability to a neuron’s model, for bothaccept and reject trials (r � 0.797, p � 0.0001 for accept trials, r �0.304, p � 0.001 for reject trials; Fig. 7A,B). As one might expectfrom this correlation, most neurons that were significantly bettermodeled by including profitability were also significantly bettermodeled by including reward size and delay (on accept trials, 50of 57 neurons that were significantly better fit with a model thatincluded profitability were also significantly better fit with amodel that included reward size and delay; 28 of 36 for rejecttrials). This pattern suggests that the population of neurons en-
Dreject trials
C
accept trials
0
0reward: 23delay: 10both: 6neither: 85
n=124 neurons0.5
-0.5-0.5 0.5
0
0
0.5
-0.5-0.5 0.5
r = -.47
r = -.29
all trials
0
0
delay coefficient (β)
rew
ard
coef
ficie
nt (
β)
reward: 17delay: 23both: 30neither: 54
n=124 neurons0.5
-0.5-0.5 0.5
r = -.40
5
10
15
20
25
30
% o
f cel
ls e
ncod
ing
p
0 0.5 1time (sec)
n=124 neuronsdecision
time
A B
delay coefficient (β)
rew
ard
coef
ficie
nt (
β)
rew
ard
coef
ficie
nt (
β)
delay coefficient (β)
reward: 11
both: 19neither: 67
delay: 27
n=124 neurons
Figure 6. Neurons encode profitability. A–C, Delay regression coefficients for each neuron plotted against that neuron’sreward-size regression coefficient. The encoding of reward and delay are negatively correlated. Each point indicates an individualneuron’s response to delay and reward; a negative coefficient means lower firing rate for higher values of the given variable. Pointsare color coded to indicate whether they reach significance ( p � 0.05) for encoding of reward (green), delay (red), both (yellow),or neither (blue). Gray line indicates best-fit line. Showing data for A, all trials, B, accept trials, and C, reject trials. D, Percentage ofneurons that have a significantly better fit with profitability added to the regression model than without.
652 • J. Neurosci., January 8, 2014 • 34(2):646 – 655 Blanchard and Hayden • dACC Neurons Carry Postdecisional Signals

coding profitability largely overlap with the population encodingother task variables.
We next investigated whether encoding of profitability wasthe same on accept and reject trials. If a neuron’s firing rate waspositively correlated with profitability on accept trials, it shouldalso be positively correlated on reject trials. Surprisingly, this wasnot the case. Using the coefficients obtained with a Poisson re-gression (regressing spike count against reward size, delay, and
profitability), we initially looked at the first 400 ms of the trials, asthis captured the entirety of the estimated decision time. Wefound no correlation between the profitability regression coeffi-cients (r � 0.030, p � 0.740; Fig. 7C). To ensure this negativeresult was not caused by a poor choice of time-window or model,we repeated this test on the first 250 ms, the first 500 ms, 250 –500ms, and 500 –1000 ms, with and without reward size and delayincluded in the regression, and found no significant correlationsor general trends (p 0.35 in all cases).
Reward anticipationWe noticed that activity of many cells ramped up in anticipationof reward (Fig. 3A). This ramping up occurred 1–2 s before re-ward time (a later epoch than we have examined so far). Tocharacterize this activity, we computed the firing rates of neuronsin the 1000 ms window preceding reward delivery in accept trials.We excluded 2 s trials from this analysis to ensure that our antic-ipation time window was separated from the time of the initialdecision. Thus, this prereward epoch begins 2– 8 s after the end-ing of the epochs analyzed above.
We found that the firing rate significantly correlated with re-ward size in 24.2% of our neurons (n � 30/124, Poisson regres-sion). Of those reaching significance, 63.3% (n � 19/30)correlated positively with reward, the remaining 36.7% (n � 11/30) correlated negatively with reward. This bias toward positiveencoding is not significant (p � 0.200, two-sided binomial test).
We next considered the effect of delay on firing rate in thesame regression analysis. We found that responses of few neuronsencoded delay (16.9%, 21/124). Of the 21 neurons reaching sig-nificance, nine correlated positively with delay and 12 negatively.
Postreward responseWhereas most studies of dACC neuronal responses have focusedon postreward responses, the present study has focused on pre-reward responses. We next characterized the postreward re-sponses in this task using a procedure similar to our analysis ofreward anticipation above. We computed the spike counts ofneurons in the 500 ms window following reward delivery in ac-cept trials. This postreward epoch occurs 1–9 s after the peride-cisional epochs analyzed above.
We found that the firing rate significantly correlated with re-ward size in 28.2% of our neurons (n � 35/124, Poisson regres-sion). Of those reaching significance, 57.1% (n � 20/35)correlated positively with reward, the remaining 42.9% (n � 15/35) correlated negatively with reward. This bias toward positiveencoding is not significant, p � 0.500, two-sided binomial test.
We next considered the effect of delay on firing rate in thesame regression analysis. We found that responses of few neuronsencoded delay (11.3%, 14/124). Of the 14 neurons reaching sig-nificance, six correlated positively with delay, and 8 negatively.
Finally, we examined reward responses on the 20% of trialsthat offered a gamble. These trials uniquely provide a test ofneural responses under uncertainty in our task. Twenty-two per-cent of neurons (27 of 121 neurons that had gamble trials) differ-entiated between receiving a reward and not receiving a reward(two-sample t test on neural activity 500 ms following rewarddelivery, or absence of reward delivery). Of these, 55.6% (15/27)showed increased firing rate for a gamble win, the remaining44.4% (12/27) showed decreased firing rate. This bias was notsignificant (p � 0.414).
DiscussionHere we report the response properties of dACC neurons in anaccept–reject foraging task whose structure is modeled on a clas-
A
0
1
profitability coefficient (β) on accept
prof
itabi
lity
coef
ficie
nt (
β) o
n re
ject
-1-1 0 1
r=.030n=124 neurons
10−4
10−3
10−2
10−1
100
101
102
103
10410−2
10−1
100
101
102
103
impr
ovem
ent i
n fit
from
rew
+ d
elay
improvement in fit from profitability
rew+delay: 35profitability: 7both: 50neither: 32
n=124 neurons
10
10
10
−1
0
1
210
10−4 10−3 10−2 10−1 100 101 102
impr
ovem
ent i
n fit
from
rew
+ d
elay
improvement in fit from profitability
n=124 neurons
rew+delay: 34profitability: 8both: 28neither: 54
B
C
reject trials
accept trials
Figure 7. Profitability overlaps with reward size and delay encoding, and encoding is differ-ent on accept versus reject trials. A, B, The improvement in fit (as measured by difference indeviance) from adding profitability to a model including reward size and delay, plotted againstthe improvement of fit in adding reward size and delay to a model including only profitability,for A, accept trials, and B, reject trials. Lines indicate value required to reach significance. Pointsare color coded to indicate whether they reach significance ( p � 0.05) for significant improve-ment in fit from adding reward size and delay (green), profitability (red), both (yellow), orneither (blue). C, The regression coefficient for each neuron on accept trials plotted against itsregression coefficient on reject trials. There is no significant correlation.
Blanchard and Hayden • dACC Neurons Carry Postdecisional Signals J. Neurosci., January 8, 2014 • 34(2):646 – 655 • 653

sic foraging problem (Stephens and Krebs, 1987). On each trial,monkeys made an accept–reject decision and then waited severalseconds for it to be resolved. Our goal was to understand thecontributions of dACC to choice processes. We find that firingrates around the time of choice encode two distinct variables,option profitability, and foregone reward. Foregone reward, theinevitable reward missed by forsaking the unchosen option, is apostdecisional variable. That means it depends on the choice theanimal makes, and cannot exist until the decision is made. Prof-itability encoding in this task is also postdecisional because itsformat (how neurons signal it and how strong the signal is) differson accept and reject trials. Thus, although it can be computed, itsformat cannot be computed until the decision is made. Together,these results place dACC downstream of choice processes thatevaluate options and compare them to make a decision. Based onits anatomical connections, we propose that profitability signalsare generated in a ventral prefrontal area upstream of dACC thatimplements the decision process (Paus, 2001). Potential loci forthis process include orbitofrontal cortex, ventromedial prefron-tal cortex (vmPFC), and/or ventral striatum (Padoa-Schioppaand Assad, 2006; Rushworth et al., 2011).
If the dACC does not play a role in the current decision, thenwhat does it do? Our results are consistent with the idea thatdACC does much the same thing around the time of the decisionthat it does after the decision: it tracks variables related to out-comes of decisions that may have some influence on the need toadjust or alter behavioral strategies, or to bring greater cognitivecontrol to bear (Botvinick et al., 2001; Kerns et al., 2004; Haydenet al., 2011a,b; Shenhav et al., 2013). Tracking foregone rewardand profitability are valuable because, in a dynamic environment,switching is favored when foregone reward rises above the benefitof the chosen option (Boorman et al., 2011).
In a previous study, we showed that dACC computes thesecontrol variables even if the actual switching is weak and incon-sistent (Hayden et al., 2011a). Others have also shown ACC ac-tivity is sensitive to task variables even when no choice is required(Sallet et al., 2007). Here, we extend these findings by showingthat dACC computes these parameters in a task where they haveno measurable effect on subsequent behavior. This finding sug-gests that, contrary to our earlier predictions, coding of putativecontrol variables in dACC is not conditional on them being usedto drive behavior (Hayden et al., 2011a). Instead, it suggests thatthey are subject to downstream gating processes that determinewhether they are implemented. Thus, these results suggest thatdACC is similar to the caudate nucleus, which can also computecontrol signals that are not used to guide behavior (Chiu et al.,2008). If the dACC control signals can, in the context of this task,have little to no effect on behavior they suggest that, althoughdACC is part of the control system, it plays a relatively early role(cf. Schall et al., 2002).
The broader idea that dACC plays a regulatory role, ratherthan serving as a comparator, is neither original nor new to us.Several other groups have previously argued that the essentialrole of dACC in cognition is to compute the need to adjust or alterstrategy; in summary, it serves as a controller over choice strategy(Procyk et al., 2000; Botvinick et al., 2001; Holroyd and Coles,2002; Kerns et al., 2004; Posner et al., 2007; Seo et al., 2007;Quilodran et al., 2008). This interpretation unites diverse find-ings linking dACC to the detection of errors, conflict, negativeoutcomes (in some tasks), and positive outcomes (in other tasks)by positing that dACC does not uniquely track any of these vari-ables, but that its activity correlates with them incidentally, be-
cause they provide evidence in favor of switching (Hayden et al.,2011a).
These results are consistent with the conclusions, but not thespecific results, of a recent important study on the role of dACCin choice (Cai and Padoa-Schioppa, 2012). Using a different task,the authors of that study found strong encoding of the chosenvalue, another postdecisional variable. Like us, they came to theconclusion that dACC does not play a direct role in choice. How-ever, whereas we found that foregone reward was strongly en-coded in our task, the most analogous variable in their task(“other value,” the value of the option not chosen) was notstrongly represented. There are several possible explanations forthe discrepancy between our study and theirs. One possibility isthat, because the temporal structure of their task includes rewarddelivery shortly after choice (750 ms), reward expectancy signalsmay overlap with and hide any foregone value signals. Indeed, wereport here that reward expectancy signals are present at least onesecond before reward delivery in our task. Another possibility isthat the monkeys in that study followed a choice strategy that ledto ignoring the unchosen option (or considering it very briefly),and so these signals do not have a chance to make their way fromupstream areas to dACC. A third possibility is that accept–rejectchoices are framed differently from two-option choices, a possi-bility supported by recent fMRI work showing different func-tions of ACC and vmPFC in binary choices versus accept–rejectforaging choices (Kolling et al., 2012) and in two seemingly sim-ilar gambling tasks (Hunt et al., 2013).
In an earlier study, we found that dACC neurons track fictiveoutcomes of decisions (Hayden et al., 2009). These fictive out-come findings are consistent with other results demonstratingcoding of hypothetical outcomes in ACC (Boorman et al., 2011),and more broadly with the idea that dACC tracks decisional re-gret (Coricelli et al., 2005). Collectively, these results indicate thatdACC does not simply carry a labeled line representation of ac-tual reward size, but that it strongly represents rewards not re-ceived or not chosen. The present results suggest a different, andmore general, interpretation of these earlier results: dACC doesnot track fictive outcomes (or any outcomes) per se, but signalsthe need to adjust strategies that comes from fictive outcomes.Fictive and hypothetical outcomes are often closely associatedwith switching or adjusting behavior (Hayden et al., 2009). Wesuspect that it is these signals originating within dACC that areresponsible for the effects of hypothetical outcomes on behav-ioral changes and adjustments.
ReferencesAlexander WH, Brown JW (2011) Medial prefrontal cortex as an action-
outcome predictor. Nat Neurosci 14:1338 –1344. CrossRef MedlineAmiez C, Joseph JP, Procyk E (2005) Anterior cingulate error-related activ-
ity is modulated by predicted reward. Eur J Neurosci 21:3447–3452.CrossRef Medline
Amiez C, Joseph JP, Procyk E (2006) Reward encoding in the monkey ante-rior cingulate cortex. Cereb Cortex 16:1040 –1055. CrossRef Medline
Bernacchia A, Seo H, Lee D, Wang XJ (2011) A reservoir of time constantsfor memory traces in cortical neurons. Nat Neurosci 14:366 –372.CrossRef Medline
Boorman ED, Behrens TE, Rushworth MF (2011) Counterfactual choiceand learning in a neural network centered on human lateral frontopolarcortex. PLoS Biol 9:e1001093. CrossRef Medline
Botvinick MM, Braver TS, Barch DM, Carter CS, Cohen JD (2001) Conflictmonitoring and cognitive control. Psychol Rev 108:624 – 652. CrossRefMedline
Busemeyer JR, Townsend JT (1993) Decision field theory: a dynamic-cognitive approach to decision making in an uncertain environment.Psychol Rev 100:432– 459. CrossRef Medline
Cai X, Padoa-Schioppa C (2012) Neuronal encoding of subjective value in
654 • J. Neurosci., January 8, 2014 • 34(2):646 – 655 Blanchard and Hayden • dACC Neurons Carry Postdecisional Signals

dorsal and ventral anterior cingulate cortex. J Neurosci 32:3791–3808.CrossRef Medline
Charnov EL (1976) Optimal foraging, the marginal value theorem. TheorPopul Biol 9:129 –136. CrossRef Medline
Chiu PH, Lohrenz TM, Montague PR (2008) Smokers’ brains compute, butignore, a fictive error signal in a sequential investment task. Nat Neurosci11:514 –520. CrossRef Medline
Coricelli G, Critchley HD, Joffily M, O’Doherty JP, Sirigu A, Dolan RJ (2005)Regret and its avoidance: a neuroimaging study of choice behavior. NatNeurosci 8:1255–1262. CrossRef Medline
Dayan P, Abbott LE (2005) Theoretical neuroscience: computational andmathematical modeling of neural systems. Cambridge, MA: MIT.
Hayden BY, Platt ML (2009) The mean, the median, and the St. Petersburgparadox. Judgm Decis Mak 4:256 –272. Medline
Hayden BY, Heilbronner SR, Nair AC, Platt ML (2008) Cognitive influenceson risk-seeking by rhesus macaques. Judgm Decis Mak 3:389 –395.Medline
Hayden BY, Pearson JM, Platt ML (2009) Fictive reward signals in the ante-rior cingulate cortex. Science 324:948 –950. CrossRef Medline
Hayden BY, Heilbronner SR, Platt ML (2010) Ambiguity aversion in rhesusmacaques. Front Neurosci 4:166. CrossRef Medline
Hayden BY, Heilbronner SR, Pearson JM, Platt ML (2011a) Surprise signalsin anterior cingulate cortex: neuronal encoding of unsigned reward pre-diction errors driving adjustment in behavior. J Neurosci 31:4178 – 4187.CrossRef Medline
Hayden BY, Pearson JM, Platt ML (2011b) Neuronal basis of sequentialforaging decisions in a patchy environment. Nat Neurosci 14:933–939.CrossRef Medline
Heilbronner SR, Hayden BY (2013) Contextual factors explain risk-seekingpreferences in rhesus monkeys. Front Neurosci 7:7. CrossRef Medline
Holroyd CB, Coles MG (2002) The neural basis of human error processing:reinforcement learning, dopamine, and the error-related negativity. Psy-chol Rev 109:679 –709. CrossRef Medline
Hunt LT, Woolrich MW, Rushworth MF, Behrens TE (2013) Trial-typedependent frames of reference for value comparison. PLoS Comput Biol9:e1003225. CrossRef Medline
Ito S, Stuphorn V, Brown JW, Schall JD (2003) Performance monitoring bythe anterior cingulate cortex during saccade countermanding. Science302:120 –122. CrossRef Medline
Kerns JG, Cohen JD, MacDonald AW 3rd, Cho RY, Stenger VA, Carter CS(2004) Anterior cingulate conflict monitoring and adjustments in con-trol. Science 303:1023–1026. CrossRef Medline
Kolling N, Behrens TE, Mars RB, Rushworth MF (2012) Neural mecha-nisms of foraging. Science 336:95–98. CrossRef Medline
Krebs JR, Erichsen JT, Webber MI, Charnov EL (1977) Optimal prey selec-tion in the great tit (Parus major). Anim Behav 25:30 –38. CrossRef
Krugman PR, Wells R, Graddy KJ (2011) Essentials of economics. NewYork: Worth.
Matsumoto M, Matsumoto K, Abe H, Tanaka K (2007) Medial prefrontal
cell activity signaling prediction errors of action values. Nat Neurosci10:647– 656. CrossRef Medline
O’Neill M, Schultz W (2010) Coding of reward risk by orbitofrontal neu-rons is mostly distinct from coding of reward value. Neuron 68:789 – 800.CrossRef Medline
Padoa-Schioppa C, Assad JA (2006) Neurons in the orbitofrontal cortexencode economic value. Nature 441:223–226. CrossRef Medline
Paus T (2001) Primate anterior cingulate cortex: where motor control, driveand cognition interface. Nat Rev Neurosci 2:417– 424. CrossRef Medline
Posner MI, Rothbart MK, Sheese BE, Tang Y (2007) The anterior cingulategyrus and the mechanism of self-regulation. Cogn Affect Behav Neurosci7:391–395. CrossRef Medline
Procyk E, Tanaka YL, Joseph JP (2000) Anterior cingulate activity duringroutine and non-routine sequential behaviors in macaques. Nat Neurosci3:502–508. CrossRef Medline
Quilodran R, Rothe M, Procyk E (2008) Behavioral shifts and action valua-tion in the anterior cingulate cortex. Neuron 57:314 –325. CrossRefMedline
Rushworth MF, Noonan MP, Boorman ED, Walton ME, Behrens TE (2011)Frontal cortex and reward-guided learning and decision-making. Neuron70:1054 –1069. CrossRef Medline
Rushworth MF, Walton ME, Kennerley SW, Bannerman DM (2004) Actionsets and decisions in the medial frontal cortex. Trends Cogn Sci 8:410 –417. CrossRef Medline
Sallet J, Quilodran R, Rothe M, Vezoli J, Joseph JP, Procyk E (2007) Expec-tations, gains, and losses in the anterior cingulate cortex. Cogn AffectBehav Neurosci 7:327–336. CrossRef Medline
Schall JD, Stuphorn V, Brown JW (2002) Monitoring and control of actionby the frontal lobes. Neuron 36:309 –322. CrossRef Medline
Seo H, Barraclough DJ, Lee D (2007) Dynamic signals related to choices andoutcomes in the dorsolateral prefrontal cortex. Cereb Cortex 17:i110 –i117. CrossRef Medline
Shenhav A, Botvinick MM, Cohen JD (2013) The expected value of control:an integrative theory of anterior cingulate cortex function. Neuron 79:217–240. CrossRef Medline
Shima K, Tanji J (1998) Role for cingulate motor area cells in voluntarymovement selection based on reward. Science 282:1335–1338. CrossRefMedline
So NY, Stuphorn V (2010) Supplementary eye field encodes option andaction value for saccades with variable reward. J Neurophysiol 104:2634 –2653. CrossRef Medline
Stanford TR, Shankar S, Massoglia DP, Costello MG, Salinas E (2010) Per-ceptual decision making in less than 30 milliseconds. Nat Neurosci 13:379 –385. CrossRef Medline
Stephens DW, Krebs JR (1987) Foraging theory, Ed 1. Princeton, NJ:Princeton UP.
Wunderlich K, Rangel A, O’Doherty JP (2009) Neural computations under-lying action-based decision making in the human brain. Proc Natl AcadSci U S A 106:17199 –17204. CrossRef Medline
Blanchard and Hayden • dACC Neurons Carry Postdecisional Signals J. Neurosci., January 8, 2014 • 34(2):646 – 655 • 655
Copyright © 2022 FDOKUMEN