Modelling Treated Laundry Greywater Reuse for Irrigation ...
Upload
westernsydneyCategory
view
0download
0
E
US
a
ARR1A
KSGISPWV
1
ps2taArpaySa
wTiwrb
b
0d
Resources, Conservation and Recycling 54 (2010) 429–435
Contents lists available at ScienceDirect
Resources, Conservation and Recycling
journa l homepage: www.e lsev ier .com/ locate / resconrec
ffects of greywater irrigation on plant growth, water use and soil properties
. Pinto, B.L. Maheshwari ∗, H.S. Grewalchool of Natural Sciences, Hawkesbury Campus, Building H3, University of Western Sydney, Locked Bag 1797, Penrith South DC NSW 1797, Australia
r t i c l e i n f o
rticle history:eceived 22 September 2008eceived in revised form3 September 2009ccepted 15 September 2009
eywords:ilverbeetreywater
a b s t r a c t
Glasshouse experiments were conducted to examine the effects of greywater irrigation on the growth ofsilverbeet plants, their water use and changes in soil properties. The experimental treatments included inthe study were: irrigating with 100% potable water (control, treatment T0), irrigating with 100% greywater(treatment T1), irrigating with a mixture of greywater and potable water in 1:1 ratio (treatment T2) andirrigating alternate with potable water for one irrigation and greywater for the next (treatment T3). ThepH and EC values of the greywater used in the study were 10.5 and 1358 �S/cm respectively. Resultsshowed that greywater irrigation had no significant effect on soil total N and total P after plant harvest,but there were significant effects on the values of soil pH and EC. Furthermore, there were no significant
rrigationoil propertieslant biomassater uptake
egetable crops
effects of greywater irrigation on plant dry biomass, water use and number of leaves. For the treatmentthat involved irrigating with 100% greywater (treatment T1), there was a significant increase in soil pHand EC when compared with the control and the other two irrigation treatments. The study indicated thatirrigating silverbeet plants with potable water and greywater in an alternate pattern (treatment T3) hadsoil pH and EC levels similar to that of irrigation with 100% potable water. This also meant that irrigating
ater a
alternate with potable wthe reuse of greywater.. Introduction
Water is a scarce resource and ensuring sustainable water sup-ly, especially in view of climate change scenarios, has become aignificant challenge globally (Abusam, 2008; Jenerette and Larsen,006; Lundqvist et al., 2005). The water is also imposing threats tohe socio-economic development and maintenance of eco-systemsround our cities and towns (Lake and Bond, 2007). All the majorustralian cities and most towns are currently under severe waterestrictions, and as a result the availability of water for urban anderi-urban irrigation has been significantly impacted (Yiasoumi etl., 2008). The extended drought in Australia during the last fewears has lead to a greater emphasis being placed by the Local,tate and Federal Governments to develop policies and on-groundctions for conserving and recycling water.
One of the ways by which we can reduce the pressure on townater supplies is to reuse greywater for irrigation around home.
he use of domestic greywater for irrigation is becoming increas-
ngly common in both developed and developing countries to copeith the water scarcity. While published practical guidelines for theeuse of domestic greywater for irrigation are being made availabley government agencies involved in water management and regu-
∗ Corresponding author. Tel.: +61 2 4570 1235; fax: +61 2 4570 1787.E-mail addresses: [email protected] (U. Pinto),
[email protected] (B.L. Maheshwari), [email protected] (H.S. Grewal).
921-3449/$ – see front matter © 2009 Elsevier B.V. All rights reserved.oi:10.1016/j.resconrec.2009.09.007
nd greywater could reduce some of the soil health risks associated with
© 2009 Elsevier B.V. All rights reserved.
lation, there are still a number of issues related to human, soil andplant health risks and environmental pollution due to the reuse. Asa result, there are often community concerns towards the reuse ofgreywater for irrigation around homes. For the greywater reuse tobecome a mainstream water recycling practice, we need to examinethese issues and concerns and seek answers to specific questionsand develop guidelines with local data to ensure the sustainabilityof greywater reuse. The main aim of this study was to (i) under-stand the effects of greywater reuse for irrigation on plant growthand water use, and (ii) examine changes in soil pH, EC and nutrientcontents (total N and total P) due to greywater irrigation.
2. Greywater reuse
Greywater is the wastewater from bath tub, shower area,hand wash basin, laundry and kitchen sink, and this water is oflower quality than drinking water (Erikkson et al., 2002; Ottosonand Stenstrom, 2003; Palmquist and Hanaeus, 2005). Greywaterexcludes foul or blackwater from toilets and urinals. Soaps anddetergents are the major component of greywater (Jefferson et al.,1999). Greywater is usually less polluted than municipal wastew-
ater due to the absence of human excretions (urine and faecalmatter) and toilet paper. From the point of view of wastewaterproduction in urban landscapes, greywater is usually considered tobe high volume with a lower level of pollution while blackwater islow volume with a higher level of pollution (Neal, 1996).
430 U. Pinto et al. / Resources, Conservation and Recycling 54 (2010) 429–435
ps fol
gwOomerotgb
whbpaaup(bg
Fig. 1. Flow chart describing key ste
The reuses of greywater may include irrigation around homes,olf courses, parks and other open spaces, toilet flushing, ground-ater recharge and industrial evaporative cooling (Okun, 1997;ttoson and Stenstrom, 2003). In arid regions, a significant partf the water requirement for the landscape around homes can beet with the greywater generated within the household (Rose
t al., 1991). Studies that examined the potential of greywatereuse to save fresh water supplies reported savings in the rangef 30–50% when greywater is reused for toilet flushing and irriga-ion (Jeppesen, 1996). When greywater is reused, particularly forarden irrigation, considerable volumes of high quality water cane saved.
Important parameters to consider for the sustainability of grey-ater reuse are its pH, electrical conductivity, suspended solids,eavy metals, faecal coliform, Escherichia coli, dissolved oxygen,iological and chemical oxygen demands, total nitrogen and totalhosphorus (Dixon et al., 1999a; Birks and Hills, 2007; Erikkson etl., 2002). The chemical and physical characteristics of greywaterre quite variable among households due to the type of detergents
sed, type of goods being washed, life style of occupants and otherractices followed at household levels. In one study, Erikkson et al.2002) found kitchen wastewater had the highest EC while handasin and shower had the lowest. They also observed that if thereywater has originated from laundry, the pH range tends to belowed during the glasshouse study.
between 8.0 and 10.0, while that originated from other domes-tic sources it ranged between 5.0 and 8.7. Highly alkaline pH inthe range of 9.3–9.5 was reported by Dixon et al. (1999b) for thegreywater from washing machines.
Reuse of greywater for growing plants may affect the microbialactivity in the rhizosphere that degrades the surfactants and the useby plant for transpiration (Garland et al., 2000). The effectivenessof microbial communities associated with the rhizosphere and thephysiology and internal dynamics of plants play an important rolein greywater reuse. Thus, the rate of surfactant degradation and theextent of microbial persistence in the soil and plants are importantconsiderations for the reuse of greywater for irrigation. Also, grey-water has the potential to increase the soil alkalinity if applied ongarden beds over a long-time. Christova-Boal et al. (1996) observedthat the reuse of greywater with pH in excess of 8 can lead toincreased soil pH and reduced availability of some micro-nutrientsfor plants, and thus affecting the growth of plants.
Phytotoxicity of greywater reuse is another issue that impactson the widespread recycling of greywater. The phytotoxicity of the
reuse is mainly due to the anionic surfactant content that altersthe microbial communities associated with rhizosphere. The phy-totoxicity effects of greywater reuse on different plants are highlyvariable. For example, Erikkson et al. (2006) performed a growthinhibition test for algae and a short-term acute assay for willow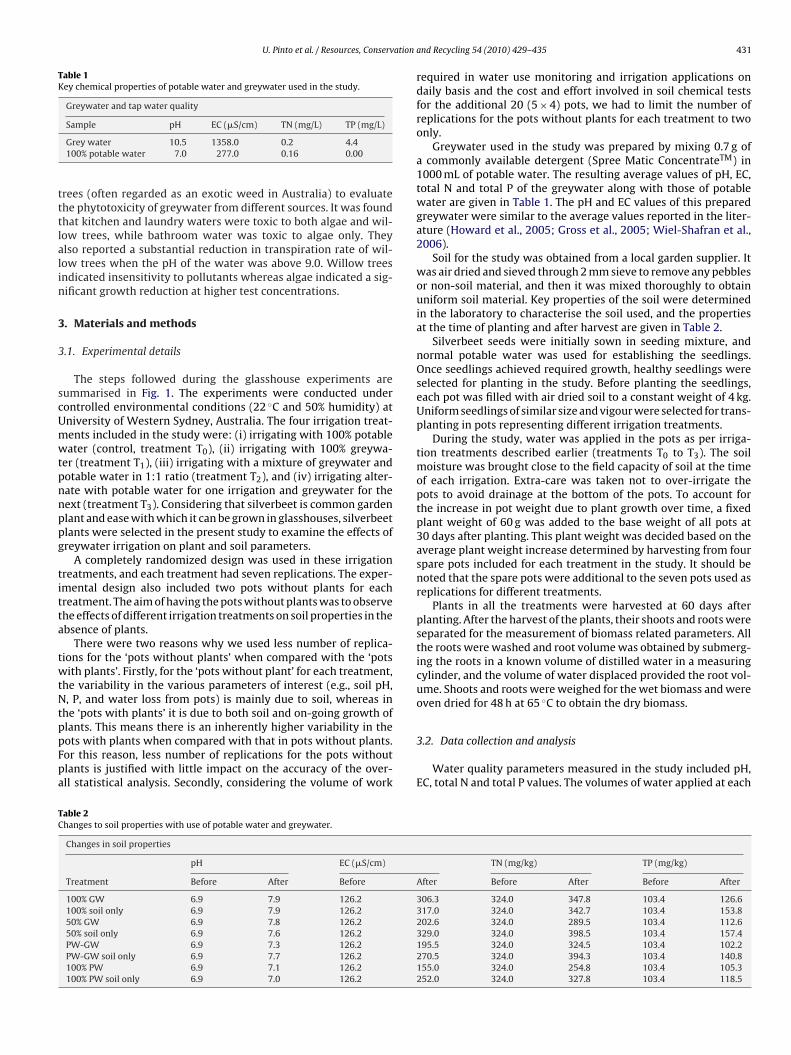
U. Pinto et al. / Resources, Conservation
Table 1Key chemical properties of potable water and greywater used in the study.
Greywater and tap water quality
tttlalin
3
3
scUmwtpnnppg
titta
twtNtppFpa
TC
Sample pH EC (�S/cm) TN (mg/L) TP (mg/L)
Grey water 10.5 1358.0 0.2 4.4100% potable water 7.0 277.0 0.16 0.00
rees (often regarded as an exotic weed in Australia) to evaluatehe phytotoxicity of greywater from different sources. It was foundhat kitchen and laundry waters were toxic to both algae and wil-ow trees, while bathroom water was toxic to algae only. Theylso reported a substantial reduction in transpiration rate of wil-ow trees when the pH of the water was above 9.0. Willow treesndicated insensitivity to pollutants whereas algae indicated a sig-ificant growth reduction at higher test concentrations.
. Materials and methods
.1. Experimental details
The steps followed during the glasshouse experiments areummarised in Fig. 1. The experiments were conducted underontrolled environmental conditions (22 ◦C and 50% humidity) atniversity of Western Sydney, Australia. The four irrigation treat-ents included in the study were: (i) irrigating with 100% potableater (control, treatment T0), (ii) irrigating with 100% greywa-
er (treatment T1), (iii) irrigating with a mixture of greywater andotable water in 1:1 ratio (treatment T2), and (iv) irrigating alter-ate with potable water for one irrigation and greywater for theext (treatment T3). Considering that silverbeet is common gardenlant and ease with which it can be grown in glasshouses, silverbeetlants were selected in the present study to examine the effects ofreywater irrigation on plant and soil parameters.
A completely randomized design was used in these irrigationreatments, and each treatment had seven replications. The exper-mental design also included two pots without plants for eachreatment. The aim of having the pots without plants was to observehe effects of different irrigation treatments on soil properties in thebsence of plants.
There were two reasons why we used less number of replica-ions for the ‘pots without plants’ when compared with the ‘potsith plants’. Firstly, for the ‘pots without plant’ for each treatment,
he variability in the various parameters of interest (e.g., soil pH,, P, and water loss from pots) is mainly due to soil, whereas in
he ‘pots with plants’ it is due to both soil and on-going growth of
lants. This means there is an inherently higher variability in theots with plants when compared with that in pots without plants.or this reason, less number of replications for the pots withoutlants is justified with little impact on the accuracy of the over-ll statistical analysis. Secondly, considering the volume of workable 2hanges to soil properties with use of potable water and greywater.
Changes in soil properties
pH EC (�S/cm)
Treatment Before After Before
100% GW 6.9 7.9 126.2100% soil only 6.9 7.9 126.250% GW 6.9 7.8 126.250% soil only 6.9 7.6 126.2PW-GW 6.9 7.3 126.2PW-GW soil only 6.9 7.7 126.2100% PW 6.9 7.1 126.2100% PW soil only 6.9 7.0 126.2
and Recycling 54 (2010) 429–435 431
required in water use monitoring and irrigation applications ondaily basis and the cost and effort involved in soil chemical testsfor the additional 20 (5 × 4) pots, we had to limit the number ofreplications for the pots without plants for each treatment to twoonly.
Greywater used in the study was prepared by mixing 0.7 g ofa commonly available detergent (Spree Matic ConcentrateTM) in1000 mL of potable water. The resulting average values of pH, EC,total N and total P of the greywater along with those of potablewater are given in Table 1. The pH and EC values of this preparedgreywater were similar to the average values reported in the liter-ature (Howard et al., 2005; Gross et al., 2005; Wiel-Shafran et al.,2006).
Soil for the study was obtained from a local garden supplier. Itwas air dried and sieved through 2 mm sieve to remove any pebblesor non-soil material, and then it was mixed thoroughly to obtainuniform soil material. Key properties of the soil were determinedin the laboratory to characterise the soil used, and the propertiesat the time of planting and after harvest are given in Table 2.
Silverbeet seeds were initially sown in seeding mixture, andnormal potable water was used for establishing the seedlings.Once seedlings achieved required growth, healthy seedlings wereselected for planting in the study. Before planting the seedlings,each pot was filled with air dried soil to a constant weight of 4 kg.Uniform seedlings of similar size and vigour were selected for trans-planting in pots representing different irrigation treatments.
During the study, water was applied in the pots as per irriga-tion treatments described earlier (treatments T0 to T3). The soilmoisture was brought close to the field capacity of soil at the timeof each irrigation. Extra-care was taken not to over-irrigate thepots to avoid drainage at the bottom of the pots. To account forthe increase in pot weight due to plant growth over time, a fixedplant weight of 60 g was added to the base weight of all pots at30 days after planting. This plant weight was decided based on theaverage plant weight increase determined by harvesting from fourspare pots included for each treatment in the study. It should benoted that the spare pots were additional to the seven pots used asreplications for different treatments.
Plants in all the treatments were harvested at 60 days afterplanting. After the harvest of the plants, their shoots and roots wereseparated for the measurement of biomass related parameters. Allthe roots were washed and root volume was obtained by submerg-ing the roots in a known volume of distilled water in a measuringcylinder, and the volume of water displaced provided the root vol-ume. Shoots and roots were weighed for the wet biomass and wereoven dried for 48 h at 65 ◦C to obtain the dry biomass.
3.2. Data collection and analysis
Water quality parameters measured in the study included pH,EC, total N and total P values. The volumes of water applied at each
TN (mg/kg) TP (mg/kg)
After Before After Before After
306.3 324.0 347.8 103.4 126.6317.0 324.0 342.7 103.4 153.8202.6 324.0 289.5 103.4 112.6329.0 324.0 398.5 103.4 157.4195.5 324.0 324.5 103.4 102.2270.5 324.0 394.3 103.4 140.8155.0 324.0 254.8 103.4 105.3252.0 324.0 327.8 103.4 118.5

432 U. Pinto et al. / Resources, Conservation and Recycling 54 (2010) 429–435
Fs
itaiswrt
atDshswa
4
4
tswHbTsewcTat
Fs
water we applied over 60 days, thus not affecting the growth of
ig. 2. Effects of different irrigation treatments (T0 to T3) on shoot dry weight ofilverbeet (N.B., the effects were statistically non-significant).
rrigation were recorded to determine the total water used in eachreatment. Soil samples from each pot were taken before plantingnd after the harvest of silverbeet plants to determine the changesn soil properties due to greywater irrigation. The properties mea-ured included pH1:5, EC1:5, total soil organic N and total P. Thehole biomass of silverbeet plants was considered as yield. The
oots and shoots of the plants were oven dried at 65 ◦C to determineheir dry weights.
The data relating to plant yield, dry matter weight, water usend soil properties were statistically analysed to understand thereatment effects on plant growth, water use and soil properties.ifferences between the means of root and shoot dry biomass, and
oil properties (pH, EC, total N and total P) before planting and afterarvest were subjected to the analysis of variance (ANOVA at 0.05ignificance level). The least significant difference (LSD at p = 0.05)as used to assess the differences among pairs of treatment means
nd the F values of the ANOVA indicated the significance.
. Results and discussion
.1. Plant growth
Figs. 2–4 show the effects of the various irrigation treatments onhe values of shoot and root dry biomasses and root volume. Thetatistical analysis of data indicate that shoot and root dry biomassere not significantly affected by any of the irrigation treatments.owever, there was a trend of slight reduction in shoot and rootiomass by irrigating silverbeet with 100% greywater (treatment1) when compared with other treatments. Similar to root andhoot dry weights, the root volumes were not significantly influ-nced by different irrigation treatments (Fig. 4). The root volume
as the highest the treatment that involved irrigating with waterontaining a mixture of greywater and potable water (treatment2) and the lowest under the treatment that involved irrigatinglternate with potable water for one irrigation and greywater forhe next (treatment T3).
ig. 3. Effects of different irrigation treatments (T0 to T3) on root dry weight ofilverbeet (N.B., the effects were statistically non-significant).
Fig. 4. Effects of different irrigation treatments (T0 to T3) on root volume of silver-beet (N.B., the effects were statistically non-significant).
The results of the present study suggest that there are no appar-ent detrimental effects of greywater irrigation on plant growthfor any of the treatments considered in the study. However, theseresults are in sharp contrast with the findings of the past stud-ies that suggested some detrimental effects of greywater on plantgrowth (Bubenheim et al., 1997; Wiel-Shafran et al., 2006). Forexample, one previous study relating to lettuce plants grown usingsoil medium indicated ‘chlorosis’ within 30-day period (Wiel-Shafran et al., 2006). In another study, which used liquid mediumand Igepon-42, showed toxicity symptoms after 4–6 h by ‘brown-ing’ of lettuce roots and suppression of root dry mass within 24 h(Bubenheim et al., 1997).
Rhizosphere is the immediate narrow region around rootswhich is usually covered with a thin layer of soil. Rhizosphere pro-vides a suitable interface for both microbes and plants roots toform an ‘association’ which is beneficial for either party in termsof fulfilling their nutrient requirement (Atlas and Bartha, 1998).Such microbial communities associated with the plant roots arecapable of biodegrading surfactants and other organic componentsin greywater (Federle and Schwab, 1989). This means, the extentof toxicity effects of greywater irrigation probably rely heavilyon the effectiveness of microbes in the roots. Some past stud-ies (Bubenheim et al., 1997; Federle and Schwab, 1989), usingIgepon-42, alkylbenzene sulphonate as anionic surfactant and lin-ear alcohol ethoxylate as non-ionic surfactant, have shown theeffectiveness of microbial communities associated with roots ofWalderman’s Green lettuce (Lactuca sativa L.), duckweed (Lemnaminor) and roots of cattail (Typha latifolia), degrading the syntheticdetergent and eliminating the phytotoxic effects of them. It is likelythat the microbes associated in the rhizosphere of silverbeet in thepresent study had successfully reduced the toxicity effects of grey-
plants.The type of microbes present around the plant roots in different
soils may also cause variation in the tolerance of species and geno-types. In addition, it appears that silverbeet probably had a positive
Fig. 5. Effects of different irrigation treatments (T0 to T3) on water use by silverbeetplants (N.B., the effects were statistically non-significant).

U. Pinto et al. / Resources, Conservation and Recycling 54 (2010) 429–435 433
F et hac
agbeagsbfird
4
wdt6taffirtaas
Fc
ig. 6. Effects of different irrigation treatments (T0 to T3) on soil pH after silver beolumns indicate the treatments with different letters are significantly different.
ssociation with microbes responsible to detoxify the effects ofreywater in the rhizosphere. Alternatively, the variety of silver-eet used in the current study may be more tolerant to any toxicffect of greywater reuse. This means, there may be some cropsnd varieties that are more likely to tolerate the toxic effects ofreywater reuse than others. In particular, this warrant a furthertudy to examine whether there is any genetic aspect of silver-eet that helps in tolerating the effects of greywater reuse. As aollow up to this glasshouse study, the next step will be to exam-ne the effects of the specie variation on tolerance to greywatereuse of commonly irrigated home garden plants under field con-itions.
.2. Plant water use
Similar to plant growth attributes, the values of cumulativeater use by silverbeet plants under different irrigation treatmentsuring the study period were similar to each-other, and statisticallyhere was no significant difference in the water consumption over0 days (Fig. 5). For all the treatments, as can be seen from Fig. 5,here was relatively less water used during early growth of plants,nd the water use increased progressively in each treatment andollowed the pattern of plant growth. Using soil evaporation datarom pots without plants, further analysis of the water use datandicate that the average transpiration amounts of each treatment
eached a maximum value after 33 days of planting and then startedo decline as plant aged. It is assumed that transpiration percent-ges of each plant started at a lower value and steadily increased tomaximum value with the growth of the plants, and then slowlytarted to decline as plants began to mature.
ig. 7. Effects of different irrigation treatments (T0 to T3) on soil EC after silver beet harolumns indicate the treatments with different letters are significantly different.
rvest (N.B., the effects were statistically significant). The letters a and b above the
Overall, the results of the present study suggest that irrigatingwith greywater does not affect water uptake of silverbeet plants forthe growth period (60 days) considered in the present study. Thenon-significant effects of greywater irrigation on plant growth andwater use in this study may be due to the higher level of toleranceof silverbeet plants to the detergent present in laundry greywater.The relatively short growth period of silverbeet plants may havealso influenced the non-significant effects of greywater on plantgrowth.
4.3. Soil pH
Fig. 6 shows the effect of different irrigation treatments of soilpH at the end of study for both in pots with plants and withoutplants. Irrigating silverbeet with 100% greywater (treatment T1)resulted in a significant (p < 0.05) increase in soil pH when com-pared with the control (treatment T0). Also, there was very littledifference in soil pH between the control (treatment T0) and treat-ment T3. Overall the soil pH in all the treatments increased at theend of experiment after harvesting silverbeet when compared withsoil pH at the beginning of the experiments.
All soil samples except the ones from the control treatment hadpH values above 7.0. The pH values of soil under treatments T1 andT2 were close to 8.0. The results of the present study suggest thatthe long-term application of greywater could lead to an increased
soil alkalinity over time, but the possibility of increase in soil pHcould be reduced by following a practice that involved irrigatingalternate with potable water and greywater (treatment T3).Soil pH greatly affects the availability of a range of soil nutrientssuch as phosphorus, copper, iron, manganese, molybdenum and
vest (N.B., the effects were statistically significant). The letters a and b above the

434 U. Pinto et al. / Resources, Conservation and Recycling 54 (2010) 429–435
after
zahfegap
4
posiopmtdpiem
wowlrirrs
Fig. 8. Effects of different irrigation treatments (T0 to T3) on soil total N
inc for plant growth, and the pH value between 6 and 7.5 is usu-lly considered optimal for growth of many plants and microbialealth of soil. Therefore, extra-care must be taken when soil pH
alls below 6 or rises above 8.2 (Hanlon et al., 1999; De Clerckat al., 2003). This means, a regular pH monitoring of soil irri-ated with greywater may be needed and any increase in soil pHbove 7.5 needs to be corrected by adding gypsum to lower theH.
.4. Soil EC
Fig. 7 shows the effect of different irrigation treatments of soilH at the end of study for both in pots with plants and with-ut plants. When compared with the control treatment, irrigatingilverbeet with 100% greywater (treatment T1) resulted in a signif-cant increase in soil EC. Irrigating with water containing a mixturef greywater and potable water (treatment T2) in the absence oflants had the highest EC (329 �S/cm), while the control treat-ent had the lowest EC (153 �S/cm) of the treatments included in
he study. Furthermore, there was no clear trend for EC values forifferent treatments involving pots with plants and those withoutlants. In general, EC values observed in the present study were
n the recommended range of 0–1500 �S/cm, which are consid-red optimal for growth of most plant types and activities of soilicrobes (De Clercka et al., 2003).Overall, the results of this study indicate accumulation of salts
hen irrigating with detergent rich greywater. However, the levelf salt accumulation could be different in the context of garden bedshen compared with the glasshouse study since surface runoff and
eaching may occur due to rain in the case of garden beds. The
esults of this study indicate that irrigation strategy that includesrrigating alternate with greywater and potable water is likely toeduce the risk of salinity in soil. However, further research isequired to investigate the long-term accumulation of salts in theoil by different sources of water.Fig. 9. Effects of different irrigation treatments (T0 to T3) on soil total P after
silver beet harvest (N.B., the effects were statistically non-significant).
4.5. Total nitrogen and phosphorus
There were no significant differences in total soil N after harvestof plants for any of the treatments although there was a trend ofhigher total N in soil irrigated with 100% greywater (treatment T1)when compared with the control (Fig. 8). The values of total N forsoil irrigated with greywater varied between 290 and 394 mg/kg,and these values were somewhat similar to those observed byWiel-Shafran et al. (2006) (385 mg/kg) for greywater irrigation oflettuce. Wiel-Shafran et al. suggested that this accumulation of Nin soil is correlated to the concentrations present in the greywa-ter.
Similar to the total N, the total P after harvest was also not signif-icantly influenced for any of the treatments included in the presentstudy when compared with the control (treatment T0) (Fig. 9).There was a trend of greater total P in 100% greywater irrigation(treatment T1) when compared with the control. The treatmentthat involved irrigating alternate with potable water and greywater(treatment T3) had the total P values similar to that for the con-trol. Thus, it is further evident that irrigating alternate with potablewater and greywater could reduce some of the risks associated withthe reuse of greywater.
The detergent and quality of water also affect the amount oftotal N and total P accumulated in soil. When investigating thequality of greywater from laundry sources, past studies indicateda wide variation in the soil total N and total P values. For exam-ple, Christova-Boal et al. (1996) reported the total N and total Pvalues ranged between 1 and 40 mg/kg and 0.062 and 42 mg/kgrespectively, while Howard et al. (2005) reported those values rang-ing between 3.5 and 31 mg/kg and 0.2 and 93 mg/kg respectively.
The wide variation in these values was probably due to the type ofdetergent used. The values of the total N (0.21 mg/kg) and total P(4.42 mg/kg) in the present study, using the prepared 100% greywa-ter, lie on the lower side of the range reported in the above studies.As such, further research is warranted to understand the accumula-silver beet harvest (N.B., the effects were statistically non-significant).

ation
tl
5
•
•
•
R
A
A
B
B
C
D
D
D
U. Pinto et al. / Resources, Conserv
ion of N and P in soil due to irrigation with greywater with higherevels of N and P concentrations.
. Conclusions
The study revealed that for the plant type examined (i.e., silver-beet), irrigation with 100% greywater had no significant effectson plant biomass (both root and shoot biomass) and water use.Also, the effects of greywater reuse were non-significant for thetotal N and total P contents of soil after the plant harvest.There was a significant increase in soil pH and EC with 100% grey-water irrigation when compared with the control and the othertwo irrigation treatments.Irrigating silverbeet with potable water and greywater in an alter-native pattern had soil pH and EC similar to that of irrigation with100% potable water. This also meant that irrigating alternate withpotable water and greywater could reduce some of the soil healthrisks associated with the reuse of greywater.
eferences
busam A. Reuse of greywater in Kuwait. International Journal of EnvironmentalStudies 2008;65:103–8.
tlas AR, Bartha R. Microbial ecology—fundamentals and applications. CA, USA:Benjamin/Cummings Publishing Company, Inc; 1998.
irks R, Hills S. Characterisation of indicator organisms and pathogens indomestic greywater for recycling. Environmental Monitoring and Assessment2007;129:61–9.
ubenheim D, Wignarajah K, Berry W, Wydeven T. Phytotoxic effects of greywaterdue to surfactants. Journal of the American Society for Horticultural Science1997;122:792–6.
hristova-Boal D, Eden RE, Mcfarlane S. An investigation into greywater reuse forurban residential properties. Desalination 1996;106:391–7.
e Clercka F, Singera MJ, Lindertb P. A 60-year history of California soil quality using
paired samples. Geoderma 2003;114:215–30.ixon A, Butler D, Fewkes A. Water saving potential of domestic water reuse systemsusing greywater and rainwater in combination. Water Science and Technology1999a;39:25–32.
ixon A, Butler D, Fewkes A, Robinson M. Measurement and modelling of qualitychanges in stored untreated greywater. Urban Water 1999b;1:293–309.
and Recycling 54 (2010) 429–435 435
Erikkson E, Auffarth K, Henze M, Ledin A. Characteristics of grey wastewater. UrbanWater Journal 2002;4:85–104.
Erikkson E, Baun A, Henze M, Ledin A. Phytotoxicity of grey wastewater evaluatedby toxicity tests. Urban Water Journal 2006;3:13–20.
Federle TW, Schwab BS. Mineralization of surfactants by microbiota of aquaticplants. Applied and Environmental Microbiology 1989;55:2092–4.
Garland JL, Levine LH, Yorio NC, Adams JL, Cool KL. Greywater processing in recircu-lation hydroponic systems: phytotoxicity, surfactant degradation and bacterialdynamics. Water Research 2000;34:3075–86.
Gross A, Azulai N, Oron G, Ronen Z, Arnold M, Nejidat A. Environmental impact andhealth risks associated with greywater irrigation: a case study. Water Scienceand Technology 2005;52:161–9.
Hanlon EA, Johnson GV, Jones BJ, Kalra YP, Miller RP, Soltanpour PN, Tucker R,Warnke DD, Watson M, editors. Soil analysis—handbook of reference methods.Washington, DC: CRC Press; 1999.
Howard E, Misra R, Loch R. Laundry greywater potential impact on toowoombasoils—final report. Queensland: National Centre for Engineering in Agriculture,University of Southern Queensland; 2005.
Jefferson B, Laine A, Parsons S, Stephenson T, Judd S. Technologies for domesticwastewater recycling. Urban Water 1999;1:285–92.
Jenerette GD, Larsen L. A global perspective on changing sustainable urban watersupplies. Global and Planetary Change 2006;50:202–11.
Jeppesen B. Domestic greywater re-use: Australia’s challenge for the future. Desali-nation 1996;106:311–5.
Lake PS, Bond NR. Australian futures: freshwater ecosystems and human waterusage. Futures 2007;39:288–305.
Lundqvist J, Tortajada C, Varis O, Biswas A. Water management in megacities. Ambio2005;3:267–8.
Neal J. Waste water reuse studies and trial in Canberra. Desalination1996;106:399–405.
Okun DA. Distributing reclaimed water through dual systems. American WaterWorks Association 1997;89:52–64.
Yiasoumi W, Grewal HS, Maheshwari BL, Simmons B. Evaluating water saving usingsmart irrigation and harvesting systems. In: Irrigation Australia Conference;2008.
Ottoson J, Stenstrom AT. Faecal contamination of greywater and associated microbialrisks. Water Research 2003;37:645–55.
Palmquist H, Hanaeus J. Hazardous substances in separately collected grey andblackwater from ordinary Swedish households. Science of the Total Environ-ment 2005;348:151–63.
Rose JB, Sun G-S, Gerba CP, Sinclair NA. Microbial quality and persistence ofenteric pathogens in greywater from various household sources. Water ResearchWATRAG 1991;25:37–42.
Wiel-Shafran A, Ronen Z, Weisbrod N, Adar E, Gross A. Potential changes in soil prop-erties following irrigation with surfactant rich greywater. Ecological Engineering2006;26:348–54.
Copyright © 2022 FDOKUMEN