Effects of Drought Stress and Rehydration on Physiological ...
17
Citation: Xiong, S.; Wang, Y.; Chen, Y.; Gao, M.; Zhao, Y.; Wu, L. Effects of Drought Stress and Rehydration on Physiological and Biochemical Properties of Four Oak Species in China. Plants 2022, 11, 679. https:// doi.org/10.3390/plants11050679 Academic Editor: Fulai Liu Received: 25 January 2022 Accepted: 28 February 2022 Published: 2 March 2022 Publisher’s Note: MDPI stays neutral with regard to jurisdictional claims in published maps and institutional affil- iations. Copyright: © 2022 by the authors. Licensee MDPI, Basel, Switzerland. This article is an open access article distributed under the terms and conditions of the Creative Commons Attribution (CC BY) license (https:// creativecommons.org/licenses/by/ 4.0/). plants Article Effects of Drought Stress and Rehydration on Physiological and Biochemical Properties of Four Oak Species in China Shifa Xiong 1,2 , Yangdong Wang 1,2 , Yicun Chen 1,2 , Ming Gao 1,2 , Yunxiao Zhao 1,2 and Liwen Wu 1,2, * 1 State Key Laboratory of Tree Genetics and Breeding, Chinese Academy of Forestry, Beijing 100091, China; [email protected] (S.X.); [email protected] (Y.W.); [email protected] (Y.C.); [email protected] (M.G.); [email protected] (Y.Z.) 2 Research Institute of Subtropical Forestry, Chinese Academy of Forestry, Hangzhou 311400, China * Correspondence: [email protected] Abstract: Quercus fabri Hance, Quercus serrata Thunb, Quercus acutissima Carruth, and Quercus variabilis BL are four Chinese oak species commonly used for forestation. To ensure the survival of seedlings, we first need to understand the differences in drought resistance of the four oak species at the seedling stage, and comprehensively evaluate their drought resistance capabilities. The four oak seedlings were divided into drought-rewatering treatment group and well watered samples (control group). For the seedlings of the drought-rewatering treatment group, drought stress lasting 31 days was used, and then re-watering for 5 days. The water parameters, osmotic solutes content, antioxidant enzyme activity and photosynthesis parameters of the seedlings in the two groups were measured every 5 days. Compared with the control group, the relative water content, water potential, net photosynthetic rate, transpiration rate, and stomatal conductance levels of the four oaks all showed a downward trend under continuous drought stress, and showed an upward trend after rehydration. The soluble protein, soluble sugar, proline, peroxidase, superoxide dismutase and catalase content of the four oaks increased first and then decreased under drought stress, and then increased after rehydration. The content of glycine betaine and malondialdehyde continued to increase, and gradually decreased after rehydration. The weight of each index was calculated by principal component analysis, and then the comprehensive evaluation of each index was carried out through the membership function method. The drought resistance levels of the four oak species were as follows: Q. serrata > Q. fabri > Q. variabilis > Q. acutissima. Keywords: drought stress; water parameters osmotic solutes; antioxidant enzyme; photosynthesiss; Quercus 1. Introduction With rising global temperatures and frequent extreme phenomena, 64% of the world’s land is already under drought stress, which has seriously affected the normal growth and development of many plants and crops [1]. Half of China’s land is arid or semiarid, and drought is a serious problem in northwest and southwest China [2]. Moreover, even southern regions with abundant rainfall are often affected by seasonal drought, which is a major factor that limits the normal growth and development of plants [3]. When plants are under drought stress, the plant water balance is severely affected, and normal physiological processes are compromised [4]. The relative water content (RWC) and water potential of plant leaves decrease [5]. In addition, plants close their stomata to reduce water loss, which can limit the supply of CO 2 and lead to reduced photosynthesis Reactive oxygen species (ROS) metabolism is the primary response of plants to stress [6]. Drought stress can lead to the disorder of production and elimination of ROS in plants, and excessive accumulation of ROS causes oxidative stress [7]. To protect themselves from oxidative stress, plants produce antioxidant enzymes and nonenzymatic substances that scavenge ROS [8]. The antioxidant enzymes mainly include peroxidase (POD), superoxide dismutase (SOD), Plants 2022, 11, 679. https://doi.org/10.3390/plants11050679 https://www.mdpi.com/journal/plants
-
Upload
khangminh22 -
Category
Documents
-
view
1 -
download
0
Transcript of Effects of Drought Stress and Rehydration on Physiological ...

�����������������
Citation: Xiong, S.; Wang, Y.; Chen,
Y.; Gao, M.; Zhao, Y.; Wu, L. Effects of
Drought Stress and Rehydration on
Physiological and Biochemical
Properties of Four Oak Species in
China. Plants 2022, 11, 679. https://
doi.org/10.3390/plants11050679
Academic Editor: Fulai Liu
Received: 25 January 2022
Accepted: 28 February 2022
Published: 2 March 2022
Publisher’s Note: MDPI stays neutral
with regard to jurisdictional claims in
published maps and institutional affil-
iations.
Copyright: © 2022 by the authors.
Licensee MDPI, Basel, Switzerland.
This article is an open access article
distributed under the terms and
conditions of the Creative Commons
Attribution (CC BY) license (https://
creativecommons.org/licenses/by/
4.0/).
plants
Article
Effects of Drought Stress and Rehydration on Physiological andBiochemical Properties of Four Oak Species in ChinaShifa Xiong 1,2, Yangdong Wang 1,2, Yicun Chen 1,2, Ming Gao 1,2, Yunxiao Zhao 1,2 and Liwen Wu 1,2,*
1 State Key Laboratory of Tree Genetics and Breeding, Chinese Academy of Forestry, Beijing 100091, China;[email protected] (S.X.); [email protected] (Y.W.); [email protected] (Y.C.); [email protected] (M.G.);[email protected] (Y.Z.)
2 Research Institute of Subtropical Forestry, Chinese Academy of Forestry, Hangzhou 311400, China* Correspondence: [email protected]
Abstract: Quercus fabri Hance, Quercus serrata Thunb, Quercus acutissima Carruth, and Quercus variabilisBL are four Chinese oak species commonly used for forestation. To ensure the survival of seedlings,we first need to understand the differences in drought resistance of the four oak species at the seedlingstage, and comprehensively evaluate their drought resistance capabilities. The four oak seedlings weredivided into drought-rewatering treatment group and well watered samples (control group). For theseedlings of the drought-rewatering treatment group, drought stress lasting 31 days was used, and thenre-watering for 5 days. The water parameters, osmotic solutes content, antioxidant enzyme activity andphotosynthesis parameters of the seedlings in the two groups were measured every 5 days. Comparedwith the control group, the relative water content, water potential, net photosynthetic rate, transpirationrate, and stomatal conductance levels of the four oaks all showed a downward trend under continuousdrought stress, and showed an upward trend after rehydration. The soluble protein, soluble sugar,proline, peroxidase, superoxide dismutase and catalase content of the four oaks increased first and thendecreased under drought stress, and then increased after rehydration. The content of glycine betaineand malondialdehyde continued to increase, and gradually decreased after rehydration. The weight ofeach index was calculated by principal component analysis, and then the comprehensive evaluation ofeach index was carried out through the membership function method. The drought resistance levels ofthe four oak species were as follows: Q. serrata > Q. fabri > Q. variabilis > Q. acutissima.
Keywords: drought stress; water parameters osmotic solutes; antioxidant enzyme; photosynthesiss;Quercus
1. Introduction
With rising global temperatures and frequent extreme phenomena, 64% of the world’sland is already under drought stress, which has seriously affected the normal growthand development of many plants and crops [1]. Half of China’s land is arid or semiarid,and drought is a serious problem in northwest and southwest China [2]. Moreover, evensouthern regions with abundant rainfall are often affected by seasonal drought, which is amajor factor that limits the normal growth and development of plants [3].
When plants are under drought stress, the plant water balance is severely affected, andnormal physiological processes are compromised [4]. The relative water content (RWC) andwater potential of plant leaves decrease [5]. In addition, plants close their stomata to reducewater loss, which can limit the supply of CO2 and lead to reduced photosynthesis Reactiveoxygen species (ROS) metabolism is the primary response of plants to stress [6]. Droughtstress can lead to the disorder of production and elimination of ROS in plants, and excessiveaccumulation of ROS causes oxidative stress [7]. To protect themselves from oxidative stress,plants produce antioxidant enzymes and nonenzymatic substances that scavenge ROS [8].The antioxidant enzymes mainly include peroxidase (POD), superoxide dismutase (SOD),
Plants 2022, 11, 679. https://doi.org/10.3390/plants11050679 https://www.mdpi.com/journal/plants

Plants 2022, 11, 679 2 of 17
ascorbate oxidase (APX) and catalase (CAT), and the nonenzymatic antioxidant substancesmainly include reduced glutathione (GSH), reduced ascorbic acid (AsA) and carotenoids [9].Many studies have shown that the responses of different protective enzymes to droughtstress vary [10–12]. The protective enzymes that play a dominant role in plants may alsodiffer between periods of stress [13]. In addition, plants can increase the concentration ofcell fluid, reduce the osmotic potential, maintain high water absorption and maintain thestability of turgor pressure by accumulating osmotic regulators [14].
The morphological structure (leaf area, leaf thickness and stomatal density) and phys-iological properties (RWC, antioxidant system and osmotic solutes) of leaves are oftenused as important indicators in drought studies [15–17]. At present, many studies havebeen carried out on the physiological and biochemical responses and drought resistancemechanisms of plants under drought stress [18–20]. A pot experiment with artificiallycontrolled water was performed to simulate the natural drought process in the soil and toobserve the plant resistance response to different levels of drought stress [21,22]. Pot ex-periments more objectively reflect the response characteristics of plants to natural droughtstress. There are many methods to evaluate the drought resistance of plants, such as theaffiliation function method, hierarchical evaluation, grey correlation analysis and principalcomponent analysis [23–25]. Among them, the affiliation function method can make amore comprehensive and integrated evaluation based on the determination of multipleindicators, avoiding the limitations and inaccuracies of a single evaluation indicator, andis the most widely used in drought resistance evaluation [26,27].Recently, there has beena preference for combining multiple evaluation methods to improve the accuracy of theresults [28]. Seedlings are sensitive to drought stress at the beginning of their develop-ment, which not only threatens their survival but also affects their later growth, biomassformation and ability to overwinter [29]. Therefore, by studying the physiological andbiochemical characteristics of oak seedling leaves under drought stress and combiningvarious evaluation methods, we can evaluate drought resistance with greater reliability.
The area of Quercus accounts for 13.7% of the total area of natural forests in China andis the main component of natural forests in China [30]. The Quercus plant genus plays animportant role in water conservation, soil and water conservation and ecological stability [31].Quercus fabri Hance, Quercus serrata Thunb, Quercus acutissima Carruth and Quercus variabilisBl are the dominant species in deciduous broad-leaved forests and mixed coniferous forestsin temperate and warm temperate regions of China and are also the forest building blocks inmost parts of the country [32,33]. Oak tree wood is dense and beautifully textured, resistantto wear and decay and is often used as a high-quality material for building and householdpurposes [34]. Oak tree bark can be used for extracting tannins, young leaves can be used toraise sericulture, and dead branches can also be used to cultivate valuable medicinal herbssuch as edible mushrooms and ganoderma lucidum [35,36]. Oak has high economic valueand is rich in oak resources in China, but its development and utilization is still backward. Atpresent, most research on oak trees has focused on the nutritional and mineral contents of thefruit, the distribution patterns of populations in individual areas and genetic diversity [37–39].However, in the process of artificial afforestation, seedlings transplanted to mountains oftensuffer from seasonal drought, which seriously affects growth and development. This leadsto a low survival rate and poor afforestation effects. Understanding how drought resistancevaries across different oak species is helpful for reasonable cultivation and extension. In thisstudy, four common oak species were selected, and the photosynthetic capacity, osmoticsolutes content and antioxidant enzyme activity of the leaves were studied under short-term natural drought stress and rehydration processes. The differences in the responsemechanisms of the four oak species to drought stress were preliminarily investigated, anddrought resistance was comprehensively evaluated to provide a theoretical basis for extensivecultivation and promotion.

Plants 2022, 11, 679 3 of 17
2. Results2.1. Soil Moisture Content
The soil moisture content of the four oak control groups ranged from 28.0% to 31.9%.With continuous drought stress, the soil moisture content of the treatment group decreasedgradually, and the range of the decrease was similar. The soil moisture content reached thelowest point of 3.1~3.5% at day 31 of drought stress and returned to the control level afterrewatering (Figure 1).
Plants 2022, 11, x FOR PEER REVIEW 3 of 17
the four oak species to drought stress were preliminarily investigated, and drought re-sistance was comprehensively evaluated to provide a theoretical basis for extensive culti-vation and promotion.
2. Results 2.1. Soil Moisture Content
The soil moisture content of the four oak control groups ranged from 28.0% to 31.9%. With continuous drought stress, the soil moisture content of the treatment group de-creased gradually, and the range of the decrease was similar. The soil moisture content reached the lowest point of 3.1~3.5% at day 31 of drought stress and returned to the control level after rewatering (Figure 1).
Figure 1. Effects of drought stress and rewatering on soil moisture content of four oak species (DR-F: drought-rewatering sample of Q. fabri; CK-F: well watered sample of Q. fabri; DR-S: drought-rewatering sample of Q. serrata; CK-S: well watered sample of Q. serrata; DR-A: drought-rewatering sample of Q. acutissima; CK-A: well watered sample of Q. acutissima; DR-V: drought-rewatering sample of Q. variabilis; CK-V: well watered sample of Q. variabilis).
2.2. Water Potential and RWC The RWC and water potential of the leaves of all four oak species tended to decrease
under continuous drought stress compared to those of the control group. The values of the treated groups were not significantly different from those of the control group on the first day, but all decreased and reached the lowest values, which were significantly lower than those of the control group, on day 31 (p < 0.05). After rewatering, the leaf water po-tential increased rapidly, and the recovery rate of the leaf water potential was faster than that of RWC on day 36. The RWC and water potential of Q. fabri leaves decreased from 81.13% and −1.52 MPa (day 1) to 41.10% and −2.84 MPa (day 31), with decrease rates of 49.47% and 87.25%, respectively. After rewatering, the RWC and water potential recov-ered to 73.02% and −1.67 MPa (day 36), respectively, but did not recover to the control sample level. The RWC and water potential of Q. serrata leaves decreased from 81.67% and −1.48 MPa (day 1) to 48.67% and −2.45 MPa (day 31), with decrease rates of 40.41% and 66.14%, respectively. After rewatering, the RWC and water potential recovered to 76.02% and −1.52 MPa (day 36), respectively. The RWC and water potential of Q. acutis-sima leaves decreased from 81.72% and −1.43 MPa (day 1) to 43.23% and −2.46 MPa (day 31), with decrease rates of 47.10% and 72.03%, respectively. After rewatering, the RWC and water potential recovered to 72.72% and −1.54 MPa (day 36), respectively. The RWC
Figure 1. Effects of drought stress and rewatering on soil moisture content of four oak species (DR-F:drought-rewatering sample of Q. fabri; CK-F: well watered sample of Q. fabri; DR-S: drought-rewateringsample of Q. serrata; CK-S: well watered sample of Q. serrata; DR-A: drought-rewatering sample ofQ. acutissima; CK-A: well watered sample of Q. acutissima; DR-V: drought-rewatering sample of Q.variabilis; CK-V: well watered sample of Q. variabilis).
2.2. Water Potential and RWC
The RWC and water potential of the leaves of all four oak species tended to decreaseunder continuous drought stress compared to those of the control group. The values ofthe treated groups were not significantly different from those of the control group on thefirst day, but all decreased and reached the lowest values, which were significantly lowerthan those of the control group, on day 31 (p < 0.05). After rewatering, the leaf waterpotential increased rapidly, and the recovery rate of the leaf water potential was fasterthan that of RWC on day 36. The RWC and water potential of Q. fabri leaves decreasedfrom 81.13% and −1.52 MPa (day 1) to 41.10% and −2.84 MPa (day 31), with decreaserates of 49.47% and 87.25%, respectively. After rewatering, the RWC and water potentialrecovered to 73.02% and−1.67 MPa (day 36), respectively, but did not recover to the controlsample level. The RWC and water potential of Q. serrata leaves decreased from 81.67% and−1.48 MPa (day 1) to 48.67% and −2.45 MPa (day 31), with decrease rates of 40.41% and66.14%, respectively. After rewatering, the RWC and water potential recovered to 76.02%and −1.52 MPa (day 36), respectively. The RWC and water potential of Q. acutissima leavesdecreased from 81.72% and −1.43 MPa (day 1) to 43.23% and −2.46 MPa (day 31), withdecrease rates of 47.10% and 72.03%, respectively. After rewatering, the RWC and waterpotential recovered to 72.72% and −1.54 MPa (day 36), respectively. The RWC and waterpotential of Q. variabilis leaves decreased from 81.02% and −1.52 MPa (day 1) to 38.07%and −2.48 MPa (day 31), with a decrease rate of 53.10% and 63.16%, respectively. Afterrewatering, the RWC and water potential recovered to 73.67% and −1.57 MPa (day 36),

Plants 2022, 11, 679 4 of 17
respectively. The leaf water potential of Q. serrata, Q. acutissima and Q. variabilis returned tocontrol samples level, but the RWC remained lower than the control sample level (Figure 2).
Plants 2022, 11, x FOR PEER REVIEW 4 of 17
and water potential of Q. variabilis leaves decreased from 81.02% and −1.52 MPa (day 1) to 38.07% and −2.48 MPa (day 31), with a decrease rate of 53.10% and 63.16%, respectively. After rewatering, the RWC and water potential recovered to 73.67% and −1.57 MPa (day 36), respectively. The leaf water potential of Q. serrata, Q. acutissima and Q. variabilis re-turned to control samples level, but the RWC remained lower than the control sample level (Figure 2).
Figure 2. Effects of drought stress and rewatering on relative water content and water potential of four oak species. (A), relative water content (B), water potential. DR-F: drought-rewatering sample of Q. fabri; CK-F: well watered sample of Q. fabri; DR-S: drought-rewatering sample of Q. serrata; CK-S: well watered sample of Q. serrata; DR-A: drought-rewatering sample of Q. acutissima; CK-A: well watered sample of Q. acutissima; DR-V: drought-rewatering sample of Q. variabilis; CK-V: well watered sample of Q. variabilis. Different lowercase letters indicate significant (p < 0.05) differences among the four oak species subjected to the same treatment time.
2.3. Osmotic Solutes Under continuous drought stress, the levels of soluble protein, soluble sugar and pro-
line of the four oak species first increased, then decreased, and then increased after rehy-dration. However, the levels of glycine betaine increased continuously and decreased af-ter rehydration. The SP levels of Q. fabri, Q. acutissima and Q. variabilis reached a peak (day 6) earlier than that of Q. serrata (day 11), which was 1.50, 1.28, 1.15 and 1.11 times higher than that of the control group, respectively. Then, the SP levels of the four oak species were the lowest on day 31 and were significantly lower than that of the control group (p < 0.05). The SP levels were decreased by 43.74%, 48.75%, 42.52% and 51.60%, respectively. After rewatering, only Q. fabri returned to control sample level, while the other three oak species were significantly lower than control samples (p < 0.05) (Figure 3A). The SS levels of the four oak species reached a peak (day 26), which was 1.46, 1.48, 1.35 and 1.37 times higher than that of the control group, respectively. Then, the SS levels decreased and were the lowest on day 31, decreasing by 15.44%, 12.79%, 10.62% and 14.22%, respectively. Af-ter rewatering, the SS level of Q. serrata were significantly lower than the control samples (p < 0.05), but the other three oak species returned to control samples level (Figure 3B). The Pro levels of the four oak species reached a peak (day 26), which was 1.89, 1.66, 1.98 and 1.87 times higher than that of the control group, respectively. Then, the Pro levels decreased but was still significantly increased compared with the level in the control group (day 31) (p < 0.05) and returned to the control sample level after rehydration (Figure 3C). The GB levels of the four oak species showed a continuous increasing trend, reaching the peak on day 31, which was was 1.56, 2.05, 1.96 and 2.29 times higher than that of the control group, respectively. After rehydration, the GB levels decreased sharply but was still significantly higher than that in the control group (p < 0.05) (Figure 3D).
Figure 2. Effects of drought stress and rewatering on relative water content and water potential offour oak species. (A), relative water content (B), water potential. DR-F: drought-rewatering sampleof Q. fabri; CK-F: well watered sample of Q. fabri; DR-S: drought-rewatering sample of Q. serrata;CK-S: well watered sample of Q. serrata; DR-A: drought-rewatering sample of Q. acutissima; CK-A:well watered sample of Q. acutissima; DR-V: drought-rewatering sample of Q. variabilis; CK-V: wellwatered sample of Q. variabilis. Different lowercase letters indicate significant (p < 0.05) differencesamong the four oak species subjected to the same treatment time.
2.3. Osmotic Solutes
Under continuous drought stress, the levels of soluble protein, soluble sugar andproline of the four oak species first increased, then decreased, and then increased afterrehydration. However, the levels of glycine betaine increased continuously and decreasedafter rehydration. The SP levels of Q. fabri, Q. acutissima and Q. variabilis reached a peak(day 6) earlier than that of Q. serrata (day 11), which was 1.50, 1.28, 1.15 and 1.11 times higherthan that of the control group, respectively. Then, the SP levels of the four oak species werethe lowest on day 31 and were significantly lower than that of the control group (p < 0.05).The SP levels were decreased by 43.74%, 48.75%, 42.52% and 51.60%, respectively. Afterrewatering, only Q. fabri returned to control sample level, while the other three oak specieswere significantly lower than control samples (p < 0.05) (Figure 3A). The SS levels of thefour oak species reached a peak (day 26), which was 1.46, 1.48, 1.35 and 1.37 times higherthan that of the control group, respectively. Then, the SS levels decreased and were thelowest on day 31, decreasing by 15.44%, 12.79%, 10.62% and 14.22%, respectively. Afterrewatering, the SS level of Q. serrata were significantly lower than the control samples(p < 0.05), but the other three oak species returned to control samples level (Figure 3B). ThePro levels of the four oak species reached a peak (day 26), which was 1.89, 1.66, 1.98 and1.87 times higher than that of the control group, respectively. Then, the Pro levels decreasedbut was still significantly increased compared with the level in the control group (day 31)(p < 0.05) and returned to the control sample level after rehydration (Figure 3C). The GBlevels of the four oak species showed a continuous increasing trend, reaching the peak onday 31, which was was 1.56, 2.05, 1.96 and 2.29 times higher than that of the control group,respectively. After rehydration, the GB levels decreased sharply but was still significantlyhigher than that in the control group (p < 0.05) (Figure 3D).

Plants 2022, 11, 679 5 of 17Plants 2022, 11, x FOR PEER REVIEW 5 of 17
Figure 3. Effects of drought stress and rewatering on osmotic solutes content of four oak species (A) soluble protein, (B) soluble sugar, (C) proline, (D) glycline betaine. DR-F: drought-rewatering sam-ple of Q. fabri; CK-F: well watered sample of Q. fabri; DR-S: drought-rewatering sample of Q. serrata; CK-S: well watered sample of Q. serrata; DR-A: drought-rewatering sample of Q. acutissima; CK-A: well watered sample of Q. acutissima; DR-V: drought-rewatering sample of Q. variabilis; CK-V: well watered sample of Q. variabilis. Different lowercase letters indicate significant (p < 0.05) differences among the four oak species subjected to the same treatment time.
2.4. Antioxidant Enzyme Activities and MDA Under continuous drought stress, the activities of POD, SOD and CAT of the four
oak species first increased, then decreased, and then increased after rehydration. The MDA level increased continuously and decreased after rehydration. The POD activity of Q. fabri, Q. acutissima and Q. variabilis (day 16) reached a peak later than that of Q. serrata (day 11), which was 1.36, 1.11, 1.34 and 1.18 times higher than that of the control group, respectively. The POD activity levels of the four oak species were the lowest on day 31 and were significantly lower than that of the control group (p < 0.05). The POD activity levels were decreased by 18.34%, 32.21%, 34.74% and 36.65%, respectively, and did not return to control samples level after rehydration (Figure 4A). The SOD activity level of the four oak species was significantly different from that of the control group at day 5 (p < 0.05) and peaked at day 21. The SOD activity levels were 2.14, 2.33, 1.93 and 2.28 times higher than that of the control group, respectively. Then, the SOD activity levels were the lowest at day 31 and were significantly lower than that in the control group (p < 0.05). The SOD activity levels were reduced by 32.55%, 29.26%, 37.10% and 20.73%, respectively, and did not recover to control samples level after rehydration (Figure 4B). The CAT activity levels of Q. fabri, Q. acutissima and Q. variabilis (day 21) reached a peak later than that of Q. serrata (day 16). The CAT activity levels were 1.54, 1.48, 1.52 and 1.39 times higher than that of the control group, respectively. The CAT activity levels of the four oak species were the lowest on day 31 and were significantly lower than that of the control group (p < 0.05). The CAT activity levels decreased by 25.13%, 20.61%, 8.12% and 11.43%, respectively. Af-ter rehydration, only Q. fabri returned to the CAT activity level of the control sample, but the levels of the other three oaks were significantly lower than control samples (p < 0.05)
Figure 3. Effects of drought stress and rewatering on osmotic solutes content of four oak species(A) soluble protein, (B) soluble sugar, (C) proline, (D) glycline betaine. DR-F: drought-rewateringsample of Q. fabri; CK-F: well watered sample of Q. fabri; DR-S: drought-rewatering sample of Q.serrata; CK-S: well watered sample of Q. serrata; DR-A: drought-rewatering sample of Q. acutissima;CK-A: well watered sample of Q. acutissima; DR-V: drought-rewatering sample of Q. variabilis; CK-V: well watered sample of Q. variabilis. Different lowercase letters indicate significant (p < 0.05)differences among the four oak species subjected to the same treatment time.
2.4. Antioxidant Enzyme Activities and MDA
Under continuous drought stress, the activities of POD, SOD and CAT of the fouroak species first increased, then decreased, and then increased after rehydration. TheMDA level increased continuously and decreased after rehydration. The POD activity ofQ. fabri, Q. acutissima and Q. variabilis (day 16) reached a peak later than that of Q. serrata(day 11), which was 1.36, 1.11, 1.34 and 1.18 times higher than that of the control group,respectively. The POD activity levels of the four oak species were the lowest on day 31 andwere significantly lower than that of the control group (p < 0.05). The POD activity levelswere decreased by 18.34%, 32.21%, 34.74% and 36.65%, respectively, and did not returnto control samples level after rehydration (Figure 4A). The SOD activity level of the fouroak species was significantly different from that of the control group at day 5 (p < 0.05)and peaked at day 21. The SOD activity levels were 2.14, 2.33, 1.93 and 2.28 times higherthan that of the control group, respectively. Then, the SOD activity levels were the lowestat day 31 and were significantly lower than that in the control group (p < 0.05). The SODactivity levels were reduced by 32.55%, 29.26%, 37.10% and 20.73%, respectively, and didnot recover to control samples level after rehydration (Figure 4B). The CAT activity levelsof Q. fabri, Q. acutissima and Q. variabilis (day 21) reached a peak later than that of Q. serrata(day 16). The CAT activity levels were 1.54, 1.48, 1.52 and 1.39 times higher than that ofthe control group, respectively. The CAT activity levels of the four oak species were thelowest on day 31 and were significantly lower than that of the control group (p < 0.05). TheCAT activity levels decreased by 25.13%, 20.61%, 8.12% and 11.43%, respectively. Afterrehydration, only Q. fabri returned to the CAT activity level of the control sample, butthe levels of the other three oaks were significantly lower than control samples (p < 0.05)

Plants 2022, 11, 679 6 of 17
(Figure 4C). The MDA levels of the four oak species showed a continuous growth trend, andthere were no significant differences in the levels at the early stage (day 1 and day 6) whencomparing between the four oak species and the control group (p > 0.05). The MDA levelspeaked on day 31 and were significantly higher than that in the control group (p < 0.05),increasing by 2.71, 2.15, 2.23 and 2.06 times, respectively. The MDA levels decreased sharplyafter rehydration but were still significantly higher than that in the control group (p < 0.05),increasing by 1.38, 1.41, 1.36 and 1.45 times, respectively (Figure 4D).
Plants 2022, 11, x FOR PEER REVIEW 6 of 17
(Figure 4C). The MDA levels of the four oak species showed a continuous growth trend, and there were no significant differences in the levels at the early stage (day 1 and day 6) when comparing between the four oak species and the control group (p > 0.05). The MDA levels peaked on day 31 and were significantly higher than that in the control group (p < 0.05), increasing by 2.71, 2.15, 2.23 and 2.06 times, respectively. The MDA levels decreased sharply after rehydration but were still significantly higher than that in the control group (p < 0.05), increasing by 1.38, 1.41, 1.36 and 1.45 times, respectively (Figure 4D).
Figure 4. Effects of drought stress and rewatering on antioxidant enzyme activities and malondial-dehyde of four oak species. (A) peroxidase activity, (B) superoxide dismutase activity, (C) catalase activity, (D) malondialdehyde content. DR-F: drought-rewatering sample of Q. fabri; CK-F: well wa-tered sample of Q. fabri; DR-S: drought-rewatering sample of Q. serrata; CK-S: well watered sample of Q. serrata; DR-A: drought-rewatering sample of Q. acutissima; CK-A: well watered sample of Q. acutissima; DR-V: drought-rewatering sample of Q. variabilis; CK-V: well watered sample of Q. vari-abilis. Different lowercase letters indicate significant (p < 0.05) differences among the four oak species subjected to the same treatment time.
2.5. Photosynthetic Parameters Compared with the control group, the Pn, Gs and Tr values for the four oak species
showed a decreasing trend under continuous drought stress. The values were the lowest on day 31 and rose rapidly after rehydration. As drought stress was prolonged, the Pn values of the four oak species decreased continuously. The Pn values of Q. serrata at day 6 was significantly higher than that of the control group (p < 0.05). The Pn values were decreased by 72.10%, 63.29%, 63.67% and 60.16%, respectively (day 31). After rehydrating, the Pn of Q. serrata was significantly lower than control samples value (p < 0.05), but the Pn values of the other three oak species returned to control samples (Figure 5A). There were no significant differences in the Gs values when comparing between the four oak species and the control group at the early stage (day 1 and day 6) (p > 0.05). The Gs values were decreased by 71.14%, 57.45%, 50.03% and 45.24%, respectively (day 31), but returned to control samples values after rehydration (Figure 5B). There were significant differences in the Tr values when comparing between the four oak species and the control group at
Figure 4. Effects of drought stress and rewatering on antioxidant enzyme activities and malondi-aldehyde of four oak species. (A) peroxidase activity, (B) superoxide dismutase activity, (C) catalaseactivity, (D) malondialdehyde content. DR-F: drought-rewatering sample of Q. fabri; CK-F: wellwatered sample of Q. fabri; DR-S: drought-rewatering sample of Q. serrata; CK-S: well watered sampleof Q. serrata; DR-A: drought-rewatering sample of Q. acutissima; CK-A: well watered sample ofQ. acutissima; DR-V: drought-rewatering sample of Q. variabilis; CK-V: well watered sample of Q.variabilis. Different lowercase letters indicate significant (p < 0.05) differences among the four oakspecies subjected to the same treatment time.
2.5. Photosynthetic Parameters
Compared with the control group, the Pn, Gs and Tr values for the four oak speciesshowed a decreasing trend under continuous drought stress. The values were the lowest onday 31 and rose rapidly after rehydration. As drought stress was prolonged, the Pn valuesof the four oak species decreased continuously. The Pn values of Q. serrata at day 6 wassignificantly higher than that of the control group (p < 0.05). The Pn values were decreasedby 72.10%, 63.29%, 63.67% and 60.16%, respectively (day 31). After rehydrating, the Pn of Q.serrata was significantly lower than control samples value (p < 0.05), but the Pn values of theother three oak species returned to control samples (Figure 5A). There were no significantdifferences in the Gs values when comparing between the four oak species and the controlgroup at the early stage (day 1 and day 6) (p > 0.05). The Gs values were decreased by71.14%, 57.45%, 50.03% and 45.24%, respectively (day 31), but returned to control samplesvalues after rehydration (Figure 5B). There were significant differences in the Tr valueswhen comparing between the four oak species and the control group at day 6 (p < 0.05).

Plants 2022, 11, 679 7 of 17
The Tr values were decreased by 62.37%, 60.08%, 61.28% and 60.72%, respectively (day 31),and did not return to control samples values after rehydration (Figure 5C).
Plants 2022, 11, x FOR PEER REVIEW 7 of 17
day 6 (p < 0.05). The Tr values were decreased by 62.37%, 60.08%, 61.28% and 60.72%, respectively (day 31), and did not return to control samples values after rehydration (Fig-ure 5C).
Figure 5. Effects of drought stress and rewatering on photosynthetic parameters of four oak species (A), net photosynthetic rate (B), transpiration rate (C), stomatal conductance. DR-F: drought-rewa-tering sample of Q. fabri; CK-F: well watered sample of Q. fabri; DR-S: drought-rewatering sample of Q. serrata; CK-S: well watered sample of Q. serrata; DR-A: drought-rewatering sample of Q. acutis-sima; CK-A: well watered sample of Q. acutissima; DR-V: drought-rewatering sample of Q. variabilis; CK-V: well watered sample of Q. variabilis. Different lowercase letters indicate significant (p < 0.05) differences among the four oak species subjected to the same treatment time.
2.6. Multivariate Statistical Analysis The eigenvalues and contribution rates of principal components were the basis for
selecting principal components. The 13 physiological and biochemical indexes of the
Figure 5. Effects of drought stress and rewatering on photosynthetic parameters of four oak species (A),net photosynthetic rate (B), transpiration rate (C), stomatal conductance. DR-F: drought-rewateringsample of Q. fabri; CK-F: well watered sample of Q. fabri; DR-S: drought-rewatering sample of Q.serrata; CK-S: well watered sample of Q. serrata; DR-A: drought-rewatering sample of Q. acutissima;CK-A: well watered sample of Q. acutissima; DR-V: drought-rewatering sample of Q. variabilis; CK-V:well watered sample of Q. variabilis. Different lowercase letters indicate significant (p < 0.05) differencesamong the four oak species subjected to the same treatment time.

Plants 2022, 11, 679 8 of 17
2.6. Multivariate Statistical Analysis
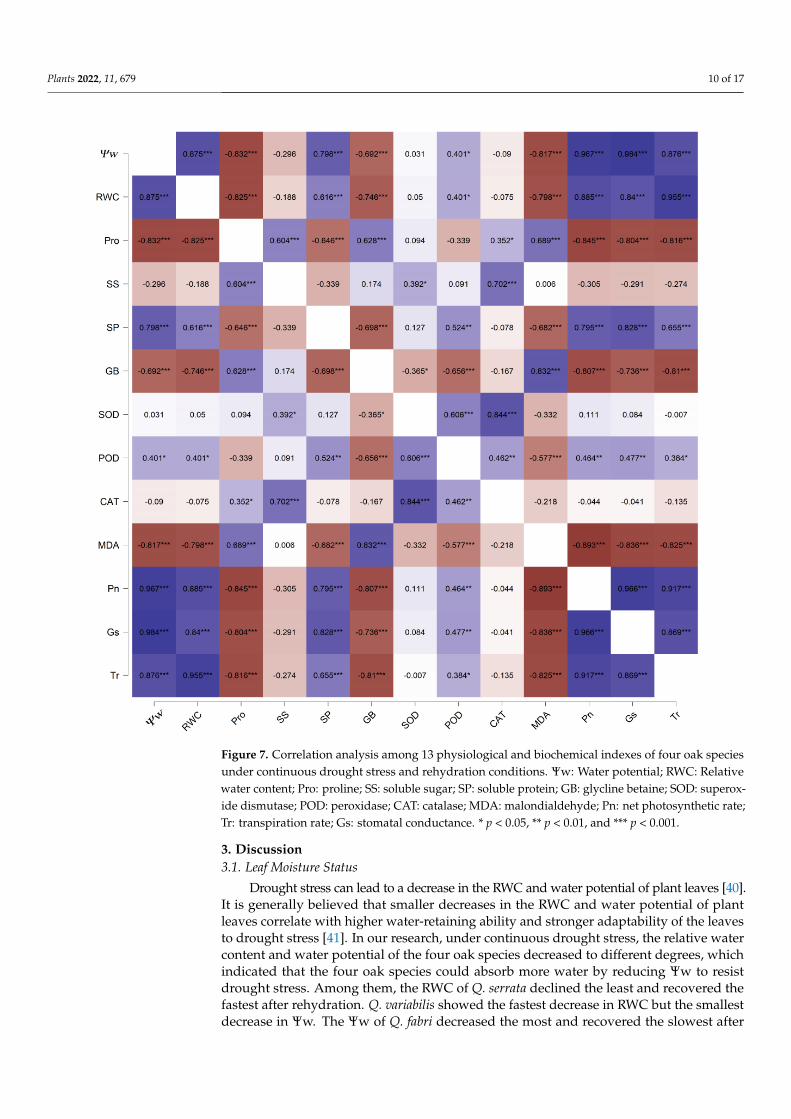
The eigenvalues and contribution rates of principal components were the basis forselecting principal components. The 13 physiological and biochemical indexes of the leavesfrom the 4 oak species were analysed by PCA. Two principal components with eigenvaluesgreater than 1 were obtained, and their contribution rates were 64.24% and 19.70%, respec-tively. The cumulative contribution rate was 83.94%, and most of the information on theoriginal characteristics was retained (Table 1). Therefore, the first two principal componentscould be selected as the important principal components of the drought resistance of thefour oak species. The factors with higher loading capacity in the first principal componentwere Ψw, RWC, Pro, SP, GB, MDA, Pn, GS and Tr, which were mainly related to leaf waterstatus, osmotic solutes and photosynthesis. The second principal component was mainlyrelated to antioxidant enzymes. The treatments of the 4 oaks under drought stress andduring rehydration were completely separated. In addition, Q. acutissima, Q. serrata andQ. variabilis highly overlapped under drought stress and during rehydration. In contrast,Q. fabri varied greatly with the other three species (Figure 6). To further understand therelationship between leaf water status, osmotic solutes, photosynthesis and antioxidantenzymes, Pearson correlation analysis was used to analyse the data. The results showedthat Pn, GS and Tr positively correlated with each other, negatively correlated with MDA,GB and Pro levels and positively correlated with SP, Ψw and RWC. Ψw and RWC levelswere significantly negatively correlated with Pro, GB and MDA levels. MDA levels weresignificantly positively correlated with GB and Pro levels and negatively correlated withSP levels and POD activities. Pro levels were significantly negatively correlated with SPlevels and positively correlated with SS and GB levels. In addition, SOD, POD and CATactivities were significantly positively correlated (Figure 7). To comprehensively evaluatethe drought resistance of the four oak species, 13 physiological and biochemical indexesof the four oak species under continuous drought stress and rehydration conditions wereanalysed by membership functions (Table 2). The membership function value of each indexwas calculated according to a formula. The degree of correlation between different indexesand drought resistance was different. The arithmetic mean of the membership value of eachindex did not fully reflect the level of drought resistance in the four oak species. Therefore,the proportion of eigenvalues corresponding to each principal component to the sum of thetotal eigenvalues of the extracted principal components was taken as the weight. The com-prehensive evaluation value of the four oak species was calculated. Higher comprehensiveevaluation values were positively correlated with stronger drought-resistance ability. Theresults showed that the order of drought resistance of the four oak species were as follows:Q. serrata > Q. fabri > Q. variabilis > Q. acutissima.
Table 1. Eigenvalue and cumulative contribution rate of each index of four oak species.
Measured IndexPrincipal Component
PC1 PC2
Relative water content 0.335 −0.014Water potential 0.326 0.018Soluble sugar −0.174 0.365
Soluble protein 0.276 0.084Glycine betaine −0.309 −0.134
Pro −0.322 0.099SOD −0.083 0.551POD 0.150 0.447CAT −0.142 0.540MDA −0.311 −0.176
Pn 0.331 0.041Gs 0.334 0.045

Plants 2022, 11, 679 9 of 17
Table 1. Cont.
Measured IndexPrincipal Component
PC1 PC2
Tr 0.328 −0.024Eigenvalue 8.352 2.562
Cumulative contribution rate (%) 64.24 83.94
Table 2. Membership function values and evaluation index of the drought resistance of four oak species.
Item Q. fabri Q. serrata Q. acutissima Q. variabilis
Relative water content 0.3340 0.2399 0.2314 0.2325Water potential 0.4529 0.5773 0.4193 0.3608Soluble sugar 0.3002 0.2288 0.3272 0.2844
Soluble protein 0.0900 0.0883 0.0863 0.0823Pro 0.1980 0.2321 0.3348 0.3919
SOD 0.0777 0.1053 0.0780 0.1094POD 0.1384 0.0909 0.1013 0.0920CAT 0.1125 0.1110 0.1236 0.1305MDA 0.4770 0.5235 0.4702 0.5055
Pn 0.4322 0.4225 0.4932 0.5193Gs 0.4354 0.4725 0.5329 0.4984Tr 0.3608 0.3990 0.3285 0.3118
Comprehensiveevaluation 0.2900 0.2983 0.2817 0.2819
Sequencing 2 1 4 3
Plants 2022, 11, x FOR PEER REVIEW 9 of 17
Table 2. Membership function values and evaluation index of the drought resistance of four oak species.
Item Q. fabri Q. serrata Q. acutissima Q. variabilis Relative water content 0.3340 0.2399 0.2314 0.2325
Water potential 0.4529 0.5773 0.4193 0.3608 Soluble sugar 0.3002 0.2288 0.3272 0.2844
Soluble protein 0.0900 0.0883 0.0863 0.0823 Pro 0.1980 0.2321 0.3348 0.3919
SOD 0.0777 0.1053 0.0780 0.1094 POD 0.1384 0.0909 0.1013 0.0920 CAT 0.1125 0.1110 0.1236 0.1305 MDA 0.4770 0.5235 0.4702 0.5055
Pn 0.4322 0.4225 0.4932 0.5193 Gs 0.4354 0.4725 0.5329 0.4984 Tr 0.3608 0.3990 0.3285 0.3118
Comprehensive evaluation 0.2900 0.2983 0.2817 0.2819 Sequencing 2 1 4 3
Figure 6. Principal component analysis of four oak species under continuous drought stress and rehydration conditions. DR-F: drought-rewatering sample of Q. fabri; CK-F: well watered sample of Q. fabri; DR-S: drought-rewatering sample of Q. serrata; CK-S: well watered sample of Q. serrata; DR-A: drought-rewatering sample of Q. acutissima; CK-A: well watered sample of Q. acutissima; DR-V: drought-rewatering sample of Q. variabilis; CK-V: well watered sample of Q. variabilis.
Figure 6. Principal component analysis of four oak species under continuous drought stress andrehydration conditions. DR-F: drought-rewatering sample of Q. fabri; CK-F: well watered sampleof Q. fabri; DR-S: drought-rewatering sample of Q. serrata; CK-S: well watered sample of Q. serrata;DR-A: drought-rewatering sample of Q. acutissima; CK-A: well watered sample of Q. acutissima; DR-V:drought-rewatering sample of Q. variabilis; CK-V: well watered sample of Q. variabilis.
Plants 2022, 11, 679 10 of 17Plants 2022, 11, x FOR PEER REVIEW 10 of 17
Figure 7. Correlation analysis among 13 physiological and biochemical indexes of four oak species under continuous drought stress and rehydration conditions. Ψw: Water potential; RWC: Relative water content; Pro: proline; SS: soluble sugar; SP: soluble protein; GB: glycline betaine; SOD: super-oxide dismutase; POD: peroxidase; CAT: catalase; MDA: malondialdehyde; Pn: net photosynthetic rate; Tr: transpiration rate; Gs: stomatal conductance. * p < 0.05, ** p < 0.01, and *** p < 0.001.
3. Discussion 3.1. Leaf Moisture Status
Drought stress can lead to a decrease in the RWC and water potential of plant leaves [40]. It is generally believed that smaller decreases in the RWC and water potential of plant leaves correlate with higher water-retaining ability and stronger adaptability of the leaves to drought stress [41]. In our research, under continuous drought stress, the relative water content and water potential of the four oak species decreased to different degrees, which indicated that the four oak species could absorb more water by reducing Ψw to resist drought stress. Among them, the RWC of Q. serrata declined the least and recovered the fastest after rehydration. Q. variabilis showed the fastest decrease in RWC but the smallest decrease in Ψw. The Ψw of Q. fabri decreased the most and recovered the slowest after rehydration. The decline of water status of four oak species in different degrees is related to their unique stomatal control and cuticular tranpiration. These results indicate that Q.
Figure 7. Correlation analysis among 13 physiological and biochemical indexes of four oak speciesunder continuous drought stress and rehydration conditions. Ψw: Water potential; RWC: Relativewater content; Pro: proline; SS: soluble sugar; SP: soluble protein; GB: glycline betaine; SOD: superox-ide dismutase; POD: peroxidase; CAT: catalase; MDA: malondialdehyde; Pn: net photosynthetic rate;Tr: transpiration rate; Gs: stomatal conductance. * p < 0.05, ** p < 0.01, and *** p < 0.001.
3. Discussion3.1. Leaf Moisture Status
Drought stress can lead to a decrease in the RWC and water potential of plant leaves [40].It is generally believed that smaller decreases in the RWC and water potential of plantleaves correlate with higher water-retaining ability and stronger adaptability of the leavesto drought stress [41]. In our research, under continuous drought stress, the relative watercontent and water potential of the four oak species decreased to different degrees, whichindicated that the four oak species could absorb more water by reducing Ψw to resistdrought stress. Among them, the RWC of Q. serrata declined the least and recovered thefastest after rehydration. Q. variabilis showed the fastest decrease in RWC but the smallestdecrease in Ψw. The Ψw of Q. fabri decreased the most and recovered the slowest after

Plants 2022, 11, 679 11 of 17
rehydration. The decline of water status of four oak species in different degrees is relatedto their unique stomatal control and cuticular tranpiration. These results indicate that Q.serrata can maintain a higher water balance than the other three oak species. Q. serrata leavesmay be more leathery than the leaves from the other species, which would be beneficialfor reducing water transpiration during drought stress. The results herein were similar tothose from studies of soybean [42] and Cyamopsis tetragonoloba (L.) Taub. [43].
3.2. Osmotic Solutes
Plants under drought stress are often damaged by osmotic stress. When cells losewater, it can decrease turgor pressure and lead to death [44]. However, plants can activelyaccumulate osmotic solutes to maintain turgor [45]. In our research, the SS, Pro, GB and SPlevels of the four oak species all showed an increasing trend in the early stages of sustaineddrought stress. The results showed that the four oak species reduced their osmotic potentialby accumulating osmotic solutesduring early stages of drought stress to ensure that watercould be absorbed from the external environment and to resist drought-induced damage.Soluble proteins respond faster than other osmotic regulators, it was significantly higherthan that in the control group at day 6, similar to the results of Cheng et al. [46]. However,osmotic regulation cannot unlimitedly regulate the osmotic pressure of cells. When droughtstress reached the limit of plant self-regulation, we found that the levels of Pro and SP of thefour oak species began to decline at day 26. In particular, SP was more sensitive to droughtstress and began to decrease earlier. It is possible that the stress damage exceeded thetolerance limit, which blocked normal plant metabolism and then affected the productionof osmotic solutes. Similar results were observed in Capsicum spp. [47], in which thecontents of SP and SS decreased under severe drought stress. At present, a large number ofstudies have shown that GB has multiple functions in resisting drought stress, includingscavenging ROS, maintaining the stability of biofilms, and protecting the photosyntheticapparatus [48,49]. In this study, we found that GB increased continuously in the four oakspecies, indicating that they could stimulate their own GB synthesis under drought stress toresist the damage caused by stress. After rehydration, the levels of SP, SS and Pro returnedto control samples in Q. fabri, and the levels of SS and Pro returned to control samples in Q.acutissima and Q. variabilis. However, only the Pro level returned to the control samplesin Q. serrata. This also reflects the difference in the recovery ability of osmotic regulationsystem among the four oak species.
3.3. Antioxidant Enzyme Activities and MDA
Under normal conditions, there is a dynamic equilibrium between the productionand clearance of ROS in plants, but when plants are under drought stress, the dynamicequilibrium is disrupted [50]. The excessive accumulation of ROS can damage cells andcause oxidative deterioration of cell membranes, which may lead to plant death in severecases. There is an active oxygen scavenging system in plants, in which SOD, POD and CATare important antioxidant enzymes for scavenging ROS [51]. In our research, the activitiesof POD, SOD and CAT enzymes in the four oak species showed a trend of increasing firstand then decreasing. The results showed that all four oak species could resist the damagecaused by drought stress by enhancing the activity of antioxidant enzymes. However, asthe drought stress was intensified, the ROS production levels exceeded the scavengingabilities of the plants, and the activities of the three protective enzymes all decreased tovarying degrees. Similar results were observed in Handeliodendron bodinieri (Levl.) [52],Olea europaea L. [53]. The activity peaks of SOD, POD and CAT appeared at different timesin four oak species, which indicated that they had different sensitivity to drought stress.We also found that the SOD activity increased significantly at day 6. The results showedthat SOD was the first to respond to the early stages of drought stress, and then POD andCAT enzymes responded. Compared with the control group, there were no significantdifferences in the MDA levels of the four oak species at day 6. The results indicated that thethree enzymes could effectively eliminate the production of reactive oxygen species in the

Plants 2022, 11, 679 12 of 17
early stages of drought stress. However, in the late stages of drought stress, the MDA levelsin the four oak species were significantly higher than that of the control group (p < 0.05). Itis possible that the four oak species suffered from long-term drought stress, which damagedthe antioxidant enzyme system to different degrees. After rehydration, the MDA levelsstill failed to fall to the control sample level, which indicates that the continuous droughtstress has caused irreversible damage. ROS overaccumulation have destroyed the cellmembranes, which may have caused MDA to accumulate in large quantities.
3.4. Photosynthetic Parameters
Drought stress can also affect the photosynthetic physiology of plant leaves, which ismainly reflected by the chlorophyll content, Pn and Tr [54]. In this study, the Pn, Gs and Trvalues of the four oak species showed a continuous decreasing trend as drought stress wasprolonged and were significantly lower than those of the control group at day 31 (p < 0.05).This result shows that photosynthesis was inhibited in the four oak species under continuousdrought stress, which might be due to the production and accumulation of a large numberof reactive oxygen species in the leaves. Accumulation of ROS results in damage to themesophyll cell membrane, destruction of photosynthetic enzyme activity and a decrease inphotosynthesis. Correlation analysis results also showed that photosynthetic parameterswere significantly positively correlated with water status and negatively correlated withMDA content. In addition, the Pn, Gs and Tr values of Q. fabri were the lowest amongthe four oak species, the Pn and Tr values of Q. serrata were the highest, and the Gs valueof Q. variabilis was the highest at day 31. The results showed that the resistance of Q.fabri photosystems was the worst, and Q. serrata was the strongest. It may be that theosmoregulation (especially the GB content) of Q. serrata is stronger than that of the otherthree species, and the decrease in RWC is the smallest, which greatly reduces the damageto the photosystem. After rehydration, there was no significant difference in Gs, but theTr value was still significantly lower than that of the control group. With the exceptionof Q. fabr, there were no significant differences in the Gs values when comparing the fouroak species with the control group. The results showed that the recovery ability of the Q.serrata photosystem was weaker than that of the other three oak species. Q. serrata mayhave weak repair ability after severe drought, which was indicated by the osmotic solutesrecovery results.
3.5. Multivariate Statistical Analysis
The four oak species are distributed in different regions in China. In the long-termadaptation and evolution of the geographical environment, each species has a different levelof drought resistance. The main differences are in the water parameters, osmotic regulation,antioxidant enzyme activity and photosynthesis. The changes in the physiological andbiochemical indexes of the four oak species were complex and varied under drought stress,and they reach the peak in different time periods, which indicated that different oak specieshave different ways to adapt to drought stress. The PCA results showed that the boundarybetween the drought rehydration group and the control group was clear, and the PC1components of the four oak species showed the same trend during the drought rehydrationperiod, indicating similar adaptation to drought stress. PC1 mainly consisting of leaf waterstatus, osmoregulatory solutes and photosynthesis, and correlation analysis shows thatthere is a significant correlation among them. At the same time, they are also closely relatedto antioxidant enzyme system and cooperate with each other to resist drought stress. Ourresults also showed that there were significant correlations between osmotic solutes andphotosynthesis and between water parameters and antioxidant enzyme activities. Thesensitivity of different oak species to drought stress is different, so the response time is alsodifferent, and the trees may be in different response stages simultaneously [55]. Duringcontinuous drought stress and rehydration, plants experience stress, adaptation, injury andrepair. The comprehensive adjustment of different response mechanisms in different stressstages constitutes the overall drought resistance of plants [56]. The drought resistance of

Plants 2022, 11, 679 13 of 17
plants is the result of multiple factors. It is difficult to accurately and comprehensivelyreflect the drought resistance of plants with only one drought resistance index. The rankingresults of a specific oak tree under different drought resistance indexes can vary greatly,so it is difficult to reasonably evaluate drought resistance according to a single index.Therefore, the weights of each indicator are calculated by PCA and then through themembership function method to comprehensively evaluate each index. The evaluationresult can approximate the actual result.
4. Materials and Methods4.1. Plant Material and Treatments
The seeds of Q. fabri, Q. serrata, Q. acutissima and Q. variabilis were collected fromWanzhou, Chongqing, China, in October 2020 (30◦38′15′ ′ N, 108◦37′21′ ′ E). No permissionwas required to collect these wild seeds. Then, the seeds were germinated in a sand bed,and the seedlings were transplanted to a light net bag container after rooting. The substrateof choice was a mixture of perlite and peat moss at a 1:3 ratio. The seedlings were cultivatedin experimental greenhouses with automatic spray watering and natural light. Robust,disease-free seedlings were selected and transferred to a 21 cm × 16 cm × 21 cm (upperdiameter × lower diameter × height) container in August 2021. One seedling was plantedin each pot and filled with soil (5 kg). The cultivated substrate was nursery soil, the organicmatter content was 54.07 g/kg, the fast nitrogen was 0.16 g/kg, the fast phosphorus was0.04 g/kg, and the fast potassium was 0.16 g/kg. Routine field management of the plantedseedlings was conducted without fertiliser. After one month of recovery, seedlings withsimilar growth were selected for natural soil drought stress and rehydration tests. Seasonaldrought occurred frequently in Chongqing, China, and the choice of local oak species couldbetter reflect the difference in response to seasonal drought stress.
Select seedlings with similar growth, one for each pot, 60 for each of the four oak species.They were randomly divided into a drought-rewatering treatment group (D-RW) and a wellwatered sample (CK), with 30 seedlings in each group. All pots were fully watered one daybefore the start of the treatment. The D-RW group was not watered again, lost water naturallyand dried-out, while the CK group was watered normally. The D-RW group was rehydratedafter one month. Leaf samples were taken at approximately 9:00 AM on days 1, 6, 11, 16,21, 26, 31 and 36 of treatment, Ten plants were randomly selected in each group, and oneleaf was taken from the same part. (3rd–5th from the tip of the branch down). The leaveswere removed from the petioles, placed in self-sealing bags, numbered, and transported backto the laboratory in ice boxes at 0–4 ◦C. Five fresh samples were taken for water potentialmeasurement, and the remaining parts were quickly ground with liquid nitrogen and stored inan ultralow temperature refrigerator at−80 ◦C for the determination of relevant physiologicaland biochemical parameters. Each indicator was repeated three times for each oak seedlingspecies. Soil moisture was monitored using a TDR200 soil moisture sensor.
4.2. Leaf Relative Water Content and Water Potential
Five leaves were randomly selected for fresh weight (FW) measurement immediatelyafter each sampling. Then, the leaves were placed in the dark in pure water for 24 h. Theleaves were then removed to dry the water on the surface of the leaves and then wereweighed, and the weight was recorded as the saturated fresh weight (TW). Finally, theleaves were placed in an oven at 85 ◦C and dried for 48 h to obtain a constant weight.Then, the leaves were removed and weighed, and the weight was recorded as the dryweight (DW) (Supplementary data). The RWC of the leaves was calculated according tothe formula: RWC(%) = ((FW − dW/TW − dW) × 100%) [57]. A WP4C dew point waterpotential metre (Psypro, Wescor Company, State of Utah, USA) was used to measure the leafwater potential. The water potential probe was clamped on each test sample, and rubbercement was added around the probe to form a closed space, which was the measurementchamber. The data were read every 5 min, and when the value was stable, the value wasrecorded 3 times to determine the average value, which was the leaf water potential.

Plants 2022, 11, 679 14 of 17
4.3. Measurements of Osmotic Solutes
The Pro content was measured using the ninhydrin colorimetric method (G0111WAssay Kit, Suzhou Geruisi, China). The SS content was measured by the anthrone sulphatemethod (G0501W Assay Kit, Suzhou, China). The Soluble protein (SP) content was mea-sured using the Komas Brilliant Blue G250 staining method (G0417W Assay Kit, Suzhou,China). The GB content was measured using the cycle colorimetric method (G0122W AssayKit, Suzhou, China).
4.4. Measurements of Antioxidant Enzyme Activity and Malondialdehyde (MDA) Content
The SOD activity was determined by the nitrogen blue tetrazole (NBT) method(G0101W Assay Kit, Suzhou, China). The CAT activity was determined by sodium thio-sulfate titration (G0105W Assay Kit, Suzhou, China). The POD activity was determinedby the peroxidase chromatographic method (G0107W Assay Kit, Suzhou, China). TheMDA content was determined by thiobarbituric acid colorimetry (G0109W Assay Kit,Suzhou, China).
4.5. Photosynthetic Parameters
After the experiment, the photosynthetic physiological parameters of the leaves weremeasured at 9:30–11:30 AM every five days. The upper, healthy, sunny-side leaves of theseedlings were observed using a LI-COR 6400 system (Li-COR, Lincoln, NE, USA). The airflow rate was set at 500 µmol/s, and the data were read after 2 min of stabilisation to recordthe net photosynthetic rate (Pn), transpiration rate (Tr) and stomatal conductance (Gs).
4.6. Data Analysis
All the data were tested for normality and Leneve’s test. The data were recorded andprocessed using Excel, and statistical analysis was carried out using SPSS 19.0. One-wayanalysis of variance (ANOVA) was used, and differences between treatments were analysedusing Duncan’s multiple comparisons (p < 0.05). GraphPad Prism 9 and JASP 0.14.1 wereused for plotting data. For PCA, the number of principal components is usually selected asthe variable containing more than 80% information; that is, the cumulative contribution rateof characteristic roots should be greater than 80%. The drought tolerance of four oak specieswas evaluated by the membership function method. When the indicator was positivelycorrelated with drought resistance, the formula was U(Xij) = (Xij − Xjmin)/(Xjmax − Xjmin).When the indicator was negatively correlated with drought resistance, the formula wasU(Xij) = 1 − (Xij − Xjmin)/(Xjmax − Xjmin). The overall evaluation value was calculated asXi = ΣU(pm × Xij)/n. In the formula, Xij is the measured value of an index of a certain oaktree. Xjmax and Xjmin are the minimum and maximum values of the index. pm is the weightcoefficient of the m-th principal component, and n is the number of indicators. These valueswere expressed as the mean ± standard error (SE) of three replicate samples.
5. Conclusions
This study simulated continuous drought stress that occurs under natural conditions.Changes in water parameters, osmotic regulation substance content, antioxidant enzymeactivity and photosynthesis were observed dynamically. It was discovered that four oakspecies showed adaptive changes to drought stress and resisted early stages of droughtstress by increasing the level of osmotic solutes and regulating the activity of antioxidantenzymes. However, with prolonged drought stress, all four oak species reached a tolerancelimit. The water content, osmotic solutes content, antioxidant enzyme activity and photo-synthetic parameters of the four oak species decreased to different degrees, especially atday 26. After rehydration, these indexes did not all recover to the control sample level, andthe recovery ability of the four oak species was different. Multivariate statistical analysisshowed that there were complex and close relationships between the leaf water status,osmotic solutes, antioxidant enzyme activities and photosynthesis, and they cooperatedwith each other to resist drought stress. PCA and the membership function method were

Plants 2022, 11, 679 15 of 17
used to analyse 13 physiological and biochemical indexes under continuous drought stressand rehydration. The drought resistance levels of the four oak species were as follows: Q.serrata > Q. fabri > Q. variabilis > Q. acutissima.
Supplementary Materials: The following supporting information can be downloaded at: https://www.mdpi.com/article/10.3390/plants11050679/s1, Table S1: RWC data sets of four oak speciesunder drought stress and rehydration.
Author Contributions: Conceptualization, Y.W. and L.W.; methodology, Y.C.; software, S.X.; val-idation, M.G. and Y.Z.; formal analysis, Y.W.; investigation, L.W.; resources, S.X.; data curation,S.X.; writing—original draft preparation, S.X.; writing—review and editing, S.X.; visualization, Y.W.;supervision, L.W.; project administration, L.W. All authors have read and agreed to the publishedversion of the manuscript.
Funding: This research research was funded by the Key Scientific and Technological Grant of Zhejiangfor Breeding New Agricultural Varieties (2021C02070-9).
Institutional Review Board Statement: Not applicable.
Informed Consent Statement: Not applicable.
Data Availability Statement: Not applicable.
Conflicts of Interest: The authors declare no conflict of interest.
Abbreviations
RWC: Relative water content; Ψw: Water potential; Pn: Net photosynthetic rate; Tr: Transpira-tion rate; Gs: Stomatal conductance; ROS: Reactive oxygen species; Pro: Proline; SP: Soluble protein;SS: Soluble sugar; GB: Glycine betaine; SOD: Superoxide dismutase; POD: Peroxidase; CAT: Catalase;MDA: Malondialdehyde; PCA: Principal component analysis.
References1. Li, R.; Geng, S. Impacts of climate change on agriculture and adaptive strategies in China. J. Integr. Agric. 2013, 12, 1402–1408.
[CrossRef]2. Piao, S.; Ciais, P.; Huang, Y.; Shen, Z.; Peng, S.; Li, J.; Zhou, L.; Liu, H.; Ma, Y.; Ding, Y.; et al. The impacts of climate change on
water resources and agriculture in China. Nature 2010, 467, 43–51. [CrossRef] [PubMed]3. Zhai, P.; Zhang, X.; Hui, W.; Pan, X. Trends in total precipitation and frequency of daily precipitation extremes over China. J. Clim.
2005, 18, 1096–1108. [CrossRef]4. Zhu, J. Salt and drought stress signal transduction in plants. Annu. Rev. Plant Biol. 2002, 53, 247–273. [CrossRef]5. Farooq, M.; Wahid, A.; Kobayashi, N.; Fujita, D.; Basra, S.M.A. Plant drought stress: Effects, mechanisms and management. Agron.
Sustain. Dev. 2009, 29, 185–212. [CrossRef]6. Ben-Gal, A.; Agam, N.; Alchanatis, V.; Cohen, Y.; Yermiyahu, U.; Zipori, I.; Presnov, E.; Sprintsin, M.; Dag, A. Evaluating water
stress in irrigated olives, correlation of soil water status, tree water status, and thermal imagery. Irrig. Sci. 2009, 27, 367–376.[CrossRef]
7. Gechev, T.S.; Van Breusegem, F.; Stone, J.M.; Denev, I.; Laloi, C. Reactive oxygen species as signals that modulate plant stressresponses and programmed cell death. Bioessays 2006, 28, 1091–1101. [CrossRef]
8. Huang, H.; Ullah, F.; Zhou, D.; Yi, M.; Zhao, Y. Mechanisms of ROS regulation of plant development and stress responses. Front.Plant Sci. 2019, 10, 800. [CrossRef]
9. Ahmad, P.; Jaleel, C.A.; Salem, M.A.; Nabi, G.; Sharma, S. Roles of enzymatic and nonenzymatic antioxidants in plants duringabiotic stress. Crit. Rev. Biotechnol. 2010, 30, 161–175. [CrossRef]
10. Anjum, S.A.; Xie, X.Y.; Wang, L.C.; Saleem, M.F.; Man, C.; Lei, W. Morphological, physiological and biochemical responses ofplants to drought stress. Afric. J. Agric. Res. 2011, 6, 2026–2032.
11. Bai, X.N.; Hao, H.; Hu, Z.H.; Leng, P.S. Ectomycorrhizal Inoculation Enhances the Salt Tolerance of Quercus mongolica Seedlings.Plants 2021, 10, 1790. [CrossRef] [PubMed]
12. Granda, V.; Delatorre, C.; Cuesta, C.; Centeno, M.L.; Fernández, B.; Rodríguez, A.; Feito, I. Physiological and biochemicalresponses to severe drought stress of nine Eucalyptus globulus clones: A multivariate approach. Tree Physiol. 2014, 34, 778–786.[CrossRef] [PubMed]
13. Seki, M.; Umezawa, T.; Urano, K.; Shinozaki, K. Regulatory metabolic networks in drought stress responses. Curr. Opin. PlantBiol. 2007, 10, 296–302. [CrossRef] [PubMed]
Plants 2022, 11, 679 16 of 17
14. Chaves, M.M.; Flexas, J.; Pinheiro, C. Photosynthesis under drought and salt stress: Regulation mechanisms from whole plant tocell. Ann. Bot. Lond. 2009, 103, 551–560. [CrossRef] [PubMed]
15. Kruskopf, M.; Flynn, K.J. Chlorophyll content and fluorescence responses cannot be used to gauge reliably phytoplanktonbiomass, nutrient status or growth rate. New Phytol. 2006, 169, 525–536. [CrossRef]
16. Li, R.; Guo, P.; Michael, B.; Stefania, G.; Salvatore, C. Evaluation of chlorophyll content and fluorescence parameters as indicatorsof drought tolerance in barley. Agric. Sci. China 2006, 5, 751–757. [CrossRef]
17. Medina, E.; Garcia, V.; Cuevas, E. Sclerophylly and oligotrophic environments: Relationships between leaf structure, mineralnutrient content, and drought resistance in tropical rain forests of the upper Rio Negro region. Biotropica 1990, 22, 51–64. [CrossRef]
18. Seleiman, M.F.; Al-Suhaibani, N.; Ali, N.; Akmal, M.; Alotaibi, M.; Refay, Y.; Dindaroglu, T.; Abdul-Wajid, H.H.; Battaglia, M.L.Drought stress impacts on plants and different approaches to alleviate its adverse effects. Plants 2021, 10, 259. [CrossRef]
19. Lei, Y.; Yin, C.; Li, C. Differences in some morphological, physiological, and biochemical responses to drought stress in twocontrasting populations of Populus przewalskii. Physiol. Plant 2006, 127, 182–191. [CrossRef]
20. Baghalian, K.; Abdoshah, S.; Khalighi-Sigaroodi, F.; Paknejad, F. Physiological and phytochemical response to drought stress ofGerman chamomile (Matricaria recutita L.). Plant Physiol. Biochem. 2011, 49, 201–207. [CrossRef]
21. Toscano, S.; Farieri, E.; Ferrante, A.; Romano, D. Physiological and biochemical responses in two ornamental shrubs to droughtstress. Front. Plant Sci. 2016, 7, 645. [CrossRef] [PubMed]
22. Yin, C.; Peng, Y.; Zang, R.; Zhu, Y.; Li, C. Adaptive responses of Populus kangdingensis to drought stress. Physiol. Plantarum. 2005,123, 445–451. [CrossRef]
23. Rivest, D.; Lorente, M.; Olivier, A.; Messier, C. Soil biochemical properties and microbial resilience in agroforestry systems: Effectson wheat growth under controlled drought and flooding conditions. Sci. Total Environ. 2013, 463, 51–60. [CrossRef] [PubMed]
24. Du, Z.; Hu, Y.; Buttar, N.A. Analysis of mechanical properties for tea stem using grey relational analysis coupled with multiplelinear regression. Sci. Hortic. 2020, 260, 108886. [CrossRef]
25. Gallé, A.; Feller, U. Changes of photosynthetic traits in beech saplings (Fagus sylvatica) under severe drought stress and duringrecovery. Physiol. Plant 2007, 131, 412–421. [CrossRef]
26. Zhang, W.; Yu, Y.; Zhou, X.; Yang, S.; Li, C. Evaluating water consumption based on water hierarchy structure for sustainabledevelopment using grey relational analysis: Case study in Chongqing, China. Sustainability 2018, 10, 1538. [CrossRef]
27. Cao, Y.; Luo, Q.; Tian, Y.; Meng, F. Physiological and proteomic analyses of the drought stress response in Amygdalus Mira(Koehne) Yü et Lu roots. BMC Plant Biol. 2017, 17, 1–16. [CrossRef]
28. Jacques, C.; Salon, C.; Barnard, R.L.; Vernoud, V.; Prudent, M. Drought Stress Memory at the Plant Cycle Level: A Review. Plants2021, 10, 1873. [CrossRef]
29. Lu, Y.; Hao, Z.; Xie, C.; Crossa, J.; Araus, J.; Gao, S.; Vivek, B.S.; Magorokosho, C.; Mugo, S.; Makumbi, D.; et al. Large-scalescreening for maize drought resistance using multiple selection criteria evaluated under water-stressed and well-wateredenvironments. Field Crops Res. 2011, 124, 37–45. [CrossRef]
30. Ditmarová, L.; Kurjak, D.; Palmroth, S.; Kmet’, J. Physiological responses of Norway spruce (Picea abies) seedlings to droughtstress. Tree Physiol. 2010, 30, 205–213. [CrossRef]
31. Yang, J.; Vázquez, L.; Feng, L.; Liu, Z.; Zhao, G. Climatic and soil factors shape the demographical history and genetic diversity ofa deciduous Oak (Quercus liaotungensis) in Northern China. Front. Plant Sci. 2018, 9, 1534. [CrossRef] [PubMed]
32. Wu, T.; Dong, Y.; Yu, M.; Geoff Wang, G.; Zeng, D. Leaf nitrogen and phosphorus stoichiometry of Quercus species across China.For. Ecol. Manag. 2012, 284, 116–123. [CrossRef]
33. Xiong, S.; Zhao, Y.; Chen, Y.; Gao, M.; Wu, L.; Wang, Y. Genetic diversity and population structure of Quercus fabri Hance in Chinarevealed by genotyping-by-sequencing. Ecol. Evol. 2020, 10, 8949–8958. [CrossRef] [PubMed]
34. Sun, J.; Shi, W.; Wu, Y.; Ji, J.; Feng, J.; Zhao, J.; Shi, X.; Du, C.; Chen, W.; Liu, J.; et al. Variations in Acorn Traits in Two Oak Species:Quercus mongolica Fisch. ex Ledeb. and Quercus variabilis Blume. Forests 2021, 12, 1755. [CrossRef]
35. Silva, S.; Costa, E.M.; Borges, A.; Carvalho, A.P.; Monteiro, M.J.; Pintado, M.M.E. Nutritional characterization of acorn flour (atraditional component of the Mediterranean gastronomical folklore). J. Food Meas. Charact. 2016, 10, 584–588. [CrossRef]
36. Marc, R.A.; Niculae, M.; Páll, E.; Mures, an, V.; Mures, an, A.; Tanislav, A.; Pus, cas, , A.; Mures, an, C.C.; Cerbu, C. Red Oak (Quercusrubra L.) Fruits as Potential Alternative for Cocoa Powder: Optimization of Roasting Conditions, Antioxidant, and BiologicalProperties. Forests 2021, 12, 1088. [CrossRef]
37. Makhlouf, F.Z.; Squeo, G.; Difonzo, G.; Faccia, M.; Pasqualone, A.; Summo, C.; Malika, B.; Francesco, C. Effects of storage on theoxidative stability of acorn oils extracted from three different Quercus species. J. Sci. Food Agric. 2021, 101, 131–138. [CrossRef]
38. Li, H.J.; Zhang, Z.B. Effect of rodents on acorn dispersal and survival of the Liaodong oak (Quercus liaotungensis Koidz.). For. Ecol.Manag. 2003, 176, 387–396. [CrossRef]
39. Yang, J.; Di, X.; Meng, X.; Feng, L.; Liu, Z.; Zhao, G. Phylogeography and evolution of two closely related oak species (Quercus)from north and northeast China. Tree Genet. Genomes 2016, 12, 1–14. [CrossRef]
40. Xiu, W.Y.; Zhu, Y.; Chen, B.; Hu, Y.; Dawuda, M.M. Effects of paclobutrazol on the physiological characteristics of Malus hallianaKoehne Seedlings under drought stress via principal component analysis and membership function analysis. Arid Land Res.Manag. 2019, 33, 97–113. [CrossRef]
41. Ritchie, S.W.; Nguyen, H.T.; Holaday, A.S. Leaf water content and gas-exchange parameters of two wheat genotypes differing indrought resistance. Crop Sci. 1990, 30, 105–111. [CrossRef]

Plants 2022, 11, 679 17 of 17
42. Schonfeld, M.A.; Johnson, R.C.; Carver, B.F.; Mornhinweg, D.W. Water relations in winter wheat as drought resistance indicators.Crop Sci. 1988, 28, 526–531. [CrossRef]
43. Du, Y.; Zhao, Q.; Chen, L.; Yao, X.; Zhang, W.; Zhang, B.; Xie, F. Effect of drought stress on sugar metabolism in leaves and rootsof soybean seedlings. Plant Physiol. Biochem. 2020, 146, 1–12. [CrossRef] [PubMed]
44. Upreti, P.; Narayan, S.; Khan, F.; Tewari, L.M.; Shirke, P.A. Drought-induced responses on physiological performance in clusterbean [Cyamopsis tetragonoloba (L.) Taub.]. Plant Physiol. Rep. 2021, 26, 49–63. [CrossRef]
45. Xiong, L.; Zhu, J.K. Molecular and genetic aspects of plant responses to osmotic stress. Plant Cell Environ. 2002, 25, 131–139.[CrossRef]
46. Gao, S.; Wang, Y.; Yu, S.; Huang, Y.; Liu, H.; Chen, W.; He, X. Effects of drought stress on growth, physiology and secondarymetabolites of two adonis species in Northeast China. Sci. Hortic. 2020, 259, 108795. [CrossRef]
47. Cheng, L.; Han, M.; Yang, L.M.; Yang, L.; Sun, Z.; Zhang, T. Changes in the physiological characteristics and baicalin biosynthesismetabolism of Scutellaria baicalensis Georgi under drought stress. Ind. Crops Prod. 2018, 122, 473–482. [CrossRef]
48. Okunlola, G.O.; Olatunji, O.A.; Akinwale, R.O.; Tariq, A.; Adelusi, A.A. Physiological response of the three most cultivatedpepper species (Capsicum spp.) in Africa to drought stress imposed at three stages of growth and development. Sci. Hortic. 2017,224, 198–205. [CrossRef]
49. Quan, R.; Shang, M.; Zhang, H.; Zhao, Y.; Zhang, J. Engineering of enhanced glycine betaine synthesis improves drought tolerancein maize. Plant Biotechnol. J. 2004, 2, 477–486. [CrossRef]
50. Räsänen, L.A.; Saijets, S.; Jokinen, K.; Lindström, K. Evaluation of the roles of two compatible solutes, glycine betaine andtrehalose, for the Acacia Senegal-Sinorhizobium symbiosis exposed to drought stress. Plant Soil 2004, 260, 237–251. [CrossRef]
51. Zhang, X.; Lei, L.; Lai, J.; Zhao, H.; Song, W. Effects of drought stress and water recovery on physiological responses and geneexpression in maize seedlings. BMC Plant Biol. 2018, 18, 1–16. [CrossRef] [PubMed]
52. Shawon, R.A.; Kang, B.S.; Lee, S.G.; Kim, S.K.; Lee, H.J.; Katrich, E.; Gorinstein, S.; Ku, Y.G. Influence of drought stress onbioactive compounds, antioxidant enzymes and glucosinolate contents of Chinese cabbage (Brassica rapa). Food Chem. 2020, 308,125657. [CrossRef] [PubMed]
53. Leng, X.; Xue, L.; Wang, J.; Li, S.; Yang, Z.; Ren, H.; Yao, X.; Wu, Z.; Li, J. Physiological responses of Handeliodendron bodinieri(Levl.) Rehd. to exogenous calcium supply under drought stress. Forests 2020, 11, 69. [CrossRef]
54. Denaxa, N.; Damvakaris, T.; Roussos, P.A. Antioxidant defense system in young olive plants against drought stress and mitigationof adverse effects through external application of alleviating products. Sci. Hortic. 2020, 259, 108812. [CrossRef]
55. Xiong, C.; Zhao, S.; Yu, X.; Sun, Y.; Li, H.; Ruan, C.; Li, J. Yellowhorn drought-induced transcription factor XsWRKY20 acts as apositive regulator in drought stress through ROS homeostasis and ABA signaling pathway. Plant Physiol. Biochem. 2020, 155,187–195. [CrossRef]
56. Fang, Y.; Xiong, L. General mechanisms of drought response and their application in drought resistance improvement in plants.Cell. Mol. Life Sci. 2015, 72, 673–689. [CrossRef]
57. Sapes, G.; Sala, A. Relative water content consistently predicts drought mortality risk in seedling populations with differentmorphology, physiology and times to death. Plant Cell Environ. 2021, 44, 3322–3335. [CrossRef]