Effects of chromium picolinate on glycemic control and kidney of the obese Zucker rat
11
BioMed Central Page 1 of 11 (page number not for citation purposes) Nutrition & Metabolism Open Access Research Effects of chromium picolinate on glycemic control and kidney of the obese Zucker rat Mahmood S Mozaffari* 1 , Rafik AbdelSayed 2 , Jun Yao Liu 1 , Hereward Wimborne 1 , Azza El-Remessy 3 and Ahmed El-Marakby 1 Address: 1 Department of Oral Biology, School of Dentistry, Medical College of Georgia Augusta, Georgia 30912, USA, 2 Department of Oral Health and Diagnostic Sciences, School of Dentistry, Medical College of Georgia, Augusta, Georgia 30912, USA and 3 Clinical and Experimental Therapeutics, College of Pharmacy, University of Georgia, Augusta GA 30912, USA Email: Mahmood S Mozaffari* - [email protected]; Rafik AbdelSayed - [email protected]; Jun Yao Liu - [email protected]; Hereward Wimborne - [email protected]; Azza El-Remessy - [email protected]; Ahmed El- Marakby - [email protected] * Corresponding author Abstract Background: Chromium picolinate (Cr(pic)3) is advocated as adjuvant therapy for impaired glycemic control, despite concerns for DNA damage. Potential toxicity of Cr(pic)3 should be greater for the kidney that accumulates chromium. Therefore, we tested the hypothesis that Cr(pic)3 treatment of obese Zucker rats (OZR) exacerbates renal abnormalities associated with dysglycemia. Methods: Male OZR were treated with diets lacking or containing 5 and 10 mg/kg of chromium, as Cr(pic)3, for 20 weeks; lean Zucker rats (LZR) served as controls. Glycemic and renal effects of Cr(pic)3 were determined in the context of indices of oxidative stress and inflammation. Results: The OZR displayed increased fasting plasma glucose and insulin in association with enlarged pancreatic islets exhibiting collagen and periodic acid Schiff-positive deposits compared to LZR; Cr(pic)3 treatment did not affect these parameters. The OZR, irrespective of Cr(pic)3, excreted more albumin than LZR. Also, other indices of renal function or histopathology were not affected by Cr(pic)3 treatment. Urinary excretion of 8-hydroxydeoxyguanosine (8-OHdG), an index of oxidative DNA damage, was greater in the OZR than LZR; dietary Cr(pic)3 treatment attenuated 8-OHdG excretion. However, immunostaining of kidney for 8-OHdG revealed similar staining pattern and intensity, despite significant renal accumulation of chromium in Cr(pic)3- treated groups. Finally, increased renal nitrotyrosine and cyclooxygenase-2 levels and urinary excretion of monocyte chemoattractant protein-1 of OZR were partially reversed by Cr(pic)3 treatment. Conclusion: Dietary Cr(pic)3 treatment of OZR does not beneficially influence glycemic status or increase the risk for oxidative DNA damage; rather, the treatment attenuates indices of oxidative stress and inflammation. Published: 10 December 2009 Nutrition & Metabolism 2009, 6:51 doi:10.1186/1743-7075-6-51 Received: 12 October 2009 Accepted: 10 December 2009 This article is available from: http://www.nutritionandmetabolism.com/content/6/1/51 © 2009 Mozaffari et al; licensee BioMed Central Ltd. This is an Open Access article distributed under the terms of the Creative Commons Attribution License (http://creativecommons.org/licenses/by/2.0 ), which permits unrestricted use, distribution, and reproduction in any medium, provided the original work is properly cited.
-
Upload
independent -
Category
Documents
-
view
3 -
download
0
Transcript of Effects of chromium picolinate on glycemic control and kidney of the obese Zucker rat

BioMed CentralNutrition & Metabolism
ss
Open AcceResearchEffects of chromium picolinate on glycemic control and kidney of the obese Zucker ratMahmood S Mozaffari*1, Rafik AbdelSayed2, Jun Yao Liu1, Hereward Wimborne1, Azza El-Remessy3 and Ahmed El-Marakby1Address: 1Department of Oral Biology, School of Dentistry, Medical College of Georgia Augusta, Georgia 30912, USA, 2Department of Oral Health and Diagnostic Sciences, School of Dentistry, Medical College of Georgia, Augusta, Georgia 30912, USA and 3Clinical and Experimental Therapeutics, College of Pharmacy, University of Georgia, Augusta GA 30912, USA
Email: Mahmood S Mozaffari* - [email protected]; Rafik AbdelSayed - [email protected]; Jun Yao Liu - [email protected]; Hereward Wimborne - [email protected]; Azza El-Remessy - [email protected]; Ahmed El-Marakby - [email protected]
* Corresponding author
AbstractBackground: Chromium picolinate (Cr(pic)3) is advocated as adjuvant therapy for impairedglycemic control, despite concerns for DNA damage. Potential toxicity of Cr(pic)3 should begreater for the kidney that accumulates chromium. Therefore, we tested the hypothesis thatCr(pic)3 treatment of obese Zucker rats (OZR) exacerbates renal abnormalities associated withdysglycemia.
Methods: Male OZR were treated with diets lacking or containing 5 and 10 mg/kg of chromium,as Cr(pic)3, for 20 weeks; lean Zucker rats (LZR) served as controls. Glycemic and renal effects ofCr(pic)3 were determined in the context of indices of oxidative stress and inflammation.
Results: The OZR displayed increased fasting plasma glucose and insulin in association withenlarged pancreatic islets exhibiting collagen and periodic acid Schiff-positive deposits compared toLZR; Cr(pic)3 treatment did not affect these parameters. The OZR, irrespective of Cr(pic)3,excreted more albumin than LZR. Also, other indices of renal function or histopathology were notaffected by Cr(pic)3 treatment. Urinary excretion of 8-hydroxydeoxyguanosine (8-OHdG), anindex of oxidative DNA damage, was greater in the OZR than LZR; dietary Cr(pic)3 treatmentattenuated 8-OHdG excretion. However, immunostaining of kidney for 8-OHdG revealed similarstaining pattern and intensity, despite significant renal accumulation of chromium in Cr(pic)3-treated groups. Finally, increased renal nitrotyrosine and cyclooxygenase-2 levels and urinaryexcretion of monocyte chemoattractant protein-1 of OZR were partially reversed by Cr(pic)3treatment.
Conclusion: Dietary Cr(pic)3 treatment of OZR does not beneficially influence glycemic status orincrease the risk for oxidative DNA damage; rather, the treatment attenuates indices of oxidativestress and inflammation.
Published: 10 December 2009
Nutrition & Metabolism 2009, 6:51 doi:10.1186/1743-7075-6-51
Received: 12 October 2009Accepted: 10 December 2009
This article is available from: http://www.nutritionandmetabolism.com/content/6/1/51
© 2009 Mozaffari et al; licensee BioMed Central Ltd. This is an Open Access article distributed under the terms of the Creative Commons Attribution License (http://creativecommons.org/licenses/by/2.0), which permits unrestricted use, distribution, and reproduction in any medium, provided the original work is properly cited.
Page 1 of 11(page number not for citation purposes)

Nutrition & Metabolism 2009, 6:51 http://www.nutritionandmetabolism.com/content/6/1/51
IntroductionThe worldwide epidemic of obesity is a major predispos-ing factor for the ever increasing prevalence and incidenceof glucose intolerance and type 2 diabetes [1,2]. In turn,obesity and impaired glucose tolerance/type 2 diabetesmarkedly increase the risk for development of renal andcardiovascular complications [3,4]. Further, obesity isknown as a pro-inflammatory state thereby contributingimportantly to eventual target organ manifestations andassociated morbidity and mortality [5,6].
Of various animal models of obesity and type 2 diabetesmellitus, the obese Zucker rats (OZR) have been usedextensively for studies focused on consequences of the dis-ease and the contributing mechanisms. The OZR have anautosomal recessive mutation of the fa gene encoding theleptin receptor. The OZR display marked obesity, dyslipi-demia, severe insulin resistance, increased oxidative stressand a proinflammatory state compared to the lean Zuckerrats (LZR) [7-9]. Thus, the OZR can serve as a useful ani-mal model for determination of potential influences oftherapies aimed at prevention or attenuation of obesity/type 2 diabetes-related abnormalities.
The nutritional supplement, chromium picolinate(Cr(pic)3), contains trivalent chromium which is chelatedto three picolinic acid molecules to increase its bioavaila-bility compared to non-chelated forms (e.g., chromiumchloride). It is widely used because of claims that it exertsantidiabetic and weight-reduction effects [10-12].Improvement in glycemic status, in turn, should reduceoxidative stress and the proinflammatory conditions asso-ciated with obesity/type 2 diabetes thereby amelioratingtarget organ complications such as nephropathy. On theother hand, other studies have raised concerns regardingthe safety of Cr(pic)3 as they indicate that the formulationincreases the risk for DNA damage [13-16]. If indeed theformulation exerts adverse effects in vivo, its potential tox-icity would be expected to be more prominent for the kid-ney which serves not only as its major route ofelimination but also accumulates chromium [17-19].Thus, long-term effects of the formulation need to beestablished utilizing animal models of the disease forwhich its use is advocated. Therefore, we tested thehypothesis that, despite improvement in glycemic status,chronic treatment of OZR with Cr(pic)3 causes significantrenal accumulation of chromium with adverse conse-quences for kidney function and structure. Accordingly,renal effects of the chromium formulation were deter-mined in the context of indices of oxidative stress (e.g., tis-sue nitrotyrosine), inflammation (e.g., urinary excretionof monocyte chemoattractant protein-1 (MCP-1), renalexpression of cyclooxygenase-2 and tissue CD68 positivehistiocytes) and oxidative DNA damage (e.g., urinary
excretion and tissue 8-hydroxydeoxyguanosine (8-OHdG)).
Methods and materialsMale obese and lean Zucker rats (OZR and LZR, respec-tively) were obtained form Harlan Laboratories at about 6weeks of age. The animals were housed in the laboratoryanimal facilities at the Medical College of Georgia that arecontrolled for humidity (60% ± 5%), temperature (24° ±1°C) and light cycle (6 AM to 6 PM). Two days afterarrival, the OZR were randomly assigned to either remainon the regular rodent diet (Harlan Teklad diet number8604) or switched to the 8604-based diet that was supple-mented with 5 or 10 mg/kg of chromium as Cr(pic)3 (i.e.,OZR; 5 Cr and OZR; 10 Cr, respectively; Harlan Tekladdiet numbers 07602 and 07603, respectively; n = 10 ani-mals per group); LZR (n = 10) were provided with the8604 diet (without supplemental chromium). Oneuntreated OZR and one OZR; 5 Cr died before terminalmeasurements at about 26 weeks of age. Unless otherwisespecified, the animals had free access to food and waterthroughout the studies. Based on measurement of foodintake, the 5 and 10 mg/kg chromium diets providedchromium at doses of 0.19 ± 0.02 and 0.41 ± 0.02 mg/kg/day (or 1.58 ± 0.16 and 3.29 ± 0.12 mg/kg/day ofCr(pic)3, respectively); the chromium intake in this studyis similar to other studies utilizing rodents [20-22]. Theuse of animals for these studies conformed to the institu-tional guidelines for the care and use of laboratory ani-mals.
At about 26 weeks of age, tail-cuff hemodynamics weremeasured and two consecutive 24-hour urine samples col-lected from each animal; urine samples were used fordetermination of urinary electrolytes, albumin, 8-OHdGand MCP-1 excretions. Further, hemoglobin A1c levelswere measured using a drop of blood from the tail (BayerHealthCare - Diabetes Care, Sunnyvale, California). Fordetermination of plasma glucose and insulin concentra-tions, the animals were fasted overnight and blood sam-ples were obtained from the tail. Plasma glucoseconcentration was measured using a Beckman glucoseanalyzer. On the other hand, plasma insulin concentra-tion was measured using an insulin 125I radioimmu-noassay Kit (MP Biomedicals, LLC; Solon, OH). The datawere used to calculate the insulin resistance HomeostaticModel Assessment (HOMA) index as follows: (FPI ×FPG)/22.5 where FPI and FPG denote fasting plasma insu-lin (μU/ml) and fasting plasma glucose (mmol/l), respec-tively [23].
After collection of metabolic data and measurement ofsystemic hemodynamics, the animals were anesthetizedwith sodium pentobarbital (45-50 mg/kg; i.p.) and renaltissue procured for histopathological (i.e., 10% formalin-
Page 2 of 11(page number not for citation purposes)

Nutrition & Metabolism 2009, 6:51 http://www.nutritionandmetabolism.com/content/6/1/51
fixed), Western and slot blot analyses (frozen in liquidnitrogen) and chromium measurement (air-dried). Also,the pancreas was fixed in buffered formalin for his-topathological examination.
Formalin-fixed and paraffin-embedded tissue (i.e., kidneyor pancreas) blocks were cut in 5 μm sections followed bystaining (e.g., hematoxylin-eosin (H&E), Masson Tri-chrome or periodic acid Schiff (PAS)); frozen sectionswere used for Oil-Red-O staining [8]. Immunohistochem-ical staining was carried out utilizing mouse anti- 8-OHdG primary antibody (Oxis Research, Foster City, CA)and biotinylated goat anti-mouse secondary antibody(Vector Labs, Burlingame CA).
Western and slot blot analysisTo determine renal cyclooxygenase-2 (COX-2) and nitro-tyrosine levels, frozen renal tissue was pulverized andadded to the isolation buffer (10 mM triethanolamine,250 mM sucrose, PH 7.6, 1 μg/ml leupeptin, PMSF (2 mg/ml), sonicated and sodium dodecyl sulfate added to afinal concentration of 1% prior to centrifugation; thesupernatant was used for protein assay (Biorad proteinassay DC kit). Standard protocols were used for Westernblot analysis as described previously (i.e., 10% gels, elec-trophoretic protein transfer to nitrocellulose membrane,rabbit anti-COX-2 polyclonal antibody (Cayman, AnnArbor, Michigan), secondary antibody (goat anti-rabbitIgG, Cell Signaling, Danvers, MA) and detection byenhanced chemiluminescence) [24,25]. Slot-blot analysiswas used to measure the nitrative stress marker: nitrotyro-sine. As described previously [26], samples were immobi-lized onto a nitrocellulose membrane using Slot Blotapparatus (BioRad). After blocking, membranes werereacted with antibodies against nitrotyrosine (Calbio-chem), followed by determination of optical density. TheCOX-2 and nitrotyrosine data were corrected for β-actinand expressed as percent of the LZR group.
AssaysUrinarysodium and potassium were measured (Easy Elec-trolytes, Medica Corporations, Bedford, MA) and used tocalculate excretion rates. Urine osmolality was measuredby an osmometer. Urinary albumin excretion was meas-ured using the Nephrat ELISA kit (Exocell, Philadelphia,PA). Urinary and plasma creatinine were measured (Cay-man Chemicals and Biovision, respectively) and used tocalculate creatinine clearance rate (an index of the glomer-ular filtration rate). Urinary excretions of 8-OHdG andMCP-1 were measured using ELISA kits [(Northwest LifeScience Specialties, LLC; Vancouver, WA) and (BD Bio-science, San Jose, CA), respectively]. All parameters weredetermined on two consecutive 24 hour urine samplesand average values recorded for each animal. Analysis ofkidney chromium content was carried out by the Wiscon-
sin State Laboratory of Hygiene using Inductively Cou-pled Plasma Mass Spectrometry (ICP-MS) technology.
StatisticsAll data were analyzed by the analysis of variance(ANOVA). Duncan's post hoc test was used for compari-son of mean values (significance of criteria of p < 0.05).Data are reported as means ± SEM.
ResultsPhysical featuresAll rats displayed significant increase in body weight dur-ing the course of the study although the OZR, irrespectiveof Cr(pic)3 treatment, gained significantly more weightthan their lean controls (Figure 1A). As an index of skele-tal growth, the length of femur and tibia were measured inexperimental groups. While obesity was associated withslight reductions in the length of both the tibia and thefemur, Cr(pic)3 treatment, per se, did not influence theseparameters (Table 1). Kidney weight was greater in theOZR, irrespective of dietary chromium treatment, thanLZR; however, kidney to body weight ratio was similaramong the groups (Table 1). Further, systolic blood pres-sure, diastolic blood pressure and mean arterial pressurewere similar among the groups (Figure 1B). Also, no dif-ferences were noted in heart rates among the groups (aver-age of 462-485 beats/min).
Glycemic statusThe OZR displayed greater fasting plasma glucose (about30%) and plasma insulin (about 400%) concentrationscompared to their lean controls (Table 1). As a result, theHOMA insulin-resistance index was markedly elevated inthe OZR, irrespective of Cr(pic)3 treatment, than LZR(Table 1). On the other hand, hemoglobin A1c levels weresimilar among the four experimental groups (Table 1).Microscopic examination of LZR pancreas revealed well-preserved pancreatic exocrine lobules consisting ofpacked acinar units which are interspersed by sharply-demarcated, small islets of Langerhans (Figure 2, panelA). Cytologic and nuclear details were bland and uniformin shape, size and staining characteristics. Microscopicexamination of pancreas for OZR, OZR; 5 Cr and OZR; 10Cr groups revealed enlarged, hyperplastic islets of Langer-hans (of varying sizes) exhibiting benign cellular prolifer-ation which resulted in irregular and "jagged" peripheraloutline (Figure 2, panels B-D). The islet cellular elementswere separated by variable aggregates of extracellulardeposits; however, the sizes or cytologic and nucleardetails of pancreatic islets were generally similar amongthe three groups of OZR. As shown in Figure 2, while therewas minimal staining of the LZR pancreas for PAS (panelE), those of OZR groups (panels F-H), irrespective ofCr(pic)3 treatment showed prominent patchy areas ofPAS-positive material. Similarly, trichrome-stained tissue
Page 3 of 11(page number not for citation purposes)
Nutrition & Metabolism 2009, 6:51 http://www.nutritionandmetabolism.com/content/6/1/51
sections from LZR group revealed uniform well-preserved,small collagen-free pancreatic islets (Panel 2, panel I). Onthe other hand, Trichrome-stained tissue sections fromOZR, OZR; 5 Cr and OZR; 10 Cr groups revealed promi-nent (and generally similar) intercellular deposits of col-lagen fibers confined within hyperplastic pancreatic islets(Figure 2, panels J-L). These histopathological findings areconsistent with the interpretation of islet hyperplasia withinterstitial fibrosis.
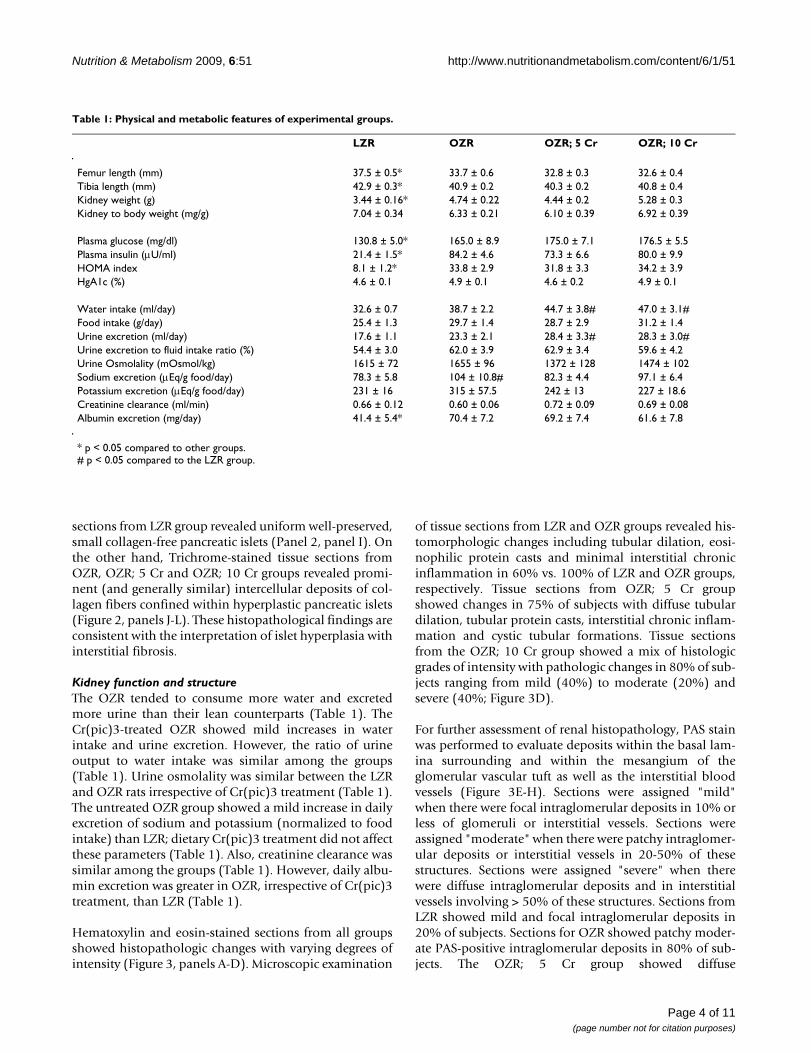
Kidney function and structureThe OZR tended to consume more water and excretedmore urine than their lean counterparts (Table 1). TheCr(pic)3-treated OZR showed mild increases in waterintake and urine excretion. However, the ratio of urineoutput to water intake was similar among the groups(Table 1). Urine osmolality was similar between the LZRand OZR rats irrespective of Cr(pic)3 treatment (Table 1).The untreated OZR group showed a mild increase in dailyexcretion of sodium and potassium (normalized to foodintake) than LZR; dietary Cr(pic)3 treatment did not affectthese parameters (Table 1). Also, creatinine clearance wassimilar among the groups (Table 1). However, daily albu-min excretion was greater in OZR, irrespective of Cr(pic)3treatment, than LZR (Table 1).
Hematoxylin and eosin-stained sections from all groupsshowed histopathologic changes with varying degrees ofintensity (Figure 3, panels A-D). Microscopic examination
of tissue sections from LZR and OZR groups revealed his-tomorphologic changes including tubular dilation, eosi-nophilic protein casts and minimal interstitial chronicinflammation in 60% vs. 100% of LZR and OZR groups,respectively. Tissue sections from OZR; 5 Cr groupshowed changes in 75% of subjects with diffuse tubulardilation, tubular protein casts, interstitial chronic inflam-mation and cystic tubular formations. Tissue sectionsfrom the OZR; 10 Cr group showed a mix of histologicgrades of intensity with pathologic changes in 80% of sub-jects ranging from mild (40%) to moderate (20%) andsevere (40%; Figure 3D).
For further assessment of renal histopathology, PAS stainwas performed to evaluate deposits within the basal lam-ina surrounding and within the mesangium of theglomerular vascular tuft as well as the interstitial bloodvessels (Figure 3E-H). Sections were assigned "mild"when there were focal intraglomerular deposits in 10% orless of glomeruli or interstitial vessels. Sections wereassigned "moderate" when there were patchy intraglomer-ular deposits or interstitial vessels in 20-50% of thesestructures. Sections were assigned "severe" when therewere diffuse intraglomerular deposits and in interstitialvessels involving > 50% of these structures. Sections fromLZR showed mild and focal intraglomerular deposits in20% of subjects. Sections for OZR showed patchy moder-ate PAS-positive intraglomerular deposits in 80% of sub-jects. The OZR; 5 Cr group showed diffuse
Table 1: Physical and metabolic features of experimental groups.
LZR OZR OZR; 5 Cr OZR; 10 Cr
Femur length (mm) 37.5 ± 0.5* 33.7 ± 0.6 32.8 ± 0.3 32.6 ± 0.4Tibia length (mm) 42.9 ± 0.3* 40.9 ± 0.2 40.3 ± 0.2 40.8 ± 0.4Kidney weight (g) 3.44 ± 0.16* 4.74 ± 0.22 4.44 ± 0.2 5.28 ± 0.3Kidney to body weight (mg/g) 7.04 ± 0.34 6.33 ± 0.21 6.10 ± 0.39 6.92 ± 0.39
Plasma glucose (mg/dl) 130.8 ± 5.0* 165.0 ± 8.9 175.0 ± 7.1 176.5 ± 5.5Plasma insulin (μU/ml) 21.4 ± 1.5* 84.2 ± 4.6 73.3 ± 6.6 80.0 ± 9.9HOMA index 8.1 ± 1.2* 33.8 ± 2.9 31.8 ± 3.3 34.2 ± 3.9HgA1c (%) 4.6 ± 0.1 4.9 ± 0.1 4.6 ± 0.2 4.9 ± 0.1
Water intake (ml/day) 32.6 ± 0.7 38.7 ± 2.2 44.7 ± 3.8# 47.0 ± 3.1#Food intake (g/day) 25.4 ± 1.3 29.7 ± 1.4 28.7 ± 2.9 31.2 ± 1.4Urine excretion (ml/day) 17.6 ± 1.1 23.3 ± 2.1 28.4 ± 3.3# 28.3 ± 3.0#Urine excretion to fluid intake ratio (%) 54.4 ± 3.0 62.0 ± 3.9 62.9 ± 3.4 59.6 ± 4.2Urine Osmolality (mOsmol/kg) 1615 ± 72 1655 ± 96 1372 ± 128 1474 ± 102Sodium excretion (μEq/g food/day) 78.3 ± 5.8 104 ± 10.8# 82.3 ± 4.4 97.1 ± 6.4Potassium excretion (μEq/g food/day) 231 ± 16 315 ± 57.5 242 ± 13 227 ± 18.6Creatinine clearance (ml/min) 0.66 ± 0.12 0.60 ± 0.06 0.72 ± 0.09 0.69 ± 0.08Albumin excretion (mg/day) 41.4 ± 5.4* 70.4 ± 7.2 69.2 ± 7.4 61.6 ± 7.8
* p < 0.05 compared to other groups.# p < 0.05 compared to the LZR group.
Page 4 of 11(page number not for citation purposes)

Nutrition & Metabolism 2009, 6:51 http://www.nutritionandmetabolism.com/content/6/1/51
intraglomerular PAS-positive deposits in 70% of subjectswhile the OZR; 10 Cr group showed mild and patchy int-raglomerular PAS-positive deposits in 75% of subjects.
We next performed Masson's trichrome stain on renal tis-sue to help highlight glomerular or interstitial fibrosis.Tissue sections from LZR and OZR groups did not showtrichrome-positive fibrotic changes. However, 60% of kid-neys from the OZR; 5 Cr group and 80% of subjects fromthe OZR;10 group showed few scattered patchy foci ofinterstitial fibrosis (data not shown).
Oil-Red-O stain was performed to help reveal cellular fatdeposits. All groups showed the presence of fat droplets;however, fat droplets were more numerous in theuntreated OZR group (Figure 3I-L, arrows).
Indices of nitrosative/oxidative stress and inflammationTissue nitrotyrosine is considered as a stable footprint ofoxidative stress. As shown in Figure 4, kidneys of OZR dis-played greater accumulation of nitrotyrosine than those ofthe LZR; chronic Cr(pic)3 treatment was associated withattenuation of renal tissue nitrotyrosine levels therebyeliminating a significant differential in comparison to theLZR (Figure 4).
In order to determine whether chronic Cr(pic)3 treatmentincreases whole body oxidative DNA damage, urinaryexcretion of 8-OHdG was measured in the experimentalgroups. As shown in Figure 5, the untreated OZR dis-played greater urinary 8-OHdG excretion. The treatmentwas associated with a decline in urinary 8-OHdG excre-tion towards that of the LZR. Interestingly, however,immunostaining of renal tissue for 8-OHdG did notreveal differences in either the (nuclear) pattern or inten-sity of staining among experimental groups (Figure 6A-D); similar findings were noted for the pancreas (Figure2M-P).
As indices of inflammation, urinary excretion of MCP-1,immunostaining for tissue histiocytes (i.e., CD68 positivecells) and renal tissue level of COX-2 were determined. Asshown in Figure 7, urinary excretion of MCP-1 was signif-icantly higher in the OZR than LZR; Cr(pic)3 treatmentwas associated with attenuation of urinary MCP-1 excre-tion thereby eliminating the significant differential withrespect to the LZR group. Examination of renal tissues forLZR group did not identify CD68 positive cells whilethose of the OZR, irrespective of Cr(pic)3 treatmentshowed generally similar foci of multiple CD68 positivecells (Figure 6E-H). Similarly, renal expression of COX-2was increased in the OZR than LZR; the higher Cr(pic)3diet was associated with reduction in COX-2 level towardsthat of the LZR group (Figure 8).
Chromium is known to accumulate in tissues includingthe kidney. Therefore, to determine whether the OZR kid-ney also accumulates chromium, renal tissue chromiumcontent was measured by ICP-MS. As shown in Figure 9,renal tissue chromium content tended to be lower in theOZR than LZR, an aspect that may relate to the require-ment of cellular uptake of chromium for normal insulinsignaling [27]. As expected, dietary Cr(pic)3 treatmentresulted in a dose-related accumulation of chromium inthe OZR kidneys (Figure 9).
DiscussionThe present study shows that long-term Cr(pic)3 treat-ment does not influence abnormal glycemic status orindices of growth of OZR. Further, the treatment is notassociated with exacerbated oxidative DNA damage.Rather, the treatment exerts mild-moderate beneficial
Body weight and blood pressureFigure 1Body weight and blood pressure. Panel A shows time-course of changes in body weight while panel B shows blood pressure of lean Zucker rats (LZR), untreated obese Zucker rats (OZR) and OZR treated with diets containing 5 and 10 mg/kg of chromium as Cr(pic)3 (i.e., OZR; 5 Cr and OZR; 10 Cr, respectively). The treatments were initiated at 6 weeks of age (i.e., time 0). Data are means ± SEM of 9-10 animals/group. * p < 0.05 compared to the other groups at the same time point.
Page 5 of 11(page number not for citation purposes)

Nutrition & Metabolism 2009, 6:51 http://www.nutritionandmetabolism.com/content/6/1/51
effects on several markers of oxidative stress and inflam-mation in OZR.
The interest in chromium supplementation stems fromearlier studies that suggested an essential role for trivalentchromium in carbohydrate and lipid metabolism[10,17,28]. These studies showed that rats consuming adiet lacking chromium developed an inability to effi-ciently dispose of blood glucose [17,10]. This defect wasreversed by addition of chromium-enriched food or bysupplementation with synthetic trivalent chromium. Sub-sequent observation that patients on total parenteralnutrition also develop a deficit in carbohydrate metabo-lism, which can be alleviated with trivalent chromium,
established the essential role of trivalent chromium inhuman diet as well [17,10]. Although the exact molecularevents subserving the effect of chromium on glucosemetabolism remain to be established, a number of mech-anisms have been proposed that collectively lead toamplification of insulin signaling (e.g., increased insulinreceptor binding but inhibition of insulin receptor tyro-sine phosphatase) [28,29]. In light of these reports, wehad expected that long-term Cr(pic)3 treatment of OZRwould improve insulin resistance. Surprisingly, however,the treatment did not beneficially influence several indi-ces of glycemic control or the marked histopathologicalfeatures of pancreatic islets in OZR. Nonetheless, theresults are consistent with a recent report indicating that
Pancreas histopathologyFigure 2Pancreas histopathology. Panels show representative H&E-stained sections (A-D; 100×), PAS-stained sections (E-H; 200×) and trichrome-stained section (I-L; 200×) of pancreas from experimental groups as described in Figure 1. Also shown is the immunohistochemical localization of 8-OHdG in pancreas of experimental groups (Panels M-P, 200×)
Page 6 of 11(page number not for citation purposes)

Nutrition & Metabolism 2009, 6:51 http://www.nutritionandmetabolism.com/content/6/1/51
Cr(pic)3, at a dose of 1000 μg/day, does not improveinsulin sensitivity or several other features of metabolicsyndrome in obese adults [30]. Human studies have typi-cally used chromium at a dose of 200-1000 μg/kg [29-31].Assuming an average body weight of 70 kg, this corre-sponds to a range of about 3-14 μg/kg of chromium sup-plementation. Animal studies, on the other hand, haveused dosages similar to (and even far higher than) theones used in this study (about 190 to 410 μg/kg/day forOZR; 5 Cr and OZR; 10 Cr groups, respectively)[22,29,31]. Thus, it is likely that far higher doses of theformulation would be required to unmask a beneficialeffect on glycemic control in the setting of marked insulinresistance as it occurs in OZR. Nonetheless, the resultsraise question about the efficacy of Cr(pic)3, alone, indoses that are commonly consumed by human subjectsalthough the possibility that such doses may exert addi-tive or synergistic effects with physical exercise and/or
other interventional modalities remains to be explored.This notion is consistent with a report indicating thatCr(pic)3 supplementation increases insulin sensitivityand improves glycemic status of type 2 diabetic patientswho are on sulfonylurea agents [32].
It is well-established that abnormal glycemic state of obes-ity and diabetes mellitus are associated with increased oxi-dative stress and subsequent oxidative DNA damage [3];indeed, generation of 8-OHdG is considered as a surro-gate marker of enhanced oxidative stress and associatedoxidative DNA damage [33]. Thus, we conjectured thatCr(pic)3-induced improvement in glycemic controlshould reduce 8-OHdG production. On the other hand, ifindeed Cr(pic)3 treatment increases oxidative DNA dam-age, then the treatment should further increase 8-OHdGgeneration in the setting of increased oxidative and nitro-sative stress that are features of OZR [7]. Consistent with
Kidney histopathologyFigure 3Kidney histopathology. Panels A-D show representative H&E-stained while panels E-H show representative PAS-stained kidney sections from experimental groups as described in Figure 1 (100× and 200×, respectively). Also shown are representa-tive panels for Oil-Red-O stained renal tissue from experimental groups (panels I-L, 200×; arrows point to lipid droplets).
Page 7 of 11(page number not for citation purposes)

Nutrition & Metabolism 2009, 6:51 http://www.nutritionandmetabolism.com/content/6/1/51
this notion, urinary excretion of 8-OHdG was signifi-cantly higher in the OZR than LZR, suggesting an increasein whole body oxidative stress. On the other hand, renaltissue nitrotyrosine level was increased in kidneys of OZRthan LZR reflecting an increase in local oxidative/nitrosa-tive stress. Interestingly, however, Cr(pic)3 treatment didnot increase either urinary excretion of 8-OHdG or renaltissue nitrotyrosine content. Rather, the treatment wasassociated with mild reductions in both parameters thatwere sufficient enough to abrogate statistical significancecompared to the LZR group. Interestingly, the reductionsin 8-OHdG excretion and tissue nitrotyrosine level werenot associated with any improvement in glycemic status
of OZR. In this context, Chander and colleagues [7] haveshown that treatment of OZR with ebselen (an antioxi-dant and peroxynitrite scavenger) reduces lipid peroxida-tive products and 3-nitrotyrosine-modified proteinswithout affecting blood glucose.
Since urinary excretion of 8-OHdG is a surrogate biomar-ker of whole body oxidative DNA damage, we also carriedout immunohistochemical examination of the kidney for8-OHdG. The rationale for this relates to the fact that tri-valent chromium is known to accumulate in a number oforgans although the kidney accumulates it to a greaterextent [17-19]. Indeed, as shown in Figure 9, Cr(pic)3-enriched diets caused significant increases in kidney chro-mium content of the OZR. Thus, we conjectured that anyadverse effect of Cr(pic)3 treatment on oxidative DNAdamage should be more readily detected in the kidney.Interestingly, however, immunostaining of renal tissuedid not reveal differential patterns or intensity among theexperimental groups; similar findings were noted for thepancreas. These observations coupled with the demon-stration that urinary excretion of 8-OHdG increases inconditions associated with oxidative stress suggest that themodified nucleoside is largely released rather than beingaccumulated in the tissue(s). Nonetheless, immunostain-ing findings and urinary excretion profile of 8-OHdG donot support the notion that Cr(pic)3 enhances oxidativeDNA damage in OZR. As indicated earlier, a major con-cern regarding Cr(pic)3 relates to reports of increased riskof genotoxicity associated with its use [13-16]. Genotoxic-ity of trivalent chromium has been shown in acellular sys-tems where direct interaction occurs with the geneticmaterial [34,31,15]. However, trivalent chromium com-pounds, including Cr(pic)3, have produced conflictingresults in ex vivo and in vivo studies likely due to multiplereasons including low cellular uptake of trivalent chro-mium and the demonstration that it does not avidly accu-mulate in DNA containing organelles such as the nucleusor the mitochondria [18,19]. The results of this study arein agreement with this notion and the more recent reportsindicating lack of a significant DNA toxicity of Cr(pic)3[20,35].
Consistent with other reports, the OZR displayed anumber of renal abnormalities compared to their leancounterparts including greater albuminuria and his-topathological changes indicative of extracellular matrixdeposits, inflammatory infiltrates and tubulointerestitialinjury. Nonetheless, renal tubular dilatations were notedfor both LZR and OZR thereby suggesting lack of a corre-lation of this abnormality with metabolic derangementsassociated with obesity and (or) type 2 diabetes. It is note-worthy that there were numerous lipid droplets in renaltissue of OZR than LZR; ectopic lipid accumulation isbelieved to contribute importantly to pathophysiology of
Kidney nitrotyrosine contentFigure 4Kidney nitrotyrosine content. Bar graphs show renal tis-sue nitrotyrosine level in experimental groups as described in Figure 1; data are expressed as percent of the LZR group. Also shown are representative blot for each group. Data are means ± SEM of 7-9 animals per group. * p < 0.05 compared to the LZR group.
Urinary excretion of 8-hydroxydeoxyguanosine (8-OHdG) in experimental groups as described in Figure 1Figure 5Urinary excretion of 8-hydroxydeoxyguanosine (8-OHdG) in experimental groups as described in Fig-ure 1. Data are means ± SEM of 9-10 animals/group. * p < 0.05 compared to the LZR or OZR;10 Cr groups.
Page 8 of 11(page number not for citation purposes)

Nutrition & Metabolism 2009, 6:51 http://www.nutritionandmetabolism.com/content/6/1/51
organ dysfunction in obesity/type 2 diabetes (i.e., lipotox-icity) [36]. More importantly, however, it is suggested thatrelease of autocrine and paracrine factors from periorganfat deposits contributes importantly to the pathogenesisof cardiac abnormalities in animals with dietary fat-induced obesity [37]. Indeed, OZR display marked depos-its of fat around the kidney, effectively encasing the organ.Nonetheless, the contribution of autocrine and paracrinerelease of factors from adipose tissue surrounding the kid-ney, an encapsulated organ, to eventual manifestation ofrenal pathology in OZR remains to be established. Impor-
tantly, however, Cr(pic)3 treatment did not result in sig-nificant beneficial effects on renal function (e.g.,albuminuria) or histopathological findings of OZR.
The lack of significant effects of Cr(pic)3 on renal functionand structure are seemingly inconsistent with its mild-moderate ameliorating effects on indices of oxidativestress (e.g., tissue nitrotyrosine) and inflammation (e.g.,
Kidney 8-OHdG and CD 68 immunostainingFigure 6Kidney 8-OHdG and CD 68 immunostaining. Panels A-D show representative 8-OHdG-immunostained kidney sections from experimental groups while panels E-H show immunostaining for CD68 positive tissue histiocytes (200× except panel E which is shown at 100×).
Urinary excretion of MCP-1 in experimental groups as described in Figure 1Figure 7Urinary excretion of MCP-1 in experimental groups as described in Figure 1. Data are means ± SEM of 9-10 animals/group. * p < 0.05 compared to LZR group.
Renal expression of cyclooxygensae-2 for experimental groups as described in Figure 1Figure 8Renal expression of cyclooxygensae-2 for experimen-tal groups as described in Figure 1. Data are normalized to β-actin and expressed as percent of the LZR group. Data are means ± SEM of 7-9 animals per group. Also shown is representative blot for each group and its β-actin control. * p < 0.05 compared to the LZR or OZR; 10 Cr groups.
Page 9 of 11(page number not for citation purposes)

Nutrition & Metabolism 2009, 6:51 http://www.nutritionandmetabolism.com/content/6/1/51
urinary MCP-1 excretion and renal tissue COX-2 level).However, it is important to note that multiple mecha-nisms contribute to genesis of proteinuria and renal dys-function associated with obesity and type 2 diabetesincluding metabolic, hemodynamic (both systemic andintrarenal), oxidative stress and a variety of inflammatorycytokines and chemokines [3]. Ultimately, the net effectof these changes results in loss of glomerular membranepermeability barrier and albuminuria. It is noteworthythat systemic hemodynamics and metabolic status of the3 Cr(pic)3-treated OZR groups were generally similarthereby suggestive of similar contribution of these deter-minants to albuminuria. On the other hand, although theparameters that were measured in this study are known tocontribute to genesis of proteinuria, it is likely that themild Cr(pic)3-induced changes in their levels are not suf-ficient to beneficially influence albuminuria. Alterna-tively, Cr(pic)3 in doses that were used in this study maynot be sufficient enough to alter the course and/or extentof proteinuria.
In conclusion, long-term Cr(pic)3 intake in doses thatexceed those consumed by human subjects does not exertbeneficial effects on glycemic control or adversely affectgrowth of OZR. In addition, despite renal accumulation ofchromium, kidney function and structure were generallysimilar among untreated and treated OZR. Importantly,the treatment did not increase either urinary excretion of8-OHdG or its immunohistochemical pattern and inten-sity in the kidney and the pancreas. Rather, Cr(pic)3 treat-ment of OZR was associated with attenuations in indicesof oxidative stress and inflammation thereby diminishingthe differentials with LZR.
Competing interestsThe authors declare that they have no competing interests.
Authors' contributionsMSM is responsible for the design and the overall conductof the study as well as data analysis and preparation of themanuscript. RA carried out histopathological examina-tion of tissue samples. HW and JYL conducted theresearch (75% and 25% effort, respectively). AER pro-vided instructions on slot blot analysis and AEM meas-ured urinary MCP-1. The authors thank Noel Stanton ofthe Wisconsin State Laboratory of Hygiene for the analy-ses of kidney chromium content and Nutrition 21 for thegenerous gift of chromium picolinate. All authors readand approved the final manuscript.
AcknowledgementsThis study was entirely supported by a grant from the National Institutes of Health (1R21AT003012-01A2; MSM).
References1. Friedman JM: Obesity in the new millennium. Nature 2000,
404:632-634.2. Korc M: Update on diabetes mellitus. Dis Markers 2004,
20:161-165.3. Mozaffari MS, Abdelsayed R, Schaffer SW: Pathogenic mecha-
nisms of diabetic complications: Diagnostic biomarkers andprognostic indicators. In Predictive Diagnostics and PersonalizedTreatment: Dream or Reality Edited by Golubnitschaja O Nova Publish-ers; 2009:157-182.
4. Chaturvedi N: The burden of diabetes and its complications:trends and implications for intervention. Diabetes Res and ClinPract 2007, 76:S3-S12.
5. Mehta S, Farmer JA: Obesity and inflammation: A new look atan old problem. Curr Atheroscler Rep 2007, 9:134-138.
6. Dandona P, Aljada A, Chaudhuri A, Mohanty P, Garg R: Metabolicsyndrome: a comprehensive perspective based on interac-tions between obesity, diabetes, and inflammation. Circulation2005, 111:1448-1454.
7. Chander PN, Gealekman O, Brodsky SV, Elitok S, Tojo A, CrabtreeM, Gross SS, Goligorsky MS: Nephropathy in Zucker diabetic fatrat is associated with oxidative and nitrosative stress: pre-vention by chronic therapy with a peroxynitrite scavengerebselen. J Am Soc Nephrol 2004, 15:2391-2403.
8. Coimbra TM, Janssen U, Grone HJ, Ostendorf T, Kunter U, SchmidtH, Brabant G, Floege J: Early events leading to renal injury inobese Zucker (fatty) rats with type II diabetes. Kidney Int 2000,57:167-182.
9. Komers R, Zdychova J, Cahova M, Kazdova L, Lindsley JN, AndersonS: Renal cyclooxygenase-2 in obese Zucker (fatty) rats. KidneyInt 2005, 67:2151-2158.
10. Anderson RA: Chromium in the prevention and control of dia-betes. Diabetes Metab 2000, 26:22-27.
11. Trumbo PR, Ellwood KC: Chromium picolinate intake and riskof type 2 diabetes: an evidence-based review by the UnitedStates food and drug administration. Nutr Rev 2006,64:357-363.
12. Vincent JB: The potential value and toxicity of chromiumpicolinate as a nutritional supplement, weight loss agent andmuscle development agent. Sports Med 2003, 33:213-230.
13. Stearns DM, Wise JP Sr, Patierno SR, Wetterhahn KE: Chromium(III) picolinate produces chromosome damage in Chinesehamster ovary cells. FASEB J 1995, 9:1643-1648.
14. Speetjens JK, Collins RA, Vincent JB, Woski SA: The nutritionalsupplement chromium(III) Tris(picolinate) cleaves DNA.Chem Res Toxicol 1999, 12:483-487.
15. Bagchi D, Stohs SJ, Downs BW, Bagchi M, Preuss HG: Cytotoxicityand oxidative mechanisms of different forms of chromium.Toxicology 2002, 180:5-22.
16. Coryell VH, Stearns DM: Molecular analysis of hprt mutationsinduced by chromium picolinate in CHO AA8 cells. Mutat Res2006, 610:114-123.
Renal tissue chromium content in experimental groups as described in Figure 1Figure 9Renal tissue chromium content in experimental groups as described in Figure 1. PPB: Parts Per Billion. * p < 0.05 compared to either the LZR or untreated OZR groups. # p < 0.05 compared to other groups.
Page 10 of 11(page number not for citation purposes)
http://www.ncbi.nlm.nih.gov/entrez/query.fcgi?cmd=Retrieve&db=PubMed&dopt=Abstract&list_uids=8529845
http://www.ncbi.nlm.nih.gov/entrez/query.fcgi?cmd=Retrieve&db=PubMed&dopt=Abstract&list_uids=8529845

Nutrition & Metabolism 2009, 6:51 http://www.nutritionandmetabolism.com/content/6/1/51
Publish with BioMed Central and every scientist can read your work free of charge
"BioMed Central will be the most significant development for disseminating the results of biomedical research in our lifetime."
Sir Paul Nurse, Cancer Research UK
Your research papers will be:
available free of charge to the entire biomedical community
peer reviewed and published immediately upon acceptance
cited in PubMed and archived on PubMed Central
yours — you keep the copyright
Submit your manuscript here:http://www.biomedcentral.com/info/publishing_adv.asp
BioMedcentral
17. Lamson DS, Plaza SM: The safety and efficacy of high-dose chro-mium. Altern Med Rev 2002, 7:218-235.
18. Hepburn DD, Vincent JB: Tissue and subcellular distribution ofchromium picolinate with time after entering the blood-stream. J Inorg Biochem 2003, 94:86-93.
19. Hepburn DD, Vincent JB: In vivo distribution of chromium fromchromium picolinate in rats and implications for the safety ofthe dietary supplement. Chem Res Toxicol 2002, 15:93-100.
20. Komorowski JR, Greenberg D, Juturu V: Chromium picolinatedoes not produce chromosome damage. Toxicol In Vitro 2008,22:819-826.
21. Jain SK, Rains JL, Croad JL: Effect of chromium niacinate andchromium picolinate supplementation on lipid peroxidation,TNF-alpha, IL-6, CRP, glycated hemoglobin, triglycerides,and cholesterol levels in blood of streptozotocin-treated dia-betic rats. Free Radic Biol Med 2007, 43:1124-1131.
22. Mozaffari MS, Patel C, Ballas C, Schaffer SW: Effects of chromiumpicolinate treatment in uninephrectomized rat. Metabolism2005, 54:1243-1249.
23. Cacho J, Sevillano J, de Castro J, Herrera E, Ramos MP: Validationof simple indexes to assess insulin sensitivity during preg-nancy in Wistar and Sprague-Dawley rats. Am J Physiol 2008,295:E1269-E1276.
24. Pastukh V, Wu S, Ricci C, Mozaffari M, Schaffer S: Reversal ofhyperglycemic preconditioning by angiotensin II: Role of cal-cium transport. Am J Physiol 2005, 288:H1965-H1975.
25. Ricci C, Pastukh V, Mozaffari MS, Schaffer SW: Insulin withdrawalinduces apoptosis via a free radical-mediated mechanism.Can J Physiol Pharmacol 2007, 85:455-464.
26. Ali TK, Matragoon S, Pillai BA, Liou GI, El-Remessy AB: Peroxyni-trite mediates retinal neurodegeneration by inhibiting nervegrowth factor survival signaling in experimental and humandiabetes. Diabetes 2008, 57:889-898.
27. Vincent JB: The biochemistry of chromium. J Nutr 2000,130:715-718.
28. Vincent JB: Mechanisms of chromium action: low-molecular-weight chromium binding substance. J Am Col Nutr 1999,18:6-12.
29. Cefalu WT, Hu FB: Role of chromium in human health and indiabetes. Diabetes Care 2004, 27:2741-2751.
30. Iqbal N, Cardillo S, Volger S, Bloedon LT, Anderson RA, Boston R,Szapary PO: Chromium picolinate does not improve key fea-tures of metabolic syndrome in obese nondiabetic adults.Metab Syndr Relat Disord 2009, 7:143-150.
31. Stout MD, Nyska A, Collins BJ, Witt KL, Kissling GE, Malarkey DE,Hooth MJ: Chronic toxicity and carcinogenicity studies ofchromium picolinate monohydrate administered in feed toF344/N rats and B6C3F1 mice for 2 years. Food Chem Toxicol2009, 47:729-733.
32. Martin J, Wang ZQ, Zhang XH, Wachtel D, Volaufova J, MatthewsDE, Cefalu WT: Chromium picolinate supplementation atten-uates body weight gain and increases insulin sensitivity insubjects with type 2 diabetes. Diabetes Care 2006, 29:1826-1832.
33. Wu LL, Chiou CC, Chang PY, Wu JT: Urinary 8-OHdG: a markerof oxidative stress to DNA and a risk factor for cancer,atherosclerosis and diabetics. Clin Chim Acta 2004, 339:1-9.
34. Snow ET: Effects of chromium on DNA replication in vitro.Environ Health Perspect 1994, 102:41-44.
35. Gudi R, Slesinski RS, Clarke JJ, San RH: Chromium picolinate doesnot produce chromosome damage in CHO cells. Mutat Res2005, 587:140-146.
36. Szendroedi J, Roden M: Ectopic lipids and organ function. CurrOpin Lipidol 2009, 20:50-56.
37. Swifka J, Weiss J, Addicks K, Eckel J, Rösen P: Epicardial fat fromguinea pig: a model to study the paracrine network of inter-actions between epicardial fat and myocardium? CardiovascDrugs Ther 2008, 22:107-114.
Page 11 of 11(page number not for citation purposes)