Effect of a Low–Glycemic Index or a High–Cereal Fiber Diet on Type 2 Diabetes
12
ORIGINAL CONTRIBUTION Effect of a Low–Glycemic Index or a High–Cereal Fiber Diet on Type 2 Diabetes A Randomized Trial David J. A. Jenkins, MD Cyril W. C. Kendall, PhD Gail McKeown-Eyssen, PhD Robert G. Josse, MB, BS Jay Silverberg, MD Gillian L. Booth, MD Edward Vidgen, BSc Andrea R. Josse, MSc Tri H. Nguyen, MSc Sorcha Corrigan, BSc Monica S. Banach, BSc Sophie Ares, MA, RD, CDE Sandy Mitchell, BASc, RD Azadeh Emam, MSc Livia S. A. Augustin, MSc Tina L. Parker, BASc, RD Lawrence A. Leiter, MD T HE NEED FOR IMPLEMENTA- tion of effective dietary strate- gies in diabetes prevention and management has been empha- sized by the success of diet and life- style changes in preventing diabetes in high-risk patients. 1 There is also con- cern that use of antihyperglycemic medications to improve glycemic con- trol in type 2 diabetes may not always significantly improve cardiovascular outcomes. 2-7 One dietary strategy aimed at im- proving both diabetes control and car- diovascular risk factors is the use of low–glycemic index diets. 8-10 These diets have been reported to benefit the control of diabetes 11 ; increase high- density lipoprotein cholesterol (HDL-C) 12,13 ; lower serum triglycer- ide, plasminogen activator inhibitor 1, and high-sensitivity C-reactive pro- tein (CRP) concentrations 14-16 ; and re- duce diabetes incidence 8,9 and overall cardiovascular events. 10 Use of the - glucosidase carbohydrate absorption in- hibitor acarbose, which effectively creates a low–glycemic index diet by Author Affiliations are listed at the end of this article. Corresponding Author: David J. A. Jenkins, MD, De- partment of Nutritional Sciences, Faculty of Medi- cine, University of Toronto, 150 College St, Toronto, ON, M5S 3E2, Canada ([email protected]). Context Clinical trials using antihyperglycemic medications to improve glycemic con- trol have not demonstrated the anticipated cardiovascular benefits. Low–glycemic in- dex diets may improve both glycemic control and cardiovascular risk factors for pa- tients with type 2 diabetes but debate over their effectiveness continues due to trial limitations. Objective To test the effects of low–glycemic index diets on glycemic control and cardiovascular risk factors in patients with type 2 diabetes. Design, Setting, and Participants A randomized, parallel study design at a Ca- nadian university hospital research center of 210 participants with type 2 diabetes treated with antihyperglycemic medications who were recruited by newspaper advertisement and randomly assigned to receive 1 of 2 diet treatments each for 6 months between September 16, 2004, and May 22, 2007. Intervention High–cereal fiber or low–glycemic index dietary advice. Main Outcome Measures Absolute change in glycated hemoglobin A 1c (HbA 1c ), with fasting blood glucose and cardiovascular disease risk factors as secondary measures. Results In the intention-to-treat analysis, HbA 1c decreased by -0.18% absolute HbA 1c units (95% confidence interval [CI], -0.29% to -0.07%) in the high–cereal fiber diet compared with -0.50% absolute HbA 1c units (95% CI, -0.61% to -0.39%) in the low–glycemic index diet (P .001). There was also an increase of high-density lipo- protein cholesterol in the low–glycemic index diet by 1.7 mg/dL (95% CI, 0.8-2.6 mg/ dL) compared with a decrease of high-density lipoprotein cholesterol by -0.2 mg/dL (95% CI, -0.9 to 0.5 mg/dL) in the high–cereal fiber diet (P = .005). The reduction in dietary glycemic index related positively to the reduction in HbA 1c concentration (r =0.35, P .001) and negatively to the increase in high-density lipoprotein cholesterol (r = -0.19, P =.009). Conclusion In patients with type 2 diabetes, 6-month treatment with a low– glycemic index diet resulted in moderately lower HbA 1c levels compared with a high– cereal fiber diet. Trial Registration clinicaltrials.gov identifier: NCT00438698 JAMA. 2008;300(23):2742-2753 www.jama.com 2742 JAMA, December 17, 2008—Vol 300, No. 23 (Reprinted) ©2008 American Medical Association. All rights reserved.
-
Upload
independent -
Category
Documents
-
view
2 -
download
0
Transcript of Effect of a Low–Glycemic Index or a High–Cereal Fiber Diet on Type 2 Diabetes
ORIGINAL CONTRIBUTION
Effect of a Low–Glycemic Indexor a High–Cereal Fiber Diet on Type 2 DiabetesA Randomized TrialDavid J. A. Jenkins, MDCyril W. C. Kendall, PhDGail McKeown-Eyssen, PhDRobert G. Josse, MB, BSJay Silverberg, MDGillian L. Booth, MDEdward Vidgen, BScAndrea R. Josse, MScTri H. Nguyen, MScSorcha Corrigan, BScMonica S. Banach, BScSophie Ares, MA, RD, CDESandy Mitchell, BASc, RDAzadeh Emam, MScLivia S. A. Augustin, MScTina L. Parker, BASc, RDLawrence A. Leiter, MD
THE NEED FOR IMPLEMENTA-tion of effective dietary strate-gies in diabetes prevention andmanagement has been empha-
sized by the success of diet and life-style changes in preventing diabetes inhigh-risk patients.1 There is also con-cern that use of antihyperglycemicmedications to improve glycemic con-trol in type 2 diabetes may not alwayssignificantly improve cardiovascularoutcomes.2-7
One dietary strategy aimed at im-proving both diabetes control and car-diovascular risk factors is the use oflow–glycemic index diets.8-10 These dietshave been reported to benefit the
control of diabetes11; increase high-density lipoprotein cholesterol(HDL-C)12,13; lower serum triglycer-ide, plasminogen activator inhibitor 1,and high-sensitivity C-reactive pro-tein (CRP) concentrations14-16; and re-duce diabetes incidence8,9 and overallcardiovascular events.10 Use of the �-
glucosidase carbohydrate absorption in-hibitor acarbose, which effectivelycreates a low–glycemic index diet by
Author Affiliations are listed at the end of this article.Corresponding Author: David J. A. Jenkins, MD, De-partment of Nutritional Sciences, Faculty of Medi-cine, University of Toronto, 150 College St, Toronto,ON, M5S 3E2, Canada ([email protected]).
Context Clinical trials using antihyperglycemic medications to improve glycemic con-trol have not demonstrated the anticipated cardiovascular benefits. Low–glycemic in-dex diets may improve both glycemic control and cardiovascular risk factors for pa-tients with type 2 diabetes but debate over their effectiveness continues due to triallimitations.
Objective To test the effects of low–glycemic index diets on glycemic control andcardiovascular risk factors in patients with type 2 diabetes.
Design, Setting, and Participants A randomized, parallel study design at a Ca-nadian university hospital research center of 210 participants with type 2 diabetes treatedwith antihyperglycemic medications who were recruited by newspaper advertisementand randomly assigned to receive 1 of 2 diet treatments each for 6 months betweenSeptember 16, 2004, and May 22, 2007.
Intervention High–cereal fiber or low–glycemic index dietary advice.
Main Outcome Measures Absolute change in glycated hemoglobin A1c (HbA1c), withfasting blood glucose and cardiovascular disease risk factors as secondary measures.
Results In the intention-to-treat analysis, HbA1c decreased by −0.18% absolute HbA1c
units (95% confidence interval [CI], −0.29% to −0.07%) in the high–cereal fiber dietcompared with −0.50% absolute HbA1c units (95% CI, −0.61% to −0.39%) in thelow–glycemic index diet (P� .001). There was also an increase of high-density lipo-protein cholesterol in the low–glycemic index diet by 1.7 mg/dL (95% CI, 0.8-2.6 mg/dL) compared with a decrease of high-density lipoprotein cholesterol by −0.2 mg/dL(95% CI, −0.9 to 0.5 mg/dL) in the high–cereal fiber diet (P=.005). The reduction indietary glycemic index related positively to the reduction in HbA1c concentration (r=0.35,P� .001) and negatively to the increase in high-density lipoprotein cholesterol (r=−0.19,P=.009).
Conclusion In patients with type 2 diabetes, 6-month treatment with a low–glycemic index diet resulted in moderately lower HbA1c levels compared with a high–cereal fiber diet.
Trial Registration clinicaltrials.gov identifier: NCT00438698JAMA. 2008;300(23):2742-2753 www.jama.com
2742 JAMA, December 17, 2008—Vol 300, No. 23 (Reprinted) ©2008 American Medical Association. All rights reserved.
slowing the rate of carbohydrate ab-sorption, similarly reduced not only therate of progression to diabetes in high-risk individuals but also the incidenceof hypertension and the risk of cardio-vascular disease.17,18 Nonetheless, therelevance and practicality of applyingthe low–glycemic index dietary ap-proach to the treatment of diabetes hasbeen questioned.19-21 Furthermore, al-though meta-analyses of clinical stud-ies have indicated a benefit in diabetesin terms of reduced glycated pro-teins,11 individual trials have often failedto demonstrate a clear benefit for low–glycemic index diets.11,22 However, thesetrials have usually been of short dura-tion with relatively small numbers ofparticipants.11 An exception is a re-cent larger and longer trial,22 but in thatstudy, the mean baseline glycated he-moglobin A1c (HbA1c) concentrationwas already relatively low at 6.1%, thusmaking it difficult to demonstrate ben-efit from the intervention.
Our goal in this study was to assessthe effect of a low–glycemic index dietin an adequately powered study of pa-tients with type 2 diabetes controlledby oral medications with HbA1c con-centrations between 6.5% and 8.0%. Atthese levels, a reduction in glycemia andassociated risk factors for diabetes com-plications are likely to be observed moreclearly. We selected a high–cereal fi-ber diet treatment for its suggestedhealth benefits8,9,23-25 for the compari-son so that the potential value of car-bohydrate foods could be emphasizedequally for both high–cereal fiber andlow–glycemic index interventions.
METHODSParticipants
Study participants were recruited fromlocal newspaper advertisements. Out of2220 responses by telephone, 981 par-ticipants were considered potentiallyeligible and were invited to attend aninformation session at the Risk FactorModification Center, St Michael’s Hos-pital, Toronto, Ontario, Canada, whereall study clinical activity took place. Ofthose participants invited, 658 at-tended a screening appointment. A total
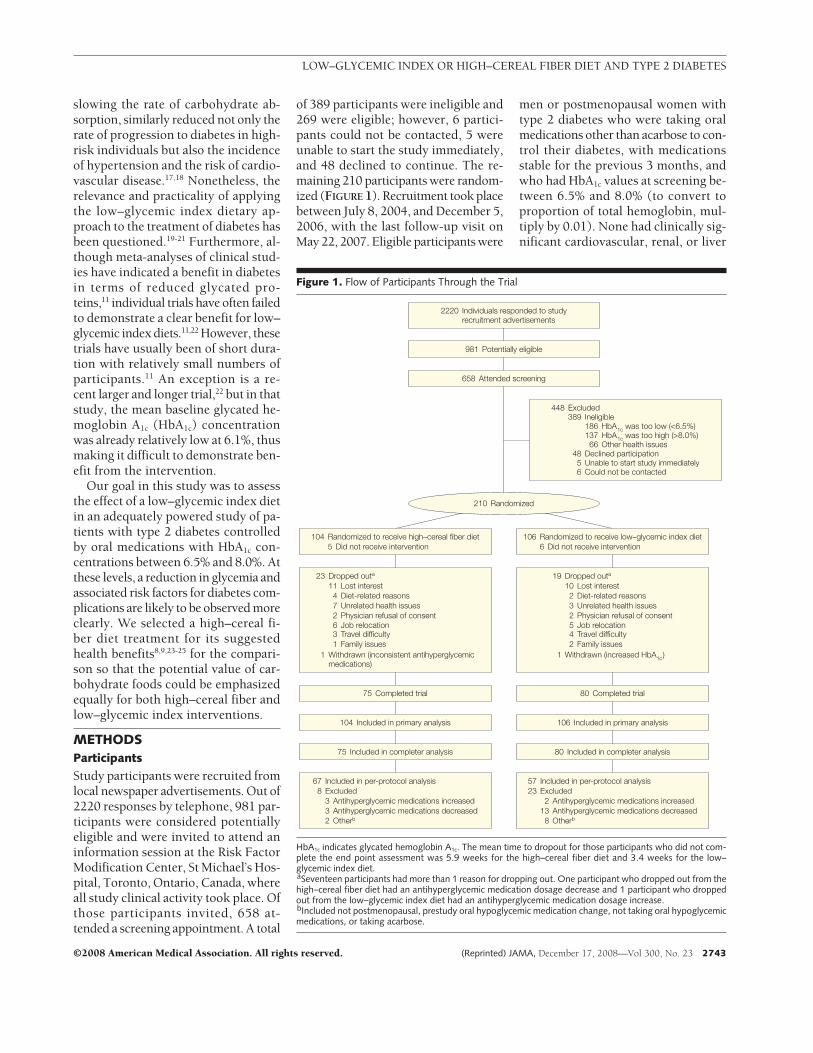
of 389 participants were ineligible and269 were eligible; however, 6 partici-pants could not be contacted, 5 wereunable to start the study immediately,and 48 declined to continue. The re-maining 210 participants were random-ized (FIGURE 1). Recruitment took placebetween July 8, 2004, and December 5,2006, with the last follow-up visit onMay 22, 2007. Eligible participants were
men or postmenopausal women withtype 2 diabetes who were taking oralmedications other than acarbose to con-trol their diabetes, with medicationsstable for the previous 3 months, andwho had HbA1c values at screening be-tween 6.5% and 8.0% (to convert toproportion of total hemoglobin, mul-tiply by 0.01). None had clinically sig-nificant cardiovascular, renal, or liver
Figure 1. Flow of Participants Through the Trial
23 Dropped outa
1 Withdrawn (inconsistent antihyperglycemicmedications)
11 Lost interest4 Diet-related reasons7 Unrelated health issues2 Physician refusal of consent6 Job relocation3 Travel difficulty1 Family issues
19 Dropped outa
1 Withdrawn (increased HbA1c)
10 Lost interest2 Diet-related reasons3 Unrelated health issues2 Physician refusal of consent5 Job relocation4 Travel difficulty2 Family issues
104 Randomized to receive high–cereal fiber diet5 Did not receive intervention
106 Randomized to receive low–glycemic index diet6 Did not receive intervention
75 Included in completer analysis 80 Included in completer analysis
104 Included in primary analysis 106 Included in primary analysis
75 Completed trial 80 Completed trial
658 Attended screening
981 Potentially eligible
448 Excluded389 Ineligible
48 Declined participation5 Unable to start study immediately6 Could not be contacted
186 HbA1c was too low (<6.5%)137 HbA1c was too high (>8.0%)
66 Other health issues
2220 Individuals responded to studyrecruitment advertisements
210 Randomized
57 Included in per-protocol analysis23 Excluded
2 Antihyperglycemic medications increased13 Antihyperglycemic medications decreased8 Otherb
67 Included in per-protocol analysis8 Excluded
3 Antihyperglycemic medications increased3 Antihyperglycemic medications decreased2 Otherb
HbA1c indicates glycated hemoglobin A1c. The mean time to dropout for those participants who did not com-plete the end point assessment was 5.9 weeks for the high–cereal fiber diet and 3.4 weeks for the low–glycemic index diet.aSeventeen participants had more than 1 reason for dropping out. One participant who dropped out from thehigh–cereal fiber diet had an antihyperglycemic medication dosage decrease and 1 participant who droppedout from the low–glycemic index diet had an antihyperglycemic medication dosage increase.bIncluded not postmenopausal, prestudy oral hypoglycemic medication change, not taking oral hypoglycemicmedications, or taking acarbose.
LOW–GLYCEMIC INDEX OR HIGH–CEREAL FIBER DIET AND TYPE 2 DIABETES
©2008 American Medical Association. All rights reserved. (Reprinted) JAMA, December 17, 2008—Vol 300, No. 23 2743
disease (alanine aminotransferase �3times the upper limit of normal) andnone were undergoing treatment forcancer. Participants were accepted af-ter surgery or myocardial infarction pro-viding an event-free, 6-month periodhad elapsed before the study.
After randomization, it was foundthat 5 participants had not been ex-cluded who were taking acarbose andhad not subsequently been advised tostop taking acarbose, and 2 partici-pants were not taking diabetes medi-cations. In addition, 8 participants hadchanged their medications within 3months before the start of the study and2 women were not postmenopausal.Furthermore, at the start of the trial, 9participants (6 in the low–glycemic in-dex diet and 3 in the high–cereal fiberdiet) did not receive the appropriate di-etary advice for the treatment to whichthey had been randomized. This errorwas corrected within the first 4 weeksof the study. Nevertheless, all random-ized participants were retained both forthe intention-to-treat (ITT) and studycompletion analyses.
Race/ethnicity was determined by amember of the research team (S.M.) andincluded to allow for future subgroupanalyses when genetic data (to be de-termined) become available. The studywas approved by the research ethicsboard of St Michael’s Hospital and theUniversity of Toronto, Toronto, On-tario, Canada, and written consent wasobtained from all participants.
Protocol
Our study was a randomized, parallelstudy with 2 treatments, a low–glycemic index diet and a high–cerealfiber diet, each of 6 months’ duration.After stratification by sex and HbA1c
(�7.1%), randomization was per-formed by using participant identifica-tion (subject ID) by a statistician (E.V.)who was geographically separated fromthe center at which participants wereobserved. Neither the dietitians whowere responsible for the day-to-day run-ning of the study nor the participantscould be blinded to the treatment al-location. The technical staff involved in
the analyses were blinded to treat-ment, as was the statistician up to andduring the preliminary assessment ofthe primary outcome, HbA1c. In addi-tion, during the study, equally strongemphasis was placed by dietitians onthe potential importance of either high–cereal fiber foods or low–glycemic in-dex foods and appropriate weeklychecklists were developed for eachtreatment.
Participants were observed at theClinical Nutrition and Risk FactorModification Center at baseline, weeks2 and 4, and thereafter at monthly in-tervals until the end of the 6-month pe-riod. During the first month, partici-pants received instructions regardingthe diet to which they were allocated.Throughout the study, this advice wasreinforced by the dietitians. At all cen-ter visits, participants were weighed inindoor clothing without shoes and afasting blood sample was taken. Bloodpressure was measured seated on 3 oc-casions at 1-minute intervals using anOmron automatic sphygmomanom-eter (OMRON Healthcare Inc, Burling-ton, Ontario, Canada) and the mean ofthe 3 measurements was taken. In ad-dition, participants brought with themtheir 7-day food record covering theweek before the visit; this was dis-cussed with the dietitian together withtheir checklist of low–glycemic indexor high–cereal fiber food items re-corded on a daily basis throughout thestudy. Participants noted their overallfeeling of satiety or hunger over the pre-vious weeks on a scale of �4 to −4,where �4 was extremely satiated, 0 wasneutral, and −4 was extremely hun-gry. For the last 114 participants whowere enrolled in the study, adherencewas rated formally under 1 of 3 catego-ries (good, adequate but may need ad-ditional encouragement with a between-visit telephone call, or nonadherentwith definite need for a telephone callbetween scheduled visits).
During the study, participants wereasked to maintain their antihyperglyce-mic medications constant and letterswere sent to family physicians for theirsupport in this matter. When patients ex-
perienced symptoms of hypoglycemiawith blood capillary glucose levels of lessthan 63.1 mg/dL (to convert to milli-moles per liter, multiply by 0.0555) forno obvious reason, study endocrinolo-gists (R.G.J., J.S., G.L.B., and L.A.L.) whowere blinded to treatment were con-sulted. The patients were then referredback to their family physicians so thatmedications could be reduced accord-ing to a predetermined protocol. If HbA1c
increased to more than 8.5% on 2 suc-cessive occasions, participants were with-drawn from the study and referred backto their own physicians. Only 1 partici-pant was withdrawn due to HbA1c beingmore than 8.5% on 2 successive occa-sions. The participant’s HbA1c was 7.6%at recruitment, but increased to 8.2% bybaseline and was later withdrawn due toreadings of more than 8.5% during thestudy.
Dietary Interventions
General dietary advice conformed to theNational Cholesterol Education Pro-gram Adult Treatment Panel III26 and theAmerican Diabetes Association27 guide-lines to reduce saturated fat and choles-terol intakes. Most of the participantswere overweight (179/210 [85.2%], withbody mass index [BMI, calculated asweight in kilograms divided by height inmeters squared] of �25) or obese (113/210 [53.8%], BMI �30) and wished tolose weight. They were informed that thiswas not a weight-loss study but appro-priate advice was given on portion sizeand fat intake to help them meet theirbody weight objectives. Participants werealso provided with a checklist with eitherlow–glycemic index or high–cereal fi-ber food options from different catego-ries (breakfast cereals, breads, veg-etables, fruit) as approximately 15-gcarbohydrate servings. The number ofcarbohydrate servings prescribed cov-ered 42% to 43% of total dietary calories.
In the low–glycemic index diet, thefollowing foods were emphasized: low–glycemic index breads (including pum-pernickel, rye pita, and quinoa and flax-seed) and breakfast cereals (includingRed River Cereal [hot cereal made ofbulgur and flax], large flake oatmeal,
LOW–GLYCEMIC INDEX OR HIGH–CEREAL FIBER DIET AND TYPE 2 DIABETES
2744 JAMA, December 17, 2008—Vol 300, No. 23 (Reprinted) ©2008 American Medical Association. All rights reserved.
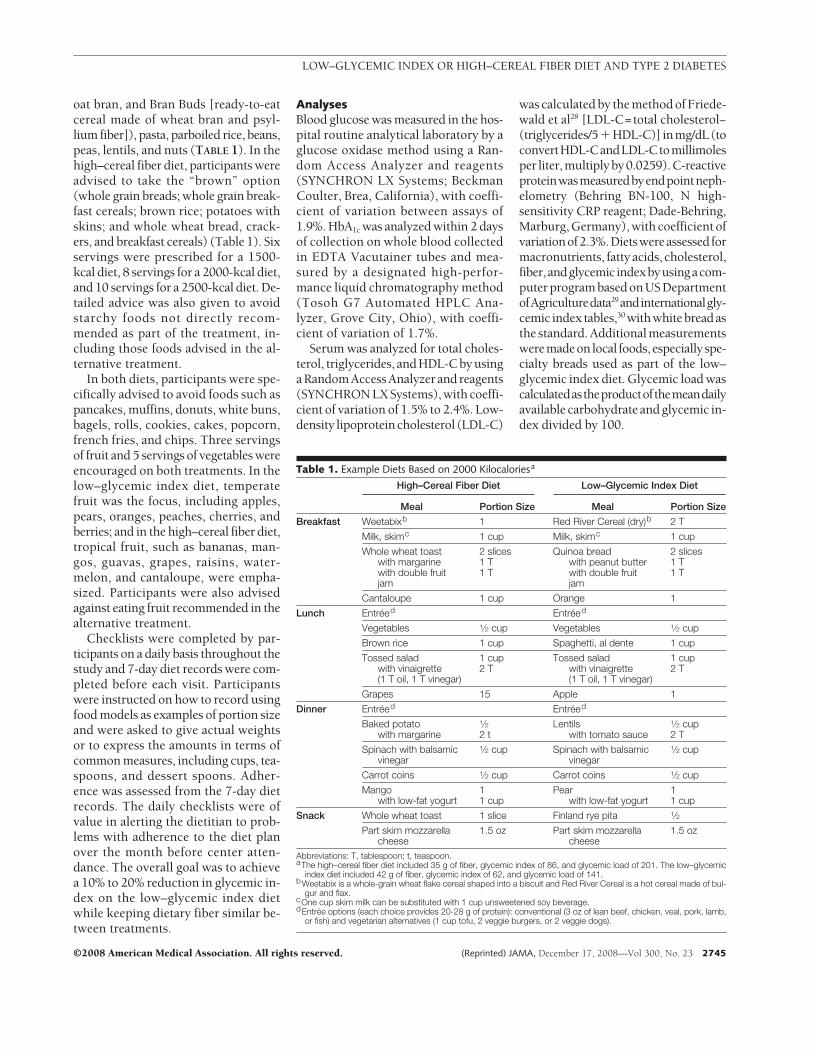
oat bran, and Bran Buds [ready-to-eatcereal made of wheat bran and psyl-lium fiber]), pasta, parboiled rice, beans,peas, lentils, and nuts (TABLE 1). In thehigh–cereal fiber diet, participants wereadvised to take the “brown” option(whole grain breads; whole grain break-fast cereals; brown rice; potatoes withskins; and whole wheat bread, crack-ers, and breakfast cereals) (Table 1). Sixservings were prescribed for a 1500-kcal diet, 8 servings for a 2000-kcal diet,and 10 servings for a 2500-kcal diet. De-tailed advice was also given to avoidstarchy foods not directly recom-mended as part of the treatment, in-cluding those foods advised in the al-ternative treatment.
In both diets, participants were spe-cifically advised to avoid foods such aspancakes, muffins, donuts, white buns,bagels, rolls, cookies, cakes, popcorn,french fries, and chips. Three servingsof fruit and 5 servings of vegetables wereencouraged on both treatments. In thelow–glycemic index diet, temperatefruit was the focus, including apples,pears, oranges, peaches, cherries, andberries; and in the high–cereal fiber diet,tropical fruit, such as bananas, man-gos, guavas, grapes, raisins, water-melon, and cantaloupe, were empha-sized. Participants were also advisedagainst eating fruit recommended in thealternative treatment.
Checklists were completed by par-ticipants on a daily basis throughout thestudy and 7-day diet records were com-pleted before each visit. Participantswere instructed on how to record usingfood models as examples of portion sizeand were asked to give actual weightsor to express the amounts in terms ofcommon measures, including cups, tea-spoons, and dessert spoons. Adher-ence was assessed from the 7-day dietrecords. The daily checklists were ofvalue in alerting the dietitian to prob-lems with adherence to the diet planover the month before center atten-dance. The overall goal was to achievea 10% to 20% reduction in glycemic in-dex on the low–glycemic index dietwhile keeping dietary fiber similar be-tween treatments.
AnalysesBlood glucose was measured in the hos-pital routine analytical laboratory by aglucose oxidase method using a Ran-dom Access Analyzer and reagents(SYNCHRON LX Systems; BeckmanCoulter, Brea, California), with coeffi-cient of variation between assays of1.9%. HbA1c was analyzed within 2 daysof collection on whole blood collectedin EDTA Vacutainer tubes and mea-sured by a designated high-perfor-mance liquid chromatography method(Tosoh G7 Automated HPLC Ana-lyzer, Grove City, Ohio), with coeffi-cient of variation of 1.7%.
Serum was analyzed for total choles-terol, triglycerides, and HDL-C by usinga Random Access Analyzer and reagents(SYNCHRON LX Systems), with coeffi-cient of variation of 1.5% to 2.4%. Low-density lipoproteincholesterol (LDL-C)
was calculated by the method of Friede-wald et al28 [LDL-C=total cholesterol−(triglycerides/5�HDL-C)] inmg/dL(toconvertHDL-CandLDL-Ctomillimolesper liter,multiplyby0.0259).C-reactiveproteinwasmeasuredbyendpointneph-elometry (Behring BN-100, N high-sensitivity CRP reagent; Dade-Behring,Marburg, Germany), with coefficient ofvariationof2.3%.Dietswereassessed formacronutrients, fatty acids, cholesterol,fiber,andglycemicindexbyusingacom-puter program based on US DepartmentofAgriculturedata29andinternationalgly-cemic index tables,30 withwhitebreadasthe standard. Additional measurementsweremadeonlocal foods,especiallyspe-cialty breads used as part of the low–glycemic index diet. Glycemic load wascalculatedastheproductofthemeandailyavailable carbohydrate and glycemic in-dex divided by 100.
Table 1. Example Diets Based on 2000 Kilocaloriesa
High–Cereal Fiber Diet Low–Glycemic Index Diet
Meal Portion Size Meal Portion Size
Breakfast Weetabixb 1 Red River Cereal (dry)b 2 T
Milk, skimc 1 cup Milk, skimc 1 cup
Whole wheat toastwith margarinewith double fruitjam
2 slices1 T1 T
Quinoa breadwith peanut butterwith double fruitjam
2 slices1 T1 T
Cantaloupe 1 cup Orange 1
Lunch Entreed Entreed
Vegetables 1⁄2 cup Vegetables 1⁄2 cup
Brown rice 1 cup Spaghetti, al dente 1 cup
Tossed saladwith vinaigrette(1 T oil, 1 T vinegar)
1 cup2 T
Tossed saladwith vinaigrette(1 T oil, 1 T vinegar)
1 cup2 T
Grapes 15 Apple 1
Dinner Entreed Entreed
Baked potatowith margarine
1⁄22 t
Lentilswith tomato sauce
1⁄2 cup2 T
Spinach with balsamicvinegar
1⁄2 cup Spinach with balsamicvinegar
1⁄2 cup
Carrot coins 1⁄2 cup Carrot coins 1⁄2 cup
Mangowith low-fat yogurt
11 cup
Pearwith low-fat yogurt
11 cup
Snack Whole wheat toast 1 slice Finland rye pita 1⁄2
Part skim mozzarellacheese
1.5 oz Part skim mozzarellacheese
1.5 oz
Abbreviations: T, tablespoon; t, teaspoon.aThe high–cereal fiber diet included 35 g of fiber, glycemic index of 86, and glycemic load of 201. The low–glycemic
index diet included 42 g of fiber, glycemic index of 62, and glycemic load of 141.bWeetabix is a whole-grain wheat flake cereal shaped into a biscuit and Red River Cereal is a hot cereal made of bul-
gur and flax.cOne cup skim milk can be substituted with 1 cup unsweetened soy beverage.dEntree options (each choice provides 20-28 g of protein): conventional (3 oz of lean beef, chicken, veal, pork, lamb,
or fish) and vegetarian alternatives (1 cup tofu, 2 veggie burgers, or 2 veggie dogs).
LOW–GLYCEMIC INDEX OR HIGH–CEREAL FIBER DIET AND TYPE 2 DIABETES
©2008 American Medical Association. All rights reserved. (Reprinted) JAMA, December 17, 2008—Vol 300, No. 23 2745
Outcome MeasuresThe primary outcome measure wasHbA1c, with glucose, HDL-C, triglycer-ides, CRP, blood pressure, and bodyweightas secondaryoutcomemeasures.
Power Calculations
The original power calculation wasbased on a predicted HbA1c difference
between end of treatments of 0.7 HbA1c
units, with an SD of effect of 1.2 HbA1c
units, �=.05, 1−�=.80, and a dropoutrate of 25%. Our participant require-ment was 67 for each treatment. How-ever, the preliminary results of a large(but at the time unpublished) study thatassessed the diet effect on HbA1c sug-gested our effect size would be smaller
than we had originally predicted.22 Inan unplanned interim analysis, we con-firmed a smaller than predicted differ-ence in the change in HbA1c betweentreatments for the first 58 participantsto complete the study. Our revisedgoal therefore was to detect a differ-ence of half of an SD (0.6%) in thechange in HbA1c between treatments(change=0.3%), with type I error of2.53% (Bonferroni adjustment to al-low for the initial analysis of the pre-liminary ITT HbA1c data with �=.05)and type II error of 20%. Assuming aloss of 25% of participants due to drop-outs and medication changes, 104 par-ticipants were needed in each treat-ment group.
Statistical Analyses
Results are expressed as means with95% confidence intervals (CIs). Allanalyses were performed by using SASversion 9.1.2.31 Three participantgroups were analyzed. The first and pri-mary analysis was an ITT analysis,which included all 210 randomized par-ticipants, with the baseline observa-tion carried forward, rather than the lastobservation, for all those who did notcomplete the study. This procedure wasused to recognize that these individu-als would most likely have reverted totheir previous diets and behavioral pat-terns, resulting also in a reversion totheir previous level of diabetic con-trol. Participants who were random-ized but did not receive intervention(n=11) had their screening value usedas baseline and this value was carriedforward. The second analysis in-cluded 155 participants who com-pleted the study (completer analysis),and the third analysis involved 124 par-ticipants who completed the study ac-cording to the protocol but who did notchange their antihyperglycemic medi-cations before or during the study pe-riod (per-protocol analysis).
The significance of treatment differ-ences was assessed by using an analy-sis of covariance model (Proc GLM)31
with change from baseline to end ofstudy as the response variable and dietand sex as main effects, with diet � sex
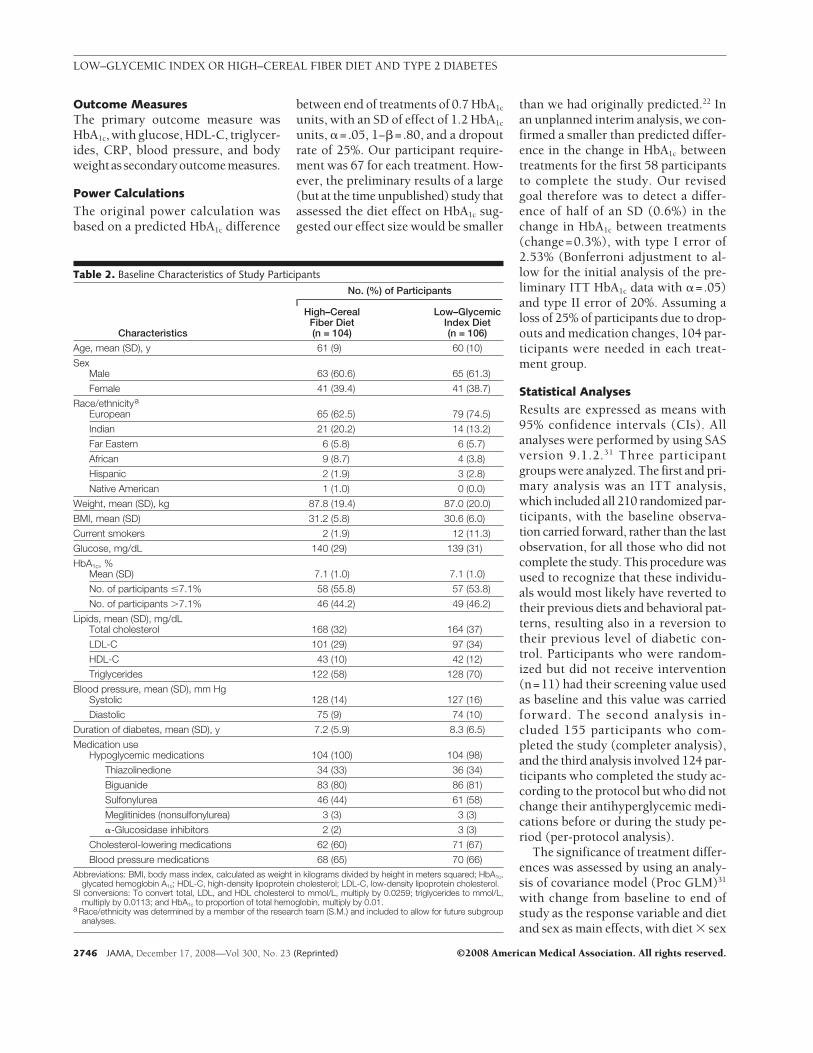
Table 2. Baseline Characteristics of Study Participants
Characteristics
No. (%) of Participants
High–CerealFiber Diet(n = 104)
Low–GlycemicIndex Diet(n = 106)
Age, mean (SD), y 61 (9) 60 (10)
SexMale 63 (60.6) 65 (61.3)
Female 41 (39.4) 41 (38.7)
Race/ethnicitya
European 65 (62.5) 79 (74.5)
Indian 21 (20.2) 14 (13.2)
Far Eastern 6 (5.8) 6 (5.7)
African 9 (8.7) 4 (3.8)
Hispanic 2 (1.9) 3 (2.8)
Native American 1 (1.0) 0 (0.0)
Weight, mean (SD), kg 87.8 (19.4) 87.0 (20.0)
BMI, mean (SD) 31.2 (5.8) 30.6 (6.0)
Current smokers 2 (1.9) 12 (11.3)
Glucose, mg/dL 140 (29) 139 (31)
HbA1c, %Mean (SD) 7.1 (1.0) 7.1 (1.0)
No. of participants �7.1% 58 (55.8) 57 (53.8)
No. of participants �7.1% 46 (44.2) 49 (46.2)
Lipids, mean (SD), mg/dLTotal cholesterol 168 (32) 164 (37)
LDL-C 101 (29) 97 (34)
HDL-C 43 (10) 42 (12)
Triglycerides 122 (58) 128 (70)
Blood pressure, mean (SD), mm HgSystolic 128 (14) 127 (16)
Diastolic 75 (9) 74 (10)
Duration of diabetes, mean (SD), y 7.2 (5.9) 8.3 (6.5)
Medication useHypoglycemic medications 104 (100) 104 (98)
Thiazolinedione 34 (33) 36 (34)
Biguanide 83 (80) 86 (81)
Sulfonylurea 46 (44) 61 (58)
Meglitinides (nonsulfonylurea) 3 (3) 3 (3)
�-Glucosidase inhibitors 2 (2) 3 (3)
Cholesterol-lowering medications 62 (60) 71 (67)
Blood pressure medications 68 (65) 70 (66)Abbreviations: BMI, body mass index, calculated as weight in kilograms divided by height in meters squared; HbA1c,
glycated hemoglobin A1c; HDL-C, high-density lipoprotein cholesterol; LDL-C, low-density lipoprotein cholesterol.SI conversions: To convert total, LDL, and HDL cholesterol to mmol/L, multiply by 0.0259; triglycerides to mmol/L,
multiply by 0.0113; and HbA1c to proportion of total hemoglobin, multiply by 0.01.aRace/ethnicity was determined by a member of the research team (S.M.) and included to allow for future subgroup
analyses.
LOW–GLYCEMIC INDEX OR HIGH–CEREAL FIBER DIET AND TYPE 2 DIABETES
2746 JAMA, December 17, 2008—Vol 300, No. 23 (Reprinted) ©2008 American Medical Association. All rights reserved.
as the interaction term and baseline asa covariate. Additional analyses werealso performed to assess the effects ofpossible factors at baseline associatedwith diabetes outcome, including ad-equate glycemic control (HbA1 c
�7.0%), normal BMI (�25), youngerage (�60 years), and smoking. Theanalysis of covariance model for theseanalyses was the basic model de-scribed above together with the maineffect of interest and its diet interac-tion. The time trends were estimated byusing Proc GLM in SAS and the re-peated statement assuming a spatialpower covariance structure to controlfor unevenly spaced time intervals be-tween measurements. This is an au-toregressive test assuming correla-tions between successive observations.A significant time trend therefore in-dicates a monotonic relationship be-tween time and change in the studymeasurement. HbA1c, glucose, HDL-C,and the lipid ratios with HDL-C in thedenominator showed significant timetrends. No time trend was observed be-tween weeks 2 to 24 for the othermeasurements.
Additional analyses were performedby using change in fiber, carbohydrateintake, and body weight as covariates
in the analysis of covariance model(Proc GLM).31 For skewed data, the re-sults were confirmed with nonparamet-ric analysis but only parametric analy-ses are reported. The Mantel-Haenszel,2 test, and Fisher exact tests were usedto assess differences in medicationchanges31 and baseline comparisons.Pearson product-moment correlationswere calculated to examine associa-tions of dietary fiber, glycemic index, andbody weight change with other vari-ables of interest. Partial correlations con-trolling for either change in body weight,fiber, or glycemic index were also un-dertaken to examine the independent as-sociationof fiber andglycemic indexwiththe variables of interest.31
RESULTSThe participant flow diagram is shownin Figure 1. Eleven participants droppedout after randomization but beforetheir baseline visit and were thereforeunaware of their treatment allocation(5 in the high–cereal fiber diet groupand 6 in the low–glycemic indexdiet group). After starting the high–cereal fiber diet, 23 of 99 participants(23%) dropped out compared with 19of 100 participants (19%) in the low–glycemic index diet group.
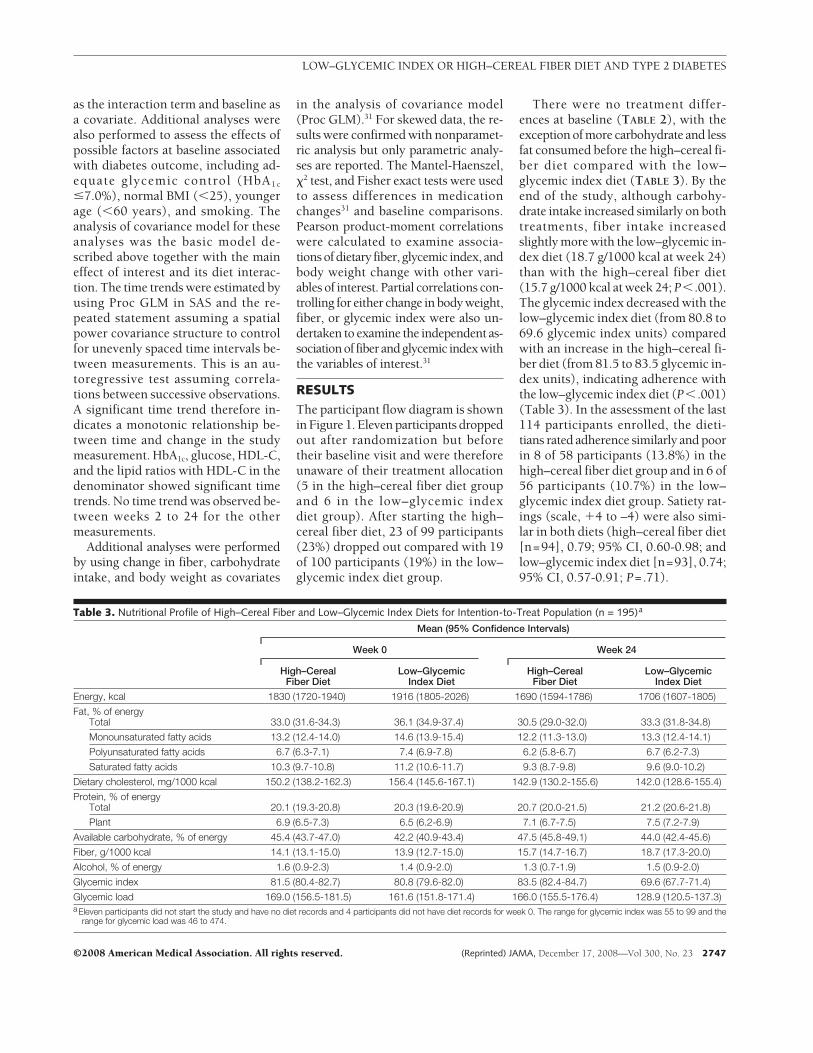
There were no treatment differ-ences at baseline (TABLE 2), with theexception of more carbohydrate and lessfat consumed before the high–cereal fi-ber diet compared with the low–glycemic index diet (TABLE 3). By theend of the study, although carbohy-drate intake increased similarly on bothtreatments, fiber intake increasedslightly more with the low–glycemic in-dex diet (18.7 g/1000 kcal at week 24)than with the high–cereal fiber diet(15.7 g/1000 kcal at week 24; P� .001).The glycemic index decreased with thelow–glycemic index diet (from 80.8 to69.6 glycemic index units) comparedwith an increase in the high–cereal fi-ber diet (from 81.5 to 83.5 glycemic in-dex units), indicating adherence withthe low–glycemic index diet (P� .001)(Table 3). In the assessment of the last114 participants enrolled, the dieti-tians rated adherence similarly and poorin 8 of 58 participants (13.8%) in thehigh–cereal fiber diet group and in 6 of56 participants (10.7%) in the low–glycemic index diet group. Satiety rat-ings (scale, �4 to –4) were also simi-lar in both diets (high–cereal fiber diet[n=94], 0.79; 95% CI, 0.60-0.98; andlow–glycemic index diet [n=93], 0.74;95% CI, 0.57-0.91; P=.71).
Table 3. Nutritional Profile of High–Cereal Fiber and Low–Glycemic Index Diets for Intention-to-Treat Population (n = 195)a
Mean (95% Confidence Intervals)
Week 0 Week 24
High–CerealFiber Diet
Low–GlycemicIndex Diet
High–CerealFiber Diet
Low–GlycemicIndex Diet
Energy, kcal 1830 (1720-1940) 1916 (1805-2026) 1690 (1594-1786) 1706 (1607-1805)
Fat, % of energyTotal 33.0 (31.6-34.3) 36.1 (34.9-37.4) 30.5 (29.0-32.0) 33.3 (31.8-34.8)
Monounsaturated fatty acids 13.2 (12.4-14.0) 14.6 (13.9-15.4) 12.2 (11.3-13.0) 13.3 (12.4-14.1)
Polyunsaturated fatty acids 6.7 (6.3-7.1) 7.4 (6.9-7.8) 6.2 (5.8-6.7) 6.7 (6.2-7.3)
Saturated fatty acids 10.3 (9.7-10.8) 11.2 (10.6-11.7) 9.3 (8.7-9.8) 9.6 (9.0-10.2)
Dietary cholesterol, mg/1000 kcal 150.2 (138.2-162.3) 156.4 (145.6-167.1) 142.9 (130.2-155.6) 142.0 (128.6-155.4)
Protein, % of energyTotal 20.1 (19.3-20.8) 20.3 (19.6-20.9) 20.7 (20.0-21.5) 21.2 (20.6-21.8)
Plant 6.9 (6.5-7.3) 6.5 (6.2-6.9) 7.1 (6.7-7.5) 7.5 (7.2-7.9)
Available carbohydrate, % of energy 45.4 (43.7-47.0) 42.2 (40.9-43.4) 47.5 (45.8-49.1) 44.0 (42.4-45.6)
Fiber, g/1000 kcal 14.1 (13.1-15.0) 13.9 (12.7-15.0) 15.7 (14.7-16.7) 18.7 (17.3-20.0)
Alcohol, % of energy 1.6 (0.9-2.3) 1.4 (0.9-2.0) 1.3 (0.7-1.9) 1.5 (0.9-2.0)
Glycemic index 81.5 (80.4-82.7) 80.8 (79.6-82.0) 83.5 (82.4-84.7) 69.6 (67.7-71.4)
Glycemic load 169.0 (156.5-181.5) 161.6 (151.8-171.4) 166.0 (155.5-176.4) 128.9 (120.5-137.3)aEleven participants did not start the study and have no diet records and 4 participants did not have diet records for week 0. The range for glycemic index was 55 to 99 and the
range for glycemic load was 46 to 474.
LOW–GLYCEMIC INDEX OR HIGH–CEREAL FIBER DIET AND TYPE 2 DIABETES
©2008 American Medical Association. All rights reserved. (Reprinted) JAMA, December 17, 2008—Vol 300, No. 23 2747
Glycemic Control and Body WeightIn the ITT analysis, antihyperglyce-mic medication dosages increased simi-larly in both treatments (3 partici-pants in low–glycemic index diet and3 participants in high–cereal fiber diet),but dosage reductions were more fre-quent in the low–glycemic index dietgroup (13 participants in low–glycemic index diet and 4 participantsin high–cereal fiber diet, P=.06).
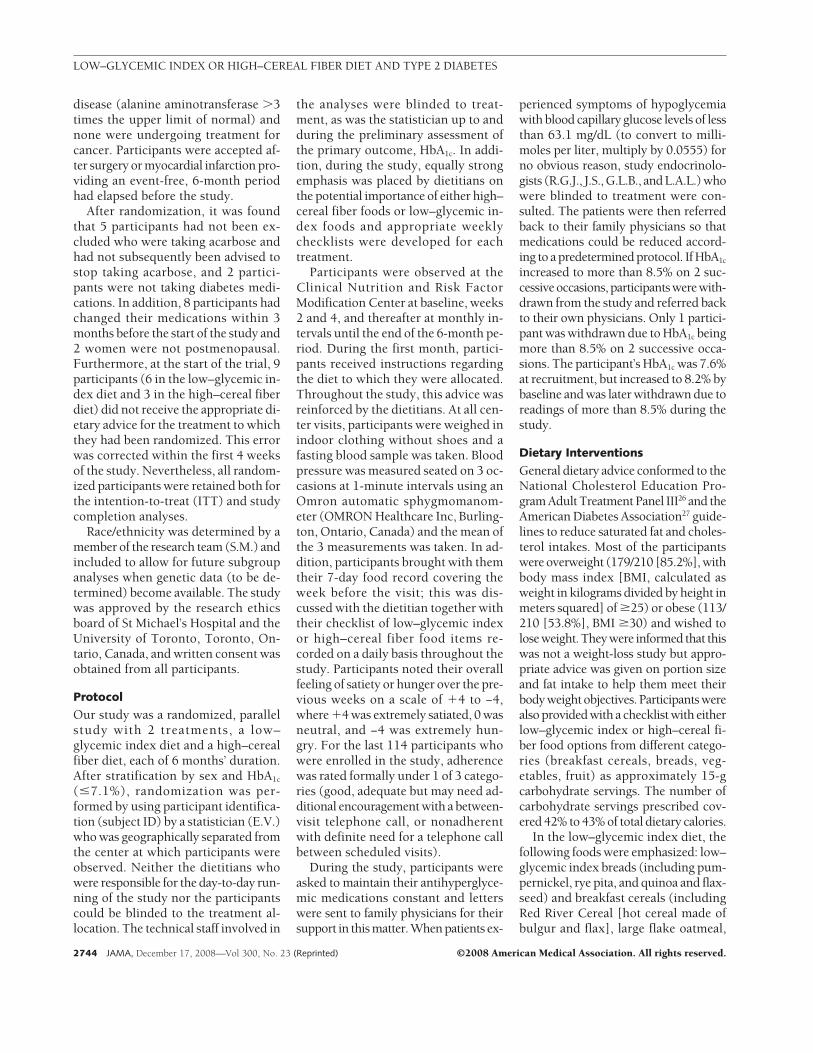
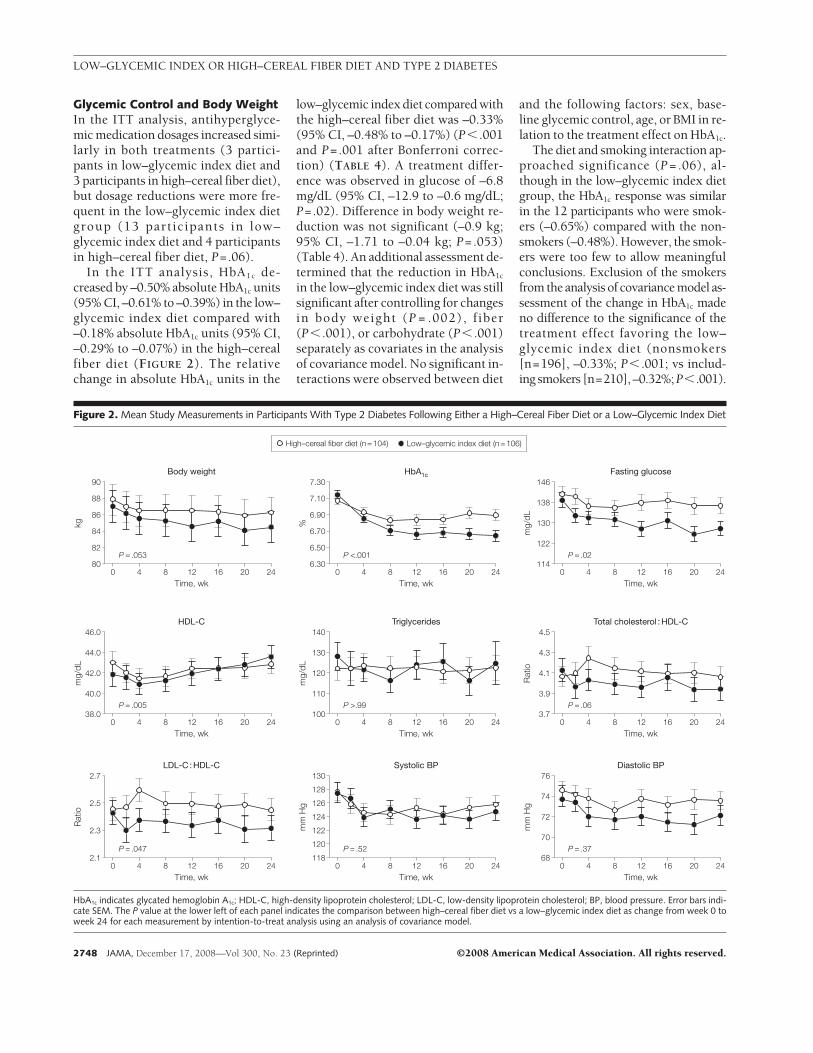
In the ITT analysis, HbA1c de-creased by –0.50% absolute HbA1c units(95% CI, –0.61% to –0.39%) in the low–glycemic index diet compared with–0.18% absolute HbA1c units (95% CI,–0.29% to –0.07%) in the high–cerealfiber diet (FIGURE 2). The relativechange in absolute HbA1c units in the
low–glycemic index diet compared withthe high–cereal fiber diet was –0.33%(95% CI, –0.48% to –0.17%) (P� .001and P=.001 after Bonferroni correc-tion) (TABLE 4). A treatment differ-ence was observed in glucose of –6.8mg/dL (95% CI, –12.9 to –0.6 mg/dL;P=.02). Difference in body weight re-duction was not significant (–0.9 kg;95% CI, –1.71 to –0.04 kg; P=.053)(Table 4). An additional assessment de-termined that the reduction in HbA1c
in the low–glycemic index diet was stillsignificant after controlling for changesin body weight (P = .002), fiber(P� .001), or carbohydrate (P� .001)separately as covariates in the analysisof covariance model. No significant in-teractions were observed between diet
and the following factors: sex, base-line glycemic control, age, or BMI in re-lation to the treatment effect on HbA1c.
The diet and smoking interaction ap-proached significance (P = .06), al-though in the low–glycemic index dietgroup, the HbA1c response was similarin the 12 participants who were smok-ers (–0.65%) compared with the non-smokers (–0.48%). However, the smok-ers were too few to allow meaningfulconclusions. Exclusion of the smokersfrom the analysis of covariance model as-sessment of the change in HbA1c madeno difference to the significance of thetreatment effect favoring the low–glycemic index diet (nonsmokers[n=196], –0.33%; P� .001; vs includ-ing smokers [n=210], –0.32%; P�.001).
Figure 2. Mean Study Measurements in Participants With Type 2 Diabetes Following Either a High–Cereal Fiber Diet or a Low–Glycemic Index Diet
High–cereal fiber diet (n = 104) Low–glycemic index diet (n = 106)
90
82
84
86
88
80P = .053
Time, wk
kg
Body weight
0 4 8 12 16 20 24
7.30
6.50
6.70
6.90
7.10
6.30
Time, wk
%
HbA1c
0 4 8 12 16 20 24
146
122
130
138
114
Time, wk
mg/
dL
Fasting glucose
0 4 8 12 16 20 24
46.0
40.0
42.0
44.0
38.0
Time, wk
mg/
dL
mg/
dL
HDL-C
0 4 8 12 16 20 24
140
110
120
130
100
Time, wk
Triglycerides
0 4 8 12 16 20 24
4.5
3.9
4.1
4.3
3.7
Time, wk
Rat
io
Total cholesterol : HDL-C
0 4 8 12 16 20 24
2.7
2.3
2.5
2.1
Time, wk
Rat
io
LDL-C : HDL-C
0 4 8 12 16 20 24
130
124
128
126
120
122
118
Time, wk
mm
Hg
Systolic BP
0 4 8 12 16 20 24
76
70
72
74
68
Time, wk
mm
Hg
Diastolic BP
0 4 8 12 16 20 24
P <.001 P = .02
P = .005 P >.99 P = .06
P = .047 P = .52 P = .37
HbA1c indicates glycated hemoglobin A1c; HDL-C, high-density lipoprotein cholesterol; LDL-C, low-density lipoprotein cholesterol; BP, blood pressure. Error bars indi-cate SEM. The P value at the lower left of each panel indicates the comparison between high–cereal fiber diet vs a low–glycemic index diet as change from week 0 toweek 24 for each measurement by intention-to-treat analysis using an analysis of covariance model.
LOW–GLYCEMIC INDEX OR HIGH–CEREAL FIBER DIET AND TYPE 2 DIABETES
2748 JAMA, December 17, 2008—Vol 300, No. 23 (Reprinted) ©2008 American Medical Association. All rights reserved.
Blood LipidsNo significant treatment differences wereobserved in lipidmedicationchanges,butsignificant treatment effects were ob-served for HDL-C and the LDL-C:HDL-C ratio (Figure 2). In the ITT analy-sis, HDL-C increased in the low–glycemic index diet group by 1.7 mg/dL(95% CI, 0.8 to 2.6 mg/dL) and de-creased by –0.2 mg/dL (95% CI, –0.9 to0.5 mg/dL) in the high–cereal fiber dietgroup (P=.005) (Table 4). Adjusting forchange in body weight, carbohydrate, orfiber intake did not affect the signifi-cance of HDL-C in the ITT cohort(P=.01, P=.004, and P=.009, respec-tively). As a consequence, the LDL-C:HDL-C ratio showed a greater reduc-tion in the low–glycemic index dietgroup (–0.12; 95% CI, –0.23 to –0.01)compared with the high–cereal fiber dietgroup (–0.01; 95% CI, –0.09 to 0.08;P=.047).
Blood Pressure
The number of participants who changedblood pressure medications was notdifferent between treatments (low–glycemic index diet, 5 increased and 5decreased; vs high–cereal fiber diet, 3 in-creased and 8 decreased; P=.18). Sys-tolic and diastolic blood pressuredropped slightly in both diets, but thetreatment differences did not reach sig-nificance (Table 4).
C-Reactive Protein
For the ITT analysis, the reductionsfrom baseline at 24 weeks were –1.6mg/L (95% CI, –2.9 to –0.3 mg/L;P=.02) in the low–glycemic index dietand –1.8 mg/L (95% CI, –3.9 to 0.4mg/L; P=.11) in the high–cereal fiberdiet (Table 4). The reductions in bothtreatments were similar (P=.78).
Associations Between GlycemicIndex, Fiber, and Body WeightWith Outcome Measures
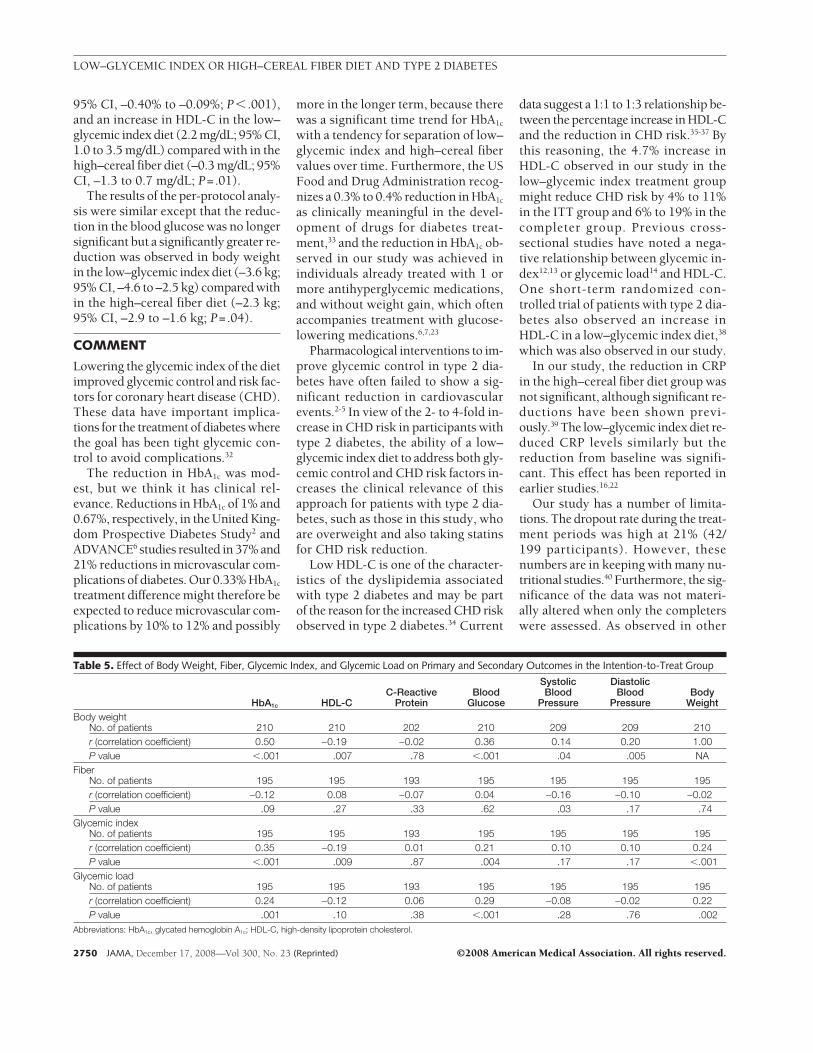
In the ITT analysis (TABLE 5), the re-duction in dietary glycemic index waspositively associated with the reduc-tion in HbA1c (n=195, r=0.35, P� .001)and negatively associated with HDL-C(n=195, r=–0.19, P=.009).
Change in body weight was signifi-cantly related to HbA1c (n=210, r=0.50,P � .001), blood glucose (n = 210,r=0.36, P � .001), systolic (n=209,r=0.14, P= .04) and diastolic bloodpressure (n=209, r=0.20, P=.005), andnegatively associated with HDL-C(n=210, r=–0.19, P=.007). No signifi-cant associations were observed with di-etary fiber apart from systolic bloodpressure (n = 195, r = –0.16, P = .03)(Table 5).
Partial correlations indicated that af-ter controlling for change in bodyweight the association between changein glycemic index and change in HbA1c
remained significant (r=0.28, P� .001),as it did after controlling for change infiber (r=0.33, P� .001). In contrast, theassociation between change in fiber andchange in HbA1c was still nonsignifi-cant after controlling for change in gly-cemic index (r=–0.02, P=.75).
Adverse Events
There were no serious adverse events di-rectly related to the study; however, ofthe 11 participants who reduced theirdiabetes medications, all 6 who had clear
evidence of hypoglycemic symptoms orlow blood glucose levels were takinglow–glycemic index diets. In addition, 1participant in the low–glycemic indexdiet was withdrawn due to high HbA1c
(�8.5%) on 2 successive measure-ments but the HbA1c had increased from7.6% at screening to 8.2% at the start ofthe study.The further increaseduring thestudy did not therefore appear related tothe intervention.
Completer and Per-ProtocolResults
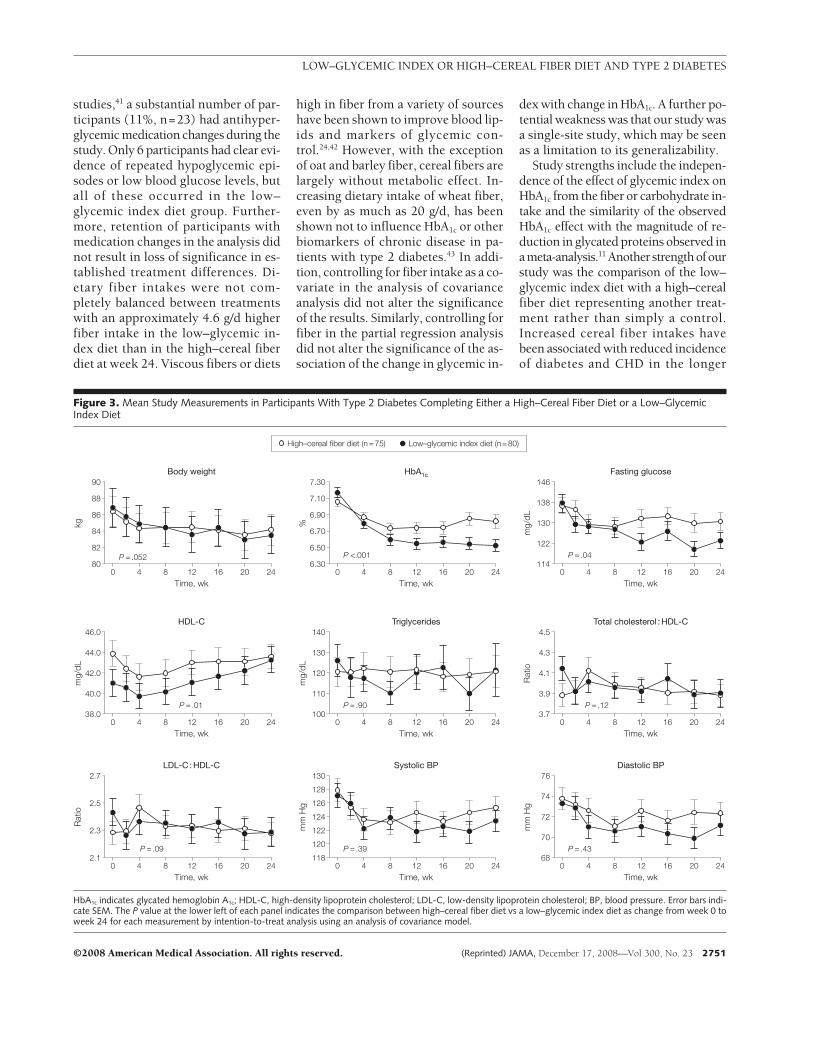
In general, the completer and per-protocol analyses confirmed the ITTanalysis but showed larger effectsizes and greater significance levels(FIGURE 3). The completer analysisshowed a significant reduction in an-tihyperglycemic medication use in thelow–glycemic index diet group (low–glycemic index diet, 13/15 medicationchanges vs high–cereal fiber diet, 3/6medication changes; P=.02). Greater re-ductions in HbA1c were observed in thelow–glycemic index diet (–0.66%; 95%CI, –0.79% to –0.53%) compared within the high–cereal fiber diet (–0.24%;
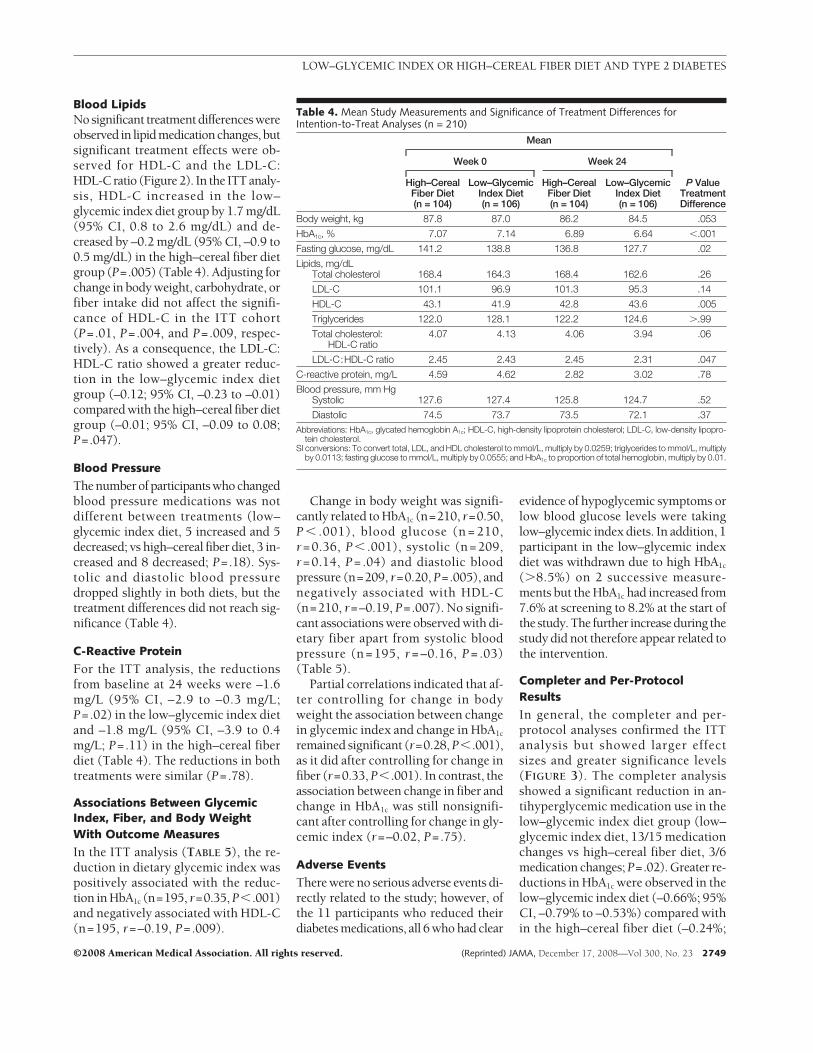
Table 4. Mean Study Measurements and Significance of Treatment Differences forIntention-to-Treat Analyses (n = 210)
Mean
P ValueTreatmentDifference
Week 0 Week 24
High–CerealFiber Diet(n = 104)
Low–GlycemicIndex Diet(n = 106)
High–CerealFiber Diet(n = 104)
Low–GlycemicIndex Diet(n = 106)
Body weight, kg 87.8 87.0 86.2 84.5 .053
HbA1c, % 7.07 7.14 6.89 6.64 �.001
Fasting glucose, mg/dL 141.2 138.8 136.8 127.7 .02
Lipids, mg/dLTotal cholesterol 168.4 164.3 168.4 162.6 .26
LDL-C 101.1 96.9 101.3 95.3 .14
HDL-C 43.1 41.9 42.8 43.6 .005
Triglycerides 122.0 128.1 122.2 124.6 �.99
Total cholesterol:HDL-C ratio
4.07 4.13 4.06 3.94 .06
LDL-C:HDL-C ratio 2.45 2.43 2.45 2.31 .047
C-reactive protein, mg/L 4.59 4.62 2.82 3.02 .78
Blood pressure, mm HgSystolic 127.6 127.4 125.8 124.7 .52
Diastolic 74.5 73.7 73.5 72.1 .37Abbreviations: HbA1c, glycated hemoglobin A1c; HDL-C, high-density lipoprotein cholesterol; LDL-C, low-density lipopro-
tein cholesterol.SI conversions: To convert total, LDL, and HDL cholesterol to mmol/L, multiply by 0.0259; triglycerides to mmol/L, multiply
by 0.0113; fasting glucose to mmol/L, multiply by 0.0555; and HbA1c to proportion of total hemoglobin, multiply by 0.01.
LOW–GLYCEMIC INDEX OR HIGH–CEREAL FIBER DIET AND TYPE 2 DIABETES
©2008 American Medical Association. All rights reserved. (Reprinted) JAMA, December 17, 2008—Vol 300, No. 23 2749
95% CI, –0.40% to –0.09%; P� .001),and an increase in HDL-C in the low–glycemic index diet (2.2 mg/dL; 95% CI,1.0 to 3.5 mg/dL) compared with in thehigh–cereal fiber diet (–0.3 mg/dL; 95%CI, –1.3 to 0.7 mg/dL; P=.01).
The results of the per-protocol analy-sis were similar except that the reduc-tion in the blood glucose was no longersignificant but a significantly greater re-duction was observed in body weightin the low–glycemic index diet (–3.6 kg;95% CI, –4.6 to –2.5 kg) compared within the high–cereal fiber diet (–2.3 kg;95% CI, –2.9 to –1.6 kg; P=.04).
COMMENT
Lowering the glycemic index of the dietimproved glycemic control and risk fac-tors for coronary heart disease (CHD).These data have important implica-tions for the treatment of diabetes wherethe goal has been tight glycemic con-trol to avoid complications.32
The reduction in HbA1c was mod-est, but we think it has clinical rel-evance. Reductions in HbA1c of 1% and0.67%, respectively, in the United King-dom Prospective Diabetes Study2 andADVANCE6 studies resulted in 37% and21% reductions in microvascular com-plications of diabetes. Our 0.33% HbA1c
treatment difference might therefore beexpected to reduce microvascular com-plications by 10% to 12% and possibly
more in the longer term, because therewas a significant time trend for HbA1c
with a tendency for separation of low–glycemic index and high–cereal fibervalues over time. Furthermore, the USFood and Drug Administration recog-nizes a 0.3% to 0.4% reduction in HbA1c
as clinically meaningful in the devel-opment of drugs for diabetes treat-ment,33 and the reduction in HbA1c ob-served in our study was achieved inindividuals already treated with 1 ormore antihyperglycemic medications,and without weight gain, which oftenaccompanies treatment with glucose-lowering medications.6,7,23
Pharmacological interventions to im-prove glycemic control in type 2 dia-betes have often failed to show a sig-nificant reduction in cardiovascularevents.2-5 In view of the 2- to 4-fold in-crease in CHD risk in participants withtype 2 diabetes, the ability of a low–glycemic index diet to address both gly-cemic control and CHD risk factors in-creases the clinical relevance of thisapproach for patients with type 2 dia-betes, such as those in this study, whoare overweight and also taking statinsfor CHD risk reduction.
Low HDL-C is one of the character-istics of the dyslipidemia associatedwith type 2 diabetes and may be partof the reason for the increased CHD riskobserved in type 2 diabetes.34 Current
data suggest a 1:1 to 1:3 relationship be-tween the percentage increase in HDL-Cand the reduction in CHD risk.35-37 Bythis reasoning, the 4.7% increase inHDL-C observed in our study in thelow–glycemic index treatment groupmight reduce CHD risk by 4% to 11%in the ITT group and 6% to 19% in thecompleter group. Previous cross-sectional studies have noted a nega-tive relationship between glycemic in-dex12,13 or glycemic load14 and HDL-C.One short-term randomized con-trolled trial of patients with type 2 dia-betes also observed an increase inHDL-C in a low–glycemic index diet,38
which was also observed in our study.In our study, the reduction in CRP
in the high–cereal fiber diet group wasnot significant, although significant re-ductions have been shown previ-ously.39 The low–glycemic index diet re-duced CRP levels similarly but thereduction from baseline was signifi-cant. This effect has been reported inearlier studies.16,22
Our study has a number of limita-tions. The dropout rate during the treat-ment periods was high at 21% (42/199 participants). However, thesenumbers are in keeping with many nu-tritional studies.40 Furthermore, the sig-nificance of the data was not materi-ally altered when only the completerswere assessed. As observed in other
Table 5. Effect of Body Weight, Fiber, Glycemic Index, and Glycemic Load on Primary and Secondary Outcomes in the Intention-to-Treat Group
HbA1c HDL-CC-Reactive
ProteinBlood
Glucose
SystolicBlood
Pressure
DiastolicBlood
PressureBody
WeightBody weight
No. of patients 210 210 202 210 209 209 210r (correlation coefficient) 0.50 −0.19 −0.02 0.36 0.14 0.20 1.00P value �.001 .007 .78 �.001 .04 .005 NA
FiberNo. of patients 195 195 193 195 195 195 195r (correlation coefficient) −0.12 0.08 −0.07 0.04 −0.16 −0.10 −0.02P value .09 .27 .33 .62 .03 .17 .74
Glycemic indexNo. of patients 195 195 193 195 195 195 195r (correlation coefficient) 0.35 −0.19 0.01 0.21 0.10 0.10 0.24P value �.001 .009 .87 .004 .17 .17 �.001
Glycemic loadNo. of patients 195 195 193 195 195 195 195r (correlation coefficient) 0.24 −0.12 0.06 0.29 −0.08 −0.02 0.22P value .001 .10 .38 �.001 .28 .76 .002
Abbreviations: HbA1c, glycated hemoglobin A1c; HDL-C, high-density lipoprotein cholesterol.
LOW–GLYCEMIC INDEX OR HIGH–CEREAL FIBER DIET AND TYPE 2 DIABETES
2750 JAMA, December 17, 2008—Vol 300, No. 23 (Reprinted) ©2008 American Medical Association. All rights reserved.
studies,41 a substantial number of par-ticipants (11%, n=23) had antihyper-glycemic medication changes during thestudy. Only 6 participants had clear evi-dence of repeated hypoglycemic epi-sodes or low blood glucose levels, butall of these occurred in the low–glycemic index diet group. Further-more, retention of participants withmedication changes in the analysis didnot result in loss of significance in es-tablished treatment differences. Di-etary fiber intakes were not com-pletely balanced between treatmentswith an approximately 4.6 g/d higherfiber intake in the low–glycemic in-dex diet than in the high–cereal fiberdiet at week 24. Viscous fibers or diets
high in fiber from a variety of sourceshave been shown to improve blood lip-ids and markers of glycemic con-trol.24,42 However, with the exceptionof oat and barley fiber, cereal fibers arelargely without metabolic effect. In-creasing dietary intake of wheat fiber,even by as much as 20 g/d, has beenshown not to influence HbA1c or otherbiomarkers of chronic disease in pa-tients with type 2 diabetes.43 In addi-tion, controlling for fiber intake as a co-variate in the analysis of covarianceanalysis did not alter the significanceof the results. Similarly, controlling forfiber in the partial regression analysisdid not alter the significance of the as-sociation of the change in glycemic in-
dex with change in HbA1c. A further po-tential weakness was that our study wasa single-site study, which may be seenas a limitation to its generalizability.
Study strengths include the indepen-dence of the effect of glycemic index onHbA1c from the fiber or carbohydrate in-take and the similarity of the observedHbA1c effect with the magnitude of re-duction in glycated proteins observed inameta-analysis.11 Another strengthofourstudy was the comparison of the low–glycemic index diet with a high–cerealfiber diet representing another treat-ment rather than simply a control.Increased cereal fiber intakes havebeen associated with reduced incidenceof diabetes and CHD in the longer
Figure 3. Mean Study Measurements in Participants With Type 2 Diabetes Completing Either a High–Cereal Fiber Diet or a Low–GlycemicIndex Diet
High–cereal fiber diet (n = 75) Low–glycemic index diet (n = 80)
90
82
84
86
88
80
Time, wk
kg
Body weight
0 4 8 12 16 20 24
7.30
6.50
6.70
6.90
7.10
6.30
Time, wk
%
HbA1c
0 4 8 12 16 20 24
146
122
130
138
114
Time, wk
mg/
dL
Fasting glucose
0 4 8 12 16 20 24
46.0
40.0
42.0
44.0
38.0
Time, wk
mg/
dL
HDL-C
0 4 8 12 16 20 24
140
110
120
130
100
Time, wk
mg/
dL
Triglycerides
0 4 8 12 16 20 24
4.5
3.9
4.1
4.3
3.7
Time, wk
Rat
io
Total cholesterol : HDL-C
0 4 8 12 16 20 24
2.7
2.3
2.5
2.1
Time, wk
Rat
io
LDL-C : HDL-C
0 4 8 12 16 20 24
128
130
120
122
124
126
118
Time, wk
mm
Hg
Systolic BP
0 4 8 12 16 20 24
76
70
72
74
68
Time, wk
mm
Hg
Diastolic BP
0 4 8 12 16 20 24
P <.001 P = .04
P = .01 P = .90 P = .12
P = .09 P = .39 P = .43
P = .052
HbA1c indicates glycated hemoglobin A1c; HDL-C, high-density lipoprotein cholesterol; LDL-C, low-density lipoprotein cholesterol; BP, blood pressure. Error bars indi-cate SEM. The P value at the lower left of each panel indicates the comparison between high–cereal fiber diet vs a low–glycemic index diet as change from week 0 toweek 24 for each measurement by intention-to-treat analysis using an analysis of covariance model.
LOW–GLYCEMIC INDEX OR HIGH–CEREAL FIBER DIET AND TYPE 2 DIABETES
©2008 American Medical Association. All rights reserved. (Reprinted) JAMA, December 17, 2008—Vol 300, No. 23 2751
term8,9,23-25 and so provided a reason fordietary adherence.
Body weight is recognized as a ma-jor determinant of glycemic con-trol.27,44 However, in our study, thetreatment difference in HbA1c re-mained even after controlling for bodyweight. Neither the effect of over-weight nor the interaction of diet withoverweight was significant. Low–glycemic index or low–glycemic loaddiets have been associated with weightloss,45,46 although the weight loss wasnot significant (P= .053) in the ITTanalysis of our study. At the same time,weight loss resulting from altered in-sulin economy may be one of themechanisms through which low–glycemic index diets improve glyce-mic control.47 Furthermore, interven-tions that improve glycemic controlwithout increasing body weight con-fer an additional benefit in diabetesmanagement by avoiding the macro-vascular complications that may be as-sociated with weight gain.7
In conclusion, in this study of pa-tients with type 2 diabetes, 6-monthtreatment with a low–glycemic indexdiet resulted in moderately lower HbA1c
levels compared with a high–cereal fi-ber diet. Low–glycemic index diets maybe useful as part of the strategy to im-prove glycemic control in patients withtype 2 diabetes taking antihyperglyce-mic medications.27,48
Author Affiliations: Clinical Nutrition and Risk FactorModification Center (Drs Jenkins, Kendall, R. Josse,and Leiter, and Messrs Vidgen and Nguyen, and MssCorrigan, Banach, Ares, Mitchell, Emam, Augustin, andParker) and Division of Endocrinology and Metabo-lism (Drs Jenkins, R. Josse, and Leiter), St Michael’sHospital, Toronto, Ontario; Dalla Lana School ofPublic Health (Dr McKeown-Eyssen), Departmentof Nutritional Sciences (Drs Jenkins, Kendall,McKeown-Eyssen, R. Josse, and Leiter, and Messrs Vid-gen and Nguyen, and Mss A. Josse, Banach, Emam,and Augustin), and Department of Medicine (Drs Jen-kins, R. Josse, Silverberg, Booth, and Leiter), Univer-sity of Toronto, Toronto, Ontario; Sunnybrook andWomen’s College Health Sciences Center,Toronto, On-tario (Dr Silverberg); and College of Pharmacy and Nu-trition, University of Saskatchewan, Saskatoon,Saskatchewan (Dr Kendall), Canada.Author Contributions: Drs Jenkins and Kendall had fullaccess to all of the data in the study and take respon-sibility for the integrity of the data and the accuracyof the data analysis.Study concept and design: Jenkins, Kendall,McKeown-Eyssen, R. Josse, Booth, Vidgen, Leiter.Acquisition of data: Jenkins, Kendall, Vidgen, A. Josse,Nguyen, Ares, Mitchell, Emam, Augustin, Parker.
Analysis and interpretation of data: Jenkins, Kendall,McKeown-Eyssen, R. Josse, Silverberg, Booth, Vidgen,Nguyen, Corrigan, Banach, Parker.Drafting of the manuscript: Jenkins, Kendall,McKeown-Eyssen, Corrigan, Banach, Augustin.Critical revision of the manuscript for important in-tellectual content: Jenkins, Kendall, McKeown-Eyssen,R. Josse, Silverberg, Booth, Vidgen, A. Josse, Nguyen,Ares, Mitchell, Emam, Parker, Leiter.Statistical analysis: Vidgen.Obtained funding: Jenkins, Kendall, McKeown-Eyssen.Administrative, technical, or material support: Kendall,A. Josse, Nguyen, Corrigan, Banach, Ares, Mitchell,Emam, Augustin, Parker.Study supervision: Jenkins, Kendall, R. Josse, Silverberg,Booth, Leiter.Financial Disclosures: Dr Jenkins reported serving onthe Scientific Advisory Board of Unilever, the Sani-tarium Company, and the California Strawberry Com-mission; receiving honoraria for scientific advice fromthe Almond Board of California, Barilla, and UnileverCanada; being on the speaker’s panel for the Al-mond Board of California; and receiving research grantsfrom Loblaws, Unilever, Barilla, and the Almond Boardof California. His wife is a director of Glycemic IndexLaboratories, Toronto, Ontario, Canada. Dr Kendallreported having been on the speaker’s panel for theAlmond Board of California and receiving partial sal-ary funding from research grants provided by Unile-ver, Loblaws, and the Almond Board of California. MrVidgen reported receiving partial salary funding fromresearch grants provided by Unilever, Loblaws, andthe Almond Board of California. No other authors re-ported any financial disclosures.Funding/Support: This work was supported by the Ca-nadian Institutes of Health Research, Canada Re-search Chair Endowment of the Federal Governmentof Canada, and Barilla (Italy).Role of the Sponsors: None of the funding organiza-tions or sponsors played any role in the design andconduct of the study, in the collection, management,analysis, and interpretation of the data, or in the prepa-ration, review, or approval of the manuscript.Additional Contributions: We thank Roberto Ciati,PhD, and Marta Bianchi, PhD (Barilla, Italy), for theirassistance with the study, and to the study partici-pants for their attention to detail and enthusiasm. Nocompensation was given.
REFERENCES
1. Knowler WC, Barrett-Connor E, Fowler SE, et al;Diabetes Prevention Program Research Group. Re-duction in the incidence of type 2 diabetes with life-style intervention or metformin. N Engl J Med. 2002;346(6):393-403.2. UK Prospective Diabetes Study (UKPDS) Group. In-tensive blood-glucose control with sulphonylureasor insulin compared with conventional treatmentand risk of complications in patients with type 2 dia-betes (UKPDS 33). Lancet. 1998;352(9131):837-853.3. Meinert CL, Knatterud GL, Prout TE, Klimt CR. Astudy of the effects of hypoglycemic agents on vas-cular complications in patients with adult-onset dia-betes, II: mortality results. Diabetes. 1970;19(suppl):789-830.4. Nissen SE, Wolski K. Effect of rosiglitazone on therisk of myocardial infarction and death from cardio-vascular causes. N Engl J Med. 2007;356(24):2457-2471.5. National Heart, Lung, and Blood Institute. For safety,NHLBI changes intensive blood sugar treatment strat-egy in clinical trial of diabetes and cardiovasculardisease. http://public.nhlbi.nih.gov/newsroom/home/GetPressRelease.aspx?id=2551. Released February 6,2008. Accessed November 6, 2008.6. Patel A, MacMahon S, Chalmers J, et al; ADVANCE
Collaborative Group. Intensive blood glucose controland vascular outcomes in patients with type 2 diabetes.N Engl J Med. 2008;358(24):2560-2572.7. Gerstein HC, Miller ME, Byington RP, et al; Actionto Control Cardiovascular Risk in Diabetes Study Group.Effects of intensive glucose lowering in type 2 diabetes.N Engl J Med. 2008;358(24):2545-2559.8. Salmeron J, Ascherio A, Rimm EB, et al. Dietary fi-ber, glycemic load, and risk of NIDDM in men. Dia-betes Care. 1997;20(4):545-550.9. Salmeron J, Manson JE, Stampfer MJ, Colditz GA,Wing AL, Willett WC. Dietary fiber, glycemic load, andrisk of non-insulin-dependent diabetes mellitus inwomen. JAMA. 1997;277(6):472-477.10. Liu S, Willett WC, Stampfer MJ, et al. A prospec-tive study of dietary glycemic load, carbohydrate in-take, and risk of coronary heart disease in US women.Am J Clin Nutr. 2000;71(6):1455-1461.11. Brand-Miller J, Hayne S, Petocz P, Colagiuri S. Low-glycemic index diets in the management of diabetes:a meta-analysis of randomized controlled trials. Dia-betes Care. 2003;26(8):2261-2267.12. Ford ES, Liu S. Glycemic index and serum high-density lipoprotein cholesterol concentration amongus adults. Arch Intern Med. 2001;161(4):572-576.13. Frost G, Leeds AA, Dore CJ, Madeiros S, BradingS, Dornhorst A. Glycaemic index as a determinant ofserum HDL-cholesterol concentration. Lancet. 1999;353(9158):1045-1048.14. Liu S, Manson JE, Stampfer MJ, et al. Dietary gly-cemic load assessed by food-frequency question-naire in relation to plasma high-density-lipoprotein cho-lesterol and fasting plasma triacylglycerols inpostmenopausal women. Am J Clin Nutr. 2001;73(3):560-566.15. Järvi AE, Karlström BE, Granfeldt YE, Björck IE, AspNG, Vessby BO. Improved glycemic control and lipidprofile and normalized fibrinolytic activity on a low-glycemic index diet in type 2 diabetic patients. Dia-betes Care. 1999;22(1):10-18.16. Liu S, Manson JE, Buring JE, Stampfer MJ, WillettWC, Ridker PM. Relation between a diet with a highglycemic load and plasma concentrations of high-sensitivity C-reactive protein in middle-aged women.Am J Clin Nutr. 2002;75(3):492-498.17. Chiasson JL, Josse RG, Gomis R, Hanefeld M,Karasik A, Laakso M. Acarbose for prevention of type2 diabetes mellitus: the STOP-NIDDM randomised trial.Lancet. 2002;359(9323):2072-2077.18. Chiasson JL, Josse RG, Gomis R, Hanefeld M,Karasik A, Laakso M. Acarbose treatment and therisk of cardiovascular disease and hypertension inpatients with impaired glucose tolerance: theSTOP-NIDDM trial. JAMA. 2003;290(4):486-494.19. Coulston AM, Reaven GM. Much ado about (al-most) nothing. Diabetes Care. 1997;20(3):241-243.20. Franz MJ. The glycemic index: not the most ef-fective nutrition therapy intervention. Diabetes Care.2003;26(8):2466-2468.21. Pi-Sunyer X. Glycemic index in early type 2diabetes. Am J Clin Nutr. 2008;87(1):3-4.22. Wolever TMS, Gibbs AL, Mehling C, et al. TheCanadian Trial of Carbohydrates in Diabetes (CCD),a 1-y controlled trial of low-glycemic-index dietary car-bohydrate in type 2 diabetes: no effect on glycatedhemoglobin but reduction in C-reactive protein. AmJ Clin Nutr. 2008;87(1):114-125.23. Anderson JW, Randles KM, Kendall CW, JenkinsDJ. Carbohydrate and fiber recommendations for in-dividuals with diabetes: a quantitative assessment andmeta-analysis of the evidence. J Am Coll Nutr. 2004;23(1):5-17.24. Chandalia M, Garg A, Lutjohann D, von BergmannK, Grundy SM, Brinkley LJ. Beneficial effects of highdietary fiber intake in patients with type 2 diabetesmellitus. N Engl J Med. 2000;342(19):1392-1398.
LOW–GLYCEMIC INDEX OR HIGH–CEREAL FIBER DIET AND TYPE 2 DIABETES
2752 JAMA, December 17, 2008—Vol 300, No. 23 (Reprinted) ©2008 American Medical Association. All rights reserved.
25. Schulze MB, Liu S, Rimm EB, Manson JE, WillettWC, Hu FB. Glycemic index, glycemic load, and di-etary fiber intake and incidence of type 2 diabetes inyounger and middle-aged women. Am J Clin Nutr.2004;80(2):348-356.26. National Cholesterol Education Program. Execu-tive Summary of the Third Report of the National Cho-lesterol Education Program (NCEP) Expert Panel onDetection, Evaluation, and Treatment of High BloodCholesterol in Adults (Adult Treatment Panel III). JAMA.2001;285(19):2486-2497.27. Franz MJ, Bantle JP, Beebe CA, et al; AmericanDiabetes Association. Nutrition principles and recom-mendations in diabetes. Diabetes Care. 2004;27(suppl 1):S36-S46.28. Friedewald WT, Levy RI, Fredrickson DS. Estima-tion of the concentration of low-density lipoproteincholesterol in plasma, without use of the preparativeultracentrifuge. Clin Chem. 1972;18(6):499-502.29. US Department of Agriculture. Composition ofFoods, Agriculture Handbook No. 8: The Agricul-tural Research Service. Washington, DC: US Dept ofAgriculture; 1992.30. Foster-Powell K, Holt SH, Brand-Miller JC. Inter-national table of glycemic index and glycemic load val-ues: 2002. Am J Clin Nutr. 2002;76(1):5-56.31. SAS/STAT User’s Guide, version 9.1.2. Cary, NC:SAS Institute Inc; 2006.32. American Diabetes Association. Standards of medi-cal care in diabetes: 2007. Diabetes Care. 2007;30(Suppl 1):S4-S41.33. US Food and Drug Administration. Guidance forindustry: diabetes mellitus: developing drugs and thera-peutic biologics for treatment and prevention. http://www.fda.gov/cder/guidance/7630dft.pdf. Re-
leased February 13, 2008. Accessed November 6,2008.34. Ginsberg HN. Lipoprotein physiology in nondia-betic and diabetic states: relationship to atherogenesis.Diabetes Care. 1991;14(9):839-855.35. Robins SJ, Collins D, Wittes JT, et al. Relation ofgemfibrozil treatment and lipid levels with major coro-nary events: VA-HIT: a randomized controlled trial.JAMA. 2001;285(12):1585-1591.36. Schaefer EJ, Lamon-Fava S, Ordovas JM, et al. Fac-tors associated with low and elevated plasma high den-sity lipoprotein cholesterol and apolipoprotein A-I lev-els in the Framingham Offspring Study. J Lipid Res.1994;35(5):871-882.37. Manninen V, Tenkanen L, Koskinen P, et al. Jointeffects of serum triglyceride and LDL cholesterol andHDL cholesterol concentrations on coronary heart dis-ease risk in the Helsinki Heart Study: implications fortreatment. Circulation. 1992;85(1):37-45.38. Luscombe ND, Noakes M, Clifton PM. Diets highand low in glycemic index versus high monounsatu-rated fat diets: effects on glucose and lipid metabo-lism in NIDDM. Eur J Clin Nutr. 1999;53(6):473-478.39. Ajani UA, Ford ES, Mokdad AH. Dietary fiber andC-reactive protein: findings from National Health andNutrition Examination Survey data. J Nutr. 2004;134(5):1181-1185.40. Dansinger ML, Gleason JA, Griffith JL, Selker HP,Schaefer EJ. Comparison of the Atkins, Ornish, WeightWatchers, and Zone diets for weight loss and heartdisease risk reduction: a randomized trial. JAMA. 2005;293(1):43-53.41. Barnard ND, Cohen J, Jenkins DJ, et al. A low-fatvegan diet improves glycemic control and cardiovas-
cular risk factors in a randomized clinical trial in indi-viduals with type 2 diabetes. Diabetes Care. 2006;29(8):1777-1783.42. Jenkins DJ, Newton C, Leeds AR, Cummings JH.Effect of pectin, guar gum, and wheat fibre onserum-cholesterol. Lancet. 1975;1(7916):1116-1117.43. Jenkins DJ, Kendall CW, Augustin LS, et al. Effectof wheat bran on glycemic control and risk factors forcardiovascular disease in type 2 diabetes. Diabetes Care.2002;25(9):1522-1528.44. Klein S, Sheard NF, Pi-Sunyer X, et al; AmericanDiabetes Association; North American Association forthe Study of Obesity; American Society for ClinicalNutrition. Weight management through lifestyle modi-fication for the prevention and management of type2 diabetes: rationale and strategies: a statement of theAmerican Diabetes Association, the North AmericanAssociation for the Study of Obesity, and the Ameri-can Society for Clinical Nutrition. Diabetes Care. 2004;27(8):2067-2073.45. Ebbeling CB, Ludwig DS. Treating obesity in youth:should dietary glycemic load be a consideration? AdvPediatr. 2001;48:179-212.46. Maki KC, Rains TM, Kaden VN, Raneri KR, DavidsonMH. Effects of a reduced-glycemic-load diet on bodyweight, body composition, and cardiovascular diseaserisk markers in overweight and obese adults. Am J ClinNutr. 2007;85(3):724-734.47. Ebbeling CB, Leidig MM, Feldman HA, LoveskyMM, Ludwig DS. Effects of a low-glycemic load vs low-fat diet in obese young adults: a randomized trial.JAMA. 2007;297(19):2092-2102.48. Miles JM. A role for the glycemic index in pre-venting or treating diabetes? Am J Clin Nutr. 2008;87(1):1-2.
LOW–GLYCEMIC INDEX OR HIGH–CEREAL FIBER DIET AND TYPE 2 DIABETES
©2008 American Medical Association. All rights reserved. (Reprinted) JAMA, December 17, 2008—Vol 300, No. 23 2753