Relationships between digestibilities of food components and characteristics of wheats ( Triticum...
12
1 2 3 4 5 6 7 8 9 10111 1 2 3 4 5 6 7 8 9 20111 1 2 3 4 5 6 7 8 9 30111 1 2 3 4 5 6 7 8 9 40111 1 2 3 4 5 6 7 8 9 50111 1 2 3 4 5 6 7 8 9 60111 INTRODUCTION Wheat can be used as a major source of energy in diets given to broiler chickens. However, metabolisable energy (ME) of wheats given to broiler chickens can vary considerably between samples (Mollah et al., 1983; Rogel et al., 1987; Nicol et al., 1993), which requires the quality of wheat samples to be known to optimise their utilisation. Relationships between digestibilities of food components and characteristics of wheats (Triticum aestivum) introduced as the only cereal source in a broiler chicken diet B. CARRÉ, A. IDI 1 , S. MAISONNIER, J.-P. MELCION 2 , F.-X. OURY 3 , J. GOMEZ AND P. PLUCHARD 4 tation de Recherches Avicoles, INRA, Nouzilly, France. 1 Recherche Avicole, DRZ, INRAN, Niamey, Niger, 2 PHYTEC, Nantes, 3 Unité d’Amélioration des Plantes, Domaine de Crouël, Clermont-Ferrand and 4 Unité de Génétique et d’Amélioration des Plantes, Domaine de Brunehaut, Estrées-Mons, INRA, France ISSN 0007–1668(print)/ISSN 1466–1799(online)/02/030404–12 © 2002 British Poultry Science Ltd DOI: 10.1080/00071660120103684 Correspondence to: B. Carré, Station de Recherches Avicoles, INRA, Nouzilly, France. E-mail: [email protected] Accepted for publication 2nd November 2001. Abstract 1. The aim of the experiment was to establish relationships between chemical or physi- cal characteristics of wheats (Triticum aestivum) and digestibilities of food components in broiler chickens fed on wheat-based diets. Twenty-two wheat samples, each differing by their cultivar origin, were included at 550 g/kg in diets offered to male Ross broiler chicks. The other main ingredients were soya bean meal (340 g/kg) and rapeseed oil (68× 5 g/kg). Diets were given as pellets. 2. In vitro viscosities of wheats measured as potential applied viscosity (PAV) or real applied viscos- ity (RAV) varied between 1× 91 and 6× 03, or between 0× 95 and 3× 81 ml/g (dry matter basis), respec- tively. Hardness of wheats varied between 17 (soft) and 95 (very hard), and lipase activity of wheats varied from 1 to 13× 6 (relative scale). 3. PAV and RAV values were not signi cantly correlated with hardness. PAV and RAV values were correlated with (80:20) ethanol:water insoluble, water soluble arabinoxylans (r = 0× 961, 0× 932, respectively), with the amount of water retained by cell walls (r = 0× 656, 0× 492, respectively), and with lipase activity (r = 0× 600, 0× 532, respectively. 4. Hardness was correlated with ash (r = –0× 484), nitrogen (r = 0× 534), mean particle size of wheat ours (r = 0× 631), and speci c energy of pelleting (r = –0× 574). 5. Wheat diets were evaluated in two assays with 3-week-old chicks, with 11 diets per assay. In each assay, a balance experiment was carried out using the total collection method. Growth performance was also measured during the balance experiment. 6. In vitro viscosity parameters were negatively correlated with diet AME n (P < 0× 05), lipid digestibil- ity (P < 0× 05) and, to a lesser extent, protein digestibility (P < 0× 05). In vitro viscosity data were pos- itively correlated with food:gain ratio (P < 0× 05) and water loss parameters (P < 0× 05), and were not signi cantly (P > 0× 05) correlated with starch digestibility. 7. Wheat hardness-related parameters were correlated (P < 0× 01) with individual starch digestibil- ity (hardness, proportion of coarse particles in wheat our, speci c energy of pelleting: r = –0× 273, –0× 305, 0× 212, respectively). 8. Wheat lipase activity was negatively correlated with individual lipid (r = –0× 179; P < 0× 05) and starch (r = –0× 225; P < 0× 01) digestibilities and with individual diet AME n (r = –0× 266; P < 0× 001). Individual diet AME n values were correlated (r = 0× 175) with the values calculated by the EU AME n prediction equation (Fisher and McNab, 1987). Among the correlations observed between the indi- vidual measured AME n :EU predicted AME n ratio and wheat parameters (P < 0× 05), the correlation obtained with wheat lipase was the highest (r = –0× 195). The correlations with lipase could be explained in part by strong correlations between lipase and in vitro viscosity parameters.
Transcript of Relationships between digestibilities of food components and characteristics of wheats ( Triticum...

123456789101111234567892011112345678930111123456789401111234567895011112345678960111
INTRODUCTION
Wheat can be used as a major source of energyin diets given to broiler chickens. However,metabolisable energy (ME) of wheats given to
broiler chickens can vary considerably betweensamples (Mollah et al., 1983; Rogel et al., 1987;Nicol et al., 1993), which requires the quality ofwheat samples to be known to optimise theirutilisation.
Relationships between digestibilities of food components and characteristics of wheats (Triticum aestivum) introduced as the onlycereal source in a broiler chicken dietB. CARRÉ, A. IDI1, S. MAISONNIER, J.-P. MELCION2, F.-X. OURY3, J. GOMEZ AND P. PLUCHARD4
tation de Recherches Avicoles, INRA, Nouzilly, France. 1Recherche Avicole, DRZ, INRAN, Niamey, Niger,2PHYTEC, Nantes, 3Unité d’Amélioration des Plantes, Domaine de Crouël, Clermont-Ferrand and4Unité de Génétique et d’Amélioration des Plantes, Domaine de Brunehaut, Estrées-Mons, INRA, France
ISSN 0007–1668(print)/ISSN 1466–1799(online)/02/030404–12 © 2002 British Poultry Science Ltd DOI: 10.1080/00071660120103684
Correspondence to: B. Carré, Station de Recherches Avicoles, INRA, Nouzilly, France. E-mail: [email protected] for publication 2nd November 2001.
Abstract 1. The aim of the experiment was to establish relationships between chemical or physi-cal characteristics of wheats (Triticum aestivum) and digestibilities of food components in broilerchickens fed on wheat-based diets. Twenty-two wheat samples, each differing by their cultivar origin,were included at 550 g/kg in diets offered to male Ross broiler chicks. The other main ingredientswere soya bean meal (340 g/kg) and rapeseed oil (68× 5 g/kg). Diets were given as pellets.2. In vitro viscosities of wheats measured as potential applied viscosity (PAV) or real applied viscos-ity (RAV) varied between 1 × 91 and 6 × 03, or between 0× 95 and 3× 81 ml/g (dry matter basis), respec-tively. Hardness of wheats varied between 17 (soft) and 95 (very hard), and lipase activity of wheatsvaried from 1 to 13 × 6 (relative scale).3. PAV and RAV values were not signi� cantly correlated with hardness. PAV and RAV values werecorrelated with (80:20) ethanol:water insoluble, water soluble arabinoxylans (r = 0× 961, 0 × 932,respectively), with the amount of water retained by cell walls (r = 0 × 656, 0 × 492, respectively), andwith lipase activity (r = 0× 600, 0× 532, respectively.4. Hardness was correlated with ash (r = –0 × 484), nitrogen (r = 0 × 534), mean particle size of wheat� ours (r = 0× 631), and speci� c energy of pelleting (r = –0× 574).5. Wheat diets were evaluated in two assays with 3-week-old chicks, with 11 diets per assay. In eachassay, a balance experiment was carried out using the total collection method. Growth performancewas also measured during the balance experiment.6. In vitro viscosity parameters were negatively correlated with diet AMEn (P < 0× 05), lipid digestibil-ity (P < 0 × 05) and, to a lesser extent, protein digestibility (P < 0 × 05). In vitro viscosity data were pos-itively correlated with food:gain ratio (P < 0 × 05) and water loss parameters (P < 0× 05), and were notsigni� cantly (P > 0 × 05) correlated with starch digestibility.7. Wheat hardness-related parameters were correlated (P < 0 × 01) with individual starch digestibil-ity (hardness, proportion of coarse particles in wheat � our, speci� c energy of pelleting: r = –0 × 273,–0 × 305, 0 × 212, respectively).8. Wheat lipase activity was negatively correlated with individual lipid (r = –0 × 179; P < 0 × 05) andstarch (r = –0× 225; P < 0 × 01) digestibilities and with individual diet AMEn (r = –0 × 266; P < 0× 001).Individual diet AMEn values were correlated (r = 0× 175) with the values calculated by the EU AMEn
prediction equation (Fisher and McNab, 1987). Among the correlations observed between the indi-vidual measured AMEn:EU predicted AMEn ratio and wheat parameters (P < 0 × 05), the correlationobtained with wheat lipase was the highest (r = –0× 195). The correlations with lipase could beexplained in part by strong correlations between lipase and in vitro viscosity parameters.

123456789101111234567892011112345678930111123456789401111234567895011112345678960111
DIGESTIBILITIES AND WHEAT CHARACTERISTICS 405
Accordingly, establishing relationships bet-ween bird responses and chemical or physicalcharacteristics of wheats is needed to predictthe quality of wheat samples. The relationshipspreviously obtained showed con� icting results.For instance, Huyghebaert and Schöner (1999)and McCracken and Quintin (2000) found asigni� cant positive correlation between wheatME and speci� c weight, while Wiseman (2000)failed to � nd such a correlation. Annison(1991) found a strong negative correlationbetween wheat AMEn and water-soluble arabi-noxylans, but Nicol et al. (1993) did not con� rmthis observation.
One of the dif� culties in the nutritionalstudies conducted on wheats is probably thevariability in the response of birds fed on wheatdiets (Choct et al., 1999). The other problem,as suggested by Wiseman (2000), is related to the multiplicity of reasons that probablyexplain wheat ME variations. Many studies onwheat were con� ned to investigation of onlyone factor, such as the viscosity associated with water-soluble non-starch polysaccharides(Annison, 1991; Choct and Annison, 1992;Nicol et al., 1993), in a way similar to that devel-oped for rye (Antoniou et al., 1981; Campbell etal., 1983; Bedford and Classen, 1993) or barley(Hesselman et al., 1981; Campbell et al., 1989;Rotter et al., 1989; Almirall et al., 1995; Svihus et al., 1997).
However, the viscosity of wheat is low com-pared with that of rye and barley (Carré et al.,1994). Thus, other factors, such as hardness,should also be investigated. Hardness has beeninvestigated by Rogel et al. (1987) but the rangeof hardness was low. Moreover, variation in vis-cosity of wheats was not investigated.
The present experiment was undertaken toestablish relationships between digestibilities offood components and several wheat character-istics of which hardness and viscosity were givenparticular attention. Thus, wheat samples werechosen in order to obtain a large range in thesetwo latter parameters. Lipase activity of wheatsamples was also examined, as such an activitymay release free fatty acids which coulddecrease lipid digestibility (Wiseman, 1990).
MATERIALS AND METHODS
Birds and management
Two assays were conducted under the same con-ditions with a 10 week interval between them.For each assay, 200 Ross male broiler chickenswere placed in metal cages (30 cm length, 30cm width, 36 cm height) at one day old, withtwo or three birds per cage. The cages wereplaced in two identical ventilated rooms with
controlled light (23 h light/d) and temperature(32°C for 3 d and steadily reduced to 24°C at d21). Birds were fed on a standard grower dietuntil 18 d of age. At d 18, chickens wereweighed, and 88 of them were selected in orderto obtain 11 groups (8 birds/group) with thesame mean weight. Each group was distributedequally in the two rooms and randomly allo-cated to individual cages. Each cage was pro-vided with an individual feeder, drinker andplastic tray for total collection of excreta. Fromd 18 to d 25, each group received one of the 22experimental diets for a balance experiment,with 11 different diets per assay.
Balance experiment
A balance experiment was conducted using amethod similar to that described by Bourdillonet al. (1990a): at d 18, birds were given theexperimental diets ad libitum for 80 h, fasted for16 h, weighed, refed for 56 h, then fasted for16 h and weighed. Individual food intakes weremeasured daily and excreta were individuallycollected daily for the last feeding and fastingperiods. After each collection, droppings wereweighed and immediately stored at –20°C.Subsequently, the droppings were freeze-dried,weighed, ground through a 0 × 5 mm screen andstored at +4°C until analysis. Water losses weremeasured as the weight decrease followingfreeze-drying. During the balance experiment,vent scores (0 to 5, with the highest score beingrelated to the dirtiest vent) were assessed by 4people for each bird fed ad libitum. Sub-sequently, a mean value was obtained for eachbird.
Diets
The ingredient composition of the 22 experi-mental diets is shown in Table 1. The cultivarname of each wheat sample is shown in Table2. The selection of samples was as follows: 10 kgsamples from 51 cultivars harvested in 1996were received from Domaine de Brunehaut,INRA (80200 Estrées-Mons, France). Each ofthe 51 wheat samples was analysed for its realapplied viscosity (RAV) value (Carré et al.,1994). From the results, 22 samples were chosenin order to obtain wide variations in RAV andhardness values, with regular intervals betweenRAV values. The distribution of the 22 selectedwheat samples between the two assays was donein order to obtain similar means and standarddeviations in the two assays for RAV and hard-ness values.
Before mixing diets, wheat samples wereground through a 3 mm screen. Mixed dietswere pelleted with a 15 k W pellet mill (PSI-La
12
3 4 5678
9101111 2 3 4 5 6 7 8 9201111 2 3 4 5 6 7 8 9301111 2 3 4 5 6 7 8 9401111 2 3 4 5 6 7 8 9501111 2 3 4 5 6 7 8 960111
Meccanica, Cittadella, Italy) using a die with amedium compression ratio and no steam addi-tion. The die size was 2 × 5 mm in diameter and35 mm in length. The power of the main motorof the press and the output of pellets were mea-sured for calculating the speci� c energy con-sumption (J/g), a � gure that represents theintensity of the pelleting treatment. The outlettemperatures were low and did not vary con-siderably between diets (47 to 51°C).
Experimental diets were offered to birds 7(1st assay) or 9 (2nd assay) months after wheatharvest.
Analyses
Gross energy values of diets and freeze-drieddroppings were measured using an isoperibolcalorimeter (IKA-Kalorimeter C 700) main-tained in a room at 22 to 25°C. Lipid contentswere measured in diets and freeze-dried excretausing petroleum ether extraction after a pre-vious acid treatment (AFNOR, 1985). Starchcontents were measured in diets and freeze-dried excreta using the amyloglucosidase-dimethyl sulphoxide method as described byCarré et al. (1991). Protein (N 6 × 25) contentof excreta was measured using the method of
Terpstra and De Hart (1974). Water, nitrogen(wheats and diets) and ash contents (wheats)were measured according to of� cial analyticalmethods (AFNOR, 1985). Water-insoluble cellwalls (WICW) were measured in wheats as des-cribed by Carré and Brillouet (1989). Waterretention of wheat cell walls, potential (PAV)and real applied viscosities (RAV) of wheats anddiets were measured as described by Carré et al.(1994). For PAV determinations, a boiling(80:20) ethanol:water treatment was used toinactivate enzyme activities prior to aqueousextraction (Carré et al. 1994).
Water-soluble arabinoxylans of wheats weremeasured as the free arabinose and xylose unitsmeasured in acid hydrolysates (1M sulphuricacid at 100°C, 150 min) of the PAV aqueousextracts, using gas chromatography of alditol-acetate derivatives of neutral sugars (Blakeneyet al., 1983).
Lipase activity of wheats was determined bymeasuring the degradation percentage oftriglycerides (1 × 9 g rapeseed oil) mixed with 15g of wheat ground on a 3 mm screen, after 4weeks at ambient temperature: after 4 weeks,lipids were extracted with diethyl-ether and sep-arated into free fatty acids, mono-, di- andtriglycerides by thin-layer chromatography and� ame-ionisation detection (Iatroscan MK5,Iatron) using an elution performed with cyclo-hexane:chloroform:formic acid (65:35:1.7,v:v:v)for 27 min.
Hardness of wheats was estimated usingnear infra-red re� ectance spectrometry accord-ing to AACC (1995), using a wholemeal � ourproduced on a Cyclotec mill � tted with a 0 × 8mm sieve.
Particle size determination of the 3 mmground wheats was carried out in duplicate 100-g samples with a laboratory siever Bühler MLU300 (Bühler-Miag, 9240 Uzwil, Switzerland)using a set of woven-wire cloth sieves with adiameter of 26 cm (12 sieves maximum). Thesieve openings were chosen according to theAFNOR (1970) speci� cations NF X 11-501within a 3200 to 100 m m range. The sieving timewas 15 min.
Calculations
Apparent metabolisable energy values cor-rected to zero nitrogen retention (AMEn) werecalculated on the basis of weight gain asdescribed by Bourdillon et al. (1990b). PredictedAMEn values of diets were calculated using themeasured lipid, starch and crude protein con-tents and the calculated sugar content of diets(56 g/kg dry matter), according to Fisher andMcNab (1987).
Pooling the data from the two assays, a lin-ear regression was calculated to relate individual
123456789101111234567892011112345678930111123456789401111234567895011112345678960111
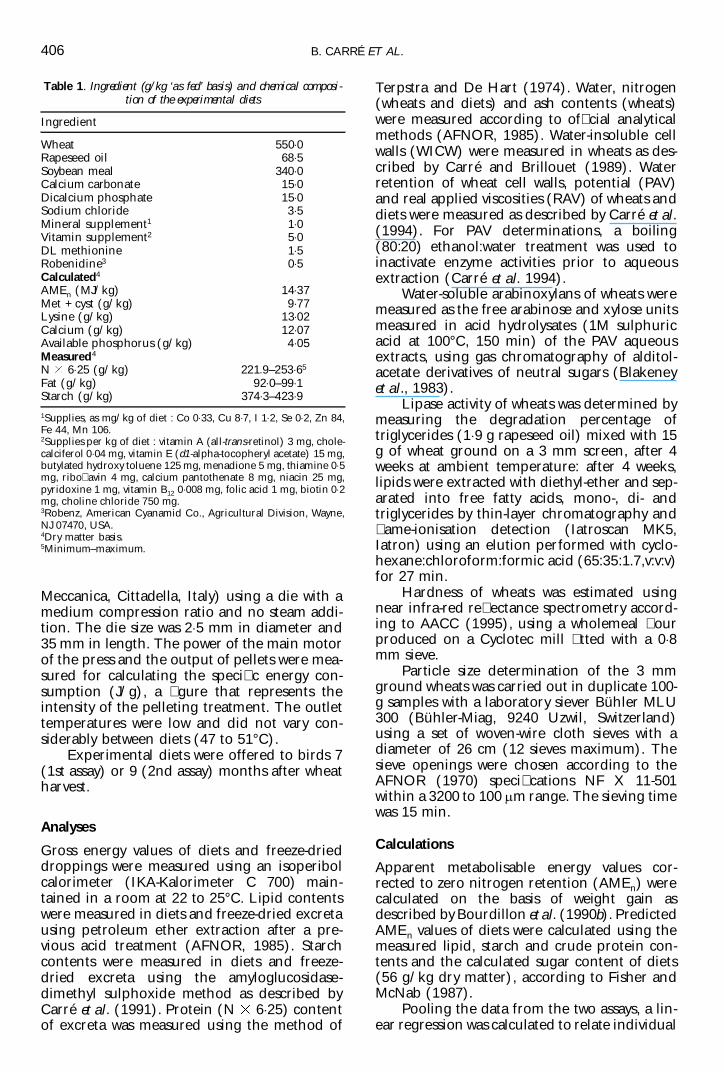
406 B. CARRÉ ET AL.
Table 1. Ingredient (g/kg ‘as fed’ basis) and chemical composi-tion of the experimental diets
Ingredient
Wheat 550× 0Rapeseed oil 68 × 5Soybean meal 340 × 0Calcium carbonate 15× 0Dicalcium phosphate 15× 0Sodium chloride 3 × 5Mineral supplement1 1× 0Vitamin supplement2 5× 0DL methionine 1× 5Robenidine3 0× 5Calculated4
AMEn (MJ/kg) 14× 37Met + cyst (g/kg) 9 × 77Lysine (g/kg) 13× 02Calcium (g/kg) 12× 07Available phosphorus (g/kg) 4 × 05Measured4
N 6× 25 (g/kg) 221.9–253 × 65
Fat (g/kg) 92× 0–99 × 1Starch (g/kg) 374 × 3–423 × 9
1Supplies, as mg/kg of diet : Co 0× 33, Cu 8 × 7, I 1× 2, Se 0× 2, Zn 84,Fe 44, Mn 106.2Supplies per kg of diet : vitamin A (all-trans-retinol) 3 mg, chole-calciferol 0 × 04 mg, vitamin E (d1-alpha-tocopheryl acetate) 15 mg,butylated hydroxy toluene 125 mg, menadione 5 mg, thiamine 0× 5mg, ribo� avin 4 mg, calcium pantothenate 8 mg, niacin 25 mg,pyridoxine 1 mg, vitamin B12 0 × 008 mg, folic acid 1 mg, biotin 0× 2mg, choline chloride 750 mg.3Robenz, American Cyanamid Co., Agricultural Division, Wayne,NJ 07470, USA.4Dry matter basis.5Minimum–maximum.
Tab
le 2
. Com
posi
tion
and
phys
ical
cha
ract
eris
tics
of w
heat
sam
ples
and
die
ts1
Wh
eat
Die
t
Wh
eat
Ash
N
Star
chH
ard-
Mea
n
Smal
l C
oars
e W
ICW
3C
ell
wal
lC
ell
wal
l PA
V5
RA
V6
Wat
er-
Ara
/xyl
L
ipas
e7PA
VR
AV
Pre-
SEP9
cult
ivar
(g/k
g)6×
25(g
/kg)
nes
spa
rtic
lepa
rtic
les2
par
ticl
es2
(g/k
g)w
ater
reta
ined
(ml/
g)(m
l/g)
solu
ble
rati
o of
(ml/
g)(m
l/g)
dict
ed(J
/g)
(g/k
g)si
ze2
(< 1
60(>
160
0re
ten
-w
ater
4ar
abin
-w
ater
-A
ME
n8
(m
)m
) (%
)m
)(%
)ti
on(g
/g)
oxyl
ans
solu
ble
(MJ/
kg)
(g/g
)(g
/kg)
arab
in-
oxyl
ans
Ass
ay 1
Acr
il17
× 210
4×5
695×
372
263
33× 9
6×5
104×
48×
770×
916
4×60
2×34
6×5
0×82
27× 3
3×29
2×10
14× 3
910
9A
rum
16× 5
108×
169
7×6
2640
913
× 51×
911
1×9
8×44
0×94
52×
991×
665×
10×
826×
22×
671×
7214
× 33
125
Bou
rbon
17× 1
96× 0
707×
664
478
14× 4
7×8
102×
19×
881×
008
2×75
1×39
4×3
1×08
6×0
2×31
1×50
14× 3
812
1C
rous
ty16
× 998
× 872
0×1
2828
525
× 22×
110
0×5
8×95
0×89
91×
910×
953×
80×
984×
21×
901×
4914
× 30
108
Efa
l16
× 510
9×3
710×
878
387
17× 8
2×6
104×
411
× 13
1×16
15×
252×
586×
81×
0011
× 43×
442×
2414
× 18
97Fo
rby
16× 7
100×
771
5×0
4440
816
× 01×
410
9×5
8×51
0×93
25×
172×
517×
00×
715×
53×
371×
7214
× 22
118
Ora
cle
17× 2
107×
471
2×4
8530
229
× 23×
510
6×0
8×19
0×86
83×
091×
825×
20×
748×
22×
541×
2414
× 13
110
Ria
lto
16× 7
111×
068
7×6
7968
26×
78×
711
7×9
8×11
0×95
66×
033×
817×
90×
8521
× 12×
952×
5613
× 97
110
Som
me
16× 6
116×
470
3×6
8658
712
× 19×
810
1×2
8×72
0×88
33×
111×
505×
30×
744×
72×
351×
2214
× 19
127
Qua
lital
15× 8
107×
170
2×2
9570
66×
47×
710
4×2
8×53
0×88
92×
832×
235×
60×
785×
62×
061×
5614
× 43
102
Cam
p
14× 9
134×
172
3×1
8435
325
× 16×
494
× 28×
390×
791
2×81
2×01
4×5
0×86
6×2
2×10
1×34
14× 5
410
4R
émy
Ass
ay 2
Alt
ria
17× 0
99× 1
709×
617
284
24× 4
0×5
117×
67×
550×
888
3×55
1×75
5×0
0×81
4×6
2×84
2×02
14× 1
611
2A
mi
17× 7
96× 0
714×
518
363
14× 8
1×1
106×
17×
610×
807
2×71
1×59
4×0
0×94
2×0
2×31
1×76
14× 1
810
1A
tala
nte
17× 1
105×
670
4×9
7758
010
× 28×
210
3×2
7×95
0×82
12×
701×
294×
01×
0010
× 22×
331×
6814
× 15
89B
astil
le16
× 510
6×6
706×
575
572
10× 5
5×1
110×
08×
750×
962
5×38
2×74
7×3
0×74
22× 2
3×56
2×83
14× 1
190
Cax
ton
17× 5
105×
871
3×4
6752
511
× 35×
710
8×4
10× 6
11×
150
5×89
3×25
8×3
0×69
5×5
4×12
2×64
14× 3
094
Ch
ian
ti16
× 310
1×6
712×
271
533
11× 8
6×2
103×
010
× 07
1×03
74×
832×
576×
50×
739×
83×
362×
4814
× 37
84C
orsa
ire
16× 5
99× 9
702×
164
551
12× 4
6×3
97× 5
9×77
0×95
33×
912×
435×
90×
755×
12×
672×
3414
× 58
89R
ecit
al16
× 810
8×9
712×
284
648
8×7
8×5
109×
39×
040×
988
3×62
1×89
5×5
0×92
6×2
2×68
2×15
14× 5
198
Ru
ben
s16
× 610
7×7
699×
194
456
14× 8
6×2
105×
88×
160×
863
2×50
1×45
4×4
0×78
2×1
2×42
1×46
14× 4
691
Side
ral
18× 1
97× 5
718×
518
266
23× 2
0×5
111×
67×
750×
865
3×73
2×25
5×6
0×72
4×1
3×33
1×79
14× 4
010
7Tr
émie
16× 7
102×
572
4×6
8057
711
× 47×
799
× 97×
600×
759
3×15
2×05
5×5
0×77
5×9
2×82
2×06
14× 3
197
1 Dat
a ar
e gi
ven
on
dry
mat
ter
basi
s.2 P
arti
cles
of
grou
nd
wh
eat
befo
re i
ntr
oduc
tion
in
die
ts.
3 Wat
er-in
solu
ble
cell
wal
ls.
4 WIC
W (
g/g)
ce
ll w
all
wat
er r
eten
tion
(g/
g).
5 Pot
enti
al a
ppl
ied
visc
osit
y.6 R
eal
appl
ied
visc
osit
y.7 D
egra
dati
on p
erce
nta
ge o
f 1×
9 g
rap
esee
d o
il m
ixed
wit
h 1
5 g
of w
hea
t gr
oun
d on
3 m
m s
cree
n a
fter
4 w
eeks
at
ambi
ent
tem
pera
ture
.8 0
× 015
5 N
6×25
+ 0
× 034
3 L
ipid
s +
0×01
67 S
tarc
h +
0× 0
130
Suga
rs (
Fish
er a
nd
McN
ab,
1987
); s
ugar
con
ten
t is
con
side
red
con
stan
t an
d ca
lcul
ated
to
be 5
6 g/
kg.
9 Spe
ci�
c en
ergy
of
pel
leti
ng.
DIGESTIBILITIES AND WHEAT CHARACTERISTICS 407
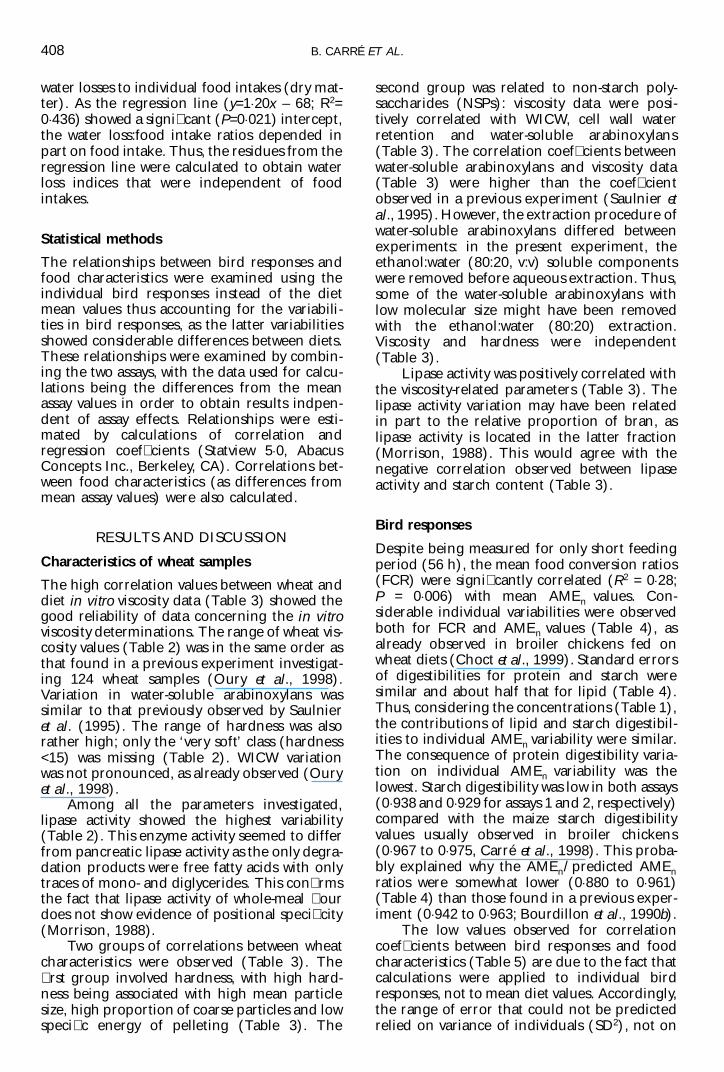
water losses to individual food intakes (dry mat-ter). As the regression line (y=1 × 20x – 68; R2=0 × 436) showed a signi� cant (P=0 × 021) intercept,the water loss:food intake ratios depended inpart on food intake. Thus, the residues from theregression line were calculated to obtain waterloss indices that were independent of foodintakes.
Statistical methods
The relationships between bird responses andfood characteristics were examined using theindividual bird responses instead of the dietmean values thus accounting for the variabili-ties in bird responses, as the latter variabilitiesshowed considerable differences between diets.These relationships were examined by combin-ing the two assays, with the data used for calcu-lations being the differences from the meanassay values in order to obtain results indpen-dent of assay effects. Relationships were esti-mated by calculations of correlation andregression coef� cients (Statview 5× 0, AbacusConcepts Inc., Berkeley, CA). Correlations bet-ween food characteristics (as differences frommean assay values) were also calculated.
RESULTS AND DISCUSSION
Characteristics of wheat samples
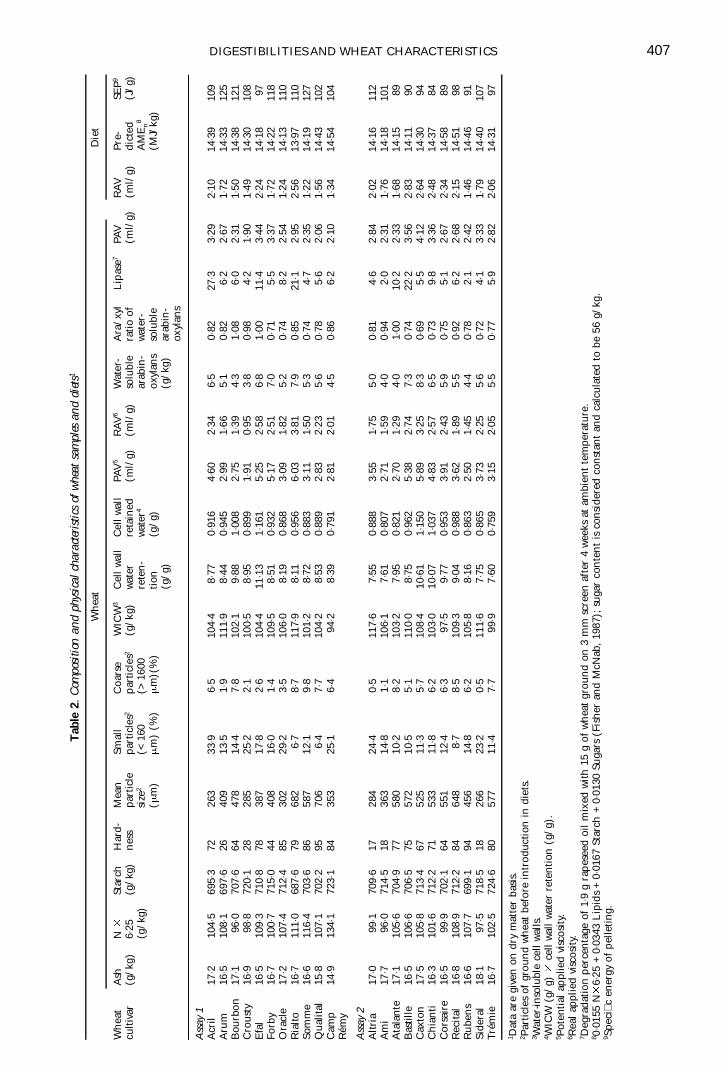
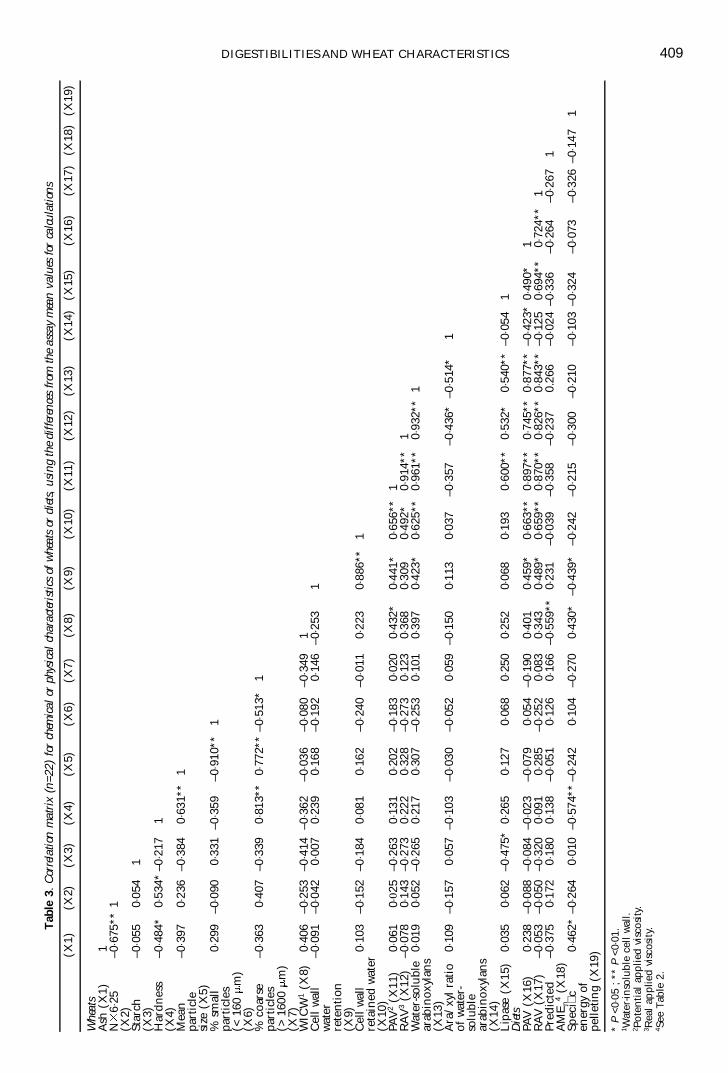
The high correlation values between wheat anddiet in vitro viscosity data (Table 3) showed thegood reliability of data concerning the in vitroviscosity determinations. The range of wheat vis-cosity values (Table 2) was in the same order asthat found in a previous experiment investigat-ing 124 wheat samples (Oury et al., 1998).Variation in water-soluble arabinoxylans wassimilar to that previously observed by Saulnieret al. (1995). The range of hardness was alsorather high; only the ‘very soft’ class (hardness<15) was missing (Table 2). WICW variation was not pronounced, as already observed (Ouryet al., 1998).
Among all the parameters investigated,lipase activity showed the highest variability(Table 2). This enzyme activity seemed to differfrom pancreatic lipase activity as the only degra-dation products were free fatty acids with onlytraces of mono- and diglycerides. This con� rmsthe fact that lipase activity of whole-meal � ourdoes not show evidence of positional speci� city(Morrison, 1988).
Two groups of correlations between wheatcharacteristics were observed (Table 3). The� rst group involved hardness, with high hard-ness being associated with high mean particlesize, high proportion of coarse particles and lowspeci� c energy of pelleting (Table 3). The
second group was related to non-starch poly-saccharides (NSPs): viscosity data were posi-tively correlated with WICW, cell wall waterretention and water-soluble arabinoxylans(Table 3). The correlation coef� cients betweenwater-soluble arabinoxylans and viscosity data(Table 3) were higher than the coef� cientobserved in a previous experiment (Saulnier etal., 1995). However, the extraction procedure ofwater-soluble arabinoxylans differed betweenexperiments: in the present experiment, theethanol:water (80:20, v:v) soluble componentswere removed before aqueous extraction. Thus,some of the water-soluble arabinoxylans withlow molecular size might have been removedwith the ethanol:water (80:20) extraction.Viscosity and hardness were independent(Table 3).
Lipase activity was positively correlated withthe viscosity-related parameters (Table 3). Thelipase activity variation may have been relatedin part to the relative proportion of bran, aslipase activity is located in the latter fraction(Morrison, 1988). This would agree with thenegative correlation observed between lipaseactivity and starch content (Table 3).
Bird responses
Despite being measured for only short feedingperiod (56 h), the mean food conversion ratios(FCR) were signi� cantly correlated (R2 = 0× 28;P = 0× 006) with mean AMEn values. Con-siderable individual variabilities were observedboth for FCR and AMEn values (Table 4), asalready observed in broiler chickens fed onwheat diets (Choct et al., 1999). Standard errorsof digestibilities for protein and starch weresimilar and about half that for lipid (Table 4).Thus, considering the concentrations (Table 1),the contributions of lipid and starch digestibil-ities to individual AMEn variability were similar.The consequence of protein digestibility varia-tion on individual AMEn variability was thelowest. Starch digestibility was low in both assays(0 × 938 and 0 × 929 for assays 1 and 2, respectively)compared with the maize starch digestibilityvalues usually observed in broiler chickens(0 × 967 to 0 × 975, Carré et al., 1998). This proba-bly explained why the AMEn/predicted AMEnratios were somewhat lower (0× 880 to 0× 961)(Table 4) than those found in a previous exper-iment (0 × 942 to 0 × 963; Bourdillon et al., 1990b).
The low values observed for correlationcoef� cients between bird responses and foodcharacteristics (Table 5) are due to the fact thatcalculations were applied to individual birdresponses, not to mean diet values. Accordingly,the range of error that could not be predictedrelied on variance of individuals (SD2), not on
123456789101111234567892011112345678930111123456789401111234567895011112345678960111
408 B. CARRÉ ET AL.
DIGESTIBILITIES AND WHEAT CHARACTERISTICS 409T
able
3. C
orre
latio
n m
atri
x (n
=22)
for
che
mic
al o
r ph
ysic
al c
hara
cter
istic
s of
whe
ats
or d
iets
, us
ing
the
diff
eren
ces
from
the
ass
ay m
ean
valu
es f
or c
alcu
latio
ns
(X1)
(X2)
(X3)
(X4)
(X5)
(X6)
(X7)
(X8)
(X9)
(X10
)(X
11)
(X12
)(X
13)
(X14
)(X
15)
(X16
)(X
17)
(X18
)(X
19)
Whe
ats
Ash
(X
1)1
N6×
25
–0× 6
75**
1(X
2)St
arch
–0
× 055
0×05
41
(X3)
Har
dnes
s –0
× 484
*0×
534*
–0× 2
171
(X4)
Mea
n
–0× 3
970×
236
–0× 3
840×
631*
*1
part
icle
si
ze (
X5)
% s
mal
l
0×29
9–0
× 090
0×33
1–0
× 359
–0× 9
10**
1pa
rtic
les
(< 1
60
m)
(X6)
% c
oars
e –0
× 363
0×40
7–0
× 339
0×81
3**
0×77
2**
–0× 5
13*
1pa
rtic
les
(> 1
600
m)
(X7)
WIC
W1
(X8)
0×40
6–0
× 253
–0× 4
14–0
× 362
–0× 0
36–0
× 080
–0× 3
491
Cel
l w
all
–0× 0
91–0
× 042
0×00
70×
239
0×16
8–0
× 192
0×14
6–0
× 253
1w
ater
re
tent
ion
(X9)
Cel
l w
all
0×10
3–0
× 152
–0× 1
840×
081
0×16
2–0
× 240
–0× 0
110×
223
0×88
6**
1re
tain
ed w
ater
(X
10)
PAV
2(X
11)
0×06
10×
0 25
–0× 2
630×
131
0×20
2–0
× 183
0×02
00×
432*
0×44
1*0×
656*
*1
RA
V3
(X12
)–0
× 078
0×14
3–0
× 273
0×22
20×
328
–0× 2
730×
123
0×36
80×
309
0×49
2*0×
914*
*1
Wat
er-s
olub
le
0×01
90×
052
–0× 2
650×
217
0×30
7–0
× 253
0×10
10×
397
0×42
3*0×
625*
*0×
961*
*0×
932*
*1
arab
inox
ylan
s (X
13)
Ara
/xyl
rat
io
0×10
9–0
× 157
0×05
7–0
× 103
–0× 0
30–0
× 052
0×05
9–0
× 150
0×11
30×
037
–0× 3
57–0
× 436
*–0
× 514
*1
of w
ater
-so
lubl
e ar
abin
oxyl
ans
(X14
)L
ipas
e (X
15)
0×03
50×
062
–0× 4
75*
0×26
50×
127
0×06
80×
250
0×25
20×
068
0×19
30×
600*
*0×
532*
0×54
0**
–0× 0
541
Die
tsPA
V (
X16
)0×
238
–0× 0
88–0
× 084
–0× 0
23–0
× 079
0×05
4–0
× 190
0×40
10×
459*
0×66
3**
0×89
7**
0×74
5**
0×87
7**
–0× 4
23*
0×49
0*1
RA
V (
X17
)–0
× 053
–0× 0
50–0
× 320
0×09
10×
285
–0× 2
520×
083
0×34
30×
489*
0×65
9**
0×87
0**
0×82
6**
0×84
3**
–0× 1
250×
694*
*0×
724*
*1
Pred
icte
d –0
× 375
0×17
20×
180
0×13
8–0
× 051
0×12
60×
166
–0× 5
59**
0×23
1–0
× 039
–0× 3
58–0
× 237
0.26
6–0
× 024
–0× 3
36–0
× 264
–0× 2
671
AM
En
4(X
18)
Spec
i�c
0×46
2*–0
× 264
0×01
0–0
× 574
**–0
× 242
0×10
4–0
× 270
0×43
0*–0
× 439
*–0
× 242
–0× 2
15–0
× 300
–0× 2
10–0
× 103
–0× 3
24–0
× 073
–0× 3
26–0
× 147
1en
ergy
of
pelle
ting
(X19
)
* P
<0× 0
5 ; *
* P
<0× 0
1.1 W
ater
-inso
lubl
e ce
ll w
all.
2 Pot
enti
al a
pplie
d v
isco
sity
.3 R
eal
appl
ied
visc
osit
y.4 S
ee T
able
2.

123456789101111234567892011112345678930111123456789401111234567895011112345678960111
Tab
le 4
. Gro
wth
per
form
ance
s, A
MEn
val
ue o
f w
heat
die
ts,
dige
stib
ilitie
s, w
ater
los
s an
d ve
nt s
core
s, i
n br
oile
r ch
icke
ns (
d 22
to
24)1
(mea
ns f
rom
8 r
eplic
ates
)
Wh
eat
Wei
ght
Food
Food
/gai
nD
ry e
xcre
ta/
Die
t A
ME
nD
iet
AM
En/
Lip
id
Star
chPr
otei
nR
esid
ue f
rom
Exc
rete
dVe
nt
culti
var
gain
(g)
inta
ke (
g)(g
/g)
food
int
ake
(MJ/
kg)
pred
icte
ddi
gest
ibili
tydi
gest
ibili
tydi
gest
ibili
tyex
cret
edw
ater
/foo
dsc
ore4
(g/g
)A
ME
n2 (M
J/M
J)w
ater
= f
(fo
od
inta
kein
take
) (g
)3(g
/g)
Ass
ay 1
Acr
il16
528
01×
690×
351
13× 0
50×
907
0×82
90×
920
0×77
3–7
× 20×
922
2×3
Aru
m16
425
81×
590×
312
13× 7
80×
961
0×84
50×
967
0×81
9–2
1×3
0×85
51×
7B
ourb
on15
727
51×
770×
333
13× 3
40×
928
0×80
80×
934
0×78
2–8
× 00×
934
1×5
Cro
usty
146
253
1×73
0×32
513
× 54
0×94
70×
842
0×95
70×
788
–6× 1
0×90
31×
3E
fal
164
278
1×78
0×34
713
× 27
0×93
60×
790
0×94
20×
782
12× 0
0×99
92×
9Fo
rby
150
268
1×73
0×32
713
× 53
0×95
20×
806
0×95
80×
783
29× 6
1×05
42×
0O
racl
e14
925
81×
740×
333
13× 5
10×
956
0×80
90×
947
0×80
97×
90×
969
1×4
Ria
lto15
427
31×
780×
357
12× 8
90×
923
0×79
50×
910
0×79
0–9
× 80×
904
2×2
Som
me
178
290
1×67
0×34
513
× 28
0×93
60×
831
0×92
70×
780
–19×
30×
899
1×3
Qua
lital
167
277
1×65
0×32
713
× 58
0×94
20×
837
0×93
80×
798
–8× 9
0×91
71×
6C
amp
Rém
y17
628
31×
610×
338
13× 3
60×
919
0×82
20×
921
0×80
3–1
0×8
0×90
81×
8Po
oled
SE
710
0×06
0×01
10×
240×
017
0×02
00×
011
0×01
115
× 80×
055
0×4
P0×
010×
230×
200×
240×
400×
540×
620×
030×
090×
610×
600×
08
Ass
ay 2
Alt
ria
172
284
1×66
0×33
313
× 03
0×92
00×
768
0×95
70×
769
9×3
0×99
31×
9A
mi
163
282
1×74
0×34
412
× 86
0×90
70×
754
0×92
50×
781
4×1
0×97
32×
2A
tala
nte
162
285
1×77
0×34
812
× 85
0×90
80×
752
0×90
50×
790
–33×
30×
841
1×7
Bas
tille
169
296
1×77
0×35
512
× 54
0×88
80×
690
0×91
70×
778
16× 6
1×02
32×
0C
axto
n13
325
21×
920×
350
12× 7
40×
891
0×70
00×
940
0×78
734
× 71×
057
1×8
Ch
iant
i16
128
61×
790×
356
12× 6
50×
880
0×74
80×
903
0×76
519
× 31×
031
2×1
Cor
sair
e15
326
41×
740×
327
13× 3
60×
916
0×80
50×
938
0×79
7–3
× 00×
934
2×1
Rec
ital
172
292
1×70
0×35
212
× 84
0×88
50×
780
0×90
70×
791
–2× 3
0×95
71×
8R
uben
s15
927
21×
740×
342
13× 2
10×
913
0×80
40×
923
0×80
1–2
8×2
0×84
02×
4Si
dera
l16
428
11×
710×
329
13× 2
50×
920
0×78
10×
949
0×78
715
× 81×
008
2×1
Trém
ie14
624
41×
690×
315
13× 4
80×
942
0×77
90×
949
0×82
710
× 10×
949
1×3
Pool
ed S
E8
110×
060×
011
0×25
0×01
80×
032
0×01
40×
012
14× 8
0×05
50×
4P
0×02
0×04
0×30
0×24
0×17
0×36
0×21
0×10
0×07
0×08
0×11
0×84
1 Foo
d in
take
s an
d A
ME
nva
lues
are
giv
en o
n d
ry m
atte
r ba
sis.
2 See
Tab
le 2
.3 R
esid
ues
from
th
e re
gres
sion
lin
e ex
pres
sin
g th
e in
divi
dual
wat
er e
xcre
tion
as
a fu
nct
ion
of
indi
vid
ual
food
in
take
cal
cula
ted
by p
oolin
g th
e da
ta f
rom
th
e tw
o as
says
.4 V
ent
scor
es f
rom
0 t
o 5,
in
crea
sin
g w
ith
dir
ty a
ppea
ran
ce o
f ve
nt.
410 B. CARRÉ ET AL

variance of means (SD2/8), which means that,when individual variabilities were high, the R2
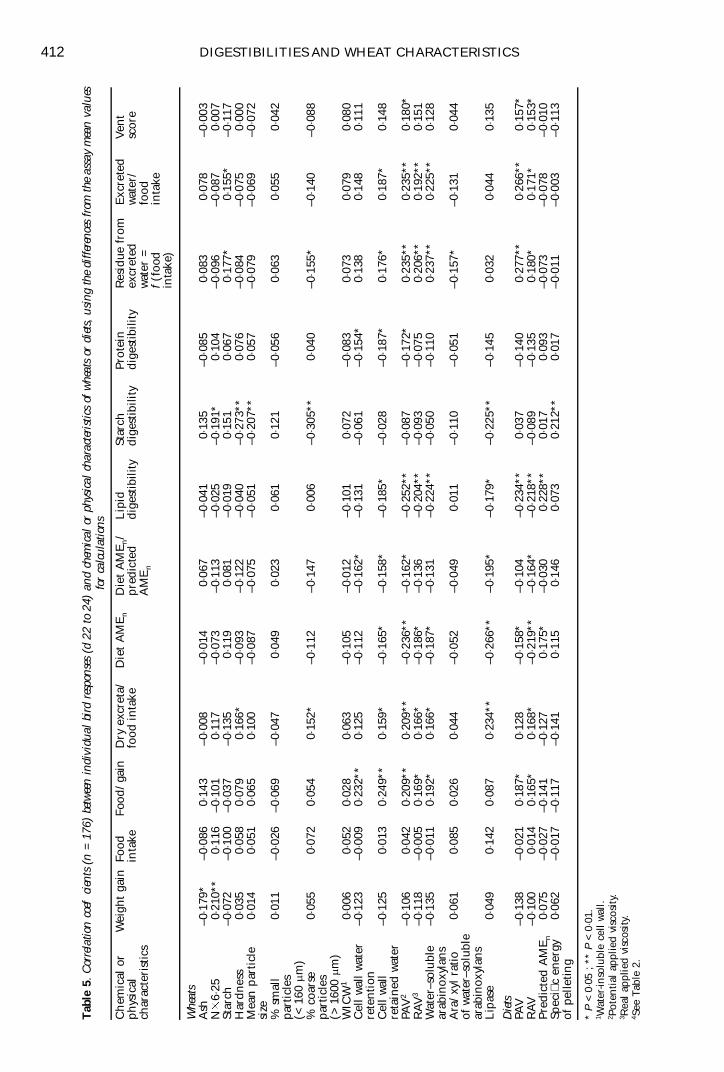
values were considerably reduced comparedwith calculations performed on mean values.Calculations on individual bird responses werepreferred to account for individual bird vari-ability. Starch digestibility could not be signi� -cantly (P > 0 × 05) correlated with any of theparameters related to viscosity (Table 5), whichis in agreement with a previous experimentshowing that the effect of viscosity on starchdigestibility is low (Maisonnier et al., 2001).These results were similar to those found byNicol et al. (1993), investigating relationshipsbetween wheat starch digestibility and water-soluble arabinoxylan content and composition.
In the present experiment, wheat starchdigestibility was negatively correlated (P < 0× 05)with the hardness-related characters (hardness,particle size distribution, N 6 × 25 content andspeci� c energy of pelleting) and lipase activity(Table 5). In a previous experiment (Rogel etal., 1987), no signi� cant relationship betweenwheat hardness and starch digestibility wasestablished. However, in the latter study, therange of hardness (34 × 5 to 63 × 6) was lower thanin the present one (17 to 95). The negative rela-tionship between hardness and starch digestibil-ity may be due to the large proportion of coarseparticles observed with hard wheat (Table 3),since coarse particles may reduce enzyme acces-sibility as already suggested for peas (Carré etal., 1991, 1998). This may also be associated withthe interaction between starch granules andprotein observed with hard wheat (Barlow et al.,1973). It could be argued that the wheat proteindigestibility should also be affected. However,the wheat proteins represented only 25% oftotal proteins, which would considerably reducethe sensitivity for detecting such an effect, sincedigestibility was measured on total proteins.Also against this hypothesis is the negligibleeffect of endosperm texture on wheat aminoacid digestibility reported by Short et al. (2000).However, in this experiment, differences inhardness were obtained by the use of isogeniclines (Short et al., 2000). If we suppose that only some of the hardness genes are involved indigestibility problems, it is not certain that these genes were concerned in these isogeniclines.
The relationship between hardness andstarch digestibility could also be due in part tothe intensity of pelleting that decreased whenhardness increased. Thus, it is possible that pel-leting induced less structural degradation ofhard wheat particles than those of soft wheat,resulting in less susceptibility of starch granulesto enzyme degradation for hard wheats than forsoft wheats.
The signi� cance of the negative relation-ship between lipase activity and starch digestibil-ity (Table 5) is unclear, as lipase activity isprobably not directly associated with variationsin starch digestibility. Lipase activity is probablycorrelated, however, with some parameterswhich in� uence starch digestibility. Lipase activ-ity was also negatively correlated to lipiddigestibility (Table 5), which can be explainedin two ways. Firstly, it is possible that, betweendiet mixing and diet distribution, the highlipase levels resulted in release of signi� cantamount of free fatty acids with a subsequentreduction in fat digestibility (Wiseman, 1990).Secondly, the high positive correlations betweenlipase activity and viscosity-related characters(Table 3) may be responsible, as viscosity isknown to decrease lipid digestibility (Smits andAnnison, 1996).
As expected, viscosity-related characterswere negatively correlated to lipid digestibilityand, to a lesser extent, to protein digestibility(Table 5). It is noteworthy that the regressioncoef� cients relating RAV value of diets todigestibilities (lipid: –0× 040, P < 0× 01, Table 6;protein: –0 × 011, P > 0 × 05; starch: –0 × 008, P >0 × 05) were very similar to the coef� cients thatcan be calculated from a previous experiment(Maisonnier et al., 2001) using guar gum as amodel for examining effects of viscosity (–0 × 043;–0 × 017; –0× 007, for the digestibilities of lipid,protein and starch, respectively). Convertingthe latter coef� cients found in the presentexperiment in terms of AMEn concentrationunits as previously described (Carré et al.,1995b), their sum was equivalent, as a mean, to–0 × 25 MJ/kg dry matter, which representedabout –1 × 8% of the AMEn predicted value. Thelatter value is very similar to the coef� cient relat-ing RAV value of diets to the diet AMEn/pre-dicted AMEn ratio (–0 × 019, P < 0 × 05, Table 6),which indicates the reliability of the data.
In agreement with the negative relation-ships between viscosity-related data and dietAMEn values, positive relationships wereobserved between viscosity-related data andfood/gain ratio (Table 5). The latter correla-tions were the highest among those concerningfood/gain ratio (Table 5) probably because, inaddition to a decrease in digestibilities, viscosityparameters tended to be related to a decreasein body weight gain (Table 5).
Positive correlations were observedbetween viscosity-related parameters andexcreted water/food intake ratio (Table 5),which is in agreement with a previous observa-tion (Carré et al., 1995a) showing that viscouspolysaccharides can induce an increase in waterexcretion in broiler chickens. However, consid-ering the coef� cient assigned to diet RAV value
123456789101111234567892011112345678930111123456789401111234567895011112345678960111
DIGESTIBILITIES AND WHEAT CHARACTERISTICS 411
123456789101111234567892011112345678930111123456789401111234567895011112345678960111
412 DIGESTIBILITIES AND WHEAT CHARACTERISTICS
Tab
le 5
. Cor
rela
tion
coef
�cie
nts
(n =
176
) be
twee
n in
divi
dual
bir
d re
spon
ses
(d 2
2 to
24)
and
che
mic
al o
r ph
ysic
al c
hara
cter
istic
s of
whe
ats
or d
iets
, us
ing
the
diff
eren
ces
from
the
ass
ay m
ean
valu
esfo
r ca
lcul
atio
ns
Ch
emic
al o
r W
eigh
t ga
inFo
od
Food
/gai
nD
ry e
xcre
ta/
Die
t A
ME
nD
iet
AM
En/
Lip
idSt
arch
Prot
ein
Res
idue
fro
mE
xcre
ted
Vent
phys
ical
in
take
food
int
ake
pred
icte
d di
gest
ibili
tydi
gest
ibili
tydi
gest
ibili
tyex
cret
ed
wat
er/
scor
ech
arac
teri
stic
sA
ME
nw
ater
=fo
odf
(foo
d in
take
inta
ke)
Whe
ats
Ash
–0× 1
79*
–0× 0
860×
143
–0× 0
08–0
× 014
0×06
7–0
× 041
0×13
5–0
× 085
0×08
30×
078
–0× 0
03N
6×25
0×21
0**
0×11
6–0
× 101
0×11
7–0
× 073
–0× 1
13–0
× 025
–0× 1
91*
0×10
4–0
× 096
–0× 0
870×
007
Star
ch–0
× 072
–0× 1
00–0
× 037
–0× 1
350×
119
0×08
1–0
× 019
0×15
10×
067
0×17
7*0×
155*
–0× 1
17H
ardn
ess
0×03
50×
058
0×07
90×
166*
–0× 0
93–0
× 122
–0× 0
40–0
× 273
**0×
076
–0× 0
84–0
× 075
0×00
0M
ean
par
ticl
e 0×
014
0×05
10×
065
0×10
0–0
× 087
–0× 0
75–0
× 051
–0× 2
07**
0×05
7–0
× 079
–0× 0
69–0
× 072
size
% s
mal
l 0×
011
–0× 0
26–0
× 069
–0× 0
470×
049
0×02
30×
061
0×12
1–0
× 056
0×06
30×
055
0×04
2pa
rtic
les
(< 1
60 m
m)
% c
oars
e
0×05
50×
072
0×05
40×
152*
–0× 1
12–0
× 147
0×00
6–0
× 305
**0×
040
–0× 1
55*
–0× 1
40–0
× 088
part
icle
s(>
160
0 m m
)W
ICW
10×
006
0×05
20×
028
0×06
3–0
× 105
–0× 0
12–0
× 101
0×07
2–0
× 083
0×07
30×
079
0×08
0C
ell
wal
l w
ater
–0
× 123
–0× 0
090×
232*
*0×
125
–0× 1
12–0
× 162
*–0
× 131
–0× 0
61–0
× 154
*0×
138
0×14
80×
111
rete
ntio
nC
ell
wal
l –0
× 125
0×01
30×
249*
*0×
159*
–0× 1
65*
–0× 1
58*
–0× 1
85*
–0× 0
28–0
× 187
*0×
176*
0×18
7*0×
148
reta
ined
wat
erPA
V2
–0× 1
060×
042
0×20
9**
0×20
9**
–0× 2
36**
–0× 1
62*
–0× 2
52**
–0× 0
87–0
× 172
*0×
235*
*0×
235*
*0×
180*
RAV
3–0
× 118
–0× 0
050×
169*
0×16
6*–0
× 186
*–0
× 136
–0× 2
04**
–0× 0
93–0
× 075
0×20
6**
0×19
2**
0×15
1W
ater
–sol
uble
–0
× 135
–0× 0
110×
192*
0×16
6*–0
× 187
*–0
× 131
–0× 2
24**
–0× 0
50–0
× 110
0×23
7**
0×22
5**
0×12
8ar
abin
oxyl
ans
Ara
/xyl
rat
io
0×06
10×
085
0×02
60×
044
–0× 0
52–0
× 049
0×01
1–0
× 110
–0× 0
51–0
× 157
*–0
× 131
0×04
4of
wat
er–s
olub
le
arab
inox
ylan
sL
ipas
e0×
049
0×14
20×
087
0×23
4**
–0× 2
66**
–0× 1
95*
–0× 1
79*
–0× 2
25**
–0× 1
450×
032
0×04
40×
135
Die
tsPA
V–0
× 138
–0× 0
210×
187*
0×12
8–0
× 158
*–0
× 104
–0× 2
34**
0×03
7–0
× 140
0×27
7**
0×26
6**
0×15
7*R
AV–0
× 100
0×01
40×
165*
0×16
8*–0
× 219
**–0
× 164
*–0
× 218
**–0
× 089
–0× 1
350×
180*
0×17
1*0×
153*
Pred
icte
d A
ME
n0×
075
–0× 0
27–0
× 141
–0× 1
270×
175*
–0× 0
300×
228*
*0×
017
0×09
3–0
× 073
–0× 0
78–0
× 010
Spec
i�c
ener
gy0×
062
–0× 0
17–0
× 117
–0× 1
410×
115
0×14
60×
073
0×21
2**
0×01
7–0
× 011
–0× 0
03–0
× 113
of p
elle
ting
* P
< 0×
05 ;
** P
< 0×
01.
1 Wat
er-in
solu
ble
cell
wal
l.2 P
oten
tial
app
lied
visc
osit
y.3 R
eal
appl
ied
visc
osit
y.4 S
ee T
able
2.
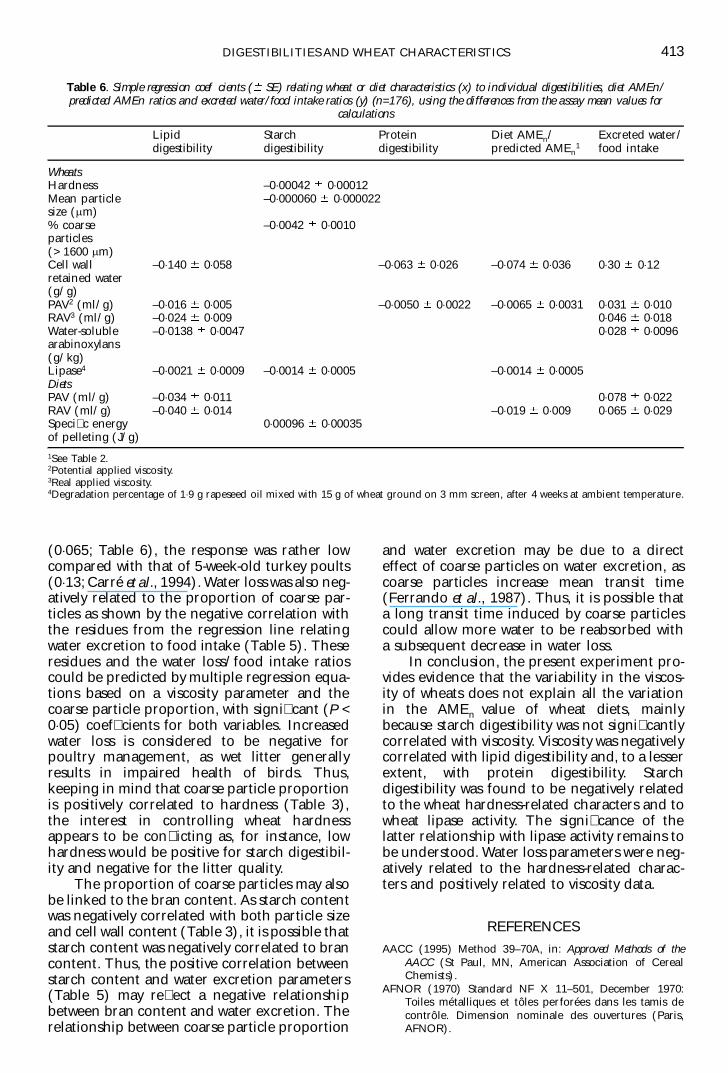
(0 × 065; Table 6), the response was rather lowcompared with that of 5-week-old turkey poults(0 × 13; Carré et al., 1994). Water loss was also neg-atively related to the proportion of coarse par-ticles as shown by the negative correlation withthe residues from the regression line relatingwater excretion to food intake (Table 5). Theseresidues and the water loss/food intake ratioscould be predicted by multiple regression equa-tions based on a viscosity parameter and thecoarse particle proportion, with signi� cant (P <0 × 05) coef� cients for both variables. Increasedwater loss is considered to be negative forpoultry management, as wet litter generallyresults in impaired health of birds. Thus,keeping in mind that coarse particle proportionis positively correlated to hardness (Table 3),the interest in controlling wheat hardnessappears to be con� icting as, for instance, lowhardness would be positive for starch digestibil-ity and negative for the litter quality.
The proportion of coarse particles may alsobe linked to the bran content. As starch contentwas negatively correlated with both particle sizeand cell wall content (Table 3), it is possible thatstarch content was negatively correlated to brancontent. Thus, the positive correlation betweenstarch content and water excretion parameters(Table 5) may re� ect a negative relationshipbetween bran content and water excretion. Therelationship between coarse particle proportion
and water excretion may be due to a directeffect of coarse particles on water excretion, ascoarse particles increase mean transit time(Ferrando et al., 1987). Thus, it is possible thata long transit time induced by coarse particlescould allow more water to be reabsorbed witha subsequent decrease in water loss.
In conclusion, the present experiment pro-vides evidence that the variability in the viscos-ity of wheats does not explain all the variationin the AMEn value of wheat diets, mainlybecause starch digestibility was not signi� cantlycorrelated with viscosity. Viscosity was negativelycorrelated with lipid digestibility and, to a lesserextent, with protein digestibility. Starchdigestibility was found to be negatively relatedto the wheat hardness-related characters and towheat lipase activity. The signi� cance of thelatter relationship with lipase activity remains tobe understood. Water loss parameters were neg-atively related to the hardness-related charac-ters and positively related to viscosity data.
REFERENCESAACC (1995) Method 39–70A, in: Approved Methods of the
AACC (St Paul, MN, American Association of CerealChemists).
AFNOR (1970) Standard NF X 11–501, December 1970:Toiles métalliques et tôles perforées dans les tamis decontrôle. Dimension nominale des ouvertures (Paris,AFNOR).
123456789101111234567892011112345678930111123456789401111234567895011112345678960111
DIGESTIBILITIES AND WHEAT CHARACTERISTICS 413
Table 6. Simple regression coef�cients ( SE) relating wheat or diet characteristics (x) to individual digestibilities, diet AMEn/predicted AMEn ratios and excreted water/food intake ratios (y) (n=176), using the differences from the assay mean values for
calculations
Lipid Starch Protein Diet AMEn/ Excreted water/digestibility digestibility digestibility predicted AMEn
1 food intake
WheatsHardness –0 × 00042 0× 00012Mean particle –0 × 000060 0× 000022size (m m)% coarse –0 × 0042 0 × 0010particles (> 1600 m m)Cell wall –0 × 140 0× 058 –0× 063 0 × 026 –0× 074 0 × 036 0× 30 0× 12retained water (g/g)PAV2 (ml/g) –0 × 016 0× 005 –0× 0050 0× 0022 –0× 0065 0× 0031 0× 031 0× 010RAV3 (ml/g) –0 × 024 0× 009 0× 046 0× 018Water-soluble –0 × 0138 0 × 0047 0× 028 0× 0096arabinoxylans (g/kg)Lipase4 –0 × 0021 0 × 0009 –0 × 0014 0× 0005 –0× 0014 0× 0005DietsPAV (ml/g) –0 × 034 0× 011 0× 078 0× 022RAV (ml/g) –0 × 040 0× 014 –0× 019 0 × 009 0× 065 0× 029Speci� c energy 0× 00096 0× 00035of pelleting (J/g)1See Table 2.2Potential applied viscosity.3Real applied viscosity.4Degradation percentage of 1 × 9 g rapeseed oil mixed with 15 g of wheat ground on 3 mm screen, after 4 weeks at ambient temperature.
AFNOR (1985) Aliments des animaux: methodes françaises et com-munautaires, 2nd Edn (Paris, AFNOR).
ALMIRALL, M., FRANCESCH, M., PEREZ-VENDRELL, A.M.,BRUFFAU, J. & ESTEVE-GARCIA, E. (1995) The differencesin intestinal viscosity produced by barley and b -glucanasealter digesta enzyme activities and ileal nutrient digestibil-ities more in broiler chicks than in cocks. Journal ofNutritian , 125: 947–955.
ANNISON, G. (1991) Relationship between the levels of thesoluble non-starch polysaccharides and the apparentmetabolizable energy of wheats assayed in broiler chick-ens. Journal of Agricultural and Food Chemistry, 39:1252–1256.
ANTONIOU, T., MARQUARDT, R.R. & CANSFIELD, E. (1981)Isolation, partial characterisation and anti-nutritionalactivity of a factor (pentosans) in rye grain. Journal ofAgricultural and Food Chemistry, 29: 1240–1247.
BARLOW, K.K., BUTTROSE, M.S., SIMMONDS, D.H. & VESK, M.(1973) The nature of the starch–protein interface inwheat endosperm. Cereal Chemistry, 50: 443–454.
BEDFORD, M.R. & CLASSEN, H.L. (1993) An in vitro assay forprediction of broiler intestinal viscosity and growth whenfed rye-based diets in the presence of exogenousenzymes. Poultry Science, 72: 137–143.
BLAKENEY, A.B., HARRIS, P.J., HENRI, R.J. & STONE, B.A.(1983) A simple and rapid preparation of alditol acetatesfor monosaccharide analysis. Carbohydrate Research, 113:219–299.
BOURDILLON, A., CARRÉ, B., CONAN, L., DUPERRAY, J.,HUYGHEBAERT, G., LECLERCQ, B., LESSIRE, M., MCNAB,J. & WISEMAN, J. (1990a) European reference method forthe in vivo determination of metabolisable energy withadult cockerels: reproducibility, effect of food intake andcomparison with individual laboratory methods. BritishPoultry Science, 31: 557–565.
BOURDILLON, A., CARRÉ, B., CONAN, L., FRANCESCH, M.,FUENTES, M., HUYGHEBAERT, G., JANSEN, W.M.M.A.,LECLERCQ, B., LESSIRE, M., MCNAB, J., RIGONI, M. &WISEMAN, J. (1990b) European reference method of invivo determination of metabolisable energy in poultry:reproducibility, effect of age, comparison with predictedvalues. British Poultry Science, 31: 567–576.
CAMPBELL, G.L., CLASSEN, H.L., REICHERT, R.D. &CAMPBELL, L.D. (1983) Improvement of the nutritivevalue of rye for broiler chickens by gamma irradiation-induced viscosity reduction. British Poultry Science, 24:205–212.
CAMPBELL, G.L., ROSSNAGEL, B.G., CLASSEN, H.L. &THACKER, P.A. (1989) Genotypic and environmental dif-ferences in extract viscosity of barley and their relation-ship to its nutritive value for broiler chickens. Animal FeedScience and Technology, 26: 221–230.
CARRÉ, B. & BRILLOUET, J.M. (1989) Determination of water-insoluble cell walls in feeds: interlaboratory study. Journalof the Association of Of�cial Analytical Chemists, 72: 463–467.
CARRÉ, B., BEAUFILS, E. & MELCION, J.P. (1991) Evaluationof protein and starch digestibilities and energy value ofpelleted or unpelleted pea seeds from winter or springcultivars in adult and young chickens. Journal ofAgricultural and Food Chemistry, 39: 468–472.
CARRÉ, B., FLORÈS, M.P. & GOMEZ, J. (1995a) Effects of pel-leting, lactose level, polyethylene glycol 4000, and guargum compared to pectin on growth performances,energy values and losses of lactose, lactic acid, and waterin chickens. Poultry Science, 74: 1810–1819.
CARRÉ, B., GOMEZ, J., MELCION, J.P. & GIBOULOT, B. (1994)La viscosité des aliments destinés à l’aviculture.Utilisation pour prédire la consommation et l’excrétiond’eau. Production Animale, 7: 369–379.
CARRÉ, B., GOMEZ, J. & CHAGNEAU, A.M. (1995b)Contribution of oligosaccharide and polysaccharidedigestion, and excreta losses of lactic acid and short chain
fatty acids, to dietary metabolisable energy values inbroiler chickens and adult cockerels. British PoultryScience, 36: 611–629.
CARRÉ, B., MELCION, J.P., WIDIEZ, J.L. & BIOT, P. (1998)Effects of various processes of fractionation, grinding andstorage of peas on the digestibility of pea starch in chick-ens. Animal Feed Science and Technology, 71: 19–33.
CHOCT, M. & ANNISON, G. (1992) The inhibition of nutrientdigestion by wheat pentosans. British Journal of Nutrition,67: 123–132.
CHOCT, M., HUGHES, R.J. & BEDFORD, M.R. (1999) Effects ofa xylanase on individual bird variation, starch digestionthroughout the intestine, and ileal and caecal volatilefatty acid production in chickens fed wheat. British PoultryScience, 40: 419–422.
FERRANDO, C., VERGARA, P., JIMENEZ, M., & GONALONS, E.(1987) Study of the rate of passage of food withchromium-mordanted plant cells in chickens (Gallusgallus). Quarterly Journal of Experimental Physiology, 72:251–259.
FISHER, C. & MCNAB, J.M. (1987) Techniques for determin-ing the metabolisable energy (ME) content of poultryfeeds, in: HARESIGN, W. & COLE, D.J.A. (Eds) RecentAdvances in Animal Nutrition, pp. 3–18 (Guildford,Butterworths).
HESSELMAN, K., ELWINGER, K., NILSON, M. & THOMKE, S.(1981) The effects of beta-glucanase supplementation,stage of ripeness and storage treatment of barley in dietsfed to broiler chickens. Poultry Science, 60: 2664–2671.
HUYGHEBAERT, G. & SCHÖNER, F.J. (1999) In� uence ofstorage and addition of enzyme on metabolisable energycontent of wheat. 1. Impact of storage and enzyme addi-tion. Archiv für Ge�ügelkunde, 63: 13–20.
MAISONNIER, S., GOMEZ, J. & CARRÉ, B. (2001) Nutrientdigestibilities and intestinal viscosities in broiler chickensfed on wheat diets, as compared to guar-gum addedmaize-diets. British Poultry Science, 42: 102–110.
MCCRACKEN, K.J. & QUINTIN, G. (2000) Metabolisable energyof diets and broiler performance as affected by wheat spe-ci� c weight and enzyme supplementation. British PoultryScience, 41: 332–342.
MOLLAH, Y., BRYDEN, W.L., WALLIS, I.R., BALNAVE, D. &ANNISON, E.F. (1983) Studies on low metabolisableenergy wheats for poultry using conventional and rapidassay procedures and the effects of processing. BritishPoultry Science, 24: 81–89.
MORRISON, W.R. (1988) Lipids, in: POMERANZ, Y. (Ed) Wheat:Chemistry and Technolody, Vol. 1, pp. 373–440 (St Paul, MN,American Association of Cereal Chemists).
NICOL, N.T., WISEMAN, J. & NORTON, G. (1993) Factors deter-mining the nutritional value of wheat varieties forpoultry. Carbohydrate Polymers, 21: 211–215.
OURY, F.X., CARRÉ, B., PLUCHARD, P., BERARD, P., NYS, Y. &LECLERCQ, B. (1998) Genetic variability and stability ofpoultry feeding related characters in wheat, in relationto environmental variation. Agronomie, 18: 139–150.
ROGEL, A.M., ANNISON, E.F., BRYDEN, W.L. & BALNAVE, D.(1987) The digestion of wheat starch in broiler chickens.Australian Journal of Agricultural Research, 38: 639–649.
ROTTER, B.A., MARQUARDT, R.R., GUENTER, W., BILLIADERIS, C. & NEWMAN, C.W. (1989) In vitro viscosity measure-ments of barley extracts as predictors of growth responsesin chicks fed barley-based diets supplemented with afungal enzyme preparation. Canadian Journal of AnimalScience, 69: 431–439.
SAULNIER, L., PENEAU, N. & THIBAULT, J.F. (1995) Variabilityof grain extract viscosity and water soluble arabinoxylancontent in wheat. Journal of Cereal Science, 22: 259–264.
SHORT, F.J., WISEMAN, J. & BOORMAN, K.N. (2000) The effect of the 1B/1R translocation and endosperm texture on amino acid digestibility in near-isogenic lines of wheat
123456789101111234567892011112345678930111123456789401111234567895011112345678960111
414 B. CARRÉ ET AL.
DIGESTIBILITIES AND WHEAT CHARACTERISTICS 415
for broilers. Journal of Agricultural Science, Cambridge, 134:69–76.
SMITS, C.H.M. & ANNISON, G. (1996) Non-starch plant poly-saccharides in broiler nutrition: towards a physiologicallyvalid approach to their determination. World’s PoultryScience Journal, 52: 203–221.
SVIHUS, B., HERSTAD, O., NEWMAN, C.W. & NEWMAN, R.K.(1997) Comparison of performance and intestinal char-acteristics of broiler chickens fed on diets containingwhole, rolled or ground barley. British Poultry Science, 38:524–529.
TERPSTRA, K. & DE HART, N. (1974) The estimation of urinarynitrogen and faecal nitrogen in poultry excreta. Zeitschriftfür Tierphysiologie, Tierernährung und Futtermittelkunde, 32:306–320.
WISEMAN, J. (1990) Variability in the nutritive value of fats for non-ruminants, in: WISEMAN, J. & COLE, D.J.A. (Eds) Feedstuff Evaluation, pp. 215–234 (London, Butter-worths).
WISEMAN, J. (2000) Correlation between physical measure-ments and dietary energy values of wheat for poultry andpigs. Animal Feed Science and Technology, 84: 1–11.