Characterization of a PDR type ABC transporter gene from wheat ( Triticum aestivum L

Research article
Transcript-specific, single-nucleotide polymorphismdiscovery and linkage analysis in hexaploid bread wheat(Triticum aestivum L.)Alexandra M. Allen1, Gary L.A. Barker1, Simon T. Berry2, Jane A. Coghill1, Rhian Gwilliam3, Susan Kirby3, PhilRobinson3, Rachel C. Brenchley4, Rosalinda D’Amore4, Neil McKenzie5, Darren Waite5, Anthony Hall4,Michael Bevan5, Neil Hall4 and Keith J. Edwards1,*
1School of Biological Sciences, University of Bristol, Bristol, UK2Limagrain UK Limited, Woolpit Business Park, Suffolk, UK3KBioscience, Unit 7, Maple Park, Hertfordshire, UK4School of Biological Sciences, University of Liverpool, Liverpool, UK5John Innes Centre, Norwich Research Park, Norwich, UK
Received 5 April 2011;
accepted 24 April 2011.
*Correspondence (fax 44 117 925 7374;
email [email protected])
Keywords: wheat, next-generation
sequencing, KASPar genotyping,
single-nucleotide polymorphism.
SummaryFood security is a global concern and substantial yield increases in cereal crops are required to
feed the growing world population. Wheat is one of the three most important crops for
human and livestock feed. However, the complexity of the genome coupled with a decline in
genetic diversity within modern elite cultivars has hindered the application of marker-assisted
selection (MAS) in breeding programmes. A crucial step in the successful application of MAS
in breeding programmes is the development of cheap and easy to use molecular markers,
such as single-nucleotide polymorphisms. To mine selected elite wheat germplasm for interva-
rietal single-nucleotide polymorphisms, we have used expressed sequence tags derived from
public sequencing programmes and next-generation sequencing of normalized wheat comple-
mentary DNA libraries, in combination with a novel sequence alignment and assembly
approach. Here, we describe the development and validation of a panel of 1114 single-nucle-
otide polymorphisms in hexaploid bread wheat using competitive allele-specific polymerase
chain reaction genotyping technology. We report the genotyping results of these markers on
23 wheat varieties, selected to represent a broad cross-section of wheat germplasm including
a number of elite UK varieties. Finally, we show that, using relatively simple technology, it is
possible to rapidly generate a linkage map containing several hundred single-nucleotide poly-
morphism markers in the doubled haploid mapping population of Avalon · Cadenza.
Introduction
With the world’s population forecasted to reach nine billion by
2050, food security has become a critical global challenge for
the 21st century. It has been estimated that cereal production
needs to increase by 50% by 2030 (Foresight: The Future of
Food and Farming, 2011). Wheat is the dominant cereal crop
grown in temperate countries, and globally, one of the three
most important crops for human and livestock feed (Shewry,
2009). Consequently, increasing wheat yields is now one of the
top priorities for agricultural research (Reaping the benefits: Sci-
ence and the sustainable intensification of global agriculture,
2009). When compared with other crops, the increase in wheat
yields has slowed since the ‘green revolution’ of the 20th cen-
tury (Alston et al., 2010). While diploid crops such as rice and
barley have benefited from extensive genetic analysis and
molecular breeding programmes, the complexity of the wheat
genome has hindered these types of studies.
The allohexaploid genome of modern bread wheat (AABBDD)
is derived from the hybridization of the diploid DD genome of
Aegilops tauschii with the AABB tetraploid genome of Triticum
turgidum (Dubcovsky and Dvorak, 2007). The genetic bottle-
neck caused by this polyploid speciation event approximately
10 000 years ago has been intensified by the domestication of
wheat, resulting in a decline of genetic diversity within modern
inbred, elite cultivars (Haudry et al., 2007). To increase the
genetic diversity of bread wheat, it has been suggested that
greater use could be made of the various wild relatives of
wheat and that by introducing genes from these relatives it
might be possible to tap novel sources of stress, pest and dis-
ease resistance (Reynolds et al., 2011). However, such strate-
gies, sometimes referred to as pre-breeding, can be resource
intensive (Valkoun, 2001). A crucial step in making wheat pre-
breeding more efficient is the development of molecular mark-
ers capable of tracking the introduced genomic regions in large
numbers of lines. There are several challenges to developing
molecular markers in a polyploid species such as wheat, for
instance, the molecular markers must be capable of distinguish-
ing between the relatively large numbers of polymorphisms
seen in homoeologous and paralogous genes compared with
ª 2011 The Authors
Plant Biotechnology Journal ª 2011 Society for Experimental Biology, Association of Applied Biologists and Blackwell Publishing Ltd 1
Plant Biotechnology Journal (2011), pp. 1–14 doi: 10.1111/j.1467-7652.2011.00628.x
the relatively infrequent varietal polymorphisms (Barker and
Edwards, 2009). Homoeologous ⁄ paralogous and varietal single-
nucleotide polymorphisms (SNPs) have previously been studied
and used in polyploid crops (Akhunov et al., 2009; Bernardo
et al., 2009; Bundock et al., 2009; Edwards et al., 2009; Imel-
fort et al., 2009); however, these studies have also shown that
distinguishing intervarietal markers from intergenomic polymor-
phisms is complicated and prone to error. For example, a previ-
ous in silico study by our group showed that of the �71 000
putative SNPs identified in the wheat EST database, only �3500
appear to be intervarietal (�5%) with the majority being SNPs
in homoeologous and paralogous genes (Barker and Edwards,
2009). These results, together with the large size of the wheat
genome (�17 300 Mb), mean that despite the global impor-
tance of wheat, there are still relatively few validated varietal
SNP markers in regular use. While this situation remains, it is
likely that, when compared with other crops such as maize and
rice, wheat will continue to lag behind in terms of marker-
assisted selection in breeding programmes (Mochida and
Shinozaki, 2010).
The development of SNP-based genotyping platforms has
lead to an increase in the number of protocols available for
analysing the genetic variation in numerous species (Perkel,
2008). However, as with the development of SNPs, large-scale
genotyping in polyploid species is still a significant challenge
because of the presence of the homoeologous and paralogous
genes. Despite these challenges, a number of platforms have
recently been developed to perform high-density genotyping
(large numbers of SNPs, with small numbers of individual
plants), and these have been successfully employed to genotype
wheat (Akbari et al., 2006; Akhunov et al., 2010; Berard et al.,
2009; Chao et al., 2010). However, these technologies can be
difficult to optimize and as such they have yet to be generally
adopted by the wheat community leaving few options for
wheat breeders and geneticists who wish to carry out medium-
to low-density genotyping on large or very large numbers of
individual plants.
In the present study, we undertook to mine the UK wheat
germplasm for varietal SNPs. To do this, we used both the avail-
able wheat expressed sequence tags (ESTs) present in the public
database and next-generation sequencing (NGS), together with
a novel sequence alignment and assembly approach to identify
varietal SNPs in lines of interest to European wheat breeders.
We then investigated whether these SNPs could be validated by
a relatively new, high-throughput genotyping procedure, the
KBioscience Competitive Allele-Specific polymerase chain reac-
tion (KASPar) assay (Orru et al., 2009). Finally, we made use of
the existing Avalon · Cadenza mapping population to examine
whether the validated SNPs could be efficiently placed onto the
existing linkage groups identified within this doubled haploid
population.
Results
SNP discovery
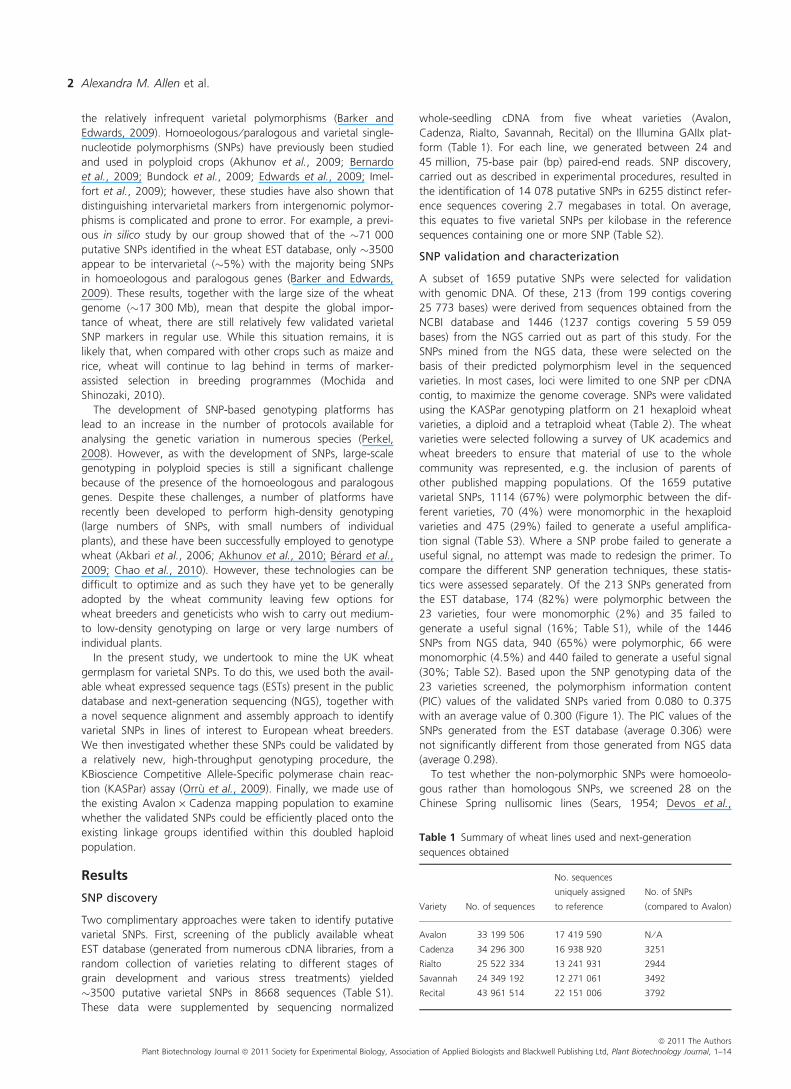
Two complimentary approaches were taken to identify putative
varietal SNPs. First, screening of the publicly available wheat
EST database (generated from numerous cDNA libraries, from a
random collection of varieties relating to different stages of
grain development and various stress treatments) yielded
�3500 putative varietal SNPs in 8668 sequences (Table S1).
These data were supplemented by sequencing normalized
whole-seedling cDNA from five wheat varieties (Avalon,
Cadenza, Rialto, Savannah, Recital) on the Illumina GAIIx plat-
form (Table 1). For each line, we generated between 24 and
45 million, 75-base pair (bp) paired-end reads. SNP discovery,
carried out as described in experimental procedures, resulted in
the identification of 14 078 putative SNPs in 6255 distinct refer-
ence sequences covering 2.7 megabases in total. On average,
this equates to five varietal SNPs per kilobase in the reference
sequences containing one or more SNP (Table S2).
SNP validation and characterization
A subset of 1659 putative SNPs were selected for validation
with genomic DNA. Of these, 213 (from 199 contigs covering
25 773 bases) were derived from sequences obtained from the
NCBI database and 1446 (1237 contigs covering 5 59 059
bases) from the NGS carried out as part of this study. For the
SNPs mined from the NGS data, these were selected on the
basis of their predicted polymorphism level in the sequenced
varieties. In most cases, loci were limited to one SNP per cDNA
contig, to maximize the genome coverage. SNPs were validated
using the KASPar genotyping platform on 21 hexaploid wheat
varieties, a diploid and a tetraploid wheat (Table 2). The wheat
varieties were selected following a survey of UK academics and
wheat breeders to ensure that material of use to the whole
community was represented, e.g. the inclusion of parents of
other published mapping populations. Of the 1659 putative
varietal SNPs, 1114 (67%) were polymorphic between the dif-
ferent varieties, 70 (4%) were monomorphic in the hexaploid
varieties and 475 (29%) failed to generate a useful amplifica-
tion signal (Table S3). Where a SNP probe failed to generate a
useful signal, no attempt was made to redesign the primer. To
compare the different SNP generation techniques, these statis-
tics were assessed separately. Of the 213 SNPs generated from
the EST database, 174 (82%) were polymorphic between the
23 varieties, four were monomorphic (2%) and 35 failed to
generate a useful signal (16%; Table S1), while of the 1446
SNPs from NGS data, 940 (65%) were polymorphic, 66 were
monomorphic (4.5%) and 440 failed to generate a useful signal
(30%; Table S2). Based upon the SNP genotyping data of the
23 varieties screened, the polymorphism information content
(PIC) values of the validated SNPs varied from 0.080 to 0.375
with an average value of 0.300 (Figure 1). The PIC values of the
SNPs generated from the EST database (average 0.306) were
not significantly different from those generated from NGS data
(average 0.298).
To test whether the non-polymorphic SNPs were homoeolo-
gous rather than homologous SNPs, we screened 28 on the
Chinese Spring nullisomic lines (Sears, 1954; Devos et al.,
Table 1 Summary of wheat lines used and next-generation
sequences obtained
Variety No. of sequences
No. sequences
uniquely assigned
to reference
No. of SNPs
(compared to Avalon)
Avalon 33 199 506 17 419 590 N ⁄ ACadenza 34 296 300 16 938 920 3251
Rialto 25 522 334 13 241 931 2944
Savannah 24 349 192 12 271 061 3492
Recital 43 961 514 22 151 006 3792
ª 2011 The Authors
Plant Biotechnology Journal ª 2011 Society for Experimental Biology, Association of Applied Biologists and Blackwell Publishing Ltd, Plant Biotechnology Journal, 1–14
Alexandra M. Allen et al.2

1999); of these, we were able to confirm that 26 (93%) were
in fact homoeologous SNPs and were therefore specific for
either the A, B or D genome, but not a specific variety.
To investigate the genetic relationship between the 23 lines,
we carried out a hierarchical cluster analysis using all 1114 vali-
dated SNPs between the varieties used in this study (Figure 2).
Several varieties clustered tightly together including the pairs of
Cadenza and Xi19; Claire and Alchemy; Opata and Weebil and
Hereward and Shamrock. The synthetic varieties formed a clear
outlying group, with the other varieties falling into two main
groupings. The first included subgroups of Renan, Robigus and
Avalon and Hereward, Shamrock, Brompton, Rialto and
Alchemy. The second group contained more diverse material
including the French lines Recital and Soissons, and the German
variety Alcedo.
Genetic map construction
An Avalon · Cadenza doubled haploid population comprising
190 individuals was scored for 548 loci (53 from the EST data
set and 495 from the NGS data set) using KASPar genotyping.
Of these, 38 loci showed significant segregation distortion and
were removed from the data set before constructing the link-
age groups. Using the information generated, in conjunction
with the 574 non-SNP markers previously available for this pop-
ulation, we were able to map 480 SNP markers (50 from the
EST data set and 430 from the NGS data set) to 21 linkage
groups representing chromosomes. A further 20 loci mapped to
unassigned linkage groups and 10 loci were unlinked (Table 3,
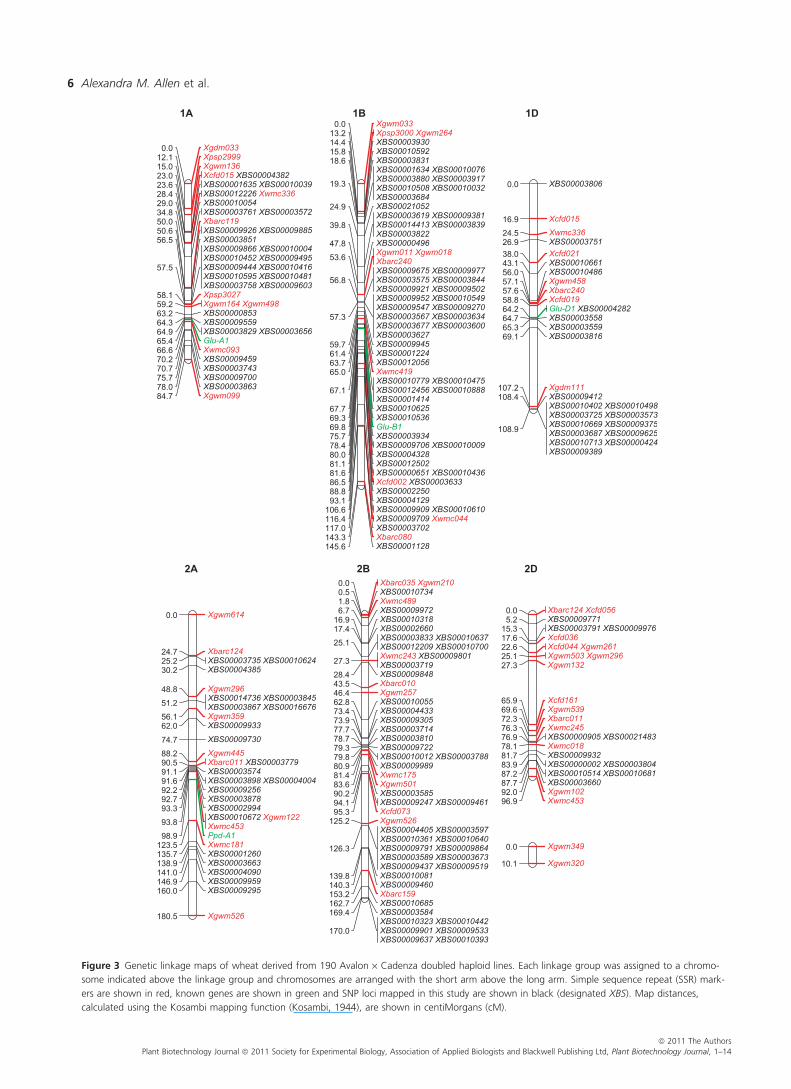
Figure 3, Table S4). The linkage groups ranged from 53.0 to
240.5 centiMorgans (cM) in size, with 9–108 markers. The total
map length was 2999 cM, with an average spacing of 2.8 cM
between loci. The total map lengths of each of the three ge-
nomes were approximately similar: 1131 cM for the A genome,
1075 cM for the B genome and 792 cM for the D genome
(Table 3). However, there was a significant difference in the dis-
tribution of SNP marker loci between the three genomes with
the A genome having 354 markers (163 SNPs), the B genome
having 526 markers (267 SNPs) and the D genome having 174
Table 2 Details of wheat varieties used in this study
Wheat Line Breeder ⁄ Source Ploidy Planting season Pedigree
Avalon PBIC Hexaploid Winter Maris-Ploughman · Bilbo
Alchemy Limagrain UK Ltd Hexaploid Winter Claire · (Consort · Woodstock)
Alcedo NIAB Hexaploid Winter (Record, AUT · Poros) · Carstens-VIII
Bacanora CIMMYT Hexaploid Spring (Jupateco-73 · BlueJay) · Ures-81
Brompton Elsoms Seeds Ltd Hexaploid Winter CWW 92.1 · Caxton
Cadenza PBIC Hexaploid Spring Axona · Tonic
Chinese Spring (L 42) JIC Hexaploid Spring Chinese Land Race
Claire Limagrain UK Ltd Hexaploid Winter Wasp · Flame
Hereward RAGT seeds Ltd Hexaploid Winter Norman ‘sib’ · Disponent
Opata CIMMYT Hexaploid Spring Bluejay · Jupateco-73
Recital C.C. Benoist Hexaploid Winter? Mexique-267 (R-267) · 9369
Renan INRA Hexaploid Winter (Mironovskaya-808 · Maris-Huntsman) · Courtot
Rialto PBIC Hexaploid Winter Haven · Fresco
Robigus KWS UK Ltd Hexaploid Winter Z836 · 1366 (PUTCH)
Savannah Zeneca Seeds UK Ltd. Hexaploid Winter Riband · Brigadier
Shamrock Verneuil Recherche Hexaploid Winter COMPL TIG 323-1-3m · CWW 4899 ⁄ 25
Soissons Maison Florimond Desprez, Franc Hexaploid Winter Iena (Jena) · HN35
Synthetic JIC Hexaploid Spring Unknown
Weebil CIMMYT Hexaploid Spring Unknown
Xi19 Limagrain UK Ltd Hexaploid Winter (Cadenza · Rialto) · Cadenza
TA1618 WGGRC Diploid Spring Aegilops Tauschii (D genome)
Croc WGGRC Tetraploid Spring Triticum turgidum subsp. Dicoccoides (AB genome)
Synthetic 39 WGGRC Hexaploid Spring TA1618 · Croc
PBIC, Plant Breeding International Cambridge, Ltd. (UK); NIAB, National Institute of Agricultural Botany; CIMMYT, International Maize and Wheat Improvement
Centre; JIC, John Innes Centre; INRA, French National Institute for Agricultural Research; WGGRC, Wheat Genetic and Genomic Resources Center.
0
50
100
150
200
250
300
350
400
450
0.0–0.10 0.10–0.15 0.15–0.20 0.20–0.25 0.25–0.30 0.31–0.35 0.35–0.40
Num
ber
of m
arke
rs
Polymorphism information content (PIC)
Figure 1 Distribution of polymorphism information content (PIC) of
SNPs among the 23 wheat varieties. The PIC was calculated for
each marker according to Botstein et al. (1980), using Excel
Microsatellite Toolkit add-in software (Park, 2001).
ª 2011 The Authors
Plant Biotechnology Journal ª 2011 Society for Experimental Biology, Association of Applied Biologists and Blackwell Publishing Ltd, Plant Biotechnology Journal, 1–14
Wheat SNP markers 3

markers (50 SNPs). The homoeologous chromosome groups also
showed variation in size and marker density; the combined
group 5 chromosome linkage maps measured the largest at
613 cM, while the group 4 linkage groups measured a total of
267 cM. Marker density was highest in the group 1 linkage
maps (average 1.7 cM between loci) and lowest in the group 7
linkage maps (average 3.8 cM between loci).
Our mapped SNP data set contained 48 loci that we had pro-
visionally mapped to specific chromosome regions using the
Kansas deletion lines (Endo and Gill, 1996; Qi et al., 2003).
Comparison of the map locations determined using both the
Kansas deletion lines and the genetic mapping confirmed the
map location for 29 of the 48 SNP markers (60%). A further 10
SNP loci mapped to the same homoeologous group, which gives
a total of 81% of the loci in common mapping to the same ho-
moeologous group. To extend this analysis, we also BLASTN
searched the 500 mapped SNP marker reference sequences
against the deletion-mapped ESTs produced by Qi et al. (2004).
Of the 155 SNP markers contained within these two data sets,
107 (69%) mapped to the same homoeologous group.
The same 500 mapped sequences were also BLASTN
searched against the Brachypodium distachyon genome
sequence (International Brachypodium Initiative., 2010) resulting
in 266 matches. A syntenic match was assumed where two or
more consecutive wheat mapped SNPs matched the same
B. distachyon chromosome. These criteria resulted in 205 of the
266 mapped wheat SNPs being placed on the B. distachyon
genome. SNP coverage was generally too low to explore synte-
ny in detail, but where sufficient markers existed, as for wheat
linkage group 2 versus B. distachyon chromosome 5, the syn-
tenic relationship was consistent with known chromosome rela-
tionships (Figure 5).
The putative functions of 500 sequences containing validated
and mapped SNP markers were determined, via BLASTX
searches, against the National Centre for Biotechnology Infor-
mation (NCBI) non-redundant protein sequence database using
an e-value cut-off of 10)5 (Table S5). This search indicated that
213 sequences (43%) had detectable similarity to sequences in
the database, while 287 sequences (57%) failed to detect any
sequences with a similarity at the level at or above the cut of
value. Of the 213 sequences with detectable sequence similari-
ties, we were able to identify 184 unique hits, as determined by
the SNP having either a unique hit in the database or having a
similar hit, but with a different map location. The remaining 29
SNPs were distributed between 13 contigs; one contig having
four SNPs, one contig having three SNPs and eleven contigs
having two SNPs each.
Optimization of primer design forhomoeologous-specific KASPar markers
Although no attempt was made to design homoeologous-
specific probes, 111 of the 1114 validated KASPar probes
(�10%) appeared to be specific for a single homoeologous
gene. In practical terms, these probes can be used to routinely
screen for heterozygotes in segregating populations, as well as
establishing the purity of inbred lines. Because such probes
might be of considerable interest to wheat breeders, we exam-
ined whether it was possible to convert generic KASPar probes
to homoeologous-specific assays. To do this, we used the pub-
licly available 5 · sequence coverage of the Chinese Spring
wheat genome (http://www.cerealsdb.uk.net/search_reads.htm)
to design homoeologous-specific KASPar reverse primers near
the existing varietal SNP ‘BS00000329’. In its original form,
KASPar probe BS00000329 detects either an ‘A’ or an ‘AG’
Figure 2 Indicator of genetic relationships between the of 23 wheat lines screened with 1114 KASPar probes. Hierarchical cluster analysis was performed
in PASW (SPSS Inc.) using the Squared Euclidean Distance method.
ª 2011 The Authors
Plant Biotechnology Journal ª 2011 Society for Experimental Biology, Association of Applied Biologists and Blackwell Publishing Ltd, Plant Biotechnology Journal, 1–14
Alexandra M. Allen et al.4

genotype. Using the available 5 · Chinese Spring genomic
sequences, we were able to design a new KASPar reverse pri-
mer that converted the original generic probe into a homoeolo-
gous-specific KASPar probe detecting either an ‘A’ or a ‘G’
genotype (Figure 5b,c).
Discussion
SNP discovery
This study represents the first large scale assembly of genotyp-
ing and genetic map information for elite UK wheat varieties
based on individual SNP markers. The SNPs described in this
study were mined from two sources; the NCBI wheat EST data-
base and next-generation cDNA sequencing data. Both sources
of data specifically targeted the identification of varietal SNPs in
coding regions, to generate molecular markers potentially linked
to genes of interest and include both synonymous and non-
synonymous point mutations. The EST data yielded �3500 puta-
tive varietal SNPs from 8668 sequences, with an average of 4.3
varietal SNPs per kilobase (Barker and Edwards, 2009). The exist-
ing EST data were supplemented by mining NGS data for varietal
SNPs, a technique that yielded 13239 putative varietal SNPs in
6255 sequences, with an average of five varietal SNPs per kilo-
base across the five varieties sequenced. Both SNP discovery
techniques identified a similar number of varietal SNPs per kilo-
base and are in agreement with previous estimates for varietal
SNPs in wheat (Ravel et al., 2007; Barker and Edwards, 2009).
SNP validation and characterization
A subset of putative varietal SNPs (1659) were selected for vali-
dation using the KASPar genotyping platform. The KASPar sys-
tem gave a conversion rate of �67% (1114 SNPs) using a
standard set of PCR conditions, which is extremely important
for routine MAS applications. However, this figure of 67%
could probably be increased with primer design and PCR opti-
mization if absolutely necessary. This conversion rate is lower
than previous studies on diploid species such as mouse (77%;
Petkov et al., 2004), but relatively high for a complex polyploid
such as wheat (Edwards et al., 2009). Of the putative varietal
SNPs, 4% were monomorphic in the hexaploid varieties, but
polymorphic between the hexaploid varieties and the diploid
and ⁄ or the tetraploid. This pattern suggests that these markers
represent intravarietal homoeologous SNPs. To test this theory,
we screened 28 markers from this category against the Chinese
Spring nullisomic lines and confirmed that 26 (93%) were in
fact homoeologous SNPs. These markers are likely to have been
misidentified as varietal SNPs in the discovery pipeline. Never-
theless, 4% is low when considering that intravarietal homoeol-
ogous SNPs account for �74% of all SNPs in wheat (Barker and
Edwards, 2009) and clearly demonstrates that our data sets
have been significantly enriched for varietal SNPs. The failure of
the remaining SNP markers to validate (29% failed to produce
a defined or useful cluster) is likely to be because of the pres-
ence of paralogous sequences, primer design issues (such as
primers spanning intron ⁄ exon boundaries or incorporating dif-
ferent homoeologous SNPs) and ⁄ or the need to optimize PCR
conditions. We made no attempts to optimize any failed assays,
and therefore, it is possible that these SNPs could be validated
with alternative primers.
The PIC values of the validated markers ranged from a mini-
mum of 0.08–0.375, with an average value of 0.300 (Figure 1),
a figure comparable to other estimates in wheat (Chao et al.,
2009; Edwards et al., 2009). No significant difference was
observed between the PIC values of markers from different
genomes or different homoeologous groups. A hierarchical clus-
ter analysis performed on the genotyping data at the SNP loci
used in this study indicates possible genetic relationships
between the 23 lines (Figure 2). Although the SNP markers
were selected based upon their polymorphism between just a
few lines (Avalon, Cadenza, Rialto, Savannah and Recital), the
expected clustering of varieties was observed, suggesting that
the SNP markers were representative of the genome. In particu-
lar, the close relationship between the varieties Cadenza and
Xi19 (derived from a Cadenza cross) and Claire and Alchemy
(derived from a Claire cross) is illustrated in the dendrogram.
The different varieties are split into two main clades with
the synthetics as an outlying group. The first clade includes
subgroups of Renan, Robigus and Avalon and Hereward, Sham-
rock, Brompton, Rialto and Alchemy; all winter wheat varieties.
The second clade contains more divergent material including
the French lines Recital and Soissons, and the German variety
Alcedo. A close relationship in this grouping is indicated
between Opata, Weebil and Bacanora, all spring wheat lines
Table 3 Summary of linkage groups and mapped loci
Linkage
Group Chromosome
Size
(cM)
Total
Number
of Loci
Number
of Bristol
SNP loci
Average spacing
between loci
(cM)
1 1A 104.9 52 28 2.0
2 1B 148.9 108 58 1.4
3 1D 108.9 50 20 2.2
4 2A 180.5 53 22 3.4
5 2B 181.1 85 43 2.1
6 2D 96.9 35 11 2.8
7 3A 155.5 37 18 4.2
8 3B 224.6 74 33 3.0
9 3D 53.0 15 1 3.5
10 4A 143.1 40 18 3.6
11 4B 53.7 26 16 2.1
12 4D 70.2 9 1 7.8
13 5A 179.5 51 23 3.5
14 5B 240.5 104 53 2.3
15 5D 193.1 20 8 9.7
16 6A 155.7 67 35 2.3
17 6B 132.0 82 37 1.6
18 6D 57.9 10 2 5.8
19 7A 212.3 54 19 3.9
20 7B 94.2 47 27 2.0
21 7D 212.3 35 7 6.1
Total 2998.8 1054 480 2.8
A genome 1131.4 354 163 3.2
B genome 1075.0 526 267 2.0
D genome 792.3 174 50 4.6
Group 1 362.8 210 106 1.7
Group 2 458.4 173 76 2.6
Group 3 433.1 126 52 3.4
Group 4 267.0 75 35 3.6
Group 5 613.1 175 84 3.5
Group 6 345.6 159 74 2.2
Group 7 518.7 136 53 3.8
ª 2011 The Authors
Plant Biotechnology Journal ª 2011 Society for Experimental Biology, Association of Applied Biologists and Blackwell Publishing Ltd, Plant Biotechnology Journal, 1–14
Wheat SNP markers 5
Xgdm0330.0Xpsp299912.1Xgwm13615.0Xcfd015 XBS0000438223.0XBS00001635 XBS0001003923.6XBS00012226 Xwmc33628.4XBS0001005429.0XBS00003761 XBS0000357234.8Xbarc11950.0XBS00009926 XBS0000988550.6XBS0000385156.5XBS00009866 XBS00010004XBS00010452 XBS00009495XBS00009444 XBS00010416XBS00010595 XBS00010481XBS00003758 XBS00009603
57.5
Xpsp302758.1Xgwm164 Xgwm49859.2XBS0000085363.2XBS0000955964.3XBS00003829 XBS0000365664.9Glu-A165.4Xwmc09366.6XBS0000945970.2XBS0000374370.7XBS0000970075.7XBS0000386378.0Xgwm09984.7
1AXgwm0330.0Xpsp3000 Xgwm26413.2XBS0000393014.4XBS0001059215.8XBS0000383118.6XBS00001634 XBS00010076XBS00003880 XBS00003917XBS00010508 XBS00010032XBS00003684
19.3
XBS0002105224.9XBS00003619 XBS00009381XBS00014413 XBS00003839XBS00003822
39.8
XBS0000049647.8Xgwm011 Xgwm018Xbarc24053.6XBS00009675 XBS00009977XBS00003575 XBS00003844XBS00009921 XBS00009502
56.8
XBS00009952 XBS00010549XBS00009547 XBS00009270XBS00003567 XBS00003634XBS00003677 XBS00003600XBS00003627
57.3
XBS0000994559.7XBS0000122461.4XBS0001205663.7Xwmc41965.0XBS00010779 XBS00010475XBS00012456 XBS00010888XBS00001414
67.1
XBS0001062567.7XBS0001053669.3Glu-B169.8XBS0000393475.7XBS00009706 XBS0001000978.4XBS0000432880.0XBS0001250281.1XBS00000651 XBS0001043681.6Xcfd002 XBS0000363386.5XBS0000225088.8XBS0000412993.1XBS00009909 XBS00010610106.6XBS00009709 Xwmc044116.4XBS00003702117.0Xbarc080143.3XBS00001128145.6
1B
XBS000038060.0
Xcfd01516.9Xwmc33624.5XBS0000375126.9Xcfd02138.0XBS0001066143.1XBS0001048656.0Xgwm45857.1Xbarc24057.6Xcfd01958.8Glu-D1 XBS0000428264.2XBS0000355864.7XBS0000355965.3XBS0000381669.1
Xgdm111107.2XBS00009412108.4XBS00010402 XBS00010498XBS00003725 XBS00003573XBS00010669 XBS00009375XBS00003687 XBS00009625XBS00010713 XBS00000424XBS00009389
108.9
1D
Xgwm6140.0
Xbarc12424.7XBS00003735 XBS0001062425.2XBS0000438530.2
Xgwm29648.8XBS00014736 XBS00003845XBS00003867 XBS0001667651.2Xgwm35956.1XBS0000993362.0XBS0000973074.7Xgwm44588.2Xbarc011 XBS0000377990.5XBS0000357491.1XBS00003898 XBS0000400491.6XBS0000925692.2XBS0000387892.7XBS0000299493.3XBS00010672 Xgwm122Xwmc45393.8Ppd-A198.9Xwmc181123.5XBS00001260135.7XBS00003663138.9XBS00004090141.0XBS00009959146.9XBS00009295160.0
Xgwm526180.5
2AXbarc035 Xgwm2100.0XBS000107340.5Xwmc4891.8XBS000099726.7XBS0001031816.9XBS0000266017.4XBS00003833 XBS00010637XBS00012209 XBS0001070025.1Xwmc243 XBS00009801XBS0000371927.3XBS0000984828.4Xbarc01043.5Xgwm25746.4XBS0001005562.8XBS0000443373.4XBS0000930573.9XBS0000371477.7XBS0000381078.7XBS0000972279.3XBS00010012 XBS0000378879.8XBS0000998980.9Xwmc17581.4Xgwm50183.6XBS0000358590.2XBS00009247 XBS0000946194.1Xcfd07395.3Xgwm526125.2XBS00004405 XBS00003597XBS00010361 XBS00010640XBS00009791 XBS00009864XBS00003589 XBS00003673XBS00009437 XBS00009519
126.3
XBS00010081139.8XBS00009460140.3Xbarc159153.2XBS00010685162.7XBS00003584169.4XBS00010323 XBS00010442XBS00009901 XBS00009533XBS00009637 XBS00010393
170.0
2B
Xbarc124 Xcfd0560.0XBS000097715.2XBS00003791 XBS0000997615.3Xcfd03617.6Xcfd044 Xgwm26122.6Xgwm503 Xgwm29625.1Xgwm13227.3
Xcfd16165.9Xgwm53969.6Xbarc01172.3Xwmc24576.3XBS00000905 XBS0002148376.9Xwmc01878.1XBS0000993281.7XBS00000002 XBS0000380483.9XBS00010514 XBS0001068187.2XBS0000366087.7Xgwm10292.0Xwmc45396.9
Xgwm3490.0
Xgwm32010.1
2D
Figure 3 Genetic linkage maps of wheat derived from 190 Avalon · Cadenza doubled haploid lines. Each linkage group was assigned to a chromo-
some indicated above the linkage group and chromosomes are arranged with the short arm above the long arm. Simple sequence repeat (SSR) mark-
ers are shown in red, known genes are shown in green and SNP loci mapped in this study are shown in black (designated XBS). Map distances,
calculated using the Kosambi mapping function (Kosambi, 1944), are shown in centiMorgans (cM).
ª 2011 The Authors
Plant Biotechnology Journal ª 2011 Society for Experimental Biology, Association of Applied Biologists and Blackwell Publishing Ltd, Plant Biotechnology Journal, 1–14
Alexandra M. Allen et al.6

XBS000037740.0XBS00009793 XBS00010059XBS000037331.1
XBS0000062823.6Xgwm36937.9Xcfd07948.0Xwmc50560.8XBS0000380161.4Xbarc01963.6Xwmc489 XBS0000383766.5XBS0000396468.7XBS0000946569.3XBS0001101271.0Xwmc26475.4XBS0001002277.1XBS0000377877.6XBS00003768 XBS00003924XBS00010414 XBS0000064678.7Xgwm155102.8
XBS00009649128.1
XBS00003849155.5
3AXcfd0790.0XBS0000410812.0XBS0000983914.8Xgwm49318.5XBS0000359626.1XBS0000133526.6XBS0001231627.7Xgwm38932.3Xbarc07546.8XBS0000999247.3XBS0001253149.0XBS0000381449.6Xbarc13350.2XBS00009393 XBS0000407451.3XBS0000390273.4XBS0000387183.3XBS0000386489.3XBS0000370890.9Xgwm28592.0XBS0001071592.6XBS0000928993.2Xbarc164 XBS0000947594.8XBS0000965195.4XBS00009579 XBS00000793XBS00012452 XBS00003781XBS00003727
95.9
XBS0001238897.5XBS0000989298.6XBS00001242 XBS0002086199.7XBS00000978100.3Xgwm131103.0XBS00010572114.1Xwmc326138.8XBS00003836156.7XBS00003931157.8XBS00003717178.0XBS00003884181.4Xgwm547183.0
3B
Xgwm0520.0Xcfd004 Xgwm456Xcfd062 Xgdm0724.6Xwmc5055.3Xgwm64512.0Xgwm31420.2
Xcfd00950.3XBS0000368857.3
3D
XBS000039140.0Xcfd0021.2
XBS0000377613.2XBS0000120714.3
XBS0001033926.3XBS00009974 XBS0000124127.9
XBS0001045533.4Xdupw004 XBS0000362336.1Xbarc17038.4
XBS0000367443.9XBS0001050445.0
Xwmc25851.2
Xwmc16156.1
XBS0001058259.9
Xgwm3500.0XBS000036925.0XBS000035875.6XBS000097036.7XBS000096807.2
Xbarc07813.7
Xgwm16017.5
XBS00000346 XBS00009882XBS00009590 Xbarc07031.9
4AXBS00009480 XBS000101150.0
XBS0000925310.8XBS0000364611.4Xbarc02012.5Xwmc08913.7XBS0000953016.5XBS0000991517.6XBS00003858 XBS0000967218.2Xgwm51320.3XBS00010409 XBS00003759XBS0001006722.5XBS0000376523.0XBS0000440724.7
Xwmc34934.5
Xgwm53840.6
XBS00003704 XBS00003927XBS0000933353.7
4BRht-D10.0
Xcfd02311.2Xwmc08912.5XBS0000385415.7
Xgwm19456.3
Xgwm62470.3
4D
Figure 3 Continued
ª 2011 The Authors
Plant Biotechnology Journal ª 2011 Society for Experimental Biology, Association of Applied Biologists and Blackwell Publishing Ltd, Plant Biotechnology Journal, 1–14
Wheat SNP markers 7

Xbarc0100.0XBS000043736.8
XBS0000369630.8
Xgwm595a55.6Xgwm12958.5Xwmc48969.5Xwmc15076.0Xgwm29377.1XBS0000531181.8XBS0000064582.9Xgwm15684.0XBS0001565389.8XBS0000037392.5Xgwm595b Xgwm18695.3XBS00009658 XBS00003746XBS00009531104.0XBS00000435107.2XBS00000648113.2Xgwm617118.7
Vrn-A10.0XBS00011360 XBS00010702XBS000104190.6XBS0000173510.3
Xgwm1260.0Xgwm595c5.9Xgwm29118.1XBS0001004823.2XBS00001953 XBS00003693XBS00000037 XBS00000028XBS00009274 XBS00003501XBS00000006
23.7
5AXBS000092640.0Xgwm234 XBS0000373912.9Xdupw11516.6XBS0001049128.8XBS0000390038.5XBS00003876 Xbarc07456.1XBS0000971958.3XBS0000370564.7XBS0000368166.4Xgwm21370.0XBS0000372670.5XBS0000371571.1XBS0000378972.2XBS0000181772.7XBS0000960784.7XBS00009311 XBS0001063686.5XBS00010675 XBS0001003392.4XBS0000086593.8XBS00003736 XBS0000985195.7XBS0001178296.8XBS00010341 XBS00003879XBS00010542 XBS00009931XBS00010581
97.3
XBS00009373 XBS00009581XBS00009382 XBS0000372497.9XBS00000701108.9XBS00010590109.4XBS00009414110.2XBS00004427117.0XBS00003565118.2Xgwm408121.8XBS00003904129.7XBS00011453130.8XBS00003770 XBS00003637XBS00003615131.9XBS00003740134.6XBS00000592 XBS00010573136.2XBS00003592140.5XBS00009621149.9XBS00010802152.7XBS00011183 XBS00003655153.2Xbarc142 XBS00009388154.3
5B
Pinb-D10.0
Xgwm19011.9
Xgwm29343.1Xgwm35848.6Xgwm15951.3
Xgwm17468.9
Xgdm063125.4
Xbarc110137.8
XBS00003711 XBS00000622162.3XBS00003826169.3XBS00009294169.9XBS00003783170.9XBS00004065172.5XBS00011769174.2
XBS00003563193.1
5D
Xgwm3340.0XBS000124146.2XBS00012150 XBS00003632XBS00004278 XBS000097596.7
XBS00009584 XBS0000363536.5XBS00003861 Xbarc023XBS00009746 XBS0000966438.6XBS0000103749.9XBS0000937651.6Xbarc10762.9Xbarc17167.1XBS00003581 XBS00001132XBS0000987167.6XBS00004377 XBS0000388168.2XBS00009988 XBS0000978368.7XBS00003616 XBS00010586XBS00003916 XBS00003877XBS00009261 XBS00010730XBS00001405 XBS00003676
70.3
Xgwm570 XBS0000383581.0
Xgwm169104.2
Xgwm617115.6
XBS00003339129.0XBS00010526129.5XBS00010408130.1XBS00003818 XBS00003958130.6XBS00003905 XBS00003723131.2Xdupw167136.8
6AXBS000106930.0XBS00003772 XBS00009825XBS00003812 XBS00003659XBS00003593
1.7
XBS000124812.8XBS00003785 XBS00009795XBS00010580 XBS00009967XBS00003792 XBS00003622XBS00003748 XBS00010551
3.4
XBS000037864.6Xcfd013 XBS00003852XBS00010420 XBS00003893XBS00010415
40.3
XBS0001249141.0Xwmc10558.3Xgwm68059.4Xgwm60861.9XBS0001053763.1XBS0000364163.6XBS00010328 XBS00010602XBS00004016 XBS0000984464.1XBS00003620 XBS00009695XBS00003897 XBS0001972667.8XBS0001436370.0XBS0000367170.5XBS0000356271.6Xgwm21983.1
Xgwm285 Xwmc089Xbarc134102.1
XBS00010618117.7
XBS00010627131.5XBS00009548132.0
6B
Xbarc1830.0XBS000098061.2XBS000107422.3
Xbarc17314.9
Xgwm32543.6Xbarc05445.9Xcfd01947.2
Xbarc17556.7
6D
Figure 3 Continued
ª 2011 The Authors
Plant Biotechnology Journal ª 2011 Society for Experimental Biology, Association of Applied Biologists and Blackwell Publishing Ltd, Plant Biotechnology Journal, 1–14
Alexandra M. Allen et al.8

developed by CIMMYT. Savannah does not appear to cluster
with the other hexaploid varieties, reflecting the exotic genetic
background to this line. The hierarchical cluster analysis illus-
trates the genetic relationship between the varieties used in this
study, but also indicates the reduction in germplasm variation
within elite lines and the need for introducing genetic diversity
into breeding programmes (Haudry et al., 2007).
Genetic map
A linkage map is often the first step towards understanding
genome assembly and evolution and provides an essential
framework for mapping agronomic traits of interest (Xia et al.,
2010). We present here the first SNP-based linkage map for
wheat, constructed using 500 transcript-linked varietal SNPs
generated in this study in combination with 574 previously
developed markers (Figure 3). The total map length was
2999 cM, similar in length to previous framework linkage maps
produced in wheat using microsatellite markers (2569 cM; Som-
ers et al., 2004), DArT markers (2937 cM; Akbari et al., 2006)
and a combination of markers (3522 cM; Quarrie et al., 2005).
While each of the three genomes had similar map lengths
(1131 cM for the A genome; 1075 cM for the B genome and
792 cM for the D genome), there was a significant difference
between the distribution of markers (i.e. SSR, SNP, AFLP and
DArT loci) between the three genomes (A genome 354 mark-
ers; B genome 526 markers; D genome 174 markers), a ratio of
33 : 50 : 17, and this difference was more apparent when cal-
culated for the 480 SNP markers alone (34 : 56 : 10). The ratio
of total markers on the three genomes is similar to that
observed by Quarrie et al. (2005) who found the distribution of
markers between the three genomes at a ratio of 40 : 40 : 20
for the A, B and D genomes, respectively. Other comparable
ratios from wheat linkage maps for the A ⁄ B ⁄ D genomes were
33 : 41 : 25 (Roder et al., 1998), 30 : 39 : 31 (Somers et al.,
2004) and 28 : 60 : 12 (Bernardo et al., 2009).
As might be expected, the distributions of markers on each
of the several homoeologous chromosome groups were not
uniform with large gaps of more than 30 cM on D genome
chromosomes and concentrations of markers around the cen-
tromeres that were particularly noticeable on A and B chromo-
somes. Our SNP marker set contained a considerably lower
number of D genome markers than previously developed mar-
ker sets; this is a likely consequence of SNP markers targeting
genic regions, while other marker types are distributed more
evenly throughout the genome. The lack of D genome markers
compared with the A and B genomes has been attributed to
the loss of polymorphism in coding regions during the genetic
bottleneck that accompanied the development of modern elite
cultivars and indicates that future SNP discovery efforts will be
required to specifically target the D genome to offset the
XBS000095430.0XBS000100062.9
Xgwm63511.2
Xwmc38821.0
XBS00003665 XBS0000940427.5
Xgwm1300.0Xbarc1271.8XBS000025562.4
XBS0000997816.7XBS0001030717.2XBS0001060517.7Xbarc12126.9Xbarc108 Xgwm63129.6Xbarc029 Xbarc04932.1
XBS0000955048.8XBS0000997550.4XBS0000389452.0
XBS00003621 XBS0000145087.4XBS0001419988.5XBS00004348 XBS0000988696.3XBS0000386597.9Xgwm34499.5XBS00000663 XBS00003720101.8
Xcfa2040119.8
7AXbarc172 Xbarc1760.0XBS000038302.3XBS00003494 XBS000037602.9
XBS0000335017.8XBS0000929018.9XBS0000955620.0Xwmc51722.1
XBS0000939831.5XBS00009861 Xdupw39836.4
XBS00009464 XBS0001045451.0XBS0001066051.6Xgwm57760.4XBS0001032762.6XBS00009879 XBS00003664XBS00003672 XBS0001056064.5XBS0000506266.2Xbarc03267.4XBS0000924569.9XBS0000937970.4XBS00004376 XBS00009619XBS0000375674.7XBS0000364978.5XBS00004171 XBS0000440379.1XBS0000370380.2XBS0001014294.2
7BXpsp3113 Xbarc17222.7XBS0000945724.0Xgwm43724.5Xcfd02127.8
Xwmc15039.1
Xbarc0700.0
XBS0000956515.4XBS0001006415.9
Xgwm4280.0XBS000039451.2XBS000100712.4XBS00009623 XBS000037492.9Xbarc097 Xcfa20407.8
Xbarc07617.7
7D
Figure 3 Continued
ª 2011 The Authors
Plant Biotechnology Journal ª 2011 Society for Experimental Biology, Association of Applied Biologists and Blackwell Publishing Ltd, Plant Biotechnology Journal, 1–14
Wheat SNP markers 9

effects of lower levels of genetic diversity in this genome (Cald-
well et al., 2004; Chao et al., 2009). Marker distribution
between the homoeologous linkage groups ranged from 7 to
20% of the total markers, with group 4 containing the lowest
number of markers, a pattern also seen in the linkage map of
Somers et al. (2004). In a genome-wide study of nucleotide
diversity by Akhunov et al. (2010) the group 4 chromosomes
were found to have low levels of diversity, with chromosomes
4A and 4B having similar diversity to the D genome. It has been
hypothesized that homoeologous group 4 chromosomes have a
lower number of genes than the remaining six homoeologous
groups (Qi et al., 2004) and hence a lower level of recombina-
tion and resulting genetic diversity (Akhunov et al., 2010).
The genetic map locations of the 500 SNP loci generated in
this study were compared with their predicted map location
from physical mapping experiments. Of 48 genetically mapped
loci, 81% mapped to the same homoeologous group predicted
by the Kansas deletion lines. A similar comparison of 155 SNP
loci with deletion-mapped ESTs revealed that 69% mapped to
the same homoeologous group (Qi et al., 2004). While this is a
relatively high level of correlation, discrepancies in the data are
not unexpected because of the numerous secondary and ter-
tiary deletions seen in the deletion lines (Qi et al., 2004).
Genetic map locations of SNP loci that can also be placed on
physical maps are a potentially useful resource for identifying
and characterizing these additional deletions.
The same 500 mapped sequences were also BLASTN
searched against the B. distachyon genome sequence resulting
in 205 wheat SNPs being placed on the B. distachyon genome.
Although SNP coverage was generally low when mapped mark-
ers were divided between wheat chromosomes, where suffi-
cient markers existed, as for wheat linkage group 2 versus
B. distachyon chromosome 5, the relationship was consistent
with known chromosomal relationships (International Brachypo-
dium Initiative., 2010; Figure 4). We found that the synteny
between wheat group 2 and B. distachyon chromosome 5 was
generally in line with expectations; however, we did find that
two SNPs (BS0010442 and BS00009533) that mapped to the
same point in linkage group 2 were placed at opposite ends of
B. distachyon chromosome 5. To investigate this further, we
BLAST searched both the rice and Sorghum bicolor genomes
with the sequences flanking BS0010442 and BS00009533. We
found no match against the rice genome, but both SNPs
mapped to within 135 kilobases of each other on S. bicolor
chromosome 6. From these results, we tentatively conclude that
the ancestral state of these markers is to lie in close proximity
and that a chromosomal rearrangement, such as a reciprocal
telomeric translocation, has altered their relative positions in the
lineage leading to B. distachyon.
Screening the 500 sequences against the NCBI non-redun-
dant protein sequence database generated 213 hits, of which
184 were unique. Owing to the nature of the normalized cDNA
libraries used, the unique sequences identified did not show a
significant bias to sequences associated with either leaf or root
gene expression (the tissues used to generate the cDNA
libraries); instead, they reveal an interesting mix of sequences,
such as various disease resistance-like genes, sequences involved
in DNA repair and various genes involved in numerous meta-
bolic pathways. While this analysis indicated that a number of
sequences (13) had multiple SNPs, it also revealed that 17 SNPs
showed similarity to the same database entries, but mapped to
different regions of the genome. For instance, three SNPs
showed sequence similarity to rice sequence H0322F07.7; one
of these SNPs, BS00009929, mapped to an unassigned linkage
group, while the second SNP, BS00010640, mapped to 2B and
the third SNP, BS00014363, mapped to 6B. The presence of
homoeologous and paralogous sequences throughout the
wheat genome has been documented (Gupta et al., 2008).
However, the specific example shown here and the remaining
16 examples, in which similar sequences could be mapped to
individual locations, suggest that KASPar-based genotyping is
sufficiently sensitive and robust to map individual paralogous
genes in the wheat genome.
Homoeologous versus non-homoeologous-specificKASPar probes
In wheat, the majority (�90%) of the KASPar probes detect
both the polymorphic and non-polymorphic homoeologous loci.
While such probes are suitable for screening inbred wheat vari-
eties, screening heterozygous material is more problematical. To
overcome this, we investigated the possibility of converting a
standard KASPar probe (BS0000329; Figure 5b) to a homoeolo-
gous-specific KASPar probe. Using the 5 · Chinese Spring
wheat genome sequence, we were able to design three homo-
eologous-specific reverse primers, which when used in conjunc-
tion with the original varietal SNP-specific KASPar primers
generated one of two possible results; a non-polymorphic probe
(when the homoeologous copy being amplified did not contain
a varietal SNP; Figure 5c) or a polymorphic probe (when the
homoeologous copy being amplified did contain a varietal SNP;
Figure 5d). Use of the redesigned homoeologous-specific prim-
ers to screen an F2 population confirmed that they were capa-
ble of discriminating between homozygotes and heterozygotes
(Figure 5e). Examination of the genomic sequence around sev-
eral other KASPar loci suggested that it should be possible to
design homoeologous-specific primers for the majority of the
SNPs generated in this investigation. However, in the absence
of both suitable primer design software and a more complete
genome sequence, this process is time-consuming taking
approximately 30 min per probe and requires further experi-
0
0.2
0.4
0.6
0.8
1
1.2
0 50 100 150 200
Posi
tion
in b
rach
ypod
ium
chr
5 (f
l)
Position in wheat group 2 (cM)
Figure 4 Scatterplot showing the syntenic relationship between the
wheat SNP map positions generated in this study for linkage group 2
and the corresponding location in Brachypodium distachyon, shown as
fraction of length (fl) along chromosome 5. The wheat SNP flanking
sequences were matched to the B. distachyon genome using BLASTN
with an e-value cut-off of 1e)10. Wheat linkage group 2 is shown here
as it has the highest number of markers mapped onto the B. distachyon
genome. The point marked in red is SNP BS0010442, and that in black
is SNP BS00009533, both of which map to 181 cM in wheat linkage
group 2.
ª 2011 The Authors
Plant Biotechnology Journal ª 2011 Society for Experimental Biology, Association of Applied Biologists and Blackwell Publishing Ltd, Plant Biotechnology Journal, 1–14
Alexandra M. Allen et al.10

mental work to validate the appropriate primer combination.
Therefore, it is our belief that currently it is more productive to
design nonspecific KASPar probes and convert these to homo-
eologous-specific probes only when they are found to be useful
for a specific purpose, for instance, when they are found to be
tightly linked to a locus of interest.
Conclusions
To the best of our knowledge, this is the first report of a public
linkage map for hexaploid wheat containing several hundred
individual SNP markers. Bernardo et al. (2009) have reported a
linkage map of wheat consisting of 923 single feature polymor-
phisms (SFPs) obtained by using Affymetrix arrays on 71 recom-
bination inbred lines from the cross Ning 7840 · Clark.
However, as reported, attempts to convert the array-based SFP
markers to useful SNP markers that can be used in single locus
assays were time-consuming and only partially successful with
33 working SNaPshot markers being generated from 58 SFPs
tested. In addition, we believe this report is also the first dem-
onstration of KASPar-based technology to both genotype wheat
varieties and generate a linkage map. To generate the SNP-
based linkage map described, we carried out 102 220 individual
KASPar reactions (538 probes · 190 plants). These reactions
were carried out within a 24-h period, using simple microplate
technology and a relatively inexpensive and widely available flu-
orescence resonance energy transfer plate reader. Using this
and similar technology, we believe that it will be possible for
wheat breeders to achieve one of their most important goals,
to rapidly and cheaply genotype thousands of plants with a
large and flexible number of markers.
Although we believe that the work described here meets the
requirements of both wheat breeders and academics, it is likely
that other technologies will be developed, which will increase
the rate of SNP-based genotyping ⁄ mapping and decrease the
cost of the individual data points. However, our studies have
also shown that there is need for further SNPs, especially for
the D genome and the homoeologous group 4 chromosomes,
(c)(b)
(e)(d)
(a)Homoeolog 1v1 #1 AAAATTCATG AATGCCCGCA GATACCTGTA GGCATGTACAHomoeolog 2v1 #1 AAAATTCATG AATGCCCGCA GATACCTGTA GGCATGTACAHomoeolog 3v1 #1 AAAATTCATG AATGCCCGCG GATACCTGTA GGCATGTGCAHomoeolog 1v2 #1 AAAATTCATG AATGCCCGCA GATACCTGTA GGCATGTACAHomoeolog 2v2 #1 AAAATTCATG AATGCCCGCA GATACCTGTA GGCATGTACAHomoeolog 3v2 #1 AAAATTCATG AATGCCCGCG GATACCTGTA GGCATGTACA
TGTACGGATGTCCATAGGCGCAremirpraPSAK ATGTACGGATGTCCATAGGCGGremirPraPSAK G
Homoeolog 1v1 #41 ATCGTTATCA GTAAATTCTG CCGTCCTAGA CTCCATCGCAHomoeolog 2v1 #41 ATCGTTATCA GTAAATTCTG CCGTCCTAGA CTCCATCACAHomoeolog 3v1 #41 ATCGTTATCA GTAAATTCTG CCGTCCTAGA CTCCATGACAHomoeolog 1v2 #41 ATCGTTATCA GTAAATTCTG CCGTCCTAGA CTCCATCGCAHomoeolog 2v2 #41 ATCGTTATCA GTAAATTCTG CCGTCCTAGA CTCCATCACAHomoeolog 3v2 #41 ATCGTTATCA GTAAATTCTG CCGTCCTAGA CTCCATGACAReverse primer 1 TAGCAATAGT CATTTAAGACHomoeolog 1 SRP GCGTHomoeolog 2 SRP GTGTHomoeolog 3 SRP CTGT
Homoeolog 1v1 #81 TGTCTTGTTT CCTAGCTTCC TGGAHomoeolog 2v1 #81 TGTCTTGTTT CCTAGCTTCC TGGAHomoeolog 3v1 #81 TGTCTTGTTT CCTAGCTTCC TGGAHomoeolog 1v2 #81 TGTCTTGTTT CCTAGCTTCC TGGAHomoeolog 2v2 #81 TGTCTTGTTT CCTAGCTTCC TGGAHomoeolog 3v2 #81 TGTCTTGTTT CCTAGCTTCC TGGAHomoeolog 1 SRP ACAGAACAAA GGATCHomoeolog 2 SRP ACAGAACAAA GGATCHomoeolog 3 SRP ACAGAACAAA GGATC
Figure 5 Effect of primer design of specificity of the KASPar reaction. (a) Sequence of region around SNP BS00000329 in the three wheat homoeolo-
gous genes and across two varieties (v1 and v2) together with the six probes designed for this region. The varietal SNP (A ⁄ G) and the homoeologous
SNPs are highlighted. The reverse primer 1 and the three homoeologous-specific primers (SRP) are shown as designed in the reverse compliment to the
BS00000329 sequence. (b-d) KASPar plots following amplification with the various primer combinations. For b–c, the standard 20 hexaploid varieties
were used together with a negative control (E3, E6 and E9) and a diploid, tetraploid and resulting synthetic line. In all cases, the KASPar primers A and
G were used. In (b), the generic reverse primer was used; in (c), Homoeolog 1 SPR was used while in (d) Homoeolog 3 SPR was used. No results are
presented for Homoeolog 2 SPR as this gave the same result as Homoeolog 1 SPR. (e) KASPar plot of F2-derived material following amplification with
the KASPar primers A and G together with the Homoeolog 3 SRP primer. In (e), both homozygotes (Blue and red spots) and heterozygotes (green
spots) are shown as discrete clusters.
ª 2011 The Authors
Plant Biotechnology Journal ª 2011 Society for Experimental Biology, Association of Applied Biologists and Blackwell Publishing Ltd, Plant Biotechnology Journal, 1–14
Wheat SNP markers 11

but with continued SNP development genome-wide association
studies will soon become possible in wheat. The extensive
genomics resources developed by whole-genome shotgun
sequencing of Chinese Spring, coupled to re-sequencing multi-
ple breeding lines, promises to dramatically increase the number
of informative SNPs, permitting unprecedented levels of preci-
sion genetic analysis in wheat breeding.
Our work has also highlighted the need to capture all of the
information associated with the SNP markers, for instance, the
sequence surrounding the SNP being assayed. This information
will allow the SNP to be adapted and used in a variety of geno-
typing platforms as and when they are developed. It is for this
reason that via this publication, we have made all the data
associated with the SNP, including the available flanking
sequences (usually 120 base pairs or greater) available via the
associated supplementary data (Tables S1 and S2). We hope
that by making this information available, it will encourage
other wheat geneticists to ensure that such markers are made
public and free to use. Only by following this principle will we
help to ensure that wheat breeders across the world have the
tools required to breed new varieties.
Experimental procedure
Plant material
The wheat lines included in this study were selected to give the
best representation of the UK wheat germplasm. Twenty-three
different wheat varieties were grown for nucleic acid extraction
(for details see Table 2). The Avalon · Cadenza population (sup-
plied by the John Innes Centre) of doubled haploid (DH) individ-
uals, derived from F1 progeny of a cross between cvs Avalon
and Cadenza, was developed by Clare Ellerbrook, Liz Sayers and
the late Tony Worland (John Innes Centre), as part of a Defra
funded project led by ADAS. The parents were originally chosen
(to contrast for canopy architecture traits) by Steve Parker (CSL),
Tony Worland and Darren Lovell (Rothamsted Research, West
Common, Harpenden, Hertfordshire, AL5 2JQ, UK).
All plants were grown in pots in a peat-based soil and main-
tained in a glasshouse at 15–25 �C under a light regime of
16 h light, 8 h dark. Root and leaf tissues were harvested from
6-week-old plants. All harvested tissues were immediately fro-
zen on liquid nitrogen and stored at )80 �C until nucleic acid
extraction.
Preparation of normalized cDNA libraries
Total RNA was extracted from root and leaf tissue of five wheat
varieties (Avalon, Cadenza, Rialto, Savannah, Recital) using the
TRIzol RNA extraction protocol (Invitrogen Ltd., Paisley, UK)
according to the manufacturer’s instructions and purified using
the RNeasy MinElute Kit (QIAGEN Ltd., Crawley, UK). Comple-
mentary DNA (cDNA) was synthesized from total RNA using the
MINT kit (Evrogen, Moscow, Russia) according to the manufac-
turer’s instructions. Double-stranded cDNA was purified using
the QiaQuick PCR purification kit (QIAGEN Ltd.). The purified
cDNA samples were then normalized using the TRIMMER kit
(Evrogen) according to the manufacturer’s instructions and puri-
fied using the QiaQuick PCR purification kit (QIAGEN Ltd.).
Next-generation sequencing
For each variety, 5 lg of normalized cDNA was processed for
sequencing by the University of Bristol Transcriptomics Facility.
Independent sequence libraries were generated by following
the manufacturer’s protocol for sequencing of genomic DNA
(Illumina Inc., San Diego, CA), with a modification to allow mul-
tiplexing of samples. Five sets of custom adapters were
designed based upon the Illumina PCR primers plus an extra
4-base barcoding tag. Sequencing was carried out on a paired-
end flowcell, using Illumina’s v.4 Cluster Generation and multiple
v.4 36-Cycle Sequencing Kits. The Illumina Genome Analyzer IIx,
was run for 2 · 76 bases of data acquisition. Image analysis
and base calling was performed with SCS 2.3 software (Illumina
Inc, San Diego, CA).
SNP discovery
Putative varietal SNPs were mined from two sources. First, public
wheat Expressed Sequence Tag (EST) data held at NCBI was used
as described by Barker and Edwards (2009). In this data set,
3500 SNPs were deemed to have a high probability of being vari-
etal (as opposed to homoeologous), and from these, we selected
213 for validation. In the second approach, SNPs were mined
from NGS data as follows. A reference sequence data set com-
prising 91 368 sequences was produced by combining the data
from NCBI wheat unigene build 38 with the NGS data used in
this study. The NCBI sequences were sampled as pseudoreads of
75 bases, combined with the NGS data and de-novo assembled
using ABYSS (Simpson et al., 2009) on the Bristol Bluecrystal
HPC cluster. NGS from the five UK varieties were mapped to our
custom reference using ELAND (Illumina Inc.) with a seed length
of 32 bases and the resulting sorted export files used for down-
stream analysis. Uniquely mapped reads were analysed using a
series of custom PERL scripts designed to identify only differences
between varieties as opposed to those between each variety,
and the reference sequence. In this way, homoeologous SNPs
(which are not useful markers) were excluded from our SNP dis-
covery pipeline. SNPs were called where at least two alternative
bases were found at a reference position, each represented by 2
or more independent reads or 5% of all reads examined (which-
ever was the greater). Only bases at the centre of a three base
window of PHRED quality ‡20 were included in the analysis.
Sequences were discarded if they showed more than 5%
sequence variation from the reference over their length or if they
mapped equally well to more than one locus as in either case
they were deemed to have uncertain mapping. Finally, where
multiple reads started at the same position in the reference, all
but one were ignored to guard against clonal reads being
sampled more than once. The NGS data will be made available
at: http://www.cerealsdb.uk.net/NGSdata/AllenSupplement.
SNP validation
Genomic DNA was prepared from leaf tissue using a phenol–
chloroform extraction method (Sambrook et al., 1989). Geno-
mic DNA samples were treated with RNase-A (New England
Biolabs UK Ltd. Hitchin, UK) according to the manufacturer’s
instructions and purified using the QiaQuick PCR purification kit
(QIAGEN Ltd.).
For each putative varietal SNP, two allele-specific forward
primers and one common reverse primer (Table S6) were
designed (KBioscience, Hoddesdon, UK). Genotyping reactions
were performed in a Gene Pro Thermal cycler (Bioer Technol-
ogy, Hangzhou, China) in a final volume of 5 lL containing 1X
KASP Reaction Mix (KBioscience), 0.07 lL Assay mix (containing
12 lM each allele-specific forward primer and 30 lM reverse pri-
ª 2011 The Authors
Plant Biotechnology Journal ª 2011 Society for Experimental Biology, Association of Applied Biologists and Blackwell Publishing Ltd, Plant Biotechnology Journal, 1–14
Alexandra M. Allen et al.12

mer) and 10–20 ng genomic DNA. The following cycling condi-
tions were used: 15 min at 94 �C; 10 touchdown cycles of 20 s
at 94 �C, 60s at 65–57 �C (dropping 0.8 �C per cycle); and
26–35 cycles of 20 s at 94 �C, 60 s at 57 �C. Fluorescence
detection of the reactions was performed using an Omega
Fluorostar scanner (BMG LABTECH GmbH, Offenburg, Germany),
and the data were analysed using the KlusterCaller 1.1 software
(KBioscience). The polymorphic information content (PIC) was
calculated for each marker according to Botstein et al. (1980),
using Excel Microsatellite Toolkit add-in software (Park, 2001).
Hierarchical cluster analysis was performed in PASW (SPSS Inc.
IBM Corporation, Somers, NY).
Genetic map construction
The software program MapDisto v. 1.7 (Lorieux, 2007) was
used to place the SNP markers in the previously established
genetic map for Avalon · Cadenza (http://www.wgin.org.uk/
resources/MappingPopulation/TAmapping.php). A chi-square
test was performed on all loci to test for segregation distortion
from the expected 1 : 1 ratio of each allele in a DH population,
and any loci showing significant distortion were removed from
the data set before constructing the linkage groups. Loci were
assembled into linkage groups using likelihood odds (LOD)
ratios with a LOD threshold of 6.0 and a maximum recombina-
tion frequency threshold of 0.40. The linkage groups were
ordered using the likelihoods of different locus-order possibili-
ties and the iterative error removal function in MapDisto and
drawn in MapChart (Voorrips, 2002). The Kosambi mapping
function (Kosambi, 1944) was used to calculate map distances
(cM) from recombination frequency.
Comparative mapping of SNPs to ESTs and theBrachypodium distachyon and Sorghum bicolorgenomes
The consensus sequence surrounding mapped SNPs were
matched to published, mapped wheat EST sequences (http://
wheat.pw.usda.gov/cgi-bin/westsql/map_locus.cgi) and to the
B. distachyon genome sequence (http://www.brachypodium.
org/) using NCBI BLASTN (Altschul et al., 1990) with an e-value
cut-off of 1e)10. Only the top BLASTN hit was used for compar-
ative mapping.
Selected wheat SNP flanking sequences were also BLASTN
searched to the S. bicolor genome at http://www.phytozome.
net using Phytozome version 6.
Acknowledgements
We are grateful to the Biotechnology and Biological Sciences
Research Council, UK, for providing the funding for this work
(awards BB ⁄ F007523 ⁄ 1, BB ⁄ F010370 ⁄ 1, BB ⁄ G012865 ⁄ 1,
BB ⁄ I003207 ⁄ 1). We thank Dr Peter Jack from RAGT, Dr Ian Mac-
Kay from NIAB and Dr Simon Griffiths from the JIC for numerous
valuable discussions throughout this project. The population of
doubled haploid individuals, derived from F1 progeny of a cross
between cvs Avalon and Cadenza, was developed by Clare Eller-
brook, Liz Sayers and the late Tony Worland (John Innes Centre),
as part of a Defra funded project led by ADAS. The parents were
originally chosen (to contrast for canopy architecture traits) by
Steve Parker (CSL), Tony Worland and Darren Lovell (Rothamsted
Research). We are grateful to the Wheat Genetic Improvement
Network for making the mapping data relating to the cvs Avalon
x Cadenza population public. For further details of the Avalon x
Cadenza mapping population, please refer to the Wheat Genetic
Improvement Network web site at: http://www.wgin.org.uk/
resources/MappingPopulation/TAmapping.php.
References
Akbari, M., Wenzl, P., Caig, V., Carling, J., Xia, L., Yang, S., Uszynski, G.,
Mohler, V., Lehmensiek, A., Kuchel., H., Hayden, M.J., Howes, N., Sharp,
P., Vaughan, P., Rathmell, B., Huttner, E. and Kilian, A. (2006) Diversity
arrays technology (DArT) for high-throughput profiling of the hexaploid
wheat genome. Theor. Appl. Genet. 113, 1409–1420.
Akhunov, E., Nicolet, C. and Dvorak, J. (2009) Single nucleotide
polymorphism genotyping in polyploidy wheat with the Illumina
GoldenGate assay. Theor. Appl. Genet. 119, 507–517.
Akhunov, E.D., Akhunova, A.R., Anderson, O.D., Anderson, J.A., Blake, N.,
Clegg, M.T., Coleman-Derr, D., Conley, E.J., Crossman, C.C., Deal, K.R.,
Dubcovsky, J., Gill, B.S., Gu, Y.Q., Hadam, J., Heo, H., Huo, N., Lazo, G.R.,
Luo, M.C., Ma, Y.Q., Matthews, D.E., McGuire, P.E., Morrell, P.L., Qualset,
C.O., Renfro, J., Tabanao, D., Talbert, L.E., Tian, C., Toleno, D.M.,
Warburton, M.L., You, F.M., Zhang, W. and Dvorak, J. (2010) Nucleotide
diversity maps reveal variation in diversity among wheat genomes and
chromosomes. BMC Genomics, 11, 702.
Alston, J.M., Babcock, B.A. and Pardey, P.G. eds. (2010) The Shifting Patterns
of Agricultural Production and Productivity Worldwide (2010) CARD-
MATRIC on-line volume, Ames: Iowa State University.
Altschul, S.F., Gish, W., Miller, W., Myers, E.W. and Lipman, D.J. (1990) Basic
local alignment search tool. J. Mol. Biol. 215, 403–410.
Barker, G.L.A. and Edwards, K.J. (2009) A genome-wide analysis of single
nucleotide polymorphism diversity in the world’s major cereal crops. Plant
Biotechnol. J. 7, 318–325.
Berard, A., Le Paslier, M.C., Dardevet, M., Exbrayat-Vinson, F., Bonnin, I.,
Cenci, A., Haudry, A., Brunel, D. and Ravel, C. (2009) High-throughput
single nucleotide polymorphism genotyping in wheat (Triticum spp.). Plant
Biotechnol. J. 7, 364–374.
Bernardo, A.N., Bradbury, P.J., Ma, H., Hu, S., Bowden, R.L., Buckler, E.S.
and Bia, G. (2009) Discovery and mapping of single feature polymorphisms
in wheat using Affymetrix arrays. BMC Genomics, 10, 251.
Botstein, D., White, R.L., Skolnick, M. and Davis, R.W. (1980) Construction of
a genetic linkage map in man using restriction fragment length
polymorphisms. Am. J. Hum. Genet. 32, 314–331.
Bundock, P.C., Eliott, F.G., Ablett, G., Benson, A.D., Casu, R.E., Aitken, K.S.
and Henry, R.J. (2009) Targeted single nucleotide polymorphism (SNP)
discovery in a highly polyploid plant species using 454 sequencing. Plant
Biotechnol. J. 7, 347–354.
Caldwell, K.S., Dvorak, J., Lagudah, E.S., Akhunov, E., Luo, M.C., Wolters, P.
and Powell, W. (2004) Sequence polymorphism in polyploid wheat and
their D-genome diploid ancestor. Genetics, 167, 941–947.
Chao, S., Zhang, W., Akhunov, E., Sherman, J., Ma, Y., Luo, M.C. and
Dubcovsky, J. (2009) Analysis of gene-derived SNP marker polymorphism in
US wheat (Triticum aestivum L.) cultivars. Mol. Breed. 23, 23–33.
Chao, S., Dubcovsky, J., Dvorak, J., Luo, M.C., Baenziger, S.P., Matnyazov,
R., Clark, D.R., Talbert, L.E., Anderson, J.A., Dreisigacker, S., Glover, K.,
Chen, J., Campbell, K., Bruckner, P.L., Rudd, J.C., Haley, S., Carver, B.F.,
Perry, S., Sorrells, M.E. and Akhunov, E.D. (2010) Population- and
genome-specific patterns of linkage disequilibrium and SNP variation in
spring and winter wheat (Triticum aestivum L.). BMC Genomics, 11, 727.
Devos, K.M., Sorrells, M.E., Anderson, J.A., Miller, T.E., Reader, S.M.,
Lukaszewski, A.J., Dubcovsky, J., Sharp, P.J., Faris, J. and Gale, M.D.
(1999) Chromosome aberrations in wheat nullisomic-tetrasomic and
ditelosomic lines. Cereal Res. Commun. 27, 231–239.
Dubcovsky, J. and Dvorak, J. (2007) Genome plasticity: a key factor in the
success of polyploid wheat under domestication. Science, 316, 1862–1866.
Edwards, K.J., Reid, A.L., Coghill, J.A., Berry, S.T. and Barker, G.L.A. (2009)
Multiplex single nucleotide polymorphism (SNP)-based genotyping in
allohexaploid wheat using padlock probes. Plant Biotechnol. J. 7, 375–390.
ª 2011 The Authors
Plant Biotechnology Journal ª 2011 Society for Experimental Biology, Association of Applied Biologists and Blackwell Publishing Ltd, Plant Biotechnology Journal, 1–14
Wheat SNP markers 13

Endo, T.R. and Gill, B.S. (1996) The deletion stocks of common wheat.
J. Hered. 87, 295–307.
Foresight (2011) The Future of Food and Farming, Final Project Report.
London: The Government Office for Science.
Gupta, P.K., Mir, R.R., Mohan, A. and Kumar, J. (2008) Wheat genomics:
present status and future prospects. Int. J. Plant Genomics, 2008, Article ID
896451
Haudry, A., Cenci, A., Ravel, C., Bataillon, T., Brunel, D., Poncet, C., Hochu,
I., Poirier, S., Santoni, S., Glemin, S. and David, J. (2007) Grinding up
wheat: a massive loss of nucleotide diversity since domestication. Mol. Biol.
Evol. 24, 1506–1517.
Imelfort, M., Duran, C., Batley, J. and Edwards, D. (2009) Discovering genetic
polymorphisms in next-generation sequencing data. Plant Biotechnol. J. 7,
312–317.
International Brachypodium Initiative. (2010) Genome sequencing and analysis
of the model grass Brachypodium distachyon. Nature, 463, 763–767.
Kosambi, D.D. (1944) The estimation of map distances from recombination
values. Ann. Eugen. 12, 172–175.
Lorieux, M. (2007) MapDisto: a free user-friendly program for computing
genetic maps. In: Plant and Animal Genome XV Conference, San Diego,
CA
Mochida, K. and Shinozaki, K. (2010) Genomics and bioinformatics resources
for crop improvement. Plant Cell Physiol. 51, 497–523.
Orru, L., Catillo, G., Napolitano, F., De Matteis, G., Scata, M.C., Signorelli, F.
and Moioli, B. (2009) Characterization of a SNPs panel for meat traceability
in six cattle breeds. Food Control, 20, 856–860.
Park, S.D.E. (2001) Trypanotolerance in West African Cattle and the
Population Genetic Effects of Selection [Ph.D. thesis] University of Dublin.
Perkel, J. (2008) SNP genotyping: Six technologies that keyed a revolution.
Nat. Methods, 5, 447–453.
Petkov, P.M., Ding, Y., Cassell, M.A., Zhang, W., Wagner, G., Sargent, E.E.,
Asquith, S., Crew, V., Johnson, K.A., Robinson, P., Scott, V.E. and Miles,
M.E. (2004) An efficient SNP system for mouse genome scanning and
elucidating strain relationships. Genome Res. 14, 1806–1811.
Qi, L., Echalier, B., Friebe, B. and Gill, B.S. (2003) Molecular characterization
of a set of wheat deletion stocks for use in chromosome bin mapping of
ESTs. Funct. Integr. Genomics. 3, 39–55.
Qi, L.L., Echalier, B., Chao, S., Lazo, G.R., Butler, G.E., Anderson, O.D.,
Akhunov, E.D., Dvorak, J., Linkiewicz, A.M., Ratnasiri, A., Dubcovsky, J.,
Bermudez-Kandianis, C.E., Greene, R.A., Kantety, R., La Rota, C.M.,
Munkvold, J.D., Sorrells, S.F., Sorrells, M.E., Dilbirligi, M., Sidhu, D.,
Erayman, M., Randhawa, H.S., Sandhu, D., Bondareva, S.N., Gill, K.S.,
Mahmoud, A.A., Ma, X.F., Miftahudin, Gustafson, J.P., Conley, E.J.,
Nduati, V., Gonzalez-Hernandez, J.L., Anderson, J.A., Peng, J.H., Lapitan,
N.L.V., Hossain, K.G., Kalavacharla, V., Kianian, S.F., Pathan, M.S., Zhang,
D.S., Nguyen, H.T., Choi, D.W., Fenton, R.D., Close, T.J., McGuire, P.E.,
Qualset, C.O. and Gill, B.S. (2004) A chromosome bin map of 16,000
expressed sequence tag loci and distribution of genes among the three
genomes of polyploid wheat. Genetics, 168, 701–712.
Quarrie, S.A., Steed, A., Calestani, C., Semikhodskii, A., Lebreton, C.,
Chinoy, C., Steele, N., Pljevljakusic, D., Waterman, E., Weyen, J.,
Schondelmaier, J., Habash, D.Z., Farmer, P., Saker, L., Clarkson, D.T.,
Abugalieva, A., Yessimbekova, M., Turuspekov, Y., Abugalieva, S.,
Tuberosa, R., Sanguineti, M.C., Hollington, P.A., Aragues, R., Royo, A. and
Dodig, D. (2005) A high density genetic map of hexaploid wheat (Triticum
aestivum L.) from the cross Chinese Spring x SQ1 and its use to compare
QTLs for grain yield across a range of environments. Theor. Appl. Genet.
110, 865–880.
Ravel, C., Praud, S., Canaguier, A., Dufour, P., Giancola, S., Balfourier, F.,
Chalhoub, B., Brunel, D., Linossier, L., Dardevet, M., Beckert, M., Rousset,
M., Murigneux, A. and Charmet, G. (2007) DNA sequence polymorphisms
and their application to bread wheat quality. Euphytica, 159, 331–336.
Reaping the benefits (2009) Science and the sustainable intensification of
global agriculture Royal Society Report. London.
Reynolds, M., Bonnett, D., Chapman, S.C., Furbank, R.T., Manes, Y., Mather,
D.E. and Parry, M.A.J. (2011) Raising yield potential of wheat I. Overview
of a consortium approach and breeding strategies. J. Exp. Bot. 62, 439–
452.
Roder, M.S., Korzun, V., Wandehake, K., Planschke, J., Tixier, M.H., Leroy, P.
and Ganal, M.W. (1998) A microsatellite map of wheat. Genetics, 149,
2007–2023.
Sambrook, J., Fritsch, E.F. and Maniatis, T. (1989) Molecular Cloning:
A Laboratory Manual, 2nd edn. Cold Spring Harbor: Cold Spring Harbor
Laboratory Press.
Sears, E.R. (1954) The aneuploids of common wheat. Research Bull. 572,
Missouri Ag. Exp. Sta. 57 p.
Shewry, P.R. (2009) Wheat. J. Exp. Bot. 60, 1537–1553.
Simpson, J.T., Wong, K., Jackman, S.D., Schein, J.E., Jones, S.J. and Birol, I.
(2009) ABySS: a parallel assembler for short read sequence data. Genome
Res. 19, 1117–1123.
Somers, D.J., Isaac, P. and Edwards, K.J. (2004) A high-density microsatellite
consensus map for bread wheat (Triticum aestivum L.). Theor. Appl. Genet.
109, 1105–1114.
Valkoun, J.J. (2001) Wheat pre-breeding using wild progenitors. Euphytica,
119, 17–23.
Voorrips, R.E. (2002) MapChart: software for the graphical presentation of
linkage maps and QTLs. J. Heredity, 93, 77–78.
Xia, J.H., Liu, F., Zhu, Z.Y., Fu, J.J., Feng, J.B., Li, J.L. and Yue, G.H. (2010)
A consensus linkage map of the grass carp (Ctenopharyngodon idella)
based on microsatellites and SNPs. BMC Genomics, 11, 135.
Supporting information
Additional Supporting information may be found in the online
version of this article:
Table S1 EST-derived SNPs.
Table S2 NGS-derived SNPs.
Table S3 Genotyping calls.
Table S4 Mapping data.
Table S5 BLAST results.
Table S6 KASPar assays and primer sequences.
Please note: Wiley-Blackwell are not responsible for the content
or functionality of any supporting materials supplied by the
authors. Any queries (other than missing material) should be
directed to the corresponding author for the article.
ª 2011 The Authors
Plant Biotechnology Journal ª 2011 Society for Experimental Biology, Association of Applied Biologists and Blackwell Publishing Ltd, Plant Biotechnology Journal, 1–14
Alexandra M. Allen et al.14
Copyright © 2022 FDOKUMEN