Advanced backcross QTL mapping of resistance to Fusarium head blight and plant morphological traits...
14
ORIGINAL PAPER Advanced backcross QTL mapping of resistance to Fusarium head blight and plant morphological traits in a Triticum macha 3 T. aestivum population Maria Buerstmayr • Marc Lemmens • Barbara Steiner • Hermann Buerstmayr Received: 13 January 2011 / Accepted: 23 March 2011 / Published online: 11 April 2011 Ó The Author(s) 2011. This article is published with open access at Springerlink.com Abstract While many reports on genetic analysis of Fusarium head blight (FHB) resistance in bread wheat have been published during the past decade, only limited information is available on FHB resistance derived from wheat relatives. In this contribution, we report on the genetic analysis of FHB resistance derived from Triticum macha (Georgian spelt wheat). As the origin of T. macha is in the Caucasian region, it is supposed that its FHB resis- tance differs from other well-investigated resistance sour- ces. To introduce valuable alleles from the landrace T. macha into a modern genetic background, we adopted an advanced backcross QTL mapping scheme. A backcross- derived recombinant-inbred line population of 321 BC 2 F 3 lines was developed from a cross of T. macha with the Austrian winter wheat cultivar Furore. The population was evaluated for Fusarium resistance in seven field experi- ments during four seasons using artificial inoculations. A total of 300 lines of the population were genetically fingerprinted using SSR and AFLP markers. The resulting linkage map covered 33 linkage groups with 560 markers. Five novel FHB-resistance QTL, all descending from T. macha, were found on four chromosomes (2A, 2B, 5A, 5B). Several QTL for morphological and developmental traits were mapped in the same population, which partly overlapped with FHB-resistance QTL. Only the 2BL FHB- resistance QTL co-located with a plant height QTL. The largest-effect FHB-resistance QTL in this population mapped at the spelt-type locus on chromosome 5A and was associated with the wild-type allele q, but it is unclear whether q has a pleiotropic effect on FHB resistance or is closely linked to a nearby resistance QTL. Introduction Resistance to Fusarium head blight (FHB) is one of the most important traits for modern wheat varieties in many wheat growing areas worldwide. Resistance to FHB is a quantitative trait, governed by polygenes, and quantitative trait loci have been detected on all wheat chromosomes (Buerstmayr et al. 2009; Liu et al. 2009; Lo ¨ffler et al. 2009). Apart from active physiological resistance plant developmental and morphological characters, especially plant height, flowering time, spike morphology and envi- ronmental conditions modulate disease development. The complex nature of the resistance and the important role of genotype-by-environment interactions render breeding for improved FHB resistance difficult. Large genetic variation for FHB resistance is available in the wheat gene pool, but often the regionally best adapted and most highly produc- tive cultivars are susceptible to FHB (Buerstmayr et al. 2009). Considering the resistance sources used for genetic analysis thus far, two main approaches can be distin- guished. One is to evaluate and map populations based on agronomically adapted cultivars, with moderate to good FHB resistance. The other is to employ and genetically characterize more or less exotic resistance sources, such as introduced cultivars, landraces or alien species. Unadapted or exotic genotypes are usually agronomically inferior to modern varieties. In populations from bi-parental crosses between an adapted parent and an exotic parent, the desired Communicated by C. Feuillet. M. Buerstmayr M. Lemmens B. Steiner H. Buerstmayr (&) Department for Agrobiotechnology Tulln, BOKU, University of Natural Resources and Life Sciences Vienna, Konrad Lorenz Str. 20, 3430 Tulln, Austria e-mail: [email protected] 123 Theor Appl Genet (2011) 123:293–306 DOI 10.1007/s00122-011-1584-x
-
Upload
independent -
Category
Documents
-
view
0 -
download
0
Transcript of Advanced backcross QTL mapping of resistance to Fusarium head blight and plant morphological traits...
ORIGINAL PAPER
Advanced backcross QTL mapping of resistance to Fusariumhead blight and plant morphological traits in a Triticummacha 3 T. aestivum population
Maria Buerstmayr • Marc Lemmens •
Barbara Steiner • Hermann Buerstmayr
Received: 13 January 2011 / Accepted: 23 March 2011 / Published online: 11 April 2011
� The Author(s) 2011. This article is published with open access at Springerlink.com
Abstract While many reports on genetic analysis of
Fusarium head blight (FHB) resistance in bread wheat have
been published during the past decade, only limited
information is available on FHB resistance derived from
wheat relatives. In this contribution, we report on the
genetic analysis of FHB resistance derived from Triticum
macha (Georgian spelt wheat). As the origin of T. macha is
in the Caucasian region, it is supposed that its FHB resis-
tance differs from other well-investigated resistance sour-
ces. To introduce valuable alleles from the landrace
T. macha into a modern genetic background, we adopted an
advanced backcross QTL mapping scheme. A backcross-
derived recombinant-inbred line population of 321 BC2F3
lines was developed from a cross of T. macha with the
Austrian winter wheat cultivar Furore. The population was
evaluated for Fusarium resistance in seven field experi-
ments during four seasons using artificial inoculations.
A total of 300 lines of the population were genetically
fingerprinted using SSR and AFLP markers. The resulting
linkage map covered 33 linkage groups with 560 markers.
Five novel FHB-resistance QTL, all descending from
T. macha, were found on four chromosomes (2A, 2B, 5A,
5B). Several QTL for morphological and developmental
traits were mapped in the same population, which partly
overlapped with FHB-resistance QTL. Only the 2BL FHB-
resistance QTL co-located with a plant height QTL. The
largest-effect FHB-resistance QTL in this population
mapped at the spelt-type locus on chromosome 5A and was
associated with the wild-type allele q, but it is unclear
whether q has a pleiotropic effect on FHB resistance or is
closely linked to a nearby resistance QTL.
Introduction
Resistance to Fusarium head blight (FHB) is one of the
most important traits for modern wheat varieties in many
wheat growing areas worldwide. Resistance to FHB is a
quantitative trait, governed by polygenes, and quantitative
trait loci have been detected on all wheat chromosomes
(Buerstmayr et al. 2009; Liu et al. 2009; Loffler et al.
2009). Apart from active physiological resistance plant
developmental and morphological characters, especially
plant height, flowering time, spike morphology and envi-
ronmental conditions modulate disease development. The
complex nature of the resistance and the important role of
genotype-by-environment interactions render breeding for
improved FHB resistance difficult. Large genetic variation
for FHB resistance is available in the wheat gene pool, but
often the regionally best adapted and most highly produc-
tive cultivars are susceptible to FHB (Buerstmayr et al.
2009).
Considering the resistance sources used for genetic
analysis thus far, two main approaches can be distin-
guished. One is to evaluate and map populations based on
agronomically adapted cultivars, with moderate to good
FHB resistance. The other is to employ and genetically
characterize more or less exotic resistance sources, such as
introduced cultivars, landraces or alien species. Unadapted
or exotic genotypes are usually agronomically inferior to
modern varieties. In populations from bi-parental crosses
between an adapted parent and an exotic parent, the desired
Communicated by C. Feuillet.
M. Buerstmayr � M. Lemmens � B. Steiner � H. Buerstmayr (&)
Department for Agrobiotechnology Tulln, BOKU,
University of Natural Resources and Life Sciences Vienna,
Konrad Lorenz Str. 20, 3430 Tulln, Austria
e-mail: [email protected]
123
Theor Appl Genet (2011) 123:293–306
DOI 10.1007/s00122-011-1584-x

resistance traits may be confounded with ‘wild’ plant traits
such as excessive height or spike morphology. To allow
target traits from exotic parents to be evaluated in a more
adapted genetic background, the advanced backcross
quantitative trait locus (AB-QTL) scheme was proposed by
Tanksley and Nelson (1996) for combining QTL detection
with variety development. Populations are generated by
repeated backcrossing to an adapted elite parent. In such
backcross-derived lines, donor chromosome fragments are
distributed throughout the genome in a standardized
genetic background close to the elite parent. Repeated
backcrossing increases recombination events between the
remaining donor genome and elite genome, which leads to
smaller donor fragments and enhances chances of sepa-
rating linked genes. Molecular marker techniques and QTL
mapping routines adjusted to this specific population
design will reveal favourable alleles. Several AB-QTL
analyses of different wheat populations identified valuable
QTL alleles derived from exotic donor lines (Huang et al.
2004; Kunert et al. 2007; Leonova et al. 2007; Liu et al.
2006; Narasimhamoorthy et al. 2006; Naz et al. 2008).
In the present work, an advanced backcross population
derived from a cross between a well-adapted Austrian
bread wheat cultivar and Triticum macha as donor was
screened for FHB-resistance QTL. T. macha, a hulled
hexaploid wheat, is endemic to the Caucasus area where it
was discovered in 1929. In Georgia, a popular local
variety ‘Makha’ that had stable yields in different climatic
conditions and high resistance to various diseases was
grown until the 1930s (Barisashvili and Gorgidze 1979).
Previous work identified a line of T. macha with
remarkably high level of quantitative FHB resistance
almost comparable to that of Sumai-3 (Buerstmayr et al.
1996; Grausgruber et al. 1998; Mentewab et al. 2000).
This resistant line was used as donor parent. Investiga-
tions of Cao et al. (2000) confirm the phylogenetic dif-
ference between T. macha and common wheat as well as
between T. macha and T. spelta. Because of the distinct
origin of T. macha, we considered it likely that T. macha
harbours novel resistance QTL.
Plant morphology, especially spike-related traits, differs
considerably between the parents of the investigated pop-
ulation. Gross morphology of wheat spike is substantially
influenced by the three major genes: Q (speltoid ear, Faris
et al. 2005; Mac Key 1954), C (compact ear, Rao 1972)
and S1 (sphaerococcum grains, Rao 1977; Salina et al.
2000). T. aestivum wheats carry the alleles QQ cc S1S1,
and T. macha possesses qq CC S1S1 (Morris and Sears
1967; Swaminathan and Rao 1961). A population from
T. aestivum 9 T. macha is therefore expected to segregate
at Q/q (square-headed and free threshing/speltoid and non-
free threshing, chromosome 5A) and C/c (compact spike/
non-compact spike, chromosome 2D), but should be fixed
at S1 (non-sphaerococcum grains, chromosome 3D). Plant
height (Buerstmayr et al. 2000; Gervais et al. 2003; Hilton
et al. 1999; Mesterhazy 1995; Steiner et al. 2004), com-
pactness of the spikes (Steiner et al. 2004; Zhu et al. 1999),
flowering time (Gervais et al. 2003; Holzapfel et al. 2008;
Paillard et al. 2004; Schmolke et al. 2005; Steiner et al.
2004) and flower opening (Gilsinger et al. 2005) have been
reported as associated with FHB infection and develop-
ment. Therefore, in this study, special attention was given
to morphological traits and their association with FHB
resistance.
A previous study with T. macha showed that its FHB
resistance is located on several wheat chromosomes
(Grausgruber et al. 1998; Mentewab et al. 2000). To date,
only one T. macha-derived FHB-resistance QTL at chro-
mosome 4A was mapped, in a single chromosome recom-
binant population (Steed et al. 2005).
We report here about an AB-QTL analysis where a BC2-
derived population was used for simultaneous map calcu-
lation and genome-wide QTL detection. The aim of this
study was to genetically characterize novel QTL for FHB
resistance derived from T. macha and for morphological
traits and to investigate their associations.
Materials and methods
Plant material and population development
A single homozygous line of T. macha was crossed to
T. aestivum cultivar Furore, and F1 plants were backcrossed
as maternal plants to Furore. A total of 321 independent
BC1F1 plants were backcrossed as female to Furore. From
each of the 321 individually obtained BC2F1 plants, one
BC2F3 plant was derived by single-seed descent. Bulked
seed from each BC2F3 plant was propagated in 0.5 m2
BC2F3:4 plots. The resulting seed was used for multi-
environment resistance evaluations as BC2F3:5 lines. The
recurrent parent Furore is an Austrian winter wheat cultivar
with pedigree POKAL//HP35719/EXTREM/3/CAROLUS/
P9094. Furore is moderately susceptible to Fusarium head
blight. The donor parent T. macha is a Transcaucasian
landrace. It is a hexaploid hulled wheat with brittle rachis,
has a dense but non-compact spike phenotype and pubes-
cent and glaucous glumes. The T. macha line used in this
project was originally obtained from JIC Norwich, UK (JIC
accession 1240001), which was the same accession used
for the generation of the T. macha—Hobbit-‘sib’ single
chromosome substitution lines described by Law and
Worland (1996) and analysed for FHB resistance by
Grausgruber et al. (1998) and Mentewab et al. (2000). It
showed excellent resistance to FHB in previous investi-
gations (Buerstmayr et al. 1996).
294 Theor Appl Genet (2011) 123:293–306
123

Fusarium head blight resistance evaluation
Field design
The 321 BC2F3:5 lines, their parental lines and several
control lines were evaluated in seven field experiments
from 2005 to 2008 at the IFA-Tulln experiment farm,
30 km west of Vienna (16�040E, 48�190N, 177 m above sea
level).
Each experiment was defined by a Fusarium isolate:
F. culmorum (FC) or F. graminearum (FG) and a specific
year encoded by the unit and the decade. For example, the
experiment FC06 was the F. culmorum-inoculated experi-
ment conducted in 2006. Each experiment had a random-
ized complete block design with two replications. The plot
size was a double row of 0.8 m length with 17 cm row
spacing. Sowing time was late autumn (October to
November) in all years. The two blocks in each experiment
were sown 2–3 weeks apart depending on the specific
weather conditions, which delayed anthesis by 1–3 days
for the later-sown blocks. Seed treatment, sowing density
and crop management were essentially as described by
Buerstmayr et al. (2002).
Disease inoculation
For six experiments, spray inoculation and for one exper-
iment (FG08) grain spawn inoculation methods were
applied. For spray inoculation, two different Fusarium
isolates were used, either macroconidia of the F. culmorum
single-spore isolate ‘IFA-106’ prepared as described by
Buerstmayr et al. (2000) or the F. graminearum single-
spore isolate ‘IFA-65’ prepared as described by Buerstmayr
et al. (2002). We used a highly aggressive F. culmorum
isolate and a moderately aggressive F. graminearum iso-
late. Conidia stock solutions in distilled water (5009) were
aliquoted into plastic vials and stored at -30�C until use.
At each inoculation day, the needed number of inoculum
aliquots were thawed and diluted in deionized water to the
desired concentration of 2.5 9 104 for the F. culmorum
isolate and to 5 9 104 for F. graminearum isolate. Each
plot was individually inoculated twice, first when 50% of
the plants had reached anthesis and again 2 days later.
Using a battery-driven backpack sprayer, inoculum was
sprayed onto the heads until runoff. Inoculations were
carried out in the evenings, usually from 4 to 6 p.m. An
automated mist-irrigation system, triggered by leaf wetness
measurement, maintained humidity and kept the plants wet
for 20 h after inoculation. For grain spawn inoculation,
15 g m-2 Gibberella zeae-infected scabby maize grains
were spread throughout the experiment 5 weeks before
anthesis. The infested grains were taken from a maize field
experiment, which was inoculated with a mix of three
F. graminearum (teleomorph: Gibberella zeae) isolates in
the previous season. Also, this trial was mist irrigated using
the same time schedule as described above during the
flowering period to provide optimal infection conditions.
Assessment of disease severity
FHB severity was recorded on days 10, 14, 18, 22 and 26
after the first inoculation or after 50% anthesis for the spray
and the grain spawn-inoculated experiments, respectively.
Severity was estimated as the percentage of infected
spikelets per plot by visually averaging whole plots.
Evaluation of other traits
All lines were evaluated for date of anthesis, plant height,
spike length, number of spikelets per spike, spike density,
threshability, spike glaucousness, hairiness of glumes and
severity of leaf chlorosis. As an index of earliness, the date
of 50% anthesis was recorded for each plot and converted
into the number of days after May 1. Plant height was
measured as the distance in centimetre from the soil surface
to the top of the ears excluding awns in the experiments
FG05, FG06, FG07, FC07 and FG08. Spike length in
centimetre and number of spikelets per spike were deter-
mined on six randomly chosen ears per plot from a non-
inoculated field experiment in 2009. The average number
of spikelets per centimetre was calculated and used as
measurement for spike density. Plots from this non-inoc-
ulated trial were harvested and threshed with a combine
harvester (Nursery Master, Wintersteiger, Ried, Austria).
Percent threshability was calculated as the weight propor-
tion of free threshed seeds in all seeds harvested. In the
experiments, FC07, FG07, FC08 and FG08 verdant spikes
were assessed visually for glaucousness based on a 0 (non-
glaucous) to 9 (intensely glaucous) scale. Similarly, the
severity of physiological leaf chlorosis was scored on a 0
(non-chlorotic) to 9 (severely chlorotic) scale in experi-
ments FG05, FG06, FC06, FG07, FC07 and FG08 at the
heading stage. In addition, every line was classified for
possessing hairy glumes, non-hairy glumes or heterogene-
ity for this trait. This trait was treated as a morphological
marker.
Molecular marker analysis
Of 321 lines, 300 were randomly chosen for marker anal-
ysis. Genomic DNA was extracted from young leaves
based on the CTAB method (Saghai Maroof et al. 1984)
from ten pooled plants of each BC2F3:4 line and the
parental lines. For molecular genotyping, microsatellite
(simple sequence repeat, SSR) and amplified fragment
length polymorphism (AFLP) markers were applied.
Theor Appl Genet (2011) 123:293–306 295
123
SSR marker analysis
SSR marker analysis was done as described by Steiner
et al. (2004) by fluorescent detection of PCR fragments on
an LI-COR 4200 dual-dye DNA analyser (LI-COR Bio-
sciences, Lincoln, Nebraska USA). The parents were
checked for polymorphism with 282 SSR primer pairs, of
which 128 polymorphic pairs were chosen for genotyping
300 lines of the mapping population, composed of 89
GWM markers (Roeder et al. 1998), 27 BARC markers
(Song et al. 2005), 9 WMC markers (Somers et al. 2004),
1 GDM marker (Pestsova et al. 2000) and 2 markers
within the Q locus. For these, we compared the reported
genome sequence of T. aestivum, GenBank no AY702956
(Q allele), and T. macha, GenBank no AY714342
(q allele), and designed two primer pairs flanking the
variable microsatellites CCT repeat within the intron 9
(Simons et al. 2006). The first pair has forward primer
50GCA-GTA-GCA-CCT-CAG-CAG-AGT and reverse
primer 50TTC-AGT-AAG-CTG-GTG-GAG-CA; the second
pair has forward primer 50AG-CTC-ATC-TTC-GTC-CCA-
GTG and reverse primer 50TTC-AGT-AAG-CTG-GT
G-GAG-CA.
AFLP marker analysis
For the AFLP marker analysis (Vos et al. 1995), restriction
digestion using MseI and Sse8387I restriction enzymes,
adapter ligation, PCR amplification and gel electrophoresis
were carried out as described by Hartl et al. (1999) and
Buerstmayr et al. (2002). Altogether, 64 AFLP primer
combinations with two or three selective nucleotides on the
30 end of either primer were performed for selective
amplification. The 50 end of the selective Sse8837I-primer
was labelled with IRD700 or IRD800 when detected on an
LI-COR 4200 dual-dye DNA analyser (LI-COR Biosci-
ences, Lincoln, Nebraska USA), or was labelled with Cy5,
Cy3 or FAM when scanned on a Typhoon-TRIO fluores-
cence scanner (GE Healthcare). AFLP markers were
named according to the standard list for AFLP primer
nomenclature (http://wheat.pw.usda.gov/ggpages/keygene
AFLPs.html) followed by a number allocated to each
polymorphic AFLP locus in this population within each
primer combination, from smaller to larger fragments.
Statistical analysis
Field data
As a measure of FHB severity, the field scores were used to
calculate the area under disease progress curve (AUDPC)
as described by Buerstmayr et al. (2000). Analysis of
variance (ANOVA) was calculated using the general linear
model (GLM) procedure to estimate the effects of repli-
cations within experiments, experiments, genotypes and
genotype-by-experiment interactions, with all effects trea-
ted as fixed. For the estimation of variance components, all
effects were considered random. Broad-sense heritability
was estimated from variance components with the equation
H2 = rG2 /(rG
2 ? rG9E2 /e ? re
2/en), where rG2 = genotypic
variance, rG9E2 = genotype-by-experiment interaction
variance, re2 = error variance, e = number of experiments,
and n = number of replications (Nyquist 1991). Pearson
correlation coefficients were calculated for each experi-
ment and trait combination. Statistical analyses were cal-
culated in SAS/STAT version 9.2 (SAS Institute Inc 2008).
Marker data
Maps were calculated using CarthaGene version 0.999-
LKH for Linux (de Givry et al. 2005). We used a modified
version of CarthaGene (provided by Dr. Clare Nelson,
Kansas State University, USA) that allows map calculation
in advanced backcross designs. For grouping a maximum
distance of 30 centimorgan (cM) and a logarithm of odds
(LOD) threshold of 3 were set. Linkage groups composed
of many markers and those containing SSR markers with
known map location on different chromosomes were
grouped at higher LOD values. Cosegregating markers
were merged into single markers. The most likely positions
of the markers along the linkage groups were determined
with the commands nicemapl, nicemapd, mfmapl, mfmapd,
flips, build and annealing. The obtained maps were com-
pared to the wheat consensus SSR map (Somers et al.
2004) available in the GrainGenes database (http://wheat.
pw.usda.gov/ggpages/maps.shtml).
QTL analysis
QTL analysis was done with QGene (version 4.2.3)
(Nelson 1997). The association between trait data and
maker data was calculated by single-marker regression
(SMR) and the locations of the detected QTL were esti-
mated using simple interval mapping (SIM) (Haley and
Knott 1992). The percentage of phenotypic variance
(%PV) explained by a QTL and its additive effect (add)
were calculated. The critical LOD values at a type I error
rate of a\ 0.05 and a\ 0.01 were determined by 1,000
permutations for each trait. Possible segregation distortion
was tested using a Chi-square test for each marker. To
estimate the total percentage of phenotypic variance
explained by QTL, we fitted a linear model of all sig-
nificant QTL simultaneously using the GLM procedure of
SAS/STAT (SAS Institute Inc 2008). Linkage groups and
LOD profiles were drawn with MapChart 2.2 (Voorrips
2002).
296 Theor Appl Genet (2011) 123:293–306
123
Results
Trait variation and trait correlations
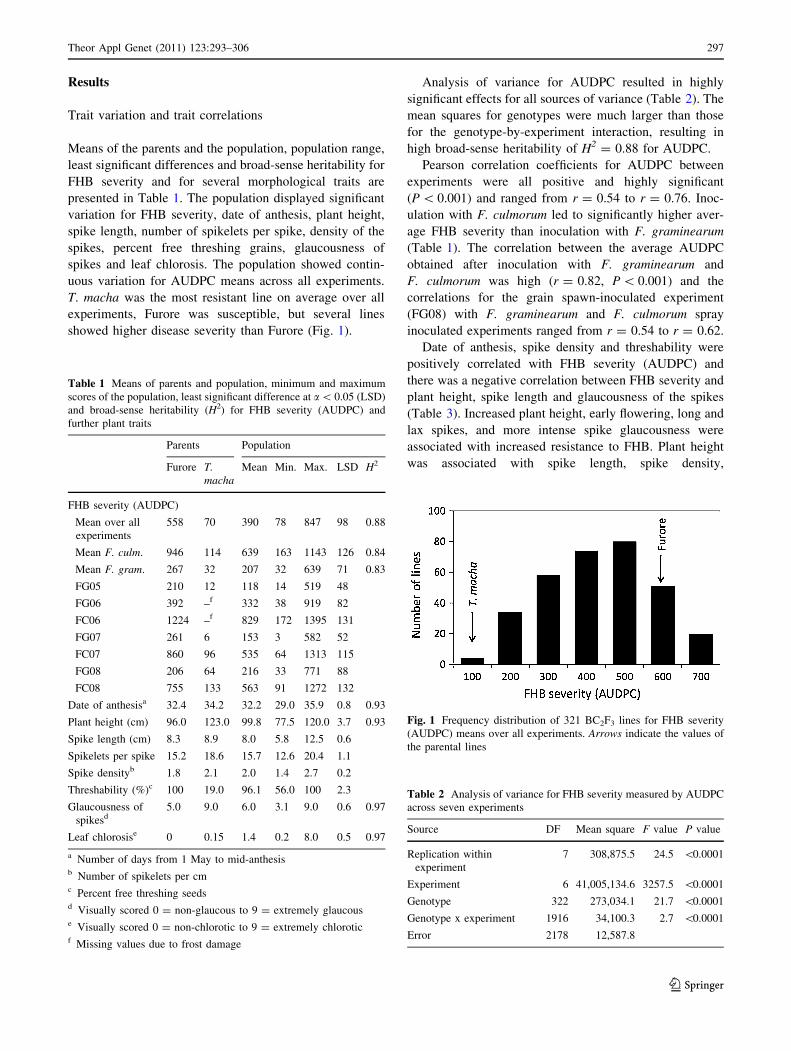
Means of the parents and the population, population range,
least significant differences and broad-sense heritability for
FHB severity and for several morphological traits are
presented in Table 1. The population displayed significant
variation for FHB severity, date of anthesis, plant height,
spike length, number of spikelets per spike, density of the
spikes, percent free threshing grains, glaucousness of
spikes and leaf chlorosis. The population showed contin-
uous variation for AUDPC means across all experiments.
T. macha was the most resistant line on average over all
experiments, Furore was susceptible, but several lines
showed higher disease severity than Furore (Fig. 1).
Analysis of variance for AUDPC resulted in highly
significant effects for all sources of variance (Table 2). The
mean squares for genotypes were much larger than those
for the genotype-by-experiment interaction, resulting in
high broad-sense heritability of H2 = 0.88 for AUDPC.
Pearson correlation coefficients for AUDPC between
experiments were all positive and highly significant
(P \ 0.001) and ranged from r = 0.54 to r = 0.76. Inoc-
ulation with F. culmorum led to significantly higher aver-
age FHB severity than inoculation with F. graminearum
(Table 1). The correlation between the average AUDPC
obtained after inoculation with F. graminearum and
F. culmorum was high (r = 0.82, P \ 0.001) and the
correlations for the grain spawn-inoculated experiment
(FG08) with F. graminearum and F. culmorum spray
inoculated experiments ranged from r = 0.54 to r = 0.62.
Date of anthesis, spike density and threshability were
positively correlated with FHB severity (AUDPC) and
there was a negative correlation between FHB severity and
plant height, spike length and glaucousness of the spikes
(Table 3). Increased plant height, early flowering, long and
lax spikes, and more intense spike glaucousness were
associated with increased resistance to FHB. Plant height
was associated with spike length, spike density,
Table 1 Means of parents and population, minimum and maximum
scores of the population, least significant difference at a\ 0.05 (LSD)
and broad-sense heritability (H2) for FHB severity (AUDPC) and
further plant traits
Parents Population
Furore T.macha
Mean Min. Max. LSD H2
FHB severity (AUDPC)
Mean over all
experiments
558 70 390 78 847 98 0.88
Mean F. culm. 946 114 639 163 1143 126 0.84
Mean F. gram. 267 32 207 32 639 71 0.83
FG05 210 12 118 14 519 48
FG06 392 –f 332 38 919 82
FC06 1224 –f 829 172 1395 131
FG07 261 6 153 3 582 52
FC07 860 96 535 64 1313 115
FG08 206 64 216 33 771 88
FC08 755 133 563 91 1272 132
Date of anthesisa 32.4 34.2 32.2 29.0 35.9 0.8 0.93
Plant height (cm) 96.0 123.0 99.8 77.5 120.0 3.7 0.93
Spike length (cm) 8.3 8.9 8.0 5.8 12.5 0.6
Spikelets per spike 15.2 18.6 15.7 12.6 20.4 1.1
Spike densityb 1.8 2.1 2.0 1.4 2.7 0.2
Threshability (%)c 100 19.0 96.1 56.0 100 2.3
Glaucousness of
spikesd5.0 9.0 6.0 3.1 9.0 0.6 0.97
Leaf chlorosise 0 0.15 1.4 0.2 8.0 0.5 0.97
a Number of days from 1 May to mid-anthesisb Number of spikelets per cmc Percent free threshing seedsd Visually scored 0 = non-glaucous to 9 = extremely glaucouse Visually scored 0 = non-chlorotic to 9 = extremely chloroticf Missing values due to frost damage
Fig. 1 Frequency distribution of 321 BC2F3 lines for FHB severity
(AUDPC) means over all experiments. Arrows indicate the values of
the parental lines
Table 2 Analysis of variance for FHB severity measured by AUDPC
across seven experiments
Source DF Mean square F value P value
Replication within
experiment
7 308,875.5 24.5 \0.0001
Experiment 6 41,005,134.6 3257.5 \0.0001
Genotype 322 273,034.1 21.7 \0.0001
Genotype x experiment 1916 34,100.3 2.7 \0.0001
Error 2178 12,587.8
Theor Appl Genet (2011) 123:293–306 297
123
glaucousness and threshability. Taller plants tended
towards elongated, lax and more glaucous spikes, and had
reduced threshability. The number of spikelets per spike
was positively correlated with both spike length and den-
sity of the spikes. More compact types were non-glaucous
and had free threshing seeds. Severity of leaf chlorosis was
weakly correlated with plant height and not correlated with
any other trait (results not shown).
Marker segregation and polymorphism
Among 282 SSR markers tested on the parents, 202
(=72%) were polymorphic. Marker data generated on 300
lines with 128 SSR primer and 64 selective AFLP primer
combinations and one morphological marker (hairy
glumes) were used for map construction, with the SSR
markers contributing 163 polymorphic loci and the AFLP
analysis 533 clearly informative AFLP markers. After
merging co-segregating markers into single markers, the
remaining 560 unique markers were composed of 117
codominant and 443 dominant markers, among which
T. macha carried the dominant allele for 230 and Furore for
213. The observed segregation in the population fitted the
expected segregation ratio for a BC2F3 RIL population.
Only 33 cM on parts of chromosomes 1D, 3A, 3D, 5A and
one unassigned linkage group, and 62 cM on parts of
chromosomes 3A, 5A, 5B and three unlinked groups
exhibited segregation distortion towards T. macha and
Furore, respectively.
Linkage map
Of the 560 markers, 554 could be placed in 33 different
linkage groups. The groups were assigned to individual
wheat chromosomes using previously mapped SSR mark-
ers and their map information from GrainGenes as anchor
points. Ten groups were assigned to the A genome, nine to
the B genome and six to the D genome, while eight linkage
groups that contained only AFLP markers remained
unassigned. At least partial maps were obtained for all
wheat chromosomes except 4D. The total length of the map
was 2,226 cM, with 803, 830 and 455 cM assigned,
respectively, to the A, B and D genomes and 138 cM
unassigned to specific chromosomes. The average distance
between markers was 4 cM. The arrangement of common
SSR markers were in most cases consistent with those in
published maps in GrainGenes.
QTL analysis
Quantitative trait loci mapping of FHB resistance
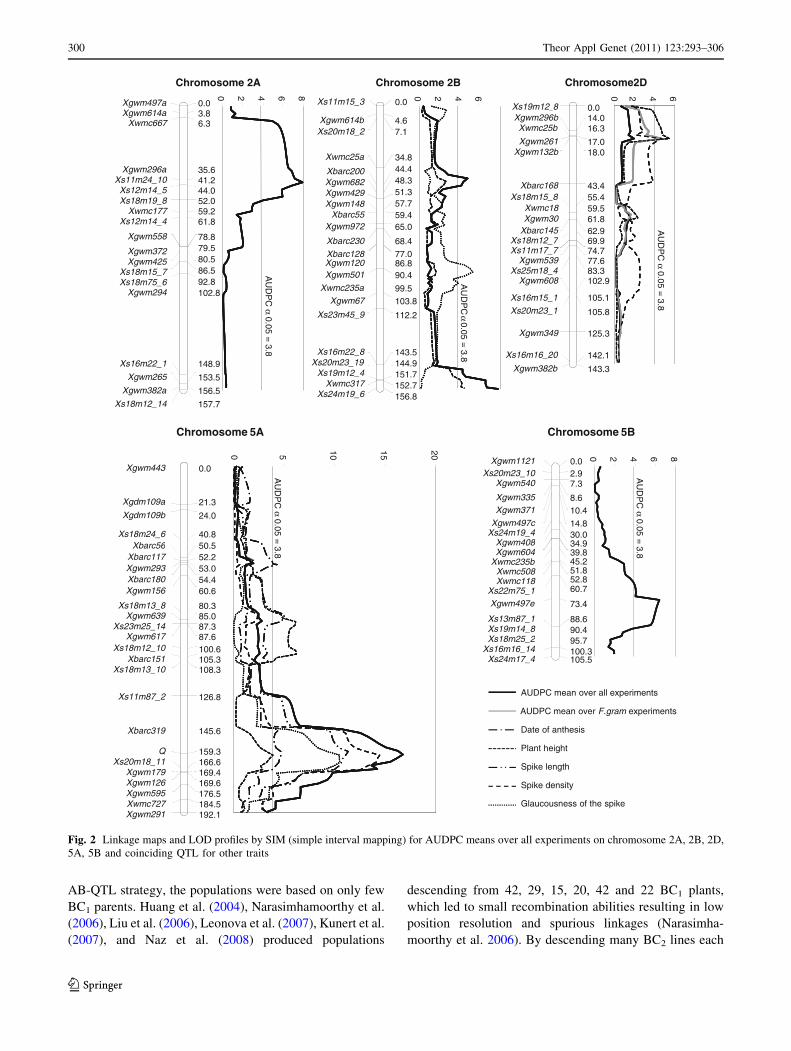
Simple interval mapping identified five significant QTL on
four different chromosomes associated with FHB severity
measured by overall mean AUDPC across all experiments
(Table 4). Permutation analysis resulted in LOD thresholds
for AUDPC means of 3.8 and 4.2 at a\ 0.05 and a\ 0.01,
respectively. For all of these five QTL, the allele improving
resistance was derived from T. macha. The linkage groups
and the LOD profiles for AUDPC means are shown in
Fig. 2.
The QTL with the largest effect, explaining 23% of the
phenotypic variance (PV) for AUDPC means mapped to
chromosome 5AL at the interval between Xs20m18_11 and
Xbarc319 and peaked at the Q locus; 11.5% of PV was
explained by a QTL at the position of Xs11m24_10 on
chromosome 2A. A QTL on the distal end of chromosome
2BL mapped close to Xwmc317 and accounted for 9.7% of
the PV. The QTL on 2A was consistently found in all
experiments with LOD values[3, while QTL on 5AL and
2BL were significant in six experiments. A second QTL on
2B and one on 5B were found in three and four experi-
ments accounting for 7.1 and 9.3% of PV, respectively. On
chromosome 2D, a QTL with LOD [3 was found in the
F. graminearum-inoculated experiments only. The LOD
value for means over all experiments was below signifi-
cance. For this putative 2D QTL, the favourable allele was
derived from Furore (Table 4; Fig. 2). The five significant
Table 3 Pearson correlation coefficients among line mean values for AUDPC, date of anthesis, plant height, spike length, spikelet per spike,
spike density, threshability and glaucousness of spikes
Trait Date of anthesis Plant height Spike length Spikelets per spike Spike density Threshability Glaucousness
AUDPC 0.30*** -0.53*** -0.27*** 0.04 0.28*** 0.44*** -0.19***
Date of anthesis -0.07 0.06 0.11* 0.00 0.23*** 0.03
Plant height 0.29*** -0.05 -0.32*** -0.28*** 0.21***
Spike length 0.39*** -0.75*** -0.35*** 0.23***
Spikelets per spike 0.29*** 0.10 -0.17***
Spike density 0.38*** -0.36***
Threshability -0.30***
* P \ 0.05, **P \ 0.01, ***P \ 0.001
298 Theor Appl Genet (2011) 123:293–306
123
QTL together explained 48% of the phenotypic variance
for mean AUDPC across all experiments.
Quantitative trait loci of other traits
The QTL identified for the date of anthesis, plant height,
spike length, number of spikelets per spike, density of the
spike, threshability, glaucousness of the spikes and leaf
chlorosis are summarized in Table 5. Date of anthesis was
modulated by QTL on 1B, 4A, 5AS, 5AL, 7B and 7D. The
alleles from T. macha on chromosome 1B, 4A, 5AS, 5AL
and 7B accelerated flowering, and on 7D retarded flower-
ing. Plant height was affected by QTL on chromosomes
2BL, 2D, 4A, 4B, 5AS, 5AL and 6A where the T. macha
allele increased plant height, except for 2D. A QTL for
spike length was found on 5AL, with the T. macha allele
favouring longer spikes. QTL affecting number of spikelets
per spike were identified on 2A, 3B and 7A. QTL on 2D,
3B, 3D and 5AL influenced spike density. The T. macha
allele at the 2D, 3B and 3D QTL increased density and at
the 5AL QTL, laxness. Threshability was strongly associ-
ated with the Q locus on 5AL. Glaucousness of the spike
was influenced by QTL on chromosomes 1A, 2B and 5AL.
Leaf chlorosis was influenced by one QTL detected on an
unassigned group, with the T. macha allele conferring
increased severity.
FHB QTL and their association with QTL for other traits
The large-effect QTL for AUDPC on 5AL was associated
with several further traits: plant height, spike length, spike
density, threshability and glaucousness of the spikes. Plants
carrying the T. macha allele at this location were more
resistant to FHB, taller and showed elongated lax, and
more glaucous spikes and strongly reduced threshability.
Co-localization of QTL for AUDPC and plant height was
found on chromosome 2BL near Xwmc317, with the
T. macha allele increasing FHB resistance and plant height.
On chromosome 2D, QTL associated with plant height
and spike density mapped to the same region, with the
T. macha allele reducing plant height and favoring a dense
spike. In terms of FHB, only F. graminearum-inoculated
experiments with general low infection levels revealed a
QTL with LOD as high as 3 at this locus.
Discussion
Precise phenotyping combined with a dense and reliable
linkage map are essential for effective QTL detection. To
ensure a complete and unbiased coverage of the donor
genome, each of the 321 BC2F3:4 lines was derived from a
different BC1 plant. In other studies on wheat with theTa
ble
4A
sso
ciat
edch
rom
oso
me,
clo
sest
mar
ker
and
flan
kin
gm
ark
ers
of
QT
Lfo
rA
UD
PC
Chro
mo
som
eC
lose
stm
ark
erF
lan
kin
gm
ark
ers
Ov
eral
lm
ean
Fu
sari
umcu
lmor
um
Fu
sari
umg
ram
inea
rum
Mea
nF
C0
6F
C0
7F
C0
8M
ean
FG
05
FG
06
FG
07
FG
08
Ad
da
LO
Db
%P
VL
OD
PV
%L
OD
PV
%L
OD
PV
%L
OD
PV
%L
OD
PV
%L
OD
PV
%L
OD
PV
%L
OD
PV
%L
OD
PV
%
2A
Xs1
1m2
4_
10X
gw
m2
96
a-X
s12m
14
_5
71
7.9
11
.56
.89
.96
.39
.55
.27
.75
.07
.47
.31
0.6
3.3
5.0
6.1
8.9
5.3
7.9
5.0
7.3
2B
SX
s20m
13
_4
Xw
mc2
5a-X
ba
rc2
00
58
4.8
7.1
4.9
7.3
2.6
4.0
4.9
7.2
4.6
6.9
3.9
5.7
4.8
7.1
1.5
2.3
3.9
5.9
2.7
4.1
2B
LX
s24m
19
_6
Xw
mc3
17-X
s24m
19
_6
71
6.7
9.7
8.0
11
.64
.06
.18
.21
1.8
6.7
9.9
4.4
6.5
4.0
6.0
3.0
4.5
2.7
4.1
3.0
4.4
5A
Lq
Xs2
0m1
8_
11-X
ba
rc3
19
89
.71
6.7
22
.71
7.4
23
.42
3.0
30
.47
.71
1.2
8.2
11
.81
1.1
15
.72
.64
.01
7.2
23
.25
.58
.06
.08
.8
5B
Xg
wm
49
7e
Xs2
2m7
5_
1-X
s13m
87
_1
63
6.4
9.3
7.2
10
.46
.69
.95
.17
.65
.48
.04
.36
.43
.24
.83
.55
.32
.84
.22
.63
.9
2D
Xg
wm
26
1X
gw
m2
96
b-X
s11m
75
_2
-4
52
.13
.21
.11
.70
.81
.31
.92
.91
.21
.84
.77
.03
.04
.54
.56
.62
.94
.32
.84
.3
LO
Dv
alu
es,%
of
ph
enoty
pic
var
ian
ce(%
PV
)an
dad
dit
ive
effe
cts
(ad
d)
are
calc
ula
ted
for
ov
eral
lm
eans
usi
ng
SIM
(sim
ple
inte
rval
map
pin
g).
LO
Dan
d%
PV
are
esti
mat
edb
yS
IMfo
rm
eans
ov
eris
ola
tes
asw
ell
asin
div
idual
exp
erim
ents
.L
OD
val
ues
[3
are
pri
nte
din
bo
lda
Posi
tive
val
ues
for
the
addit
ive
effe
cts
indic
ate
that
the
T.
ma
cha
alle
lere
du
ces
the
aver
age
trai
tv
alues
rela
tiv
eto
the
Fu
rore
alle
leb
Per
mu
tati
on
test
for
AU
DP
Co
ver
all
mea
ns,
1,0
00
iter
atio
ns:
a0
.05
=3
.8,a
0.0
1=
4.2
Theor Appl Genet (2011) 123:293–306 299
123
AB-QTL strategy, the populations were based on only few
BC1 parents. Huang et al. (2004), Narasimhamoorthy et al.
(2006), Liu et al. (2006), Leonova et al. (2007), Kunert et al.
(2007), and Naz et al. (2008) produced populations
descending from 42, 29, 15, 20, 42 and 22 BC1 plants,
which led to small recombination abilities resulting in low
position resolution and spurious linkages (Narasimha-
moorthy et al. 2006). By descending many BC2 lines each
Xs19m12_8 0.0Xgwm296b 14.0Xwmc25b 16.3
Xgwm261 17.0
Chromosome2D
Xs11m15_3
Xs20m18_2
0.0
Xgwm614b 4.67.1
0 2 4 6
Chromosome 2B
0 2 4 6
0 2 4 6 8 Xgwm497a 0.0Xgwm614a 3.8
Xwmc667 6.3
Chromosome 2A
Xgwm132b 18.0
Xbarc168 43.4Xs18m15_8 55.4
Xwmc18 59.5Xgwm30 61.8
Xbarc145 62.9Xs18m12_7 69.9
Xwmc25a 34.8
Xbarc200 44.4
Xgwm682 48.3Xgwm429 51.3Xgwm148 57.7
Xbarc55 59.4Xgwm972 65.0
Xbarc230 68.4
AU
D
Xs11m24_10Xgwm296a 35.6
41.2Xs12m14_5 44.0Xs18m19_8 52.0
Xwmc177 59.2Xs12m14_4 61.8
Xgwm558 78.879 5 Xs11m17_7 74.7
Xgwm539 77.6Xs25m18_4 83.3
Xgwm608 102.9
Xs16m15_1 105.1
Xs20m23_1 105.8
Xgwm349 125.3
Xs23m45_9
Xbarc128 77.0Xgwm120 86.8Xgwm501 90.4
Xwmc235a 99.5Xgwm67 103.8
112.2A
UD
PC
α0.05 =
DP
C α
0.05 = 3.8
Xgwm372 79.5
Xgwm425 80.5Xs18m15_7 86.5Xs18m75_6 92.8
Xgwm294 102.8
AU
DP
C α
0.05 = 3
Xs16m16_20 142.1
Xgwm382b 143.3
Xs16m22_8Xs20m23_19
Xs19m12_4
Xs24m19_6
143.5144.9151.7
Xwmc317 152.7156.8
= 3.8
Xs18m12_14
Xs16m22_1 148.9
Xgwm265 153.5
Xgwm382a 156.5
157.7
3.8
B5emosomorhCA5emosomorhC
Xgwm443 0.0
Xgdm109a 21.3
Xgdm109b 24.0
Xs18m24_6 40.8Xb 56 50 5
0 5
10
15
20 Xgwm1121 0.0Xs20m23_10 2.9
Xgwm540 7.3
Xgwm335 8.6Xgwm371 10.4
Xgwm497c 14.8Xs24m19_4 30.0
Xgwm408 34 9
0 2 4 6 8
AU
DP
C α
0.05 =
AU
DP
C α
0.05 =
Xbarc56 50.5Xbarc117 52.2Xgwm293 53.0Xbarc180 54.4Xgwm156 60.6
Xs18m13_8 80.3Xgwm639 85.0
Xs23m25_14 87.3Xgwm617 87.6
Xgwm408 34.9Xgwm604 39.8
Xwmc235b 45.2Xwmc508 51.8Xwmc118 52.8
Xs22m75_1 60.7
Xgwm497e 73.4
Xs13m87_1 88.6Xs19m14_8 90.4Xs18m25 2 95.7
= 3.8
= 3.8
Xs18m12_10 100.6Xbarc151 105.3
Xs18m13_10 108.3
Xs11m87_2 126.8
Xbarc319 145.6
_ 95.7Xs16m16_14 100.3
Xs24m17_4 105.5
AUDPC mean over all experiments
AUDPC mean over F.gram experiments
Date of anthesis
Q 159.3Xs20m18_11 166.6
Xgwm179 169.4Xgwm126 169.6Xgwm595 176.5Xwmc727 184.5Xgwm291 192.1
Plant height
Spike length
Glaucousness of the spike
Spike density
Fig. 2 Linkage maps and LOD profiles by SIM (simple interval mapping) for AUDPC means over all experiments on chromosome 2A, 2B, 2D,
5A, 5B and coinciding QTL for other traits
300 Theor Appl Genet (2011) 123:293–306
123

from a different BC1 plant, a possible loss of parts of the
donor genome was avoided. By using a large and unbiased
population of 300 BC2-derived lines, it was feasible to
perform genetic mapping in the same population that was
used for phenotyping and QTL mapping and the obtained
maps appeared accurate in relation to other published maps.
We used spray inoculation and grain spawn inoculation
methods for our experiments. As both methods provide
information on overall FHB resistance, including type I
(resistance to initial infection) and type II (resistance to the
fungal spread) (Schroeder and Christensen 1963), the dif-
ferent types of resistance could not be separated. The sig-
nificant and positive correlation coefficients among
experiments and the high broad-sense heritability coeffi-
cient (H2 = 0.88) for FHB severity show that a large
proportion of the observed variation among the tested lines
was due to genetic effects and support the meaningful
localization and estimation of QTL effects.
Table 5 Summary of QTL for morphological and developmental plant traits detected with SIM (simple interval mapping) and SMR (single-
marker regression). Significance thresholds are shown as footnotes
Trait Chromosome Closest marker Flanking markers SIM SMR
Addi LOD %PV Addi LOD %PV
Date of anthesisa 1B Xs23m13_8a Xs23m13_8a-Xs20m13_1 0.4 5.6 8 0.4 5.6 8
4A Xs14m22_6 Xs14m22_6-Xs14m87_5 0.5 12.0 17 0.6 11.1 16
5AS Xbarc180 Xbarc117-Xgwm156 0.2 3.9 6 0.3 4.3 6
5AL q Xbarc319-Xs20m18_11 0.4 4.7 7 0.5 5.8 9
7B Xs19m19_11 Xgwm611-Xs11m14_7 0.4 4.3 6 0.4 4.5 7
7D Xgwm44 Xs13m15_1-Xgwm111a -0.4 3.6 5 -0.5 5.4 8
Plant heightb 2BL Xs24m19_6 Xs19m12_4-Xs24m19_6 -2.8 4.2 6 -2.9 4.5 7
2D Xgwm132b Xgwm296b-Xs11m75_2 3.6 5.3 8 3.6 5.3 8
4A Xs14m13_9 Xs18m24_2-Xgwm610 -2.4 4.1 6 -2.4 4.4 7
4B Xs18m12_6 Xs23m45_12-Xs19m12_17 -2.7 4.0 6 -2.7 4.3 6
5AS Xgwm617 Xgwm639-Xbarc151 -2.9 6.1 9 -3.0 6.3 9
5AL q Xbarc319-Xs20m18_11 -2.0 3.9 6 -2.4 5.0 7
6A Xs19m19_3 Xs18m24_8-Xbarc3 -2.0 3.7 6 -2.4 3.9 6
Spike lengthc 5AL q Xbarc319-Xs20m18_11 -0.6 11.3 16 -0.6 12.4 17
Spikelets per spiked 2A Xgwm425 Xgwm588-Xs18m15_7 -0.5 5.1 8 -0.5 5.6 8
3B Xs20m23_8 Xs20m23_8-Xs22m12_1 -0.4 4.7 7 -0.6 5.6 8
7A Xs13m17_6 Xs11m75_6-Xs13m17_6 0.5 5.4 8 0.5 5.6 8
Spike densitye 2D Xgwm132b Xgwm296b-Xbarc168 -0.1 4.5 7 -0.1 4.5 7
3B Xs11m19_9 Xs14m12_4-Xbarc858 -0.1 7.8 11 -0.1 8.1 12
3D Xgwm341 Xs11m87_5-Xgwm341 -0.1 5.6 8 -0.1 5.7 8
5AL q Xbarc319-Xs20m18_11 0.1 14.4 20 0.2 15.8 22
Threshabilityf 5AL q Xbarc319-Xs20m18_11 10.0 64.8 63 10.8 81.2 71
Glaucousnessg 1A hairy glume hairy glume-Xs20m15_8 -0.7 12.1 17 -0.7 12.1 17
2B Xgwm501 Xs13m15_2-Xs19m19_14 -0.5 5.3 8 -0.6 5.7 8
5AL q Xbarc319-Xs20m18_11 -0.7 10.5 15 -0.8 12.9 18
Leaf chlorosish nij Xs20m18_15 Xbarc57b-Xs11m87_10 -1.7 27.7 36 -1.0 25.6 33
a a 0.05 = 4, a 0.01 = 5.2b a 0.05 = 3.8, a 0.01 = 4.6c a 0.05 = 5.6, a 0.01 = 7.5d a 0.05 = 4.4, a 0.01 = 5.4e a 0.05 = 4.1, a 0.01 = 5.1f a 0.05 = 6.6, a 0.01 = 9g a 0.05 = 3.9, a 0.01 = 4.9h a 0.05 = 5.9, a 0.01 = 7.3i Positive values for the additive effects indicate that the T. macha allele reduces the average trait values relative to the Furore allelej Linkage group not assigned to a chromosome
Theor Appl Genet (2011) 123:293–306 301
123
QTL detection
Essentially the same QTL were found for experiments
inoculated with F. graminearum as for those with F. cul-
morum, but for F. culmorum-inoculated experiments QTL
were estimated more precisely and at higher probability
values. This indicates that QTL detection is more effective
under high infection pressure.
The detection of five putative QTL for FHB resistance
underlines the complex and polygenic inheritance of this
trait already shown in numerous other QTL projects for
FHB in wheat. While Steed et al. (2005) reported a signi-
ficant type 1 FHB-resistance QTL derived from T. macha,
no 4A QTL was found in our study. Possibly, this 4A QTL
was specific to their population based on a Hobbit ‘sib’
(T. macha 4A) single chromosome recombinant doubled
haploid (DH) population.
The largest-effect QTL in our study was found on
chromosome 5AL at the Q locus, where no QTL for FHB
was reported previously. We consider it a major QTL for
FHB resistance. It coincided with QTL associated with
spike-related traits as for threshability, spike length, spike
density, glaucousness of the spikes, date of anthesis and
with plant height. Grausgruber et al. (1998) reported
similar findings for morphological characters of the ear
and found positive effects on resistance to FHB on 5A in
a Hobbit ‘sib’ (T. macha) intervarietal substitution line.
T. macha carries the q allele (Faris et al. 2005; Kuckuck
1964; Mac Key 1966; Simons et al. 2006) and the
detected QTL very likely corresponds to q. The Q locus
with the alleles Q (free threshing) and q (speltoid, non-
free threshing) is a major regulatory gene. It pleiotropi-
cally influences many other domestication-related traits
such as glume shape and tenacity, rachis fragility, spike
length, plant height and spike emergence time (Faris and
Gill 2002; Simons et al. 2006), which is in accordance
with our findings. Whether the association with FHB
resistance is due to a pleiotropic effect of the q allele or
close linkage between q and a FHB-resistance QTL
cannot be determined with current results. A much larger
high-resolution mapping population would be needed to
search for potential recombinants. Goral et al. (2008)
tested several spelt wheat cultivars and found highly
resistant as well as highly susceptible spelt varieties, and
among 151 T. dicoccoides accessions tested by
Buerstmayr et al. (2003) most were susceptible to FHB.
Thus, the presence of the allele q does not always confer
high FHB resistance, supporting the hypothesis that FHB
resistance is rather linked to q than pleiotropic. In our
population, it is possible that part of the increased FHB
resistance associated with the q allele may be due to
morphological and developmental traits such as spike
structure and flowering behaviour.
The QTL on 2BL close to Xwmc317 was repeatedly
detected in six experiments. This QTL coincided with a
QTL for plant height, with the Furore allele reducing
height. The Rht4 gene is located on chromosome 2BL close
to Xwmc317 (Ellis et al. 2005). Whether or not the QTL for
reduced height from Furore is caused by Rht4 is currently
not known. Schmolke et al. (2005) reported a resistance
QTL for FHB in the Dream/Lynx population after spray
inoculation in a similar position, but found no association
with plant height. In our study, a second QTL on 2BS close
to Xbarc200 was revealed in four experiments. Gilsinger
et al. (2005) detected a resistance QTL linked with
Xbarc200 on 2BS in the cultivar Goldfield and found a
relation to narrow flower opening associated with resis-
tance at this QTL. The flower opening trait was not
investigated in our population. In the review of FHB-
related QTL by Buerstmayr et al. (2009), QTL for FHB
resistance are reported at several positions along chromo-
some 2B. Since T. macha is related neither to Dream nor to
Goldfield, we suggest that both T. macha-derived QTL on
2B are novel.
In the 2AS region containing a FHB-resistance QTL
significant in all experiments, no overlapping QTL for
other traits were found. Three QTL related to FHB resis-
tance were published on 2AS. The Asian wheat variety
Ning7840 expressed a minor QTL for FHB spread asso-
ciated with Xgwm614 (Zhou et al. 2002). Variety NK93604
had a QTL for low DON (deoxynivalenol) accumulation at
Xbarc124, although no association to FHB symptom
severity was found (Semagn et al. 2007), and a resistance
QTL derived from Wangshuibai mapped close to Xgwm425
near the centromere. In the present population, Xgwm614a
mapped 38 cM distal and Xgwm425 40 cM proximal to our
QTL peak at the AFLP marker Xs11m24_10. We therefore
assume that the T. macha QTL differs from these previ-
ously reported QTL at chromosome 2A. Based on our map
and the maps of Xue et al. (2008) and Song et al. (2005), it
appears likely that QTL for FHB severity on 2AS, 2BS and
2D reside at homoeologous genomic regions.
Bourdoncle and Ohm (2003) reported a QTL for FHB
spread derived from Patterson with minor effects towards
resistance in approximately the same location as our 5BL
QTL observed in five experiments.
Morphological traits and their association with FHB
resistance
Q locus
A T. macha line with good resistance to FHB served as
donor parent. This line was 27 cm taller and 2 days later in
anthesis compared to the recurrent parent Furore, a com-
mon hexaploid wheat. Ear morphology of T. macha differs
302 Theor Appl Genet (2011) 123:293–306
123
markedly from the bread wheat parent. T. macha is a hulled
wheat, has a dense square-headed, but non-compact spike
phenotype, has a fragile rachis, is only partly free threshing
and has hairy and waxy glumes. Compared to T. spelta it
does not show the speltoid ear shape, which is described as
a spear-shaped spike with elongated rachis. The European
spelt and T. macha carry the q allele, while the Iranian spelt
carries Q (Simons et al. 2006). The q allele plays a key role
in the present study. In accordance with the known modi-
fications associated with the q allele, we identified QTL for
plant height, date of anthesis, spike density, spike length
and threshability at the location of q. In addition, we found
QTL for glaucousness of the glumes and for FHB severity.
Lines carrying the q allele showed typically speltoid ear-
shape, which was not visible in T. macha, but appeared in
the genetic background of Furore.
Compactness
T. macha has a compacting gene that appears to be allelic
to C (Swaminathan and Rao 1961). C determines whether a
spike is lax or compacted and it affects spike morphology,
grain size, shape, spikelet number and perhaps other
aspects of plant development (Gul and Allan 1972). In our
study, QTL for plant height and dense spike co-located on
chromosome 2D near Xgwm261. The T. macha allele
changed lines towards smaller plants with dense square-
headed spikes. Additionally, a minor but not significant
QTL for FHB resistance coincided. Lines carrying T. ma-
cha allele were more highly infected. Johnson et al. (2008)
mapped C to Xgwm358 close to the centromere of 2D,
which is in disagreement with our findings. Sourdille et al.
(2000) and Ma et al. (2007) found a QTL for compactness
on 2D at Xgwm261, consistent with our results. Rht8
(Worland et al. 1998) is closely linked to Xgwm261, con-
sistent with the QTL for plant height in our study. Nalam
et al. (2007) and Ma et al. (2007) reported a QTL for glume
tenacity and threshability at Xgwm261. The basically non-
free threshing character of T. macha in combination with
its long and dense but non-compact spike arises therefore
from the specific allele combination of q and C.
A QTL for density of spikes was found at Xgwm341 on
3D. Xgwm341 maps about 0.2 cM from Xgwm456 (Somers
et al. 2004). The S1 locus was mapped close to the cen-
tromeric marker Xgwm456 of the long arm of 3D by Salina
et al. (2000). Rao (1977) and Koba and Tsunewaki (1978)
also reported that the sphaerococcum gene S1 is near the
centromere of chromosome 3D. Besides other character-
istics, S1 also influences spike density. Swaminathan and
Rao (1961) confirmed that the qq CC S1S1 alleles were
present in T. macha. Even though the genotype of both
T. macha and Furore are assumed to be S1S1, the T. macha
allele conferred a denser spike than Furore. This indicates
that T. macha and Furore carry different alleles at this
locus. Interestingly, no QTL for number of spikelets per
spike coincided with the previously discussed loci on 5AL,
2D and 3D.
Glaucousness (waxiness/glossiness) of the spike
QTL for spike glaucousness coincided with QTL for FHB
resistance on chromosome 5AL and the morphological
marker Hg (hairy glumes) on 1AS. The QTL for glau-
cousness on 2B had no association with other traits.
Glaucousness could possibly be a passive resistance factor,
as a more waxy cuticle can potentially impede the entry of
fungi. The positive phenotypic correlation between glau-
cousness and resistance may be accounted for by coincid-
ing QTL for glaucousness and QTL for FHB resistance on
5AL rather then by glaucousness per se.
Plant height
Although seven QTL with significant influence on plant
height were revealed, only QTL on 5AL and 2BL coin-
cided with QTL for FHB resistance. Repeated observations
of associations between FHB severity and plant height
(Buerstmayr et al. 2000; Gervais et al. 2003; Hilton et al.
1999; Mesterhazy 1995; Steiner et al. 2004) as well as
compactness of the spikes (Steiner et al. 2004; Zhu et al.
1999) may be partly explained by passive resistance. Tall
plants are more exposed to wind and sun and therefore dry
off earlier, whereby short plants, especially in combination
with dense spikes, are exposed to a more humid micro-
climate, which favours FHB infections.
Date of flowering
Although T. macha was the later-flowering parent, the
T. macha allele at QTL for date of anthesis favoured earlier
flowering on chromosomes 1B, 4A, 5AS, 5AL and 7B and
delayed flowering only on 7D. The chromosome 4A QTL
showed the highest influence on the date of anthesis.
Though FHB resistance was positively correlated with date
of anthesis, no coinciding QTL except the 5AL one was
revealed. Several different publications mention a positive
effect of early flowering on FHB resistance (Gervais et al.
2003; Holzapfel et al. 2008; Paillard et al. 2004; Schmolke
et al. 2005; Steiner et al. 2004) in agreement with our
findings.
Chlorosis
A single major QTL for leaf chlorosis was found on an
unassigned linkage group. This is in agreement with
Tsunewaki (1971) and Naskidashvili et al. (2010) who
Theor Appl Genet (2011) 123:293–306 303
123
reported the occurrence of several chlorosis and necrosis
alleles in T. macha. Leaf chlorosis was not associated with
other traits evaluated in this study.
Summary and conclusions
In this AB-QTL analysis, several novel QTL deriving from
the landrace T. macha were mapped. These novel T. ma-
cha-derived QTL appear valuable for broadening the
genetic basis and diversity of FHB resistance in wheat.
Some of the FHB-resistance QTL from Georgian spelt
wheat coincide with those for spelt wheat traits. The major
FHB-resistance QTL at chromosome 5A was closely
associated with the wild-type allele q, and it is unclear
whether q has a pleiotropic effect on FHB resistance or is
closely linked to a nearby resistance QTL. Only the 2BL
FHB-resistance QTL co-located with a plant height QTL;
the allele q had only a moderate effect on height and none
of the other plant height QTL corresponded to FHB-
resistance QTL. Selected lines from this study appear
useful for practical resistance breeding, because they carry
QTL from the landrace T. macha in an already agronom-
ically adapted background. In addition, selected lines car-
rying q (spelt wheat ear type) could be useful as crossing
partners for spelt wheat breeding.
Acknowledgments Funding of this project was provided by
Austrian Science Fund (FWF), project number: 17310-B05. We
acknowledge the Federal State of Lower Austria for supporting the
research program of IFA-Tulln. We acknowledge the excellent
technical assistance by Lisa Schmid and Matthias Fidesser. We thank
Clare Nelson (Kansas State University, USA) for adapting the
CarthaGene program to handle advanced backcross designs and for
his suggestions for improving this manuscript.
Open Access This article is distributed under the terms of the
Creative Commons Attribution Noncommercial License which per-
mits any noncommercial use, distribution, and reproduction in any
medium, provided the original author(s) and source are credited.
References
Barisashvili MA, Gorgidze AD (1979) O proiskhozhdenii pshenitsy
T. macha Dek. et. Men. (On the origin of T. macha Dek. et Men.
wheat) Soobshcheniya. Akad Nauk Gruz SSR 95:409–412
Bourdoncle W, Ohm HW (2003) Quantitative trait loci for resistance
to Fusarium head blight in recombinant inbred wheat lines from
the cross Huapei 57–2/Patterson. Euphytica 131:131–136
Buerstmayr H, Lemmens M, Grausgruber H, Ruckenbauer P (1996)
Scab resistance of international wheat germplasm. Cereal Res
Commun 24:195–202
Buerstmayr H, Steiner B, Lemmens M, Ruckenbauer P (2000)
Resistance to fusarium head blight in winter wheat: heritability
and trait associations. Crop Sci 40:1012–1018
Buerstmayr H, Lemmens M, Hartl L, Doldi L, Steiner B, Stierschne-
ider M, Ruckenbauer P (2002) Molecular mapping of QTLs for
Fusarium head blight resistance in spring wheat. I. Resistance to
fungal spread (type II resistance). Theor Appl Genet 104:84–91
Buerstmayr H, Stierschneider M, Steiner B, Lemmens M, Griesser M,
Nevo E, Fahima T (2003) Variation for resistance to head blight
caused by Fusarium graminearum in wild emmer (Triticumdicoccoides) originating from Israel. Euphytica 130:17–23
Buerstmayr H, Ban T, Anderson JA (2009) QTL mapping and
marker-assisted selection for Fusarium head blight resistance in
wheat: a review. Plant Breed 128:1–26
Cao WG, Scoles G, Hucl P, Chibbar RN (2000) Phylogenetic
relationships of five morphological groups of hexaploid wheat
(Triticum aestivum L. em Thell.) based on RAPD analysis.
Genome 43:24–727
de Givry S, Bouchez M, Chabrier P, Milan D, Schiex T (2005)
CARTHAGENE: multipopulation integrated genetic and radi-
ated hybrid mapping. Bioinformatics 21:1703–1704
Ellis MH, Rebetzke GJ, Azanza F, Richards RA, Spielmeyer W
(2005) Molecular mapping of gibberellin-responsive dwarfing
genes in bread wheat. Theor Appl Genet 111:423–430
Faris JD, Gill BS (2002) Genomic targeting and high-resolution
mapping of the domestication gene Q in wheat. Genome
45:706–718
Faris JD, Simons KJ, Zhang Z, Gill BS (2005) The wheat super
domestication gene Q. Wheat Inf Serv 100:129–148
Gervais L, Dedryver F, Morlais JY, Bodusseau V, Negre S, Bilous M,
Groos C, Trottet M (2003) Mapping of quantitative trait loci for
field resistance to Fusarium head blight in an European winter
wheat. Theor Appl Genet 106:961–970
Gilsinger J, Kong L, Shen X, Ohm H (2005) DNA markers associated
with low Fusarium head blight incidence and narrow flower
opening in wheat. Theor Appl Genet 110:1218–1225
Goral T, Ochodzki P, Mazurek A, Bulinska-Radomska Z (2008)
Resistance of species from genus Triticum to Fusarium head
blight and accumulation of Fusarium-metabolites in grain.
Cereal Res Commun 36:95–97
Grausgruber H, Lemmens M, Buerstmayr H, Ruckenbauer P (1998)
Chromosomal location of Fusarium head blight resistance and in
vitro toxin tolerance in what using the Hobbit ‘sib’ (Triticummacha) chromosome substitution lines. J Genet Breed 52:173–180
Gul A, Allan RE (1972) Relation of the club gene with yield and yield
components of near-isogenic lines. Crop Sci 12:297
Haley SC, Knott AS (1992) A simple regression method for mapping
quantitative trait loci in line crosses using flanking markers.
Heredity 69:315–324
Hartl L, Mohler V, Zeller FJ, Hsam SLK, Schweizer G (1999)
Identification of AFLP markers closely linked to the powdery
mildew resistance genes Pm1c and Pm4a in common wheat
(Triticum aestivum L.). Genome 42:322–329
Hilton AJ, Jenkinson P, Hollins TW, Parry DW (1999) Relationship
between cultivar height and severity of Fusarium ear blight in
wheat. Plant Pathol 48:202–208
Holzapfel J, Voss HH, Miedaner T, Korzun V, Haberle J, Schweizer
G, Mohler V, Zimmermann G, Hartl L (2008) Inheritance of
resistance to Fusarium head blight in three European winter
wheat populations. Theor Appl Genet 117:1119–1128
Huang XQ, Kempf H, Ganal MW, Roder MS (2004) Advanced
backcross QTL analysis in progenies derived from a cross
between a German elite winter wheat variety and a synthetic
wheat (Triticum aestivum L.). Theor Appl Genet 109:933–943
Johnson EB, Nalam VJ, Zemetra RS, Riera-Lizarazu O (2008)
Mapping the compactum locus in wheat (Triticum aestivum L.)
and its relationship to other spike morphology genes of the
Triticeae. Euphytica 163:193–201
Koba T, Tsunewaki K (1978) Mapping of the s and Ch2 genes on
chromosome 3D of common wheat. Wheat Inf Serv
45–46:18–20
304 Theor Appl Genet (2011) 123:293–306
123
Kuckuck H (1964) Experimentelle Untersuchungen zur Entstehung
der Kulturweizen. Z Pflanzenzuchtg 51:97–140
Kunert A, Naz AA, Dedeck O, Pillen K, Leon J (2007) AB-QTL
analysis in winter wheat: I. Synthetic hexaploid wheat
(T. turgidum ssp dicoccoides 9 T. tauschii) as a source of
favourable alleles for milling and baking quality traits. Theor
Appl Genet 115:683–695
Law CN, Worland AJ (1996) Inter-varietal chromosome substitution
lines in wheat. Euphytica 89:1–10
Leonova IN, Laikova LI, Popova OM, Unger O, Borner A, Roder MS
(2007) Detection of quantitative trait loci for leaf rust resistance
in wheat-T. timopheevii/T. tauschii introgression lines. Euphy-
tica 155:79–86
Liu SB, Zhou RG, Dong YC, Li P, Jia JZ (2006) Development,
utilization of introgression lines using a synthetic wheat as
donor. Theor Appl Genet 112:1360–1373
Liu SY, Hall MD, Griffey CA, McKendry AL (2009) Meta-analysis
of QTL associated with fusarium head blight resistance in wheat.
Crop Sci 49:1955–1968
Loffler M, Schon CC, Miedaner T (2009) Revealing the genetic
architecture of FHB resistance in hexaploid wheat (Triticumaestivum L.) by QTL meta-analysis. Mol Breed 23:473–488
Ma ZQ, Zhao DM, Zhang CQ, Zhang ZZ, Xue SL, Lin F, Kong ZX,
Tian DG, Luo QY (2007) Molecular genetic analysis of five
spike-related traits in wheat using RIL and immortalized F-2
populations. Mol Genet Genomics 277:31–42
Mac Key J (1954) Neutron and X-ray experiments in wheat and a
revision of the speltoid problem. Hereditas 40:65–180
Mac Key J (1966) Species relationship in Triticum. Hereditas
2(Suppl):237–276
Mentewab A, Rezanoor HN, Gosman N, Worland AJ, Nicholson P
(2000) Chromosomal location of Fusarium head blight resistance
genes and analysis of the relationship between resistance to head
blight and brown foot rot. Plant Breed 119:15–20
Mesterhazy A (1995) Types and components of resistance to
Fusarium head blight of wheat. Plant Breed 114:377–386
Morris R, Sears ER (1967) The cytogenetics of wheat and its
relatives. In: Quisenberry KS, Reitz LP (eds) Wheat and wheat
improvement. American Society of Agronomy, Madison,
pp 19–87
Nalam VJ, Vales MI, Watson CJW, Johnson EB, Riera-Lizarazu O
(2007) Map-based analysis of genetic loci on chromosome 2D
that affect glume tenacity and threshability, components of the
free-threshing habit in common wheat (Triticum aestivum L.).
Theor Appl Genet 116:135–145
Narasimhamoorthy B, Gill BS, Fritz AK, Nelson JC, Brown-Guedira
GL (2006) Advanced backcross QTL analysis of a hard winter
wheat 9 synthetic wheat population. Theor Appl Genet
112:787–796
Naskidashvili P, Naskidashvili M, Naskidashvili I, Gakharia N (2010)
Revealing genes of hybrid necrosis and red hybrid chlorosis in
crosses of varieties of Georgian wheat and the importance of
these genetic phenomena for selection and theoretical research.
Bull Georg Natl Acad Sci 4:145–150
Naz AA, Kunert A, Lind V, Pillen K, Leon J (2008) AB-QTL analysis
in winter wheat: II. Genetic analysis of seedling and field
resistance against leaf rust in a wheat advanced backcross
population. Theor Appl Genet 116:1095–1104
Nelson J (1997) QGENE: software for marker-based genomic
analysis and breeding. Mol Breed 3:239–245
Nyquist WE (1991) Estimation of heritability and prediction of
selection response in plant populations. Crit Rev Plant Sci
10:235–322
Paillard S, Schnurbusch T, Tiwari R, Messmer M, Winzeler M, Keller
B, Schachermayr G (2004) QTL analysis of resistance to
Fusarium head blight in Swiss winter wheat (Triticum aestivumL.). Theor Appl Genet 109:323–332
Pestsova E, Ganal MW, Roder MS (2000) Isolation and mapping of
microsatellite markers specific for the D genome of bread wheat.
Genome 43:689–697
Rao MVP (1972) Mapping of the compactum gene C on chromosome
2D of wheat. Wheat Inf Serv 35:9
Rao MVP (1977) Mapping of the sphaerococcum gene ‘s’ on
chromosome 3D of wheat. Cereal Res Commun 5:15–17
Roeder SM, Korzun K, Wendehake K, Plaschke J, Tixier HM, Leroy
P, Ganal WM (1998) A microsatellite map of wheat. Genetics
149:2007–2023
Saghai Maroof MAK, Soliman RA, Jorgensen RA, Allard RW (1984)
Ribosomal DNA spacer length polymorphism in barley: Men-
delian inheritance, chromosomal location and populationdynam-
ics. Proc Natl Acad Sci USA 81:8014–8018
Salina E, Borner A, Leonova I, Korzun V, Laikova L, Maystrenko O,
Roder MS (2000) Microsatellite mapping of the induced
sphaerococcoid mutation genes in Triticum aestivum. Theor
Appl Genet 100:686–689
SAS Institute Inc (2008) SAS/STAT� 9.2 user’s guide. Cary, NC
Schmolke M, Zimmermann G, Buerstmayr H, Schweizer G, Miedaner
T, Korzun V, Ebmeyer E, Hartl L (2005) Molecular mapping of
Fusarium head blight resistance in the winter wheat population
Dream/Lynx. Theor Appl Genet 111:747–756
Schroeder HW, Christensen JJ (1963) Factors affecting resistance of
wheat to scab caused by Gibberella zeae. Phytopathology
53:831–838
Semagn K, Skinnes H, Bjornstad A, Maroy AG, Tarkegne Y (2007)
Quantitative trait loci controlling Fusarium head blight resis-
tance and low deoxynivalenol content in hexaploid wheat
population from ‘Arina’ and NK93604. Crop Sci 47:294–303
Simons KJ, Fellers JP, Trick HN, Zhang ZC, Tai YS, Gill BS, Faris
JD (2006) Molecular characterization of the major wheat
domestication gene Q. Genetics 172:547–555
Somers DJ, Isaac P, Edwards K (2004) A high-density microsatellite
consensus map for bread wheat (Triticum aestivum L.). Theor
Appl Genet 109:1105–1114
Song QJ, Shi JR, Singh S, Fickus EW, Costa JM, Lewis J, Gill BS,
Ward R, Cregan PB (2005) Development and mapping of
microsatellite (SSR) markers in wheat. Theor Appl Genet
110:550–560
Sourdille P, Tixier MH, Charmet G, Gay G, Cadalen T, Bernard S,
Bernard M (2000) Location of genes involved in ear compact-
ness in wheat (Triticum aestivum) by means of molecular
markers. Mol Breed 6:247–255
Steed A, Chandler E, Thomsett M, Gosman N, Faure S, Nicholson P
(2005) Identification of type I resistance to Fusarium head blight
controlled by a major gene located on chromosome 4A of
Triticum macha. Theor Appl Genet 111:521–529
Steiner B, Lemmens M, Griesser M, Scholz U, Schondelmaier J,
Buerstmayr H (2004) Molecular mapping of resistance to
Fusarium head blight in the spring wheat cultivar Frontana.
Theor Appl Genet 109:215–224
Swaminathan MS, Rao MVP (1961) Macro-mutations and sub-
specific differentiation in Triticum. Wheat Inf Serv 13:9–11
Tanksley SD, Nelson JC (1996) Advanced backcross QTL analysis: a
method for the simultaneous discovery and transfer of valuable
QTLs from unadapted germplasm into elite breeding lines. Theor
Appl Genet 92:191–203
Tsunewaki K (1971) Distribution of necrosis genes in wheat
v. Triticum macha, T. spelta and T. vavilovii. Jpn J Genet
46:93–101
Voorrips RE (2002) MapChart: software for the graphical presenta-
tion of linkage maps and QTLs. J Hered 93:77–78
Theor Appl Genet (2011) 123:293–306 305
123
Vos P, Hogers R, Bleeker M, Reijans M, van de Lee T, Horens M,
Frijters A, Pot J, Peleman J, Kuiper M, Zabeau M (1995) AFLP:
a new technique for DNA fingerprinting. Nucleic Acids Res
23:4407–4414
Worland AJ, Korzun V, Roder MS, Ganal MW, Law CN (1998)
Genetic analysis of the dwarfing gene Rht8 in wheat. Part II. The
distribution and adaptive significance of allelic variants at the
Rht8 locus of wheat as revealed by microsatellite screening.
Theor Appl Genet 96:1110–1120
Xue SL, Zhang ZZ, Lin F, Kong ZX, Cao Y, Li CJ, Yi HY, Mei MF,
Zhu HL, Wu J, Xu HB, Zhao DM, Tian DG, Zhang CQ, Ma Z
(2008) A high-density intervarietal map of the wheat genome
enriched with markers derived from expressed sequence tags.
Theor Appl Genet 117:181–189
Zhou WC, Kolb FL, Bai GH, Shaner G, Domier LL (2002) Genetic
analysis of scab resistance QTL in wheat with microsatellite and
AFLP markers. Genome 45:719–727
Zhu H, Gilchrist L, Hayes P, Kleinhofs A, Kudrna D, Liu Z, Prom L,
Steffenson B, Toojinda T, Vivar H (1999) Does function follow
form? Principal QTLs for Fusarium head blight (FHB) resistance
are coincident with QTLs for inflorescence traits and plant height
in a doubled-haploid population of barley. Theor Appl Genet
99:1221–1232
306 Theor Appl Genet (2011) 123:293–306
123