Does a High-protein Diet Improve Weight Loss in Overweight and Obese Children
30
QUT Digital Repository: http://eprints.qut.edu.au/ Gately, Paul J. and King, Neil A. and Greatwood, Hannah C. and Humphrey, Lauren C. and Radley, Duncan and Cooke, Carlton B. and Hill, Andrew J. (2007) Does a High-protein Diet Improve Weight Loss in Overweight and Obese Children?. Obesity 15(6):pp. 1527-1534. © Copyright 2007 Nature Publishing Group
Transcript of Does a High-protein Diet Improve Weight Loss in Overweight and Obese Children

QUT Digital Repository: http://eprints.qut.edu.au/
Gately, Paul J. and King, Neil A. and Greatwood, Hannah C. and Humphrey, Lauren C. and Radley, Duncan and Cooke, Carlton B. and Hill, Andrew J. (2007) Does a High-protein Diet Improve Weight Loss in Overweight and Obese Children?. Obesity 15(6):pp. 1527-1534.
© Copyright 2007 Nature Publishing Group

1
Does a high-protein diet improve weight loss in overweight and obese children?
Paul J Gately,1 Neil A King,2, 3 Hannah C Greatwood,1 Lauren C Humphrey,1 Duncan
Radley,1 Carlton B Cooke,1 and Andrew J Hill.4
Author affiliations
1School of Sport, Exercise and Physical Education, Leeds Metropolitan University,
Fairfax Hall, Headingley Campus, Leeds, LS6 3QS, UK.
2Institute of Psychological Sciences, University of Leeds, UK.
3Institute of Health and Biomedical Innovation, Queensland University of Technology,
Brisbane, Australia.
4Academic Unit of Psychiatry and Behavioural Sciences, Leeds University School of
Medicine, UK.
Corresponding author and reprints
Paul J Gately
School of Sport, Exercise and Physical Education, Leeds Metropolitan University,
Fairfax Hall, Headingley Campus, Leeds, LS6 3QS, UK.
Tel. +44 113 283 2600 ext. 3579. Fax. +44 113 283 7575
Email: [email protected].
Running title
High-protein diet, appetite and weight-loss.

2
Abstract
Objective: To evaluate the effect of a high-protein diet on anthropometry, body
composition, subjective appetite and mood sensations in overweight and obese children
attending a residential weight-loss camp.
Research Methods and Procedures: 120 overweight and obese children (BMI 33.1±5.5
kg.m-2; age 14.2±1.9 years) were randomly assigned to either a standard or high-protein
diet group (15% vs 22.5% protein respectively). All children engaged in 5 hours/d of
physical activity and 5 educational classes per week for 2-6 weeks. All children were
assessed at baseline and at the end of the camp for anthropometry, body composition and
blood pressure. Subsamples were used to obtain data on biochemical variables (n=27)
and subjective appetite and mood sensations (n=50).
Results: Attendance at the weight-loss camp resulted in significant improvements in most
measures. Campers lost 5.5±2.9 kg in body weight (p<0.001), 3.8±5.4 kg in fat mass
(p<0.001), reduced their BMI sd score by 0.27±0.1 (p<0.001) and their waist
circumference by 6.6±2.8 cm (p<0.001). Subjective sensations of hunger increased
significantly over the camp duration but no other changes in appetite or mood were
observed. There were no significant differences between the two diets on any physical or
subjective measures.
Discussion: Weight-loss camps are effective in assisting children to lose weight and
improve on a range of health outcomes, independent of the protein content of the diet.
The implications of an increase in hunger associated with weight loss needs to be

3
considered. Further work is warranted into whether higher levels of dietary protein are
feasible or effective in longer-term weight-loss interventions of this type.
Key words: Obesity, residential camp, hunger, satiety.
4
Introduction
Like adult obesity, childhood obesity prevalence is rising (1), making it imperative that
treatment programmes are developed and supported. As these children move into
adulthood this will lead to an associated increase in physical and psychological morbidity
(2). It is vital to treat obesity in childhood, as lifestyle behaviours that contribute to and
sustain obesity in adults are less well established in children and may be more amendable
to change (3).
Short-term weight loss in paediatric patients has previously been achieved in trials
involving various methods for the control of both diet and activity level. These include
energy and fat reduction (4), adherence to a low-carbohydrate diet (5), participation in
structured, vigorous physical activity (6) and a reduction in sedentary behaviour (7).
However, one of the consequences of achieving a dietary-induced negative energy
balance is an increase in hunger, at least in adults. There are many examples of energy
restriction giving rise to hunger and increased food intake (8-10). It is also reported that
combining an acute increase in exercise-induced energy expenditure with energy
restriction fails to kerb the increase in hunger and food intake (11). Finding ways of
preventing the automatic increase in hunger in response to a dietary-induced negative
energy balance may improve adherence to weight loss programmes.
One approach might be to increase the proportion of dietary protein consumed. Weigle et
al. (12) suggest that there are two mechanisms by which increased dietary protein
impedes an increase in the drive to eat usually experienced during negative energy

5
balance. The first is the capacity of dietary protein to increase energy expenditure, partly
due to greater diet-induced thermogenesis after protein consumption than after
consumption of equal calorific loads of carbohydrate or fat (13). The second is the
greater satiating power of protein compared with the other macronutrients (14-16).
Weigle et al. (12) demonstrated that an increase in protein intake from 15% to 30% of
energy, at a constant carbohydrate intake of 50% of energy, resulted in subjects reporting
a clear decrease in hunger and increase in fullness. This effect has been demonstrated in
short-term feeding studies (17), in long-term studies with imposed caloric restrictions (18,
19), and in spontaneous energy intake where participants consuming more dietary protein
consumed less energy in subsequent meals (20).
An additional body of evidence has shown that the substitution of dietary carbohydrate
with protein in low-fat diets (<30%) enhances weight loss and has several beneficial
effects on body composition and cardiovascular risk (19, 21, 22). Furthermore, a high-
protein diet has been shown to be prevent weight regain (18). These authors found that
increasing protein from 15% to just 18% of energy intake significantly improved weight
maintenance over a period of 3 months, although this may not be extended up to 12
months (23). In summary, high-protein acute and longer term diet manipulations are
associated with greater satiety and improved weight loss in adults. Very little is known
about how obese children respond to a high-protein, energy controlled diet and whether it
is associated with similar weight loss and satiety-enhancing properties.

6
We have recently reported the short-term benefits to overweight and obese children
attending a residential weight-loss camp (24). Over a period of 4 weeks these children
lost an average of 6.0kg, reduced their BMI by 2.4 kg.m-2 and BMI sds by 0.28.
However, we have also observed a significant increase in hunger and a decrease in
fullness over the course of the camp programme (25).
The residential weight-loss camp provides an opportunity to achieve good control over
variables that affect energy balance over a medium term period, whilst maintaining free
living conditions. Although the camp focus is on participation in a variety of physical
activities, children’s food intake is carefully controlled. As such, it is possible to alter the
nutrient profile of the food offered and increase the protein content of the diet. The aim
of the present study therefore was to compare the effect of a higher protein diet (22.5% of
total energy intake) with a standard protein diet (15% protein) on weight loss and hunger
and satiety in a controlled environment. It was hypothesized that children consuming the
higher protein diet would experience greater weight loss and improved satiety compared
with children consuming the standard diet.

7
Research Methods and Procedures
Subjects and study design
Subjects were 120 children attending the Carnegie International Camp, a residential
weight-loss camp for overweight and obese children in Leeds, England in 2004. Of
these, 22 children were excluded prior to randomisation (exclusion criteria included
learning disability and taking prescribed medication). There were 38 boys (mean age
14.0 ± 1.4 years) and 60 girls (14.4 ± 2.1 years) with an overall BMI of 33.1 ± 5.5 kg.m-2
(range 23.1 to 52.6 kg.m-2). Basal metabolic rate (BMR) for the sample was determined
from equations devised by Schofield (26). Children were assigned to one of four food
energy groups (1300, 1800, 2300 or 2800 kcal.day-1) based on their BMR. Participants
were randomised using a stratified block procedure (energy group, age, and duration of
stay) into one of the two diet groups (protein or standard) for the duration of their stay.
The duration of residence at the camp varied between 2 to 6 weeks (mean 29 days). Ten
children withdrew from the study before the end for reasons including homesickness,
illness, injury and family holidays. Due to incomplete data, 29 boys and 51 girls (mean
age 14.3 ± 2.0 years) were included in the analysis.
Children (aged 11 to 17 years) were accepted on to the program contingent on having a
BMI above the cut-off for overweight (27) and following a health screen by their family
physician.
8
Sixty-two children who had enrolled for a minimum of four weeks volunteered to
participate in the subjective appetite, mood and taste sensations part of the study. This
involved completing subjective ratings periodically during a day at baseline and four
weeks later. Children were trained how to complete subjective sensations. There were
incomplete appetite data for 12 children. Four had a fault with the electronic recording
device, 3 did not complete the recordings correctly and 5 left early (as reported above).
The study was granted Ethical Approval by the Leeds Metropolitan University Ethics
Committee. All children and parents gave written consent to participate in the study.
The dietary programme
The standard camp diet was 15% protein, 30% fat, 55% carbohydrate and followed the
food choice principles in the balance of good health (28). The high-protein study diet
comprised 22.5% protein, 30% fat and 47.5% carbohydrate. The composition of the diets
were designed by a Registered Dietitian. All meals were served by staff guided by the
Dietitian. Table 1 shows a sample menu for each dietary group. The aim of the dietary
intervention was to provide sufficient daily energy to meet the individual requirements of
each child based on their BMR, such that they could fully engage in all parts of the camp
programme. Children were not informed which energy group they were in or which diet
they had been allocated to. Children were observed during all meals to ensure they did
not abstain from eating and that they did not consume food other than that allocated to
them.

9
- Table 1 near here –
Programme and procedure
All children who attended the camp were residents in boarding school premises that
provided catering, residential, educational and high quality indoor and outdoor sports
facilities. All staff were housed on site throughout the summer period. The program aim
was to provide a safe, supportive environment where children could reduce their body
mass whilst having fun. In addition, a child centered approach was used that focused on
providing children with positive experiences and appropriate strategies which they could
continue when returning home.
Children were divided by age and sex into four groups for all aspects of the camp
program (9-14 and 15-18 year olds, girls and boys). The daily schedule of physical
activity combined a range of structured fun-type, skill-based activities consisting of six 1-
hour sessions each day: one aerobic (e.g. dance or aerobics), one water-based (e.g.
canoeing or swimming), two camper-choice sessions, and 2 games-based sessions (e.g.
netball or rugby). The aims of the physical activity sessions were to develop skills and
competence in a range of activities with enjoyment and choice being fundamental
components of this educational process. All activities were led by physical education
teachers and qualified sports coaches.

10
Children also took part in four educational sessions per week, conducted by the education
team at the camp. These covered issues such as changing food choices, maintaining
behaviour change and addressing bullying.
Body weight and composition
Body weight and stature were measured using standard apparatus and BMIs (kg.m-2)
calculated for each participant. BMI standard deviation scores (sds) were calculated
using the 1996 revision of the Child Growth Foundation’s growth reference programme
(29). Percentage body fat was assessed using air-displacement plethysmography (Life
Measurement Inc, Concord, CA) (30). Fat mass (FM) and fat free mass (FFM) were
derived from this assessment. This method is accurate, quick to use, non-invasive, and
has been shown to be valid in this population (31). Waist circumference was assessed
based on principles recommended by Lohman et al (32).
Blood pressure was measured using a mercury sphygmomanometer with diastolic
pressure recorded at the 5th phase of Korotkoff sounds.
Biochemistry
A sub-sample of 33 children (standard diet n=17, high-protein diet n=16) provided blood
samples. Fasting blood samples were drawn into fluoride oxalate, serum separator and
ethylene diamine tetra acetic acid (EDTA) BD Vacutainer™ tubes by venepuncture.
Appropriately qualified personnel undertook this procedure. The samples were then
11
transported to the Department of Chemical Pathology at Leeds General Infirmary. Data
reported below include total cholesterol, HDL, triglyceride and LDL.
Subjective appetite and mood
The Electronic Appetite Rating System (EARS) is an electronic method of measuring
subjective appetite in the free-living and laboratory using visual analogue scales (33).
The use of electronic VAS recording has been validated and is well established (34, 35).
The EARS has been used to monitor subjective states in laboratory based appetite studies
(36) and in clinical studies using renal patients (37, 38). The method uses a hand held
Psion organiser (Psion Plc, London, UK) to administer the VAS. The EARS
automatically quantifies and time stamps each subjective rating completed. Each child
completed their rating of the following states on 100mm scales ranging from ‘Not at all’
to ‘Extremely’: hunger, fullness, irritability, mental alertness, contentedness, tiredness
and meal palatability (end of meal only). The ratings were made immediately before and
after each of the three fixed meals (breakfast, lunch and dinner) and 2hr after each meal.
Therefore, participants made ratings at 9 time points across the day. These data are
expressed as diurnal ratings to demonstrate the temporal changes and as an area under the
curve (AUC) to provide a single day average for the whole day.
Procedure
Body weight was recorded at the start of camp and weekly thereafter. Height, body
composition, blood pressure, blood lipids and appetite and mood variables were recorded

12
prior to breakfast on the first and last days of each child’s stay. All assessments were
made by the same personnel and children wore bathing suits for measurements.
Statistical analysis
Data are reported as mean (±SD) and statistical analysis were performed by using SPSS
for WINDOWS software (version 12; SPSS Inc, Chicago, IL). Diet groups were
compared on all outcome measures at the start of the study. Analysis of variance, with
main effects of time and diet and group x time interaction were used with the main
outcome measures. Paired t-tests compared differences between means as a post-hoc test.
During preliminary analysis girls and boys’ responses were compared. There were no
main effects of sex and girls and boys data are not reported separately. Significance was
set at p ≤ 0.05.
13
Results
Anthropometric and biochemical outcomes
Overall, children had a BMI sds of 3.0 and 42% of their body weight was fat. There was
a significant main effect of time on all of the outcome measures apart from height (p<
0.05). However, there was no main effect of diet group or any time by diet group
interaction (p > 0.05). Combining all children from both diet groups, there was a
significant weight loss (5.3±2.8kg; p < 0.001), reductions in BMI sds (0.27±0.1; p <
0.001), % body fat (2.0±6.3%; p < 0.001), fat mass (3.8±5.4kg; p < 0.001), fat free mass
(1.5±5.3kg; p < 0.05) waist circumference (6.2±2.6cm; p < 0.001) and blood pressure
(systolic 5.4±8.2mmHg; p < 0.001, diastolic 5.7±8.6mmHg; p < 0.001; Table 2) and
improvement in all blood lipid measures (p < 0.01). It should be noted, however,
although not significant, there is a four-fold difference of fat free mass loss between the
standard and protein diet groups (2.4kg and 0.6kg respectively).
- Table 2 near here –
Subjective hunger and mood
Children who completed ratings of hunger and mood did not differ from the rest of the
sample in weight or body composition at baseline. ANOVA showed a significant
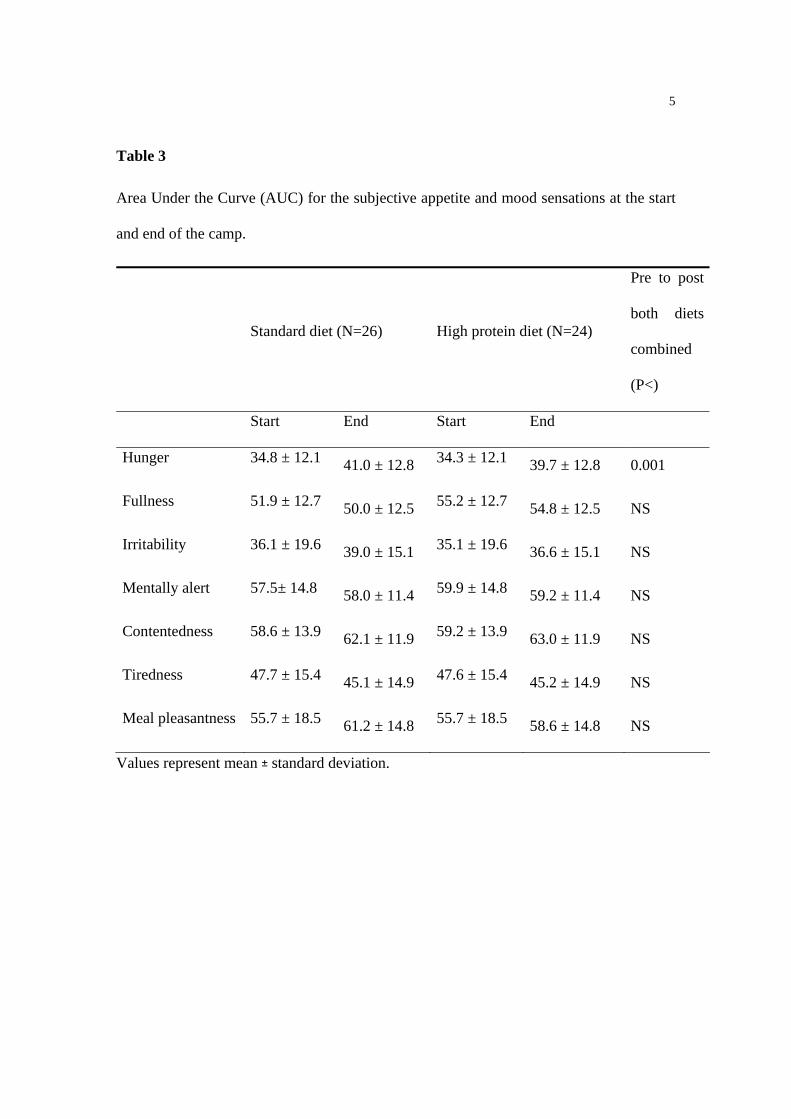
increase in AUC hunger at the end compared with the start of the camp in both diet
groups (p < 0.001; Table 3). However, neither fullness nor any of the mood ratings
14
differed significantly over the course of the camp (p > 0.05). There was no main effect of
diet group, or group by time interaction on the subjective sensations (p > 0.05).
- Table 3 near here –
Figure 1 represents the diurnal profile of subjective hunger across the day at the start and
end of camp for the two diet groups pooled. Children rated hunger at the end of camp
significantly higher at breakfast, mid-morning and after lunch (p < 0.05). There were no
differences observed from dinner time into the evening.
- Figure 1 near here -
There was no significant time by diet interaction in palatability of the two diets indicated
by the perceived tastiness ratings (p = 0.33) (55.7±18.5 start camp, 61.2±14.8 end camp;
55.7 ±18.5 start camp, 58.6±14.8 end camp for standard and high-protein diet
respectively). In general both diets were relatively palatable. .

15
Discussion
This study has shown that a 50% increase in daily energy intake provided by protein had
no significant impact on changes in body weight, body composition, appetite, mood or
perceived palatability. Regardless of the protein composition of their diet, these children
lost similar amounts of weight, derived similar physiological benefit, and experienced
similar changes in motivation to eat.
The absence of greater weight loss on high-protein diets is not without dispute. A review
of the literature concluded that there was no effect of high-protein intake on body fat loss
or body weight change during negative energy balance when energy intake was fixed,
regardless of whether the diets were ketogenic or non-ketogenic (16). However, our
results show that despite a non significant difference between groups the change in FFM
of the standard diet group was four times that of the change in FFM within the higher
protein group. These findings are supported by Layman et al. (39), who reported that
consuming a diet high in protein (30%) increased weight loss, increased loss of body fat
and minimised the loss of fat free mass. One of the only other studies involving children
or adolescents that we are aware of was a dietary intervention aimed at massively obese
11-16 year olds, which compared the effectiveness of diets differing in protein in a
boarding school environment over a period of a year (40). The children lost a large
amount of weight over this period but the high-protein diet did not influence weight
change or FFM change either during or after the intervention.
16
The menus provided in the present study and by Rolland-Cachera et al (40) resulted in
relatively modest differences in daily protein content (15 vs 22.5%, and 15 vs 19%,
respectively). The main strategy to increase dietary protein intake was by offering larger
portions of familiar higher protein foods in children’s usual meal plan, a difference that
went unnoticed by most participants. This contrasts with the literature on the effects of
single preloads or high-protein meals on satiety and subsequent energy intake (16). In
these studies, the high-protein preloads or meals averaged at over 50% of food energy in
the form of protein, a level sometimes achieved by supplementation or presenting the
preloads in liquid form. Their impact on hunger suppression and reduced food intake is
marked. It may be therefore that the proportion of dietary protein in longer-term studies
needs to be greater than 22% to impact on either satiety or weight loss. However, long-
term exposure to very high-protein diets is practically and financially challenging, and
has been argued as potentially unsafe. Interestingly, the Institute of Medicine (41) has
recently identified a normal protein intake range for children to be 10% - 30% of food
energy, while that for adults is 10% - 35%. A valuable future research objective would
be to look at the weight and hunger suppressing potential of long-term diets nearer the
upper level of this range.
Consistent with previous findings (25), the present study found an increase in rated
hunger over the duration of the camp. Therefore, although the appetite system was
unresponsive to differences in protein intake it showed sensitivity to prolonged negative
energy balance. This effect was apparent in the difference between start and end of camp
hunger ratings and in the diurnal profiles, most particularly during the early part of day.

17
A medium-term increase in hunger associated with weight loss has management
implications. Potentially, children could regain weight if the increase in hunger leads to a
compensatory increase in food intake. The motivation to eat consequences of a dietary
and exercise-induced weight loss needs to be considered. Especially in children returning
to their habitual, free-living environments. There is likely to be individual variation in
this increase but familiarity and coping with hunger during camp may prepare these
children for continued weight management when they return home. It also confirms that
obese individuals, like their lean counter-parts, show sensitivity in their appetite control
mechanisms (42).
The lack of measurement of ad libitum food intake did not provide the opportunity to
detect differences in food intake between the two dietary manipulations. Therefore, the
subjective appetite sensation measurements provided the only opportunity to detect an
increased satiating effect of the HP diet. Visual analogue scales have been shown to be
sensitive to acute manipulations in macronutrient composition (e.g. (43, 44)) and are
commonly used as a measure of satiety in the absence of ad libitum food intake.
Therefore, it is unlikely that the absence of a difference in subjective appetite sensations
between the two diets was due to the insensitivity of the measurement.
One important study limitation was some imprecision in monitoring the foods consumed
by individuals. This was inevitable given the cafeteria style presentation of meals and the
free-living nature of the intervention. It prevented, for example, the weighing of

18
individual plate waste. However, in the kitchen the food was prepared and served under
the guidance of a Dietitian who weighed out a portion of each meal on electronic scales
prior to the meals being served. Due to time constraints each meal could not be
individually weighed and therefore portion sizes were estimated from the pre-weighed
measures. In addition, the daily schedule was highly structured and left few opportunities
for children not to be engaged in similar activities (i.e. the camp programme prescribed
all activities included rest and relaxation within the 8 am to 10 pm programme).
Participants had little opportunity to buy food, being 20 minutes from the nearest shop,
and children were required to open posted packages in communal areas, preventing any
contraband.
In conclusion, this study has confirmed the capacity for a summer residential activity-
based camp to help overweight and obese children to lose weight. It also supports the
observation that prolonged negative energy balance is associated with an increase in
hunger motivation. However, randomising children to a high-protein diet failed either to
facilitate weight loss or to suppress hunger. Further work is warranted into whether
higher levels of dietary protein are feasible or effective in longer-term weight loss
interventions of this type.
Acknowledgements
This research was supported by a project grant from Glaxo Smith Kline, UK.

19

20
References
1. Summerbell CD, Ashton V, Campbell KJ, Edmunds L, Kelly S, Waters E. Interventions for treating obesity in children. Cochrane Database Syst Rev 2003:CD001872.
2. Barlow SE, Trowbridge FL, Klish WJ, Dietz WH. Treatment of child and adolescent obesity: reports from pediatricians, pediatric nurse practitioners, and registered dietitians. Pediatrics 2002;110:229-35.
3. Edmunds L, Waters E, Elliott EJ. Evidence based paediatrics: Evidence based management of childhood obesity. Bmj 2001;323:916-9.
4. Epstein LH, Valoski A, Wing RR, McCurley J. Ten-year outcomes of behavioral family-based treatment for childhood obesity. Health Psychol 1994;13:373-83.
5. Sondike SB, Copperman N, Jacobson MS. Effects of a low-carbohydrate diet on weight loss and cardiovascular risk factor in overweight adolescents. J Pediatr 2003;142:253-8.
6. Gutin B, Barbeau P, Owens S, et al. Effects of exercise intensity on cardiovascular fitness, total body composition, and visceral adiposity of obese adolescents. Am J Clin Nutr 2002;75:818-26.
7. Epstein LH, Paluch RA, Gordy CC, Dorn J. Decreasing sedentary behaviors in treating pediatric obesity. Arch Pediatr Adolesc Med 2000;154:220-6.
8. Delargy HJ, Burley VJ, O'Sullivan KR, Fletcher RJ, Blundell JE. Effects of different soluble: insoluble fibre ratios at breakfast on 24-h pattern of dietary intake and satiety. Eur J Clin Nutr 1995;49:754-66.
9. Green SM, Burley VJ, Blundell JE. Effect of fat- and sucrose-containing foods on the size of eating episodes and energy intake in lean males: potential for causing overconsumption. Eur J Clin Nutr 1994;48:547-55.
10. Lawton CL, Burley VJ, Wales JK, Blundell JE. Dietary fat and appetite control in obese subjects: weak effects on satiation and satiety. Int J Obes Relat Metab Disord 1993;17:409-16.
11. Hubert P, King NA, Blundell JE. Uncoupling the effects of energy expenditure and energy intake: appetite response to short-term energy deficit induced by meal omission and physical activity. Appetite 1998;31:9-19.
12. Weigle DS, Breen PA, Matthys CC, et al. A high-protein diet induces sustained reductions in appetite, ad libitum caloric intake, and body weight despite compensatory changes in diurnal plasma leptin and ghrelin concentrations. Am J Clin Nutr 2005;82:41-8.
13. Mikkelsen PB, Toubro S, Astrup A. Effect of fat-reduced diets on 24-h energy expenditure: comparisons between animal protein, vegetable protein, and carbohydrate. Am J Clin Nutr 2000;72:1135-41.

21
14. Rolls BJ, Kim-Harris S, Fischman MW, Foltin RW, Moran TH, Stoner SA. Satiety after preloads with different amounts of fat and carbohydrate: implications for obesity. Am J Clin Nutr 1994;60:476-87.
15. Rolls BJ. Carbohydrates, fats, and satiety. Am J Clin Nutr 1995;61:960S-967S.
16. Eisenstein J, Roberts SB, Dallal G, Saltzman E. High-protein weight-loss diets: are they safe and do they work? A review of the experimental and epidemiologic data. Nutr Rev 2002;60:189-200.
17. Stubbs RJ, van Wyk MC, Johnstone AM, Harbron CG. Breakfasts high in protein, fat or carbohydrate: effect on within-day appetite and energy balance. Eur J Clin Nutr 1996;50:409-17.
18. Westerterp-Plantenga MS, Lejeune MP, Nijs I, van Ooijen M, Kovacs EM. High protein intake sustains weight maintenance after body weight loss in humans. Int J Obes Relat Metab Disord 2004;28:57-64.
19. Baba NH, Sawaya S, Torbay N, Habbal Z, Azar S, Hashim SA. High protein vs high carbohydrate hypoenergetic diet for the treatment of obese hyperinsulinemic subjects. Int J Obes Relat Metab Disord 1999;23:1202-6.
20. Due A, Toubro S, Skov AR, Astrup A. Effect of normal-fat diets, either medium or high in protein, on body weight in overweight subjects: a randomised 1-year trial. Int J Obes Relat Metab Disord 2004;28:1283-90.
21. Parker B, Noakes M, Luscombe N, Clifton P. Effect of a high-protein, high-monounsaturated fat weight loss diet on glycemic control and lipid levels in type 2 diabetes. Diabetes Care 2002;25:425-30.
22. Layman DK, Boileau RA, Erickson DJ, et al. A reduced ratio of dietary carbohydrate to protein improves body composition and blood lipid profiles during weight loss in adult women. J Nutr 2003;133:411-7.
23. Foster GD, Wyatt HR, Hill JO, et al. A randomized trial of a low-carbohydrate diet for obesity. N Engl J Med 2003;348:2082-90.
24. Gately PJ, Cooke CB, Barth JH, Bewick BM, Radley D, Hill AJ. Children's residential weight-loss programs can work: a prospective cohort study of short-term outcomes for overweight and obese children. Pediatrics 2005;116:73-7.
25. King N, Hester J, Cooke CB, Gately PJ. Subjective appetite sensations are sensitive to a medium-term activity and diet induced energy deficit in obese children. Int. J. Ob., In press.
26. Schofield WN. Predicting basal metabolic rate, new standards and review of previous work. Hum Nutr Clin Nutr 1985;39 Suppl 1:5-41.
27. Cole TJ, Bellizzi MC, Flegal KM, Dietz WH. Establishing a standard definition for child overweight and obesity worldwide: international survey. Bmj 2000;320:1240-3.

22
28. Health Do. Dietary Reference Values for Food Energy and Nutrients for the United Kingdom. London: HMSO, 1991.
29. Foundation CG. Cross-sectional stature and weight reference curves for the U.K. Child Growth Foundation 1990.
30. Dempster P, Aitkens S. A new air displacement method for the determination of human body composition. Med Sci Sports Exerc 1995;27:1692-7.
31. Gately PJ, Radley D, Cooke CB, et al. Comparison of body composition methods in overweight and obese children. J Appl Physiol 2003;95:2039-46.
32. Lohman TG, Roche AF, Martorell R. Anthropometric Standardisation Reference Manual. Champaign: Human Kinetics, 1988.
33. King NA, Burley VJ, Blundell JE. Exercise-induced suppression of appetite: effects on food intake and implications for energy balance. Eur J Clin Nutr 1994;48:715-24.
34. Stubbs RJ, Hughes DA, Johnstone AM, et al. The use of visual analogue scales to assess motivation to eat in human subjects: a review of their reliability and validity with an evaluation of new hand-held computerized systems for temporal tracking of appetite ratings. Br J Nutr 2000;84:405-15.
35. Stratton RJ, Stubbs RJ, Hughes D, King N, Blundell JE, Elia M. Comparison of the traditional paper visual analogue scale questionnaire with an Apple Newton electronic appetite rating system (EARS) in free living subjects feeding ad libitum. Eur J Clin Nutr 1998;52:737-41.
36. King N, Lawton C, Delargy H, Smith F, Blundell J. The elctronic appetite rating system (EARS): a portable computerised method of continuous automated monitoring of motivation to eat and mood. In: Wellman P, Hoebel B, eds. Ingestive Behaviour Protocols, Society for the Study of Ingestive Behaviour., 1997:71-76.
37. Wright M, Woodrow G, O'Brien S, et al. Cholecystokinin and leptin: their influence upon the eating behaviour and nutrient intake of dialysis patients. Nephrol Dial Transplant 2004;19:133-40.
38. Wright M, Woodrow G, O'Brien S, et al. Polydipsia: a feature of peritoneal dialysis. Nephrol Dial Transplant 2004;19:1581-6.
39. Layman DK, Evans E, Baum JI, Seyler J, Erickson DJ, Boileau RA. Dietary protein and exercise have additive effects on body composition during weight loss in adult women. J Nutr 2005;135:1903-10.
40. Rolland-Cachera MF, Thibault H, Souberbielle JC, et al. Massive obesity in adolescents: dietary interventions and behaviours associated with weight regain at 2 y follow-up. Int J Obes Relat Metab Disord 2004;28:514-9.
41. Medicine Io. Dietary Reference Intakes for Energy, Carbohydrate, Fiber, Fat, Fatty Acids, Cholesterol, Protein, and Amino Acids Washington, DC: National Academies Press, 2005.
23
42. Hill AJ, Blundell JE. Comparison of the action of macronutrients on the expression of appetite in lean and obese human subjects. Annals of the New York Academy of Sciences 1990;575:529-531.
43. Teff KL, Young SN, Blundell JE. The effect of protein or carbohydrate breakfasts on subsequent plasma amino acid levels, satiety and nutrient selection in normal males. Pharmacol Biochem Behav 1989;34:829-37.
44. Hill AJ, Leathwood PD, Blundell JE. Some evidence for short-term caloric compensation in normal weight human subjects: the effects of high- and low-energy meals on hunger, food preference and food intake. Hum Nutr Appl Nutr 1987;41:244-57.

1
Table 1
Sample menus for the standard and high protein diets
Standard High protein
Breakfast
Bacon 2 rashers 3 rashers
Toast 2 slices 1 slice
Tomato 1 large 1 large
Fruit 1 piece 1 piece
Orange juice 1 glass 1 glass
Or
Cereal 1 small bowl 1 small bowl
Milk (s.skimmed) 1 ladle 1 ladle
Toast 1 slice - -
Margarine medium spread - -
Jam medium spread - -
Low calorie yoghurt - - 1 small pot
Mixed nuts - - 1 tablespoon
Fruit 1 piece 1 piece
Orange juice 1 glass 1 glass
Lunch
Jacket potato 1 medium ½ medium
Filling (cheese,

2
baked beans etc) 1 portion 2 portion
Salad small bowl small bowl
Low calorie yogurt 1 small pot 1 small pot
Or
Pitta bread 1 medium ½ medium
Filling (cheese,
ham etc 1 portion 2 portion
Salad small bowl small bowl
Low calorie yogurt 1 small pot 1 small pot
Dinner
Spaghetti small portion ½ small portion
Bolognaise 2 small ladles 3 small ladles
Fruit salad 1 bowl ½ bowl
Salad 1 small serving 1 small serving
Orange squash 1 glass 1 glass
Or
Rice 1 cup ½ cup
Vegetable curry 2 small ladles 3 small ladles
Salad 1 small serving 1 small serving
Fruit salad 1 bowl ½ bowl
Orange squash 1 glass 1 glass

3
Table 2
Subject characteristics: anthropometric, body composition and physiological measures at
the start and the end of camp.
Standard diet (N=39) High protein diet (N=41) Pre to post
both diets
combined (P<)
Start End Start End
Age (yrs) 14.4 ± 2.0 14.5 ± 2.0 14.1 ± 2.0 14.2 ± 2.0
Duration of stay (days) 27 ± 10 27 ± 9
Gender ratio (M:F) 12: 27 17: 24
Height (cm) 164.2 ± 7.8 164.3 ± 7.6 164.9 ± 10.6 165.1 ± 11.0 NS
Weight (kg) 93.9 ± 22.9 88.4 ± 21.6 85.6 ± 17.2 80.4 ± 15.9 0.001
BMI (kg.m-2) 34.5 ± 6.0 32.4 ± 5.8 31.3 ± 3.9 29.3 ± 3.5 0.001
BMI sds 3.10 ± 0.50 2.84 ± 0.58 2.83 ± 0.42 2.54 ± 0.44 0.001
% Fat 43.2 ± 7.5 42.6 ± 7.8 41.0 ± 6.3 37.7 ± 7.3 0.01
Fat mass (kg) 41.7 ± 16.3 38.5 ± 14.7 35.1 ± 9.0 30.6 ± 9.4 0.001
Fat free mass (kg) 52.3 ± 9.4 49.9 ± 10.0 50.4 ± 11.0 49.8 ± 10.1 0.05
Waist circumference (cm) 98.9 ± 13.1 92.5 ± 11.3 92.7 ± 8.8 87.4 ± 9.2 0.001
Systolic BP (mmHg) 114 ± 9 111 ± 10.0 113 ± 9 108 ± 8 0.001
Diastolic BP(mmHg) 67 ± 10 62 ± 7 64 ± 8 59 ± 6 0.001
Total cholesterol (mmol) 3.99 ± 0.73 3.25 ± 0.50 4.26 ± 0.79 3.40 ± 1.01 0.001
HDL (mmol) 1.15 ± 0.19 0.99 ± 0.17 1.14 ± 0.28 1.03 ± 0.23 0.01
Triglycerides (mmol) 0.82 ± 0.40 0.78 ± 0.28 1.05 ± 0.52 0.83 ± 0.31 0.01
4
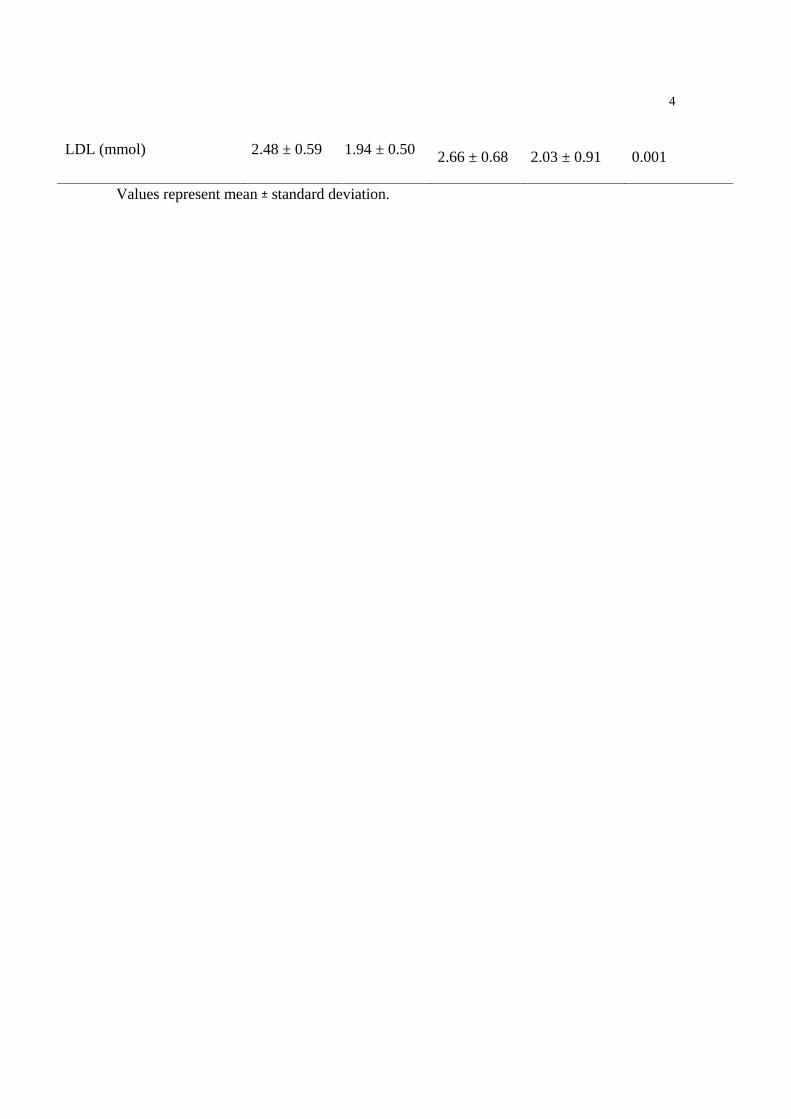
LDL (mmol) 2.48 ± 0.59 1.94 ± 0.50 2.66 ± 0.68 2.03 ± 0.91 0.001
Values represent mean ± standard deviation.
5
Table 3
Area Under the Curve (AUC) for the subjective appetite and mood sensations at the start
and end of the camp.
Standard diet (N=26) High protein diet (N=24)
Pre to post
both diets
combined
(P<)
Start End Start End
Hunger 34.8 ± 12.1 41.0 ± 12.8 34.3 ± 12.1 39.7 ± 12.8 0.001
Fullness 51.9 ± 12.7 50.0 ± 12.5 55.2 ± 12.7 54.8 ± 12.5 NS
Irritability 36.1 ± 19.6 39.0 ± 15.1 35.1 ± 19.6 36.6 ± 15.1 NS
Mentally alert 57.5± 14.8 58.0 ± 11.4 59.9 ± 14.8 59.2 ± 11.4 NS
Contentedness 58.6 ± 13.9 62.1 ± 11.9 59.2 ± 13.9 63.0 ± 11.9 NS
Tiredness 47.7 ± 15.4 45.1 ± 14.9 47.6 ± 15.4 45.2 ± 14.9 NS
Meal pleasantness 55.7 ± 18.5 61.2 ± 14.8 55.7 ± 18.5 58.6 ± 14.8 NS
Values represent mean ± standard deviation.

mid-evening
post-dinner
pre-dinner
mid-afternoon
post-lunch
pre-lunch
mid-morning
post-breakfast
pre-breakfast
Timepoint
60
50
40
30
20
10
Hun
ger r
atin
gs (m
m)
End campStart camp
* ** * *
Figure 1. The diurnal profile of hunger ratings at the start and end of camp.
* indicates significant start-end camp differences at individual time points (p<0.05).