FOSTERING TEENAGERS’ COGNITIVE SKILLS THROUGH THE IMPLEMENTATION OF READING TASKS. project proposal
Human Movement Science 30 (2011) 115–124
Contents lists available at ScienceDirect
Human Movement Science
journal homepage: www.elsevier .com/locate/humov
Effect of stride frequency on the energy cost of walkingin obese teenagers
Anne Delextrat a,⇑, Dionne Matthew a, Daniel D. Cohen a, Jeanick Brisswalter b
a Faculty of Life Sciences, London Metropolitan University, London, UKb Laboratory of Human Motricity, Education and Health University of Nice Sophia Antipolis, France
a r t i c l e i n f o a b s t r a c t
Article history:Available online 18 December 2010
PsycINFO classification:3300
Keywords:Preferred frequencyHarmonic oscillatorExcess body fatExternal and internal mechanical workBalance
0167-9457/$ - see front matter � 2010 Elsevier B.doi:10.1016/j.humov.2010.10.004
⇑ Corresponding author. Address: Faculty of LifeLondon, UK. Tel.: +44(0)20 7133 4686; fax: +44(0)
E-mail address: [email protected] (A
The aim of this study was to compare the energy cost of obese andnon-obese teenagers while walking at their preferred speed anddifferent stride frequencies. Twelve obese and twelve non-obeseteenagers walked continuously on the treadmill at their most com-fortable speed for 6 periods of 4 min each. Each period corre-sponded to a specific stride frequency: preferred (PSF), force-driven harmonic oscillator (FDHO), PSF + 10%, PSF + 20%, PSF � 10%and PSF � 20%. Cardiorespiratory parameters were collectedbetween the 3rd and 4th minute of each stage, and used to calcu-late the energy cost of walking (EC). The main results showed a sig-nificantly higher cost of walking expressed relative to lean bodymass. In addition, a U-shaped relationship between EC and stridefrequency was shown in both groups, with PSF and FDHO leadingto a significantly lower value compared to all other frequencies.This showed first, that FDHO is a good predictor of PSF and minimalenergy cost of walking in both groups, and second, that excessbody fat does not affect the relationship between energy expendi-ture and stride frequency. Walking at lower or higher than pre-ferred frequencies could be used as an exercise mode to promoteweight loss in obese teenagers.
� 2010 Elsevier B.V. All rights reserved.
V. All rights reserved.
Sciences, London Metropolitan University, 166-220 Holloway Road, N7 8DB20 7133 4149.. Delextrat).
116 A. Delextrat et al. / Human Movement Science 30 (2011) 115–124
1. Introduction
Childhood obesity, considered by many to be an ‘‘epidemic’’ in Western countries, has increased inUK from 11.2% in 1995 to 16.5% in 2003 among children aged 8–10 years old (Ali et al., 2006). It is welldocumented that obese children are more likely to become obese adults (Whitaker, Wright, Pepe, Sei-del, & Dietz, 1997). Therefore it is important to address this issue at childhood to prevent future healthrisks.
Most research done to date to characterize obese individuals or test the effectiveness of traininginterventions has mainly focused on maximal oxygen consumption (VO2max) (e.g., Ekelund, Franks,Wareham, & Aman, 2004). However, obese subjects do not usually exercise at high intensities. There-fore measuring oxygen consumption during submaximal exercises seems more applicable to the typeof daily activities experienced by this population (Holt, Jeng, Ratcliffe, & Hamill, 1995). In particular,the energy cost of walking, defined as the rate of oxygen consumption per unit of distance, has beensuggested as a relevant parameter to compare obese and non-obese subjects (Browning & Kram,2005).
Body mass is one of the main factors evoked in the literature to affect the energy cost of walkingat a freely selected gait, with obese individuals having larger energy costs than lean subjects (Fosteret al., 1995; Melanson et al., 2003). Another crucial variable is the combination of stride frequencyand stride length (e.g., Saibene & Minetti, 2003). Generally, a U-shaped relationship is reported be-tween the energy cost of walking and stride frequency in lean individuals, with the lowest energycost being reached at the frequency spontaneously adopted by the subjects (Preferred Stride Fre-quency, PSF; Holt, Hamill, & Andres, 1991; Jeng, Liao, Lai, & Hou, 1997). In adults walking at a con-stant speed, an increase in oxygen consumption of 18%, was observed when the stride frequency wasraised by 15 cycles min�1 above PSF, while an equivalent decrease in stride frequency below PSF letto a significantly higher metabolic cost (+46%) (Holt et al., 1991). However, in children and teenagersfrom 7 to 12 years old, a similar increase in the physiological cost of walking, defined as the heartrate per unit of distance was reported at frequencies 25% above and below PSF (Jeng et al., 1997).To our knowledge, there is no such study on obese populations. Assessing the relationship betweenstride frequency and energy cost of walking in obese subjects is essential for two reasons. First, iftheir energy cost is not minimized at PSF, it means that they do not follow the principle of ‘‘self-optimization’’, stating that humans spontaneously adopt particular movement patterns because theyreduce the energy cost of the system according to the constraints of the task and the environment(Wilke, 1977). If this is the case, strategies could be elaborated to modify this behavior and reducethe potential stress and discomfort experienced during daily activities. Second, if a particular com-bination of stride length-frequency largely increased the energy cost of walking, it could be use topromote weight loss. Indeed, walking is often thought as a convenient exercise mode for obesesubjects because it is less stressful than running and involves a larger muscle mass than cycling(Browning & Kram, 2005).
Holt, Hamill, and Andres (1990) suggested that the preferred walking period (PSP, inverse of PSF)could be predicted as the resonant period of a force-driven harmonic oscillator (FDHO), calculatedfrom the subject’s lower limb dimensions. Walking at the resonant period is thought to minimize en-ergy expenditure because it requires less muscle forces to maintain gait and possibly less mechanicalwork required by body segments (Holt et al., 1990). This model was validated on lean adults and leanchildren aged from 3 to 12 years old, with no significant difference observed between the energyexpenditure when walking at the preferred and predicted frequencies (Holt et al., 1991; Jeng et al.,1997). However, Malina and Bouchard (1991) highlighted that the sensitivity of children and teenag-ers to the resonant frequency was likely to be altered by the changes in body form taking place duringgrowth, reflecting in particular the distribution of subcutaneous body fat and development of muscletissue. Within this context, investigating the relationship between PSF and FDHO in obese teenagerswould add some information in the validation process of the resonant frequency model for differentpopulations.
Therefore, the objective of this study was to compare the energy cost of obese and non-obese teen-agers while walking at their preferred speed and different stride frequencies. A secondary aim was toassess if the FDHO was accurate at predicting the minimal energy cost of walking in obese teenagers.
A. Delextrat et al. / Human Movement Science 30 (2011) 115–124 117
2. Methods
2.1. Subjects
Twenty-four subjects between 12 and 16 years of age volunteered to take part in this study. Theywere divided into two groups: obese (8 boys and 4 girls) and non-obese (7 boys and 5 girls) based ontheir body mass index (BMI) from the UK 1990 percentile charts (Cole, Freeman, & Preece, 1995).According to these charts, obesity was defined by a BMI above the 98th percentile (Reilly, Wilson,Summerbell, & Wilson, 2002). Obese teenagers were recruited from a leisure center in East London(UK) where they were due to start a weight loss program the following month, while non-obese sub-jects were pupils of three different secondary schools from the same area. Subjects and their parentsor legal guardians were fully informed of any risk and stresses associated with the study before givingwritten consent. None of the subjects suffered from any musculo-skeletal condition that could inter-fere with normal gait patterns. In addition, they were required to record their previous medical historyto ensure they did not have any major disease through the PedsQL 4.0 Health Status Evaluation Ques-tionnaire (Varni, Burwinkle, & Seid, 2006). All experimental procedures were approved by the localethical committee (London Metropolitan University, UK).
2.2. Procedures
Each subject came to the laboratory on two separate occasions. The first visit was used to collectanthropometric data, while establishing familiarization with the treadmill and preferred walkingspeed. Height (m) was recorded with a portable stadiometer (Seca, Marsden, UK) with subjects stand-ing in bare feet. Thigh length (cm) was measured from the greater trochanter to the lateral condyle ofthe knee, shank length (cm) from the lateral condyle to the lateral malleolus, and foot length (cm)from the lateral malleolus to the head of the fifth metatarsal. These measurements were obtainedon the right side of the body. Body mass (kg) and body fat percentage (BF, %) of the whole body, rightand left arms, right and left legs and trunk were measured using the Tanita BC-418MA Segmental BodyComposition Analyzer (Tanita Corporation, Tokyo, Japan). BMI was calculated as body mass (kg)/height2 (m). Then subjects were asked to walk on the treadmill and to instruct the experimentalistto increase or decrease the speed until their most comfortable speed (m s�1) was found. To ensure thattheir choice was consistent, the experimentalist increased and decreased the treadmill speed withoutgiving any feedback to the subjects, and they were asked to choose their most comfortable speedagain. This procedure was repeated when necessary until the subject was consistent for three consec-utive trials. When this pace was achieved, walking speed (m min�1) was recorded as well as the cor-responding stride frequency (PSF, cycles min�1), defined as the reciprocal of the period of heel strike ofone foot to the next heel strike of the same foot (preferred stride period, PSP, s). Heel strike was mea-sured as the first contact of heel with the treadmill and stride length was calculated from the relation-ship between speed and frequency (speed = stride length � stride frequency). From theanthropometric measurements collected, the predicted stride frequency (FDHO, cycles min�1), definedas the resonant frequency predicted as the minimum cost to maintain the motion of a force-drivenharmonic oscillator, was calculated. The equation used for this calculation is based on the predictedstride period (s), according to the following formula:
s ¼ 2pffiffiffiffiffiffiffiffiffiffiffiL=2g
p
where p = 3.1416, g = 9.81 m s�1, and L = simple pendulum equivalent length, calculated from thethigh, shank and foot (these segments were assumed to be a single rigid body attached at the hip bya frictionless pin joint). The simple pendulum calculation is as follows (Kugler, Kelso, & Turvey, 1982):
L ¼ Isys=Msys � Dsys
where Isys and Msys are respectively the moment of inertia and mass of the lower extremity, and Dsys isthe distance from the greater trochanter to the center of mass of the lower extremity. The modelunderlying all these calculations has been described in detail by Holt et al. (1990).
118 A. Delextrat et al. / Human Movement Science 30 (2011) 115–124
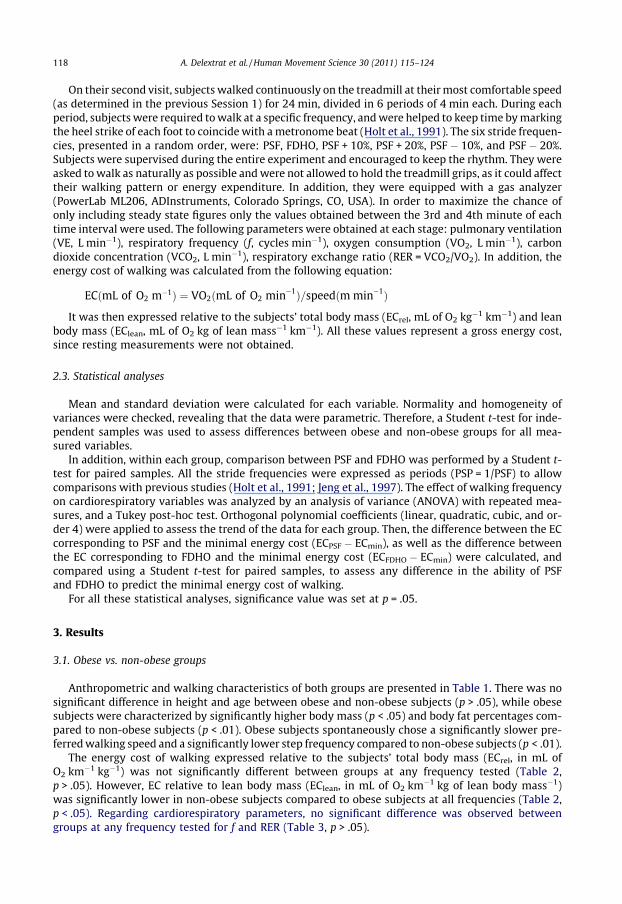
On their second visit, subjects walked continuously on the treadmill at their most comfortable speed(as determined in the previous Session 1) for 24 min, divided in 6 periods of 4 min each. During eachperiod, subjects were required to walk at a specific frequency, and were helped to keep time by markingthe heel strike of each foot to coincide with a metronome beat (Holt et al., 1991). The six stride frequen-cies, presented in a random order, were: PSF, FDHO, PSF + 10%, PSF + 20%, PSF � 10%, and PSF � 20%.Subjects were supervised during the entire experiment and encouraged to keep the rhythm. They wereasked to walk as naturally as possible and were not allowed to hold the treadmill grips, as it could affecttheir walking pattern or energy expenditure. In addition, they were equipped with a gas analyzer(PowerLab ML206, ADInstruments, Colorado Springs, CO, USA). In order to maximize the chance ofonly including steady state figures only the values obtained between the 3rd and 4th minute of eachtime interval were used. The following parameters were obtained at each stage: pulmonary ventilation(VE, L min�1), respiratory frequency (f, cycles min�1), oxygen consumption (VO2, L min�1), carbondioxide concentration (VCO2, L min�1), respiratory exchange ratio (RER = VCO2/VO2). In addition, theenergy cost of walking was calculated from the following equation:
ECðmL of O2 m�1Þ ¼ VO2ðmL of O2 min�1Þ=speedðm min�1Þ
It was then expressed relative to the subjects’ total body mass (ECrel, mL of O2 kg�1 km�1) and leanbody mass (EClean, mL of O2 kg of lean mass�1 km�1). All these values represent a gross energy cost,since resting measurements were not obtained.
2.3. Statistical analyses
Mean and standard deviation were calculated for each variable. Normality and homogeneity ofvariances were checked, revealing that the data were parametric. Therefore, a Student t-test for inde-pendent samples was used to assess differences between obese and non-obese groups for all mea-sured variables.
In addition, within each group, comparison between PSF and FDHO was performed by a Student t-test for paired samples. All the stride frequencies were expressed as periods (PSP = 1/PSF) to allowcomparisons with previous studies (Holt et al., 1991; Jeng et al., 1997). The effect of walking frequencyon cardiorespiratory variables was analyzed by an analysis of variance (ANOVA) with repeated mea-sures, and a Tukey post-hoc test. Orthogonal polynomial coefficients (linear, quadratic, cubic, and or-der 4) were applied to assess the trend of the data for each group. Then, the difference between the ECcorresponding to PSF and the minimal energy cost (ECPSF � ECmin), as well as the difference betweenthe EC corresponding to FDHO and the minimal energy cost (ECFDHO � ECmin) were calculated, andcompared using a Student t-test for paired samples, to assess any difference in the ability of PSFand FDHO to predict the minimal energy cost of walking.
For all these statistical analyses, significance value was set at p = .05.
3. Results
3.1. Obese vs. non-obese groups
Anthropometric and walking characteristics of both groups are presented in Table 1. There was nosignificant difference in height and age between obese and non-obese subjects (p > .05), while obesesubjects were characterized by significantly higher body mass (p < .05) and body fat percentages com-pared to non-obese subjects (p < .01). Obese subjects spontaneously chose a significantly slower pre-ferred walking speed and a significantly lower step frequency compared to non-obese subjects (p < .01).
The energy cost of walking expressed relative to the subjects’ total body mass (ECrel, in mL ofO2 km�1 kg�1) was not significantly different between groups at any frequency tested (Table 2,p > .05). However, EC relative to lean body mass (EClean, in mL of O2 km�1 kg of lean body mass�1)was significantly lower in non-obese subjects compared to obese subjects at all frequencies (Table 2,p < .05). Regarding cardiorespiratory parameters, no significant difference was observed betweengroups at any frequency tested for f and RER (Table 3, p > .05).
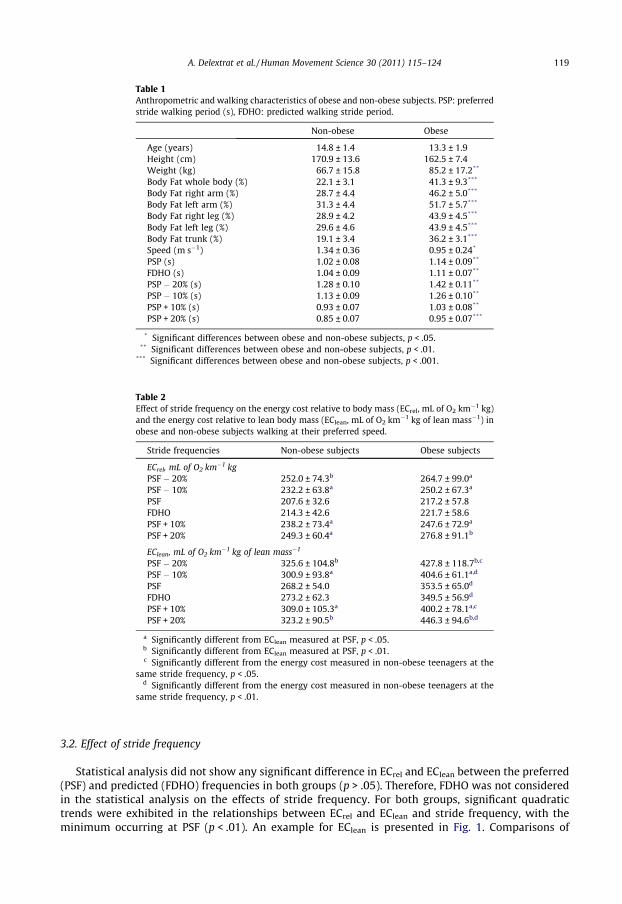
Table 1Anthropometric and walking characteristics of obese and non-obese subjects. PSP: preferredstride walking period (s), FDHO: predicted walking stride period.
Non-obese Obese
Age (years) 14.8 ± 1.4 13.3 ± 1.9Height (cm) 170.9 ± 13.6 162.5 ± 7.4Weight (kg) 66.7 ± 15.8 85.2 ± 17.2**
Body Fat whole body (%) 22.1 ± 3.1 41.3 ± 9.3***
Body Fat right arm (%) 28.7 ± 4.4 46.2 ± 5.0***
Body Fat left arm (%) 31.3 ± 4.4 51.7 ± 5.7***
Body Fat right leg (%) 28.9 ± 4.2 43.9 ± 4.5***
Body Fat left leg (%) 29.6 ± 4.6 43.9 ± 4.5***
Body Fat trunk (%) 19.1 ± 3.4 36.2 ± 3.1***
Speed (m s�1) 1.34 ± 0.36 0.95 ± 0.24*
PSP (s) 1.02 ± 0.08 1.14 ± 0.09**
FDHO (s) 1.04 ± 0.09 1.11 ± 0.07**
PSP � 20% (s) 1.28 ± 0.10 1.42 ± 0.11**
PSP � 10% (s) 1.13 ± 0.09 1.26 ± 0.10**
PSP + 10% (s) 0.93 ± 0.07 1.03 ± 0.08**
PSP + 20% (s) 0.85 ± 0.07 0.95 ± 0.07***
* Significant differences between obese and non-obese subjects, p < .05.** Significant differences between obese and non-obese subjects, p < .01.
*** Significant differences between obese and non-obese subjects, p < .001.
Table 2Effect of stride frequency on the energy cost relative to body mass (ECrel, mL of O2 km�1 kg)and the energy cost relative to lean body mass (EClean, mL of O2 km�1 kg of lean mass�1) inobese and non-obese subjects walking at their preferred speed.
Stride frequencies Non-obese subjects Obese subjects
ECrel, mL of O2 km�1 kgPSF � 20% 252.0 ± 74.3b 264.7 ± 99.0a
PSF � 10% 232.2 ± 63.8a 250.2 ± 67.3a
PSF 207.6 ± 32.6 217.2 ± 57.8FDHO 214.3 ± 42.6 221.7 ± 58.6PSF + 10% 238.2 ± 73.4a 247.6 ± 72.9a
PSF + 20% 249.3 ± 60.4a 276.8 ± 91.1b
EClean, mL of O2 km�1 kg of lean mass�1
PSF � 20% 325.6 ± 104.8b 427.8 ± 118.7b,c
PSF � 10% 300.9 ± 93.8a 404.6 ± 61.1a,d
PSF 268.2 ± 54.0 353.5 ± 65.0d
FDHO 273.2 ± 62.3 349.5 ± 56.9d
PSF + 10% 309.0 ± 105.3a 400.2 ± 78.1a,c
PSF + 20% 323.2 ± 90.5b 446.3 ± 94.6b,d
a Significantly different from EClean measured at PSF, p < .05.b Significantly different from EClean measured at PSF, p < .01.c Significantly different from the energy cost measured in non-obese teenagers at the
same stride frequency, p < .05.d Significantly different from the energy cost measured in non-obese teenagers at the
same stride frequency, p < .01.
A. Delextrat et al. / Human Movement Science 30 (2011) 115–124 119
3.2. Effect of stride frequency
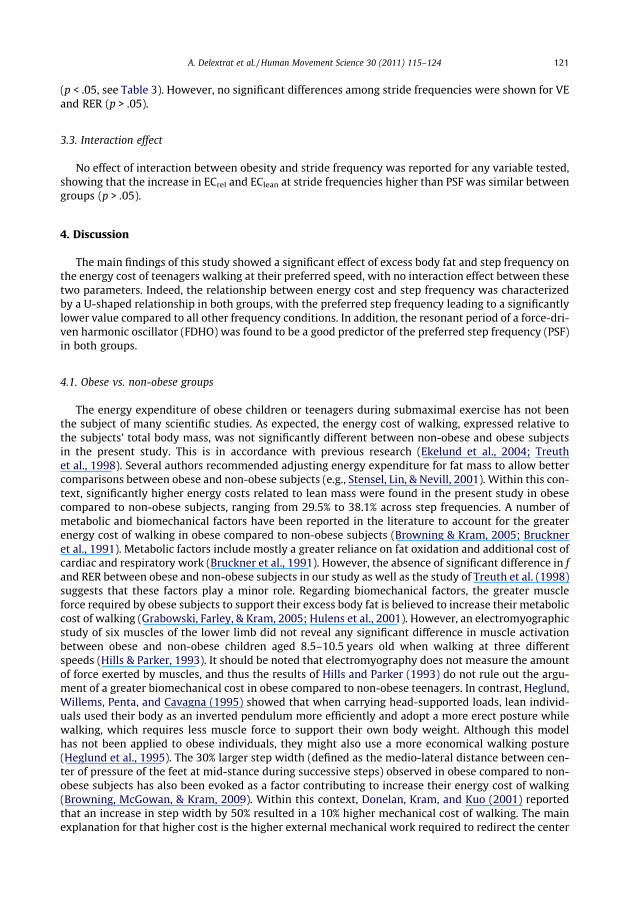
Statistical analysis did not show any significant difference in ECrel and EClean between the preferred(PSF) and predicted (FDHO) frequencies in both groups (p > .05). Therefore, FDHO was not consideredin the statistical analysis on the effects of stride frequency. For both groups, significant quadratictrends were exhibited in the relationships between ECrel and EClean and stride frequency, with theminimum occurring at PSF (p < .01). An example for EClean is presented in Fig. 1. Comparisons of
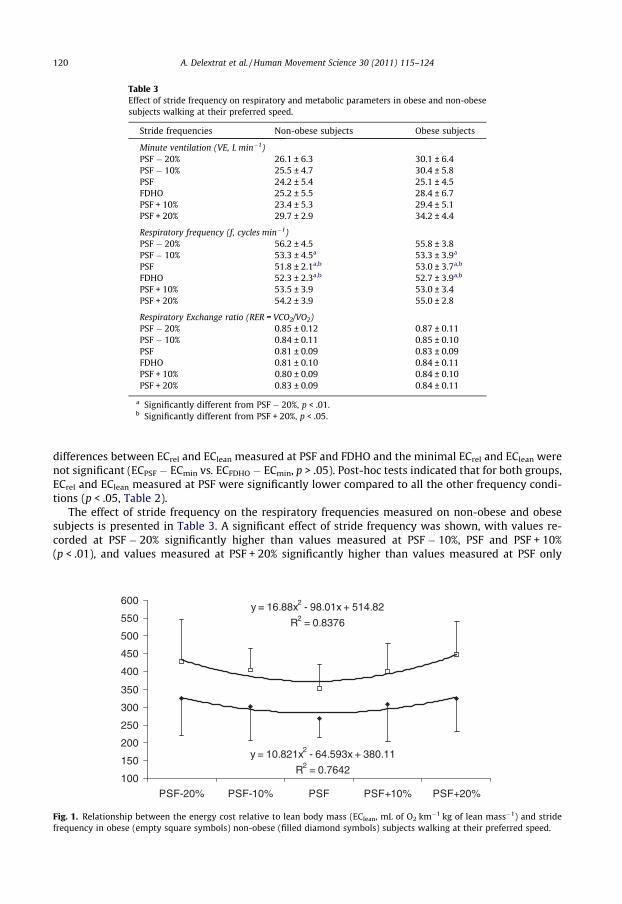
Table 3Effect of stride frequency on respiratory and metabolic parameters in obese and non-obesesubjects walking at their preferred speed.
Stride frequencies Non-obese subjects Obese subjects
Minute ventilation (VE, L min�1)PSF � 20% 26.1 ± 6.3 30.1 ± 6.4PSF � 10% 25.5 ± 4.7 30.4 ± 5.8PSF 24.2 ± 5.4 25.1 ± 4.5FDHO 25.2 ± 5.5 28.4 ± 6.7PSF + 10% 23.4 ± 5.3 29.4 ± 5.1PSF + 20% 29.7 ± 2.9 34.2 ± 4.4
Respiratory frequency (f, cycles min�1)PSF � 20% 56.2 ± 4.5 55.8 ± 3.8PSF � 10% 53.3 ± 4.5a 53.3 ± 3.9a
PSF 51.8 ± 2.1a,b 53.0 ± 3.7a,b
FDHO 52.3 ± 2.3a,b 52.7 ± 3.9a,b
PSF + 10% 53.5 ± 3.9 53.0 ± 3.4PSF + 20% 54.2 ± 3.9 55.0 ± 2.8
Respiratory Exchange ratio (RER = VCO2/VO2)PSF � 20% 0.85 ± 0.12 0.87 ± 0.11PSF � 10% 0.84 ± 0.11 0.85 ± 0.10PSF 0.81 ± 0.09 0.83 ± 0.09FDHO 0.81 ± 0.10 0.84 ± 0.11PSF + 10% 0.80 ± 0.09 0.84 ± 0.10PSF + 20% 0.83 ± 0.09 0.84 ± 0.11
a Significantly different from PSF � 20%, p < .01.b Significantly different from PSF + 20%, p < .05.
120 A. Delextrat et al. / Human Movement Science 30 (2011) 115–124
differences between ECrel and EClean measured at PSF and FDHO and the minimal ECrel and EClean werenot significant (ECPSF � ECmin vs. ECFDHO � ECmin, p > .05). Post-hoc tests indicated that for both groups,ECrel and EClean measured at PSF were significantly lower compared to all the other frequency condi-tions (p < .05, Table 2).
The effect of stride frequency on the respiratory frequencies measured on non-obese and obesesubjects is presented in Table 3. A significant effect of stride frequency was shown, with values re-corded at PSF � 20% significantly higher than values measured at PSF � 10%, PSF and PSF + 10%(p < .01), and values measured at PSF + 20% significantly higher than values measured at PSF only
y = 16.88x2 - 98.01x + 514.82
R2 = 0.8376
y = 10.821x2 - 64.593x + 380.11
R2 = 0.7642100
150
200
250
300
350
400
450
500
550
600
PSF-20% PSF-10% PSF PSF+10% PSF+20%
Fig. 1. Relationship between the energy cost relative to lean body mass (EClean, mL of O2 km�1 kg of lean mass�1) and stridefrequency in obese (empty square symbols) non-obese (filled diamond symbols) subjects walking at their preferred speed.
A. Delextrat et al. / Human Movement Science 30 (2011) 115–124 121
(p < .05, see Table 3). However, no significant differences among stride frequencies were shown for VEand RER (p > .05).
3.3. Interaction effect
No effect of interaction between obesity and stride frequency was reported for any variable tested,showing that the increase in ECrel and EClean at stride frequencies higher than PSF was similar betweengroups (p > .05).
4. Discussion
The main findings of this study showed a significant effect of excess body fat and step frequency onthe energy cost of teenagers walking at their preferred speed, with no interaction effect between thesetwo parameters. Indeed, the relationship between energy cost and step frequency was characterizedby a U-shaped relationship in both groups, with the preferred step frequency leading to a significantlylower value compared to all other frequency conditions. In addition, the resonant period of a force-dri-ven harmonic oscillator (FDHO) was found to be a good predictor of the preferred step frequency (PSF)in both groups.
4.1. Obese vs. non-obese groups
The energy expenditure of obese children or teenagers during submaximal exercise has not beenthe subject of many scientific studies. As expected, the energy cost of walking, expressed relative tothe subjects’ total body mass, was not significantly different between non-obese and obese subjectsin the present study. This is in accordance with previous research (Ekelund et al., 2004; Treuthet al., 1998). Several authors recommended adjusting energy expenditure for fat mass to allow bettercomparisons between obese and non-obese subjects (e.g., Stensel, Lin, & Nevill, 2001). Within this con-text, significantly higher energy costs related to lean mass were found in the present study in obesecompared to non-obese subjects, ranging from 29.5% to 38.1% across step frequencies. A number ofmetabolic and biomechanical factors have been reported in the literature to account for the greaterenergy cost of walking in obese compared to non-obese subjects (Browning & Kram, 2005; Bruckneret al., 1991). Metabolic factors include mostly a greater reliance on fat oxidation and additional cost ofcardiac and respiratory work (Bruckner et al., 1991). However, the absence of significant difference in fand RER between obese and non-obese subjects in our study as well as the study of Treuth et al. (1998)suggests that these factors play a minor role. Regarding biomechanical factors, the greater muscleforce required by obese subjects to support their excess body fat is believed to increase their metaboliccost of walking (Grabowski, Farley, & Kram, 2005; Hulens et al., 2001). However, an electromyographicstudy of six muscles of the lower limb did not reveal any significant difference in muscle activationbetween obese and non-obese children aged 8.5–10.5 years old when walking at three differentspeeds (Hills & Parker, 1993). It should be noted that electromyography does not measure the amountof force exerted by muscles, and thus the results of Hills and Parker (1993) do not rule out the argu-ment of a greater biomechanical cost in obese compared to non-obese teenagers. In contrast, Heglund,Willems, Penta, and Cavagna (1995) showed that when carrying head-supported loads, lean individ-uals used their body as an inverted pendulum more efficiently and adopt a more erect posture whilewalking, which requires less muscle force to support their own body weight. Although this modelhas not been applied to obese individuals, they might also use a more economical walking posture(Heglund et al., 1995). The 30% larger step width (defined as the medio-lateral distance between cen-ter of pressure of the feet at mid-stance during successive steps) observed in obese compared to non-obese subjects has also been evoked as a factor contributing to increase their energy cost of walking(Browning, McGowan, & Kram, 2009). Within this context, Donelan, Kram, and Kuo (2001) reportedthat an increase in step width by 50% resulted in a 10% higher mechanical cost of walking. The mainexplanation for that higher cost is the higher external mechanical work required to redirect the center
122 A. Delextrat et al. / Human Movement Science 30 (2011) 115–124
of mass during step-to-step transition (Donelan et al., 2001). However, step width was not measuredin the present study.
4.2. Effect of stride frequency
The first major observation of our investigation regarding stride frequency was the absence of a sig-nificant difference between PSF and FDHO in both groups (p > .05, see Table 1). This is in accordancewith two previous studies undertaken on lean adults and children, and suggests that the predictabilityof subjects’ preferred walking step frequency from the resonance model could also be applied to obeseteenagers (Holt et al., 1991; Jeng et al., 1997). In other words, this study shows that in contrast to thehypothesis of Malina and Bouchard (1991), the sensitivity of obese teenagers to the resonant fre-quency was not different from lean teenagers, despite the different fat distributions in these two pop-ulations. Similar oxygen consumptions and heart rates per unit of distance have been reportedbetween PSF and FDHO in previous studies on lean individuals, which was similar to our results (Holtet al., 1991; Jeng et al., 1997). In addition, a similar U-shaped relationship between the energy cost ofwalking and step frequency was observed in obese and non-obese teenagers in the present study, withthe minimal cost occurring at PSF or FDHO and increases or decreases in stride frequencies by thesame amount leading to similar increases in energy costs. This shows that obese teenagers followthe principle of ‘‘self-optimization’’ evoked by Wilke (1977). The absence of an interaction effect be-tween groups suggests that excess body fat does not affect the relationship between step frequencyand energy expenditure while walking. These results are similar to those obtained by Jeng et al.(1997) on children, teenagers and adults when stride frequency was manipulated above and belowPSF by 25%. However, Holt et al. (1991) showed a significantly greater increase in the oxygen con-sumption of lean adults when their step frequency was decreased by 15 steps min�1 below PSF, com-pared to a rise in step frequency of the same amount (differences between PSF and PSF � 15steps min�1 and PSF and PSF + 15 steps min�1 of 46% and 18%, respectively). These discrepanciesmight be related to the age of the subjects (teenagers vs. adults) or to the different magnitudes ofchange above and below PSF used in these investigations.
Several biomechanical and metabolic factors have been suggested in the literature to explain thegreater costs of walking at low as well as high frequencies, they will be examined in the followingparagraphs, with particular reference to obese subjects.
Several authors have reported that when walking with long steps (low step frequency), the greatervertical oscillations of the center of mass increased the external mechanical work necessary to movethe body’s center of mass (Donelan et al., 2001; Holt et al., 1991).
Another disadvantage of walking at low step frequencies is that it decreases the possibility to takeadvantage of the elastic energy return because of the increased stance time (Holt et al., 1991). Thisenergy, stored in the contractile components and tendons during the eccentric phase of muscle con-traction, can only be recovered and used during the concentric phase during a limited time (Asmussen& Bonde-Petersen, 1974). This mechanism might affect the obese teenagers of the present study to agreater extent than the non-obese teenagers because their significantly smaller stride frequencies, andhence greater stance time at PSF � 10% and PSF � 20%.
A greater use of postural muscles to maintain balance has also been pointed out as a factor thatmay increase the energy cost of walking at low step frequencies (Holt et al., 1991; Kram & Taylor,1990). The observation of the walking gait naturally adopted by obese subjects shows a great instabil-ity. Differences such as shorter single stance and longer double stance periods, greater asymmetry be-tween legs and more tentative gait in obese compared to non-obese subjects could contribute to theirhigher energy cost at frequencies lower than PSF (Hills & Parker, 1991; Nantel, Brochu, & Prince, 2006).A lower medio-lateral stability has been reported in obese compared to non-obese subjects, evidencein particular by greater medio-lateral ground reaction forces while walking (Browning et al., 2009).Within this context, Maki, Holliday, and Topper (1992) reported that an increase in non-contributorymass (such as body fat) affected medio-lateral stability to a greater extent than antero-posterior sta-bility, because it relies on muscle adjustments involving a lower number of degrees of freedom(mostly at the hip) compared to antero-posterior stability that relies on more degrees of freedom(hip, but also knee and ankle).
A. Delextrat et al. / Human Movement Science 30 (2011) 115–124 123
All the above-mentioned parameters could account for the greater energy costs associated with fre-quencies below PSF. However the differences were very similar in both groups (increases of +14.5% vs.+12.2% at PSF � 10%, and of +21.0% vs. +21.4%, respectively for obese and non-obese subjects). On theother hand, when an increase in step frequency was considered, greater (but not significant) increasesin energy costs were reported in obese subjects (increase between PSF + 20% and PSF of +26.3% vs.+20.5% in obese and non-obese subjects), suggesting that they might be slightly more affected at highfrequencies. This result could be interesting in the context of exercise prescription for weight-loss pro-grams. Indeed, since obese subjects find walking more comfortable than other locomotion modes,walking with greater stride frequencies than PSF could be a good alternative to the exercises classi-cally since it induces sufficient metabolic energy expenditure with a lower mechanical stress thanrunning.
The main factor to explain the greater energy costs of walking at higher than preferred frequenciesis the increase in internal mechanical work, defined as the energy needed to accelerate the differentbody segments with regards to the center of mass (Saibene & Minetti, 2003). Saibene and Minetti(2003) showed that this parameter is increased in obese subjects because they have a different massdistribution compared to lean subjects, in particular disproportionately larger thighs. Many authorshave highlighted that the cost of moving heavier legs could account for the higher energy costs ofwalking at high stride frequencies in obese compared to non-obese individuals (Browning & Kram,2005; Browning et al., 2009; Donelan et al., 2001). Unfortunately, the internal mechanical work wasnot calculated in the present study, and further studies involving three dimensional video analysesshould be conducted to estimate the importance of this parameter in subjects with different bodyfat percentages. It has also been reported that the increase in friction forces between the legs in obesesubjects could lead to higher energy costs of walking at high frequencies (Donelan et al., 2001).
Another parameter explaining the greater energy cost of walking at high frequencies is the de-creased time available during the stance to generate forces to support one’s own body weight (Saibene& Minetti, 2003). Indeed, Kram and Taylor (1990) suggested that the energy cost of walking and run-ning is inversely proportional to the time a single foot applies force to the ground during each stride.However, this probably affected the obese and non-obese teenagers of the present study to the sameextent.
Finally, metabolic parameters could explain the greater energy costs observed at stride frequencieseither lower or higher that PSF in the present study. Indeed, significantly greater f were measured atPSF � 20% compared to PSF � 10%, PSF and PSF + 10% and f recorded at PSF + 20% was significantlygreater compared to PSF. Therefore it could be hypothesized that walking with either low or high stepfrequencies increases the energy requirement of respiratory muscles, hence contributing to the great-er energy cost of locomotion.
Considering these comments, it must be noted that gross oxygen cost was considered in the pres-ent study, which can limit interpretations. Indeed, the net energy cost is considered as a better reflec-tion of energy expenditure during exercise, but unfortunately could not be measured in this study.
In conclusion, the present study showed first, a significant negative effect of excess body fat andstride frequency on the energy cost of obese teenagers walking at their preferred speed, and secondthat the preferred stride frequency of both groups could be predicted by the resonant period of aforce-driven harmonic oscillator. While a greater energy cost expressed in absolute values and relativeto lean body mass was observed in obese compared to non-obese subjects, increasing or decreasingstride frequency by 10% or 20% resulted in similar increases in energy expenditure in both groups.
4.3. Practical implications
The minimization of the energy cost of walking of obese teenagers at their preferred stride frequencysuggests that there is no need to train them to adapt their walking gait in order to reduce any discomfortin daily activities. However, the tendency for greater increases in energy cost at high frequencies in theobese group is opposite to what was observed in lean populations (greater energy expenditure at lowerfrequencies), and suggests that walking at high frequencies could be used as an exercise mode topromote weight loss. However, large distances should be covered in order to result in substantial differ-ence in calory expenditure. Indeed, subjects from the present study consumed 18.5 L of O2 km�1 when
124 A. Delextrat et al. / Human Movement Science 30 (2011) 115–124
walking at their preferred stride frequency (217.2 mL km�1 kg�1 multiplied by 85.2 kg), compared to23.6 L of O2 km�1 when stride frequency was increased by 20% (217.2 mL km�1 kg�1 multiplied by85.2 kg). Given a mean RER of 0.84 in these conditions (see Table 3), corresponding to a caloric equiv-alent of 4.85 kcal L�1 of O2, the subjects of our study spent 114.5 kcal km�1 in the PSF + 20% condition,compared to 89.7 kcal km�1 at their preferred frequency.
References
Ali, A., Becker, E., Chaudhury, M., Fuller, E., Harris, J., Heeks, F., et al. (2006). Obesity and other risk factors in children. In R. Craig& J. Mindell (Eds.), Lifestyles statistics. Leeds: The Information Centre.
Asmussen, E., & Bonde-Petersen, F. (1974). Apparent efficiency and storage of elastic energy in human muscles during exercise.Acta Physiologica Scandinavica, 92, 537–545.
Browning, R. C., & Kram, R. (2005). Energetic cost and preferred speed of walking in obese vs. normal weight women. ObesityResearch, 13, 891–899.
Browning, R. C., McGowan, C. P., & Kram, R. (2009). Obesity does not increase external mechanical work per kilogram body massduring walking. Journal of Biomechanics, 42, 2273–2278.
Bruckner, J. C., Atchou, G., Capelli, C., Duvallet, A., Barrault, D., Jousselin, E., et al. (1991). The energy cost of running increaseswith the distance covered. European Journal of Applied Physiology, 62, 385–389.
Cole, T. J., Freeman, J. V., & Preece, M. A. (1995). Body mass index reference curves for the UK, 1990. Archives of Disease inChildhood, 73, 25–29.
Donelan, J. M., Kram, R., & Kuo, A. D. (2001). Mechanical and metabolic determinants of the preferred step width in humanwalking. Proceedings Biological Sciences/The Royal Society, 268, 1985–1992.
Ekelund, U., Franks, P. W., Wareham, N. J., & Aman, J. (2004). Oxygen uptakes adjusted for body composition in normal-weightand obese adolescents. Obesity Research, 12, 513–520.
Foster, G. D., Wadden, T. A., Kendrick, Z. V., Letizia, K. A., Lander, D. P., & Conill, A. M. (1995). The energy cost of walking beforeand after significant weight loss. Medicine and Science in Sports and Exercise, 27, 888–894.
Grabowski, A., Farley, C. T., & Kram, R. (2005). Independent metabolic costs of supporting body weight and accelerating bodymass during walking. Journal of Applied Physiology, 98, 383–390.
Heglund, N. C., Willems, P. A., Penta, M., & Cavagna, G. A. (1995). Energy-saving gait mechanics with head-supported loads.Nature, 375, 52–54.
Hills, A. P., & Parker, A. W. (1991). Gait characteristics of obese children. Archives of Physical Medicine and Rehabilitation, 72,403–407.
Hills, A. P., & Parker, A. W. (1993). Electromyography of walking in obese children. Electromyography and ClinicalNeurophysiology, 33, 225–233.
Holt, K. G., Hamill, J., & Andres, R. O. (1990). The force driven harmonic oscillator as a model of human locomotion. HumanMovement Science, 9, 55–68.
Holt, K. G., Hamill, J., & Andres, R. O. (1991). Predicting the minimal energy costs of human walking. Medicine and Science inSports and Exercise, 23, 491–498.
Holt, K. G., Jeng, S. F., Ratcliffe, R., & Hamill, J. (1995). Energy cost and stability during human walking at the preferred stridefrequency. Journal of Motor Behavior, 27, 164–178.
Hulens, M., Vansant, G., Lysens, R., Claessens, A. L., Muls, E., & Brumagne, S. (2001). Study of differences in peripheral musclestrength of lean versus obese women: An allometric approach. International Journal of Obesity and Related MetabolicDisorders, 25, 676–681.
Jeng, S. F., Liao, H. F., Lai, J. S., & Hou, J. W. (1997). Optimization of walking in children. Medicine and Science in Sports and Exercise,29, 370–376.
Kram, R., & Taylor, C. R. (1990). Energetics of running: A new perspective. Nature, 34, 265–267.Kugler, P. N., Kelso, J. A. S., & Turvey, M. T. (1982). On the control and coordination of naturally developing systems. In J. A. S.
Kelso & T. E. Clark (Eds.), The development of movement control and coordination (pp. 5–78). New York: Wiley & Sons.Maki, B. E., Holliday, P. J., & Topper, A. K. (1992). Postural control and prospective risk of falling in the elderly (pp. 291–294). In
M. Woolacott & F. Horak (Eds.), Posture and gait: Control mechanisms. University of Oregon Books.Malina, R. M., & Bouchard, C. (1991). Growth, maturation and physical activity (pp. 37–85). Champaign, IL: Human Kinetics Books.Melanson, E. L., Bell, M. L., Knoll, J. R., Coelho, L. B., Donahoo, W. T., Peters, J. C., et al. (2003). Body mass index and sex influence
the energy cost of walking at self-selected speeds. Medicine and Science in Sports and Exercise, 35, S183.Nantel, J., Brochu, M., & Prince, F. (2006). Locomotor strategies in obese and non-obese children. Obesity, 14, 1789–1794.Reilly, J. J., Wilson, M., Summerbell, C. D., & Wilson, D. (2002). Obesity diagnosis prevention, and treatment: Evidence-based
answers to common questions. Archives of Disease in Childhood, 8, 392–394.Saibene, F., & Minetti, A. E. (2003). Biomechanical and physiological aspects of legged locomotion in humans. European Journal of
Applied Physiology, 88, 297–316.Stensel, D. J., Lin, F. P., & Nevill, A. M. (2001). Resting metabolic rate in obese and non-obese Singaporean boys aged 13–15 y.
American Journal of Clinical Nutrition, 74, 369–373.Treuth, M. S., Figueroa-Colon, R., Hunter, G. R., Weinsier, R. L., Butte, N. F., & Goran, M. I. (1998). Energy expenditure and physical
fitness in overweight vs non-overweight prepubertal girls. International Journal of Obesity, 22, 440–447.Varni, J. W., Burwinkle, T. M., & Seid, M. (2006). The PedQL™ 4.0 as a school population health measure: Feasibility, reliability,
and validity. Quality of Life Research, 15, 203–215.Whitaker, R. C., Wright, J. A., Pepe, M. S., Seidel, K. D., & Dietz, W. H. (1997). Predicting obesity in young adulthood from
childhood and parental obesity. The New England Journal of Medicine, 337, 869–873.Wilke, J. T. (1977). Ultradian biological periodicities in the integration of behaviour. International Journal of Neurosciences, 7,
125–143.
Copyright © 2022 FDOKUMEN