REARING JUVENILES OF THE ANEMONE FISH, AMPHIPRION BICINCTUS IN CAPTIVITY
Upload
independentCategory
view
1download
0
JOURNAL OF THEWORLD AQUACULTURE SOCIETY
Vol. 41, No. 4August, 2010
Effects of Alternative Dietary Lipid Sources on GrowthPerformance and Fatty Acid Composition of Beluga Sturgeon,
Huso huso, Juveniles
Seyed Vali Hosseini1 and Abdolmohammad Abedian Kenari2
Department of Fisheries, Tarbiat Modares University, PO Box 46414-356, Noor,Mazandaran, Iran
Joe M. Regenstein
Department of Food Science, Cornell University, Stocking Hall, Ithaca, New York 14853-7201USA
Masoud Rezaei
Department of Fisheries, Tarbiat Modares University, PO Box 46414-356, Noor, Mazandaran,Iran
Rajab Mohammad Nazari and Morteza Moghaddasi
Rajaee Sturgeon Hatchery Center, PO Box 833, Sari, Mazandaran, Iran
Seyed Abdollah Kaboli
Mazandaran Livestock and Aquatic’s Feed Co., PO Box 643, Sari, Mazandaran, Iran
Amelia A. M. Grant
Department of Zoology, University of British Columbia, 6270 University Boulevard,Vancouver, BC, Canada V6T 1Z4
AbstractThe main aim of this investigation was to determine the impact of a total dietary fish oil (FO)
replacement by vegetable oils (soybean [SO] and canola [CO] oil) on the growth and fatty acid(FA) composition of juvenile Beluga sturgeon, Huso huso. Three practical-type diets with equalprotein and lipid content were formulated using FO, SO, and CO. Each of the diets was fed toapparent satiation five times daily to H. huso (initial weight 206 ± 7.3 g) for 120 d. All groupsgrew equally well. Fish weight gain, condition factor, daily growth, feed intake, feed conversion, feedefficiency, protein efficiency, and survival were not affected by diet treatment. Fish lipid compositionreflected the inclusion of vegetable oils and their respective FA compositions. Monounsaturated FAand polyunsaturated FA significantly increased in fish fed the CO and SO diets, respectively, but theratio n − 3/n − 6 were significantly reduced by the inclusion of dietary vegetable oils (P < 0.05). Thisstudy suggests that FO can be replaced by SO and CO in H. huso diets under our test conditions withno significant effect on growth. However, longer assessments of these substitutions are warranted toensure that these treatments do not have an adverse effect on fish health.
In the future, aquaculture will contributemore to global food fish supplies and further
1 Present address: Department of Fisheries and Environ-mental Sciences, University of Tehran, Karaj campus, P.O.Box 31585-3314, Tehran, Iran.
2 Corresponding author.
help reduce global poverty and food secu-rity (FAO 2001). A major challenge of futureaquaculture production is a stable, predictable,and high-quality feed supply. Fish oil (FO)is used as the main lipid source in fish dietsto increase their energy content and provideessential fatty acids (EFA). Because of the
© Copyright by the World Aquaculture Society 2010
471
472 VALI HOSSEINI ET AL.
development of more nutrient dense feeds alongwith the general growth of the aquacultureindustry, a significant proportion of the totalglobal production of FO is used for fish feedproduction (Caballero et al. 2002). The annualglobal supply of FO is relatively constant (usu-ally varying between 1.1 and 1.4 million tonnesand may decline to 800,000 tonnes or lessin El Nino years); whereas the demand formarine fish oil (MFO) in aquafeeds is contin-ually increasing and may exceed 75% of theglobal supply by the year 2010 (Barlow 2000).The supply of these materials is limited becauseof fish catch limits and their cost is continu-ously increasing and affecting in a direct waythe aquaculture feed costs. In addition, compe-tition for FO for inclusion in human nutritionalsupplements and agricultural feeds other thanfor aquaculture will soon make FO a highlyprized commodity (Bell et al. 2001). Clearly,if aquaculture is to expand continuously, alter-natives to its current dependence on FO mustbe developed. Therefore, considerable researchefforts have been directed toward the evalua-tion of other oil sources as potential substitutesfor FO in fish diets. Various alternatives havebeen identified and investigated over the lastfew years as a means of reducing this depen-dency on FO (Raso and Anderson 2003).
A major challenge in replacing MFO inaquaculture feeds by alternative lipid sourcesis to economically supply an optimum levelof energy along with a well-balanced levelof EFAs (Figueiredo-Silva et al. 2005). Veg-etable oils are a favored alternative becausethey are readily available, relatively stablein price (Izquierdo et al. 2003), and virtuallyfree of dioxins and other organic pollutants(Figueiredo-Silva et al. 2005). Global produc-tion of vegetable oils are around 100 timeshigher than that of FO and a number ofstudies have shown that they can replace totalor significant parts of the FO in diets forfishes such as Atlantic salmon, Salmo salar(Bell et al. 2001); rainbow trout, Oncorhynchusmykiss (Caballero et al. 2002); African cat-fish, Clarias gariepinus (Ng et al. 2004);Murray cod, Maccullochella peelii peelii (Fran-cis et al. 2006); white bass, Morone chrysops
(Lane and Kohler 2006); chinook salmon,Oncorhynchus tshawytscha (Grant et al. 2008);and also some sturgeon species such as whitesturgeon, Acipencer transmontanus (Xu et al.1993); Adriatic sturgeon, Acipencer naccarii(McKenzie et al. 1999); and Russian sturgeon,Acipencer gueldenstaedtii (Sener et al. 2005),without compromising growth, feed efficiency,or reproduction. Notably, there is presently alack of information concerning the potential ofincluding alternative lipid sources in practicaldiets of H. huso on the growth, feed efficiency,and body composition.
In recent years, the intensive culture ofcertain sturgeon species has been developedas an alternative to other more traditionalfish species such as salmonids and cyprinids(Garcia-Gallego et al. 1999). H. huso, is dis-tributed within the basins of the Caspian, Black,and Adriatic seas where it once supported majorcommercial fisheries (Falahatkar and Barton2007), but now it is considered endangeredby the International Union for Conservation ofNature and Natural Resources (Sturgeon Spe-cialist Group 1996). This fish is suitable foraquaculture because of its fast growth, ease ofreproduction in captivity, lower feed conversionratio as compared to other sturgeons, and tol-erance of variable rearing conditions (Mohseniet al. 2006). At present, the culture of H. husosupports a relatively small but increasing aqua-culture industry in some countries around theCaspian Sea (Abdolhay and Tahori 2006). But,presently, there are no dedicated commercialdiets available for H. huso; instead, nutrition-ally substandard feeds formulated for otherspecies are commonly used. In comparison withother sturgeon fishes, there is less informationcurrently available on H. huso dietary require-ments, especially for lipid utilization and fattyacid composition.
Furthermore, it is well known that growthand chemical composition of fish can be influ-enced by dietary manipulation (Koskela et al.1998). In addition, there is increased inter-est in devising methods for improving pro-tein utilization (Regost et al. 2001), proteinsparing with decreased nitrogenous losses infish culture (Aksnes et al. 1996), and also

EFFECT OF DIETARY LIPIDS ON GROWTH OF BELUGA JUVENILES 473
control of the chemical composition and foodquality attributes of farmed fish by dietarymanipulation (Wathne 1995).
At the present time, the product of the stur-geon aquaculture industry is of high nutritionalquality with an abundance of n − 3 high unsat-urated FA (HUFA; fatty acids with over 20carbon atoms and three conjugated doublebonds) and a high n − 3/n − 6 polyunsaturatedFA (PUFA; fatty acids containing 16–22 car-bon atoms and 2–6 conjugated double bonds)ratio (Garcia-Gallego et al. 1999; Vaccaro et al.2005; Zareh et al. 2006; Kaya et al. 2007;Abedian-Kenari et al. 2009). Clearly, producersand consumers of sturgeons want to minimizeany perceived reduction in quality arising fromthe inclusion of vegetable oils, both in termsof growth and health of the fish and in thehealthy image of sturgeon as part of the humandiet. The high growth rates of cultured sturgeonare because of their use of high energy (oil)diets, which are rich in the polyenoic fatty acidscharacteristic of marine oils. Vegetable oilslack arachidonic acid (AA, C20:4n − 6), whichmay influence the health and physiology offish and humans (Mozaffarian and Rimm 2006;Ikonomou et al. 2007). Furthermore, it hasbeen demonstrated that many freshwater fish,including sturgeons, can potentially convertlinoleic acid (LA, C18:2n − 6) to AA and α-linolenic acid (ALA, C18:3n−3) to eicosapen-taenoic acid (EPA, C20:5n − 3) and docosa-hexaenoic acid (DHA, C22:6n−3) by enzy-matic pathways of desaturation and elongation(Opsahl-Ferstad et al. 2003; Sener et al. 2005).Thus, any substitute for FO in sturgeon feedsshould meet the following criteria: (1) avoidexcessive deposition of LA; (2) adequate lev-els of ALA for conversion to EPA and DHA;and (3) provide sufficient energy in the form ofmonoenoic fatty acids to maintain high growthrates.
In this regard, canola oil (CO) is a potentialcandidate for inclusion in commercial fishfeeds. CO has moderate levels of LA and ALA,in a ratio of 2:1, and an abundance of oleicacid (OA, C18:1n − 9). The ratio of LA/ALAin CO makes a benefit to human health, as wellas fish health (Bell et al. 2001). In addition,
soybean oil (SO) is the world’s largest sourceof vegetable oils and contains high levels ofPUFA and also like CO is a cholesterol-free oil(Figueiredo-Silva et al. 2005), but lacks EPAand DHA (NRC 1993).
Therefore, the objectives of this investigationwere to evaluate the suitability and effects ofSO and CO, two relatively available and lowpriced oils, as alternatives to FO on growth,feed efficiency, and fillet FA composition ofjuvenile H. huso. This study represents the firstdata about replacement of FO with plant oils ina H. huso diet.
Materials and Methods
Fish Rearing
For 120 d during May to October, the exper-iments were carried out in the Iranian govern-ment’s sturgeon hatchery, Shahid Rajaei (Sari,Mazandaran, Iran; l 36◦37′N, long 53◦05′E).The fish were from a genetically homoge-nous stock obtained from the mesocosm hatch-ery stock (i.e., a land-based pond), weanedand adapted to a formulated diet. During theacclimatization period prior to the feeding tri-als, the fish were fed daily with a semimoistdiet Commercial aquatic feeds (as a meal) wereprovided by a local manufacturer (MazandaranLivestock and Aquatic’s Feed Co., Sari, Iran)and were mixed (approximate ratio: 2:1 w/w)with fresh minced whole trash fish, Carassiuscarassius, and then pelleted. Most of the stur-geon fingerlings were released into the TajanRiver (Caspian region, Iran) at the end of springof the same year. For feeding trials, 135 stur-geon juveniles, with near uniform biomass andfree of disease, were selected and distributedrandomly into three replicated groups in 2000-L fiberglass tanks (nine tanks for the feedingtrials with 15 fish per tank). The initial weightand length of the experimental fish were 206 ±7 g and 349 ± 1 mm, respectively.
Fish were reared with a ground earth bot-tom supplied with constantly overflowing water(with a flow rate of ca. 15 L/min). The waterquality parameters observed during the exper-imental period were temperature (19–24 C),oxygen saturation (73–88%), total alkalinity
474 VALI HOSSEINI ET AL.
(136 ± 6 mg/L as CaCO3), pH (6.95–7.75),and salinity ≤1 ppt. Tanks were indoors andthe light cycle was 1600 h light and 0800 hdarkness (artificial photoperiod). The water wasaerated by an air supply to the reservoir tankbefore transferring to the experimental tanks.Dead fish were counted daily, and the numberof fish surviving at the end of the experimentwas expressed as a percentage of the numberof fish at the beginning of the experiment (sur-vival [%] = 100 × [initial fish number-deadfish number]/[initial fish number]).
Diet Preparation
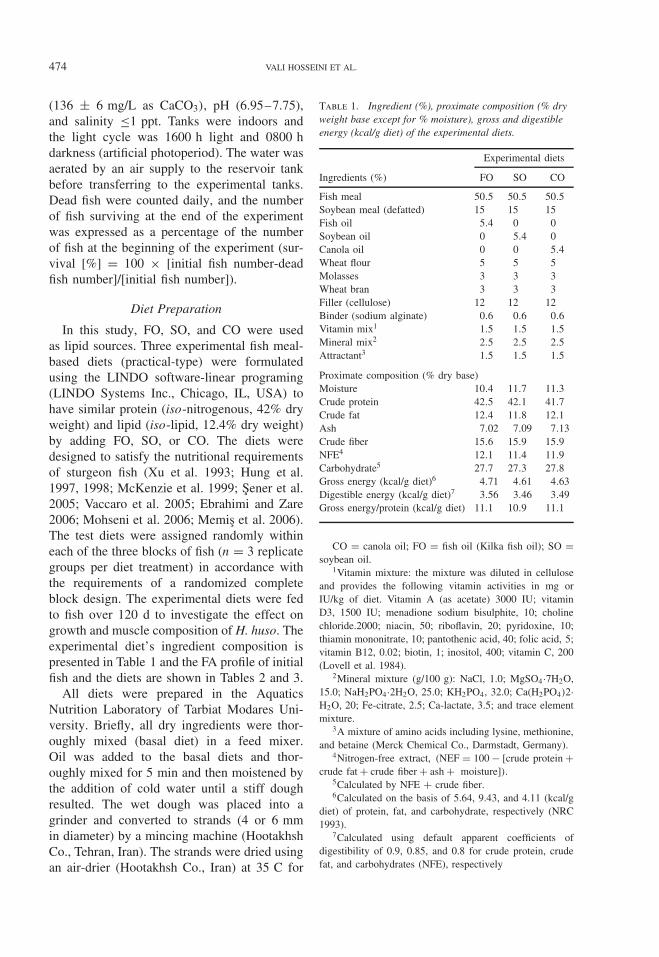
In this study, FO, SO, and CO were usedas lipid sources. Three experimental fish meal-based diets (practical-type) were formulatedusing the LINDO software-linear programing(LINDO Systems Inc., Chicago, IL, USA) tohave similar protein (iso-nitrogenous, 42% dryweight) and lipid (iso-lipid, 12.4% dry weight)by adding FO, SO, or CO. The diets weredesigned to satisfy the nutritional requirementsof sturgeon fish (Xu et al. 1993; Hung et al.1997, 1998; McKenzie et al. 1999; Sener et al.2005; Vaccaro et al. 2005; Ebrahimi and Zare2006; Mohseni et al. 2006; Memis et al. 2006).The test diets were assigned randomly withineach of the three blocks of fish (n = 3 replicategroups per diet treatment) in accordance withthe requirements of a randomized completeblock design. The experimental diets were fedto fish over 120 d to investigate the effect ongrowth and muscle composition of H. huso. Theexperimental diet’s ingredient composition ispresented in Table 1 and the FA profile of initialfish and the diets are shown in Tables 2 and 3.
All diets were prepared in the AquaticsNutrition Laboratory of Tarbiat Modares Uni-versity. Briefly, all dry ingredients were thor-oughly mixed (basal diet) in a feed mixer.Oil was added to the basal diets and thor-oughly mixed for 5 min and then moistened bythe addition of cold water until a stiff doughresulted. The wet dough was placed into agrinder and converted to strands (4 or 6 mmin diameter) by a mincing machine (HootakhshCo., Tehran, Iran). The strands were dried usingan air-drier (Hootakhsh Co., Iran) at 35 C for
Table 1. Ingredient (%), proximate composition (% dryweight base except for % moisture), gross and digestibleenergy (kcal/g diet) of the experimental diets.
Experimental diets
Ingredients (%) FO SO CO
Fish meal 50.5 50.5 50.5Soybean meal (defatted) 15 15 15Fish oil 5.4 0 0Soybean oil 0 5.4 0Canola oil 0 0 5.4Wheat flour 5 5 5Molasses 3 3 3Wheat bran 3 3 3Filler (cellulose) 12 12 12Binder (sodium alginate) 0.6 0.6 0.6Vitamin mix1 1.5 1.5 1.5Mineral mix2 2.5 2.5 2.5Attractant3 1.5 1.5 1.5
Proximate composition (% dry base)Moisture 10.4 11.7 11.3Crude protein 42.5 42.1 41.7Crude fat 12.4 11.8 12.1Ash 7.02 7.09 7.13Crude fiber 15.6 15.9 15.9NFE4 12.1 11.4 11.9Carbohydrate5 27.7 27.3 27.8Gross energy (kcal/g diet)6 4.71 4.61 4.63Digestible energy (kcal/g diet)7 3.56 3.46 3.49Gross energy/protein (kcal/g diet) 11.1 10.9 11.1
CO = canola oil; FO = fish oil (Kilka fish oil); SO =soybean oil.
1Vitamin mixture: the mixture was diluted in celluloseand provides the following vitamin activities in mg orIU/kg of diet. Vitamin A (as acetate) 3000 IU; vitaminD3, 1500 IU; menadione sodium bisulphite, 10; cholinechloride.2000; niacin, 50; riboflavin, 20; pyridoxine, 10;thiamin mononitrate, 10; pantothenic acid, 40; folic acid, 5;vitamin B12, 0.02; biotin, 1; inositol, 400; vitamin C, 200(Lovell et al. 1984).
2Mineral mixture (g/100 g): NaCl, 1.0; MgSO4·7H2O,15.0; NaH2PO4·2H2O, 25.0; KH2PO4, 32.0; Ca(H2PO4)2·H2O, 20; Fe-citrate, 2.5; Ca-lactate, 3.5; and trace elementmixture.
3A mixture of amino acids including lysine, methionine,and betaine (Merck Chemical Co., Darmstadt, Germany).
4Nitrogen-free extract, (NEF = 100 − [crude protein +crude fat + crude fiber + ash + moisture]).
5Calculated by NFE + crude fiber.6Calculated on the basis of 5.64, 9.43, and 4.11 (kcal/g
diet) of protein, fat, and carbohydrate, respectively (NRC1993).
7Calculated using default apparent coefficients ofdigestibility of 0.9, 0.85, and 0.8 for crude protein, crudefat, and carbohydrates (NFE), respectively
EFFECT OF DIETARY LIPIDS ON GROWTH OF BELUGA JUVENILES 475
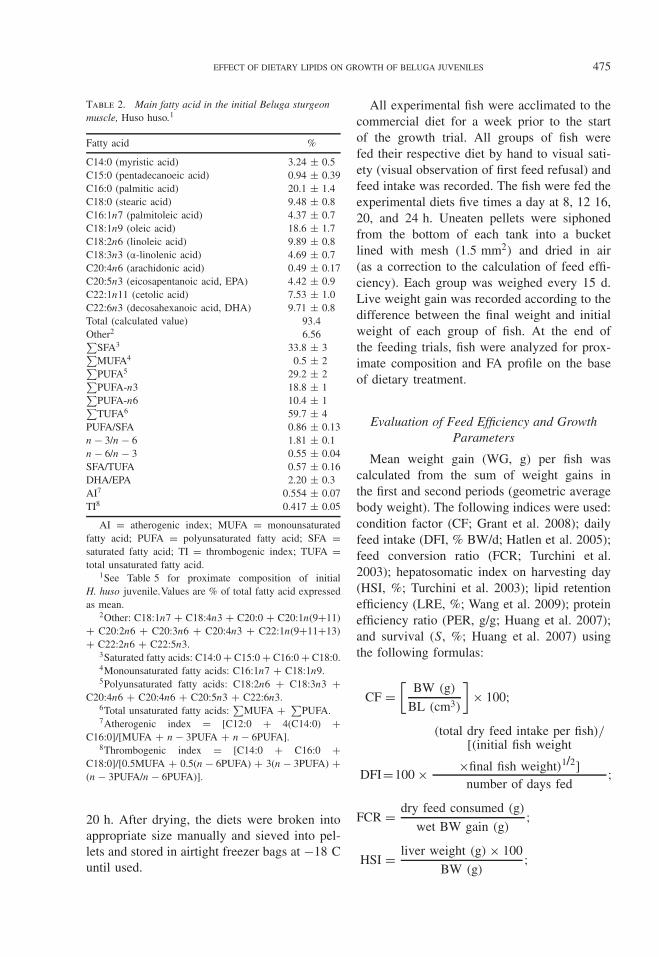
Table 2. Main fatty acid in the initial Beluga sturgeonmuscle, Huso huso.1
Fatty acid %
C14:0 (myristic acid) 3.24 ± 0.5C15:0 (pentadecanoeic acid) 0.94 ± 0.39C16:0 (palmitic acid) 20.1 ± 1.4C18:0 (stearic acid) 9.48 ± 0.8C16:1n7 (palmitoleic acid) 4.37 ± 0.7C18:1n9 (oleic acid) 18.6 ± 1.7C18:2n6 (linoleic acid) 9.89 ± 0.8C18:3n3 (α-linolenic acid) 4.69 ± 0.7C20:4n6 (arachidonic acid) 0.49 ± 0.17C20:5n3 (eicosapentanoic acid, EPA) 4.42 ± 0.9C22:1n11 (cetolic acid) 7.53 ± 1.0C22:6n3 (decosahexanoic acid, DHA) 9.71 ± 0.8Total (calculated value) 93.4Other2 6.56∑
SFA3 33.8 ± 3∑MUFA4 0.5 ± 2∑PUFA5 29.2 ± 2∑PUFA-n3 18.8 ± 1∑PUFA-n6 10.4 ± 1∑TUFA6 59.7 ± 4
PUFA/SFA 0.86 ± 0.13n − 3/n − 6 1.81 ± 0.1n − 6/n − 3 0.55 ± 0.04SFA/TUFA 0.57 ± 0.16DHA/EPA 2.20 ± 0.3AI7 0.554 ± 0.07TI8 0.417 ± 0.05
AI = atherogenic index; MUFA = monounsaturatedfatty acid; PUFA = polyunsaturated fatty acid; SFA =saturated fatty acid; TI = thrombogenic index; TUFA =total unsaturated fatty acid.
1See Table 5 for proximate composition of initialH. huso juvenile.Values are % of total fatty acid expressedas mean.
2Other: C18:1n7 + C18:4n3 + C20:0 + C20:1n(9+11)+ C20:2n6 + C20:3n6 + C20:4n3 + C22:1n(9+11+13)+ C22:2n6 + C22:5n3.
3Saturated fatty acids: C14:0 + C15:0 + C16:0 + C18:0.4Monounsaturated fatty acids: C16:1n7 + C18:1n9.5Polyunsaturated fatty acids: C18:2n6 + C18:3n3 +
C20:4n6 + C20:4n6 + C20:5n3 + C22:6n3.6Total unsaturated fatty acids:
∑MUFA + ∑
PUFA.7Atherogenic index = [C12:0 + 4(C14:0) +
C16:0]/[MUFA + n − 3PUFA + n − 6PUFA].8Thrombogenic index = [C14:0 + C16:0 +
C18:0]/[0.5MUFA + 0.5(n − 6PUFA) + 3(n − 3PUFA) +(n − 3PUFA/n − 6PUFA)].
20 h. After drying, the diets were broken intoappropriate size manually and sieved into pel-lets and stored in airtight freezer bags at −18 Cuntil used.
All experimental fish were acclimated to thecommercial diet for a week prior to the startof the growth trial. All groups of fish werefed their respective diet by hand to visual sati-ety (visual observation of first feed refusal) andfeed intake was recorded. The fish were fed theexperimental diets five times a day at 8, 12 16,20, and 24 h. Uneaten pellets were siphonedfrom the bottom of each tank into a bucketlined with mesh (1.5 mm2) and dried in air(as a correction to the calculation of feed effi-ciency). Each group was weighed every 15 d.Live weight gain was recorded according to thedifference between the final weight and initialweight of each group of fish. At the end ofthe feeding trials, fish were analyzed for prox-imate composition and FA profile on the baseof dietary treatment.
Evaluation of Feed Efficiency and GrowthParameters
Mean weight gain (WG, g) per fish wascalculated from the sum of weight gains inthe first and second periods (geometric averagebody weight). The following indices were used:condition factor (CF; Grant et al. 2008); dailyfeed intake (DFI, % BW/d; Hatlen et al. 2005);feed conversion ratio (FCR; Turchini et al.2003); hepatosomatic index on harvesting day(HSI, %; Turchini et al. 2003); lipid retentionefficiency (LRE, %; Wang et al. 2009); proteinefficiency ratio (PER, g/g; Huang et al. 2007);and survival (S, %; Huang et al. 2007) usingthe following formulas:
CF =[
BW (g)
BL (cm3)
]× 100;
DFI=100 ×
(total dry feed intake per fish)/[(initial fish weight
×final fish weight)1/2]number of days fed
;
FCR = dry feed consumed (g)
wet BW gain (g);
HSI = liver weight (g) × 100
BW (g);
476 VALI HOSSEINI ET AL.
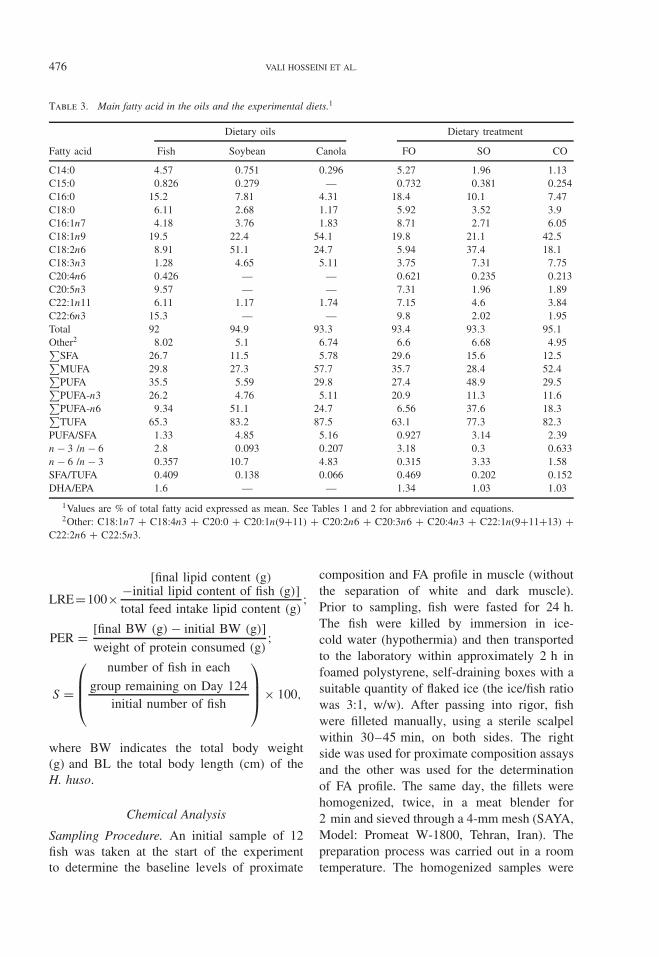
Table 3. Main fatty acid in the oils and the experimental diets.1
Dietary oils Dietary treatment
Fatty acid Fish Soybean Canola FO SO CO
C14:0 4.57 0.751 0.296 5.27 1.96 1.13C15:0 0.826 0.279 — 0.732 0.381 0.254C16:0 15.2 7.81 4.31 18.4 10.1 7.47C18:0 6.11 2.68 1.17 5.92 3.52 3.9C16:1n7 4.18 3.76 1.83 8.71 2.71 6.05C18:1n9 19.5 22.4 54.1 19.8 21.1 42.5C18:2n6 8.91 51.1 24.7 5.94 37.4 18.1C18:3n3 1.28 4.65 5.11 3.75 7.31 7.75C20:4n6 0.426 — — 0.621 0.235 0.213C20:5n3 9.57 — — 7.31 1.96 1.89C22:1n11 6.11 1.17 1.74 7.15 4.6 3.84C22:6n3 15.3 — — 9.8 2.02 1.95Total 92 94.9 93.3 93.4 93.3 95.1Other2 8.02 5.1 6.74 6.6 6.68 4.95∑
SFA 26.7 11.5 5.78 29.6 15.6 12.5∑MUFA 29.8 27.3 57.7 35.7 28.4 52.4∑PUFA 35.5 5.59 29.8 27.4 48.9 29.5∑PUFA-n3 26.2 4.76 5.11 20.9 11.3 11.6∑PUFA-n6 9.34 51.1 24.7 6.56 37.6 18.3∑TUFA 65.3 83.2 87.5 63.1 77.3 82.3
PUFA/SFA 1.33 4.85 5.16 0.927 3.14 2.39n − 3 /n − 6 2.8 0.093 0.207 3.18 0.3 0.633n − 6 /n − 3 0.357 10.7 4.83 0.315 3.33 1.58SFA/TUFA 0.409 0.138 0.066 0.469 0.202 0.152DHA/EPA 1.6 — — 1.34 1.03 1.03
1Values are % of total fatty acid expressed as mean. See Tables 1 and 2 for abbreviation and equations.2Other: C18:1n7 + C18:4n3 + C20:0 + C20:1n(9+11) + C20:2n6 + C20:3n6 + C20:4n3 + C22:1n(9+11+13) +
C22:2n6 + C22:5n3.
LRE=100×[final lipid content (g)
−initial lipid content of fish (g)]total feed intake lipid content (g)
;
PER = [final BW (g) − initial BW (g)]
weight of protein consumed (g);
S =
⎛⎜⎜⎝
number of fish in each
group remaining on Day 124initial number of fish
⎞⎟⎟⎠ × 100,
where BW indicates the total body weight(g) and BL the total body length (cm) of theH. huso.
Chemical Analysis
Sampling Procedure. An initial sample of 12fish was taken at the start of the experimentto determine the baseline levels of proximate
composition and FA profile in muscle (withoutthe separation of white and dark muscle).Prior to sampling, fish were fasted for 24 h.The fish were killed by immersion in ice-cold water (hypothermia) and then transportedto the laboratory within approximately 2 h infoamed polystyrene, self-draining boxes with asuitable quantity of flaked ice (the ice/fish ratiowas 3:1, w/w). After passing into rigor, fishwere filleted manually, using a sterile scalpelwithin 30–45 min, on both sides. The rightside was used for proximate composition assaysand the other was used for the determinationof FA profile. The same day, the fillets werehomogenized, twice, in a meat blender for2 min and sieved through a 4-mm mesh (SAYA,Model: Promeat W-1800, Tehran, Iran). Thepreparation process was carried out in a roomtemperature. The homogenized samples were
EFFECT OF DIETARY LIPIDS ON GROWTH OF BELUGA JUVENILES 477
kept at −18 C prior to proximate analysisand at −40 C prior to FA analysis. The sameprocedures were used for the samples collectedat the end of the feeding trials.
Proximate Analysis
The nutrient composition and FA profile ofthe homogenized fish samples (pretrial andpostharvest), liver and of the diets were per-formed according to the procedures of theAssociation of Official Analytical Chemists(AOAC 2005). In the homogenized fish (andalso liver), samples for moisture, ash, crudefiber, protein, and fat contents were assayedby methods 934.01, 920.153, 973.18, 954.01,and 991.36, respectively and in the diet using934.01, 942.05, 978.10, 968.06, and 920.39,respectively. Moisture was determined by dry-ing the samples in an oven (Heraeus, D-63450,Hanau, Germany) at 105 C to constant weight;ash was determined by incineration in a muf-fle furnace (Isuzu, Tokyo, Japan) at 600 C for3 h; crude fiber was determined by the aciddetergent fiber (ADF) method (Fibertec Sys-tem 1010 Heat Extractor, Hoganas, Sweden);crude protein was determined by the Kjel-dahl method (N × 6.25) using an automaticKjeldahl system (230-Hjeltec Analyzer, FossTecator, Hoganas, Sweden); crude fat contentwas measured gravimetrically after extractionwith petroleum ether using an automatic Soxtecdevice (FOSS, Soxtec 2050, Hoganas, Swe-den); nitrogen-free extracts (NFE) were calcu-lated by the following formula and NFE plusfiber was expressed as carbohydrate (Aksnesand Opstvedt 1998):
NFE = 100 − (crude protein + crude
lipid + fiber + ash + moisture);carbohydrate = NFE + fiber.
The calculation of the gross energy of thediets was cerried out according to the NRC(1993) procedure, based on 1 g crude protein(P) = 5.64 kcal, 1 g crude fat (F) = 9.43 kcal,and 1 g carbohydrate (C) = 4.11 kcal. Estimatesof the digestible energy (DE, kcal) content in
feed were calculated using the default apparentcoefficients of digestibility of 0.9, 0.85, and 0.8for crude protein, crude fat, and carbohydrates(NFE), respectively (Moreau et al. 2003). Eachmeasurement was repeated five times. If thecoefficient of variation within these repeti-tions exceeded 0.4%, the measurements wererepeated.
Fatty Acid Analysis and Lipid Quality
For lipid analysis of fish and diets, thetotal lipids were extracted according to a mod-ified Folch method (1957) as described byRajion (1985), using a chloroform : methanol(2:1, v/v) solvent system. The FA composi-tion of the fish and diets was determined bygas liquid chromatography (GLC) according toFirestone (1998). Transmethylation was per-formed using 20% methanolic boron trifluo-ride (BF3, Merck, Darmstadt, Germany). Thefatty acid methyl esters (FAMEs) were ana-lyzed using a Phillips GLC-PU4400 (PhillipsScientific, Cambridge, UK), equipped with afused silica capillary polar column (BPX70,60 × 0.32 mm ID, 0.25 μm film thickness,SGM, Victoria, Australia), and a flame ion-ization detector (FID). The carrier gas washelium and the split ratio was 1:20. A thermalgradient from 160 to 230 C at 45 C/min wasused with the injector and FID temperatures at240 and 280 C, respectively. In this study, theoven thermal gradient increased from an initial160–180 C at 20 C/min, from 180 to 210 C at1.5 C/min; and from 210 to 230 C at 20 C/min.Temperatures were maintained for 5, 10, 3,and 5 min at 160, 180, 210 C, and the finaltemperature, respectively. The injected sam-ple was 0.3 μL. Before methylation, 1.0 mLof hexane containing 0.5 mg of heptadecanoicacid (C17:0, Aldrich, Catalog No.: 29,851-4,Lot No.: 10608CU, Milwaukee, WI, USA) wasadded to all samples as an internal standard.Standard FAMEs from Aldrich were run underthe same conditions and the subsequent reten-tion times used to identify the FA in the fishlipid samples. Individual FA were identified andquantified by comparison with retention timesand peak areas of the FAME standards. Peak

478 VALI HOSSEINI ET AL.
position and area were analyzed using ClarityDataApex software (Prague, Czech Republic).To make direct comparisons possible betweendifferent feeding trials, the FA data is expressedas a weight percentage of the measured FA poolfor that sample ([weight of each FA]
/[weight
of all FA]) × 100. Fatty acid analysis wasperformed in triplicate on three subsamples ofeach of the added dietary oils, three subsamplesof the experimental diets, and three pooledfillet samples from each of the diet treatmentreplicates.
The lipid quality indices, that is, the athero-genic index (AI) and the thrombogenic index(TI), were calculated according to Ulbricht andSouthgate (1991). The AI and TI were calcu-lated as follows:
AI = [C12 : 0 + 4(C14 : 0) + C16 : 0]
[MUFA + n − 3PUFA + n − 6PUFA];
TI = [C14 : 0 + C16 : 0 + C18 : 0][0.5MUFA + 0.5(n − 6PUFA)
+3(n − 3PUFA)
+(n − 3PUFA/n − 6PUFA)]
.
Statistical Analysis
Descriptive statistics (means and standarddeviations) for the analysis results were cal-culated for each treatment All data were sub-jected to one-way ANOVA to test the effectsof experimental diets. The data were tested forhomogeneity of variances at a significant levelof 0.05 and probability values <0.05 were con-sidered as statistically significant. When testsfor normality and equal variance were rejected,a square root transformation was performed.Differences between means were assessed byDuncan’s multiple range test (Duncan, 1955)and linear regression was carried out betweensurvival rate and experimental diets. Graph-ical relationships were obtained between theconcentrations of selected dietary fatty acidsand those noted for the respective fatty acidsin the muscle lipids according to Bell et al.(2001) and Grant et al. (2008) to gain additionalinsights into the metabolic fates of these fattyacids. Excel, Microsoft Office, 2007, and SPSSversion 13.5 (SPSS Inc., Chicago, IL, USA)
were used for data manipulations and statisticalanalysis.
Results
Growth Indices
There were no significant differences inthe initial weights of the fish at the startof the trial, either between dietary treatmentsor between replicate tanks from the sametreatment. Similarly, the final weights were notsignificantly different in fish fed the experi-mental diets (Table 4, P > 0.05). The overallmortality was very low in all feeding groups(<2 fish for each treatment) and did not appearto be related to the dietary treatment.
During the feeding trials, growth perfor-mance was high for all fish groups and nosignificant differences were found among treat-ments for WG, CF, DFI, FCR, HSI, and PER(Table 4). Essentially there were no significanteffects of replacement of vegetable oils for FOon the mentioned parameters. The mean finalweights of juvenile H. huso reared on FO, SO,and CO diets obtained 753, 788, and 673 g,respectively (Table 4). Although there was nosignificant difference in the final weight ofexperimental fishes, the fish fed the CO diethad the lowest final mean weights among thethree oils. In all feeding trials, experimental fishincreased in weight by around threefold in the120 d. Feed conversion ratios did not differ forany treatment but the best value (2.13 ± 0.22)was observed for fish fed the SO diet and thepoorest (2.93 ± 0.79) was again for fish fed theCO diet. The highest and lowest protein effi-ciency ratio (PER g/g) was observed for fishfed SO (1.13 ± 0.11) and CO (0.873 ± 0.24),respectively.
Fish Proximate and Fatty Acid Composition
The proximate compositions of the measurededible portions (muscle) of H. huso fed differ-ent diets are shown in Table 5. Slight changein the composition of the flesh of H. husowas observed for all measured components butthe oils had no significant effect on the mus-cle composition. Among experimental diets, thedifferences between the dietary treatments were
EFFECT OF DIETARY LIPIDS ON GROWTH OF BELUGA JUVENILES 479
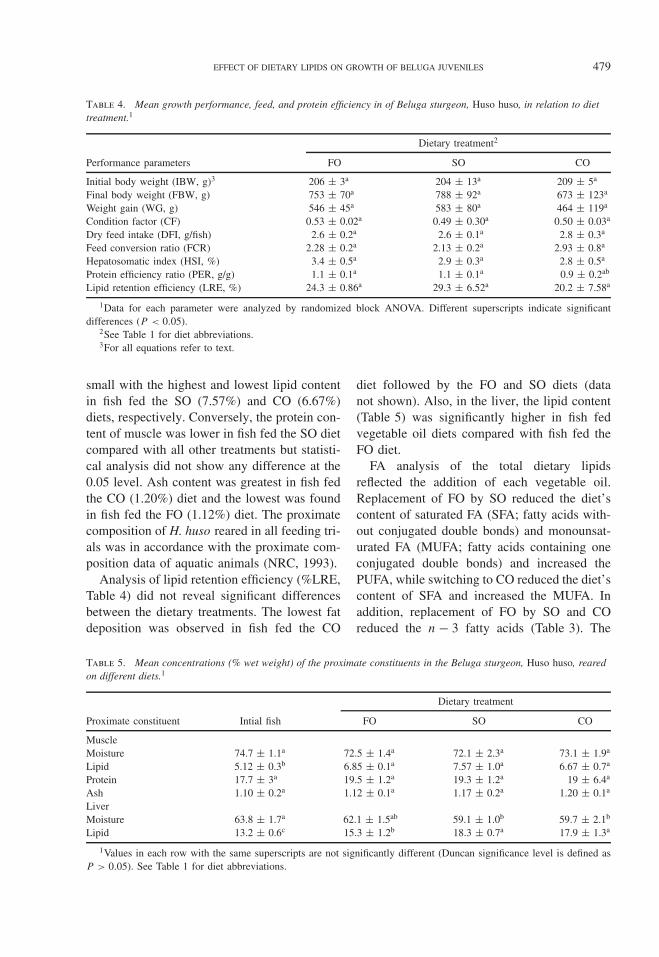
Table 4. Mean growth performance, feed, and protein efficiency in of Beluga sturgeon, Huso huso, in relation to diettreatment.1
Dietary treatment2
Performance parameters FO SO CO
Initial body weight (IBW, g)3 206 ± 3a 204 ± 13a 209 ± 5a
Final body weight (FBW, g) 753 ± 70a 788 ± 92a 673 ± 123a
Weight gain (WG, g) 546 ± 45a 583 ± 80a 464 ± 119a
Condition factor (CF) 0.53 ± 0.02a 0.49 ± 0.30a 0.50 ± 0.03a
Dry feed intake (DFI, g/fish) 2.6 ± 0.2a 2.6 ± 0.1a 2.8 ± 0.3a
Feed conversion ratio (FCR) 2.28 ± 0.2a 2.13 ± 0.2a 2.93 ± 0.8a
Hepatosomatic index (HSI, %) 3.4 ± 0.5a 2.9 ± 0.3a 2.8 ± 0.5a
Protein efficiency ratio (PER, g/g) 1.1 ± 0.1a 1.1 ± 0.1a 0.9 ± 0.2ab
Lipid retention efficiency (LRE, %) 24.3 ± 0.86a 29.3 ± 6.52a 20.2 ± 7.58a
1Data for each parameter were analyzed by randomized block ANOVA. Different superscripts indicate significantdifferences (P < 0.05).
2See Table 1 for diet abbreviations.3For all equations refer to text.
small with the highest and lowest lipid contentin fish fed the SO (7.57%) and CO (6.67%)diets, respectively. Conversely, the protein con-tent of muscle was lower in fish fed the SO dietcompared with all other treatments but statisti-cal analysis did not show any difference at the0.05 level. Ash content was greatest in fish fedthe CO (1.20%) diet and the lowest was foundin fish fed the FO (1.12%) diet. The proximatecomposition of H. huso reared in all feeding tri-als was in accordance with the proximate com-position data of aquatic animals (NRC, 1993).
Analysis of lipid retention efficiency (%LRE,Table 4) did not reveal significant differencesbetween the dietary treatments. The lowest fatdeposition was observed in fish fed the CO
diet followed by the FO and SO diets (datanot shown). Also, in the liver, the lipid content(Table 5) was significantly higher in fish fedvegetable oil diets compared with fish fed theFO diet.
FA analysis of the total dietary lipidsreflected the addition of each vegetable oil.Replacement of FO by SO reduced the diet’scontent of saturated FA (SFA; fatty acids with-out conjugated double bonds) and monounsat-urated FA (MUFA; fatty acids containing oneconjugated double bonds) and increased thePUFA, while switching to CO reduced the diet’scontent of SFA and increased the MUFA. Inaddition, replacement of FO by SO and COreduced the n − 3 fatty acids (Table 3). The
Table 5. Mean concentrations (% wet weight) of the proximate constituents in the Beluga sturgeon, Huso huso, rearedon different diets.1
Dietary treatment
Proximate constituent Intial fish FO SO CO
MuscleMoisture 74.7 ± 1.1a 72.5 ± 1.4a 72.1 ± 2.3a 73.1 ± 1.9a
Lipid 5.12 ± 0.3b 6.85 ± 0.1a 7.57 ± 1.0a 6.67 ± 0.7a
Protein 17.7 ± 3a 19.5 ± 1.2a 19.3 ± 1.2a 19 ± 6.4a
Ash 1.10 ± 0.2a 1.12 ± 0.1a 1.17 ± 0.2a 1.20 ± 0.1a
LiverMoisture 63.8 ± 1.7a 62.1 ± 1.5ab 59.1 ± 1.0b 59.7 ± 2.1b
Lipid 13.2 ± 0.6c 15.3 ± 1.2b 18.3 ± 0.7a 17.9 ± 1.3a
1Values in each row with the same superscripts are not significantly different (Duncan significance level is defined asP > 0.05). See Table 1 for diet abbreviations.
480 VALI HOSSEINI ET AL.
main difference between the experimental dietswas in their OA, LA, and HUFA (EPA andDHA) levels. The percentage of OA was higherin the CO diet (42.5%), whereas that of LA washigher in the SO diet (37.4%). The FO diet, onthe other hand, had the highest content of EPAand DHA (Table 3).
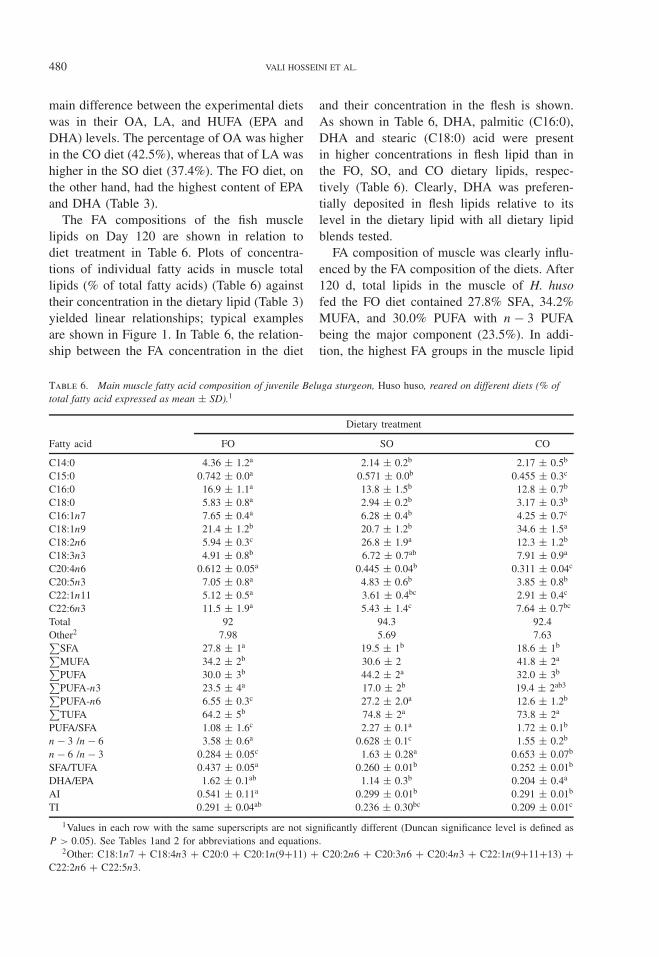
The FA compositions of the fish musclelipids on Day 120 are shown in relation todiet treatment in Table 6. Plots of concentra-tions of individual fatty acids in muscle totallipids (% of total fatty acids) (Table 6) againsttheir concentration in the dietary lipid (Table 3)yielded linear relationships; typical examplesare shown in Figure 1. In Table 6, the relation-ship between the FA concentration in the diet
and their concentration in the flesh is shown.As shown in Table 6, DHA, palmitic (C16:0),DHA and stearic (C18:0) acid were presentin higher concentrations in flesh lipid than inthe FO, SO, and CO dietary lipids, respec-tively (Table 6). Clearly, DHA was preferen-tially deposited in flesh lipids relative to itslevel in the dietary lipid with all dietary lipidblends tested.
FA composition of muscle was clearly influ-enced by the FA composition of the diets. After120 d, total lipids in the muscle of H. husofed the FO diet contained 27.8% SFA, 34.2%MUFA, and 30.0% PUFA with n − 3 PUFAbeing the major component (23.5%). In addi-tion, the highest FA groups in the muscle lipid
Table 6. Main muscle fatty acid composition of juvenile Beluga sturgeon, Huso huso, reared on different diets (% oftotal fatty acid expressed as mean ± SD).1
Dietary treatment
Fatty acid FO SO CO
C14:0 4.36 ± 1.2a 2.14 ± 0.2b 2.17 ± 0.5b
C15:0 0.742 ± 0.0a 0.571 ± 0.0b 0.455 ± 0.3c
C16:0 16.9 ± 1.1a 13.8 ± 1.5b 12.8 ± 0.7b
C18:0 5.83 ± 0.8a 2.94 ± 0.2b 3.17 ± 0.3b
C16:1n7 7.65 ± 0.4a 6.28 ± 0.4b 4.25 ± 0.7c
C18:1n9 21.4 ± 1.2b 20.7 ± 1.2b 34.6 ± 1.5a
C18:2n6 5.94 ± 0.3c 26.8 ± 1.9a 12.3 ± 1.2b
C18:3n3 4.91 ± 0.8b 6.72 ± 0.7ab 7.91 ± 0.9a
C20:4n6 0.612 ± 0.05a 0.445 ± 0.04b 0.311 ± 0.04c
C20:5n3 7.05 ± 0.8a 4.83 ± 0.6b 3.85 ± 0.8b
C22:1n11 5.12 ± 0.5a 3.61 ± 0.4bc 2.91 ± 0.4c
C22:6n3 11.5 ± 1.9a 5.43 ± 1.4c 7.64 ± 0.7bc
Total 92 94.3 92.4Other2 7.98 5.69 7.63∑
SFA 27.8 ± 1a 19.5 ± 1b 18.6 ± 1b∑MUFA 34.2 ± 2b 30.6 ± 2 41.8 ± 2a∑PUFA 30.0 ± 3b 44.2 ± 2a 32.0 ± 3b∑PUFA-n3 23.5 ± 4a 17.0 ± 2b 19.4 ± 2ab3∑PUFA-n6 6.55 ± 0.3c 27.2 ± 2.0a 12.6 ± 1.2b∑TUFA 64.2 ± 5b 74.8 ± 2a 73.8 ± 2a
PUFA/SFA 1.08 ± 1.6c 2.27 ± 0.1a 1.72 ± 0.1b
n − 3 /n − 6 3.58 ± 0.6a 0.628 ± 0.1c 1.55 ± 0.2b
n − 6 /n − 3 0.284 ± 0.05c 1.63 ± 0.28a 0.653 ± 0.07b
SFA/TUFA 0.437 ± 0.05a 0.260 ± 0.01b 0.252 ± 0.01b
DHA/EPA 1.62 ± 0.1ab 1.14 ± 0.3b 0.204 ± 0.4a
AI 0.541 ± 0.11a 0.299 ± 0.01b 0.291 ± 0.01b
TI 0.291 ± 0.04ab 0.236 ± 0.30bc 0.209 ± 0.01c
1Values in each row with the same superscripts are not significantly different (Duncan significance level is defined asP > 0.05). See Tables 1and 2 for abbreviations and equations.
2Other: C18:1n7 + C18:4n3 + C20:0 + C20:1n(9+11) + C20:2n6 + C20:3n6 + C20:4n3 + C22:1n(9+11+13) +C22:2n6 + C22:5n3.
EFFECT OF DIETARY LIPIDS ON GROWTH OF BELUGA JUVENILES 481
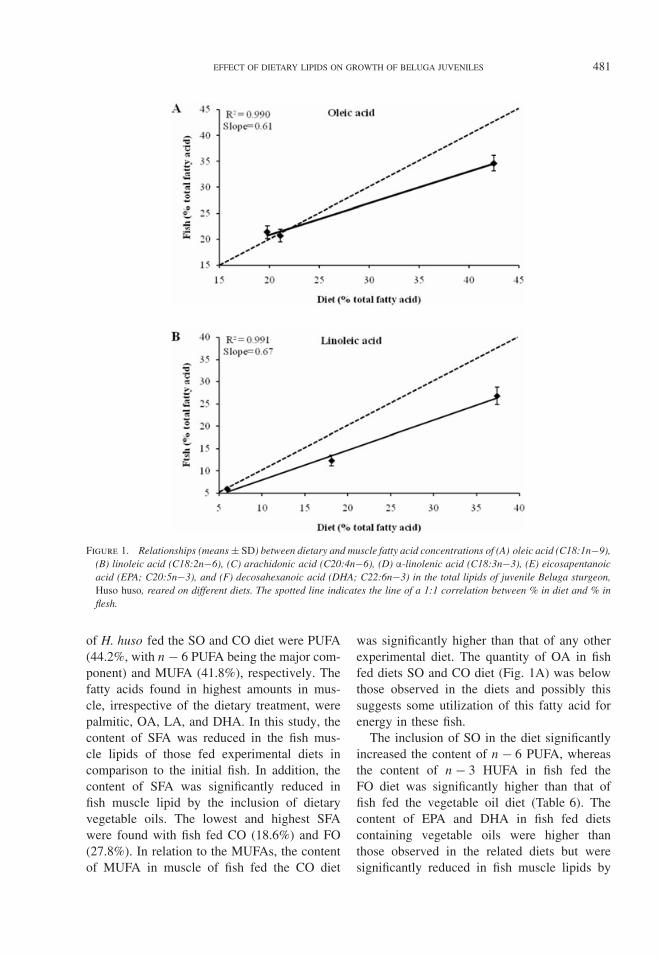
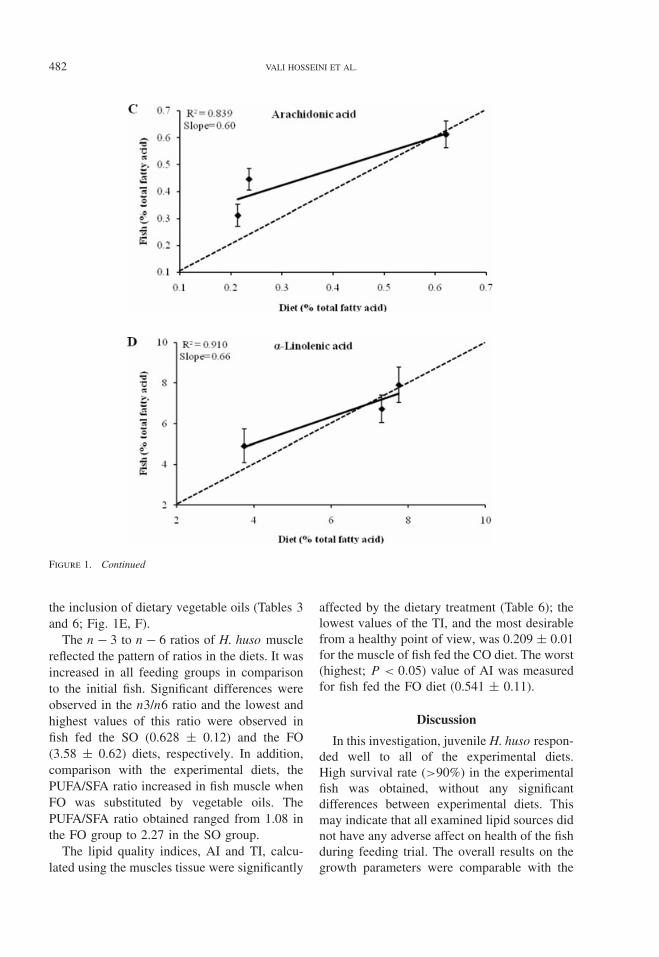
Figure 1. Relationships (means ± SD) between dietary and muscle fatty acid concentrations of (A) oleic acid (C18:1n−9),(B) linoleic acid (C18:2n−6), (C) arachidonic acid (C20:4n−6), (D) α-linolenic acid (C18:3n−3), (E) eicosapentanoicacid (EPA; C20:5n−3), and (F) decosahexanoic acid (DHA; C22:6n−3) in the total lipids of juvenile Beluga sturgeon,Huso huso, reared on different diets. The spotted line indicates the line of a 1:1 correlation between % in diet and % inflesh.
of H. huso fed the SO and CO diet were PUFA(44.2%, with n − 6 PUFA being the major com-ponent) and MUFA (41.8%), respectively. Thefatty acids found in highest amounts in mus-cle, irrespective of the dietary treatment, werepalmitic, OA, LA, and DHA. In this study, thecontent of SFA was reduced in the fish mus-cle lipids of those fed experimental diets incomparison to the initial fish. In addition, thecontent of SFA was significantly reduced infish muscle lipid by the inclusion of dietaryvegetable oils. The lowest and highest SFAwere found with fish fed CO (18.6%) and FO(27.8%). In relation to the MUFAs, the contentof MUFA in muscle of fish fed the CO diet
was significantly higher than that of any otherexperimental diet. The quantity of OA in fishfed diets SO and CO diet (Fig. 1A) was belowthose observed in the diets and possibly thissuggests some utilization of this fatty acid forenergy in these fish.
The inclusion of SO in the diet significantlyincreased the content of n − 6 PUFA, whereasthe content of n − 3 HUFA in fish fed theFO diet was significantly higher than that offish fed the vegetable oil diet (Table 6). Thecontent of EPA and DHA in fish fed dietscontaining vegetable oils were higher thanthose observed in the related diets but weresignificantly reduced in fish muscle lipids by
482 VALI HOSSEINI ET AL.
Figure 1. Continued
the inclusion of dietary vegetable oils (Tables 3and 6; Fig. 1E, F).
The n − 3 to n − 6 ratios of H. huso musclereflected the pattern of ratios in the diets. It wasincreased in all feeding groups in comparisonto the initial fish. Significant differences wereobserved in the n3/n6 ratio and the lowest andhighest values of this ratio were observed infish fed the SO (0.628 ± 0.12) and the FO(3.58 ± 0.62) diets, respectively. In addition,comparison with the experimental diets, thePUFA/SFA ratio increased in fish muscle whenFO was substituted by vegetable oils. ThePUFA/SFA ratio obtained ranged from 1.08 inthe FO group to 2.27 in the SO group.
The lipid quality indices, AI and TI, calcu-lated using the muscles tissue were significantly
affected by the dietary treatment (Table 6); thelowest values of the TI, and the most desirablefrom a healthy point of view, was 0.209 ± 0.01for the muscle of fish fed the CO diet. The worst(highest; P < 0.05) value of AI was measuredfor fish fed the FO diet (0.541 ± 0.11).
Discussion
In this investigation, juvenile H. huso respon-ded well to all of the experimental diets.High survival rate (>90%) in the experimentalfish was obtained, without any significantdifferences between experimental diets. Thismay indicate that all examined lipid sources didnot have any adverse affect on health of the fishduring feeding trial. The overall results on thegrowth parameters were comparable with the

EFFECT OF DIETARY LIPIDS ON GROWTH OF BELUGA JUVENILES 483
Figure 1. Continued
values previously reported for sturgeon species(Xu et al. 1993; McKenzie et al. 1999; Seneret al. 2005). In addition, the results showedthat rapidly growing juvenile H. huso can usethe three different lipid sources equally wellwhen fed at 12% of diets for 120 d, during thistime their body weights increased threefold tofourfold.
In this experiment, the muscle proximatecomposition, with the exception of the per-cent moisture, was not affected by diet treat-ment. Although slight differences betweenthe dietary treatments were observed, thesedifferences were not significant. The sameresults were obtained by Xu et al. (1993) andDeng et al. (1998) on white sturgeon; McKen-zie et al. (1999) on Adriatic sturgeon; and Seneret al. (2005) on Russian sturgeon. Although
differences in muscle moisture percentages areoften accompanied by reciprocal changes inwhole body lipid content (Bendiksen et al.2003; Huang et al. 2007), the latter effect wasnot found in this study. As mentioned in theresults (Table 4), lipid content and LRE inthe muscle was greater in fish fed the SOdiet compared with fish fed FO and CO diets.Conversely, the muscle protein content waslower in fish fed the SO diet compared withall other treatments. This relationship betweenmuscle protein and lipid content has beenobserved in previous study with Russian stur-geon (Sener et al. 2005) and other fish, thatis, salmonids (Bell et al. 2001). On the otherhand, dietary lipids and the retention of lipids(LRE), particularly in fillets, are parametersoften discussed in connection with quality (Lie

484 VALI HOSSEINI ET AL.
et al. 1986). In farmed fish, the fatty acids aswell as other fillet lipids may be altered by feed-ing (Bell et al. 2001), so controlled diets can beused to manipulate the fatty acid profile of tis-sue lipids. For farmed sturgeon, the relationshipbetween dietary lipids and deposition of fat infillets has been studied in some species. In astudy, Hung et al. (1997) reported that dietarylipid levels between 26 and 36% gave goodgrowth without major effects on body compo-sition of the white sturgeon.
Because of the MFO and the phospholipidscontained in fish meal, the SO and CO dietscontained respectively 1.89–1.96% EPA, and1.95–2.02% DHA on a fatty acid composition(wet weight basis). These amounts are sufficientto meet the HUFA requirements of sturgeonfishes for normal growth and development (Xuet al. 1993; Deng et al. 1998; Hung et al. 1998;Sener et al. 2005; Vaccaro et al. 2005; Ebrahimiand Zare 2006; Mohseni et al. 2006). Althoughour results did not clearly indicate that therewas an optimal balance between dietary levelsof EPA, DHA, and AA, it is interesting to notethat the H. huso fed the SO diet showed a trendtoward improved growth, feed intake, and feedutilization relative to those consuming othertest diets. However, the differences between thegroups for each of the foregoing performanceparameters were not significant. A study oflonger duration may provide more definitiveevidence with respect to this point.
FA composition of the fish and other fil-let lipids may be altered by feeding (Bellet al. 2001; Lane et al. 2006). This is con-firmed in this study, which clearly establisheslinear correlations, with different slopes andintercepts, between the percentage of indi-vidual FAs in dietary lipids and in mus-cle total lipids (Fig. 1). The figures alsoshow how different FAs in dietary lipids areselected for or against for tissue lipid depo-sition. Thus, the data in Tables 3 and 6, andFigure 1 establish that EPA and especially DHAare selectively deposited in H. huso musclelipids. The same trend was obtained by Bellet al. (2001, 2002) and Almaida-Pagan et al.(2007), when they substituted FO with veg-etable oils in S. salar and Diplodus puntazzo
diet, respectively. They have mentioned thatpossible mechanisms underlying this selectivedeposition include high specificity of fatty acyltransferases for EPA and DHA and/or rela-tive resistance of EPA and DHA to β-oxidationstemming from the complex catabolic path-way for this fatty acid (Bell et al. 2001, 2002;Almaida-Pagan et al. 2007). It is well knownthat DHA is the main component of the phos-phoglycerols in fish biomembranes (Hendersonand Tocher 1987) and is critical for normaldevelopment of the brain and retina (Bell et al.1995). But, EPA is more likely to be catabo-lized for energy and less likely to be retained inbiomembranes than DHA (Madsen et al. 1999).In this regard, it is of interest that completereplacement of FO in the H. huso diet withSO and CO reduced the percentage of EPA andDHA in dietary lipids around fourfold but inthe muscle lipid only by around twofold.
Neutral and polar lipids were not partitionedin this study; it is difficult to determinethe exact impacts of replacement of FO bySO and CO of different lipid compartmentsin the tissues. This aspect deserves moreinvestigation. It has previously been shownthat the FA profile of neutral lipids (mainlycomprised of triglycerides) in fish tissues islargely a reflection of the FA profile of the diet(Sargent et al. 2002; Robin et al. 2003). Thecomposition of polar lipids (which are mainlycomprised of phospholipids) because of theirrole in membrane structure and properties isunder much tighter regulation and does notalways fully reflect composition of the diet(Bureau et al. 2002; Robin et al. 2003). Thelevel of DHA in polar lipids is generally muchhigher and less affected by DHA content ofthe diet (Bureau et al. 2002). Phospholipidsrepresent approximately 0.5% of the weight offish tissues. As the lipid content of the fish fleshin this study was between 6 and 7%, it canbe concluded that more than 90% of the totalfatty acids in the tissues analyzed were fromneutral lipids. Although partitioning neutral andpolar lipids would have been informative, fattyanalysis of total lipids of the tissue provided anadequate representation of the broad effect ofthe dietary treatments.
EFFECT OF DIETARY LIPIDS ON GROWTH OF BELUGA JUVENILES 485
It is well known that freshwater fish have adietary requirement for n − 3 and n − 6 fattyacids, predominantly in the form of LA andALA (Tocher 2003; Francis et al. 2006). Incomparison to marine fish species, freshwaterfish are also generally better equipped to desat-urate and elongate these fatty acids to higherhomologs (Guillou et al. 1995; Tocher 2003).Despite the SO and CO diet having the high-est percent of LA and ALA in the experimentaldiets, this study showed them to have a lowerconcentration in the muscle than in the diets.It is probable that a high degree of metabolismof these fatty acids is taking place in juvenileH. huso. On the other hand, feeding sturgeondiets rich in C18 PUFA (SO, CO) resulted inrelatively high levels of EPA and DHA. Theseresults showed that sturgeon have the ability todesaturate and elongate C18 PUFAs to EPA andDHA fatty acids. This is in agreement with theobtained results on other sturgeon fish (Xu et al.1993; Deng et al. 1998; Sener et al. 2005). Inaddition, the concentration of AA was very sim-ilar in muscle of initial fish and that of fishfed the test diets for 120 d (Tables 2, 3 and6). Arachidonic acid is probably maintainedat a physiologically optimum level in tissuesbecause of its importance in eicosanoid forma-tion (Fountoulaki et al. 2003; Subhadra et al.2006).
To better illustrate the findings for FA utiliza-tion and retention, muscle lipid concentrationsof OA, LA, ALA, AA, EPA, and DHA weregraphed as functions of their respective dietarylevels (Fig. 1). Furthermore, our results suggestthat dietary PUFA was used preferentially as asource of energy by the H. huso. The othersthat may have been used similarly as sourcesof energy included stearic acid (C18:0) andcetolic acid (C22:1n − 1 1) and possibly OA.This conclusion is based on the observation oflower concentrations of these FA in the musclelipids than in respective dietary lipids of fish.These findings are in accord with the fatty acidmetabolism abilities of sturgeon species in gen-eral as described by Deng et al. (1998); Hunget al. (1998); and Sener et al. (2005).
The n3/n6 ratio has been suggested as a use-ful indicator to compare the relative nutritional
values of FOs of different species (Pigott andTucker, 1990). It was suggested that a ratio of1:1 to 1:5 would be best for a healthy humandiet (Osman et al. 2001). From the resultsobtained in this study, although the n3/n6 ratioin H huso, was lower than that of the othercultured sturgeons (4.26 for Acipencer spp.[Badiani et al. 1996]; 6.74 for A. naccarii ×A. baerii [hybrid] [Vaccaro et al. 2005]; and4.94 for H. huso [Kaya et al. 2007]). But withthe exception of the SO treatment, the valuesfor all other treatment are within the recom-mended ratio. Also, this ratio was higher inmuscle than in the diets. This could indicate thata threshold level in the muscle was obtained,probably adjusted to a narrowly defined physi-ological level (Bell et al. 1997; Turchini et al.2003); irrespective of dietary treatment; thisminimum level seems to be 0.628. In addi-tion, the PUFA/SFA ratio indicated that H. husowas an average source of PUFA. The minimumvalue of the PUFA/SFA ratio recommended is0.45 (HMSO 1994), which was exceeded in thisstudy (1.08–2.27). Taken together, the resultsobtained from this study suggest that the sub-stitution of FO by examined vegetable oils in H.huso diet seems not to have a negative influenceon H. huso flesh in examined age and under ourtest conditions.
The AI and TI take the interactions amongdifferent fatty acids into account, allowing anintegrated assessment of dietary lipid on humancoronary health (Ulbricht and Southgate 1991).In addition, Ulbricht and Southgate (1991) havereported that lipid nutritional quality and thevalues of the AI or TI are inversely related.Higher values of AI and TI (>1.0) are detri-mental to human health (Bobe et al. 2004).In this study the AI and TI showed signif-icant variation, but were lower in fish feddiets containing vegetable oils (Table 6). Theseresults showed that the use of vegetable oilsin H. huso diet is effective in reducing theSFA, AI, and TI, with consequent benefitson the nutritional quality. Similar results wereobtained in brown trout and largemouth bassfed a diet with fish oil compared with fish feddiets with canola and soybean oils (Turchiniet al. 2003; Subhadra et al. 2006). Furthermore,

486 VALI HOSSEINI ET AL.
Abedian-Kenari et al. (2009) found AI and TIvalues of 0.465–0.698 and 0.441–0.486 forH. huso at different ages, respectively.
Conclusion
Our findings indicate Beluga sturgeon,H. huso, can use SO and CO in diets equallywell, and FO can be replaced by SO and CO,as an alternative lipid sources, in a practical dietfor H. huso without any adverse effects on theirgrowth, general health (survival), or muscleproximate composition. These alternative lipidsources are more cost-effective and marine-resource friendly. It is known that feeding soy-bean and canola oil to fish did not negativelyaffect growth, feed conversion, or survival(Turchini et al. 2003; Almaida-Pagan et al.2007; Grant et al. 2008). However, the lackof a well-balanced fatty acid profile (Sargentet al. 2002), a lower palatability (Thomassenand Rosjo 1989; Guillou et al. 1995; Regostet al. 2003) and digestibility (Caballero et al.2002; Gunasekara et al. 2002), and the even-tual presence of some antinutritional factors(Figueiredo-Silva et al. 2005) may limit thesuccess of vegetable oils as a total animallipid replacement in fish diet. Therefore, fur-ther studies on other aspects of such substitu-tion, that is, FA composition in the liver, his-tological effects, tests on other size and age offish, and enzymatic activities, should be con-ducted to confirm the results found in thisstudy.
Acknowledgments
This study has been partly financed byMazandaran Livestock and Aquatic’s Feed Co.,Sari, Iran. We would like to thank the generalmanager of the company for his support.We thank Seyedeh Hakimeh Hoseini, SeyedMehdi Ojagh, and Mojtaba Mohseni for theirtechnical assistance during the preparation ofthe experimental diets and fish husbandryand also thank Nader Bahramifar and AriaBabakhani for their kind help in the lipidanalyses.
Literature CitedAbdolhay, H. A. and H. B. Tahori. 2006. Fingerling pro-
duction and release for stock enhancement of sturgeonin the southern Caspian Sea: an overview. Journal ofApplied Ichthyology 22:125–131.
Abedian-Kenari, A., J. M. Regenstein, S. V. Hosseini,M. Rezaei, R. Tahergorabi, R. M. Nazari, M.Moghaddasi, and S. A. Kaboli. 2009. Amino acidand fatty acid composition of cultured Beluga (Husohuso) of different ages. Journal of Aquatic FoodProduct Technology 18:245–265.
Aksnes, A. and J. Opstvedt. 1998. Content of digestibleenergy in fish feed ingredients determined by theingredient-substitution method. Aquaculture 161:45–53.
Aksnes, A., T. Hjertnes, and J. Opstvedt. 1996. Effectof dietary protein level on growth and carcass compo-sition in Atlantic halibut (Hippoglossus hippoglossusL.). Aquaculture 145:225–233.
Almaida-Pagan, P. F., M. D. Hernandez, G. B. García,J. A. Madrid, J. De Costa, and P. Mendiola. 2007.Effects of total replacement of fish oil by vegetableoils on n − 3 and n − 6 polyunsaturated fatty aciddesaturation and elongation in sharpsnout seabream(Diplodus puntazzo) hepatocytes and enterocytes.Aquaculture 272:589–598.
Association of Official Analytical Chemists. 2005. Offi-cial methods of analysis, 18th edition. Association ofOfficial Analytical Chemists, Gaithersburg, MD, USA.
Badiani, A., P. Anfossi, L. Fiorentini, P. P. Gatta,M. Manfredini, N. Nanni, S. Stipa, and B. Tolomelli.1996. Nutritional composition of cultured sturgeon(Acipenser spp.). Journal of Food Composition andAnalysis 9:171–190.
Barlow, S. 2000. Fishmeal and fish oil: sustainable feedingredients for aquafeeds. Advocate 4:85–88.
Bell, M. V., R. S. Batty, J. R. Dick, K. Fretwell, J. C.Navarro, and J. R. Sargent. 1995. Dietary deficiencyof docosahexanoic acid impairs vision at low lightintensities in juvenile herring (Clupea harengus L.).Lipids 30:373–376.
Bell, J. G., D. R. Tocher, R. M. Farndale, D. I. Cox,R. W. McKinney, and J. R. Sargent. 1997. Theeffect of dietary lipid on polyunsaturated fatty acidmetabolism in Atlantic salmon (Salmo salar) undergo-ing parr – smolt transformation. Lipids 32:515–525.
Bell, J. G., J. McEvoy, D. R. Tocher, F. McGhee, P. J.Campbell, and J. R. Sargent. 2001. Replacement offish oil with rapeseed oil in diets of Atlantic salmon(Salmo salar) affects tissue lipid compositions andhepatocyte fatty acid metabolism. Journal of Nutrition131:1535–1543.
Bell, J. G., R. J. Henderson, D. R. Tocher, F. McGhee,J. R. Dick, A. Porter, R. P. Smullen, and J. R.Sargent. 2002. Substituting fish oil with crude palmoil in the diet of Atlantic salmon (Salmo salar) affectsmuscle fatty acid composition and hepatic fatty acidmetabolism. Journal of Nutrition 132:222–230.
EFFECT OF DIETARY LIPIDS ON GROWTH OF BELUGA JUVENILES 487
Bendiksen, E. A., A. M. Arnesen, and M. Jobling. 2003.Effects of dietary fatty acid profile and fat content onsmolting and seawater performance in Atlantic salmon(Salmo salar L.). Aquaculture 225:149–163.
Bobe, G., S. Zimmerman, E. G. Hammond, G. Freeman,G. L. Lindberg, and D. C. Beitz. 2004. Textureof butters made from milks differing in indices ofatherogenicity. Iowa State University Animal IndustryReport 2004. A.S. Leaflet R1902.
Bureau, D. P., J. Gibson, A. El-Mowafi. 2002. Review:use of animal fats in aquaculture feeds. L. E. Cruz-Suarez, D. Ricque-Marie, M. Tapia-Salazar, M. G.Gaxiola-Cortes, and N. Simoes, editors. Avances enNutricion Acuícola VI. Memorias del VI SimposiumInternacional de Nutricion Acuícola. 3 al 6 deSeptiembre del 2002. Cancun, Quintana Roo, Mexico.
Caballero, M. J., A. Obach, G. Rosenlund, D. Mon-tero, M. Gisvold, and M. S. Izquierdo. 2002. Impactof different dietary lipid sources on growth, lipiddigestibility, tissue fatty acid composition and histol-ogy of rainbow trout, Oncorhynchus mykiss. Aquacul-ture 214:253–271.
Deng, D. F., S. S. O. Hung, and D. E. Conklin. 1998.White sturgeon (Acipencer transmontanus) requireboth n − 3 and n − 6 fatty acids. Aquaculture (Abs-tracts Lipids and Fatty Acids) 161:333–335.
Duncan, D. 1955. Multiple range tests and multiple F tests.Biometrics 11:1–42.
Ebrahimi, E. and P. Zare. 2006. Growth and survival ofBeluga (Huso huso) and Persian sturgeon (Acipenserpersicus) fingerlings fed by live food and artificial diet.Journal of Applied Ichthyology 22:321–324.
Falahatkar, B. and B. A. Barton. 2007. Preliminaryobservations of physiological responses to acute han-dling and confinement in juvenile Beluga Huso huso.Aquaculture Research 38:1786–1789.
FAO. 2001. “Aquaqulture in the third millenium” UN Foodand Agriculture Organization. http://www.fao.org/fi/meetings/aq2000/tech proc/third mill.asp.
Figueiredo-Silva, A., E. Rocha, J. Dias, P. Silva,P. Rema, E. Gomes, and L. M. P. Valente. 2005.Partial replacement of fish oil by soybean oil onlipid distribution and liver histology in Europeansea bass (Dicentrarchus labrax ) and rainbow trout(Oncorhynchus mykiss) juveniles. Aquaculture Nutri-tion 11:147–155.
Firestone, D. 1998. Official methods and recommendedpractices of the American oil chemists society, vol-umes I–II, 5th edition (Metodo). AOCS, Champaign.
Folch, J., M. Lees, and G. H. Sloan-Stanley. 1957.A simple method for the isolation and purification oftotal lipids from animal tissues. Journal of BiologicalChemistry 226:497–509.
Fountoulaki, E., M. N. Alexis, I. Nengas, and B. Venou.2003. Effects of arachidonic acid (20:4n − 6), ongrowth, body composition, and tissue fatty acid profileof gilthead bream fingerlings (Sparus aurata L.).Aquaculture 225:309–323.
Francis, D. S., G. M. Turchini, P. L. Jones, and S. S.De Silva. 2006. Effects of dietary oil source ongrowth and fillet fatty acid composition of Murray cod,Maccullochella peelii. Aquaculture 253:547–556.
Garcia-Gallego, M., A. Sanz, A. Domezain, and M. Dela Higuera. 1999. Age-size influence on tissue–lipidquality of the sturgeon Acipenser naccari fromintensive culture. Journal of Applied Ichthyology15:261–264.
Grant, A. A. M., D. Baker, D. A. Higgs, C. J. Brauner,J. G. Richards, S. K. Balfry, and P. M. Schulte.2008. Effects of dietary canola oil level on growth,fatty acid composition and osmoregulatory abil-ity of juvenile fall Chinook salmon (Oncorhynchustshawytscha). Aquaculture 277:303–312.
Guillou, A., P. Soucy, M. Khalil, and L. Adambounou.1995. Effects of dietary vegetable and marine lipid ongrowth, muscle fatty acid composition and organolep-tic quality of flesh of brook charr (Salvelinus fonti-nalis). Aquaculture 136:351–362.
Gunasekara, R. M., K. Leelarasamee, and S. De Silva.2002. Lipid and fatty acid digestibility of three oiltypes in the Australian shortfin eel, Anguilla australis.Aquaculture 203:335–347.
Hatlen, B., B. Grisdale-Helland, and S. J. Helland. 2005.Growth, feed utilization and body composition intwo size groups of Atlantic halibut (Hippoglossushippoglossus) fed diets differing in protein andcarbohydrate content. Aquaculture 249:401–408.
Henderson, R. J. and D. R. Tocher. 1987. The lipidcomposition and biochemistry of freshwater fish,Progress in Lipid Research 26:281–347.
HMSO (Her Majesty’s Stationary Office). 1994. Nutri-tional aspects of cardiovascular disease. Report onhealth and social subjects no. 46. London, UK.
Huang, S. S. Y., A. N. Oo, D. A. Higgs, C. J. Brauner,and S. Satoh. 2007. Effect of dietary canola oil levelon the growth performance and fatty acid compositionof juvenile red sea bream, Pagrus major. Aquaculture271:420–431.
Hung, S. S. O., T. Storebakken, Y. Cui, L. Tian, andO. Einen. 1997. High energy diets for white stur-geon (Acipencer transmontanus). Aquaculture Nutri-tion 3:281–286.
Hung, S. S. O., M. A. Herold, A. Gawlicka, and J. dela Noue. 1998. Effects of dietary lipid on growth andfatty acid composition of white sturgeon (Acipensertransmontanus) larve. Aquaculture (Abstracts Lipidsand Fatty Acids) 161:333–335.
Ikonomou, M. G., D. A. Higgs, M. Gibbs, J. Oakes,B. Skura, S. Mckinley, S. K. Balfry, S. Jojnes,R. Withler, and C. Dubetz. 2007. Flesh quality ofmarket-size farmed and wild British Columbia salmon.Environmental Sciences and Technology 41:437–443.
Izquierdo, M. S., A. Obach, L. Arantzamendi,D. Montero, L. Robaina, G. Roselund. 2003. Dietarylipid sources for seabream and seabass: growth perfor-mance, tissue composition and flesh quality. Aquacul-ture Nutrition 9:397–407.
488 VALI HOSSEINI ET AL.
Kaya, Y., H. Turan, and M. E. Erdem. 2007. Fatty acidand amino acid composition of raw and hot smokedsturgeon (Huso huso, L. 1758). International Journalof Food Science and Nutrition 59:635–642.
Koskela, J., M. Jobling, and R. Savolainen. 1998. Influ-ence of dietary fat level on feed intake, growth andfat deposition in the whitefish Coregonus lavaretus.Aquaculture International 6:95–102.
Lane, R. L. and C. C. Kohler. 2006. Effects of dietarylipid and fatty acids on white bass, Morone chrysops,reproductive performance, egg hatchability, and over-all quality of progeny. North American Journal ofAquaculture 68:141–150.
Lane, R. L., J. T. Trushenski, and C. C. Kohler. 2006.Modification of fillet composition and evidence ofdifferential fatty acid turnover in sunshine bass Moronechrysops × M. saxatilis following change in dietarylipid source. Lipids 41:1029–1038.
Lie, Ø., E. Lied, and G. Lambertsen. 1986. Liverretention of fat and of fatty acids in cod (Gadusmorhua) fed different oils. Aquaculture 59:187–196.
Lovell, R. T., T. Miyazaki, and S. Rabegnator. 1984.Requirement for Alpha-tocopherol by channel catfishfed diets low in polyunsaturated triglycerides. Journalof Nutrition 114:894–901.
Madsen, L., A. C. Rustan, H. Vaagenes, K. Berge,E. Dyroy, and R. K. Berge. 1999. Eicosapentanoicand docosahexanoic acid affect mitochondrial andperoxisomal fatty acid oxidation in relation to substratepreference. Lipids 34:951–963.
McKenzie, D. J., G. Piraccini, C. Agnisola, J. F.Steffensen, P. Bronzi, C. L. Bolis, B. Tota, andE. W. Taylor. 1999. The influence of dietary fattyacid composition on the respiratory and cardiovascularphysiology of Adriatic sturgeon (Acipenser naccarii ):a review. Journal of Applied Ichthyology 15:265–269.
Memis, D., M. S. Celikkale, and E. Ercan. 2006.Effects of different diets on growth performance andbody composition of Russian sturgeon (Acipensergueldenstaedtii, Brandt & Ratzenburg, 1833). Journalof Applied Ichthyology 22 (Suppl. 1):287–290.
Mohseni, M., M. Pourkazemi, M. Bahmani,B. Falahatkar, H. R. Pourali, and M. Salehpour.2006. Effects of feeding rate and frequency on growthperformance of yearling great sturgeon, Huso huso.Journal of Applied Ichthyology 22:278–282.
Moreau, Y., J. Arredondo, I. Perraud-Gaime, andS. Roussos. 2003. Dietary utilization of protein andenergy from fresh and ensiled coffee pulp by theNile tilapia, Oreochromis niloticus. Brazilian Archivesof Biology and Technology 46 DOI: 10.1590/S1516-89132003000200014
Mozaffarian, D. and E. B. Rimm. 2006. Fish intake,contaminants, and human health; evaluating the risksand benefits. The Journal of American MedicalAssociation 296:1885–1899.
Ng, W. K., Y. Wang, P. Ketchimenin, and K. H. Yuen.2004. Replacement of dietary fish oil with palmfatty acid distillate elevates tocopherol and tocotrienol
concentrations and increases oxidative stability inthe muscle of African catfish, Clarias gariepinus.Aquaculture 233:423–437.
NRC (Nutrient Requirements of Fish). 1993. Pages 114.National Research Council, National Academy Press,Washington, DC, USA.
Opsahl-Ferstad, H. G., H. Rudi, B. Ruyter, andS. Refstie. 2003. Biotechnological approaches to mod-ify rapeseed oil composition for applications in aqua-culture. Plant Science 165:349–357.
Osman, H., A. R. Suriah, and E. C. Law. 2001. Fattyacid composition and cholesterol content of selectedmarine fish in Malaysian waters. Food Chemistry 73:55–60.
Pigott, G. M. and B. W. Tucker. 1990. Effects oftechnology on nutrition. Marcel Decker, New York,New York, USA.
Rajion, M. A. 1985. Essential fatty acid metabolism in thefetal and neonatal lamb, PhD thesis. The University ofMelbourne, Australia.
Raso, S. and T. A. Anderson. 2003. Effect of dietaryfish oil replacement on growth and carcass proximatecomposition of juvenile barramundi (Lates calcarifer ).Aquaculture Research 34:813–819.
Regost, C., J. Arzel, M. Cardinal, M. Laroche, andS. J. Kaushik. 2001. Fat deposition and flesh qualityin seawater reared, triploid brown trout Salmo truttaas affected by dietary fat levels and starvation.Aquaculture 193:325–345.
Regost, C., J. Arzel, J. Robin, G. Rosenlund, andS. J. Kaushik. 2003. Total replacement of fish oil bysoybean or linseed oil with a return to fish oil in Turbot(Psetta maxima). Aquaculture 220:737–747.
Robin, J. H., C. Regost, J. Arzel, and S. J. Kaushik.2003. Fatty acid profile of fish following a changein dietary fatty acid source: model of fatty acidcomposition with a dilution hypothesis. Aquaculture225:283–293.
Sargent, J. R., D. R. Tocher, and J. G. Bell. 2002. Thelipids. Pages 239–243 in J. E. Halver and R. W.Hardy, editors. Fish nutrition Academic Press, London,UK.
Sener, E., M. Yildiz, and E. Savas. 2005. Effects of dietarylipids on growth and fatty acid composition in Rus-sian Sturgeon (Acipenser gueldenstaedtii ) juveniles.Turkish Journal of Veterinary and Animal Sciences29:1101–1107.
Sturgeon Specialist Group. 1996. Huso huso. IUCN 2004Red List of Threatened Species. Accessed January 28,2006 at http://www.iucnredlist.org.
Subhadra, B., R. Lochmann, S. Rawles, and R. Chen.2006. Effect of dietary lipid source on the growth,tissue composition and hematological parameters oflargemouth bass (Micropterus salmoides). Aquaculture255:210–222.
Thomassen, M. S. and C. Rosjo. 1989. Different fatsin feed for salmon: influence on sensory parameters,growth rate and fatty acids in muscle and heart.Aquaculture 79:129–135.
EFFECT OF DIETARY LIPIDS ON GROWTH OF BELUGA JUVENILES 489
Tocher, D. R. 2003. Metabolism and functions of lipidsand fatty acids in teleost fish. Reviews in FisheriesScience 11:107–184.
Turchini, G. M., T. Mentasti, L. Frøyland, E. Orban,F. Caprino, V. M. Moretti, F. Valfre. 2003. Effectsof alternative dietary lipid sources on performance,tissue chemical composition, mitochondrial fatty acidoxidation capabilities and sensory characteristics inbrown trout (Salmo trutta L.). Aquaculture 225:251–267.
Ulbricht, T. L. V. and D. A. T. Southgate. 1991. Coro-nary heart disease: Seven dietary factors. The Lancet338:985–994.
Vaccaro, A. M., G. Buffa, C. M. Messina, A. Santulli,and A. Mazzola. 2005. Fatty acid composition ofa cultured sturgeon hybrid, Acipenser naccarii ×Acipenser baerii. Food Chemistry 93:627–631.
Wang, N., X. Xu, and P. Kestemont. 2009. Effectof temperature and feeding frequency on growthperformances, feed efficiency and body composition ofpikeperch juveniles (Sander lucioperca). Aquaculture289:70–73.
Wathne, E. 1995. Strategies for directing slaughter qualityof farmed Atlantic salmon (Salmo salar) with empha-sis on diet composition and fat deposition. Dr scient.thesis, Norges Landbruks Høgskole, As. 230 pp.
Xu, R., S. S. O. Hung, and J. B. German. 1993. Whitesturgeon tissue fatty acid compositions are affected bydietary lipids. Journal of Nutrition 123:1685–1692.
Zareh, G., R. Porgholam, A. Shenavar, A. Jafari, andM. Saifzadeh. 2006. Quality assessment of variousmeat processing modes for meat from 2-year-oldfarmed Huso huso. Journal of Applied Ichthyology22:422–426.
Copyright © 2022 FDOKUMEN