Electronic Tagging of Green Sturgeon Reveals Population Structure and Movement among Estuaries
15
Transactions of the American Fisheries Society 140 108 122, 2011 C American Fisheries Society 2011 ISSN 0002-8487 print 1548-8659 online DOI 10.1080 00028487.2011.557017 ARTIC E Electronic Tagging of Green Sturgeon Reveals Population Structure and Movement among Estuaries Steven T. indley National Marine Fisheries Service, Southwest Fisheries Science Center, 110 Shaffer Road, Santa Cruz, California 95060, USA Daniel . Erickson 1 Marine Program, WildlifeConservation Society, Bronx Zoo, 2300 Southern Boulevard, Bronx, New York 10460, USA Mary . Moser and Greg Williams National Marine Fisheries Service, Northwest Fisheries Science Center, 2725 Montlake Boulevard East, Seattle, Washington 98112, USA Olaf P. angness Washington Department of Fish and Wildlife, 2108 Grand Boulevard, Vancouver, Washington 98661, USA Barry W. McCovey Jr. and Michael Belchik Yurok Tribal Fisheries Program, Highway 96, Weitchpec, California 95546, USA Dave Vogel Natural Resource Scientists, Inc., Post Office Box 1210, Red Bluff, California 96080, USA William Pinnix U.S. Fish and Wildlife Service, 1655 Heindon Road, Arcata, California 95521, USA John T. elly, 2 Joseph C. Heublein, 3 and A. Peter limley Department of Wildlife, Fish, and Conservation Biology, University of California, 1334 Academic Surge, Davis, California 95616, USA Abstract Green sturgeon Acipenser medirostris spend much of their lives outside of their natal rivers, but the details of their migrations and habitat use are poorly known, which limits our understanding of how this species might be affected by human activities and habitat degradation. We tagged 355 green sturgeon with acoustic transmitters on their spawning grounds and in known nonspawning aggregation sites and examined their movement among these sites and other Corresponding author steve.lindley noaa.gov 1 Present address Oregon Department of Fish and Wildlife, Marine Resources Program, 2040 Southeast Marine Science Drive, Newport, Oregon 97365, USA. 2 Present address U.S. Geological Survey, Conte Anadromous Fish Research Center, One Anadromous Way, Turners Falls, Massachusetts 01376, USA. 3 Present address National Marine Fisheries Service, Southwest Regional Office, 777 Sonoma Avenue, Room 325, Santa Rosa, California 95404, USA. Received April 14, 2010 accepted November 14, 2010 108 Downloaded By: [Holzweissig, Kay] At: 18:48 8 March 2011
-
Upload
independent -
Category
Documents
-
view
1 -
download
0
Transcript of Electronic Tagging of Green Sturgeon Reveals Population Structure and Movement among Estuaries
Transactions of the American Fisheries Society 140:108–122, 2011C© American Fisheries Society 2011ISSN: 0002-8487 print / 1548-8659 onlineDOI: 10.1080/00028487.2011.557017
ARTICLE
Electronic Tagging of Green Sturgeon Reveals PopulationStructure and Movement among Estuaries
Steven T. Lindley*National Marine Fisheries Service, Southwest Fisheries Science Center, 110 Shaffer Road, Santa Cruz,California 95060, USA
Daniel L. Erickson1
Marine Program, Wildlife Conservation Society, Bronx Zoo, 2300 Southern Boulevard, Bronx,New York 10460, USA
Mary L. Moser and Greg WilliamsNational Marine Fisheries Service, Northwest Fisheries Science Center, 2725 Montlake Boulevard East,Seattle, Washington 98112, USA
Olaf P. LangnessWashington Department of Fish and Wildlife, 2108 Grand Boulevard, Vancouver, Washington 98661, USA
Barry W. McCovey Jr. and Michael BelchikYurok Tribal Fisheries Program, Highway 96, Weitchpec, California 95546, USA
Dave VogelNatural Resource Scientists, Inc., Post Office Box 1210, Red Bluff, California 96080, USA
William PinnixU.S. Fish and Wildlife Service, 1655 Heindon Road, Arcata, California 95521, USA
John T. Kelly,2 Joseph C. Heublein,3 and A. Peter KlimleyDepartment of Wildlife, Fish, and Conservation Biology, University of California, 1334 Academic Surge,Davis, California 95616, USA
AbstractGreen sturgeon Acipenser medirostris spend much of their lives outside of their natal rivers, but the details of their
migrations and habitat use are poorly known, which limits our understanding of how this species might be affected byhuman activities and habitat degradation. We tagged 355 green sturgeon with acoustic transmitters on their spawninggrounds and in known nonspawning aggregation sites and examined their movement among these sites and other
*Corresponding author: [email protected] address: Oregon Department of Fish and Wildlife, Marine Resources Program, 2040 Southeast Marine Science Drive, Newport, Oregon 97365, USA.2Present address: U.S. Geological Survey, Conte Anadromous Fish Research Center, One Anadromous Way, Turners Falls, Massachusetts 01376, USA.3Present address: National Marine Fisheries Service, Southwest Regional Office, 777 Sonoma Avenue, Room 325, Santa Rosa, California 95404, USA.Received April 14, 2010; accepted November 14, 2010
108
Downloaded By: [Holzweissig, Kay] At: 18:48 8 March 2011
POPULATION STRUCTURE AND MOVEMENT OF GREEN STURGEON 109
potentially important locations using automated data-logging hydrophones. We found that green sturgeon inhabit anumber of estuarine and coastal sites over the summer, including the Columbia River estuary, Willapa Bay, GraysHarbor, and the estuaries of certain smaller rivers in Oregon, especially the Umpqua River estuary. Green sturgeonfrom different natal rivers exhibited different patterns of habitat use; most notably, San Francisco Bay was used onlyby Sacramento River fish, while the Umpqua River estuary was used mostly by fish from the Klamath and Roguerivers. Earlier work, based on analysis of microsatellite markers, suggested that the Columbia River mixed stock wasmainly composed of fish from the Sacramento River, but our results indicate that fish from the Rogue and KlamathRiver populations frequently use the Columbia River as well. We also found evidence for the existence of migratorycontingents within spawning populations. Our findings have significant implications for the management of the threat-ened Sacramento River population of green sturgeon, which migrates to inland waters outside of California whereanthropogenic impacts, including fisheries bycatch and water pollution, may be a concern. Our results also illustratethe utility of acoustic tracking to elucidate the migratory behavior of animals that are otherwise difficult to observe.
The southern distinct population segment (DPS) of greensturgeon Acipenser medirostris is listed as a threatened speciesunder the U.S. Endangered Species Act, and the northern DPSis of conservation concern. Much of the concern about the sta-tus of southern DPS green sturgeon stems from the extensivemodification and degradation of habitats within their natal riverbasin, the Sacramento River in northern California (Adams et al.2007). Because green sturgeon are highly migratory they mayalso be affected by activities far outside of their natal river basin.After one to a few years of rearing in freshwater, juvenile greensturgeon move into the estuary of their natal river and then to theocean, where they spend 10–15 years before maturing (Moyle2002; Allen and Cech 2007; Allen et al. 2009). Mature greensturgeon spawn every 2 to 4 years, at least in the northern DPS(Erickson and Webb 2007). In summer months, subadult andadult green sturgeon that are not spawning may remain in theocean or aggregate in the estuaries of certain nonnatal rivers be-tween central California and the Fraser River, British Columbia,as well as in the larger bays on the West Coast, including GraysHarbor, Willapa Bay, Humboldt Bay, and San Francisco–SanPablo Bay (Adams et al. 2007; Moser and Lindley 2007; Lind-ley et al. 2008; Heublein et al. 2009).
Estuaries and bays are frequently sites of intense humanactivity and have the potential to detrimentally affect greensturgeon populations. In the past and present these activitieshave included commercial and recreational fisheries (ODFWand WDFW 2002), wetland filling, shellfish aquaculture and itsattendant use of pesticides (Simenstad and Fresh 1995; Dum-bauld et al. 2008), dredging of shipping lanes and anchorages,dredge spoil disposal, and municipal and industrial effluent dis-charge. In the future, tidal energy facilities may add to the im-pacts on green sturgeon and their estuarine habitats.
The population structure of green sturgeon has been de-scribed primarily on the basis of genetic data. These data showthat spawning groups in the Sacramento River are differentiatedfrom those in the Rogue and Klamath rivers (Israel et al. 2004)and that the proportions of southern DPS and northern DPSgreen sturgeon vary considerably among nonnatal river estuar-ies and coastal embayments (Israel et al. 2009), which suggests
that fish from different distinct population segments may usenonnatal habitats differently. Fish may also exhibit intrapop-ulation variability in migratory behavior and habitat use, asexemplified by migratory contingents in populations of stripedbass Morone saxatilis (Clark 1968) and Japanese eel Anguillajaponica (Tzeng et al. 2003). Such structuring within popula-tions would not be easily revealed by genetic data, yet vari-ation in migratory behavior can have important consequencesfor management because migration determines a population’saccessibility to human impacts (Secor 1999; Cadrin and Secor2009). It is therefore crucial to understand how green sturgeonuse different habitats and whether there is variation in migratorybehavior within and between populations.
Recently, electronic tagging has been applied to questions ofpopulation structure and migratory behavior with notable suc-cess (e.g., Lutcavage et al. 1999; Hunter et al. 2004; Block et al.2005; Lindley et al. 2008). For species such as green sturgeonthat frequently aggregate at different times and places over thecourse of their life history, acoustic tags are an attractive tech-nology. Fish can be captured at locations where they are locallyabundant, and their subsequent movements can be followed bymeans of automated data-logging hydrophones. Acoustic tagsobviate the need to physically recapture the fish, overcoming theproblem of low recapture rates that have limited the utility ofconventional sturgeon tagging programs. Also, acoustic tags areless expensive than pop-up satellite archival tags, and becausethey can be implanted internally, multiyear deployments are fea-sible, potentially allowing investigators to directly observe thefull cycle of migratory behaviors of individual fish.
In this paper, we report the results of a large-scale tagging andtracking experiment in which green sturgeon were tagged withlong-lived acoustic transmitters in spawning rivers and summeraggregation sites and their subsequent movements monitoredwith automated hydrophones deployed in various rivers, estu-aries, and bays between San Francisco and the Fraser River. Insome cases, these hydrophones had been deployed for studiesof other organisms or for local studies, but they proved usefulfor our purpose because a common technology was used anddata were shared effectively. We used these tagging results to
Downloaded By: [Holzweissig, Kay] At: 18:48 8 March 2011
110 LINDLEY ET AL.
test the hypotheses that green sturgeon populations correspondto individual spawning rivers and that green sturgeon exhibitvariability in their migratory behavior among and within popu-lations.
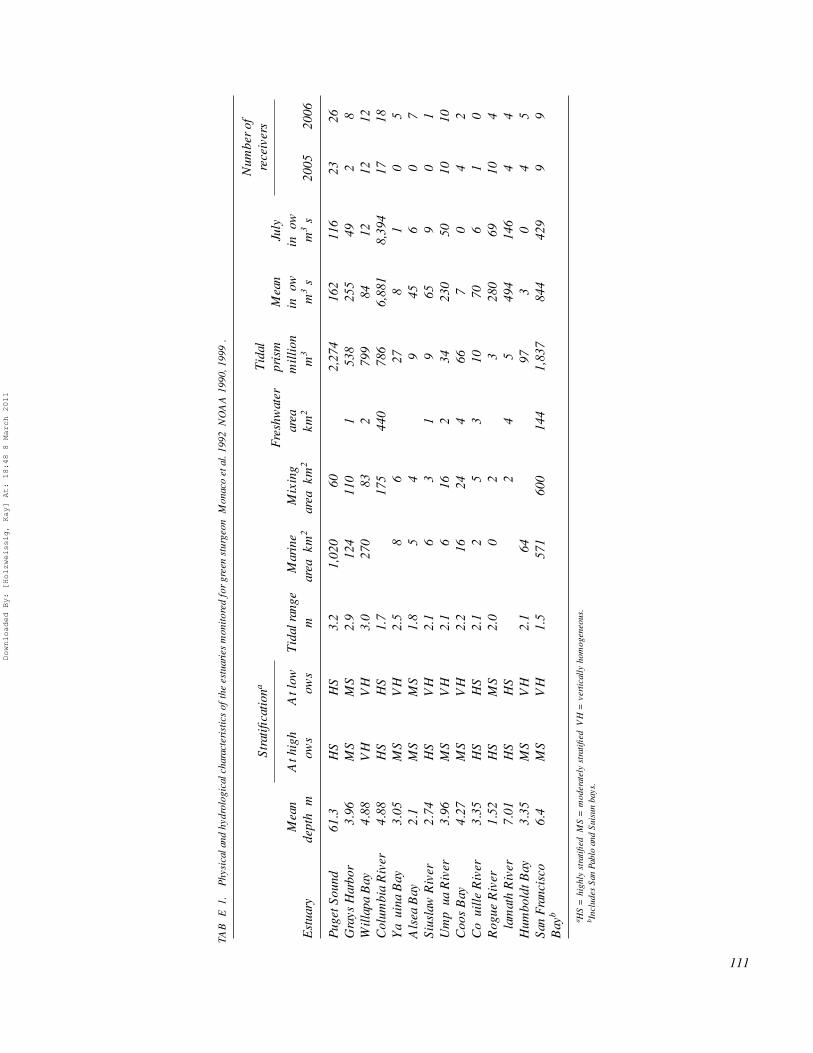
METHODSStudy area.—The physical and hydrological characteristics
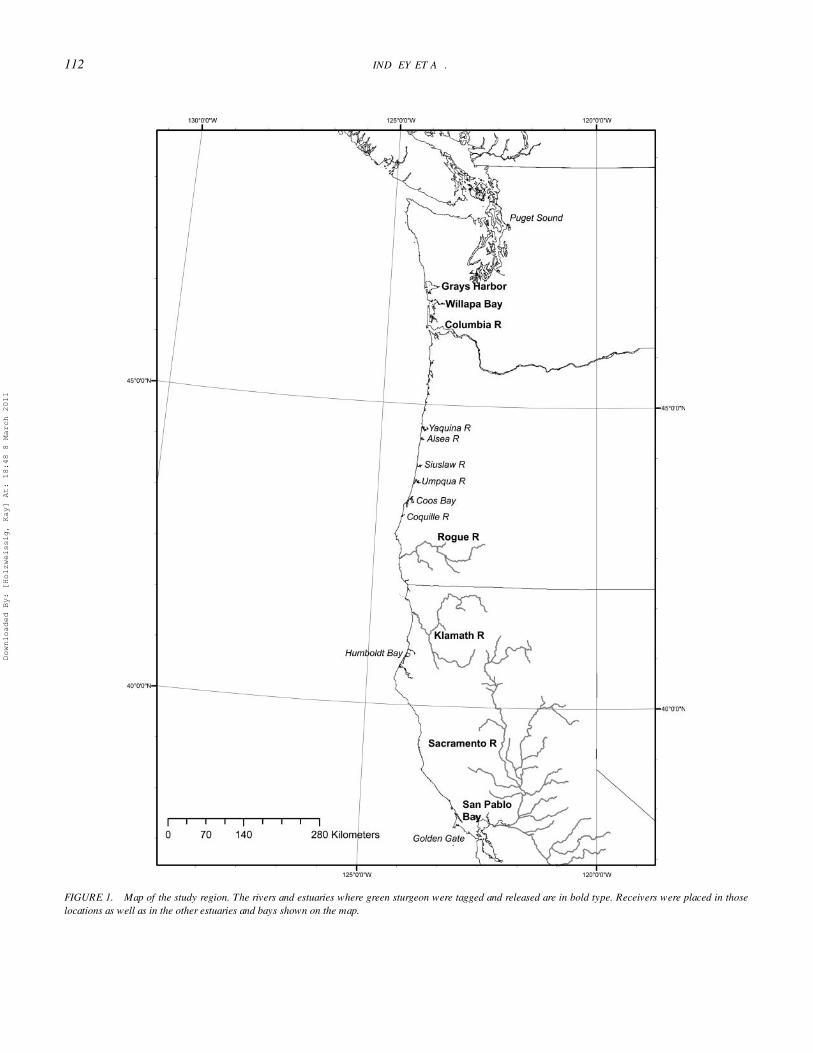
of the study estuaries are summarized in Table 1 (data fromMonaco et al. 1992). Green sturgeon spawn in the Sacramento,Klamath and Rogue rivers (Figure 1). The Sacramento Riverhas an extensive estuary that includes San Francisco, San Pablo,and Suisun bays. In contrast, the Klamath and Rogue rivers havevery small estuaries. Nonnatal estuaries monitored for taggedgreen sturgeon included river estuaries along the Oregon coast(Yaquina, Alsea, Coos, Siuslaw, Umpqua, and Coquille rivers),a medium-sized embayment in northern California (HumboldtBay), the large embayments in coastal Washington (WillapaBay and Grays Harbor), the Columbia River estuary, and theextensive fjord system of Puget Sound.
Fish capture and tagging.—Details of the fish capture, han-dling, and surgical procedures are given by Erickson and Webb(2007), Kelly et al. (2007), and Moser and Lindley (2007) andare only briefly reviewed here. Green sturgeon were capturedprimarily with gill nets, although some were caught by anglingusing ghost shrimp (Callianassidae) as bait. In rivers wheregreen sturgeon spawn, small, sinking, monofilament gill nets(∼33 m long) were deployed from jet boats in suspected holdingareas, typically deep pools (>5 m depth). Nets were fished for30–60 min during daylight. In bays and estuaries, larger sinkinggill nets (∼100 m long) were deployed by means of commercialgill-net boats, with sets lasting 20–45 min. Total length (TL)and fork length (FL) of each captured fish was measured, andgreen sturgeon at least 1.1 m TL were retained for tagging.
Over the 2002–2005 period, green sturgeon were tagged inthe Columbia River estuary, the Klamath River, the Rogue River,San Pablo Bay, the Sacramento River, Willapa Bay, and GraysHarbor (Table 2; Figure 1). Uniquely coded ultrasonic pingertags (Vemco V16–6H and V16–5H) were implanted surgicallyinto the abdominal cavity of the sturgeon. The V16 tag is 90 mmlong, 16 mm in diameter, and weighs 14 g in water. This is lessthan 0.2% of the weight of the smallest green sturgeon taggedand well within the recommended maximum tag size to bodysize ratio suggested by Chittenden et al. (2009). Tag life rangedfrom 3 to 5 years, depending on pulse transmission configura-tion. A variety of pulse transmission rates that ranged from 90to 120 s nominal delay were used. Tags were sterilized withbenzalkonium chloride and inserted through a 2.5-cm incisionthat was made 2 cm from the ventral midline, midway betweenthe pectoral and pelvic fins. Incisions were closed with sutures,and the fish were released immediately.
Receiver deployments.—Tagged green sturgeon were de-tected with passive hydrophones (Vemco; Model VR2) that logthe identity and time of tags within their range (up to 1 kmunder favorable conditions for V16 tags) during 2005 and 2006.Receivers were deployed in natal rivers and estuaries—the es-
tuaries of select nonnatal rivers known to be used by greensturgeon—and large bays (Table 1; Figure 1). Coverage of es-tuaries during our study period included all estuaries whereEmmett et al. (1991) indicated that green sturgeon are common,except for the Eel River estuary (which was covered in 2007; asingle green sturgeon was detected at this site that year). Em-mett et al. (1991) reported that green sturgeon are rare in PugetSound and the Siuslaw River (both covered) and not present inother West Coast estuaries.
Arrays were deployed in three different spatial arrangements.In Willapa Bay, Humboldt Bay, and Puget Sound, receiverswere deployed over a broad area within the estuary to detectmovement of tagged green sturgeon within these estuaries (seeAndrews et al. 2007 for an example). In the lower ColumbiaRiver, Grays Harbor in 2006, and at the Golden Gate, receiverswere arranged in lines across the estuary to detect movement oftagged fish (including salmonids carrying relatively low-powertags) in and out of the estuary. Spacing between receivers wasapproximately 700 m and thus allowed substantial overlap of de-tection coverage. In 2005, Grays Harbor had only two receiversthat were deployed near the mouth of the Chehalis River. In thatyear, green sturgeon could enter and exit Grays Harbor with-out being detected if they did not approach the Chehalis River(at the eastern end of the estuary). In the remaining small riverestuaries, one or more receivers were placed in the channel intidal waters such that tagged fish would be well within detectionrange of the receivers as they passed. We therefore expectedthat green sturgeon entering the study estuaries would generallybe detected by one or more receivers, although under some un-usual conditions detection ranges could be suppressed to suchan extent that tagged sturgeon could pass undetected.
Deployment methods differed by location and included theuse of submerged moorings with acoustic releases (InterOceans;Model 111) in deep areas (e.g., at the entrance to San FranciscoBay), submerged moorings tethered to shore by steel cables(e.g., the entrance to Humboldt Bay), surface moorings, andattachment to structures such as navigation buoys, pilings, andbridge abutments (Grays Harbor, Willapa Bay, and Oregon baysand rivers).
Data analysis.—In the analysis of detection data, we exam-ined detections of fish that had been at large for at least onewinter before detection. This delay allowed the green sturgeonto move away from the area where they were tagged, undertaketheir winter migration, and then potentially distribute them-selves among various estuarine habitats.
We used logistic regression to examine whether fish lengthand release location influenced whether a fish was detected atone of the monitoring sites. Logistic regression models have theform
log[πi/(1 − πi)] = xTi · β, (1)
where πi is the probability of detection at the ith site, xTi
is a vector of covariables that includes both continuous vari-ables (fish length and the site characteristics total surface area,
Downloaded By: [Holzweissig, Kay] At: 18:48 8 March 2011
TAB
LE
1.Ph
ysic
alan
dhy
drol
ogic
alch
arac
teri
stic
sof
the
estu
arie
sm
onito
red
for
gree
nst
urge
on(M
onac
oet
al.1
992;
NO
AA
1990
,199
9).
Stra
tifica
tiona
Num
ber
ofre
ceiv
ers
Est
uary
Mea
nde
pth
(m)
Ath
igh
flow
sA
tlow
flow
sT
idal
rang
e(m
)M
arin
ear
ea(k
m2 )
Mix
ing
area
(km
2 )
Fres
hwat
erar
ea(k
m2 )
Tid
alpr
ism
(mill
ion
m3 )
Mea
nin
flow
(m3 /s
)
July
inflo
w(m
3 /s)
2005
2006
Puge
tSou
nd61
.3H
SH
S3.
21,
020
602,
274
162
116
2326
Gra
ysH
arbo
r3.
96M
SM
S2.
912
411
01
538
255
492
8W
illap
aB
ay4.
88V
HV
H3.
027
083
279
984
1212
12C
olum
bia
Riv
er4.
88H
SH
S1.
717
544
078
66,
881
8,39
417
18Y
aqui
naB
ay3.
05M
SV
H2.
58
627
81
05
Als
eaB
ay2.
1M
SM
S1.
85
49
456
07
Sius
law
Riv
er2.
74H
SV
H2.
16
31
965
90
1U
mpq
uaR
iver
3.96
MS
VH
2.1
616
234
230
5010
10C
oos
Bay
4.27
MS
VH
2.2
1624
466
70
42
Coq
uille
Riv
er3.
35H
SH
S2.
12
53
1070
61
0R
ogue
Riv
er1.
52H
SM
S2.
00
23
280
6910
4K
lam
ath
Riv
er7.
01H
SH
S2
45
494
146
44
Hum
bold
tBay
3.35
MS
VH
2.1
6497
30
45
San
Fran
cisc
oB
ayb
6.4
MS
VH
1.5
571
600
144
1,83
784
442
99
9
a HS
=hi
ghly
stra
tified
;MS
=m
oder
atel
yst
ratifi
ed;V
H=
vert
ical
lyho
mog
eneo
us.
b Incl
udes
San
Pabl
oan
dSu
isun
bays
.
111
Downloaded By: [Holzweissig, Kay] At: 18:48 8 March 2011
112 LINDLEY ET AL.
FIGURE 1. Map of the study region. The rivers and estuaries where green sturgeon were tagged and released are in bold type. Receivers were placed in thoselocations as well as in the other estuaries and bays shown on the map.
Downloaded By: [Holzweissig, Kay] At: 18:48 8 March 2011
POPULATION STRUCTURE AND MOVEMENT OF GREEN STURGEON 113
TABLE 2. Summary of green sturgeon release groups. Abbreviations are as follows: N = number tagged and released; min, max = minimum and maximumlengths.
Location Release year N Mean TL (cm) SD Min Max
Columbia River 2004 12 171 21 139 210Grays Harbor 2005 39 173 23 124 240Klamath River 2002 12 188 13 164 207
2003 24 185 15 155 2202004 8 191 12 175 2132005 8 186 13 173 203
Rogue River 2002 10 171 11 153 1962003 44 180 17 145 2162004 4 177 10 168 189
Sacramento River 2005 54 188 14 161 213San Pablo Bay 2004 54 135 20 110 203
2005 39 151 23 115 204Willapa Bay 2003 30 153 19 120 195
2004 17 149 21 122 198
surface area of the mixing zone, and average annual inflow) anddummy variables that correspond to factors (detection and re-lease sites and their interaction, and site characteristics such asthe degree of stratification during high- and low-flow periods),and β is a vector of parameters. The main effects of release siteand detection site are not of particular interest, as we expectthe detection locations to have different detection rates due todifferences in receiver coverage. Similarly, release groups maydiffer in their overall detection probabilities due to differentialsurvival or other vagaries of the sampling. It is the interactionbetween release and detection sites that is of particular interest,as this is what indicates whether different release groups havedifferent distributions among estuaries. The relative effect ofrelease location, fish length, and physical attributes of the estu-aries on detection probabilities was determined by comparingthe fit of models with and without these terms using Akaike’sinformation criterion (AIC; Akaike 1974). Models with lowerAIC scores are preferred, and a difference of more than 2 isconsidered to indicate a substantially better fit (Burnham andAnderson 1998).
To gain some insight into potential differences in migratorybehavior among individual green sturgeon, we characterizedeach individual in terms of whether it was detected at differentnonnatal estuaries and bays and in quarters of the years 2005 and2006. Further analysis was conducted on 121 green sturgeon thatwere detected at three or more time–place combinations. Detec-tion or nondetection at the set of time and place combinationswas represented by a vector of ones and zeros. Dissimilarity ofthe migration history vectors of any two individuals was quan-tified by Jaccard’s distance, Jd, (Legendre and Legendre 1998),determined as
Jd = 1 − a
a + b + c= b + c
a + b + c, (2)
where a is the number of locations where both individuals werepresent, and b and c are the numbers of locations where oneof the individuals was present but not the other. Note that jointabsences do not effect Jd. We then created a binary cluster treefrom the matrix of Jd values using the unweighted pair-groupmethod with arithmetic mean algorithm. The binary cluster treewas used to order individual presence–absence plots such thatsimilar histories were plotted near each other. To identify which,if any, of the clusters identified by the clustering analysis werestatistically significant, we used the similarity profile methodof Clarke et al. (2008) as implemented in PRIMER version6 with 1,000 permutations and a significance level of 0.01.Potential differences in the length of fish in putative clusterswere investigated with analysis of variance (ANOVA).
The probability that a green sturgeon entering an estuarywould be detected by receivers in that estuary was evaluatedwith capture–recapture models for closed populations (Borcherset al. 2002). The population in this context is assumed to con-sist of those green sturgeon making use of the estuary duringsome or all of a season, and individual receivers are viewed ascapture “occasions.” The simplest model assumes that all re-ceivers have the same detection probability. A more realisticmodel allows detection probabilities to vary among receivers.Finally, we considered the heterogeneity models of Pledger(2000), which allow for the population to consist of two or moregroups of animals with different detection probabilities. Het-erogeneity in detection probabilities could arise if, for example,some green sturgeon reside in an estuary for much of the sea-son while others are transients. Accounting for heterogeneousdetection probabilities can reduce the bias that arises from vio-lating the assumption that all animals have equal detection prob-abilities. These different capture–recapture models were fit tothe green sturgeon detection data with Program MARK (White2008).
Downloaded By: [Holzweissig, Kay] At: 18:48 8 March 2011
114 LINDLEY ET AL.
TABLE 3. Models of the distribution of tagged green sturgeon among detec-tion sites. Abbreviations are as follows: R = release site; D = detection site;Ea = total estuary area; Sh, Sl = stratification during high and low flows; Ma
= mixing zone area; F = average inflow; null = common mean; and AIC =Akaike information criterion.
Detectionyear Model AIC
2005 R + D + R × D 803.8R + D 885.2D 916.8R + Ea + Sh + Sl + Ma
+ F1,009
Ea + Sh + Sl + Ma + F 1,036R 1,107Null 1,133
2006 R + D + R × D 1,309R + D 1,386D 1,523R 1,558R + Ea + Sh + Sl + Ma
+ F1,529
Ea + Sh + Sl + Ma + F 1,662Null 1,690
RESULTSDetection probabilities for receiver arrays were estimated to
be quite high, with maximum likelihood estimates ranging from98% to 100% depending on the estuary and model. Given thehigh detection rates and similarity of estimates among mod-els, we did not attempt to expand observations for detectionefficiency.
In both 2005 and 2006, fish from different release sites weredistributed differently among detection sites, as indicated by themuch lower AIC value for the model that included the interac-tion between release and detection site effects (Table 3). Thesignificant effect of release site indicates that overall detectionrates were not the same for all groups, and the significant effectof detection site indicates that rates of detection varied amongdetection sites for all release groups. Models with effects dueonly to physical characteristics of the estuary fit the data poorlycompared with the best model, but they did have better fit thanthe null model and the model that allowed for differences dueonly to release group, which suggests that some variation inthe use of estuaries is related to physical differences among theestuaries.
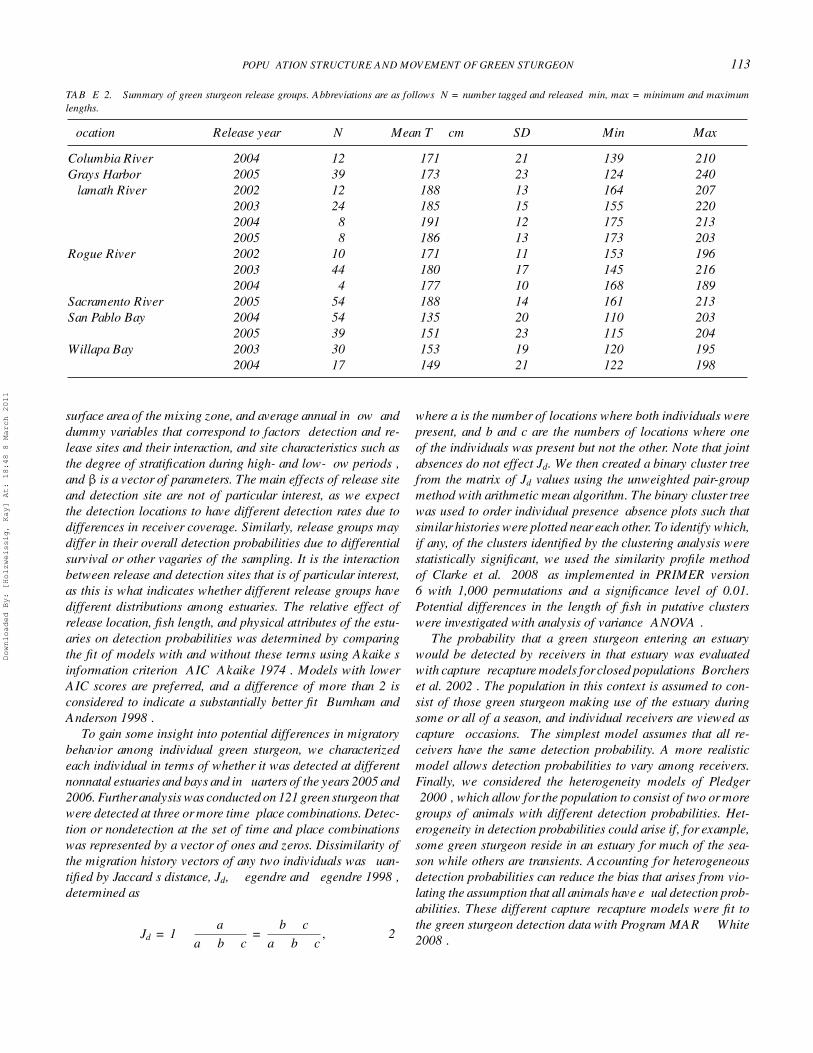
2005 DetectionsWillapa Bay, the lower Columbia River, the Umpqua River
estuary, and the Golden Gate area of San Francisco Bay wereused by many tagged green sturgeon in 2005 (Figure 2). Thetemporal pattern of detections in the nonnatal estuaries wassimilar, with peak numbers of individuals observed in summer
FIGURE 2. Numbers of individual green sturgeon tagged in 2004 or earlierand detected at detection sites in 2005, by month. The gray bars along the x-axesindicate the periods of receiver deployment. The plots are arranged from northto south.
months. Natal estuaries were used less frequently, and detectionsbegan earlier in the year (February–March). No tagged greensturgeon were detected in the Coquille River estuary.
Green sturgeon exhibited fidelity to natal rivers: fish taggedin the Sacramento River or San Pablo Bay were frequently
Downloaded By: [Holzweissig, Kay] At: 18:48 8 March 2011
POPULATION STRUCTURE AND MOVEMENT OF GREEN STURGEON 115
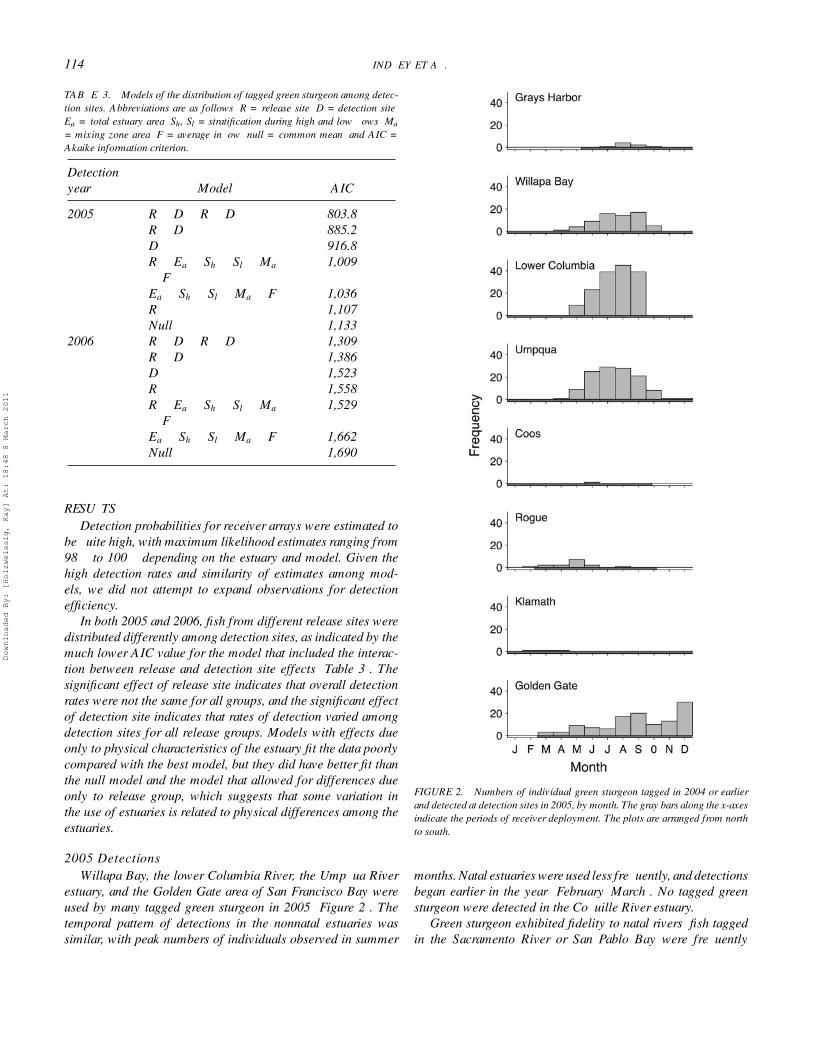
FIGURE 3. Detections of green sturgeon tagged at five tagging locations in 2004 or earlier at detection locations in 2005. The panel for the tagging locations arearranged from north to south; n = the size of the release group.
detected in San Pablo Bay but were never detected in the Kla-math or Rogue river estuaries, while green sturgeon tagged inthose rivers were detected as they returned to those river estuar-ies but were not detected in San Francisco Bay (Figure 3). Greensturgeon tagged in the Rogue and Klamath rivers also made ex-tensive use of the lower Columbia River and the Umpqua Riverestuary and lesser use of Willapa Bay. Those green sturgeontagged in San Pablo Bay, and presumably of southern DPS ori-gin, were also detected at a high rate in the lower Columbia Riverand in San Francisco Bay; four fish were detected in WillapaBay, and a single fish entered Coos Bay for a brief period.
Green sturgeon tagged in Willapa Bay or the lower ColumbiaRiver, which were potentially of Klamath, Rogue, or Sacramentoriver origin, moved freely between the lower Columbia Riverand Willapa Bay (Figure 3). In both cases, two fish from theserelease groups were detected at the Golden Gate and one was de-
tected in the Umpqua River. None were detected in the Klamathor Rogue rivers in 2005.
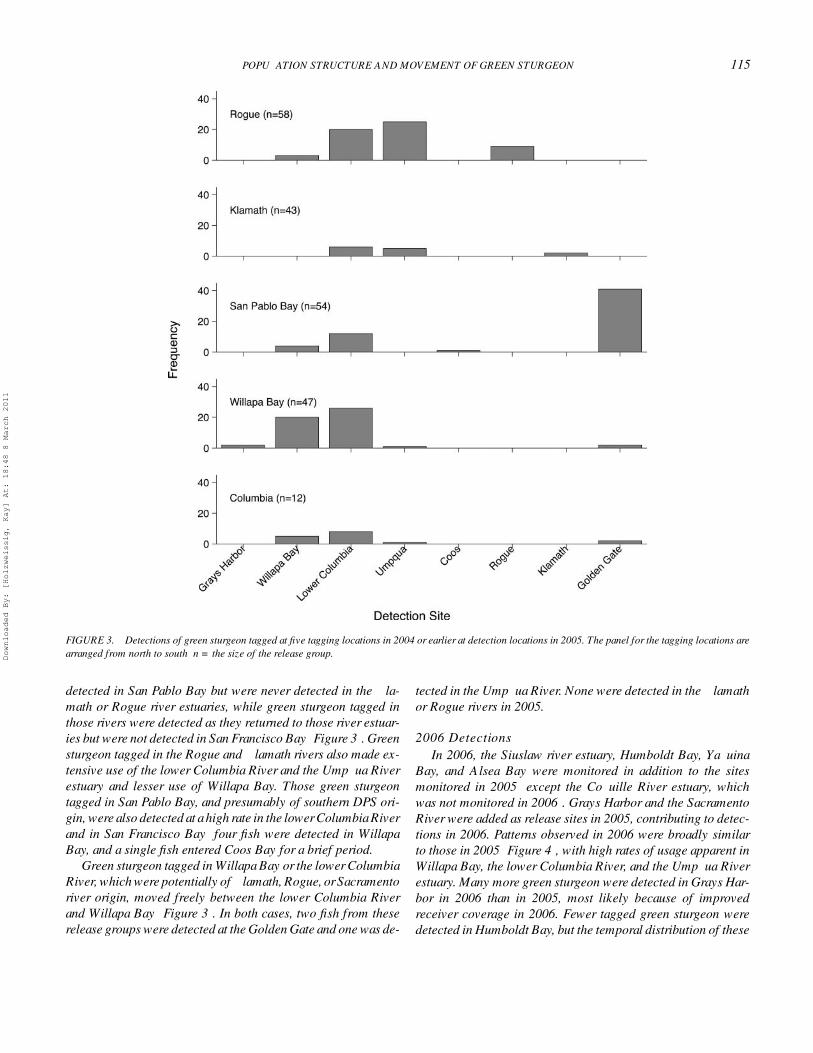
2006 DetectionsIn 2006, the Siuslaw river estuary, Humboldt Bay, Yaquina
Bay, and Alsea Bay were monitored in addition to the sitesmonitored in 2005 (except the Coquille River estuary, whichwas not monitored in 2006). Grays Harbor and the SacramentoRiver were added as release sites in 2005, contributing to detec-tions in 2006. Patterns observed in 2006 were broadly similarto those in 2005 (Figure 4), with high rates of usage apparent inWillapa Bay, the lower Columbia River, and the Umpqua Riverestuary. Many more green sturgeon were detected in Grays Har-bor in 2006 than in 2005, most likely because of improvedreceiver coverage in 2006. Fewer tagged green sturgeon weredetected in Humboldt Bay, but the temporal distribution of these
Downloaded By: [Holzweissig, Kay] At: 18:48 8 March 2011
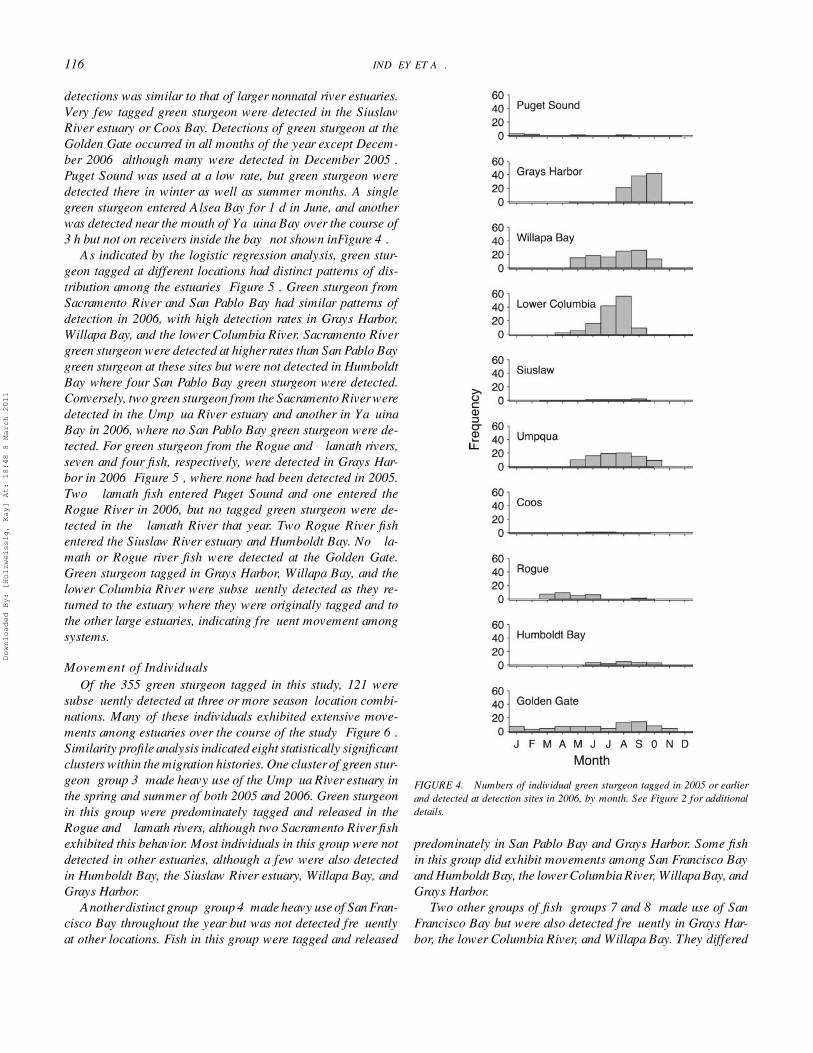
116 LINDLEY ET AL.
detections was similar to that of larger nonnatal river estuaries.Very few tagged green sturgeon were detected in the SiuslawRiver estuary or Coos Bay. Detections of green sturgeon at theGolden Gate occurred in all months of the year except Decem-ber 2006 (although many were detected in December 2005).Puget Sound was used at a low rate, but green sturgeon weredetected there in winter as well as summer months. A singlegreen sturgeon entered Alsea Bay for 1 d in June, and anotherwas detected near the mouth of Yaquina Bay over the course of3 h but not on receivers inside the bay (not shown inFigure 4).
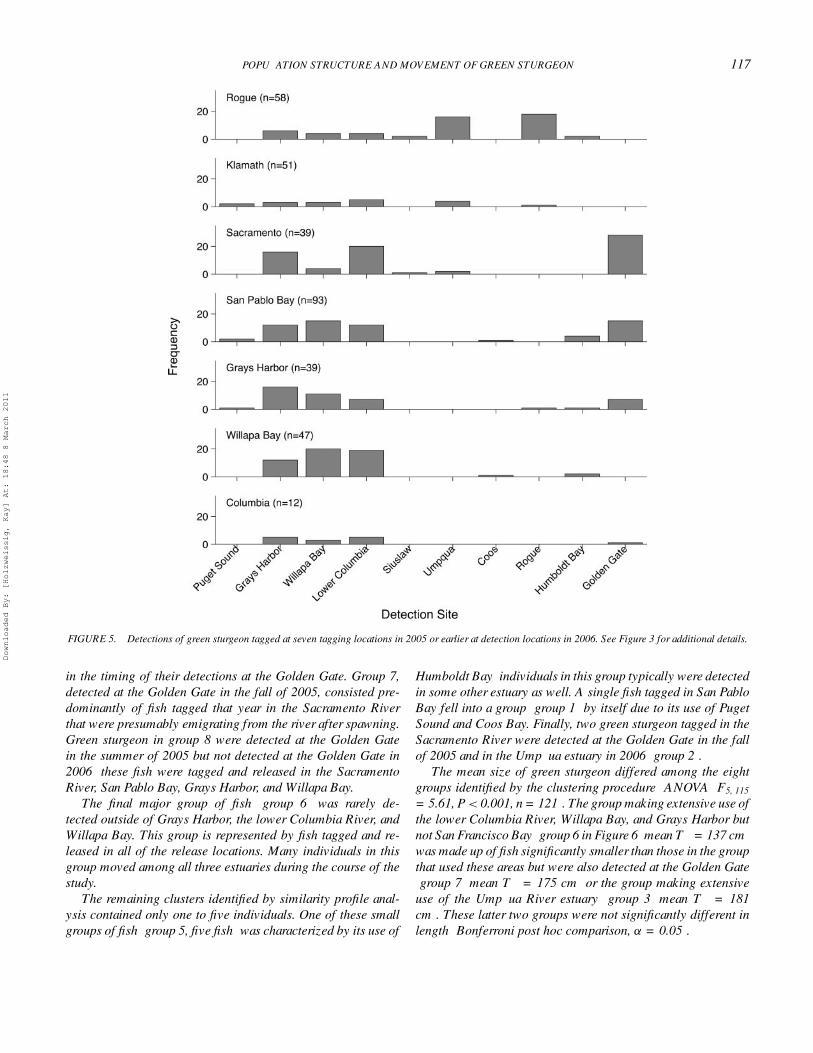
As indicated by the logistic regression analysis, green stur-geon tagged at different locations had distinct patterns of dis-tribution among the estuaries (Figure 5). Green sturgeon fromSacramento River and San Pablo Bay had similar patterns ofdetection in 2006, with high detection rates in Grays Harbor,Willapa Bay, and the lower Columbia River. Sacramento Rivergreen sturgeon were detected at higher rates than San Pablo Baygreen sturgeon at these sites but were not detected in HumboldtBay where four San Pablo Bay green sturgeon were detected.Conversely, two green sturgeon from the Sacramento River weredetected in the Umpqua River estuary and another in YaquinaBay in 2006, where no San Pablo Bay green sturgeon were de-tected. For green sturgeon from the Rogue and Klamath rivers,seven and four fish, respectively, were detected in Grays Har-bor in 2006 (Figure 5), where none had been detected in 2005.Two Klamath fish entered Puget Sound and one entered theRogue River in 2006, but no tagged green sturgeon were de-tected in the Klamath River that year. Two Rogue River fishentered the Siuslaw River estuary and Humboldt Bay. No Kla-math or Rogue river fish were detected at the Golden Gate.Green sturgeon tagged in Grays Harbor, Willapa Bay, and thelower Columbia River were subsequently detected as they re-turned to the estuary where they were originally tagged and tothe other large estuaries, indicating frequent movement amongsystems.
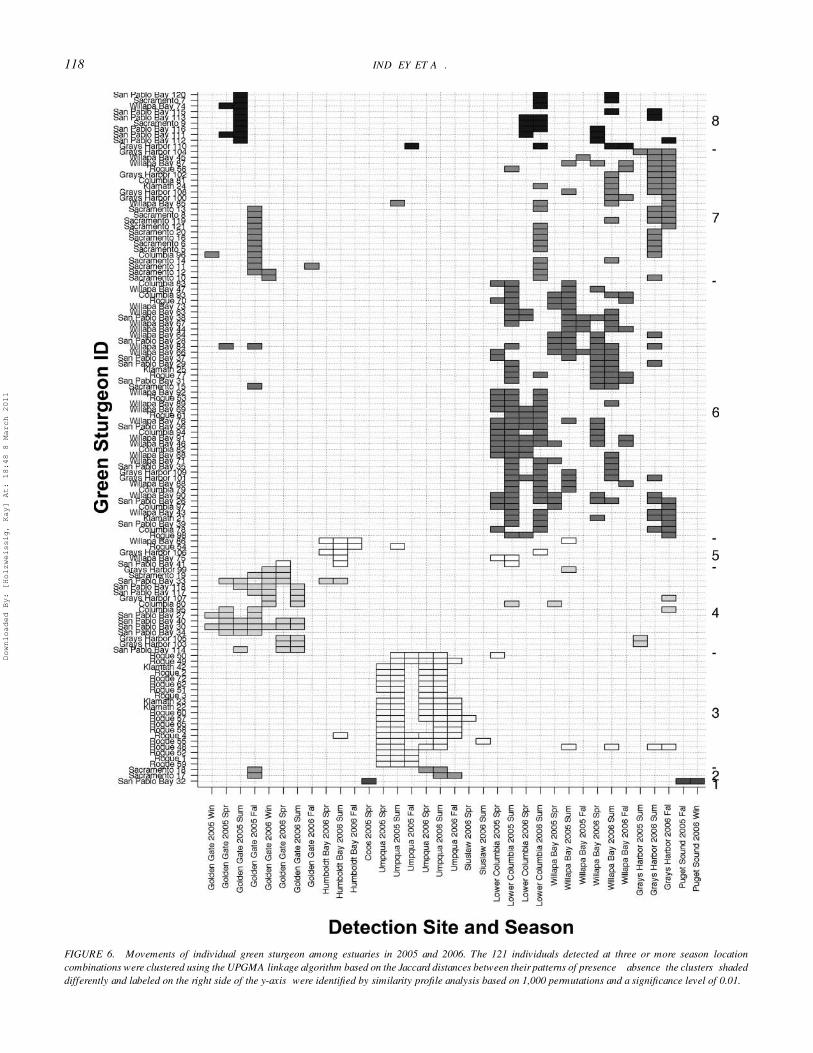
Movement of IndividualsOf the 355 green sturgeon tagged in this study, 121 were
subsequently detected at three or more season–location combi-nations. Many of these individuals exhibited extensive move-ments among estuaries over the course of the study (Figure 6).Similarity profile analysis indicated eight statistically significantclusters within the migration histories. One cluster of green stur-geon (group 3) made heavy use of the Umpqua River estuary inthe spring and summer of both 2005 and 2006. Green sturgeonin this group were predominately tagged and released in theRogue and Klamath rivers, although two Sacramento River fishexhibited this behavior. Most individuals in this group were notdetected in other estuaries, although a few were also detectedin Humboldt Bay, the Siuslaw River estuary, Willapa Bay, andGrays Harbor.
Another distinct group (group 4) made heavy use of San Fran-cisco Bay throughout the year but was not detected frequentlyat other locations. Fish in this group were tagged and released
FIGURE 4. Numbers of individual green sturgeon tagged in 2005 or earlierand detected at detection sites in 2006, by month. See Figure 2 for additionaldetails.
predominately in San Pablo Bay and Grays Harbor. Some fishin this group did exhibit movements among San Francisco Bayand Humboldt Bay, the lower Columbia River, Willapa Bay, andGrays Harbor.
Two other groups of fish (groups 7 and 8) made use of SanFrancisco Bay but were also detected frequently in Grays Har-bor, the lower Columbia River, and Willapa Bay. They differed
Downloaded By: [Holzweissig, Kay] At: 18:48 8 March 2011
POPULATION STRUCTURE AND MOVEMENT OF GREEN STURGEON 117
FIGURE 5. Detections of green sturgeon tagged at seven tagging locations in 2005 or earlier at detection locations in 2006. See Figure 3 for additional details.
in the timing of their detections at the Golden Gate. Group 7,detected at the Golden Gate in the fall of 2005, consisted pre-dominantly of fish tagged that year in the Sacramento Riverthat were presumably emigrating from the river after spawning.Green sturgeon in group 8 were detected at the Golden Gatein the summer of 2005 but not detected at the Golden Gate in2006; these fish were tagged and released in the SacramentoRiver, San Pablo Bay, Grays Harbor, and Willapa Bay.
The final major group of fish (group 6) was rarely de-tected outside of Grays Harbor, the lower Columbia River, andWillapa Bay. This group is represented by fish tagged and re-leased in all of the release locations. Many individuals in thisgroup moved among all three estuaries during the course of thestudy.
The remaining clusters identified by similarity profile anal-ysis contained only one to five individuals. One of these smallgroups of fish (group 5, five fish) was characterized by its use of
Humboldt Bay; individuals in this group typically were detectedin some other estuary as well. A single fish tagged in San PabloBay fell into a group (group 1) by itself due to its use of PugetSound and Coos Bay. Finally, two green sturgeon tagged in theSacramento River were detected at the Golden Gate in the fallof 2005 and in the Umpqua estuary in 2006 (group 2).
The mean size of green sturgeon differed among the eightgroups identified by the clustering procedure (ANOVA: F5, 115
= 5.61, P < 0.001, n = 121). The group making extensive use ofthe lower Columbia River, Willapa Bay, and Grays Harbor butnot San Francisco Bay (group 6 in Figure 6; mean TL = 137 cm)was made up of fish significantly smaller than those in the groupthat used these areas but were also detected at the Golden Gate(group 7; mean TL = 175 cm) or the group making extensiveuse of the Umpqua River estuary (group 3; mean TL = 181cm). These latter two groups were not significantly different inlength (Bonferroni post hoc comparison, α = 0.05).
Downloaded By: [Holzweissig, Kay] At: 18:48 8 March 2011
118 LINDLEY ET AL.
FIGURE 6. Movements of individual green sturgeon among estuaries in 2005 and 2006. The 121 individuals detected at three or more season–locationcombinations were clustered using the UPGMA linkage algorithm based on the Jaccard distances between their patterns of presence—absence; the clusters (shadeddifferently and labeled on the right side of the y-axis) were identified by similarity profile analysis based on 1,000 permutations and a significance level of 0.01.
Downloaded By: [Holzweissig, Kay] At: 18:48 8 March 2011
POPULATION STRUCTURE AND MOVEMENT OF GREEN STURGEON 119
DISCUSSIONThe results presented confirm the population structure of the
species, show that green sturgeon migrate seasonally among avariety of estuarine, riverine, and marine habitats and revealimportant intrapopulation diversity in migratory behavior. Inthe following discussion of these findings, one should bear inmind two limitations of our study. First, while the number ofelectronic tags deployed was relatively large for a study of thistype, larger sample sizes would probably reveal more patternsof habitat use and movement that are too uncommon to be de-tected reliably in the present study. Additionally, we monitoreda subset of West Coast estuaries for up to 2 years. We are unableto say how green sturgeon may or may not use estuaries thatwere not monitored. Finally, we should expect that habitat usepatterns will vary among years at the population level (becauseof the ways in which green sturgeon may respond to chang-ing environmental conditions) as well as at the individual level(owing to ontogenetic shifts).
Population StructureAcoustic tagging results support the delineation of green stur-
geon into southern and northern DPSs (Adams et al. 2007), asno fish tagged in the Klamath or Rogue rivers were detectedat the Golden Gate and no fish tagged in San Pablo Bay orthe Sacramento River were detected in the Rogue or Klamathrivers. The detection of a fish in the Rogue River that had beentagged and released in the Klamath River is consistent withthese two spawning areas comprising a single DPS, as was theKlamath River recovery (at river kilometer 45) of a green stur-geon that had been tagged in the Rogue River (B. McCovey,Jr., personal observation), the detection in the lower KlamathRiver of a radio-tagged green sturgeon from the Rogue River(Erickson et al. 2002), and the lack of genetic differentiation offish captured in these rivers (Israel et al. 2004). A low level ofexchange of individuals between the Rogue and Klamath riversexplains the observed lack of genetic differentiation betweenthese sites (Israel et al. 2004, 2009). Low levels of migrationamong populations (such as a few migrants per generation)are sufficient to erase differences in the frequencies of neutralmarkers (Felsenstein 1976). From a demographic perspective,however, movement between these populations does not ap-pear to be common, thereby making it appropriate to managethe Klamath and Rogue River populations separately for manypurposes.
Our results also provide further insight into the populationstructure of green sturgeon in nonnatal estuaries. Green stur-geon made significant use of these estuaries in the summer,and some moved among different estuaries during the summer,which confirms the findings of Moser and Lindley (2007). Non-natal estuaries support aggregations of green sturgeon from bothDPSs, although certain estuaries seem to be used preferentiallyby green sturgeon from certain rivers (the most notable case isthe high affinity of northern DPS green sturgeon for the UmpquaRiver estuary).
Electronic tags, which can determine the probability of indi-viduals using certain habitats, and population genetics methods,which can determine the proportional composition of a samplefrom a habitat, offer complementary information about stockcomposition and habitat selection differences. Israel et al. (2004,2009) used population genetics data to show that green sturgeoncollected in the Columbia River were predominately southernDPS fish. Based on the presumption that southern DPS greensturgeon are less numerous than northern DPS green sturgeon(Adams et al. 2007), Israel et al. (2009) concluded that south-ern DPS green sturgeon make preferential use of the ColumbiaRiver estuary. We found that in 2005 northern DPS green stur-geon used the Columbia River estuary at a high frequency rela-tive to green sturgeon tagged in San Pablo Bay, and that in 2006northern DPS green sturgeon used the Columbia River at a lowerbut not insignificant rate compared with that of southern DPSgreen sturgeon. There are two potential implications of theseresults. First, there may be substantial interannual variation inthe use of some habitats among populations of green sturgeon.Second, southern DPS green sturgeon may be more abundantor the northern DPS green sturgeon may be less abundant thansupposed by Adams et al. (2007). Another explanation of theapparent discrepancy between the population genetics and tag-ging data are the relatively small sample sizes and potentiallyunrepresentative sampling of either or both of the studies. Es-timates of population size associated with each spawning riverare urgently needed to resolve this question, as the status ofnorthern DPS green sturgeon may be less secure than presentlythought.
Patterns of Estuary UseGreen sturgeon from both the southern and northern DPSs
make frequent use of Willapa Bay, Grays Harbor, and theColumbia River estuary during summer and early autumnmonths, which confirms the importance of these areas as ag-gregation sites where green sturgeon may be vulnerable to ex-ploitation or being bycaught in fisheries (Moser and Lindley2007). The retention of green sturgeon in various fisheries inthese estuaries was banned by the states of Washington andOregon in 2006 and 2007, which greatly reduced the threatposed by fisheries in these waters, although discard mortalitymay be a concern. These large estuaries are clearly importanthabitats for green sturgeon, which emphasizes the need to betterunderstand how green sturgeon use them so that habitat fea-tures and functions can be best conserved. Moser and Lindley(2007) suggested that growth opportunities for green sturgeonare higher in estuaries because estuaries are warmer than shelfwaters and food is abundant.
The Umpqua River estuary was also used heavily for summerand autumn holding. No tagged sturgeon were detected beforeMay, so entry into the Umpqua River was probably not related tospawning migrations. Adams et al. (2007) reported that two ju-venile green sturgeon have been captured roughly 150 km up theUmpqua River, but intensive sampling by Oregon Department
Downloaded By: [Holzweissig, Kay] At: 18:48 8 March 2011
120 LINDLEY ET AL.
of Fish and Wildlife captured no green sturgeon above the tidalinfluence in 2002–2004. Our observations support the assertionof Adams et al. (2007) that spawning by green sturgeon in theUmpqua River is rare, given that many especially large greensturgeon were detected in the estuary, but none were detectedby a hydrophone upstream from tidal influence.
The temporal pattern of detections in San Francisco Bay isdifferent from that observed in large, more northerly estuaries.This probably reflects the use of San Francisco Bay and theSacramento–San Joaquin River estuary as a migration corridorby green sturgeon en route to spawning grounds, while othersuse the estuary for feeding or other nonreproductive purposes.Heublein et al. (2009) found that of 90 green sturgeon taggedin San Francisco Bay, only 11 moved up into the SacramentoRiver, which suggests that many green sturgeon enter the bayfor purposes other than spawning.
The pattern of detections in the Klamath and Rogue riversis consistent with spawning migrations, with entry beginning inFebruary or March. The onset of spawning migrations is similarto that reported by Erickson and Webb (2007) for the RogueRiver but somewhat earlier than reported by Benson et al. (2007)for the Klamath River, although Benson et al. (2007) apparentlydid not sample in late winter or early spring. Both the KlamathRiver and the Rogue River have very small estuaries (Table 1),and the paucity of detections in summer months is consistentwith the idea that green sturgeon are using these estuaries asmigration corridors on their way to spawning grounds.
In summary, the large estuaries along the West Coast ofsouthern Washington, Oregon, and northern California appearto be important habitats for both northern and southern DPSgreen sturgeon, while the much smaller Umpqua River estu-ary appears to be especially important to northern DPS greensturgeon. Green sturgeon move among these estuaries and natalrivers as part of their migration to spawning rivers, overwin-tering habitat in the coastal ocean (Lindley et al. 2009), andsummer–fall holding or feeding habitat.
Intrapopulation Diversity in Migratory BehaviorOur results show that there is significant variation in migra-
tory behavior and habitat use within green sturgeon populations.Some of this variation is related to the size of the green sturgeon.Smaller fish make extensive use of the large estuaries in Wash-ington in summer. Many large fish also exhibit this behavior, butsome spend the summer in the Umpqua River estuary and do notuse the larger estuaries. The differences observed in migratorybehavior do not correspond perfectly with natal origin. Rather,there is diversity in migratory behaviors within populations.
A number of hypotheses have been put forward to explain in-trapopulation variation in migratory behavior, including geneticpolymorphisms, state-dependent migration (e.g., Forseth et al.1999; Nøttestad et al. 1999; Brodersen et al. 2008; Jørgensenet al. 2008), density-dependent habitat selection, and entrain-ment (whereby fish learn migration routes from other fish[Dodson 1988; Rose 1993; McQuinn 1997; Corten 2002; ICES
2007]). These hypotheses are not generally mutually exclusiveand none can be rejected by our data. Assuming that greensturgeon spawning in the same river are part of a panmicticpopulation, genetic polymorphism seems an unlikely explana-tion for differential patterns of estuary use within populationsbut could be responsible for differences between populations. Inthe absence of abundance estimates for green sturgeon we cansay nothing about density-dependent habitat selection.
State-dependent migration is consistent with our observationof significant size differences among migratory contingents andthe differences in distribution of fish tagged in San Pablo Bay(a mixture of small and large fish, perhaps not all of which aremature) and in the Sacramento River (generally large, matureindividuals). If migration is an adaptation that allows exploita-tion of resources that fluctuate in time and space (Dingle andDrake 2007), green sturgeon should change their pattern of mi-gration as they grow and mature to meet their changing resourcerequirements.
Several lines of evidence also support the entrainment hy-pothesis. Sturgeon exhibit cohesive social behavior (Sulaket al. 2002; Allen et al. 2009), are long-lived, have overlappingage cohorts, and in the case of green sturgeon, migrate alongpredictable routes (Erickson and Hightower 2007; Lindley et al.2008), all of which are factors that enhance opportunities forsocial learning (Dodson 1988). Small and apparently immaturegreen sturgeon have been observed migrating to spawning areas(Heublein et al. 2009), a behavior shared with other sturgeonspecies (Sulak and Randall 2002). Social learning of migrationbehaviors has been documented for coral reef fishes (Helfmanand Schultz 1984; Warner 1988) and explains patterns of habitatuse by fish species as diverse as Pacific herring Clupea pallasii,Pacific sardine Sardinops sagax, striped bass, bluefin tuna Thun-nus thynnus, northern anchovy Engraulis mordax, and Pacificwhiting Merluccius productus (ICES 2007).
If the existence of migratory contingents within populationsof green sturgeon is due to entrainment, there are importantmanagement implications (ICES 2007). Entrainment creates aspatial memory for the population, which can be maladaptiveunder some circumstances. For example, a contingent may con-tinue to use a habitat for several generations after the habitathas become suboptimal. Overexploitation in one habitat couldhave a “vacuuming” effect on contingents, which could causea decline in abundance in other areas (Secor et al. 2009; Kerret al. 2010). In the extreme case, overexploitation can extirpatea subpopulation, and habitats used by that subpopulation mayremain unused even if the overall population recovers rapidly.One implication of these possibilities for long-lived fish, likegreen sturgeon, is that current patterns of habitat use and levelsof abundance might reflect the impacts of habitat degradationor fishing activities that occurred in previous decades. Spatialmemory within populations, caused by delaying population re-sponses to environmental changes, would make it difficult to dis-cover the cause-and-effect relationships that drive the dynamicsof green sturgeon populations. Given that green sturgeon may
Downloaded By: [Holzweissig, Kay] At: 18:48 8 March 2011
POPULATION STRUCTURE AND MOVEMENT OF GREEN STURGEON 121
live for 40–60 years (Emmett et al. 1991; Moyle 2002), the de-lay between habitat degradation and population response couldbe quite long.
Conversely, if green sturgeon contingents reflect state-dependent migration or density-dependent habitat selection,habitat degradation would have a different but subtle effect(Sutherland 1996). As the quality of one habitat declines, contin-gents using that habitat would move to other areas and increasecompetition in those habitats. In this way, contingents never ex-posed to the degraded habitat might still suffer lower growth andsurvival. A corollary of the state-dependent migration hypothe-sis is that the Umpqua River estuary differs in some importantways from the other study estuaries. Sulak and Randall (2002)hypothesized that many sturgeon species fast for several monthsto control their growth. Given that members of the contingentmaking use of the Umpqua River estuary were relatively large,perhaps that estuary is a favorable area for holding and fast-ing. Regardless of how green sturgeon contingents arise, theexistence of such natural variation in behavior warrants conser-vation, as it is a source of resilience for the population (Secorand Rooker 2005). The persistence of a diversity of high-qualityestuarine habitats is fundamental to the maintenance of this be-havioral diversity.
ACKNOWLEDGMENTSThis research was supported by the NOAA–Fisheries Species
of Concern Program (S.T.L. and M.L.M.), the Northwest Fish-eries Science Center internal grants program, the Wildlife Con-servation Society, and the David and Lucile Packard Founda-tion (D.L.E.), and the CALFED Science Program (P.K., J.T.,and J.H.). Numerous people helped in the field, including M.Howell, S. West, E. Evans, C. Black, B. Pickering, D. Farrer,and B. Cady (Washington Department of Fish and Wildlife);J. Weber, B. Krohn, G. Ryden, and C. Barber (Oregon Depart-ment of Fish and Wildlife); K. Hanson and A. Keller (WildlifeConservation Society); R. Whitlock (Imperial College, UK); M.Webb, K. Kapperman, J. Ogawa, and G. Stutzer (U.S. Fish andWildlife Service); S. Turo and R. Benson, (Yurok Tribal Fish-eries); H. Fish, D. Rundio, A. Ammann, and J. Harding (NOAASouthwest Fisheries Science Center); and G. Holt and E. Danner(University of California at Santa Cruz). The Columbia River In-tertribal Fish Commission (D. Hatch and R. Branstetter) and theOregon Department of Fish and Wildlife (D. Hering) providedhydrophone data from the Columbia River estuary. K. Andrews(NOAA Northwest Fisheries Science Center) supplied detectiondata for Puget Sound. J. Power (U.S. Environmental ProtectionAgency, Hatfield Marine Science Center) provided data fromreceivers in the Alsea River and Yaquina Bay. D. Rundio con-ducted the similarity profile analysis of the migration historydissimilarity matrix. S. X. Cadrin, E. Mora, C. Grimes, W. Per-rin, and two anonymous reviewers provided helpful reviews ofan earlier draft of the manuscript.
REFERENCESAdams, P. B., C. Grimes, J. E. Hightower, S. T. Lindley, M. L. Moser, and M. J.
Parsley. 2007. Population status of North American green sturgeon Acipensermedirostris. Environmental Biology of Fishes 79:339–356.
Akaike, H. 1974. A new look at the statistical model identification. IEEE (In-stitute of Electrical and Electronics Engineers) Transactions on AutomaticControl 19:716–723.
Allen, P., and J. Cech. 2007. Age/size effects on juvenile green sturgeon,Acipenser medirostris, oxygen consumption, growth, and osmoregulation insaline environments. Environmental Biology of Fishes 79:211–229.
Allen, P. J., J. A. Hobbs, J. J. Cech, J. P. Van Eenennaam, and S. I. Doroshov.2009. Using trace elements in pectoral fin rays to assess life history move-ments in sturgeon: estimating age at initial seawater entry in Klamath Rivergreen sturgeon. Transactions of the American Fisheries Society 138:240–250.
Andrews, K. S., P. S. Levin, S. L. Katz, D. Farrer, V. F. Gallucci, and G.Bargmann. 2007. Acoustic monitoring of sixgill shark movements in PugetSound: evidence for localized movement. Canadian Journal of Zoology85:1136–1143.
Benson, R. L., S. Turo, and B. W. J. McCovey. 2007. Migration and movementpatterns of green sturgeon (Acipenser medirostris) in the Klamath and Trinityrivers, California, USA. Environmental Biology of Fishes 79:269–279.
Block, B. A., S. L. H. Teo, A. Walli, A. Boustany, M. J. W. Stokesbury, C.J. Farwell, K. C. Weng, H. Dewar, and T. D. Williams. 2005. Electronictagging and population structure of Atlantic bluefin tuna. Nature (London)434:1121–1127.
Borchers, D. L., S. T. Buckland, and W. Zucchini. 2002. Estimating animalabundance: closed populations. Springer, London.
Brodersen, J., P. A. Nilsson, L. A. Hansson, C. Skov, and C. Bronmark. 2008.Condition-dependent individual decision-making determines cyprinid partialmigration. Ecology 89:1195–1200.
Burnham, K. P., and D. R. Anderson. 1998. Model selection and inference: apractical information-theoretic approach. Springer-Verlag, New York.
Cadrin, S. X., and D. H. Secor. 2009. Accounting for spatial population structurein stock assessment: past, present, and future. Pages 405–426 in R. J. Beamishand B. J. Rothschild, editors. The future of fisheries science in North America.Springer-Verlag, New York.
Chittenden, C., K. Butterworth, K. Cubitt, M. Jacobs, A. Ladouceur, and D.Welch, and R. McKinley. 2009. Maximum tag to body size ratios for anendangered coho salmon (O. kisutch) stock based on physiology and perfor-mance. Environmental Biology of Fishes 84:129–140.
Clark, J. 1968. Seasonal movements of striped bass contingents of Long IslandSound and New York Bight. Transactions of the American Fisheries Society97:320–343.
Clarke, K. R., P. J. Somerfield, and R. N. Gorley. 2008. Testing of null hypothesesin exploratory community analyses: similarity profiles and biota–environmentlinkage. Journal of Experimental Marine Biology and Ecology 366:56–69.
Corten, A. 2002. The role of “conservatism” in herring migrations. Reviews inFish Biology and Fisheries 11:339–361.
Dingle, H., and V. A. Drake. 2007. What is migration? BioScience 57:113–121.Dodson, J. J. 1988. The nature and role of learning in the orientation and
migratory behavior of fishes. Environmental Biology of Fishes 23:161–182.
Dumbauld, B. R., D. L. Holden, and O. P. Langness. 2008. Do sturgeon limitburrowing shrimp populations in Pacific Northwest estuaries? EnvironmentalBiology of Fishes 83:283–296.
Emmett, R. L., S. A. Hinton, S. L. Stone, and M. E. Monaco. 1991. Distributionand abundance of fishes and invertebrates in West Coast estuaries, volume II.Species life history summaries. National Oceanic and Atmospheric Admin-istration, ELMR Report 8, Rockville, Maryland.
Erickson, D. L., and J. E. Hightower. 2007. Oceanic distribution and behaviorof green sturgeon (Acipenser medirostris). Pages 197–211 in J. Munro, D.Hatin, J. E. Hightower, K. McKown, K. J. Sulak, A. W. Kahnle, and F. Caron,
Downloaded By: [Holzweissig, Kay] At: 18:48 8 March 2011
122 LINDLEY ET AL.
editors. Anadromous sturgeon: status and trends, anthropogenic impacts, andessential habitats. American Fisheries Society, Symposium 56, Bethesda,Maryland.
Erickson, D. L., J. North, J. E. Hightower, J. Weber, and L. Lauck. 2002.Movement and habitat use of green sturgeon Acipenser medirostris in theRogue River, Oregon, U.S.A. Journal of Applied Ichthyology 18:565–569.
Erickson, D. L., and M. A. H. Webb. 2007. Spawning periodicity, spawningmigration, and size at maturity of green sturgeon, Acipenser medirostris, inthe Rogue River, Oregon. Environmental Biology of Fishes 79:255–268.
Felsenstein, J. 1976. The theoretical population genetics of variable selectionand migration. Annual Review of Genetics 10:253–280.
Forseth, T., T. F. Naesje, B. Jonsson, and K. Harsaker. 1999. Juvenile migrationin brown trout: a consequence of energetic state. Journal of Animal Ecology68:783–793.
Helfman, G. S., and E. T. Schultz. 1984. Social transmission of behaviouraltraditions in a coral reef fish. Animal Behaviour 32:379–384.
Heublein, J. C., J. T. Kelly, C. E. Crocker, A. P. Klimley, and S. T. Lindley.2009. Migration of green sturgeon, Acipenser medirostris, in the SacramentoRiver. Environmental Biology of Fishes 84:245–258.
Hunter, E., J. D. Metcalfe, G. P. Arnold, and J. D. Reynolds. 2004. Impacts ofmigratory behaviour on population structure in North Sea plaice. Journal ofAnimal Ecology 73:377–385.
ICES (International Council for the Exploration of the Sea). 2007. Report ofthe workshop on testing the entrainment hypothesis (WKTEST). ICES, C.M.2007/LRC:10, Copenhagen.
Israel, J. A., K. J. Bando, E. C. Anderson, and B. May. 2009. Polyploid mi-crosatellite data reveal stock complexity among estuarine North Americangreen sturgeon (Acipenser medirostris). Canadian Journal of Fisheries andAquatic Sciences 66:1491–1504.
Israel, J. A., J. F. Cordes, M. A. Blumberg, and B. May. 2004. Geographicpatterns of genetic differentiation among collections of green sturgeon. NorthAmerican Journal of Fisheries Management 24:922–931.
Jørgensen, C., E. S. Dunlop, A. F. Opdal, and Ø. Fiksen. 2008. The evolution ofspawning migrations: state dependence and fishing-induced changes. Ecology(Washington, D.C.) 89:3436–3448.
Kelly, J. T., A. P. Klimley, and C. E. Crocker. 2007. Movements of greensturgeon, Acipenser medirostris, in the San Francisco Bay estuary, California.Environmental Biology of Fishes 79:281–295.
Kerr, L. A., S. X. Cadrin, and D. H. Secor. 2010. Simulation modelling as atool for examining the consequences of spatial structure and connectivity onlocal and regional population dynamics. ICES (International Council for theExploration of the Sea) Journal of Marine Science 67:1631–1639.
Legendre, P., and L. Legendre. 1998. Numerical ecology. Elsevier, Amsterdam.Lindley, S. T., M. L. Moser, D. L. Erickson, M. Belchik, D. W. Welch, E.
Rechisky, J. T. Kelly, J. C. Heublein, and A. P. Klimley. 2008. Marine mi-gration of North American green sturgeon. Transactions of the AmericanFisheries Society 137:182–194.
Lutcavage, M. E., R. W. Brill, G. B. Skomal, B. C. Chase, and P. W. Howey.1999. Results of pop-up satellite tagging of spawning-size-class fish in theGulf of Maine: do North Atlantic bluefin tuna spawn in the mid-Atlantic?Canadian Journal of Fisheries and Aquatic Sciences 56:173–177.
McQuinn, I. H. 1997. Metapopulations and the Atlantic herring. Reviews inFish Biology and Fisheries 7:297–329.
Monaco, M. E., T. A. Lowry, and R. L. Emmett. 1992. Assemblages of U.S. WestCoast estuaries based on the distribution of fishes. Journal of Biogeography19:251–267.
Moser, M. L., and S. T. Lindley. 2007. Use of Washington estuaries bysubadult and adult green sturgeon. Environmental Biology of Fishes 79:243–253.
Moyle, P. B. 2002. Inland fishes of California. University of California Press,Berkeley.
NOAA (National Oceanic and Atmospheric Administration). 1990. Estuaries ofthe United States: vital statistics of a national resource base. NOAA, SilverSpring, Maryland.
NOAA (National Oceanic and Atmospheric Administration). 1999. Physicaland hydrologic characteristics of coastal watersheds. NOAA, National OceanService, Coastal Assessment and Data Synthesis System, Silver Spring, Mary-land.
Nøttestad, L., J. G. Giske, J. C. Holst, and G. Huse. 1999. A length-based hy-pothesis for feeding migrations in pelagic fish. Canadian Journal of Fisheriesand Aquatic Sciences 56:26–34.
ODFW (Oregon Department of Fish and Wildlife) and WDFW (WashingtonDepartment of Fish and Wildlife). 2002. Status report: Columbia River fishruns and fisheries, 1938–1999. ODFW, Salem, and WDFW, Olympia.
Pledger, S. 2000. Unified maximum likelihood estimates for closedcapture–recapture models using mixtures. Biometrics 56:434–442.
Rose, G. A. 1993. Cod spawning on a migration highway in the northwestAtlantic. Nature (London) 366:458–461.
Secor, D. H. 1999. Specifying divergent migrations in the concept of stock: thecontingent hypothesis. Fisheries Research (Amsterdam) 43:13–34.
Secor, D. H., L. A. Kerr, and S. X. Cadrin. 2009. Connectivity effects onproductivity, stability, and persistence in a herring metapopulation model.ICES (International Council for the Exploration of the Sea) Journal of MarineScience 66:1726–1732.
Secor, D. H., and J. R. Rooker. 2005. Connectivity in the life histories of fishesthat use estuaries. Estuarine, Coastal, and Shelf Science 64:1–3.
Simenstad, C. A., and K. L. Fresh. 1995. Influence of intertidal aquaculture onbenthic communities in Pacific Northwest estuaries: scales of disturbance.Estuaries 18:43–70.
Sulak, K. J., R. E. Edwards, G. W. Hill, and M. T. Randall. 2002. Why dosturgeons jump? Insights from acoustic investigations of the gulf sturgeon inthe Suwannee River, Florida, USA. Journal of Applied Ichthyology 18:617–620.
Sulak, K. J., and M. Randall. 2002. Understanding sturgeon life history: enig-mas, myths, and insights from scientific studies. Journal of Applied Ichthy-ology 18:519–528.
Sutherland, W. J. 1996. From individual behavior to population ecology. OxfordUniversity Press, New York.
Tzeng, W.-N., Y. Iizuka, J. C. Shiao, Y. Yamada, and H. P. Oka. 2003. Identi-fication and growth rates comparison of divergent migratory contingents ofJapanese eel (Anguilla japonica). Aquaculture 216:77–86.
Warner, R. R. 1988. Traditionality of mating-site preferences in a coral reef fish.Nature (London) 335:719–721.
White, G. 2008. Closed population estimation models and their exten-sions in program MARK. Environmental and Ecological Statistics 15:89–99.
Downloaded By: [Holzweissig, Kay] At: 18:48 8 March 2011