A Classification of Tasmanian Estuaries and Assessment of ...

Journal of Hydrology 527 (2015) 718–733
Contents lists available at ScienceDirect
Journal of Hydrology
journal homepage: www.elsevier .com/locate / jhydrol
Karst estuaries are governed by interactions between inlandhydrological conditions and sea level
http://dx.doi.org/10.1016/j.jhydrol.2015.05.0210022-1694/� 2015 Elsevier B.V. All rights reserved.
⇑ Corresponding author. Tel.: +1 (813) 974 7103.E-mail address: [email protected] (J.R. Garey).
Damian M. Menning a, Jonathan G. Wynn b, James R. Garey a,⇑a Department of Cell Biology, Microbiology, and Molecular Biology, University of South Florida, 4202 E. Fowler Ave., ISA 2015, Tampa, FL 33620, United Statesb School of Geosciences, University of South Florida, 4202 E. Fowler Ave., NES 107, Tampa, FL 33620, United States
a r t i c l e i n f o s u m m a r y
Article history:Received 25 March 2015Received in revised form 27 April 2015Accepted 11 May 2015Available online 19 May 2015This manuscript was handled by Peter K.Kitanidis, Editor-in-Chief, with theassistance of Barbara Mahler, AssociateEditor
Keywords:AquiferGeochemistryMixing zoneSalt water intrusion
Karst estuaries represent unique systems created by freshwater inputs that flow directly into the seathrough karst conduits and/or matrices. In order to determine the characteristics of a karst estuary result-ing from the brackish discharge of Double Keyhole Spring into the Gulf of Mexico, we monitoredshort-term tidal fluctuations, long-term rainfall patterns, aquifer levels, spring discharge, and multiplegeochemical parameters along a transect from the spring through the estuary. We monitored four sitesalong a spring/estuary transect and a nearby inland freshwater spring to represent the freshwater portionof the Upper Floridan Aquifer. Datasondes were deployed in Double Keyhole Spring to measure dischargevolume, tidal fluctuations, and physical water parameters for two years. Water samples were collectedquarterly from both springs and the surrounding surface sites over the same time period. An isotopic/-trace element mass balance tracer method was used to determine the hydrogeological components ofthe spring discharge from three possible sources: (1) freshwater from the upper portion of the UpperFloridan aquifer, (2) freshwater from the lower portion of the Upper Floridan aquifer, and (3) saltwaterfrom the Gulf of Mexico. Within the water column of the submarine spring conduit, there were no signif-icant differences of the sampled parameters over short sampling distances (<400 m) and periods (<1 h).Spring discharge directly correlated to aquifer level and negatively correlated to tidal level. The brackishnature of the spring discharge is due to simple mixing between Gulf of Mexico saltwater and freshwaterfrom the lower portion of the Upper Floridan aquifer. The composition of the spring discharge varied sea-sonally, showing increased marine influence during the wet season. In June 2012, Tropical Storm Debbyresulted in measurable freshwater inputs from the upper portion of the Upper Floridan aquifer that dis-charged directly to the estuary and bypassed the spring. The number of spring reversals (salt water intru-sion events) into Double Keyhole Spring increased as the dry season progressed, stopped immediatelyafter Tropical Storm Debby, and then gradually increased into the next dry season. Statistically significantgeochemical differences were found along the spring/estuary transect on each collection date and season-ally at the individual sites. Our data shows that this karst estuary system is governed by the interactionsbetween inland hydrological conditions and sea level.
� 2015 Elsevier B.V. All rights reserved.
1. Introduction
Submarine groundwater discharge (SGD) through subterraneanestuaries has been recognized as a major source of nutrients tocoastal ecosystems (Burnett et al., 2006; Moore, 2010; Smith andCave, 2012; Szymczycha et al., 2012). This influx of nutrientsmay have dramatic impacts on the ecology of the surroundingestuaries (Johannes, 1980; Kotwicki et al., 2014) and can be seenby the resulting geochemical gradients (Burnett et al., 2003; Kimet al., 2005). Increased aquifer usage and/or increased sea levels
may result in salt water intrusion to coastal aquifers by shiftingthe mixing zone underneath estuaries inland, and turning themfrom estuarine to salt marsh habitats. This may have dramaticeffects on the biological communities which currently serve asnurseries for numerous invertebrate and fish species (Beck et al.,2001).
Estuaries are semi-enclosed bodies of water which have a freeconnection to the open sea and within which sea water is measur-ably diluted with freshwater derived from land drainage(Pritchard, 1967). This definition generally applies to freshwaterinputs from surface rivers and streams which may be secondaryto subterranean drainage in karst regions. Moore (1999) definedthe subterranean estuary as a coastal aquifer where terrestrial

D.M. Menning et al. / Journal of Hydrology 527 (2015) 718–733 719
groundwater measurably dilutes seawater that has invaded theaquifer through a free underground connection to the sea. Alongkarst-dominated coasts (Durr et al., 2011), subterranean estuariesare the primary source of freshwater and nutrient inputs to thesea due to the lack of surface rivers or streams. Karst estuaries rep-resent habitats along karst-dominated coasts where freshwaterinputs are not derived from surface drainage but instead derivedfrom groundwater (Fig. 1).
The study of SGD has primarily focused on diffuse flow overlarge regions (Moore, 1996; Santos et al., 2008) but less researchhas been conducted on point-source discharges such as conduitflow through submarine springs (Swarzenski et al., 2001;Peterson et al., 2009). In Florida there are over 700 documentedsprings (http://www.dep.state.fl.us/springs/), most of which areinland, but there are also numerous undocumented springs alongthe coast (Fig. 2). Some of these springs discharge aquifer waterdirectly to the Gulf of Mexico forming karst estuaries and act sim-ilarly to surface rivers bringing freshwater and nutrients to theestuary (Harrington et al., 2010).
Under reverse-flow conditions, submarine springs may also bepotential points for salt water intrusion of coastal aquifers thatcould be harmful to the freshwater sources used by many coastalcommunities (Fleury et al., 2007; Vera et al., 2012). Terrestrialcoastal springs typically discharge freshwater but are also tidallyinfluenced because of underlying marine water. Nearshore and off-shore springs may discharge fresh or brackish water depending oninland hydrological conditions (Michael et al., 2005). Changes inlong term weather patterns and human water use can have delete-rious impacts on coastal springs (Wetland-Solutions-Inc., 2007;
Depth (m)
0
50
25
75
Brackis
h wate
r
Wat
er F
low
Fresh/Brackish w
Karst Estuary
Middle Confining U
Upper Floridan Aqu
DeepRoom
Freshwater
Brackish
200 m
Aquifer
Brackish
High Tide LineLow Tide Line
Wat
er F
low
West
Fig. 1. Double Keyhole Spring profile and the geology of the nearby area. On the left sideThe red X near the entrance indicates the datasonde deployment location. The dashed linewater during reversals noted during the study period. The right side of the figure showsapproximate depth of SWFWMD hydraulic head gauges. The dashed line across the middlthe Upper Floridan aquifer. (For interpretation of the references to color in this figure le
Quinlan et al., 2008), and thus these springs can act as sentinelsof hydrological change in coastal regions. For example, an offshoresubmarine spring known as Jewfish Sink (Garman and Garey,2005), approximately one km offshore of West Central Florida,ceased flow completely in 1962 following a prolonged droughtand increased aquifer use by a nearby citrus industry.
Storm events play an important role in determining the hydro-logical conditions of coastal springs (Lerner et al., 1990). There islimited understanding of the influence that tidal fluctuations andrainfall patterns have on submarine spring discharge (Ozyurt,2008; Valle-Levinson et al., 2011). In karst regions, rainfall eventsare the primary source of direct aquifer recharge (Lerner et al.,1990) which result in higher water tables and subsequentincreases in aquifer discharge through springs (reviewed in deVries and Simmers, 2002). Heavy rainfall due to storm events cancreate a surge of freshwater through the system that may con-tribute as much as 25% of the total spring discharge (Lakey andKrothe, 1996). This surge plays an important role in not only aqui-fer recharge but in defining the geochemical gradients formed byaquifer discharge through coastal springs.
Ecosystems within karst estuaries are likely governed by inlandhydrological conditions and sea level. Events that shift the balancebetween these two forces may have a dramatic impact on the bio-logical communities of these environments (Santoro et al., 2008).The goal of this study is to describe the hydrological and geochem-ical drivers of a specific karst estuary. We (1) describe the influenceof tidal fluctuations on spring discharge, (2) demonstrate theimpact rainfall patterns have on aquifer level and spring discharge,(3) define the hydrogeological conditions of the nearshore brackish
RockType Formation Depth (m)
0
50
100
150
200
250
Suw
anne
e
X
X
X
X
Sand
Dolostone
ClayLakeCity
AvonPark
Ocala
Limestone
Freshw
ater W
ater Flow
ater boundary
nit
ifer
X
is the cross section of Double Keyhole Spring showing the direction of water flow.across the conduit path estimates the location of the deepest penetration of surface
the geology of the nearby area with data from Decker (1983). Black X’s indicate thee of the figure indicates the edge of the mixing zone between the Gulf of Mexico andgend, the reader is referred to the web version of this article.)

10 km
Pasco County
Hernando County
Documented SpringUndocumented Spring
Double KeyholeSpring
28°26'00N
28°41'40N
Sur
veye
d aer
A
Isabella Spring
Citrus County
Gulf of Mexico
North
82°40'00W 82°28'00W82°52'00W
Fig. 2. Location of documented and undocumented springs along the west centralgulf coast of Florida. The blue circles are springs documented by the FloridaDepartment of Environmental Protection (http://www.floridasprings.org/). The redcircles are coastal submarine springs not documented by the Florida DEP butidentified by a local dive team (Brett Hempill, personal communication). Only thetop half of the map has been surveyed to date. (For interpretation of the referencesto color in this figure legend, the reader is referred to the web version of thisarticle.)
720 D.M. Menning et al. / Journal of Hydrology 527 (2015) 718–733
submarine spring discharge, and (4) show the geochemical gradi-ents formed by spring discharge within the surrounding karstestuary.
1.1. Site description
Approximately one km south of the town of Aripeka on the westcoast of central Florida is Double Keyhole Spring, a nearshorebrackish submarine spring that discharges directly into the Gulfof Mexico forming a surface estuary (Figs. 2 and 3). Five sites weremonitored in the area: (1) Double Keyhole Spring, (2) DoubleKeyhole Pond into which Double Keyhole Spring discharges, (3)Estuary 1 site, 100 m west of Double Keyhole Spring, (4) Estuary2 site, two km west-southwest of Double Keyhole Spring towardthe Gulf of Mexico, and (5) an inland freshwater spring, IsabellaSpring, one km south-southeast of Double Keyhole Spring(Fig. 3). These sites were chosen to investigate geochemical gradi-ents between freshwater and marine sources associated withDouble Keyhole Spring in order to determine the amount of mixingbetween the Upper Floridan aquifer and the Gulf of Mexico.
1.2. Geological and hydrological background
The Floridan aquifer system encompasses approximately160,000 km2 and underlies the southern parts of Alabama,
Georgia, and South Carolina, and all of Florida (Miller, 1986). Thesystem is split into two parts based on the permeability of the rock(Upper and Lower Floridan aquifer) which are separated by aMiddle Confining Unit. The Upper Floridan aquifer occurs inTertiary karstic rocks of which the thickest and most productiveare the Eocene Avon Park Formation and Ocala Limestone (Miller,1986). Near the town of Aripeka, Florida the Upper Floridan aquiferis unconfined at the surface (Sprinkle, 1989) allowing for rapidrecharge and increased discharge soon after rainfall events. In thisarea the Upper Floridan aquifer occurs in undifferentiated sandsnear the surface, limestone from 1 to 151 m, followed by dolostoneand limestone layers from 151 to 248 m (Fig. 1). The lower portionbelow 151 m is interspersed with multiple layers of clay (Decker,1983).
The hydrochemical framework of the area can be divided intothree sections, the upper portion of the Upper Floridan aquifer con-sisting of low salinity, low sulfate water, the lower portion of theUpper Floridan aquifer consisting of low salinity, high sulfatewater, and the Gulf of Mexico consisting of high salinity, high sul-fate water. Each section has a distinct geochemical signature dis-tinguished by strontium concentrations and d18O values that canbe used to determine the extent of mixing found in DoubleKeyhole Spring discharge. Strontium concentration and d18O values(a measure of the ratio of 18O:16O) were used because they are wellknown conservative tracers that are able to differentiate sources ofwater (Epstein and Mayeda, 1953; Craig and Gordon, 1965;Peterman et al., 1970; Veizer et al., 1999; Bigg and Rohling,2000). The 18O:16O ratio in hydrological reservoirs change overtime due to well-known fundamental hydrological mechanismssuch as evaporation and precipitation and exchange with otherreservoirs (Dansgaard, 1964; Kendall and McDonnell, 1999). Thestrontium concentrations present in the rocks of the Floridan aqui-fer system are reflected in the water discharged from the aquiferdue to the dissolution of the karst and exchange with carbonateminerals of the karst rocks (largely CaCO3). These hydrologicaland geochemical processes result in chemical signatures of thewater that can be used to differentiate the sections of theFloridan aquifer system from each other and from the Gulf ofMexico (Katz et al., 1997; Swarzenski et al., 2001).
Pump tests of wells in the area around Aripeka indicate that thekarstic rocks from the surface to 157 m are filled with low salinity,low sulfate freshwater. A transition zone between freshwater andsaltwater was determined to be between 157 and 166 m belowwhich the water increases in salinity and sulfate concentration.High sulfate concentrations (32.8 mM) were found at a depth of280 m near the highest concentration of gypsum in the lower por-tion of the Upper Floridan aquifer (Decker, 1983). Further inlandfrom this site, Sacks et al. (1995) found low salinity, high sulfatewaters at the bottom of the Upper Floridan aquifer near theMiddle Confining Unit.
2. Materials and methods
2.1. Sampling
Monitoring of the study sites was conducted from September2011 through September 2013 to examine spring discharge pat-terns and to establish correlations to local rainfall and aquiferhydrology. Datasondes were deployed nearly continuously withinDouble Keyhole Spring to measure water velocity and directionusing an Argonaut-Acoustic Doppler Velocimeter (ADV) (SonTek,USA) as well as water temperature, dissolved oxygen (DO), pH,and salinity using a HACH Hydrolab DS3 or DS5X multi-parameterdatasonde (HACH, USA). All datasondes were serviced annuallyand calibrated prior to each deployment. Datasondes deployed in

Activ
e Li
mes
tone
Qua
rry
Estuary 2
Double KeyholeSpring
DoubleKeyholePond
Estuary 1
Isabella Spring
JewfishSink
OldLimestoneQuarry
Old Canal
Old
Dix
ie H
wy
IndustrialPark
lightresidential
Gulf of Mexico
28°24'50N
28°25'50N
28°23'50N
N1 km
US Hwy 1
9
Aripeka
ROMPTR 18-2
2km
Aripeka Rd
82°40'00W82°42'27W
Fig. 3. Site map showing the studies sites in west central Florida. ROMP TR 18-2 is approximately two km north of the town of Aripeka.
D.M. Menning et al. / Journal of Hydrology 527 (2015) 718–733 721
the spring conduit were set to record measurements every 30 min.Spring discharge volumes were calculated by multiplying the areaof the conduit at the datasonde deployment location (6.12 m) bythe water velocity determined by the ADV. Five 500 mL replicatewater samples were collected from the springs and surface sitesquarterly for geochemical, stable isotope, and trace element analy-ses. Spring samples were collected by scientific divers usingclosed-circuit rebreathers under the auspices of the University ofSouth Florida (USF) scientific diving program. Within the springconduit, previously sterilized 500 mL bottles filled with autoclaveddeionized water were purged three times with helium to preventthe introduction of surface water and air into the spring samples.All samples were collected immediately after low tide and werekept on ice for transport to the lab. Concurrent with all surface watersample collections, a HACH Hydrolab DS3 or DS5X multi-parameterdatasonde was used to measure the same parameters as those inspring conduit. Strontium concentrations and d18O values for thelower portion of the Upper Floridan aquifer were retrieved fromSacks et al. (1995) and used as end-member values (see below).Aquifer hydraulic head from a nearby well, ROMP TR 18-2, and totaldaily rainfall data from the Engle Park, Shady Hills, and SummerTree sites were retrieved from the Southwest Florida WaterManagement District (SWFWMD) Water ManagementInformation System (WMIS) website (http://www18.swfwmd.state.fl.us/ResData/Search/ExtDefault.aspx).
2.2. Water sample analysis
All water samples were filtered through GTTP 04700 0.2 lmmembrane filters (Millipore, USA). Samples were divided into50 mL tubes for trace element analysis, 10 mL bottles for stable iso-tope analysis, and the remainder was transferred to a 500 mL bottlefor major ion analysis. Trace element concentrations were deter-mined using an ELAN DRC II ICP Mass Spectrometer (PerkinElmerSCIEX, USA) following the procedures described by Eggins et al.
(1997). Standard curves were created using serial dilutions of knownconcentrations of trace elements obtained from High-PurityStandards (USA) and Fisher-Scientific (USA). NIST 1640a andCRM-SW (High-Purity Standards, USA) were used to verify the effi-ciency of the measurements and to account for drift resulting frommeasuring multiple samples consecutively. The average standarddeviation for trace element concentration was less than 0.15% basedon replicate measurements of internal standards in each run.Oxygen isotopic composition was determined by the USF StableIsotope Laboratory using a Finnigan Delta V 3 keV Isotope RatioMass Spectrometer (Thermo Fisher Scientific, USA) and a GasbenchII (Thermo Fisher Scientific, USA) preparation device using the equi-libration method. The ratio of 18O:16O in the water samples was mea-sured with respect to internal standards with values reported on theVienna Standard Mean Ocean water scale as d18O values whered18O = (((18O/16O)sample/(18O/16O)standard) � 1) ⁄ 1000‰. The aver-age standard deviation of the d18O values of reference materialswithin analytical sequences was less than 0.25‰ based on replicatemeasurements of internal standards in each sequence. A mass bal-ance analysis of the trace element strontium and d18O values wasconducted to determine the hydrogeological composition ofDouble Keyhole Spring discharge and the surrounding estuarinewaters assuming three end-members following the methodsdescribed by Lazareva and Pichler (2011). Strontium concentrationwas used in conjunction with d18O values because they are conserva-tive under most scenarios with well-documented fundamentallycontrolling processes of fractionation (Epstein and Mayeda, 1953;Craig and Gordon, 1965; Peterman et al., 1970; Veizer et al., 1999;Bigg and Rohling, 2000). The three end-members used in the mixingcalculations (Table 1) consisted of Gulf of Mexico water representedby samples collected from estuary 2 site (Est2), the upper portion ofthe Upper Floridan aquifer represented by samples collected fromIsabella Spring (Isa), and the lower portion of the Upper Floridanaquifer (LFA) represented by values reported by Sacks et al. (1995).Strontium concentrations and d18O values from this study

722 D.M. Menning et al. / Journal of Hydrology 527 (2015) 718–733
(Table 1) were used in following mass-balance equation fromLazareva and Pichler (2011) to determine the individual contribu-tion from each end-member source at each study site where x wasused to represent the individual sites along the transect (DoubleKeyhole Spring, Double Keyhole Pond, and estuary 1 site):mx = mEst2 + mIsa + mLFA = 1.
Water samples were analyzed using a HACH DR/2400 spec-trophotometer (HACH, USA) for ammonia (#8155, 0.59–29.35 lMNH3-N), nitrate (#8171, 1.61–161.28 lM NO3
�-N), phosphate(#8048, 0.21–26.32 lM PO4
3�), and sulfate (#8051, 20.8–728.7 lM). Brackish samples used for sulfate analysis were dilutedper manufacturer’s instructions. The average standard deviationsfor geochemical parameters based on replicate samples were0.59 lM for ammonia, 1.61 lM for nitrate, 0.84 lM for phosphate,and 707.9 lM for sulfate. Field measurements of DO, pH, water tem-perature, and salinity were conducted using a HACH Hydrolab DS3 orDS5X multi-parameter datasonde (HACH, USA). The average stan-dard deviations for DO, pH, water temperature, and salinity basedon replicate samples were all 0.01%. All sampled geochemicalparameters were plotted using Surfer 11 (Golden Software, USA).
2.3. Statistical analyses
Statistical analyses were performed using IBM SPSS 22.0 (IBM,USA). One-Way ANOVAs were conducted on all geochemical datato determine statistical significance (p < 0.05) between samplesites collected on the same date and between sample dates col-lected at the same site. Partial correlation analyses were conductedto determine statistically significant correlations between thestudied parameters controlling for study site or collection date(Bai et al., 2010).
3. Results
3.1. Double Keyhole Spring profile
The Double Keyhole Spring profile (Fig. 1) shows that the depthof the conduit generally stays near 33 m until the ‘Deep Room’ atthe end of the diver accessible conduit. The linear distance from
Table 1Strontium concentrations and d18O values at all sites from fall 2011 through fall 2013.
Strontium (mM) Fall 2011 Winter 2011 Spring 2012 Summer 2012
Estuary 2 – Average 24.0 44.3 48.3 48.7Estuary 2 – Std Dev 3.4 5.1 2.6 4.2Estuary 1 – Average 41.7 64.3 50.4 51.9Estuary 1 – Std Dev 2.6 0.4 7.0 5.1Double Keyhole Pond – Average 52.5 54.5 62.6 58.3Double Keyhole Pond – Std Dev 3.1 7.3 9.3 0.8Double Keyhole Spring – Average 43.3 50.1 58.6 101.8Double Keyhole Spring – Std Dev 5.0 2.5 2.7 15.3Isabella – Average 4.8 3.0 4.0 9.9Isabella – Std Dev 0.3 0.3 0.3 1.2Lower portion of UFA 12.2
d18O (‰) Fall 2011 Winter 2011 Spring 2012 Summer 2012
Estuary 2 – Average 0.83 0.01 1.33 2.43Estuary 2 – Std Dev 0.25 0.25 0.25 0.25Estuary 1 – Average �0.85 �0.40 0.05 0.77Estuary 1 – Std Dev 0.25 0.25 0.25 0.25Double Keyhole Pond – Average �0.96 �0.78 �0.21 �0.14Double Keyhole Pond – Std Dev 0.25 0.25 0.25 0.25Double Keyhole Spring – Average �1.03 �0.63 �0.61 0.29Double Keyhole Spring – Std Dev 0.25 0.11 0.25 0.25Isabella – Average �2.90 �2.92 �2.93 �2.75Isabella – Std Dev 0.25 0.25 0.11 0.25Lower portion of UFA – Average �2.08Lower portion of UFA – Std Dev 0.15
the spring entrance to the ‘Deep Room’ is approximately 150 malthough divers must travel approximately 400 m due to themeandering of the conduit. During a 50 min dive, datasonde mea-surements of temperature, salinity, pH, and DO taken every fiveseconds along the conduit path from the beginning of the springto the ‘Deep Room’ show no significant difference in any of thevariables collected (Fig. 4).
3.2. Double Keyhole Spring ‘Deep Room’ profile
The ‘Deep Room’ in Double Keyhole Spring extends from 10 mbelow the surface of the estuary to a depth of 76 m (Fig. 1) andis only accessible by divers through the main conduit at 27 mdepth. The water within the ‘Deep Room’ is well mixed from theconduit entrance up to a halo/chemo/thermocline at an approxi-mate depth of 19 m where DO and pH increase and temperatureand salinity decrease. Datasonde measurements of temperature,salinity, pH, and DO of the water column in the ‘Deep Room’ showno significant difference in any of the variables collected untilreaching the halo/chemo/thermocline (Fig. 5).
3.3. Rainfall patterns
Rainfall data was retrieved from three SWFWMD data collec-tions sites (Engle Park, Shady Hills, and Summer Tree, site IDs20546, 20552, and 20461 respectively) located within a two kmradius of Double Keyhole Spring. The average daily rainfallbetween these three sites ranged from nil to 20 cm over the courseof the study (Fig. 6). Rainfall in Florida generally follows a wet/dryseason pattern with the wet season coinciding with hurricane sea-son from June through November, and our data follows this pat-tern. Maximum average daily rainfall during the study (20 cm)was observed during Tropical Storm Debby in June 2012.
3.4. Tidal fluctuations and flow reversals
Short-term monitoring of Double Keyhole Spring indicates thatspring discharge is inversely related to tidal level with the tidalrange generally near one meter (Fig. 7). Our data shows regularly
Late-Summer2012
Fall 2012 Winter 2012 Spring 2013 Summer 2013 Fall 2013
41.6 62.1 56.8 49.9 84.8 57.95.9 8.0 6.1 2.7 5.5 2.534.3 48.3 47.4 55.2 54.5 48.33.5 1.8 1.4 3.1 3.6 2.044.6 42.9 46.2 48.1 58.7 52.24.1 2.2 5.0 0.9 5.6 0.434.9 41.1 40.3 48.9 62.4 55.43.9 4.4 5.9 4.9 4.5 5.65.7 5.7 4.2 5.5 5.9 5.60.2 0.3 0.2 0.2 0.0 0.0
Late-Summer2012
Fall 2012 Winter 2012 Spring 2013 Summer 2013 Fall 2013
�0.33 0.96 0.59 0.82 1.10 0.860.11 0.11 0.11 0.11 0.11 0.11�0.91 �0.31 �0.86 �0.66 �0.13 �0.260.11 0.11 0.11 0.11 0.11 0.11�1.03 �0.79 �0.90 �0.84 �0.56 �0.940.11 0.11 0.11 0.11 0.11 0.11�1.45 �1.51 �1.04 �1.03 �0.64 �0.980.25 0.11 0.11 0.11 0.11 0.11�3.00 �2.94 �3.16 �3.05 �3.12 �3.010.25 0.11 0.11 0.11 0.11 0.11

Water Temperature (°C)
Salinity
pH
Depth (m)
Dep
th (m
)
Wat
er T
empe
ratu
re (°
C)/S
alin
ity/ p
H
Dis
solv
ed O
xyge
n (m
g/L)
Dissolved Oxygen (mg/L)
Time (minutes)
25
20
15
10
5
0
0
-10
-20
-30
-40
-5000:00:00 00:10:00 00:20:00 00:30:00 00:40:00 00:50:00
Fig. 4. Datasonde profile along the Double Keyhole Spring conduit path from theentrance of the spring through the ‘Deep Room’ over the course of a 50 min dive.Temperature, salinity, pH, and dissolved oxygen remained constant from theentrance to the opening to the ‘Deep Room’.
Wat
er T
empe
ratu
re (°
C)
Salin
ity
pH
Dis
solv
ed O
xyge
n (m
g/L)
Dep
th (m
)
0
8.0 8.2 8.4 8.6 8.8 9.0 9.2
14
16
18
20
22
24
26
28
30
32
34
5 10 15 20 25
Water Temperature Dissolved Oxygen (mg/L)
(°C)/Salinity
pH
Fig. 5. Datasonde profile of the ‘Deep Room’ in Double Keyhole Spring.
Hyd
raul
ic H
ead,
NG
VD
29 (m
)Es
timat
ed A
quife
r Dis
char
ge (L
/s)
Sept
embe
r 201
1
Janu
ary
2012
May
201
2Tr
opic
al S
torm
Deb
by
Sept
embe
r 201
2
Janu
ary
2013
May
201
3
Sept
embe
r 201
3
Janu
ary
2014
Tota
l Dai
ly R
ainf
all (
cm)
4
3000
2000
1000
0
-1000
-2000
3
2
1
0
2520151050
-1
-2160 m240.8 m
63.7 m
143.3 m
Fig. 6. Hydraulic head data from four depths within ROMP TR 18-2 in the UpperFloridan aquifer, total daily rainfall around the study sites, and estimated aquiferdischarge from fall 2011 through winter 2013. Tropical Storm Debby is noted inJune 2012 by a dramatic increase of rainfall and subsequent increase of aquifer leveland spring discharge.
D.M. Menning et al. / Journal of Hydrology 527 (2015) 718–733 723
timed salinity increases that correspond to increased aquifer dis-charge at low tide. It also shows irregularly timed salinity increasesthat correspond to spring reversals at some high tides. Springreversals are accompanied by increases in DO and salinity.Reversals of aquifer discharge (saltwater intrusion events) can beseen on Figs. 6 and 7 as all points that fall below zero L/sEstimated Aquifer Discharge. The frequency of reversals increasedthroughout the dry season with a maximum occurring just beforeTropical Storm Debby (Table 2). Immediately after Tropical StormDebby, spring reversals stopped but gradually increased throughthe following dry season until the next rainy season in May2013. Datasondes were deployed from February 12th throughMarch 16th 2013 at different depths (16 m and 40 m) in DoubleKeyhole Spring. During that time there were a total of 39 high tidesthat included 10 reversal events of which seven reached a depth of16 m (24 m from the entrance) and four reached a depth of 40 m(110 m from the entrance).
3.5. Aquifer hydraulic head measurements
Aquifer hydraulic head data relative to mean sea level (NationalGeodetic Vertical Datum of 1929) were retrieved from theSWFWMD WMIS website (Fig. 6). Four depths (63.7 m, 143 m,160 m, and 240 m) within the same well (ROMP TR 18-2) locatedapproximately two km northeast of Double Keyhole Spring in theUpper Floridan aquifer (Fig. 3) were used to compare long-termhydraulic head changes to rainfall patterns and aquifer geochem-istry. The hydraulic head at 143 m was higher (2.17–3.08 m) thanany of the other three locations monitored, 63.7 m (0.73–1.92 m),160 m (�1.27–2.88 m), and 240 m (�1.37–3.02 m). TropicalStorm Debby in June 2012 resulted in a measurable increase atall locations but the greatest changes were seen at 160 m and240 m, +3.34 m and +4.15 m respectively. Approximately ninemonths after Tropical Storm Debby hydraulic head at 160 mshowed a 3.53 m decrease.
3.6. Aquifer discharge
Monitoring of Double Keyhole Spring discharge over the twoyear period shows that spring discharge ranges from approxi-mately �1449 L/s to 2576 L/s (Table 2). The negative values resultfrom reverse-flow events where estuary water enters the springwhile the positive values represent normal discharge from thespring. Average daily discharge and maximum daily discharge bothcorrelated to all four aquifer levels but not to total rainfall the week

4/7/2012 4/8/2012 4/9/2012 -1000
-500
0
500
1000
1500
2000
15.2
15.4
15.6
15.8
16.0
16.2
16.4
16.6
16
18
20
22
24
26
0
2
4
6
8
edt
ima
Est
) (L
/sha
rge
c D
isr
Aqui
fe
) (m
Dep
th
ytal
ini
S
mg/
L)(
xyge
nO
d ol
ves
Dis
Estimated Aquifer Discharge (L/s)Salinity
Dissolved Oxygen (mg/L)
Depth (m)
Fig. 7. Estimated aquifer discharge, tidal height (as datasonde depth at deployment location in meters), salinity, and dissolved oxygen concentration over a two day period inApril 2012. Flow reversals are indicated where estimated aquifer discharge falls below zero L/s. At each reversal event, salinity and dissolved oxygen in the conduit rises dueto the incoming estuary water. Salinity also increases at aquifer discharge maxima indicating an increase of the Gulf of Mexico input to aquifer discharge via a Venturi-typeeffect.
724 D.M. Menning et al. / Journal of Hydrology 527 (2015) 718–733
prior to or total rainfall between sampling dates (Table 3). The low-est discharge rate observed (�1449 L/s) was in April 2012 duringthe dry season. The highest discharge rate observed (2576 L/s)was immediately following Tropical Storm Debby in June 2012.Approximately nine hours after Tropical Storm Debby, aquifer dis-charge from Double Keyhole Spring increased from an average of506 L/s to 1549 L/s (Table 2). Correlations of aquifer discharge totidal height are shown in Table 2. The highest correlations wereseen during the dry seasons (R2 = +0.81 to +0.83) while the lowestwere seen in the wet seasons (R2 = +0.63 to +0.65).
3.7. Strontium concentration and d18O values
Strontium concentration and d18O values are shown in Table 1.Strontium concentrations ranged from a high of 102 mM at theDouble Keyhole Spring site in summer 2013 to a low of 34.3 mMat the estuary 1 site in late-summer 2012. Samples taken fromIsabella Spring are representative of the upper portion of theUpper Floridan aquifer and ranged from 2.99 to 9.88 mM. Thed18O values ranged from a low of �1.5‰ at Double KeyholeSpring in fall 2012 to a high of 2.4‰ at the estuary 2 site in summer2013. Samples taken from Isabella Spring are representative of theupper portion of the Upper Floridan aquifer and ranged from �2.8to �3.2‰.
3.8. Water quality along the estuarine transect
Monitored water quality parameters are shown in Figs. 8 and 9.Water temperature, salinity, pH, and DO showed statistically sig-nificant differences between all sites and dates. Water temperatureremained close to 24 �C in Double Keyhole Spring throughout thesampling period. Seasonal variations were observed at the estuary2 site where water temperatures fluctuated from 17 �C during thefall and winter to 28 �C during the summer. Salinity values rangedfrom a low of 0.9 at Isabella Spring in fall 2013 to a high of 25.8during spring 2012 at the estuary 2 site. There was a general linearincrease of pH from Double Keyhole Spring through estuary 2 site.The pH ranged from a low of 6.2 at Double Keyhole Spring in win-ter 2011 to a high of 8.9 in winter 2013 at the estuary 2 site.Dissolved oxygen concentrations displayed a general increasing
linear trend from nil at Double Keyhole Spring in fall 2013 to10.3 mg/L at the Double Keyhole Pond site. Ammonia concentra-tions ranged from nil at the estuary sites to 4.11 lM duringlate-summer 2012 at Isabella Spring. Nitrate concentrations ran-ged from 2.9 lM in summer 2012 to 11.9 lM spring 2012 atIsabella Spring. Sulfate concentrations ranged from 0.71 mM inwinter 2011 at Isabella Spring to 12.2 mM in summer 2012 atthe estuary 2 site. Phosphate concentrations ranged from0.38 lM in winter 2012 to 8.68 lM in summer 2012 at the estuary1 site. Correlations of rainfall, aquifer discharge, and aquiferhydraulic head to the studied geochemical parameters at all sitesalong the spring/estuary 2 site transect are shown in Tables 4–7.Ammonia concentration was the only measured variable that didnot show significant correlation to the hydrologic parametersmonitored during the study period. There were generally more sig-nificant and higher correlations of the monitored geochemicalparameters to rainfall, aquifer discharge, and aquifer hydraulichead at sites closer to Double Keyhole Spring than estuary 2 site.
4. Discussion
4.1. Double Keyhole Spring Profile
Datasonde results from Double Keyhole Spring show that oncewater enters the conduit system from the ‘Deep Room’ it hasalready been well mixed and physical water parameters remainconstant over distances of 400 m or less and in time frames of lessthan one hour (Fig. 4). In anchialine and submarine caves inBermuda, Van Hengstum and Scott (2011) found differences ofsalinity, organic matter, d13C values, and C:N ratios near caveentrances but once inside those parameters remained relativelyconstant throughout the conduit. Liu et al. (2004) found similarresults in a karst conduit system in China where prior to majorrainfall events there were no short-term changes observed inwater temperature or pH of spring discharge. Our data suggeststhat there are no other water sources entering the conduit pathbetween the surface and ‘Deep Room’ or if so, their impacts onthe geochemistry of the spring discharge are negligible over shorttime scales.

Table 2Discharge data of Double Keyhole Spring from fall 2011 through winter 2013.
Sample dates Average discharge(L/s)
Maximum discharge(L/s)
Minimumdischarge(L/s)
Dischargevs. Tide R2
Total data points Total datapoints reversing
Percent reversing
10/27/2011 3:00:00 PM – 12/12/2011 4:00:00 PM 765.56 1313.04 �708.78 0.6279 2211 114 5.1612/15/2011 4:00:00 PM – 2/9/2012 2:00:00 PM 754.81 1260.54 �307.13 0.7758 2685 162 6.033/22/2012 1:00:00 PM – 5/3/2012 11:00:00 AM 552.64 1591.19 �1449.11 0.81 2013 294 14.615/3/2012 12:30:00 PM – 6/25/2012 12:30:00 AM 505.99 1753.87 �1261.05 0.7036 2521 465 18.456/27/2012 2:00:00 PM – 7/19/2012 2:00:00 PM 1548.65 2576.68 40.26 No data 1057 0 0.007/19/2012 2:00:00 PM – 9/17/2012 2:30:00 PM 1279.47 2288.32 �190.25 0.6515 2882 10 0.359/20/2012 4:30:00 PM – 10/29/2012 1:00:00 PM 1082.07 1894.91 �264.73 0.7571 1866 16 0.8611/5/2012 4:00:00 PM – 1/24/2013 12:30:00 PM 1028.90 2127.03 �588.26 0.7544 3834 92 2.402/7/2013 1:30:00 PM – 4/25/2013 11:30:00 AM 896.88 1742.41 �689.19 0.739 3693 107 2.904/25/2013 1:30:00 PM – 5/9/2013 11:30:00 AM 786.36 1874.65 �347.77 0.8306 669 32 4.785/9/2013 2:00:00 PM – 6/9/2013 4:30:00 PM 775.57 1766.78 �575.07 0.815 1494 91 6.098/20/2013 12:30:00 PM – 12/15/2013 2:30:00 AM 1154.17 2130.85 �510.74 0.7189 5597 91 1.63
Table 3Correlations of rainfall, Double Keyhole Spring discharge, and aquifer hydraulic head. Values are only shown where p is less than 0.05.
Control variables Total rainfall theweek prior tosampling
Total rainfallbetween samplecollections
AverageDailyDischarge
MaximumDailyDischarge
Aquifer waterelevation gauge@ 63.7 m
Aquifer waterelevation gauge@ 143 m
Aquifer waterelevation gauge@ 160 m
Total rainfall betweensample collections
Correlation .643Significance (2-tailed) .000df 47
Average Daily Discharge CorrelationSignificance (2-tailed)df
Maximum Daily Discharge Correlation .721Significance (2-tailed) .000df 47
Aquifer water elevationgauge @ 63.7 m
Correlation .543 .815 .388 .573Significance (2-tailed) .000 .000 .006 .000df 47 47 47 47
Aquifer water elevationgauge @ 143 m
Correlation .592 .615 .764 .888Significance (2-tailed) .000 .000 .000 .000df 47 47 47 47
Aquifer water elevationgauge @ 160 m
Correlation .565 .868 .499 .804Significance (2-tailed) .000 .000 .000 .000df 47 47 47 47
Aquifer water elevationgauge @ 240 m
Correlation .694 .799 .635 .871 .870Significance (2-tailed) .000 .000 .000 .000 .000df 47 47 47 47 47
D.M. Menning et al. / Journal of Hydrology 527 (2015) 718–733 725
4.2. Double Keyhole ‘Deep Room’ profile
The depth profile of the ‘Deep Room’ in Double Keyhole Springindicates that the water is well mixed from the conduit entranceup to the halo/chemo/thermocline at the top of the room (Fig. 5).We suspect that the level of the halo/chemo/thermocline in the‘Deep Room’ of Double Keyhole Spring varies daily with tidal fluctu-ations and seasonally with rainfall patterns and aquifer levelsalthough long term monitoring has not yet been conducted. In anearby off-shore sink, Garman et al. (2011) found seasonal variationsof temperature, salinity, pH, and DO with depth indicating theupward and downward movement of the halo/chemo/thermoclineover time which may also be occurring in the ‘Deep Room’ ofDouble Keyhole Spring. The mixing diagram showing the ratio ofsalinity to d18O values versus salinity (Fig. 10) suggests that thewater found at the top of the ‘Deep Room’ underneath the estuaryinside Double Keyhole Spring has a composition more similar toevaporatively 18O-enriched surface water than to surficial aquiferwater or surface water from Isabella Spring. This implies that thefreshwater at the top of the ‘Deep Room’ in Double Keyhole Springis terrestrial runoff that followed the topographic gradient through
the karst matrix and is distinct from the water from Isabella Springthat has made its way through the Upper Floridan aquifer system.
4.3. Tidal fluctuations
Monitoring of Double Keyhole Spring discharge shows a directcorrelation of tidal height to spring discharge where spring dis-charge increases at low tide (Fig. 7 and Table 2). These correlationswere generally higher during the dry season than the wet seasonwhich is most likely due to the added variable of aquifer recharge.Koizumi (1993) also found tidal influences on groundwater dis-charge from an artesian well in Japan where discharge increasedat low tide. Numerous papers modeling SGD also support thisobservation (Ataie-Ashtiani et al., 1999; Li et al., 1999; Robinsonet al., 2007; Abarca et al., 2013).
The area of the pond outside of Double Keyhole Spring isapproximately 4500 m2 with a mean water level near 1.2 m(Fig. 7). Accounting for a tidal range of 1 m, the volume of waterin the pond typically ranges from 3150 to 7650 m3. The observedsalinity increase during periods of low tide/increased spring dis-charge is most likely due to reduction of overhead tidal pressure

DK Spring
DK Spring
DK Spring
DK Spring
Isabella
Isabella
Isabella
Isabella
DK Pond
DK Pond
DK Pond
DK Pond
Estuary 1
Estuary 1
Estuary 1
Estuary 1
Estuary 2
Estuary 2
Estuary 2
Estuary 2
102 llaF1 102 retni
W1 2102 gnirp
S
2102 rem
muS
2102 llaF
2102 rem
muS-etaL
Tybbe
D mrot
S lacipor
2102 retniW
3102 gnirpS
3102 rem
muS
3102 llaF
Wat
er T
)C°( erutarep
meytinila
SpH
)L/gm( negyx
O devlossiD
A
B
C
D
66.577.588.59
17
20
23
26
29
32
0
5
10
15
20
25
0
2.5
5
7.5
10
Fig. 8. Surfer plots of alkalinity, dissolved oxygen, pH, salinity, and water temperature at all sites from fall 2011 through fall 2013.
726 D.M. Menning et al. / Journal of Hydrology 527 (2015) 718–733
allowing high salinity brackish water from the surface estuary tobe drawn down through the karst matrix into the conduit/mixingzone via the Venturi effect (Fig. 1). These salinity increases werenot caused by intrusion events because intrusion events wouldbe accompanied by increased DO concentrations and negative dis-charge volumes. The DO concentrations and discharge volume datademonstrate that estuarine water brought in during reversalevents is washed out within the same approximate amount of timein which the reversal occurred (Fig. 7). Conversely, the lower salin-ities of the Double Keyhole Spring discharge observed at high tide(Fig. 7) may be due to a combination of effects. For example, theincoming saltwater wedge could force low salinity brackish waterfrom the mixing zone into the conduit from below. Another possi-bility is that increased tidal pressure could force water from thefreshwater lens above the conduit through the karst matrix intothe conduit allowing for more freshwater to be drawn into the con-duit via a Venturi effect. Maramathas et al. (2006) describe thisprinciple as a potential mechanism for the brackish nature ofspring discharge. They assume that two conduits (one containingfresh groundwater and one containing sea water) mix at a singlepoint inland of the spring entrance resulting in brackish springdischarge.
4.4. Rainfall patterns
The main rainfall events during this two year study were a per-iod of drought, followed by Tropical Storm Debby, and finally anextended rainy period. Analysis of rainfall patterns shows the con-nectivity of Double Keyhole Spring to the Upper Floridan aquifer(Fig. 6 and Table 3). Hydraulic head data from ROMP TR 18-2 ata depth of 63.7 m shows significant correlations (R2 = +0.543) tototal rainfall the week prior to sampling. Hydraulic head data atboth 63.7 m and 143 m show significant correlations (R2 = +0.815and +0.592, respectively) to the total amount of rainfall betweensample collections. These data suggest a rapid recharge of theupper portion of the Upper Floridan aquifer as was seen in June2012 when Tropical Storm Debby produced over 20 cm of rainfallin the area surrounding the study sites. After Tropical StormDebby, aquifer discharge from Double Keyhole Spring and thehydraulic head at all four monitored well depths within ROMPTR 18-2 increased. Studies by Lakey and Krothe (1996),Knochenmus and Yobbi (2001), Doctor et al. (2006), and Hermanet al. (2009) all show similar responses of storm events to springdischarge although the lag times vary depending on the amountof rainfall and geological setting. In a study of the Santa Fe river

102 llaF1 102 retni
W1 2102 gnirp
S
2102 rem
muS
2102 llaF
2102 rem
muS-etaL
Tybbe
D mrot
S lacipor
2102 retniW
3102 gnirpS
3102 rem
muS
3102 llaF
)Mμ( aino
mm
A)
Mμ( etartiN
)M
m( etafluS
)Mμ( etahpsoh
P
DK Spring
DK Spring
DK Spring
DK Spring
Isabella
Isabella
Isabella
Isabella
DK Pond
DK Pond
DK Pond
DK Pond
Estuary 1
Estuary 1
Estuary 1
Estuary 1
Estuary 2
Estuary 2
Estuary 2
Estuary 2A
B
C
D
0
0.015
0.03
0.045
0.06
0.075
0.160.260.360.460.560.660.760
300
600
900
120000.150.30.450.60.750.9
0.00
0.88
1.76
2.64
3.52
4.40
12.26
12.49
9.487.906.324.74
3.161.580
9.37
6.25
3.12
0
10.649.037.425.814.192.54
Fig. 9. Surfer plots of phosphate, sulfate, nitrate, and ammonia at all sites from fall 2011 through fall 2013.
D.M. Menning et al. / Journal of Hydrology 527 (2015) 718–733 727
basin in north-central Florida where the geology is very similar tothe area around Double Keyhole Spring, Ritorto et al. (2009) foundthat diffuse recharge following storm events resulted in increasedriver and conduit discharge. They also found that in between stormevents, river discharge generally decreased with decreasinghydraulic heads in wells nearby. Although our study only focusedon conduit discharge, the same patterns can be seen between theSanta Fe river basin and Double Keyhole Spring in that dischargeamounts increased following storm events and generally decreasedwith decreasing hydraulic heads in nearby monitoring wells(Fig. 6) that accompany drought or overuse of the aquifer.
4.5. Aquifer water-level measurements
There were no significant correlations between hydraulic headin the lower portions of the Upper Floridan aquifer to rainfall indi-cating a slower recharge of this part of the Floridan aquifer. This ismost likely due to the differences in porosity and permeabilitybetween the limestone and dolostone layers as well as the multiplelayers of clay that may act as semi-confining units (Table 3).
Ehrenberg et al. (2006) showed that buried dolostone tends to havehigher porosity than buried limestone in the same area and thatthe buried limestone may act as a barrier to water flow due tochemical compaction and cementation. The slower recharge mayalso be due to multiple layers of clay in the lower portion of theUpper Floridan aquifer that creates semi-confining units. A reviewby Back (1986) describes how semi-confining units can determinethe rates of infiltration and discharge in aquifers. The hydraulichead at 160 m shows a sudden decrease in May 2013 but no con-current change at 240 m (Fig. 6). There are several possible expla-nations for the observed decline in hydraulic head at 160 m but notat 240 m. The most likely explanation, given the geology of theaquifer layers (Fig. 1), is that the multiple layers of clay between160 m and 240 m are acting as a semi-confining unit preventingthe rapid discharge of water from 240 m. Other possible explana-tions for the rapid discharge seen at a depth of 160 m but not at240 m include: the permeability of the rocks around 160 m maybe greater than 240 m; there may be a break in the single layerof clay above 160 m; there could be a connection to a conduit at160 m; or there could be increased pumping of freshwater from
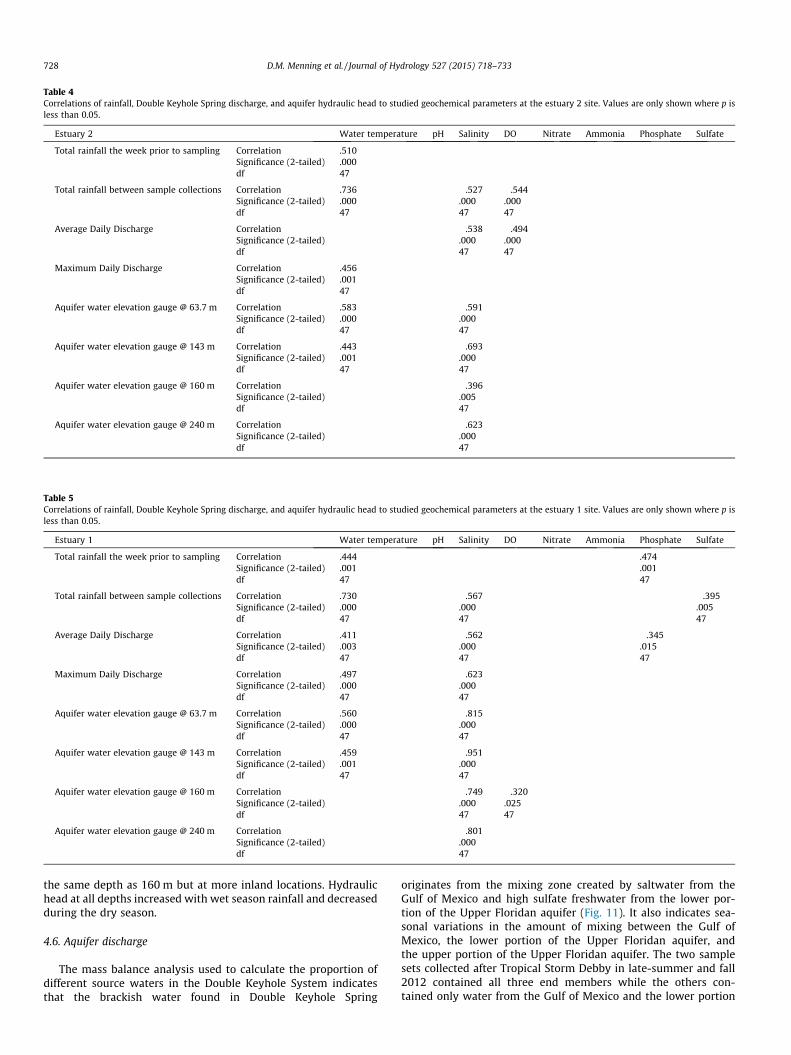
Table 4Correlations of rainfall, Double Keyhole Spring discharge, and aquifer hydraulic head to studied geochemical parameters at the estuary 2 site. Values are only shown where p isless than 0.05.
Estuary 2 Water temperature pH Salinity DO Nitrate Ammonia Phosphate Sulfate
Total rainfall the week prior to sampling Correlation .510Significance (2-tailed) .000df 47
Total rainfall between sample collections Correlation .736 �.527 �.544Significance (2-tailed) .000 .000 .000df 47 47 47
Average Daily Discharge Correlation �.538 �.494Significance (2-tailed) .000 .000df 47 47
Maximum Daily Discharge Correlation .456Significance (2-tailed) .001df 47
Aquifer water elevation gauge @ 63.7 m Correlation .583 �.591Significance (2-tailed) .000 .000df 47 47
Aquifer water elevation gauge @ 143 m Correlation .443 �.693Significance (2-tailed) .001 .000df 47 47
Aquifer water elevation gauge @ 160 m Correlation �.396Significance (2-tailed) .005df 47
Aquifer water elevation gauge @ 240 m Correlation �.623Significance (2-tailed) .000df 47
Table 5Correlations of rainfall, Double Keyhole Spring discharge, and aquifer hydraulic head to studied geochemical parameters at the estuary 1 site. Values are only shown where p isless than 0.05.
Estuary 1 Water temperature pH Salinity DO Nitrate Ammonia Phosphate Sulfate
Total rainfall the week prior to sampling Correlation .444 .474Significance (2-tailed) .001 .001df 47 47
Total rainfall between sample collections Correlation .730 �.567 �.395Significance (2-tailed) .000 .000 .005df 47 47 47
Average Daily Discharge Correlation .411 �.562 �.345Significance (2-tailed) .003 .000 .015df 47 47 47
Maximum Daily Discharge Correlation .497 �.623Significance (2-tailed) .000 .000df 47 47
Aquifer water elevation gauge @ 63.7 m Correlation .560 �.815Significance (2-tailed) .000 .000df 47 47
Aquifer water elevation gauge @ 143 m Correlation .459 �.951Significance (2-tailed) .001 .000df 47 47
Aquifer water elevation gauge @ 160 m Correlation �.749 �.320Significance (2-tailed) .000 .025df 47 47
Aquifer water elevation gauge @ 240 m Correlation �.801Significance (2-tailed) .000df 47
728 D.M. Menning et al. / Journal of Hydrology 527 (2015) 718–733
the same depth as 160 m but at more inland locations. Hydraulichead at all depths increased with wet season rainfall and decreasedduring the dry season.
4.6. Aquifer discharge
The mass balance analysis used to calculate the proportion ofdifferent source waters in the Double Keyhole System indicatesthat the brackish water found in Double Keyhole Spring
originates from the mixing zone created by saltwater from theGulf of Mexico and high sulfate freshwater from the lower por-tion of the Upper Floridan aquifer (Fig. 11). It also indicates sea-sonal variations in the amount of mixing between the Gulf ofMexico, the lower portion of the Upper Floridan aquifer, andthe upper portion of the Upper Floridan aquifer. The two samplesets collected after Tropical Storm Debby in late-summer and fall2012 contained all three end members while the others con-tained only water from the Gulf of Mexico and the lower portion

Table 6Correlations of rainfall, Double Keyhole Spring discharge, and aquifer hydraulic head to studied geochemical parameters at the Double Keyhole Pond site. Values are only shownwhere p is less than 0.05.
Double Keyhole Pond Water temperature pH Salinity DO Nitrate Ammonia Phosphate Sulfate
Total rainfall the week prior to sampling Correlation .498 �.375Significance (2-tailed) .000 .008df 47 47
Total rainfall between sample collections Correlation .675 �.431 �.355Significance (2-tailed) .000 .002 .012df 47 47 47
Average Daily Discharge Correlation .499 �.369Significance (2-tailed) .000 .009df 47 47
Maximum Daily Discharge Correlation .571 �.572 �.420 .430Significance (2-tailed) .000 .000 .003 .002df 47 47 47 47
Aquifer water elevation gauge @ 63.7 m Correlation .495 �.579 �.405Significance (2-tailed) .000 .000 .004df 47 47 47
Aquifer water elevation gauge @ 143 m Correlation .407 �.754 �.535Significance (2-tailed) .004 .000 .000df 47 47 47
Aquifer water elevation gauge @ 160 m Correlation �.737 �.533 .492Significance (2-tailed) .000 .000 .000df 47 47 47
Aquifer water elevation gauge @ 240 m Correlation �.699 �.332 .465Significance (2-tailed) .000 .020 .001df 47 47 47
Table 7Correlations of rainfall, Double Keyhole Spring discharge, and aquifer hydraulic head to studied geochemical parameters at the Double Keyhole Spring site. Values are only shownwhere p is less than 0.05.
Double Keyhole Spring Water temperature pH Salinity DO Nitrate Ammonia Phosphate Sulfate
Total rainfall the week prior to sampling Correlation .777 �.536Significance (2-tailed) .000 .000df 47 47
Total rainfall between sample collections Correlation .377 .515Significance (2-tailed) .008 .000df 47 47
Average Daily Discharge Correlation .455 �.531 �.690 �.402 .448Significance (2-tailed) .001 .000 .000 .004 .001df 47 47 47 47 47
Maximum Daily Discharge Correlation .595 �.461 �.698 .439Significance (2-tailed) .000 .001 .000 .002df 47 47 47 47
Aquifer water elevation gauge @ 63.7 m Correlation .675 �.370 .453Significance (2-tailed) .000 .009 .001df 47 47 47
Aquifer water elevation gauge @ 143 m Correlation .600 �.614 .420Significance (2-tailed) .000 .000 .003df 47 47 47
Aquifer water elevation gauge @ 160 m Correlation .538 �.433 .407Significance (2-tailed) .000 .002 .004df 47 47 47
Aquifer water elevation gauge @ 240 m Correlation .491 �.677 .382Significance (2-tailed) .000 .000 .007df 47 47 47
D.M. Menning et al. / Journal of Hydrology 527 (2015) 718–733 729
of the Upper Floridan aquifer. The estuary 2 site portion of thebrackish water found in Double Keyhole Spring ranged from alow of 22% during fall 2011 to a high of 63% during summer2013. Generally there was more of a marine influence followingrainfall events. This suggests that during the wet season,increased water pressure is forcing the mixing zone offshoreresulting in increased water from the mixing zone to dischargethrough Double Keyhole Spring thereby protecting inland fresh-water resources. A study by Michael et al. (2005) of Waquoit
Bay, Massachusetts, also found seasonal movement of the mixingzone that depended on the inland hydrologic cycle. They notedthat during the dry season there was an inland shift of the mix-ing zone as the water table falls, and during the wet season,when the water table rises, the mixing zone, moves off-shore.Seasonal shifts such as this can also be seen at all of our siteswhere the proportions of each component of water (estuary 2site, upper and lower portions of the Upper Floridan Aquifer)change with rainfall and aquifer hydraulic head (Fig. 11).

0 5 10 15 20 25 30-4
-3
-2
-1
0
1
2Double Keyhole Spring
‘Deep Room’
Freshwatery = 1.6111x - 4.5835
r² = 0.8033
Brackishy = 0.0116x - 0.2296
r² = 0.6414
18 δO
(‰)/S
alin
ity
Salinity
Fig. 10. Mixing diagram showing the ratio of d18O values to salinity versus salinity.Freshwater samples were collected from Isabella Spring. Brackish samples includeall samples collected from the Double Keyhole Spring, Double Keyhole Pond,estuary 1 and 2 sites. The red diamond indicates the sample collected from the topof the ‘Deep Room’ in Double Keyhole Spring. Freshwater lakes in central Floridahave salinity concentrations near zero and d18O values ranging from �1.04‰ to2.93‰ (Sacks et al., 1998). (For interpretation of the references to color in this figurelegend, the reader is referred to the web version of this article.)
100%
100%
100%
60%
60%
60%
50%
50%
50%
40%
40%
40%
30%
30%
30%
20%
20%
20%
10%
10%
10%
0%
0%
0%
80%
80%
80%
70%
70%
70%
90%
90%
90%
1 yrauts EdnoP el ohye
K el buoD
gnir pS el ohyeK el buo
D
102 ll aF1 102 r et ni
W1 2102 gni r p
S
2102 r em
muS
2102 r em
muS- et aL
Tybbe
D mr ot
S l aci por
2102 ll aF
2102 r et niW
3102 gni r pS
Sum
mer
201
3 3102 ll aF
% Lower UFA% Upper UFA% Estuary 2
% Lower UFA% Upper UFA% Estuary 2
% Lower UFA% Upper UFA% Estuary 2
Fig. 11. Hydrogeological conditions of the Double Keyhole Spring, Double KeyholePond, and the estuary sites showing the proportions of Upper Floridan and Gulf ofMexico water from fall 2011 through fall 2013.
730 D.M. Menning et al. / Journal of Hydrology 527 (2015) 718–733
The average discharge of Double Keyhole Spring prior toTropical Storm Debby was 506 L/s, with a peak right after Debbyof 2576 L/s and an average of 1549 L/s in the months afterDebby. The estimated volume of the Double Keyhole pond rangesfrom 3150 to 5400 m3 depending on the tide. At peak discharge,the spring could displace the entire volume of the pond in approx-imately19 min, while at its pre-Debby mean, it would take about3 h. The mass balance analysis showed that 20–62% of the waterfrom the Double Keyhole Spring conduit is recirculated throughthe karst from the Estuary 2 site and the remainder is from thelower portion of the Upper Floridan Aquifer. In contrast 40–70%of the pond water is from the Estuary 2 site. This increase of 8–20% is due to surface mixing of pond water with Estuary 2 sitewater through tidal action.
The effects of Tropical Storm Debby were apparent during thelate-summer and fall 2012 collections. In late-summer 2012,approximately 17% of the estuary 1 site water was from the upperportion of the Upper Floridan aquifer. This was the only time duringour two year study when water from the upper portion of the UpperFloridan aquifer was detected in the estuary. This indicates that dur-ing times of heavy rainfall, freshwater bypasses the Double KeyholeSpring conduit and discharges directly into the estuary by diffuseflow through the karst or through small conduits. In fall 2012 therewas a measureable percentage of water (4%) from the upper portionof the Upper Floridan aquifer found within Double Keyhole Springdischarge (Fig. 11). This was the only time that water from the upperportion of the Upper Floridan aquifer was detected in DoubleKeyhole Spring discharge indicating the minor influence this portionof the aquifer has on the composition of the spring discharge. Thissuggests that it takes three to four months for rainwater from trop-ical storms to pass through the aquifer and discharge from thespring. The smaller percentage of upper Floridan aquifer waterfound at the Double Keyhole Pond site compared to the DoubleKeyhole Spring site demonstrates that the discharge from the springis quickly diluted as it moves into the estuary.
4.7. Water quality along the estuarine transect
Geochemical profiles along the transect from Double KeyholeSpring through the estuary 2 site near the Gulf of Mexico showthe influences of aquifer fed spring discharge on geochemical
gradients in the surrounding estuary (Figs. 8 and 9). In an examina-tion of submarine groundwater discharge near the island ofHawaii, Grossman et al. (2010) found that SGD extended between100 m and 1000 m offshore showing the range of impact SGD mayhave on the surrounding area. We found the effects of DoubleKeyhole Spring discharge two km from the spring at the estuary2 site.
Water temperature is the most seasonally influenced factoralong the transect (Fig. 8D and Tables 4–7). In the summer, the coolspring discharge water warms up to Gulf temperatures by the timeit reaches the estuary 2 site while in the winter the spring dis-charge water cools to Gulf temperature well past the estuary 2 site.Water temperatures within the spring were also correlated(R2 = +0.377) to total rainfall over the three months prior to sam-pling. These correlations support the hypothesis that there is athree to four month lag between a major rainfall event and dis-charge of that water from the spring, despite the fact that increaseddischarge from the spring, occurs in less than a day. We hypothe-size that spring discharge immediately after a major rainfall eventis comprised of water already within the aquifer being pushed outby increased inland hydraulic head and that it takes three to fourmonths for the rainwater to discharge from the spring.
Salinity and pH gradients also show seasonal variations (Fig. 8Band C). During the dry season, pH gradients extend further out

D.M. Menning et al. / Journal of Hydrology 527 (2015) 718–733 731
from Double Keyhole Spring toward the estuary 2 site than duringthe wet season. Salinity gradients indicate the presence of addi-tional SGD from diffuse flow or small conduits in these areas thatbypass the Double Keyhole Spring conduit immediately afterTropical Storm Debby (Fig. 8C). Salinity had the highest correlationto hydraulic head at all sites except for within Double KeyholeSpring which had the highest correlation (R2 = +0.777) to rainfallthe week prior to sampling (Tables 4–7). Salinity at the estuary 2site (17.6–29.9, Fig. 8C) was less than the salinity reported byNOAA for Gulf of Mexico water (35–36, http://www.nodc.noaa.-gov/OC5/regional_climate/GOMclimatology/). The Florida shelfremains relatively shallow for miles offshore and it was not logis-tically feasible to collect Gulf of Mexico water samples for thisstudy. The observed salinity fluctuations and the lower thanexpected values at the estuary 2 site indicate the influence ofspring discharge on creating the salinity gradient along the estuar-ine transect and suggest additional freshwater inputs in the areamost likely via diffuse flow through the karst matrix.
The effects of Tropical Storm Debby can be seen in geochem-ical changes at the estuary 1 and Double Keyhole Pond sites. Weexamined how many significant differences in geochemicalparameters there were between sites and dates before and afterTropical Storm Debby. If there were none or only a few significantdifferences (<50%) for a particular chemical among different adja-cent sample dates and sites, that chemical was not consideredhighly partitioned. If there were a lot of significant differences(>50%), the chemical was considered highly partitioned. Someparameters showed extensive differences both before and afterTropical Storm Debby (Fig. 8). Prior to Tropical Storm Debby,there were more changes of some geochemical parameters overtime and space close to Double Keyhole Spring than there wereat the Pond and estuary 1 and 2 sites. After Tropical StormDebby, there was an increase in partitioning of geochemicalparameters at the sites farther away from Double KeyholeSpring. This was most apparent with phosphate, sulfate, andnitrate (Fig. 9A–C) where there were fewer significant differencesprior to Debby and more significant differences after TropicalStorm Debby. The observed spike of phosphate concentration insummer 2012 and nitrate in fall 2012 could be due to mixingof nutrient rich water of unknown origin, either anthropogenicor from the Gulf of Mexico. Other parameters (DO, pH, salinity,and water temperature) were partitioned equally before and afterTropical Storm Debby, but the patterns of distribution changeddramatically (Fig. 8).
At the estuary 1 site and Double Keyhole Pond sites ammoniaconcentrations increased while salinity decreased immediatelyafter Tropical Storm Debby (Figs. 8C and 9D). This is most likelydue to increased submarine groundwater discharge diffusely flow-ing through the karst or small conduits that bypass the DoubleKeyhole Spring conduit and discharge directly into the area sur-rounding the Double Keyhole Pond and estuary sites. No seasonalcycles were observed over the course of the two year study forany of the geochemical parameters tested at the Double KeyholeSpring, Double Keyhole Pond, or estuary sites. However, ammoniaand nitrate concentrations at Isabella Spring showed seasonal vari-ations. The increase of ammonia concentrations at the estuary 1and Double Keyhole Pond sites may be due to higher ammoniaconcentrations found at Isabella Spring.
5. Conclusions
This study found that the hydrological and geochemical fluctu-ations observed within the karst estuary surrounding Double
Keyhole Spring are governed by interactions between inlandhydrological conditions and sea level. Aquifer discharge throughDouble Keyhole Spring varied daily with tidal fluctuations and sea-sonally with local rainfall and aquifer levels (Figs. 6 and 7). The fre-quency of reversals increased as the inland water table decreased.Reversals were observed up to a depth of 40 m, approximately110 m within the Double Keyhole Spring conduit from theentrance (Fig. 1). We found that the brackish water dischargingfrom Double Keyhole Spring originates from the mixing zonebetween the Upper Floridan aquifer and the Gulf of Mexico locatedbelow the estuary (Fig. 11). The amount of each portion (UpperFloridan Aquifer vs. Gulf of Mexico) varied seasonally. During thedry season, when aquifer levels fell, the mixing zone moved inlandresulting in increased proportion of salt water from the Gulf ofMexico. We hypothesize that the increased hydraulic head inlandcaused by Tropical Storm Debby pushed brackish water alreadyin the mixing zone out through the spring, resulting in theobserved increase of the salt water component.
Correlations of hydraulic head from the Floridan aquifer andDouble Keyhole Spring discharge to the geochemical parametersin this study (Tables 4–7) indicate that the primary driver of thegeochemical gradients observed between Double Keyhole Springand the surrounding karst estuary is the volume of aquifer dis-charge from the spring. These geochemical differences wereobserved at the estuary 2 site almost two km away. With theexception of ammonia, there was more partitioning of the geo-chemical parameters along the transect from Double KeyholeSpring through the estuary 2 site after Tropical Storm Debby thanbefore Tropical Storm Debby with increased partitioning at thesites farther away from the spring.
The geochemical variations observed, indicated that duringperiods of heavy rainfall, such as Tropical Storm Debby, a portionof the SGD diffused from the upper freshwater portion of theUpper Floridan aquifer bypassing the Double Keyhole Spring con-duit and discharging directly into the surrounding estuary(Figs. 8C and 11). During the dry seasons when aquifer dischargewas at a minimum, the observed gradients were less partitioned,indicating more water input from the Gulf of Mexico.
Double Keyhole Spring serves as a model to study KarstEstuaries as it currently lies in the transition zone between anactive inland freshwater and an offshore inactive spring. Theimpacts of tidal fluctuations, rainfall, and aquifer level on sub-marine spring discharge can be used as a baseline for the impactsof future development in the area as well as other karst estuariesaround the world. In its current state the karst estuary surroundingDouble Keyhole Spring is considered pristine according to the con-ditions set by the Florida Department of State Rule Chapter 62-302(http://www.dep.state.fl.us/legal/Rules/shared/62-302/62-302.pdf). These types of spring/estuary systems appear to be commonalong the Florida Gulf Coast (Fig. 2). However, if drought, increasedaquifer usage, and/or increased sea levels cause the mixing zoneunderneath these systems to permanently move inland it couldtransform the areas around these springs from karst estuaries tosalt marshes resulting in dramatic impacts on the biologicalcommunities.
Acknowledgements
The authors thank the University of South Florida for supportingthis project. We thank Pasco County FL for allowing access to thesite, Dave DeWitt of the South West Florida Water ManagementDistrict and Zachary Atlas of the Geology Department at USF forassistance. Many undergraduates provided surface and logistical

732 D.M. Menning et al. / Journal of Hydrology 527 (2015) 718–733
support in the field and helped process samples in the lab, includingElaina Graham, William Carraher-Stross and Devon Thomas.
References
Abarca, E., Karam, H., Hemond, H.F., Harvey, C.F., 2013. Transient groundwaterdynamics in a coastal aquifer: the effects of tides, the lunar cycle, and the beachprofile. Water Resour. Res. 49 (5), 2473–2488.
Ataie-Ashtiani, B., Volker, R.E., Lockington, D.A., 1999. Tidal effects on sea waterintrusion in unconfined aquifers. J. Hydrol. 216 (1–2), 17–31.
Back, W., 1986. Role of aquitards in hydrogeochemical systems: a synopsis. Appl.Geochem. 1 (3), 427–437.
Bai, J., Chen, C.T., Zhao, Y.G., Tian, W.J., Dong, X., Yin, N.N., 2010. Studies onnitrobacteria and nitrification in Liaohe estuary wetland sediments. Huan JingKe Xue 31 (12), 3011–3017.
Beck, M.W., Heck, K.L., Able, K.W., Childers, D.L., Eggleston, D.B., Gillanders, B.M.,Halpern, B., Hays, C.G., Hoshino, K., Minello, T.J., Orth, R.J., Sheridan, P.F.,Weinstein, M.R., 2001. The identification, conservation, and management ofestuarine and marine nurseries for fish and invertebrates. Bioscience 51 (8),633–641.
Bigg, G.R., Rohling, E.J., 2000. An oxygen isotope data set for marine waters. J.Geophys. Res.-Oceans 105 (C4), 8527–8535.
Burnett, W., Bokuniewicz, H., Huettel, M., Moore, W., Taniguchi, M., 2003.Groundwater and pore water inputs to the coastal zone. Biogeochemistry 66(1–2), 3–33.
Burnett, W.C., Aggarwal, P.K., Aureli, A., Bokuniewicz, H., Cable, J.E., Charette, M.A.,Kontar, E., Krupa, S., Kulkarni, K.M., Loveless, A., Moore, W.S., Oberdorfer, J.A.,Oliveira, J., Ozyurt, N., Povinec, P., Privitera, A.M.G., Rajar, R., Ramassur, R.T.,Scholten, J., Stieglitz, T., Taniguchi, M., Turner, J.V., 2006. Quantifying submarinegroundwater discharge in the coastal zone via multiple methods. Sci. TotalEnviron. 367 (2–3), 498–543.
Craig, H., Gordon, L.I., 1965. Isotopic oceanography: Deuterium and oxygen 18variations in the ocean and the marine atmosphere. Stable Isotopes inOceanographic Studies and Paleotemperatures. E. Tongiorgi. Spoleta, Italy,Consiglio Nazionale Delle Ricerche Laboratorio di Geologia Nucleare: 9-130.
Dansgaard, W., 1964. Stable isotopes in precipitation. Tellus 16 (4), 436–468.de Vries, J.J., Simmers, I., 2002. Groundwater recharge: an overview of processes and
challenges. Hydrogeol. J. 10 (1), 5–17.Decker, J.L., 1983. Executive Summary TR 18-2 ‘‘Aripeka’’. Southwest Florida Water
Management District.Doctor, D.H., Alexander, E.C., Petric, M., Kogovsek, J., Urbanc, J., Lojen, S., Stichler, W.,
2006. Quantification of karst aquifer discharge components during stormevents through end-member mixing analysis using natural chemistry andstable isotopes as tracers. Hydrogeol. J. 14 (7), 1171–1191.
Durr, H.H., Laruelle, G.G., van Kempen, C.M., Slomp, C.P., Meybeck, M., Middelkoop,H., 2011. Worldwide typology of nearshore coastal systems: defining theestuarine filter of river inputs to the Oceans. Estuaries Coasts 34 (3), 441–458.
Eggins, S.M., Woodhead, J.D., Kinsley, L.P.J., Mortimer, G.E., Sylvester, P., McCulloch,M.T., Hergt, J.M., Handler, M.R., 1997. A simple method for the precisedetermination of >=40 trace elements in geological samples by ICPMS usingenriched isotope internal standardisation. Chem. Geol. 134 (4), 311–326.
Ehrenberg, S.N., Eberli, G.P., Keramati, M., Moallemi, S.A., 2006. Porosity-permeability relationships in interlayered limestone-dolostone reservoirs.Aapg Bull. 90 (1), 91–114.
Epstein, S., Mayeda, T., 1953. Variation of O18 content of waters from naturalsources. Geochim. Cosmochim. Acta 4 (5), 213–224.
Fleury, P., Bakalowicz, M., de Marsily, G., 2007. Submarine springs and coastal karstaquifers: a review. J. Hydrol. 339 (1–2), 79–92.
Garman, K.M., Garey, J.R., 2005. The transition of a freshwater karst aquifer to ananoxic marine system. Estuaries 28 (5), 686–693.
Garman, K.M., Rubelmann, H., Karlen, D.J., Wu, T.H., Garey, J.R., 2011. Comparison ofan inactive submarine spring with an active nearshore anchialine spring inFlorida. Hydrobiologia 677 (1), 65–87.
Grossman, E.E., Logan, J.B., Presto, K.M., Storlazzi, C.D., 2010. SubmarineGroundwater Discharge and Fate Along the Coast of Kaloko-HonokohauNational Historic Park, Island of Hawaii; Part3, Spatial and Temporal Patternsin Nearshore Waters and Coastal Groundwater Plumes, December 2003-April2006. U.S. Geological Survey Scientific Investigations Report 2010-5081.
Harrington, D., Maddox, G., Hicks, R., 2010. Florida Springs Initiative MonitoringNetwork Report and Recognized Sources of Nitrate. Florida Department ofEnvironmental Protection.
Herman, E.K., Toran, L., White, W.B., 2009. Quantifying the place of karst aquifers inthe groundwater to surface water continuum: a time series analysis study ofstorm behavior in Pennsylvania water resources. J. Hydrol. 376 (1–2), 307–317.
Johannes, R.E., 1980. The ecological significance of the submarine discharge ofgroundwater. Mar. Ecol. Prog. Ser. 3 (4), 365–373.
Katz, B.G., Coplen, T.B., Bullen, T.D., Davis, J.H., 1997. Use of chemical and isotopictracers to characterize the interactions between ground water and surfacewater in mantled karst. Ground Water 35 (6), 1014–1028.
Kendall, C., McDonnell, J.J., 1999. Isotope Tracers in Catchment Hydrology. ElsevierScience.
Kim, G., Ryu, J.W., Yang, H.S., Yun, S.T., 2005. Submarine groundwater discharge(SGD) into the Yellow Sea revealed by Ra-228 and Ra-226 isotopes: implicationsfor global silicate fluxes. Earth Planet. Sci. Lett. 237 (1–2), 156–166.
Knochenmus, L.A., Yobbi, D.K., 2001. Hydrology of the Coastal Springs Ground-Water Basin and Adjacent Parts of Pasco, Hernando, and Citrus Counties,Florida. U.S. Geological Survey Water-Resources Investigations Report 01-4230.
Koizumi, N., 1993. Frequency-dependence of the groundwater discharge at anartesian well as recognized from tidal fluctuation records. J. Geophys. Res.-SolidEarth 98 (B1), 825–835.
Kotwicki, L., Grzelak, K., Czub, M., Dellwig, O., Gentz, T., Szymczycha, B., Bottcher,M.E., 2014. Submarine groundwater discharge to the Baltic coastal zone:impacts on the meiofaunal community. J. Mar. Syst. 129, 118–126.
Lakey, B., Krothe, N.C., 1996. Stable isotopic variation of storm discharge from aperennial karst spring, Indiana. Water Resour. Res. 32 (3), 721–731.
Lazareva, O., Pichler, T., 2011. Evaluating complex hydrogeological settings in aconstructed Wetland: an isotopic/chemical mass balance approach. Wetlands31 (3), 521–534.
Lerner, D.N., Issar, A., Simmers, I., 1990. Groundwater Recharge: A Guide toUnderstanding and Estimating Natural Recharge. Heinz Heise, Hannover.
Li, L., Barry, D.A., Stagnitti, F., Parlange, J.Y., 1999. Submarine groundwater dischargeand associated chemical input to a coastal sea. Water Resour. Res. 35 (11),3253–3259.
Liu, Z.H., Groves, C., Yuan, D.X., Meiman, J., Jiang, G.H., He, S.Y., Li, Q.A., 2004.Hydrochemical variations during flood pulses in the south-west China peakcluster karst: impacts of CaCO3–H2O–CO2 interactions. Hydrol. Process. 18(13), 2423–2437.
Maramathas, A., Pergialiotis, P., Gialamas, I., 2006. Contribution to the identificationof the sea intrusion mechanism of brackish karst springs. Hydrogeol. J. 14 (5),657–662.
Michael, H.A., Mulligan, A.E., Harvey, C.F., 2005. Seasonal oscillations in waterexchange between aquifers and the coastal ocean. Nature 436 (7054), 1145–1148.
Miller, J.A., 1986. Hydrogeologic Framework of the Floridan Aquifer System inFlorida and in Parts of Georgia, South Carolina, and Alabama. U.S. GeologicalSurvey Report P 1403-B: B1–B91.
Moore, W.S., 1996. Large groundwater inputs to coastal waters revealed by Ra-226enrichments. Nature 380 (6575), 612–614.
Moore, W.S., 1999. The subterranean estuary: a reaction zone of ground water andsea water. Mar. Chem. 65 (1–2), 111–125.
Moore, W.S., 2010. The effect of submarine groundwater discharge on the Ocean.Ann. Rev. Mar. Sci. 2, 59–88.
Ozyurt, N.N., 2008. Analysis of drivers governing temporal salinity and temperaturevariations in groundwater discharge from Altug Submarine Karst Cave (Kas-Turkey). Environ. Geol. 54 (4), 731–736.
Peterman, Z.E., Hedge, C.E., Tourtelot, H.A., 1970. Isotopic composition of strontiumin sea water throughout Phanerozoic time. Geochim. Cosmochim. Acta 34 (1),105–120.
Peterson, R.N., Burnett, W.C., Glenn, C.R., Johnson, A.G., 2009. Quantification ofpoint-source groundwater discharges to the ocean from the shoreline of the BigIsland, Hawaii. Limnol. Oceanogr. 54 (3), 890–904.
Pritchard, D.W., 1967. What is an Estuary: Physical Viewpoint. AmericanAssociation for the Advancement of Science, Washington, D.C..
Quinlan, E.L., Phlips, E.J., Donnelly, K.A., Jett, C.H., Sleszynski, P., Keller, S., 2008.Primary producers and nutrient loading in Silver Springs, FL, USA. Aquat. Bot. 88(3), 247–255.
Ritorto, M., Screaton, E.J., Martin, J.B., Moore, P.J., 2009. Relative importance andchemical effects of diffuse and focused recharge in an eogenetic karst aquifer:an example from the unconfined upper Floridan aquifer, USA. Hydrogeol. J. 17(7), 1687–1698.
Robinson, C., Li, L., Barry, D.A., 2007. Effect of tidal forcing on a subterraneanestuary. Adv. Water Resour. 30 (4), 851–865.
Sacks, L.A., Herman, J.S., Kauffman, S.J., 1995. Controls on high sulfateconcentrations in the Upper Floridan Aquifer in southwest Florida. WaterResour. Res. 31 (10), 2541–2551.
Sacks, L.A., Swancar, A., Lee, T.M., 1998. Estimating Ground-Water Exchange withLakes Using Water-Budget and Chemical Mass-Balance Approaches for TenLakes in Ridge Areas of Polk and Highlands Counties, Florida. U.S. GeologicalSurvey Water-Resources Investigations Report 98-4133.
Santoro, A.E., Francis, C.A., de Sieyes, N.R., Boehm, A.B., 2008. Shifts in the relativeabundance of ammonia-oxidizing bacteria and archaea across physicochemicalgradients in a subterranean estuary. Environ. Microbiol. 10 (4), 1068–1079.
Santos, I.R., Burnett, W.C., Chanton, J., Mwashote, B., Suryaputra, I., Dittmar, T., 2008.Nutrient biogeochemistry in a Gulf of Mexico subterranean estuary andgroundwater-derived fluxes to the coastal ocean. Limnol. Oceanogr. 53 (2),705–718.
Smith, A.M., Cave, R.R., 2012. Influence of fresh water, nutrients and DOC in twosubmarine-groundwater-fed estuaries on the west of Ireland. Sci. Total Environ.438, 260–270.
Sprinkle, C.L., 1989. Geochemistry of the Floridan Aquifer System in Florida and inParts of Georgia, South Carolina, and Alabama. U.S. Geological SurveyProfessional Paper 1403-I.
Swarzenski, P.W., Reich, C.D., Spechler, R.M., Kindinger, J.L., Moore, W.S., 2001.Using multiple geochemical tracers to characterize the hydrogeology of thesubmarine spring off Crescent Beach, Florida. Chem. Geol. 179 (1–4), 187–202.
Szymczycha, B., Vogler, S., Pempkowiak, J., 2012. Nutrient fluxes via submarinegroundwater discharge to the Bay of Puck, southern Baltic Sea. Sci. TotalEnviron. 438, 86–93.
Valle-Levinson, A., Marino-Tapia, I., Enriquez, C., Waterhouse, A.F., 2011. Tidalvariability of salinity and velocity fields related to intense point-source

D.M. Menning et al. / Journal of Hydrology 527 (2015) 718–733 733
submarine groundwater discharges into the coastal ocean. Limnol. Oceanogr. 56(4), 1213–1224.
van Hengstum, P.J., Scott, D.B., 2011. Ecology of Foraminifera and habitat variabilityin an underwater cave: distinguishing anchialine versus submarine caveenvironments. J. Foramin. Res. 41 (3), 201–229.
Veizer, J., Ala, D., Azmy, K., Bruckschen, P., Buhl, D., Bruhn, F., Carden, G.A.F., Diener,A., Ebneth, S., Godderis, Y., Jasper, T., Korte, C., Pawellek, F., Podlaha, O.G.,Strauss, H., 1999. Sr-87/Sr-86, delta C-13 and delta O-18 evolution ofPhanerozoic seawater. Chem. Geol. 161 (1–3), 59–88.
Vera, I., Marino-Tapia, I., Enriquez, C., 2012. Effects of drought and subtidal sea-levelvariability on salt intrusion in a coastal karst aquifer. Mar. Freshw. Res. 63 (6),485–493.
Wetland-Solutions-Inc., 2007. Human Use and Ecological Evaluation of theRecommended Minimum Flow Regime for Blue Spring and Blue Spring Run,Volusia County, Florida. St. Johns River Water Management District SpecialPublication SJ2007-SP19: 92pp.
Copyright © 2022 FDOKUMEN