effectiveness of streamlined physical distribution to
68
EFFECTIVENESS OF STREAMLINED PHYSICAL DISTRIBUTION TO DISTRIBUTOR SMALL AND MEDIUM-SIZED ENTERPRISES IN KERICHO COUNTY, KENYA BY ELMELDAH AKINYI OBIERO A RESEARCH PROJECT SUBMITTED IN PARTIAL FULFILLMENT OF THE REQUIREMENTS FOR THE DEGREE OF MASTER IN BUSINESS ADMINISTRATION SCHOOL OF BUSINESS AND ECONOMICS MASENO UNIVERSITY © 2017
-
Upload
khangminh22 -
Category
Documents
-
view
4 -
download
0
Transcript of effectiveness of streamlined physical distribution to
EFFECTIVENESS OF STREAMLINED PHYSICAL DISTRIBUTION TO DISTRIBUTOR SMALL AND MEDIUM-SIZED ENTERPRISES IN KERICHO
COUNTY, KENYA
BY
ELMELDAH AKINYI OBIERO
A RESEARCH PROJECT SUBMITTED IN PARTIAL FULFILLMENT OF THE REQUIREMENTS FOR THE DEGREE OF MASTER IN BUSINESS
ADMINISTRATION
SCHOOL OF BUSINESS AND ECONOMICS
MASENO UNIVERSITY
© 2017

ii
DECLARATION
I declare that this research report has not been presented anywhere for any award and that all sources of information have been acknowledged by means of references. Elmeldah Akinyi Obiero Signature: …………………… Date: ……………. MBA/BE/00008/2014 SUPERVISOR This research report has been submitted for examination with my approval as the University supervisor. Dr. Charles Ondoro, PhD Signature: …………………… Date: ……………. Department Of Business Administration, Maseno University

iii
ACKNOWLEGEMENTS First and foremost, am deeply grateful to Jehovah God for his undeserved kindness throughout the period of my studies through to this project. For me, His love and guidance have remained greater than anything else and I will always honor Him. The entire period of study at Maseno University has so far been unforgettable. I am truly grateful to the entire lecturing fraternity in the school of business and economics. My deepest gratitude however is to my supervisor Dr. Charles Ondoro, who has not only painstakingly guided me throughout this research, but whose prowess on the subject, constructive suggestions, positive criticisms, patience and guidance proved to be limitless and without whom completion of aim would only remain a mere dream. I am truly grateful for the love and support of my babies Hannisah, Amanda and Hydd-Loyal. I appreciate too in a special way their father Mr Ibrahim, who urged me on at the conception of this dream, his strong words of encouragements, prayers and thoughts saw me actualize this dream. They have proved beyond doubt that there is no bond stronger than true compassion and the inspiration it brings along is unfailing. I will forever be proud of them all. May Jehovah richly bless all of them for me, may He keep them and my love for them all will only keep growing by the day. I have no doubt about the well wishes of my dear mum, Janet Grace, as well as my siblings. May our God Jehovah forever remain real to all of my extended family members including my nephews James, Adrian, Andy and Hayden and my nieces Tamara, Romana and Penelope. Last but not least, the memory of my late dad, James Kenneth, has always kept me going. He was very passionate about education hence, he inculcated in us the values of hard work and determination, and these have spread their roots so deep and helped me push this work to its conclusion. I surely look forward to meeting him again on resurrection, when I know with open arms he will embrace me with pride.

iv
DEDICATION With special love to my adorable children; Hannisah Lindsay Ibrahim, Amanda Blessing Ibrahim and Hydd-Loyal Emmanuel Ibrahim whose love, thoughts and supports have bolstered me through this journey.

v
ABSTRACT Distributor SMEs provide employment, jobs and support economies. They represent the interest of exporters in their specified territories for agreed range of products. However, a 2016 survey indicated that in 2015 and 2016, distributor SMEs had anticipated growth of 58% and 70% respectively. Yet, 11% was the reported growth totally in line with the plans in 2015. Further, a 2013 report by the ministry of industry and commerce in Kericho County indicated that the distributor SMEs in the county have to contend with issues of changing relationships, employee retention and customer expectations. An attempt to solve this problem focused on enforcing legislation on local content for public projects, establishing ‘buy Kenya, build Kenya’ policies in public procurement, research and development support and increased contributions to funds such as Uwezo. The problem continues to exist. There are no efforts directed towards investigating the issue of streamlining physical distribution for these SMEs with a direct bearing on their viability, competitive advantage and growth. Empirical literature has failed to address the issue of streamlined physical distribution in this context. Therefore, no empirical information is available on extent of adoption of streamlined physical distribution, factors contributing to effectiveness of streamlined physical distribution and challenges to streamlining physical distribution among distributor SMEs in Kenya and Kericho County. The study thus sought to establish the contribution of streamlined physical distribution among distributor SMEs in Kericho County, Kenya. Specifically, the study sought to determine the extent of adoption of streamlined physical distribution, factors affecting effectiveness of streamlined physical distribution and challenges to streamlining physical distribution among the distributor SMEs. The study was guided by systems approach theory. The study adopted descriptive cross sectional survey design and targeted 48 owner managers of distributor SMEs although only 42 responded to the questionnaires. Census sampling was applied. Primary data was used and the data was collected by means of structured questionnaire. Construct validity and test-retest reliability was employed to determine the validity and reliability of the questionnaire. Descriptive statistics like frequencies, mean and standard deviation were used to analyze the three objectives of the study. The findings were presented in tables. The study revealed that streamlined physical distribution had been adopted by distributor SMEs majorly on order processing (71.4%) by setting deadlines for order processing completion. Physical distribution has least been streamlined on stock management (54.8%) as these distributors least understand their safe inventory levels (35.3%). Further, the study revealed that the greatest challenges these distributor SMEs face while streamlining their physical distribution are political interference (85.7%) followed by unreliable market conditions (78.6%) then unfair regulations and high taxes (76.2%). The study thus concluded that distributor SMEs have adopted strategies that streamline their physical distribution mainly on faster order processing. They need to improve on transportation, distribution planning, customer service and inventory management too for sustainability, growth and competitive advantages. These results may be used by policy makers dealing with distributor SMEs and researchers who may wish to further their research based on this study.

vi
TABLE OF CONTENT
TITLE PAGE ----------------------------------------------------------------------------------------i
DECLARATION-------------------------------------------------------------------------------------ii
ACKNOWLEDGEMENTS------------------------------------------------------------------------iii
DEDICATION---------------------------------------------------------------------------------------iv
ABSTRACT------------------------------------------------------------------------------------------v
TABLE OF CONTENT----------------------------------------------------------------------------vi
LIST OF TABLES---------------------------------------------------------------------------------viii
LIST OF FIGURES --------------------------------------------------------------------------------ix
LIST OF ABBREVIATIONS---------------------------------------------------------------------x
OPERATIONAL DEFINITION OF TERMS--------------------------------------------------xi
CHAPTER ONE: INTRODUCTION----------------------------------------------------------1
1.1 Background of the Study-----------------------------------------------------------------------1
1.1.1 Distributor Small and Medium-sized Enterprises------------------------------------3
1.2 Statement of the Problem-----------------------------------------------------------------------4
1.3Objectives -----------------------------------------------------------------------------------------5
1.4Research Questions-------------------------------------------------------------------------------5
1.5Scope of the Study--------------------------------------------------------------------------------6
1.6Justification for the Study-----------------------------------------------------------------------6
1.7Conceptual Framework--------------------------------------------------------------------------7
CHAPTER TWO: LITERATURE REVIEW------------------------------------------------8
2.1 Theory of the Study-----------------------------------------------------------------------------8
2.1.1 Systems Approach Theory -------------------------------------------------------------8
2.2 Concept of Physical Distribution--------------------------------------------------------------8
2.2.1 Extent of Adoption of Streamlined Physical Distribution among Distributor
SMEs--------------------------------------------------------------------------------------------10
2.2.2 Factors Contributing to Effectiveness of Streamlined Physical Distribution
among Distributor SMEs---------------------------------------------------------------------14
2.2.3 Challenges to Streamlining Physical Distribution for Distributor SMEs-------20
CHAPTER THREE: RESEARCH METHODOLOGY-----------------------------------26
3.1 Research Design-------------------------------------------------------------------------------26
3.2 Study Area--------------------------------------------------------------------------------------26

vii
3.3 Target Population------------------------------------------------------------------------------27
3.4 Sample Size and Sampling Method----------------------------------------------------------27
3.5 Data Collection---------------------------------------------------------------------------------27
3.5.1 Data Type and Source-----------------------------------------------------------------27
3.5.2 Data Collection Instrument-----------------------------------------------------------27
3.5.3 Instrument Validation and Reliability Test-----------------------------------------27
3.6 Data Analysis and Presentation--------------------------------------------------------------28
CHAPTER FOUR: RESULTS AND DISCUSSIONS-------------------------------------29
4.1 Response Rate----------------------------------------------------------------------------------29
4.2 General Information on Distributor SMEs--------------------------------------------------29
4.2.1 Respondents size of business------------------------------------------------------29
4.2.2 Respondents age of business since inception------------------------------------30
4.2.3 Respondents category of distributorship-----------------------------------------30
4.3 Extent of Adoption of Streamlined Physical Distribution amongst Distributor
SMEs---------------------------------------------------------------------------------------31
4.4 Factors Contributing to Effectiveness of Streamlined Physical Distribution
among Distributor SMEs------------------------------------------------------------------34
4.5 Challenges to Streamlining Physical Distribution among Distributor SMEs----------42
CHAPTER FIVE: SUMMARY, CONCLUSIONS AND RECOMMENDATIONS47
5.1 Summary of Findings-------------------------------------------------------------------------47
5.2 Conclusions-------------------------------------------------------------------------------------48
5.3 Recommendations-----------------------------------------------------------------------------49
5.4 Limitations of the Study----------------------------------------------------------------------49
5.5 Suggestions for Further Research-----------------------------------------------------------50
REFERENCES------------------------------------------------------------------------------------51
LIST OF APPENDICES
Appendix I: WORK SCHEDULE-------------------------------------------------------------56
Appendix II: BUDGET--------------------------------------------------------------------------57
viii
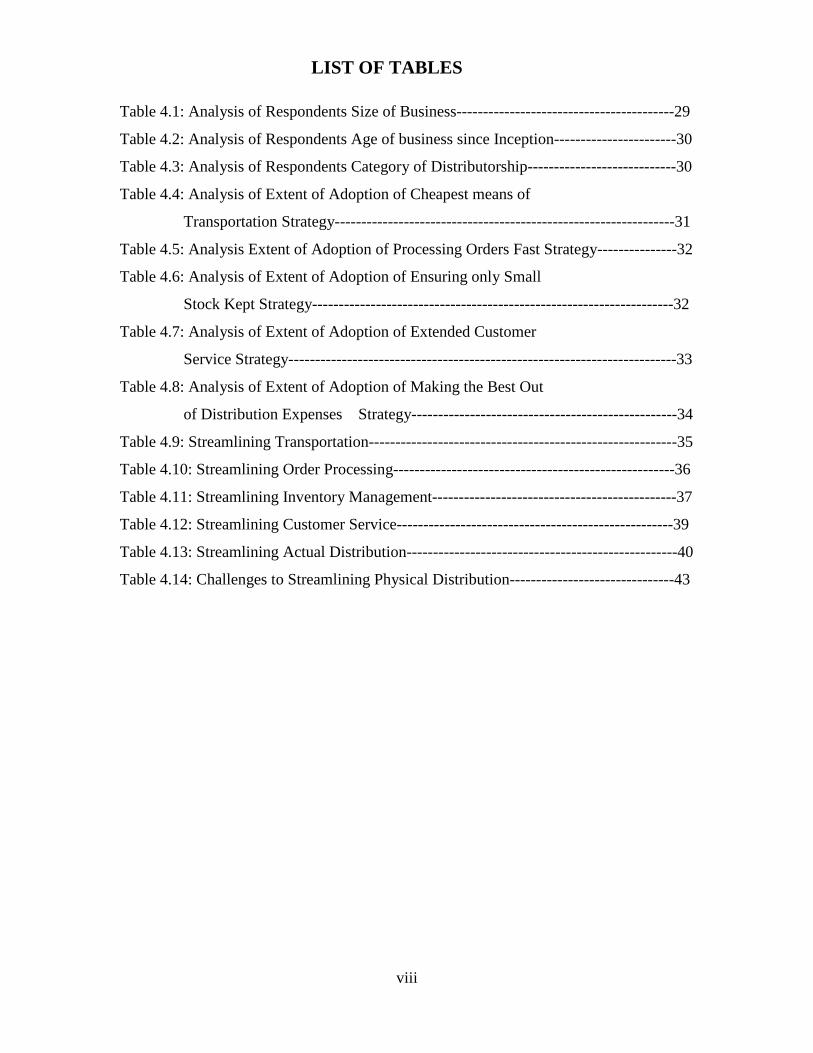
LIST OF TABLES Table 4.1: Analysis of Respondents Size of Business-----------------------------------------29
Table 4.2: Analysis of Respondents Age of business since Inception-----------------------30
Table 4.3: Analysis of Respondents Category of Distributorship----------------------------30
Table 4.4: Analysis of Extent of Adoption of Cheapest means of
Transportation Strategy----------------------------------------------------------------31
Table 4.5: Analysis Extent of Adoption of Processing Orders Fast Strategy---------------32
Table 4.6: Analysis of Extent of Adoption of Ensuring only Small
Stock Kept Strategy--------------------------------------------------------------------32
Table 4.7: Analysis of Extent of Adoption of Extended Customer
Service Strategy-------------------------------------------------------------------------33
Table 4.8: Analysis of Extent of Adoption of Making the Best Out
of Distribution Expenses Strategy--------------------------------------------------34
Table 4.9: Streamlining Transportation----------------------------------------------------------35
Table 4.10: Streamlining Order Processing-----------------------------------------------------36
Table 4.11: Streamlining Inventory Management----------------------------------------------37
Table 4.12: Streamlining Customer Service----------------------------------------------------39
Table 4.13: Streamlining Actual Distribution---------------------------------------------------40
Table 4.14: Challenges to Streamlining Physical Distribution-------------------------------43

ix
LIST OF FIGURES Figure 1.1 – conceptual framework----------------------------------------------------------------7

x
LIST OF ABBREVIATIONS SMEs – Small and Medium-sized Enterprises
MSE - Micro and Small Enterprises
ICT – Information and Communications Technology
MSEA – Micro and Small Enterprises Authority
IT – Information Technology
SCM – Supply Chain Management

xi
OPERATIONAL DEFINITION OF TERMS Effectiveness – The degree to which objectives are achieved and the extent to which
targeted problems are solved within distributor SMEs as a result of streamlined physical
distribution
Physical Distribution – activities used to move products from producers to consumers
and other end users before they are consumed
Streamlined – Designed in a way that presents very little resistance to flow, increasing
speed and ease of movement
Distributor – An agent who supplies goods to stores and other businesses that sell to
consumers
Small and Medium-sized Enterprise – an enterprise as a business with sales of between
500,000 and 1 million shillings a year with 10 to 50 people working in it

1
CHAPTER ONE
INTRODUCTION This chapter provides background of the study, statement of the problem, objectives of the study,
the research questions that the study attempted to answer, justification of the study and a
conceptual framework. The section also highlights the context of the study which is distributor
SMEs in Kericho County, Kenya.
1.1 Background of the Study Today’s business environment is competitive and this has resulted in increased pressure in
virtually all industries. To be able to compete, companies must thus fill customer orders
accurately, quickly and efficiently (Yang, 2013). Whereas, physical distribution has been
acknowledged as an important component of channel management, relatively little attention has
been paid to streamlining its functions in channel research within marketing literature. The
general subject has received more emphasis in other literatures, such as operations management,
logistics, transportation, purchasing and IT, with a general focus on how product orders can be
efficiently and effectively processed and then delivered to channel members and end-customers.
While it can be said that the lack of attention to streamlining physical distribution in channel
research in marketing is unfortunate, physical distribution functions will impact both channel
organizations and the manner in which channel relationships are coordinated over time (Frazier,
2009).
Physical distribution is one of the unique functions of marketing (Bose, 2012). Once the function
of exchange is completed, the physical distribution function is responsible for completing the
marketing transaction. It involves handling and moving raw materials and finished goods from
the producer to the final consumer. Streamlining physical distribution involves designing and
administering systems to control the flow of goods. Its function is to accomplish the delivery of
goods at the right place, at the right time and in the right quantity. It is relevant to marketing
agencies such as dealers, merchants and mercantile agents.
The objectives of physical distribution can be defined as providing superior customer service,
optimizing total distribution costs, minimizing finished goods inventories in the supply channel,
2
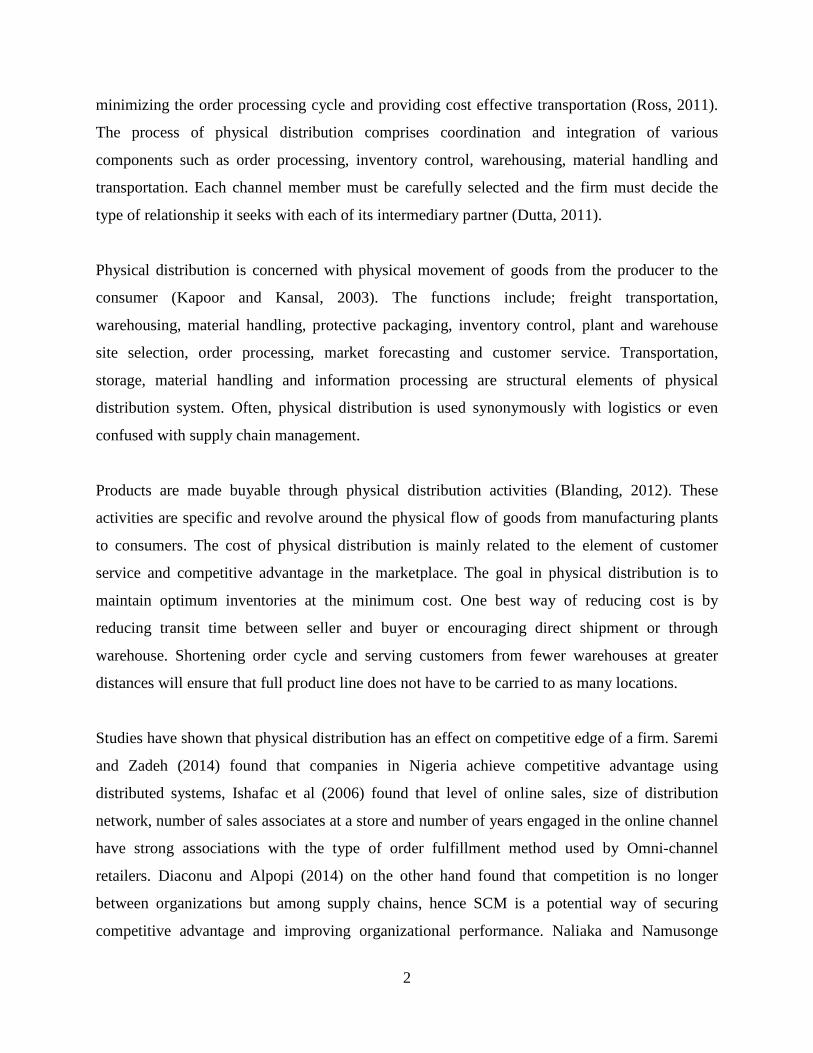
minimizing the order processing cycle and providing cost effective transportation (Ross, 2011).
The process of physical distribution comprises coordination and integration of various
components such as order processing, inventory control, warehousing, material handling and
transportation. Each channel member must be carefully selected and the firm must decide the
type of relationship it seeks with each of its intermediary partner (Dutta, 2011).
Physical distribution is concerned with physical movement of goods from the producer to the
consumer (Kapoor and Kansal, 2003). The functions include; freight transportation,
warehousing, material handling, protective packaging, inventory control, plant and warehouse
site selection, order processing, market forecasting and customer service. Transportation,
storage, material handling and information processing are structural elements of physical
distribution system. Often, physical distribution is used synonymously with logistics or even
confused with supply chain management.
Products are made buyable through physical distribution activities (Blanding, 2012). These
activities are specific and revolve around the physical flow of goods from manufacturing plants
to consumers. The cost of physical distribution is mainly related to the element of customer
service and competitive advantage in the marketplace. The goal in physical distribution is to
maintain optimum inventories at the minimum cost. One best way of reducing cost is by
reducing transit time between seller and buyer or encouraging direct shipment or through
warehouse. Shortening order cycle and serving customers from fewer warehouses at greater
distances will ensure that full product line does not have to be carried to as many locations.
Studies have shown that physical distribution has an effect on competitive edge of a firm. Saremi
and Zadeh (2014) found that companies in Nigeria achieve competitive advantage using
distributed systems, Ishafac et al (2006) found that level of online sales, size of distribution
network, number of sales associates at a store and number of years engaged in the online channel
have strong associations with the type of order fulfillment method used by Omni-channel
retailers. Diaconu and Alpopi (2014) on the other hand found that competition is no longer
between organizations but among supply chains, hence SCM is a potential way of securing
competitive advantage and improving organizational performance. Naliaka and Namusonge

3
(2015) too agreed that information technology, inventory control systems, inventory lead time
and inventory control practices are important factors for competitive advantage of manufacturing
firms in Kenya. Even though Mbondo, Okibo and Mogwambo (2015) found that a strong and
positive correlation exists between distribution strategies and performance of service firms in
Kenya, Maghanga (2011) concluded that the drive towards use of logistics outsourcing is mainly
cost reduction, pursuit of core business activities, risk reduction and gaining competitive edge.
Previous researches on factors contributing to effectiveness of physical distribution are not
specific on when the activities have been streamlined. Urbanska (2010) looked at the role of the
broader subject, distribution, in creation of competitive advantage for companies in SME sector.
Hajdarpasic (2013) studied management of physical distribution of foods on the market. Mogere,
Oloko and Okibo (2013) studied effect of inventory control systems on operational performance
of tea processing firms. Kariithi (2016) on the other hand examined effects of SCM strategies on
competitive advantage in food and beverage processing companies. Karimi and Namusonge
(2014) studied the role of IT on warehouse management while Bwari, Getuno and Kiarie (2016)
studied effects of third party logistics on supply chain performance.
The studies on challenges facing physical distribution have not been specific on distributor
SMEs. Barua (2010) studied challenges facing SCM in oil marketing companies, Maghanga
(2011) explored the challenges tea processing firms in Kericho face on logistics outsourcing and
Musundi and Ogollah (2014) studied challenges facing business linkages between SMEs and
mobile telephone companies. Lyimo (2014) attempted a study on distributor SMEs in Arusha,
Tanzania, but the focus was on the challenges and prospects they face while accessing credit
facilities.
1.1.1 Distributor Small and Medium-sized Enterprises
Distributor SMEs are agents, wholesalers, distribution centers or local importers who buy goods
outright from the exporter and then sell them to the customers at a profit. The distributors
represent the interest of the exporter in a specified territory or region for an agreed range of
products. There are relatively no credit risks for the exporter in such cases. The distributor holds
stock, looks after local publicity and sales promotion. They also provide after sales service where
4
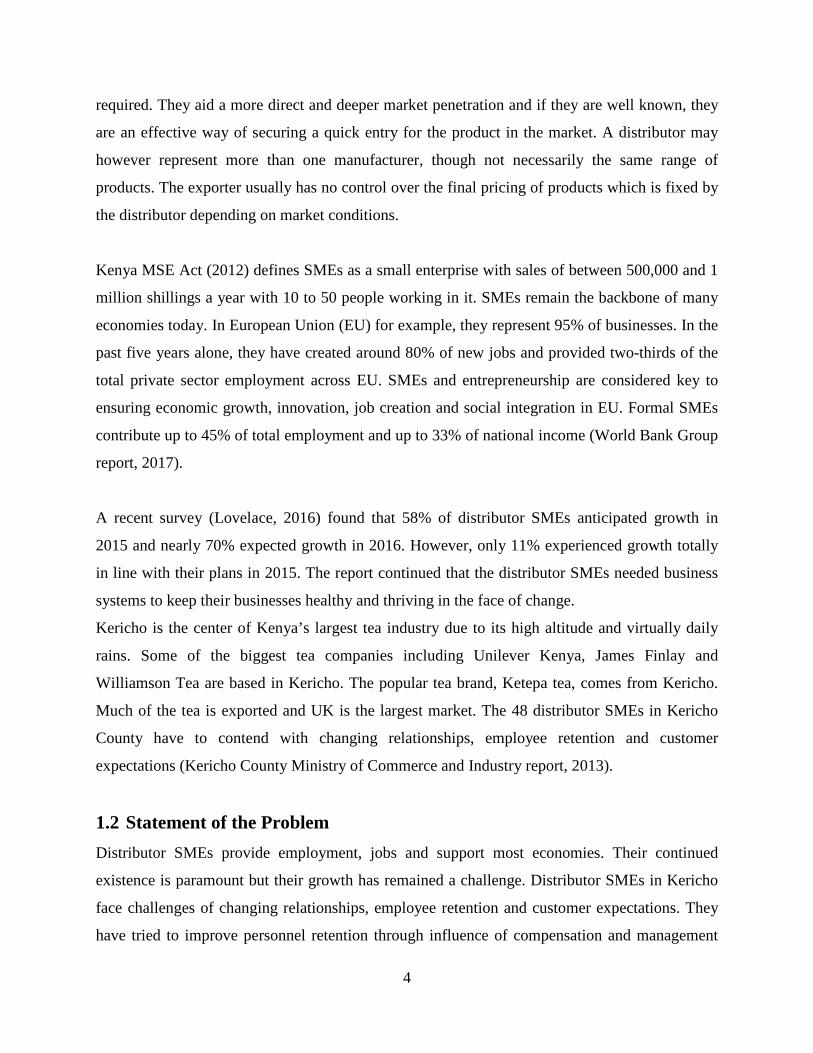
required. They aid a more direct and deeper market penetration and if they are well known, they
are an effective way of securing a quick entry for the product in the market. A distributor may
however represent more than one manufacturer, though not necessarily the same range of
products. The exporter usually has no control over the final pricing of products which is fixed by
the distributor depending on market conditions.
Kenya MSE Act (2012) defines SMEs as a small enterprise with sales of between 500,000 and 1
million shillings a year with 10 to 50 people working in it. SMEs remain the backbone of many
economies today. In European Union (EU) for example, they represent 95% of businesses. In the
past five years alone, they have created around 80% of new jobs and provided two-thirds of the
total private sector employment across EU. SMEs and entrepreneurship are considered key to
ensuring economic growth, innovation, job creation and social integration in EU. Formal SMEs
contribute up to 45% of total employment and up to 33% of national income (World Bank Group
report, 2017).
A recent survey (Lovelace, 2016) found that 58% of distributor SMEs anticipated growth in
2015 and nearly 70% expected growth in 2016. However, only 11% experienced growth totally
in line with their plans in 2015. The report continued that the distributor SMEs needed business
systems to keep their businesses healthy and thriving in the face of change.
Kericho is the center of Kenya’s largest tea industry due to its high altitude and virtually daily
rains. Some of the biggest tea companies including Unilever Kenya, James Finlay and
Williamson Tea are based in Kericho. The popular tea brand, Ketepa tea, comes from Kericho.
Much of the tea is exported and UK is the largest market. The 48 distributor SMEs in Kericho
County have to contend with changing relationships, employee retention and customer
expectations (Kericho County Ministry of Commerce and Industry report, 2013).
1.2 Statement of the Problem Distributor SMEs provide employment, jobs and support most economies. Their continued
existence is paramount but their growth has remained a challenge. Distributor SMEs in Kericho
face challenges of changing relationships, employee retention and customer expectations. They
have tried to improve personnel retention through influence of compensation and management

5
styles but still they lose experienced and well trained workforce. Some of them have
implemented ERP solution to manage their processes in a coordinated manner yet the high levels
of process automation still change the relationships between them and their customers.
Customers still expect everything faster, cheaper and better regardless of the efforts the
distributors have put in. Studies on this subject have concentrated on the general subject of
physical distribution, the activities and functions but not on the streamlining the process of
physical distribution. Previous researches on factors contributing to effectiveness of physical
distribution are not specific on when the activities have been streamlined. The studies on
challenges facing streamlined physical distribution have not been specific on distributor SMEs.
1.3 Objectives The purpose of this study was to assess the effectiveness of streamlined physical distribution to
distributor SMEs in Kericho County.
The study was guided by the following specific objectives;
i. To determine the extent of adoption of streamlined physical distribution among distributor
SMEs in Kericho County
ii. To establish the factors contributing to effectiveness of streamlined physical distribution
among distributor SMEs in Kericho County
iii. To evaluate the challenges to streamlining physical distribution among distributor SMEs in
Kericho County
1.4 Research Questions i. What is the extent of adoption of streamlined physical distribution among distributor SMEs
in Kericho County?
ii. What factors contribute to effectiveness of streamlined physical distribution among
distributor SMEs in Kericho County?
iii. What are the challenges to streamlining physical distribution for distributor SMEs in
Kericho County?

6
1.5 Scope of the study The study covered distributor SMEs in Kericho County. Kericho County is bounded on the north
by Nandi and Kisumu counties, on the east by Nakuru and Baringo counties and on the south by
Bomet County. It occupies an area of 2,454.5 km2. It has 15% of its population residing in four
urban centers while the rest 85% reside in 344 rural localities (KNBS Census Report, 2009). The
county headquarter is Kericho town, which is also the largest town. The county urbanization rate
stands at 28.3% with electricity access rate of 11.8%. However, the county has 58.5% good roads
although only 13.8% are paved. The county poverty rate stands at 44.2% (USAID report, 2011).
The study focused on the three areas as articulated in the objectives. It was cross sectional;
concerned with responses at a point in time.
1.6 Justification for the Study The study provides an opportunity for distributor SMEs across Kericho County to assess their
physical distribution efforts. It is expected that the findings of this study are beneficial to policy
makers within and without the county government directly dealing with SMEs. They would thus
base their arguments for or against streamlined physical distribution contribution based on the
study findings. The national government through MSEA as well, should be able to direct the
regulation and policy for SMEs based on study outcome. Researchers also benefit from the study
by applying the resulting knowledge and they may also use it as a basis for additional research.

7
1.7 Conceptual Framework
Independent Variable Intervening variable Dependent Variable
Figure 1.1: contribution of adoption of streamlined physical distribution to physical distribution
effectiveness
Source: Adapted from Stichweh (2011)
In the conceptual framework, figure 1.1, adoption of streamlined physical distribution indicated
by coordination of various components of physical distribution, careful selection of channel
members and decision on type of relationship to seek with intermediary partners, is expected to
contribute to physical distribution effectiveness by degree of superior customer service, level of
optimized total distribution costs, level of minimal finished goods inventory and extent of
minimum order processing cycle. It is also observed that the relationship is influenced by other
variables such as customer service management system, order processing system and inventory
control system.
Adoption of Streamlined Physical Distribution
- Coordination of various
components of physical distribution
- Careful selection of channel members
- Decision on type of
relationship to seek with intermediary partner
Physical Distribution
Effectiveness • Superior customer
service • Optimized total
distribution costs • Minimal finished goods
inventory • Minimum order
processing cycle
• Customer service management system
• Order processing system • Inventory control system

8
CHAPTER TWO
LITERATURE REVIEW The chapter highlights the theoretical foundations on which the study was built. It then explores
works of other scholars in form of comparative empirical literature on the concept of physical
distribution, hence helps to explain the gaps that the study sought to address.
2.1 Theory of the Study 2.1.1 Systems Approach Theory
The theory was first proposed under the name ‘general system theory’ by biologist Ludwig von
Bertalanffy (1968). He noted that all systems studied by physicists are closed and do not interact
with the outside world. Yet, systems can either be closed or open. He observed that mutual
interactions of component systems in a way glue the components together into a whole. If the
parts do not interact, the whole would not be more than the sum of its components. But because
they interact, something is added. The parts are thus seen as subsystems in respect to the whole,
and the whole is seen as a subsystem in respect to the parts. The theory anchors on the
assumption that there are universal principles of organization, which hold for all systems.
The theory remains one of the most prominent theories in management today. It treats
organization as a system. It was thus concluded that the systems approach theory best formed the
foundation of the study. It helped in breaking the elements of physical distribution making the
subsystems of the whole being physical distribution. The study focused on when the subsystems
are streamlined, in this context, something is added; the interactions of the subsystems; then we
were interested in learning the outcome.
2.2 Concept of Physical Distribution Physical distribution is one of the unique functions of marketing (Bose, 2012). Once the function
of exchange is completed, the physical distribution function is responsible for completing the
marketing transaction. It involves handling and moving raw materials and finished goods from
the producer to the final consumer. Physical distribution management on the other hand refers to
the process of designing and administering systems to control the flow of goods. Its function is to

9
accomplish the delivery of goods at the right place, at the right time and in the right quantity. It is
relevant to marketing agencies such as dealers, merchants and mercantile agents.
Kapoor and Kansal (2003) established that physical distribution is concerned with physical
movement of goods from the producer to the consumer. It entails typical ancillary functions of
physical distribution which include freight transportation, warehousing, material handling,
protective packaging, inventory control, plant and warehouse site selection, order processing,
market forecasting and customer service. They add that the structural elements of physical
distribution system are transportation, storage, material handling and information processing.
Sometimes physical distribution is used synonymously with logistics or even confused with
supply chain management but these are not considered as different terms.
Blanding (2012) argues that physical distribution activities make products buyable. They are
specific activities related to the physical flow of goods from manufacturing plants to consumers.
The cost of physical distribution is mainly related to the element of customer service and
competitive advantage in the marketplace. For instance, transportation, maintaining product
availability in retail outlets, keeping full inventories strategically spotted in warehouses, making
goods available in units convenient to the customer like cartons, barrels or bulk. He adds that the
goal in physical distribution is to maintain optimum inventories at the minimum cost. He
recommends one best way of reducing cost is by reducing transit time between seller and buyer
or encouraging direct shipment or through warehouse. At the same time, shortening order cycle
and serving customers from fewer warehouses at greater distances will ensure that full product
line does not have to be carried to as many locations.
According to Ross (2011), objectives of physical distribution can be defined as providing
superior customer service, optimizing total distribution costs, minimizing finished goods
inventories in the supply channel, minimizing the order processing cycle and providing cost
effective transportation. The process of physical distribution comprises coordination and
integration of various components such as order processing, inventory control, warehousing,
material handling and transportation. These elements have interrelations and interact with one
another (Bose, 2012). Thus, there are many decisions that must be taken when a firm organizes a

10
channel of intermediaries to streamline the movement of goods from producer to consumer. Each
channel member must be carefully selected and the firm must decide the type of relationship it
seeks with each of its intermediary partner (Dutta, 2011).
Physical distribution has been acknowledged as an important component of channel
management. Howbeit, relatively little attention has been paid to streamlining physical
distribution functions in channel research within marketing literature. The general subject has
received more emphasis in other literatures, such as operations management, logistics,
transportation, purchasing and IT, with a general focus on how product orders can be efficiently
and effectively processed and then delivered to channel members and end-customers. The lack of
attention to streamlining physical distribution in channel research in marketing is unfortunate.
Even so, physical distribution functions will impact both channel organizations and the manner
in which channel relationships are coordinated over time (Frazier, 2009).
2.2.1 Extent of Adoption of Streamlined Physical Distribution among Distributor SMEs
According to Bose (2012), streamlined physical distribution activities are being given unique
importance in the process of marketing, in the modern business world. It can offer a feasible
solution by striking an optimum balance between physical distribution costs and the customer
service level. He cites seven reasons that would push a business firm to streamline its physical
distribution. They include minimization of distribution costs, better customer service experience,
increase in sales volume, stabilization of prices, effective product planning, size of inventory and
effect on channel of distribution. Streamlining physical distribution is now recognized as a
critical area of overall supply chain management. In fact, there is little point in making large
savings in the cost of distribution if in the long run sales are lost to poor customer dissatisfaction.
Companies with right goods in the right place at the right time and in the right quantity with the
right support services are able to sell more than competitors that do not. Even when demand for
products is unpredictable, suppliers must be able to respond quickly to inventory needs.
Technology has transformed physical distribution so that it is possible to make just-in-time
delivery, precise inventory visibility and instant shipment tracking capabilities. In effect, these

11
help companies to reduce costs, generate revenues and even avoid expensive mistakes.
Marketing channel members are thus able to see precisely where an item is within the supply
chain at any time (Pride and Ferrell, 2008).
Physical distribution thus has sub-functions such as order processing, warehousing, finished
goods management, materials handling and packaging, shipping and transportation. Order
processing is about timely, accurate and efficient processing of customer orders into the firm. It
has three interrelated processes namely; order entry, inventory allocation and picking and order
confirmation and shipping. Warehousing ensures there is inventory available for customer sale at
the least possible cost.
Ross (2011) clarifies that streamlining finished good involves determining the proper amount of
stock to carry in the supply channel to satisfy customer requirements without stock-out while
minimizing inventory carrying cost. Materials handling and packaging entails activities like
containerization, vehicle loading, hazardous product handling and packaging. Shipping on the
other hand consists of customer order packing, vehicle loading, order confirmation and shipment
documentation. Transportation provides continuous flow of product through supply channel,
optimizing vehicle capacities and loading equipment during shipment, providing speedy and
timely delivery and minimizing shipment damage and theft.
Dutta (2011) argues that applying business logistical techniques to physical distribution
optimizes cost and customer satisfaction. Similarly, it does not make economic sense to provide
a level of service that is not required by the customer but leads to erosion of profits. This is the
dilemma that physical distribution managers are faced with.
Alexandersson and Fridolf (2015) studied the process of distributor selection among SMEs.
Theirs was a multiple case study in the health sector in Sweden. They looked at four Swedish
SMEs with an ambition to increase the knowledge of the decision making in this process. Their
findings suggested that the distributor selection is a vital decision in the international expansion
among SMEs. They also discovered that managerial experience, partnership dependency,

12
resources and maturity level are some of the factor that influences distributor selection process
among the SMEs they studied.
Odondi (2001) investigated physical distribution and sales performance. She took a case study on
dairy processing firms in Nairobi. The study objectives were to identify physical distribution
strategies employed by the dairy processing firms and to find out if there is relationship between
physical distribution strategies and the firms’ sales and market share performance. The study
focused on functions of physical distribution such as order processing, storage and warehousing,
inventory decision making and transportation. The study found that dairy processors use similar
physical distribution strategies and that the strategies affect sales and market share performance.
Saremi and Zadeh (2014) studied management of distribution channels. They realized that
decisions about the structure of distribution channel are important in at least two dimensions: the
decision has a direct effect on other marketing strategic planning decisions and the decisions
require long-term commitment. They alluded that managers today have to deal with physical
distribution and its management as well as the cost and interaction between analysis, planning
and control of service levels. They concluded that companies achieve competitive advantages
using distributed systems.
A study by Okoro (2012) analyzed the contribution of physical distribution cost to price in
marketing in Nigeria. The findings revealed that physical distribution function performed by
marketing organizations contribute significantly to firms overall cost in Nigeria. Further, it found
that environmental factors do contribute significantly to physical distribution cost of marketing
by manufacturing firms. The study also showed that inventory management has an impact on
physical distribution of manufacturing firms.
Ishfaq, Defee, Gibson and Raja (2006) found that retailers are developing a consistent Omni-
channel physical distribution process in which stores undertake a bigger role in order fulfillment
and delivery. Level of online sales, size of distribution network, number of sales associates at a
store and number of years engaged in the online channel are identified as having strong
associations with the type of order fulfillment method used by the Omni-channel retailers. The

13
study was on realignment of the physical distribution process in Omni-channel fulfillment. It also
found that retailers are focused on integrating their store and distribution channel inventories and
have the benefit of scale with a large store network.
Diaconu and Alpopi (2014) analyzed the strengths and weaknesses of current supply chain
management and initiatives for the future. They argued that SCM is the potential way of securing
competitive advantage and improving organizational performance. They mentioned that
competition is no longer between organizations but among supply chains. The study aimed at
identifying strengths and weaknesses of current SCM at different levels. They made suggestions
as to what parts should be focused on for the future so as to reach the desired performance of
SCM.
Mbondo, Okibo and Mogwambo (2015) examined the influence of physical distribution
strategies on the performance of service firms in Kenya. The survey was on print media
distribution in South Nyanza region in Kenya. The study on 53 respondents aimed at assessing
the influence of distribution strategies on performance of service firms in Kenya. It argued that
the current physical distribution efforts and sales results in the print media industry are
unsatisfactory. Study found that customer service strategy and transport logistics strategy are the
major physical distribution strategies adopted. It also found that a strong and positive correlation
existed between physical distribution strategies and performance of the industry.
Naliaka and Namusonge (2015) conducted a case study among 289 employees of Unga Group
limited. The study aimed at investigating the role of inventory management on competitive
advantage among manufacturing firms in Kenya. Using descriptive research design, they
assessed the extent to which information technology is used in inventory management,
determined how inventory lead time, inventory control and inventory control practices affect
competitive advantage. The study found that information technology, inventory control systems,
inventory lead time and inventory control practices are important factors for competitive
advantage of manufacturing firms in Kenya. The study recommended embracing inventory
control systems and information technology to improve and enhance competitive advantage.
14
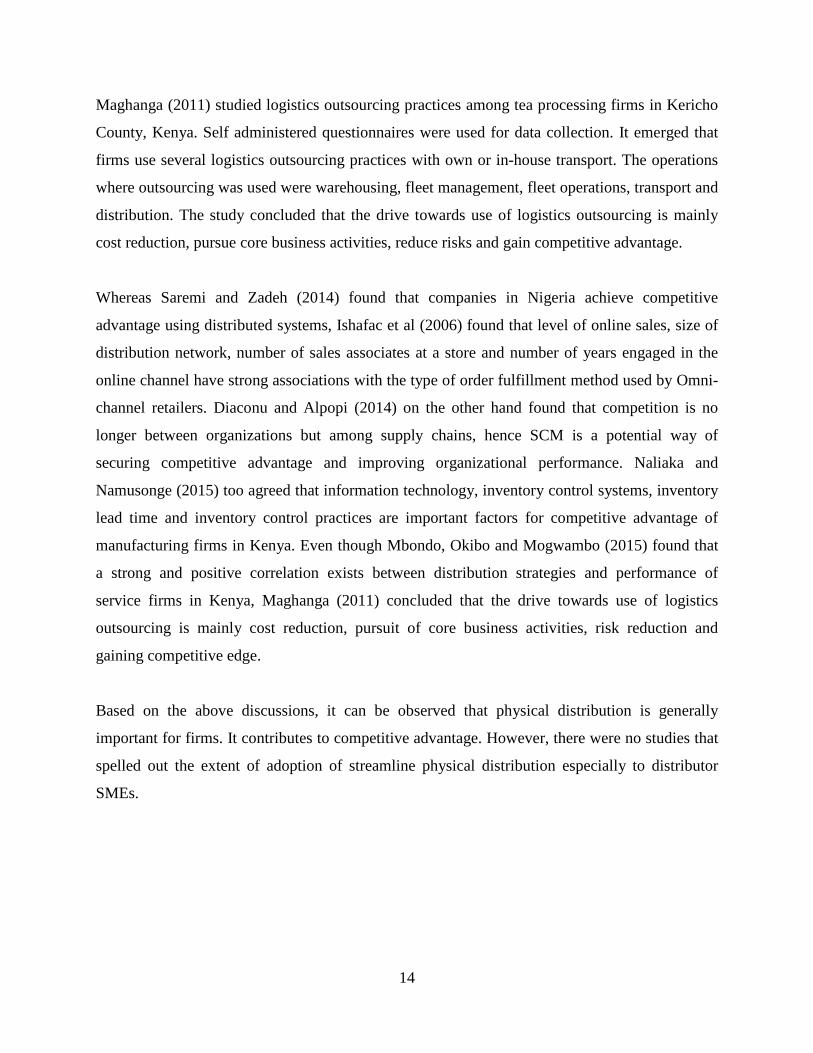
Maghanga (2011) studied logistics outsourcing practices among tea processing firms in Kericho
County, Kenya. Self administered questionnaires were used for data collection. It emerged that
firms use several logistics outsourcing practices with own or in-house transport. The operations
where outsourcing was used were warehousing, fleet management, fleet operations, transport and
distribution. The study concluded that the drive towards use of logistics outsourcing is mainly
cost reduction, pursue core business activities, reduce risks and gain competitive advantage.
Whereas Saremi and Zadeh (2014) found that companies in Nigeria achieve competitive
advantage using distributed systems, Ishafac et al (2006) found that level of online sales, size of
distribution network, number of sales associates at a store and number of years engaged in the
online channel have strong associations with the type of order fulfillment method used by Omni-
channel retailers. Diaconu and Alpopi (2014) on the other hand found that competition is no
longer between organizations but among supply chains, hence SCM is a potential way of
securing competitive advantage and improving organizational performance. Naliaka and
Namusonge (2015) too agreed that information technology, inventory control systems, inventory
lead time and inventory control practices are important factors for competitive advantage of
manufacturing firms in Kenya. Even though Mbondo, Okibo and Mogwambo (2015) found that
a strong and positive correlation exists between distribution strategies and performance of
service firms in Kenya, Maghanga (2011) concluded that the drive towards use of logistics
outsourcing is mainly cost reduction, pursuit of core business activities, risk reduction and
gaining competitive edge.
Based on the above discussions, it can be observed that physical distribution is generally
important for firms. It contributes to competitive advantage. However, there were no studies that
spelled out the extent of adoption of streamline physical distribution especially to distributor
SMEs.

15
2.2.2 Factors Contributing to Effectiveness of Streamlined Physical Distribution among
Distributor SMEs
Physical distribution is also referred to as logistics. It entails all the activities used to move
products from producers to consumers and other end users (Pride and Ferrell, 2008). The
activities of physical distribution within marketing channel can be executed by a producer,
wholesaler, and retailer or can even be outsourced. Outsourcing physical distribution activities
can be done to third party firms who have special expertise in areas like warehousing,
transportation, and inventory management and information technology. Planning an efficient
physical distribution strategy is crucial to developing an efficient marketing strategy as it can
decrease costs and increase customer satisfaction.
Fillion (2011) confirm that physical distribution networks are integral parts of modern supply
chains. In a world of uncertainty, the integrity of such networks as well as its robustness are
factors worth considering before concluding which node in the network is more important.
Physical distribution remains a vital sub-function of the entire marketing management. It has the
responsibility for inbound as well as outbound transportation. It is equally important to optimize
service and costs for materials received by a company and for finished goods shipped to
customers (Magad, 2013).
The cost of physical distribution components represent a significant portion of product cost and
have a decided impact on overall price levels. Activities assigned to physical distribution vary
among different organizations, sometimes because of location of physical distribution within the
company structure. Physical distribution influences the length of an order cycle in several ways.
It is important to provide dependable, timely deliveries as customer dissatisfaction can result
from delayed shipments, damaged goods and product quality errors. Therefore, distribution must
concentrate on eliminating shipping errors. Magad (2013) therefore recommends decentralizing
distribution centers as a viable solution to shipment problems.
According to Ross (2011), a thorough knowledge of the level of service output required by the
customer and the market exposure strategy as well as the corresponding cost impact on the
channel to meet service expectations are important in making distribution strategy decisions.

16
Both the needs of the customer and the strategic objectives of the channel members are
important. The higher the level of service output and market exposure required, the larger the
size and number of intermediaries and the greater the channel costs. He summarizes factors
affecting choice of intensive distribution strategy to include; nature of the products distributed,
strengths and weaknesses of channel partners, firm’s relative competitive advantage, profitability
targets, service level, delivery system, and marketing approach.
Rushton, Oxley and Croucher (2000) summarized factors that call for need to streamline physical
distribution within a firm. However, they agree that the importance of these factors would vary
depending on the nature of business the firm runs. They cited the need to keep down production
costs, to help link demand requirements with production capabilities, to enable large seasonal
demands to be catered for more economically, to provide good customer service, to allow cost
trade-off with transport system and to facilitate order assembly. It is important for firm to
consider these factors before embarking on the streamlining prospect.
It may be important to draw a logistics and distribution plan to help in the process of physical
distribution management. The approach entails putting down the practical steps that would be
required in executing physical distribution. The approach requires collection, collation and
analysis of a great deal of data (Rushton et al, 2000). Both external factors and internal factors
would be considered in formulating the corporate objectives and business strategy. From these,
the physical distribution or logistics objectives will be drawn. Thereafter, a sourcing model will
be formulated. Here, the cost and flows, resource and operating costs, cost relationships, product
profiles, major product flows, service elements, demand forecasts and market segmentation
factors will be at play.
Rushton et al (2000) further recommend that with a sourcing model at hand, the next step is to
determine flows then logistics options. Then, a strategy model for logistics will be developed and
consequently validated. It is thereafter important to analyze costs and compare the options. Prior
to recommendation of the plan, it is wise to evaluate the strategy against preferred business
strategy and make practical considerations.

17
Hajdarpasic (2013) explored management of the physical distribution of foods on the market. He
argued that terms and length of transport of most material products have a major and often
decisive influence on the actual level of quality at the time of arrival to the ultimate user. Study
agreed that storage conditions of product and the way they are stored and transport affect the
preservation of product integrity, ease of manipulation, rational use of storage capacity and
transportation equipment, work organization as well as distribution costs. Study revealed that
half of losses incurred by spoilage of products can be avoided if appropriate preservation,
storage, transportation and packaging measures are selected. It identified a model of management
of material goods transportation and recommended it for use by SMEs engaged in transport
services.
Urbanska (2010) assessed the role of distribution in creating competitive advantage of companies
in SME sector. The study argued that distribution is an important instrument of marketing
management hence; it underlined the optimal choice of distribution strategy and the role of
intermediaries. The study found that the choice of most optimal distribution channel structure is
determined not just by cost factor but also client expectations, action of competitors, strategy of
positioning product, number of products in the offer, market absorption and market segment
where the product is sold.
Karimi and Namusonge (2014) analyzed the role of information technology on warehouse
management in Kenya. They adopted descriptive research design and conducted the study at
JKUAT. The main objective was to find out factors affecting warehousing management. They
were specifically interested in the effect of information technology on warehouse management.
The study recommended continued investment and training in information technology and
adoption of better information sharing tools.
Bwari, Getuno and Kiarie (2016) studied effects of third party logistics on supply chain
performance in Kenya. The study was the case of East African Breweries Limited Company. The
objective was specifically to determine effect of inventory control, distribution management,
transportation management and warehousing services on supply chain performance in EABL.
The study research design adopted was descriptive. The study discovered that inventory control,

18
distribution management, transportation management influences supply chain management to a
great extent but warehousing management influenced only moderately. It thus recommended the
need for EABL to analyze its needs and non-core business so as to make informed decisions of
the right logistics services to outsource.
In a study on effect of inventory control systems on operational performance of tea processing
firms, Mogere, Oloko and Okibo (2013) took to a case study of Gianchore tea factory in Nyamira
County Kenya. They wanted to determine the effect of material requirement planning on
operational performance, establish the influence of continuous replenishment on operational
performance, and establish the extent to which distributive resource planning influence
operational performance and effect of vendor managed inventory on operational performance.
The study found that there is significant correlation between the use of inventory control systems
and operational performance of tea processing firms.
A quantitative study on effects of supply chain management strategies on competitive advantage
in food and beverage processing companies in Nairobi County, by Kariithi (2016) found that to a
large extent companies are striving to attain competitive advantage over their competitors. The
study was built from an argument that most logistics executives do not know exactly how SCM
creates value for customers because the phenomenon has not been examined exhaustively. The
study equally found that supply chain integration had the greatest effect on competitive
advantage followed by supply chain collaboration. Supply chain agility turned out to have the
least effect on competitive advantage. The study concluded that competitive advantage is
achieved when companies manage an integrated chain where customer is the focus, information
requirements, physical logistics and chain participants are managed.
Keitany, Wanyoike and Richu (2014) assessed the role of materials management on
organizational performance. They took to the case of new Kenya Cooperative Creameries
Limited in Eldoret, Kenya. They assessed how inventory control systems and lead time affect
organizational performance. The results of the study indicated that there was significant increase
in organizational performance as a result of inventory control system involvement. It also
emerged that lead time is highly significant to organizational performance through acquisition

19
and delivery of needed material within the shortest time possible. The study thus recommended
focus on materials management in dairy companies so as to achieve significant cost savings,
reduce waste and production costs and achieve increased profitability and product quality. All
these would improve organizational performance.
Sang (2016) conducted a study on effects of e-supply chain processes on organizational
performance of NGOs in Kericho County. The study was based on case of Walter Reed Project.
The findings indicated the e-purchasing process enhances efficiency through reduction of
procurement costs and lead times through prompt fulfillment of orders and receipts. It also found
that e-inventory management greatly affected organizational performance through use of ERP
systems that enabled the organization to have and maintain adequate and efficient inventory
management plans. Overall, the study pointed that e-supply chain process in NGOs result in
reduced logistical costs.
Onyango, Nyaoga, Matwere and Owuor (2014) examined green supply chain management and
economic performance. They reviewed tea processing firms in Kericho and Bomet Counties in
Kenya. They wanted to determine the relationship between green procurement and economic
performance, establish the relationship between green design and manufacturing and economic
performance. They also wanted to investigate the relationship between green distribution and
economic performance as well as between reverse logistics and economic performance. The
finding of this correlation design research was that a positive relationship exists between green
SCM and economic performance.
George and Iravo (2014) conducted a study on factors affecting the performance of distribution
logistics among production firms in Kenya. It was the case study of Bata Shoe Company
Limited. The study also sought to determine in what way the factors may influence distribution
logistics performance. Study revealed that product nature related factors such as weight, shape,
unitization, product range, perishability and product form affect performance of distribution
logistics. It also revealed that distribution structure factors like availability of regional depots,
route planning and mode of transport equally have an influence.
20
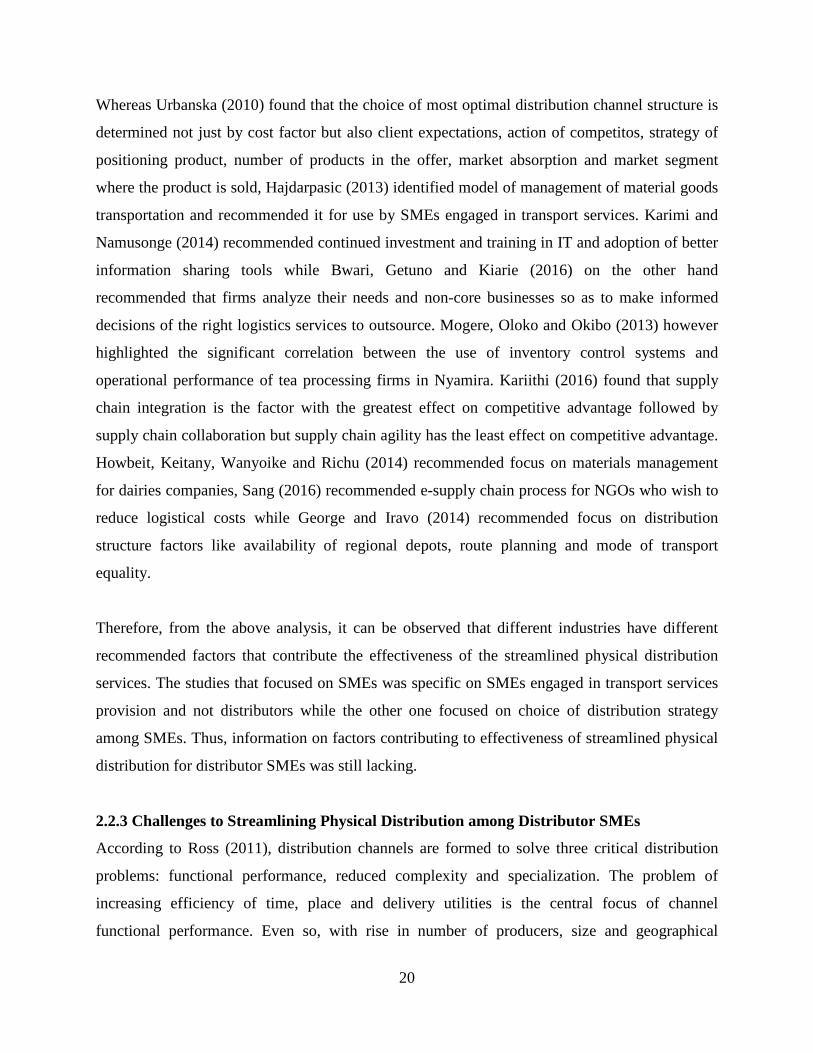
Whereas Urbanska (2010) found that the choice of most optimal distribution channel structure is
determined not just by cost factor but also client expectations, action of competitos, strategy of
positioning product, number of products in the offer, market absorption and market segment
where the product is sold, Hajdarpasic (2013) identified model of management of material goods
transportation and recommended it for use by SMEs engaged in transport services. Karimi and
Namusonge (2014) recommended continued investment and training in IT and adoption of better
information sharing tools while Bwari, Getuno and Kiarie (2016) on the other hand
recommended that firms analyze their needs and non-core businesses so as to make informed
decisions of the right logistics services to outsource. Mogere, Oloko and Okibo (2013) however
highlighted the significant correlation between the use of inventory control systems and
operational performance of tea processing firms in Nyamira. Kariithi (2016) found that supply
chain integration is the factor with the greatest effect on competitive advantage followed by
supply chain collaboration but supply chain agility has the least effect on competitive advantage.
Howbeit, Keitany, Wanyoike and Richu (2014) recommended focus on materials management
for dairies companies, Sang (2016) recommended e-supply chain process for NGOs who wish to
reduce logistical costs while George and Iravo (2014) recommended focus on distribution
structure factors like availability of regional depots, route planning and mode of transport
equality.
Therefore, from the above analysis, it can be observed that different industries have different
recommended factors that contribute the effectiveness of the streamlined physical distribution
services. The studies that focused on SMEs was specific on SMEs engaged in transport services
provision and not distributors while the other one focused on choice of distribution strategy
among SMEs. Thus, information on factors contributing to effectiveness of streamlined physical
distribution for distributor SMEs was still lacking.
2.2.3 Challenges to Streamlining Physical Distribution among Distributor SMEs
According to Ross (2011), distribution channels are formed to solve three critical distribution
problems: functional performance, reduced complexity and specialization. The problem of
increasing efficiency of time, place and delivery utilities is the central focus of channel
functional performance. Even so, with rise in number of producers, size and geographical

21
dispersion of customer base, the need for internal intermediaries to facilitate flow of products,
services and information arises. By streamlining information, marketing and product flow within
the channel, the intermediary substantially reduces the number of transactions between producers
and customers.
Distributors are faced with challenges to effective physical distribution management. For
instance, they have to deal with the growing movement for channel disintermediation so as to
squeeze every unnecessary cost out of the supply chain. They constantly struggle with
continuously trying to narrow the number of channel partners with whom they do business
(Ross, 2011). They also contend with the problem of significant excess capacity, the
unwillingness to risk and or inability to attract the capital investment necessary to retool their
information systems, human resources and marketing strategies to tackle these issues.
Miryala (2015) mentions that changing business dynamics and intensifying competition have
brought about new challenges for supply chain professionals. Globalization, shortened product
life cycles, stringent regulations and volatile markets have made effective supply chain
management a prerequisite for business success and growth.
Parthasarathy (2010) highlights the role of information and communication technology is
streamlining physical distribution. It adds value both to the business and to customers. Thus
information and communication technology driven physical distribution management synergy
should be unique. It is worthwhile to invest in information and communication technology so as
to achieve supply chain and customer relationship management synergy.
In a study on response strategies adopted by agrochemical companies to the challenges of
agrochemical distribution in Kenya, Sitanda (2013) found the main challenges facing
agrochemical companies were stakeholders’ environmental pressure groups, regulatory changes
and competition defined by the number of companies and products competing in the market
which were high. The study also found that other challengers were technological changes in the
industry, counterfeit or illegal products sold in the country. The study adopted survey design and
targeted a population of 54 companies registered with Agrochemical Association of Kenya.
22
Structured questionnaire was used for data collection and data analysis was done using both
qualitative and quantitative techniques.
Karanja (2009) investigated the distributor’s perception on coca cola distribution system in
Nairobi. The study specifically wanted to find out the perception of the distributors of coca cola
Company on channel management used, physical distribution management and establish what
the distributors perceive as the hindrances in the distribution system. The study found that both
financial and non-financial motivational strategy is important and appreciated by distributors.
The strategy would include product performance reviews and offering high quality services. The
study thus concluded that distributors positively perceived the system of distribution and so the
company needs to invest more on the transport trucks and vans to ensure steady supply of
products.
Okeudo (2013) conducted a study titled optimization of physical distribution of consumer goods
in Nigeria. The study looked at the case of Unilever with an objective of procuring optimal
solutions to challenges faced in the physical distribution system of consumer goods. Network
optimization models were applied to develop optimal solutions to real life problems in physical
distribution system. The study identified trends in warehousing operations, the nature of the
relationship between physical flow and distribution cost and how various service variables
influence service level. It recommended ways to benefit from the opportunities and steps to take
to curb the impact of its challenges to the physical distribution system.
Hassan, Zaharudin and Yunus (2015) conducted a study on delays in physical distribution. The
case study was of Sony supply chain solutions in Malaysia. The aim was to identify factors that
cause product delay to customers, analyze the causes that may contribute to product delivery
delay and suggest the solution to overcome the problems. Findings from the study indicated that
tools can determine the delays in terms of factors and causes through systematical analysis
accurately. It also revealed that delays in physical distribution are mainly due to inefficient
transportation system caused by vessel delay. The study recommended integration of IT and
logistics management with shipping liners.

23
In a study titled review of distribution related problems in logistics and supply chain research,
Yang (2013), pointed out twelve issues in distribution research that need to be addressed. The
major conclusion of the study was that future research needs to address an integral approach to
distribution design and to consider and incorporate the sustainability development concept. The
study also concluded that all entities and activities in supply chain are highly interrelated to each
other by means of material and information flow. Thus, synchronized consideration of
production, inventory and distribution is necessary and critical in the study of a distribution
problem.
Barua (2010) investigated the challenges facing supply chain management in the oil marketing
companies in Kenya. The study was a qualitative and quantitative survey and involved 23 oil
marketing companies in Kenya. The findings revealed that challenges facing SCM in the oil
marketing companies in Kenya occur in one or more of the supply chain components;
transportation, equipment, communication, suppliers, customers, labor and finance.
A study by Maghanga (2011) on logistics outsourcing practices among tea processing firms in
Kericho County, Kenya established challenges faced by firms as they moved to outsource their
business activities. The challenges included; loss of control of activities, loss of employee
loyalty, industrial unrests, switching costs, loss of information to competitors and resistance to
change by stakeholders. The study involved 4 tea processing firms and 22 tea factories in the
study area.
Musundi and Ogollah (2014) explored the challenges facing business linkages between SMEs
and mobile telephone companies in Kenya. The study employed descriptive research design and
targeted a total 114 SMEs. The study revealed that failure by SMEs to understand the
technological market, ineffective network among the SMEs, poor intra-organizational as well as
inter-organizational skills; small size of the market, low market technology and lack of
knowledge on target market hinders linkage ability. Other factors include lack of information on
market products, poor market accessibility and customer contacts, which also hinder linkages.

24
Lyimo (2014) examined the challenges and prospects faced by SMEs in accessing credit facility.
The case study targeted agricultural inputs sellers and distributors in Arusha, Tanzania. This
study concluded that constraints faced by distributor SMEs in accessing credit from financial
institutions inhibit their growth.
Karanja, SMA and Thuo (2014) studied effect of marketing capabilities and distribution strategy
on performance of mobile service providers’ intermediary organizations in Nairobi County,
Kenya. Their study employed a descripto-explanatory cross sectional survey research design.
They collected primary data using a semi-structured questionnaire from 219 respondents out of a
target population of 397 selected using stratified and simple random sampling procedures. The
data was analyzed using descriptive statistics such as frequencies and one sample t-tests. For
inferential statistical analysis, they used simple linear regression and multiple linear regression in
SPSS. They discovered that marketing capabilities and choice of distribution strategy has a
composite effect in contributing significantly to the MSP intermediary organizations’
performance. Thus, they recommended that MSP intermediary organization sales managers
lobby management to in vest in training and appropriate performance compensation plan for its
sales people as well as ICT system that will enable efficient routing of the customers among
other benefits and in the end improve performance.
Albeit Hassan et al (2015) indicated that tools can determine the delays in terms of factors and
causes through systematical analysis accurately, and that delays in physical distribution are
mainly due to inefficient transportation system caused by vessel delay, Yang (2013) concluded
that all entries and activities in supply chain are highly interrelated to each other by means of
material and information flow. Interestingly, Barua (2010) found that challenges facing SCM in
the oil manufacturing companies in Kenya occur in one or more of the supply chain components.
Maghanga (2011) on the other hand established that loss of control of activities, loss of employee
loyalty, industrial unrests, switching costs, loss of information to competitors and resistance to
change by stakeholders are some of the challenges tea processing firms in Kericho face on
logistics outsourcing. Similarly, Musundi and Ogollah (2014) found failure by SMEs to
understand technological market, ineffective network among the SMEs, poor intra-organizational
and inter-organizational skills, small market size, low market technology and lack of knowledge

25
on target market affect linkage ability between SMEs and mobile telephone companies in Kenya.
Lyimo (2014) on the other hand discovered that constraints faced by distributor SMEs in Arusha
in accessing credit from financial institutions inhibit their growth. Karanja, SMA and Thuo
(2014) also found that marketing capabilities and choice of distribution strategy has a composite
effect in contributing significantly to MSP intermediary organizations’ performance.
The above studies confirm that physical distribution process is confronted by challenges across
the board. However, details on the challenges that firms encounter while streamlining their
physical distribution activities is lacking. Therefore, information on challenges to streamlining
physical distribution among distributor SMEs was unknown.

26
CHAPTER THREE
RESEARCH METHODOLOGY In this chapter, the researcher presents the methodology that was used to conduct the study. The
research design, study area, target population, sample size, sampling technique, data type and
source as well as data collection method is outlined. The chapter also describes how instrument
validation and reliability was done as well as how data was analyzed and presented.
3.1 Research Design The study employed descriptive cross sectional survey design. The design helped provide
insights into the dynamics of the variables of the study. Kothari (2004) mentions that the major
purpose for descriptive research is to describe the state of affairs as it exists at present. Since the
data for this study was collected at a point in time, cross sectional survey was deemed
appropriate. The researcher thus explored and described the degree of effectiveness of
streamlined physical distribution, the factors contributing to effectiveness of streamlined
physical distribution as well as the challenges distributor SMEs face in implementing
streamlined physical distribution.
3.2 Study Area The area of study was Kericho County. It is bounded on the north by Nandi and Kisumu
counties, on the east by Nakuru and Baringo counties and on the south by Bomet County. It
occupies an area of 2,454.5 km2. It has 15% of its population residing in four urban centers while
the rest 85% reside in 344 rural localities (KNBS 2009 Census Report, 2010). The county
headquarter is Kericho town, which is also the largest town. The county urbanization rate stands
at 28.3% with electricity access rate of 11.8%. However, the county has 58.5% good roads
although only 13.8% are paved. The county poverty rate stands at 44.2% (USAID report, 2011).
The distributor SMEs in Kericho County have to contend with issues of changing relationships,
employee retention and customer expectations.

27
3.3 Target Population For this study, the target population included all owners or managers of 48 distributor SMEs in
Kericho County (Ministry of Commerce and Industry, Kericho County report, 2013).
3.4 Sample Size and Sampling Method There was no need for using any sampling technique for this study since the target population
was relatively small. Other studies have applied the same argument (Thuku, 2009). Therefore,
census was used and all 48 owner managers of the distributor SMEs were targeted.
3.5 Data Collection 3.5.1 Data Type and Source
The study used primary data. The primary data was collected from respondents by means of self
administered, structured questionnaires. Structured questionnaire was deemed appropriate in this
research due to its ease to standardize. Thus, respondents were asked similar questions in the
exact same way. At the same time, it also proved relatively quick and easy to create, code and
interpret.
3.5.2 Data Collection Instrument
Good survey research requires good questionnaires to ensure accuracy of data (Hair, 2015). Data
was collected through Drop-off and pick-up method. The researcher visited each of the 48
owner/managers of the distributor SMEs and dropped the questionnaire, and later returned after
five days to pick-up the filled forms. This increased the percentage of people who respond to the
questionnaire. At the drop-off, clarifications were made and the personal contact with
respondents enhanced privacy. Follow up visits were made on day three to increase response rate
and remind them on the collection date.
3.5.3 Instrument Validation and Reliability Test
For this study, researcher employed construct validity (Fink and Litwin, 1995). Validity refers to
how well a test measures what it is purported to measure. The questionnaire was given to two
experts in the field of study to read and validate before it was administered. They were to

28
confirm validity of the questionnaire in terms of consequence, content, substance, structure,
external quality, and generalize-ability.
Test-retest reliability was employed in this study. Reliability refers to the degree to which an
assessment tool produces stable and consistent results. The instrument was administered to 5 of
the respondents twice over a period of one week. The scores from time 1 and time 2 was
correlated to evaluate the stability of the test over the period (Fink and Litwin, 1995).
3.6 Data Analysis and Presentation Data analysis was done to answer the research questions of this study using SPSS tool.
Descriptive statistics like frequencies, mean, standard deviation was used in this case (Cramer,
2003). Descriptive statistics aim to summarize a sample rather than use the data to learn about
the population that the sample of data is thought to represent. The results of the study were
presented in tables.

29
CHAPTER FOUR
RESULTS AND DISCUSSIONS This chapter presents the key findings of the research based on the methodology as identified in
the preceding chapter. The chapter is structured into data analysis, presentation and interpretation
of descriptive statistics.
The purpose of this study was to analyze the contribution of streamlined physical distribution to
distributor small and medium-size enterprises in Kericho County. The purpose of this chapter
therefore is to analyze the extent of adoption of streamlined physical distribution amongst these
distributor SMEs, to analyze the effectiveness of such adoption and to present the challenges
faced by the distributor SMEs in Kericho while streamlining their physical distribution activities.
4.1 Response Rate A total of 48 distributor SMEs were targeted and given the study questionnaire to fill out and
return. Out of those, 42 responded by returning the filled out questionnaires. This translates to a
response rate of 88% which is considered adequate for the study.
4.2 General Information on Distributor SMEs General information was captured to give a general background on the distributor-SMEs. The
information sought included size of the business, age of the business since inception and
category of distributorship of the businesses.
4.2.1 Respondents Size of Business
Table 4.1: Analysis of Respondents Size of Business
Frequency Percent Mean Standard deviation
small medium Total
23 19 42
54.8 45.2 100.0
1.45
0.504 Source: Survey data, 2017
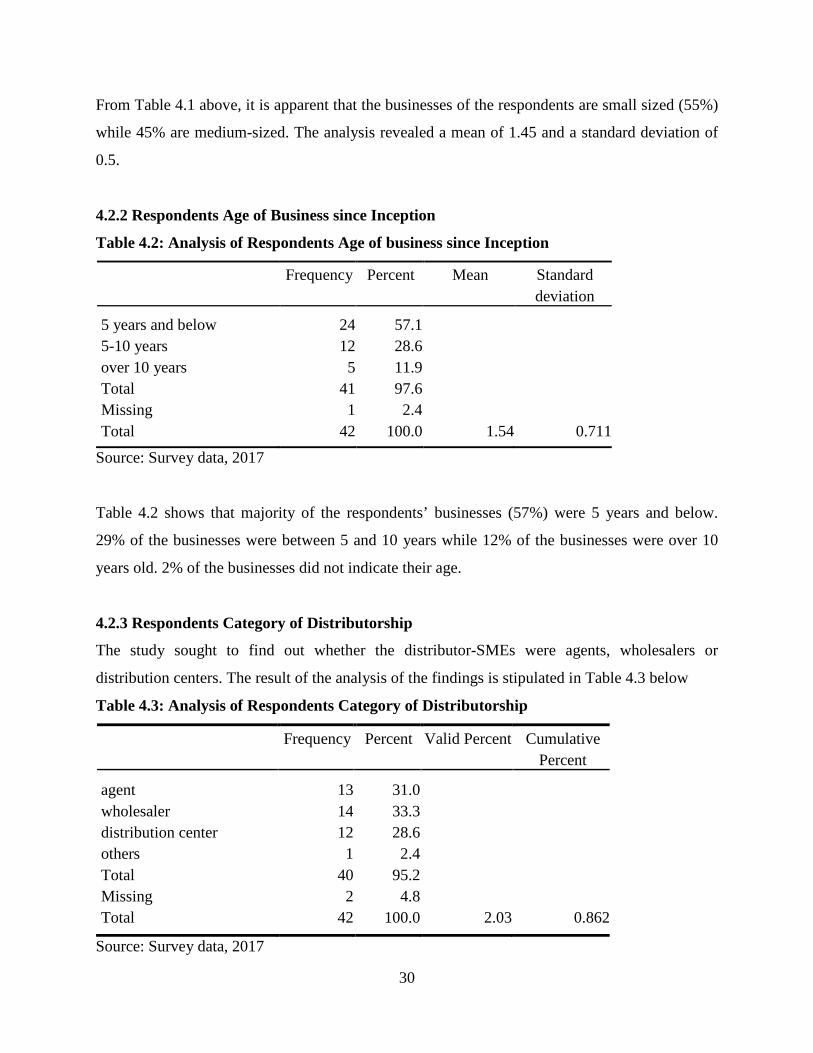
30
From Table 4.1 above, it is apparent that the businesses of the respondents are small sized (55%)
while 45% are medium-sized. The analysis revealed a mean of 1.45 and a standard deviation of
0.5.
4.2.2 Respondents Age of Business since Inception
Table 4.2: Analysis of Respondents Age of business since Inception
Frequency Percent Mean Standard deviation
5 years and below 5-10 years over 10 years Total Missing Total
24 12 5
41 1
42
57.1 28.6 11.9 97.6 2.4
100.0
1.54
0.711
Source: Survey data, 2017
Table 4.2 shows that majority of the respondents’ businesses (57%) were 5 years and below.
29% of the businesses were between 5 and 10 years while 12% of the businesses were over 10
years old. 2% of the businesses did not indicate their age.
4.2.3 Respondents Category of Distributorship
The study sought to find out whether the distributor-SMEs were agents, wholesalers or
distribution centers. The result of the analysis of the findings is stipulated in Table 4.3 below
Table 4.3: Analysis of Respondents Category of Distributorship
Frequency Percent Valid Percent Cumulative Percent
agent wholesaler distribution center others Total Missing Total
13 14 12 1
40 2
42
31.0 33.3 28.6 2.4
95.2 4.8
100.0
2.03
0.862
Source: Survey data, 2017

31
Based on Table 4.3, we deduce that 33% of the distributor-SMEs are wholesalers, 31% are
agents while 29% are distribution centers. 2% of the respondents did not indicate the category
their distributorship. A valid percent of 2.03 and cumulative percent of 0.862 are deduced from
the analysis above. As such, there were more wholesaler respondents with the least being
distribution centers.
4.3 Extent of Adoption of Streamlined Physical Distribution amongst
Distributor SMEs The first objective of this study was to determine the extent of adoption of streamlined physical
distribution amongst distributor SMEs in Kericho County. Streamlining physical distribution
entails employing strategies such as using the cheapest means of transportation, processing
orders fast, ensuring only small stocks are kept, extending customer service and making the best
out of the distribution expenses. Respondents were asked to indicate the extent to which the
above strategies were applied in their different SMEs. The ranges were from very high (1) to
very low (5) on Likert Scale.
Table 4.4: Analysis of Extent of Adoption of Cheapest means of Transportation Strategy
Frequency Percent Valid Percent Cumulative Percent
very high high moderate low very low Total
19 10 9 3 1
42
45.2 23.8 21.4 7.1 2.4
100.0
1.98
1.093 Source: Survey data, 2017
From Table 4.4, majority of respondents applied the strategy of using the cheapest means of
transportation in their businesses highly. 45% said their rate of application of this strategy is very
high, 24% rated their extent of application of the strategy as high, 21% said their application
extent is moderate while the rest 10% rated their application as low. This implies that the
businesses have realized that whereas there are other factors to consider while transporting goods

32
to customers, they ought to be keen on selecting the means that would fulfill the need at low cost
yet safe, flexible and accessible. Similarly, Maghanga (2011) found that tea processing firms are
already using several outsourcing practices alongside own or in-house transportation the goal
being to reduce costs, pursue core business activities, reduce risks and gain competitive
advantage. Further, Mbondo, Okibo and Mogwambo (2015) found that transport logistics
strategy is among the major physical distribution strategy that has been adopted by service firms
in Kenya.
Table 4.5: Analysis Extent of Adoption of Processing Orders Fast Strategy
Frequency Percent Mean Standard deviation
very high high moderate low Total
15 15 8 4
42
35.7 35.7 19.0 9.5
100.0
2.02
0.975 Source: Survey data, 2017
Table 4.5 indicates that 70.4% of respondents highly apply the strategy of processing orders fast
in their businesses. 19% of respondents moderately apply the strategy while 9.5% apply the
strategy but to a low extent. This further implies that SMEs have recognized the competitive
advantage that comes with faster order fulfillment and are leaving nothing to chance.
Table 4.6: Analysis of Extent of Adoption of Ensuring only Small Stock Kept Strategy
Frequency Percent Mean Standard deviation
very high high moderate low very low Total
10 13 12 4 3
42
23.8 31.0 28.6 9.5 7.1
100.0
2.45
1.173 Source: Survey data, 2017

33
Table 4.6 shows that 54.8% of respondents highly apply the strategy of ensuring only small stock
is kept at their businesses. 28.6% have moderately applied this strategy while 16.6% apply the
strategy only to a low scale. This indicates that SMEs have realized the importance of inventory
management. They know that monitoring and controlling one’s stock is key to success of
physical distribution. Thus, they only keep minimal stock so that they can easily control wastage,
maintain cost and turnover rate with ease and also exercise selective control when need be. The
findings agree with the recommendation on Naliaka and Namusonge (2014) that businesses
should embrace inventory control systems and IT to improve and enhance competitive
advantage.
Table 4.7: Analysis of Extent of Adoption of Extended Customer Service Strategy
Frequency Percent Mean Standard deviation
very high high moderate low very low Total
13 16 8 3 2
42
31.0 38.1 19.0 7.1 4.8
100.0
2.17
1.102 Source: Survey data, 2017
A quick look at Table 4.7 shows that 69.1% of respondents apply extended customer service
strategy in their businesses to a high extent. 19% apply the strategy moderately while 11.9%
apply the strategy on a low key. This signifies that SMEs have embraced the value of
maintaining satisfied customers as they recognize the accruing benefits such as referrals,
dedication and reputation. They know that satisfied customers are likely to be repeat customers
and this also lowers complaints and problems. Similarly, Mbondo, Okibo and Mogwambo
(2015) found that customer service strategy is among the major physical distribution strategies
that has been adopted by service firms in Kenya.

34
Table 4.8: Analysis of Extent of Adoption of Making the Best Out of Distribution Expenses
Strategy
Frequency Percent Mean Standard deviation
very high high moderate low very low Total
11 16 10 3 2
42
26.2 38.1 23.8 7.1 4.8
100.0
2.26
1.083 Source: Survey data, 2017
From Table 4.8 above, 64.3% of the respondents confirmed that they highly apply the strategy of
optimizing their distribution expenses in their businesses. 23.8% moderately apply the strategy
while 11.9% apply the strategy on a low scale. Therefore, it can be said that this is because
SMEs have realized that optimizing distribution expenses brings along increased competitive
advantage, reduces distribution lead times and also ensures the business expends only on what is
necessary. On the contrary, Mbondo, Okibo and Mogwambo (2015) found that physical
distribution efforts and sales results in print media industry are unsatisfactory.
4.4 Factors Contributing to Effectiveness of Streamlined Physical Distribution
among Distributor SMEs The second objective of the study was to establish the factors contributing to effectiveness of
streamlined physical distribution among distributor SMEs in Kericho County. Success of
streamlined physical distribution is dependent on using fast and cheapest means of transportation
that ensures goods are delivered to customers in a non-compromised condition. This also calls
for having deadlines for order processing; reducing interruptions to order processing,
streamlining sequence of order processing activities and performing order processing activities in
parallel. In addition, it also requires knowledge of safe minimum inventory levels as well as
understanding of seasonal inventory and speculative inventory levels of one’s business. It
equally demands that all staffs are involved in customer service issues and that the mission of the
business is tailored to its customers. The newness of the business should not wear off. Finally,

35
there is need to plan the distribution, locating warehouses strategically and not holding too much
or too little stock at any point. The business should know the best means of transport and
consolidate transportation whilst comparing prices across carriers.
Table 4.9: Streamlining Transportation
Very high
High
Moderate
Low Very low
Missing
Mean Standard deviation
Fast and cheapest means of transportation
13 31%
18 42.9%
4 9.5%
1 2.4%
- 6 14.3%
1.81 0.749
Choosing means of transportation that does not compromise condition of goods
13 31%
18 42.9%
5 11.9%
1 2.4%
5 11.9%
1.86 0.855
Source: Survey data, 2017
According to Table 4.9, 85.7% distributor SMEs agreed that using fast and cheapest means of
transportation contributes to effectiveness of streamlined physical distribution. However, 73.9%
agreed that the contribution of this factor is high. 9.5% rated the level of contribution of this
factor as moderate while 2.4% rated the contribution as low. This implies that whereas the
distributor SMEs appreciate that it is important to get goods to customers fast, there are cost
efficient alternatives that they need to consider before making their selection. On the contrary,
Keitany, Wanyoike and Richu (2014) recommended that focus should be on material
management. Sang (2016) also suggested that adoption of ERP would improve organizational
performance especially the adoption of e-inventory management.
We also deduce that 88% of the distributor SMEs agreed that selecting a means of transportation
that ensures condition of goods are not compromised plays a role in effectiveness of streamlined
physical distribution. Even so, 73.9% of these respondents rated this factor’s contribution to be
high. 11.9% rated the contribution of the factor as moderate while 2.4% rated the contribution of

36
the factor as low. This means majority distributor SMEs agreed that there is need to make wise
selection of transportation model for your goods. However, it is important to ensure the customer
receives the goods in the best condition which they were sent.
Table 4.10: Streamlining Order Processing
Very high
High
Moderate
Low Very low
Missing
Mean Standard deviation
Having deadlines for completion of order processing
9 24.1%
14 33.3%
6 14.3%
3 7.1%
- 10 23.8%
2.09 0.928
Reduced interruption to order processing
5 11.9%
15 35.7%
7 16.7%
3 7.1%
- 12 28.6%
2.27 0.868
Streamlining sequence of order processing activities
7 16.7%
10 23.8%
10 23.8%
3 7.1%
- 12 28.6%
2.30 0.952
Performing order processing activities in parallel
5 11.9%
10 23.8%
7 16.7%
4 9.5%
2 4.8%
14 33.3%
2.57 1.168
Source: Survey data, 2017
Table 4.10 shows that 76% distributor SMEs thought that having a deadline for completion of
order processing is a factor that affects effectiveness of streamlined physical distribution. 54.7%
rated the influence of the factor as high, 14.3% rated the influence of the factor as moderate and
7.1% found the factor’s influence to be low. This implies that these SMEs recognize to complete
orders, there must be pre-determined timelines.
71.4% distributor SMEs noted that reduced interruptions to order processing is a factor that
affects effectiveness of streamlined physical distribution. 47.6% rated the influence of this factor
as high, 16.7% rated the influence as moderate and 7.1% rated the influence as low. This means

37
that distributor SMEs focusing on order processing acknowledge that interruption of the process
would slow its completion or even skew the outcome.
It further indicates that 72.4% distributor SMEs mentioned streamlining sequence of order
processing activities as a factor that influences effectiveness of streamlined physical distribution.
40.5% rated this influence as high, 23.8% rated the influence moderate and 7.1% rated the
influence as low. This implies that distributor SMEs have appreciated the fact that how customer
orders are handles must be organized in a specified manner, certain activities must precede
others in a sequence.
Finally, it can be noted that 66.7% distributor SMEs noted performing order processing activities
in parallel as a factor that influences effectiveness of streamlined physical distribution. 35.7%
rated the influence as high, 16.7% rated the influence as moderate while 14.3% rated the
influence as low. Thus, it can be understood that distributor SMEs have recognized the need of
multi-tasking or combining tasks to be able to complete order processing. They have realized
that customers love to be served fast and that can happen when activities are merged or handled
simultaneously.
Table 4.11: Streamlining Inventory Management
Very high
High
Moderate
Low Very low
Missing
Mean Standard deviation
Knowledge of safe minimum inventory levels
7 16.7%
12 28.6%
6 14.3%
2 4.8%
1 2.4%
14 33.3%
2.21 1.031
Understanding seasonal inventory level
9 21.1%
12 28.6%
6 14.3%
4 9.5%
1 2.4%
10 23.8%
2.25 1.107
Understanding speculative inventory level
9 21.1%
7 16.7%
10 23.8%
1 2.4%
1 2.4%
14 33.3%
2.21 1.067
Source: Survey data, 2017

38
Table 4.11 shows that 66.7% distributor SMEs agreed that knowledge of safe minimum
inventory levels is a factor that influences success of streamlined physical distribution. 45.3%
rated the factor’s influence as high, 14.3% rated it moderate while 7.2% rated the influence as
low. It can thus be understood that distributor SMEs have appreciated the risks associated with
the prevalent uncertainties in demand and supply hence the need to always have a safe extra
stock level to mitigate the risk. On the contrary, Karimi and Namusonge (2014) recommended
that investment should be on training on IT and adoption of better information sharing tools.
It also illustrates that 76.2% distributor SMEs said that understanding seasonal inventory levels
is critical for success of streamlined physical distribution. 50% rated the contribution of this
factor as high, 14.3% rated it as moderate while 11.9% rated its contribution as low. This can be
interpreted to mean that distributor SMEs appreciate the complications of tracking stock and
sales of seasonal products. The distributor SMEs in Kericho deal in products that have peak and
off peak times. Erratic production of such products can result in acute shortage and the demand
always fluctuates. Thus, they must anticipate such stock to be able to mitigate the shortage.
We deduce that 66.7% respondents felt that understanding speculative inventory levels would
determine the success of streamlined physical distribution. 38.1% felt this factor highly
determines that success. 23.8% however felt this determination is only at a moderate level while
4.8% felt the determination level of this factor is low. This therefore implies that distributor
SMEs have realized the need to anticipate future demand rather than meet current demand. They
thus want to get ahead of the market and also save on cost.

39
Table 4.12: Streamlining Customer Service
Very high
High
Moderate
Low Very low
Missing
Mean Standard deviation
Involving all staff in customer service issues
11 26.2%
14 33.3%
3 7.1%
3 7.1%
- 11 26.2%
1.94 0.929
Tailoring business mission statement to customers
7 16.7%
6 14.3%
11 26.2%
4 9.5%
1 2.4%
13 31.0%
2.52 1.122
Never allowing newness of business to wear off from customers
10 23.8%
11 26.2%
3 7.1%
4 9.5%
1 2.4%
13 31.0%
2.14 1.54
Source: Survey data, 2017
Table 4.12 above shows that 73.8% respondents felt that involving all staff in customer service
issues would influence success of streamlined physical distribution. 59.5% felt the influence of
this factor is high, 7.1% felt it is moderate while another 7.1% felt it is low. It is apparent that
distributor-SMEs have discovered that whereas provision of support to customers before, during
and after a purchase is important, it requires a collective effort. Thus, all employees need to
adjust themselves to the personality of their customers.
69% of distributor SMEs listed tailoring business mission to customers as a factor that influences
effectiveness of streamlined physical distribution. 31% rated the influence of this factor as high,
26.2% rated that influence as moderate and 11.9% rated it at low. For the distributor SMEs, the
business mission is similar to business plan. It stipulates the essence of a business in terms of its
goals and philosophies underlying them.
For 69% of distributor SMEs, maintaining the business newness in the minds of its customers is
a factor that influences the success of streamlined physical distribution. 50% rated the
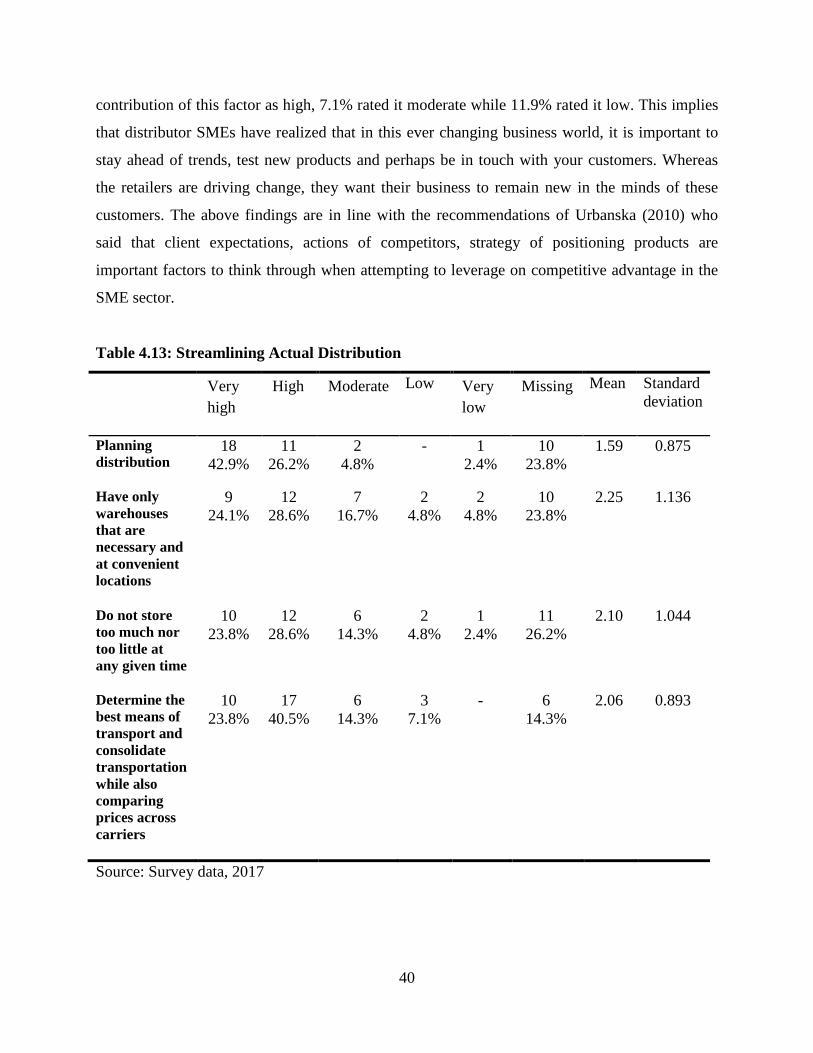
40
contribution of this factor as high, 7.1% rated it moderate while 11.9% rated it low. This implies
that distributor SMEs have realized that in this ever changing business world, it is important to
stay ahead of trends, test new products and perhaps be in touch with your customers. Whereas
the retailers are driving change, they want their business to remain new in the minds of these
customers. The above findings are in line with the recommendations of Urbanska (2010) who
said that client expectations, actions of competitors, strategy of positioning products are
important factors to think through when attempting to leverage on competitive advantage in the
SME sector.
Table 4.13: Streamlining Actual Distribution
Very high
High
Moderate
Low Very low
Missing
Mean Standard deviation
Planning distribution
18 42.9%
11 26.2%
2 4.8%
- 1 2.4%
10 23.8%
1.59 0.875
Have only warehouses that are necessary and at convenient locations
9 24.1%
12 28.6%
7 16.7%
2 4.8%
2 4.8%
10 23.8%
2.25 1.136
Do not store too much nor too little at any given time
10 23.8%
12 28.6%
6 14.3%
2 4.8%
1 2.4%
11 26.2%
2.10 1.044
Determine the best means of transport and consolidate transportation while also comparing prices across carriers
10 23.8%
17 40.5%
6 14.3%
3 7.1%
- 6 14.3%
2.06 0.893
Source: Survey data, 2017

41
Table 4.13 above indicates that 76.2% distributor SMEs mentioned that planning distribution is
key to success of streamlined physical distribution. 69.1% rated this factor to have high
contribution. 4.8% rated the contribution as moderate while 2.4% rated it very low. It seems
distributor SMEs have realized that orders must be planned within the supply chain. There are
tools to aid this function and would enable one to fix their safety stock levels and calculate time-
phased stock requirements.
We note 76.2% distributor SMEs said that strategically locating warehouses at convenient
locations is critical for success of streamlined physical distribution. 50% felt this influence is
high, 16.7% rated it at moderate while 9.6% rated it at low. This further implies that the
distributor SMEs have recognized the importance of making prompt delivery to their customers.
Thus, they are leaving nothing to chance including ensuring that they have a warehouse closer to
where their customers are concentrated. Similarly, Bwari, Getuno and Kiarie (2016) suggested
that the decision on right logistical services to outsource is critical for supply chain performance.
73.8% distributor SMEs felt that managing stock ensures that streamlined physical distribution
succeeds. 52.4% rated this contribution at high, 14.3% rated it moderate while 7.2% rated it low.
This means that the distributor SMEs have taken an interest in the available inventory
management software and tools available so that they can better ensure they do not hold too
much or too little stock at any point in time.
85.7% distributor SMEs mentioned determination of best means of transport consolidating
transportation as a factor that determines success of streamlined physical distribution. 64.3%
rated the contribution of this factor at high. 14.3% rated it at moderate while 7.1% rated it at low.
This implies that distributor SMEs are concerned with how much they will spend on
transportation, how reliable and regular a transport mode is, the safety of a transport mode, the
type of goods they deal in before they make a selection of a mode of transport to use.

42
4.5 Challenges to Streamlining Physical Distribution among Distributor SMEs Finally, the study had an objective of evaluating the challenges to streamlining physical
distribution amongst distributor SMEs in Kericho County. Despite the usual challenges that these
SMEs contend with, the activities around handling and moving goods from the business to
customer is marred with challenges. These include but not limited to fluctuating transportation
costs, unreliable market conditions, high staff turnover, lack of self motivated workforce, nature
and characteristics of channel members, unfair regulations and high taxes. There are also
challenges from political interference, poor infrastructure, lack of demand planning knowhow,
personality differences and lack of customer support knowledge.

43
Table 4.14: Challenges to Streamlining Physical Distribution
Very high
High
Moderate
Low Very low
Missing
Mean Standard deviation
fluctuating transportation costs
12 28.6%
12 28.6%
3 7.1%
1 2.4%
- 14 33.3%
1.75 0.799
unreliable market conditions
17 40.5%
10 23.8%
5 11.9%
1 2.4%
- 9 21.4%
1.70 0.847
high staff turnover
9 21.4%
6 14.3%
6 14.3%
3 7.1%
1 2.4%
17 40.5%
2.24 1.200
lack of self-motivated workforce
3 7.1%
13 31.0%
6 14.3%
3 7.1%
- 17 40.5%
2.36 0.860
nature and characteristics of channel members
1 2.4%
9 21.4%
9 21.4%
2 4.8%
- 21 50.0%
2.57 0.746
unfair
regulations
and high taxes
16 38.1%
7 16.7%
6 14.3%
3 7.1%
- 10 23.8%
1.88 1.040
political
interference
24 57.1%
6 14.3%
5 11.9%
- 1 2.4%
6 14.3%
1.56 0.939
poor infrastructure
6 14.3%
10 23.8%
9 21.4%
1 2.4%
2 4.8%
14 33.3%
2.39 1.100
lack of demand planning knowhow
3 7.1%
8 19.0%
7 16.7%
5 11.9%
2 4.8%
17 40.5%
2.80 1.155
personality differences
5 11.9%
2 4.8%
7 16.7%
11 26.2%
1 2.4%
16 38.1%
3.04 1.214
personality differences
1 2.4%
6 14.3%
12 28.6%
4 9.5%
- 19 45.2%
2.83 0.778
Source: Survey data, 2017
From Table 4.14 above, it is observed that 66.7% distributor SMEs mentioned fluctuating
transportation costs as challenge to streamlining physical distribution. 57.2% rated this challenge

44
high, 7.1% rated it moderate while 2.4% rated it low. This could be attributed to the unstable fuel
costs and unpredictable changes as well as the economic condition of the country in general.
These findings echo to what Hassan, Zaharudin and Yunus (2015) found that physical
distribution is delayed by inefficient transportation system that in effect causes vessel delays.
78.6% distributor SMEs listed unreliable market condition as challenge to streamlining physical
distribution. 74.3% rated the challenge high, 11.9% rated it moderate while 2.4% rated it low.
This could be due to the unstable economic and political environments that are prevalent. No
wonder, Barua (2010) concluded that the challenges facings supply chain management occur in
one or more of the supply chain components; transportation, equipment, communication,
suppliers, customers, labor and finance.
It is apparent that 59.5% distributor SMEs felt that high staff turnover is a challenge to
streamlining physical distribution. 35.7% rated this challenge high, 14.3% rated it moderate
while 7.1% rated it low. This challenge could be apparent due to the kind of staff distributor
SMEs have. They are easily motivated by higher pay, they are not engaged, they are bored and
poorly managed hence do not think twice on an opportunity to move on.
59.5% mentioned lack of self motivated workforce as a challenge to streamlining physical
distribution. 38.1% rated the challenge high, 14.3% rated it moderate while 7.1% rated it low.
The high rating of this challenge can be explained by the composition of workforce distributor
SMEs go for. They tend to employ unskilled workers, who are prone to deficiency in desire,
procrastinators who often lack enough stimuli or incentives and suffer fear or failure or fear of
what others would say. This is similar to what Karanja (2009) found when he studied the
distributor’s perception even though on the distribution system used by Coca Cola in Nairobi. It
was evident that distributors need both financial and non-financial motivations to positively
perceive the system.
It can be observed that 50% distributor SMEs indicated nature and characteristics of channel
members as a challenge to streamlining physical distribution. 23.8% rated this challenge high,
21.4% rated it moderate and 4.8% rated it low. This can be explained by the statistics size of

45
businesses above. It is almost evenly distributed among small and medium sized. Majority of
respondents own small businesses hence they do not engage resellers or specialty firms.
76.2% distributor SMEs mentioned unfair regulations and high taxes as a challenge to
streamlining physical distribution.54.8% rated this challenge high, 14.3% rated it moderate while
7.1% rated it low. 38.1% rating this challenge to be very high could be explained by the frequent
demonstrations by the general business community in the recent past. In parallel, Lyimo (2014)
found that SMEs have challenges accessing credit facilities from financial institutions and this
challenges their growth.
85.7% distributor SMEs mentioned political interference as a challenge to streamlining physical
distribution. 71.4% rated this challenge high, 11.9% rated it moderate while 2.4% rated it low.
Considering the political situation in the Country at the moment, the rating of very high (57.1%)
is expected. Further, political unrests results in tension that affects functional markets and
economy as a whole.
67% distributor SMEs cited poor infrastructure as a challenge to streamlining physical
distribution. 38.1% rated this challenge high, 21.4% rated it moderate while 7.2% rated it low.
This implies that these businesses might be dealing with high infrastructure set-up costs, low
returns and high operational costs as a result. Similarly, Musundi and Ogollah (2014) listed poor
market accessibility, low market technology as some of the challenges that SMEs contend with.
We note that 59.5% distributor SMEs mentioned lack of demand planning knowhow as a
challenge to streamlining physical distribution.26.1% rated this challenge high, 16.7% rated it
moderate while another 16.7% rated it low. This means that whereas the distributor-SMEs
appreciate this challenge, majority may be reaching out to demand forecasting tools to manage
their inventory thus keeping the challenge to a low of 33.4%. Similarly, Okeudo (2013)
discovered that trends in warehousing operations, the nature of relationships between physical
flow and distribution cost as well as how various service variables influence service level.

46
61.9% of distributor SMEs cited personality differences as a challenge to streamlining physical
distribution. 16.7% rated this challenge high; another 16.7% rated it moderate while 28.6% rated
it low. This means even though majority feel this challenge exists, they have learned to deal with
their differences at workplace and so the impact is kept at low. These findings are similar to what
Maghanga (2011) listed as challenges that tea processing firms in Kericho face as they moved to
outsource their business activities. He mentioned loss of employee loyalty and industrial unrest
among other challenges.
54.8% of the distributor SMEs cited customer support ignorance as a challenge they encounter to
streamlining physical distribution. 16.7% rated this challenge as high, 28.6% rated it moderate
while 9.5% rated it as low. This implies that whereas this challenge exists, it is a moderate threat
to the businesses. Even so, the findings agree with what Musundi and Ogollah (2014) discovered
that SMEs fail to understand the technological market and they also have poor intra and inter
organizational skills.

47
CHAPTER FIVE
SUMMARY, CONCLUSIONS AND RECOMMENDATIONS This chapter discusses what has been silent throughout the paper. It presents summary
discussions of the key findings presented in the chapter four and conclusions drawn based on
such findings including recommendations.
5.1 Summary of Findings The study’s first objective was to determine the extent of adoption of streamlined physical
distribution among distributor SMEs in Kericho County. Descriptive statistics were computed on
42 respondents. The study revealed that streamlined physical distribution strategies have been
adopted by distributor SMEs to a high extent. The highest adopted strategy amongst distributor
SMEs was on order processing followed by customer service, optimization of distribution
expenses, then transportation. Streamlining stock levels emerged as the lowest adopted strategy.
The above findings are in line with previous studies on physical distribution such as the study on
dairy processors that reveled they are embracing physical distribution strategies on functions
such as order processing, storage and warehousing, inventory decision making and
transportation. A different study on retailers revealed that they are focusing on integrating their
store and distribution channel inventories.
The second objective of the study was to establish the factors contributing to effectiveness of
streamlined physical distribution among distributor SMEs in Kericho County. The respondents
cited factors and went ahead to rate the contribution of these factors on streamlining physical
distribution. Descriptive statistics computed revealed the top five among the sixteen factors cited
in order of factor selected by majority as choosing transportation means that does not
compromise quality of goods, followed by optimization of distribution expenses, setting
deadlines for completion of order processing, understanding seasonal inventory levels and
involving all staff on customer care issues as the factors.
However, weight was put on selecting a means of transportation that does not compromise
quality of goods, followed by planning distribution, then involving all staff of matters customer

48
care, then setting deadlines for order processing completion and knowledge of seasonal
inventory levels. Generally, these findings disagree partly with what other researchers have
found, that inventory control, distribution management, transportation management influence
SCM to a great extent but warehousing management only influences moderately. However, it
agrees with findings of a study that lead time is significant to success of SCM.
The third objective was to evaluate the challenges to streamlining physical distribution among
distributor SMEs in Kericho County. Descriptive statistics revealed that distributor SMEs face
various challenges whilst executing streamlined physical distribution activities. Majority
mentioned political interference, followed by unreliable market conditions, then unfair
regulations and high taxes. The distributor SMEs also mentioned challenges of fluctuating
transportation costs and poor infrastructure, personality differences, high staff turnover, lack of
self-motivated workforce and lack of demand planning knowhow and lack of customer support
knowledge. The challenge that was mentioned by the least distributor SMEs is that of nature and
characteristics of channel members.
5.2 Conclusions Based on the foregoing summary the study thus concludes that all aspects of streamlined
physical distribution have been adopted by distributor SMEs to some extent. Majority have
however focused on streamlining their order processing to make it fast. The distributor SMEs
have discovered that they can process orders fast when they set deadlines for completing the
processes. The SMEs are also paying attention to customer service issues and this they do by
involving every worker in the customer service issues. Next, the distributor SMEs are optimizing
their distribution expenses which they do best by planning their distribution and consolidating
transportation, comparing costs across carriers and selecting the best transport means.
Distributor SMEs are using cheapest means of transportation. They have realized that it is not
just enough to deliver to customers but to do so in the fastest time possible. As such, they are
carefully screening transport options to get the fastest yet cheap mode which will not
compromise the condition of the goods when they are eventually delivered to the customers.

49
Finally, these distributor SMEs are paying attention to stock management issues. They ensure
they only keep enough or small stock. However, the stock they pay attention to most is the
seasonal inventory levels. They realize that trading stock and sales of seasonal products can be
complicated. As such, they must anticipate this demand that fluctuates and mitigate its shortage
by proper understanding of its levels.
The study also concludes that among all the problems and challenges that the distributor SME
has to contend with, top of the list are political interference, unreliable market conditions and
unfair regulations and high taxes.
5.3 Recommendations The study recommends that SMEs should focus more on transportation means for their products
that is low cost yet safe and accessible. This is because streamlining physical distribution calls
for coordination of all the five key components; transportation, order processing, customer
service, inventory management and control as well as optimization of distribution expenses.
Adoption of the other four aspects is better as opposed to transportation.
Further, the study recommends that SMEs should pay attention on transportation that does not
compromise quality of their products on delivery. They must endeavor to process orders fast by
setting deadlines for completion of tasks. They must familiarize themselves with the seasonal
products as erratic production of these would result in acute shortage. The study also
recommends that all staffs be involved customer service issues. The channel members should be
carefully selected. Each SME should have a distribution plan. They should anticipate challenges
and plan on mitigating them to sustain their businesses.
5.4 Limitations of the Study The study focused on distributor SMEs in Kericho County only. Whereas their views may be a
representation of the many, they may not accurately represent the unique situations of other
distributor SMEs in the city as Kericho is a sub-urban set-up. The study relied purely of primary
data obtained from owner managers of the distributor SMEs and this may not represent the views

50
of other stakeholders like employees or workers within these firms. Even though the response
rate of 87.5% was deemed adequate for the study, we cannot conclude that the views of the other
8 would be irrelevant, it might have provided additional information that the study may have
required.
5.5 Suggestions for Further Research The researcher suggests future separate studies on the different individual strategies of physical
distribution on distributor SMEs. Secondly, the researcher also suggests future research
endeavors in this area could use regression analysis to bring out the relationship between
streamlined physical distribution strategies and sustainability of distributor SMEs.

51
REFERENCES
Alexandersson, A., Fridolf, A. (2015). The Process of Distributor Selection among SMEs: A
Multiple-Case Study in the Healthcare Sector. Unpublished MSc Project in International
Business and Trade, University of Gothenburg.
Barua, J.J. (2010). Challenges Facing Supply Chain Management in the Oil Marketing
Companies in Kenya. Unpublished MBA Project, University of Nairobi.
Bertalanffy, L.V. (1969). General System Theory. New York: George Brazillier.
Blanding, W. (2012). Blanding’s Practical Physical Distribution: A Handbook for Planning and
Operations. Berlin: Springer Science & Business Media.
Bose, D.C. (2012). Principles of Management and Administration. New Delhi: PHI Learning
Pvt. Ltd.
Bwari, M.M., Getuno, P., Kiarie, D. (2016). Effects of Third Party Logistics on Supply Chain
Performance in Kenya (A Case of East African Breweries Limited Company). Journal of
Applied Management Science, 2 (5), 16-50.
Cramer, D. (2003). Advanced Quantitative Data Analysis. UK, McGraw-Hill Education.
Diaconu, D., Alpopi, C. (2014). Strengths and Weaknesses of Current Supply Chain
Management and Initiatives for the Future. Bucharest University of Economic Studies,
1165-1172.
Dutta, B. (2011). Sales and Distribution Management. New Delhi: I.K International Pvt Ltd.
Frazier, G.L. (2009). Physical Distribution and Channel Management: A Knowledge and
Capabilities Perspective. Journal of Supply Chain Management, 45, (2), 23-36.
Fink, A, Litwin, M.S. (1995). How to Measure Survey Reliability and Validity. Carlifornia:
SAGE.

52
George, K., Iravo, M. (2014). Factors Affecting the Performance of Distribution Logistics among
Production Firms in Kenya: A Case Study of Bata Shoe Company (K) Limited.
International Journal of Academic Research in Business and Social Sciences, 4, (10),
279-287.
Hajdarpasic, S. (2013). Management of the Physical Distribution of Foods in the Market. Annals
of Oradea University, 2.
Halsall, F. (2008). Systems of Art: Art, History and Systems Theory, Bern: Peter Lang.
Hassan, A.A.B.M., Zaharudin, A.B., Yunus, A.B.M. (2015). Delays in Physical Distribution: A
Case Study of Sony Supply Chain Solutions Malaysia. Unpublished Project, Universiti
Malaysia Kelantan, Malaysia.
Ishafaq, R., Defee, C.C., Gibson, B.J., Raja, U. (2016). Realignment of the Physical Distribution
Process in Omni-Channel Fulfillment. International Journal of Physical Distribution &
Logistics Management, 46, (6/7), 543-61.
Kapoor, S.K., Kansal, P. (2003). Basics of Distribution Management: A Logistics Approach.
New Delhi: PHI Learning Pvt. Ltd.
Karanja, M. (2009). Distributors’ Perception of Coca Cola Distribution System in Nairobi,
Kenya. Unpublished MBA Project, University of Nairobi.
Karanja, S.C., SMA, M., Thuo, J.K. (2014). The Effect of Marketing Capabilities and
Distribution Strategy on Performance of MSP Intermediary Organizations in Nairobi
County, Kenya. Business Management and Strategy, 5 (1).
Kariithi, S.W. (2016). Effects of Supply Chain Management Strategies on Competitive
Advantage in Food and Beverage Processing Companies in Nairobi County. Unpublished
Master of Commerce Project, Strathmore University.
Karimi, K., Namusonge, G.S. (2014). Role of Information Technology on Warehouse
Management in Kenya: A Case Study of Jomo Kenyatta University of Agriculture and

53
Technology. International Journal of Academic Research in Business and Social
Sciences, 4 (11), 188-196.
Keitany, P.J., Wanyoike, D.M., Richu, S. (2014). Assessment of the Role of Materials
Management on Organizational Performance – A Case of New Kenya Cooperative
Creameries Limited, Eldoret, Kenya. European Journal of Material Sciences, 1 (1), 1-10.
KNBS (August 2010) 2009 Kenya Population and Housing Census, Volume I A; Population by
Administrative Units, Kenya National Bureau of Statistics.
Lyimo, S.E. (2014). Challenges and Prospects Faced by Small and Medium Enterprises in
Accessing Credit Facility: A Case of Agricultural Inputs Sellers and Distributors in
Arusha City. Unpublished MBA Project, Open University of Tanzania.
Maghanga, F.M. (2011). Logistics Outsourcing Practices Among Tea Processing Firms in
Kericho County, Kenya. Unpublished MBA Project, University of Nairobi.
Mbondo, G.K., Okibo, W.B., Mogwambo, V.A. (2015). Influence of Physical Distribution
Strategies on Performance of Service Firms in Kenya: A Survey Study of Print Media
Distribution in South Nyanza Region, Kenya. European Journal of Business and
Management, 7(14), 39-50.
Micro and Small Enterprises Act 2012 (MSEA) s. 55 (Kenya).
Miryala, R.K. (2015). Trends, Challenges & Innovations in Management, Volume III.
Hyderabad: Zenon Academic Publishing.
Mogere, K.M., Oloko, M., Okibo, W. (2013). Effect of Inventory Control Systems on
Operational Performance of Tea Processing Firms: A Case Study of Gianchore Tea
Factory, Nyamira County, Kenya. The International Journal of Business & Management,
1 (5), 12-27.
Musundi, A.S., Ogollah, K. (2014). Challenges Facing Business Linkages Between Small and
Medium Enterprises and Mobile Telephone Companies in Kenya. European Journal of
Business Management, 1, (11), 298-318.

54
Naliaka, V.W., Namusonge, G.S. (2015). Role of Inventory Management on Competitive
Advantage among Manufacturing Firms in Kenya: A Case Study of Unga Group Limited.
International Journal of Academic Research in Business and Social Sciences, 5 (5), 87-
104.
Odondi, R.K. (2001). Physical Distribution and Sales Performance: A Case of Dairy Processing
Firms in Nairobi. Unpublished MBA Project, University of Nairobi.
Okeudo, G. (2013). Optimization of Physical Distribution of Consumer Goods in Nigeria: A
Case Study of Unilever. Nigeria Plc (South-East Region). Journal of Business and
Management, 10 (5), 45-53.
Okoro, D.P. (2012). Analysis of the Contribution of Physical Distribution Cost to Price in
Marketing in Nigeria (A study of Nigeria Bottling Company PLC and Emenite Limited).
Unpublished MSc. Dissertation. University of Nigeria.
Onyango, M.B., Nyaoga, R.B., Matwere, R.B., Owuor, O.J. (2014). Green Supply Chain
Management and Economic Performance: A Review of Tea Processing Firms in Kericho
and Bomet Counties, Kenya. International Journal of Science and Research, 3 (11),
2462-2466.
Parthasarany, S. (2010). Enterprise Information Systems and Implementing IT InfrastructuresK
Challenges and Issues. Dauphin County: IGI Global.
Ross, D.F. (2011). Distribution Planning and Control: Managing in the Era of Supply Chain
Management. Berlin: Springer Science & Business Media.
Rushton, A., Oxley, J., Croucher, P. (2000). The Handbook of Logistics and Distribution
Management. London: Kogan Page Publishers.
Sang, C. (2016). Effects of E-Supply Chain Processes on Organizational Performance of Non-
Governmental Organizations in Kericho County. Strategic Journal of Business & Change
Management, 3 (4).

55
Saremi, H., Zadeh, S.M.M. (2014).Management of Distribution Channels. Indian Journal of
Science and Research, 5 (3), 452-456.
Sitanda, K.E. (2013). Response Strategies Adopted by Agrochemical Companies to the
Challenges of Agrochemical Distribution in Kenya. Unpublished MBA Project,
University of Nairobi.
Stichweh, R. (2011). Systems Theory. California: Sage Publishing.
Urbanska, J. (2010). The Role of Distribution in Creating Competitive Advantage of Companies
in SME Sector. Advanced Logistics Systems, 4, 130-136.
World Bank Group. (2017). Global Economic Prospects: Weak Investments in Uncertain Times.
US, The World Bank.
Yang, X. (2013). A Review of Distribution Related Problems in Logistics and Supply Chain
Research. International Journal of Supply Chain Management, 2, (4), 1-8.

56
Appendix I: WORK SCHEDULE ACTIVITIE
S
PERIOD - 2017
FE
B
MA
R
AP
R
MA
Y
JU
N
JU
L
AU
G
SE
P
OC
T
NO
V
Proposal writing, corrections and submission
Proposal presentation
Piloting of instrument and data collection
Data entry
Data analysis
Presentation of draft report
Presentation of final report
Submission of project report for examination
Publication of the report

57
Appendix II: BUDGET ITEM AMOUNT (KES)
Stationery 7,000
Travelling 10,000
Printing & Photocopying 7,500
Data Collection 15,000
Data Analysis 11,000
Binding & Publishing 25,000
Miscellaneous 7,000
TOTAL 82,500