EFFECTIVENESS OF HYDROMULCHING TO REDUCE RUNOFF AND EROSION IN A RECENTLY BURNT PINE PLANTATION IN...
15
EFFECTIVENESS OF HYDROMULCHING TO REDUCE RUNOFF AND EROSION IN A RECENTLY BURNT PINE PLANTATION IN CENTRAL PORTUGAL Sérgio Alegre Prats 1 *, Maruxa Cortizo Malvar 1 , Diana Catarina Simões Vieira 1 , Lee MacDonald 2 , Jan Jacob Keizer 1 1 Centro de Estudos do Ambiente e do Mar (CESAM), Department of Environment and Planning, University of Aveiro, 3810-193 Aveiro, Portugal 2 Department of Forest, Rangeland and Watershed Stewardship, Warner College of Natural Resources, Colorado State University, Fort Collins, CO 80523-1472, USA Received: 13 June 2013; Revised: 4 July 2013; Accepted: 4 July 2013 ABSTRACT Forest fires can greatly increase runoff and surface erosion rates. Post-fire soil erosion control measures are intended to minimize this response and facilitate ecosystem recovery. In a few recent cases, hydromulch has been applied, and this consists of a mixture of organic fibers, water and seeds. The objectives of this research were to (i) analyze the effectiveness of hydromulch in reducing post-fire runoff and sediment production and (ii) determine the underlying processes and mechanisms that control post-fire runoff and erosion. After a wildfire occurred in August 2008, 14 plots ranging in size from 0·25 to 10 m 2 were installed on a 25 degree slope in a burnt pine plantation that had also been subjected to salvage logging. Half of the plots were randomly selected and treated with hydromulch. One of two slope strips adjacent to the plots was also hydromulched and used for monitoring some soil properties. Measurements made in each of the first 3 years following the wildfire included (i) the plot-scale runoff volumes and sediment yields; (ii) soil shear strength, soil moisture, and soil water repellency; and (iii) surface cover. The hydromulch reduced over- land flow volume by 70% and soil erosion by 83%. The decrease in runoff was attributed to the increase in soil water retention capacity and the decrease in soil water repellency, whereas the reduction in soil erosion was initially attributed to the protective cover provided by the hydromulch and lately to an enhanced vegetative regrowth in the third year after burning. Copyright © 2013 John Wiley & Sons, Ltd. keywords: wildfire; post-fire erosion; overland flow; soil water repellency; ash INTRODUCTION Soil erosion is a key process in the functioning of Mediterranean ecosystems (Cantón et al., 2001; Ceballos et al., 2003; Cerdà et al., 2010), and wildfires represent one of a number of disturbances in forests and shrublands that can greatly increase soil and fertility losses (Cerdà, 1998a, 1998b; Shakesby & Doerr, 2006; Shakesby, 2011). The consumption of the vegetation and litter layer by fire increases both overland flow—because of the reduction of rainfall interception and resistance to flow— and sediment losses by increasing the splash erosion by rain- drops (Soto & Diaz-Fierros, 1997; Llorens & Domingo, 2006). Additionally, the fire-induced heating of the soil can reduce aggregate stability, decrease porosity, and increase soil water repellency (SWR), and these changes can decrease infiltration and increase soil erodibility (DeBano, 2000; Ferreira et al., 2008; Keizer et al., 2008; Malvar et al., 2011; Prats et al., 2012). The association of wildfire with on-site soil erosion and downstream flooding and massive sediment deposition has become increasingly recognized (Kraebel, 1934) and, in the early part of the last century, led to the first systematic soil erosion control treatments following wildfires (Munns, 1919). The first post-fire rehabilitation efforts consisted of building engineering structures (check dams) in stream channels to trap the sediments and of seeding hillslopes to increase ground cover (Wohlgemuth et al., 2009). However, it was proved to be unrealistic to build check dams in the short periods between the occurrence of the wildfires and the occurrence of the erosion-producing rains; also, various studies started to question the effectiveness of seeding to reduce soil erosion during the 1980s (Gautier, 1983; Taskey et al., 1989). During the 1990s and the 2000s, research on post-fire erosion mitigation concerned seeding (e.g., Pinaya et al., 2000; Fernández-Abascal et al., 2003; Beyers, 2004; Robichaud et al., 2006; Groen & Woods, 2008; Peppin et al., 2010), construction of erosion barriers by using logs (Wagenbrenner et al., 2006; Robichaud et al., 2008), and straw mulching (Bautista et al., 1996; Badía & Martí, 2000; Wagenbrenner et al., 2006). In a nutshell, these studies found seeding to be effective in some cases but not in others, log erosion barriers to be ineffective unless rain events are few and small, and mulching to be highly effective. The effectiveness of mulching was also well-established for agriculture lands (Harris & Yao, 1923; Meyer et al., 1970; Lyles et al., 1974; Meyer et al., 1999; Wilson et al., 2004; García-Orenes et al., 2009, 2010; Giménez-Morera et al., 2010; Jordán et al., 2010), cut slopes, and unpaved roads (Grismer & Hogan, 2005; Jordán & Zavala, 2008). Post-fire straw mulching at rates of c.a. 2 Mg ha 1 has been proved to reduce sediment yields by more than 80% *Correspondence to: S. A. Prats, Centro de Estudos do Ambiente e do Mar (CESAM), Department of Environment and Planning, University of Aveiro, 3810-193 Aveiro, Portugal. E-mail: [email protected] Copyright © 2013 John Wiley & Sons, Ltd. land degradation & development Land Degrad. Develop. (2013) Published online in Wiley Online Library (wileyonlinelibrary.com) DOI: 10.1002/ldr.2236
-
Upload
independent -
Category
Documents
-
view
3 -
download
0
Transcript of EFFECTIVENESS OF HYDROMULCHING TO REDUCE RUNOFF AND EROSION IN A RECENTLY BURNT PINE PLANTATION IN...
land degradation & developmentLand Degrad. Develop. (2013)
Published online in Wiley Online Library (wileyonlinelibrary.com) DOI: 10.1002/ldr.2236
EFFECTIVENESS OF HYDROMULCHING TO REDUCE RUNOFF AND EROSIONIN A RECENTLY BURNT PINE PLANTATION IN CENTRAL PORTUGAL
Sérgio Alegre Prats1*, Maruxa Cortizo Malvar1, Diana Catarina Simões Vieira1, Lee MacDonald2, Jan Jacob Keizer1
1Centro de Estudos do Ambiente e do Mar (CESAM), Department of Environment and Planning, University of Aveiro, 3810-193 Aveiro, Portugal2Department of Forest, Rangeland and Watershed Stewardship, Warner College of Natural Resources, Colorado State University, Fort Collins,
CO 80523-1472, USA
Received: 13 June 2013; Revised: 4 July 2013; Accepted: 4 July 2013
ABSTRACT
Forest fires can greatly increase runoff and surface erosion rates. Post-fire soil erosion control measures are intended to minimize this response andfacilitate ecosystem recovery. In a few recent cases, hydromulch has been applied, and this consists of a mixture of organic fibers, water and seeds.The objectives of this research were to (i) analyze the effectiveness of hydromulch in reducing post-fire runoff and sediment production and(ii) determine the underlying processes and mechanisms that control post-fire runoff and erosion. After a wildfire occurred in August 2008,14 plots ranging in size from 0·25 to 10m2 were installed on a 25 degree slope in a burnt pine plantation that had also been subjected to salvagelogging. Half of the plots were randomly selected and treated with hydromulch. One of two slope strips adjacent to the plots was also hydromulchedand used for monitoring some soil properties. Measurements made in each of the first 3 years following the wildfire included (i) the plot-scale runoffvolumes and sediment yields; (ii) soil shear strength, soil moisture, and soil water repellency; and (iii) surface cover. The hydromulch reduced over-land flow volume by 70% and soil erosion by 83%. The decrease in runoff was attributed to the increase in soil water retention capacity and thedecrease in soil water repellency, whereas the reduction in soil erosion was initially attributed to the protective cover provided by the hydromulchand lately to an enhanced vegetative regrowth in the third year after burning. Copyright © 2013 John Wiley & Sons, Ltd.
keywords: wildfire; post-fire erosion; overland flow; soil water repellency; ash
INTRODUCTION
Soil erosion is a key process in the functioning ofMediterranean ecosystems (Cantón et al., 2001; Ceballoset al., 2003; Cerdà et al., 2010), and wildfires representone of a number of disturbances in forests and shrublandsthat can greatly increase soil and fertility losses (Cerdà,1998a, 1998b; Shakesby & Doerr, 2006; Shakesby,2011). The consumption of the vegetation and litter layerby fire increases both overland flow—because of thereduction of rainfall interception and resistance to flow—and sediment losses by increasing the splash erosion by rain-drops (Soto & Diaz-Fierros, 1997; Llorens & Domingo,2006). Additionally, the fire-induced heating of the soil canreduce aggregate stability, decrease porosity, and increase soilwater repellency (SWR), and these changes can decreaseinfiltration and increase soil erodibility (DeBano, 2000;Ferreira et al., 2008; Keizer et al., 2008; Malvar et al., 2011;Prats et al., 2012).The association of wildfire with on-site soil erosion and
downstream flooding and massive sediment deposition hasbecome increasingly recognized (Kraebel, 1934) and, inthe early part of the last century, led to the first systematicsoil erosion control treatments following wildfires (Munns,1919). The first post-fire rehabilitation efforts consisted of
*Correspondence to: S. A. Prats, Centro de Estudos do Ambiente e do Mar(CESAM), Department of Environment and Planning, University of Aveiro,3810-193 Aveiro, Portugal.E-mail: [email protected]
Copyright © 2013 John Wiley & Sons, Ltd.
building engineering structures (check dams) in streamchannels to trap the sediments and of seeding hillslopes toincrease ground cover (Wohlgemuth et al., 2009). However,it was proved to be unrealistic to build check dams in theshort periods between the occurrence of the wildfires andthe occurrence of the erosion-producing rains; also, variousstudies started to question the effectiveness of seeding toreduce soil erosion during the 1980s (Gautier, 1983; Taskeyet al., 1989).During the 1990s and the 2000s, research on post-fire
erosion mitigation concerned seeding (e.g., Pinaya et al.,2000; Fernández-Abascal et al., 2003; Beyers, 2004;Robichaud et al., 2006; Groen & Woods, 2008; Peppinet al., 2010), construction of erosion barriers by using logs(Wagenbrenner et al., 2006; Robichaud et al., 2008), andstraw mulching (Bautista et al., 1996; Badía & Martí,2000; Wagenbrenner et al., 2006). In a nutshell, thesestudies found seeding to be effective in some cases but notin others, log erosion barriers to be ineffective unlessrain events are few and small, and mulching to behighly effective. The effectiveness of mulching was alsowell-established for agriculture lands (Harris & Yao,1923; Meyer et al., 1970; Lyles et al., 1974; Meyer et al.,1999; Wilson et al., 2004; García-Orenes et al., 2009,2010; Giménez-Morera et al., 2010; Jordán et al., 2010),cut slopes, and unpaved roads (Grismer & Hogan, 2005;Jordán & Zavala, 2008).Post-fire straw mulching at rates of c.a. 2Mg ha�1 has
been proved to reduce sediment yields by more than 80%
S. A. PRATS ET AL.
(Bautista et al., 1996; Badía & Martí, 2000; Wagenbrenneret al., 2006; Groen & Woods, 2008; Fernández et al.,2011; Robichaud et al., 2013b). However, straw may beavailable in only limited quantities in certain regions,including Portugal (Prats et al., 2012), and may beredistributed by strong winds as a result of its low weight(Robichaud et al., 2000). Straw application can alsointroduce invasive weeds and inhibit native species recovery(Kruse et al., 2004). Despite the increased application costs,other mulches of higher specific weight have also beentested. Forest residues, at application rates of 8Mg ha�1 inPrats et al. (2012) and 46Mg ha�1 in Shakesby et al.(1996), or wood strands mulch, at rates of 4–12Mg ha �1
in Robichaud et al. (2013a), were found to be as effectiveas straw mulch, whereas wood chips mulch was found tobe much less effective (Kim et al., 2008; Fernándezet al., 2011).Mulching is effective against erosion because it
reduces runoff and erosion rates by two mechanisms.First, it increases interception storage capacity, whichreduces the amount of rain available for producingrunoff, it reduces runoff velocity, and it increases soilmoisture (Bautista et al., 2009). Second, mulch protectsthe soil surface against the kinetic energy of rainfalldrops and decreases the hydrodynamic power of flowingwater (Smets et al., 2008).A recent variant of mulching is that of hydromulching,
which refers to the application of a water-based mixtureof organic fibers, seeds and a green colorant. It is easilyapplied because it can be sprayed onto slopes by a jet hose(Naveh, 1975). It also tends to bind strongly to the soilsurface by the action of the soil-binding agent, so it isparticularly useful on steep slopes and strongly modifiedareas such as quarries, construction sites, and cut and fillslopes along roads (Emanual, 1976; Benik et al., 2003;Robichaud et al., 2010). Runoff and soil erosion will bereduced because the hydromulch increases interceptionstorage and protects the soil surface. Additionally, theintroduced seeds are intended to increase the vegetativecover, especially when the mulch starts decompose. Inburnt areas, seeding requires careful selection of speciesthat are adapted to the target environment, both to guaran-tee that the seeding produces an adequate cover and toavoid that the introduced species come to behave as inva-sive weed (Kruse et al., 2004). An important disadvantageof hydromulching is its elevated costs, which can rangefrom $3,700.00 to $10,300.00 per ha for aerial application(Hubbert et al., 2012). By contrast, the costs for strawmulching are on the order of $600.00 and $1,200.00 perha for application by helicopter and by hand-spreading,respectively (Napper, 2006). Despite this greater expense,hydromulching has been used especially in the USA aftersome fires when access was difficult, the slopes were toosteep or subject to wind to use straw mulch and whenthere were particularly important ‘values at risk’, such aswater reservoirs, cultural or natural heritage sites, orindustrial plants.
Copyright © 2013 John Wiley & Sons, Ltd.
The effectiveness of hydromulching in reducing post-firerunoff and erosion has not yet been fully established.Although Robichaud et al. (2013b) found no markeddecrease in post-fire runoff, Hubbert et al. (2012), Rough(2007), and Robichaud et al. (2010, 2013a) did reportsubstantial reductions in erosion rates (with 65–95%).However, these reductions were restricted to the first yearafter hydromulching, which the authors attributed to therapid breakdown of the mulch layer. Wohlgemuth et al.(2011) also found hydromulching to markedly reduceoverall erosion rates (by 60–80%) but not the sedimentlosses produced by high-intensity storms. Robichaud et al.(2010) suggested that hydromulching would be most effec-tive on short slopes (10–20m), where interrill erosion isthe dominant process and the hydromulch mat is less likelyto be detached by rill incision. However, Rough (2007)found aerial hydromulching to be highly effective on longhillslopes with elevated rill densities (0·1 rill m�2).Given the elevated potential of hydromulching for post-
fire rehabilitation, there is a clear need to test its effective-ness in geographical regions outside the USA. Althoughhydromulch can include surfactants, the effectiveness ofhydromulching has been poorly assessed for vegetationtypes associated with strong or extreme SWR, such as theeucalypt and pine plantations that dominate in north-centralPortugal (Ferreira et al., 2008, Keizer et al., 2008; Pratset al., 2012). Also, the effectiveness of hydromulching afterpost-fire salvage logging is poorly known in spite of beingperhaps the most common practice following wildfires innorth-central Portugal. Salvage logging was typically beingused to recover timber values and reduce the risk of insectinfestation (McIver & Starr, 2000), but it can trigger runoffand soil erosion through soil alteration and forest floordisturbances (Rab, 1994; Castillo et al., 1997; Edeso et al.,1999; Fernández et al., 2004, 2007).The overall aim of the present research was to study the
effectiveness of hydromulching to reduce runoff anderosion over a three-year period in a recently burnt andlogged pine plantation in north-central Portugal. Thespecific objectives were to (i) assess the effectiveness ofhydromulching in reducing runoff volumes and sedimentyields at the plot scale; (ii) analyze the changes in runoffand soil erosion over time and across plot size (0·25, 0·5,and 10m2 plots); and (iii) determine the effect ofhydromulching on key soil properties, surface cover, andvegetative recovery, and the extent to which thesemulching-induced changes can explain the observed differ-ences in runoff and erosion between the hydromulched anduntreated plots.
MATERIAL AND METHODS
Study Area and Site
This study was conducted near the village of Colmeal in theGóis municipality of north-central Portugal (N 40º08′42″, W7º59′16″; 490m asl). On 27 August 2008, a wildfire burnt68 ha of forest lands. A west-facing 25 degree steep hillslope
LAND DEGRADATION & DEVELOPMENT, (2013)
POST-FIRE HYDROMULCHING REDUCED RUNOFF AND SEDIMENT LOSSES
was selected to study post-fire vegetation recovery (Maiaet al., 2012a, 2012b), and, at a later stage, also for this study.The hillslope had been planted with maritime pine (Pinuspinaster Ait.) some 25 years before the wildfire, at a densityof 2,600 saplings per ha. The undergrowth was composed ofa mixture of Mediterranean and Atlantic shrubs and wasdominated by Calluna vulgaris I. and Arbutus unedo L.(Maia et al., 2012b). The study area has a Mediterraneanclimate with a mean annual temperature of 10–12·5°C(according to Köppen; APA, 2011). The annual precipita-tion as recorded by the nearest weather station (Cadafaz, N40º08′02″, W 8º32′40″; 12 kmW�1 from the study area;25 years of data) was, on average, 1,130mm but varied from717mm to 1,872mm (SNIRH, 2012). The soils wereshallow, 30- to 35-cm deep Humic Cambisols (WRB,2007), overlying schist, as was observed from four soil pitsdug during November 2008 (Table I). A soil sample wascollected at 0–5 cm depth in each pit, and later analyzed,using standard laboratory methods, for bulk density (Portaet al., 2003), porosity, and grain-size distribution (Guitian& Carballas, 1976). Percent organic carbon was determinedby a carbon analyzer (Flash EA 1112 series by ThermoFinnigan, USA) and multiplied by the van Bemmelen factor(1·724) in order to obtain the organic matter content on thesoil (Jackson, 1958).
Experimental Design, Field Data Collection, andLaboratory Analyses
At the location selected for this experiment, the 2008wildfire had completely consumed the pine crowns, so
Table I. Indicators of fire severity, ground cover, and mean soilproperties from 0- to 5-cm depth (n= 4)
Site characteristics Average ± SD
Overall fire severity ModerateTree canopy consumption TotalTDI 0·4 ± 0·1MTR (°C) 78 ± 30
Ground cover in December 2008 (%)Litter 2 ± 1·3Black ashes 56·6 ± 9·7Bare soil 7·2 ± 3·7Stones (>2mm) 34·2 ± 8·3
Soil propertiesSoil depth (cm) 35·3 ± 4·3Slope (º) 24·5 ± 3·4Bulk density (g cm�3) 0·8 ± 0·1
Porosity (cm3 cm�3) 0·5 ± 0·1Organic matter (%) 16·4 ± 1·6
Soil textureClay (%) 8·4 ± 1·9Silt (%) 35·8 ± 9·0Sand (%) 55·8 ± 12·8
Stoniness (>2mm) (%) 36 ± 15·0USDA soil texture class Sandy loam
TDI, twig diameter index; MTR, maximum temperature reached, followingMaia et al. (2012a, 2012b); SD, standard deviation; USDA, United StatesDepartment of Agriculture.
Copyright © 2013 John Wiley & Sons, Ltd.
there was basically no needle cast after the fire (Table I).On 11 December 2008, 106 days after the fire, more thanhalf of the soil surface corresponded to black ashes, athird to stones, and less than 10% to bare soil. The fireseverity was classified as moderate according to variousseverity indices described in Maia et al. (2012b) atlocations some 5–10m distance from the present experi-ment. For example, the maximum temperature reached(Guerrero et al., 2007) by the soil at 0–3 cm depth, esti-mated with near-infrared spectroscopy, was, on average,78°C; the twig diameter index ( Maia et al., 2012a),which ranged between 0 (unburnt) and 1 (very intensewildfire) was, on average, 0·4 (Table I).Because the National Forestry Authority had decided to
log the stand as soon as possible because of the risk ofnematode infestation, the experimental set up of this studyinvolved four phases. The first phase comprised the installa-tion of a tipping-bucket rain gage (Pronamic professionalrain gauge with an event logger) in combination with astorage gage for validation purposes. This was carried outon 15 September 2008, prior to any rainfall followingthe wildfire. After that, the rainfall was measured weeklyfrom the storage gage, and the maximum weekly ormonthly 30-min rainfall intensity (‘I30’, in mm h�1)was calculated for each period from the tipping-bucketrain gage data series.On 5 November 2008, the pretreatment period started
with the installation of four plots bounded with metal sheets.Two were micro-plots of approximately 0·5 × 0·5m,whereas the other two were small plots of approximately0·5m wide and 1·0m long. The outlets of each plot wereconnected, using garden hose, to 30 L tanks, where the run-off was collected. The runoff volume in each tank was mea-sured at 1- to 2-weekly intervals, depending on rainfall, from5 November 2008 to 12 October 2010, except during March2008 when the runoff measurements had to be interruptedbecause of the logging activities. This 23-month periodwas divided in a pretreatment and posttreatment period, asfurther specified in Table II. Whenever runoff exceeded250ml, a sample was collected for determination ofsediment and organic matter contents by using standardlaboratory methods (filtration at 14μm, drying for 24 h at105°C and loss-on-ignition for 4 h at 550°C; APHA, 1998).The third phase began on 30 March 2009, after the log-
ging had been completed, when two more micro-plotsand two more small plots were installed at close distancesfrom the previous micro-plots (<5m) along with six sedi-ment fences (Robichaud & Brown, 2002) that had beenset up at some 10–20m distance in the upslope direction.Following the design by Fernández et al. (2011), thesesediment fence plots (‘SF plots’) of roughly 2-m wideand 5-m long were bounded by means of a geotextile fabricand delimited by metal sheets to avoid run-on into theplots. The geotextile fabric filtered the runoff, and onlythe sediments accumulated at the bottom of the SF plotswere collected at monthly intervals from 31 March 2009to 12 October 2010. Afterwards, the SF plots were emptied
LAND DEGRADATION & DEVELOPMENT, (2013)
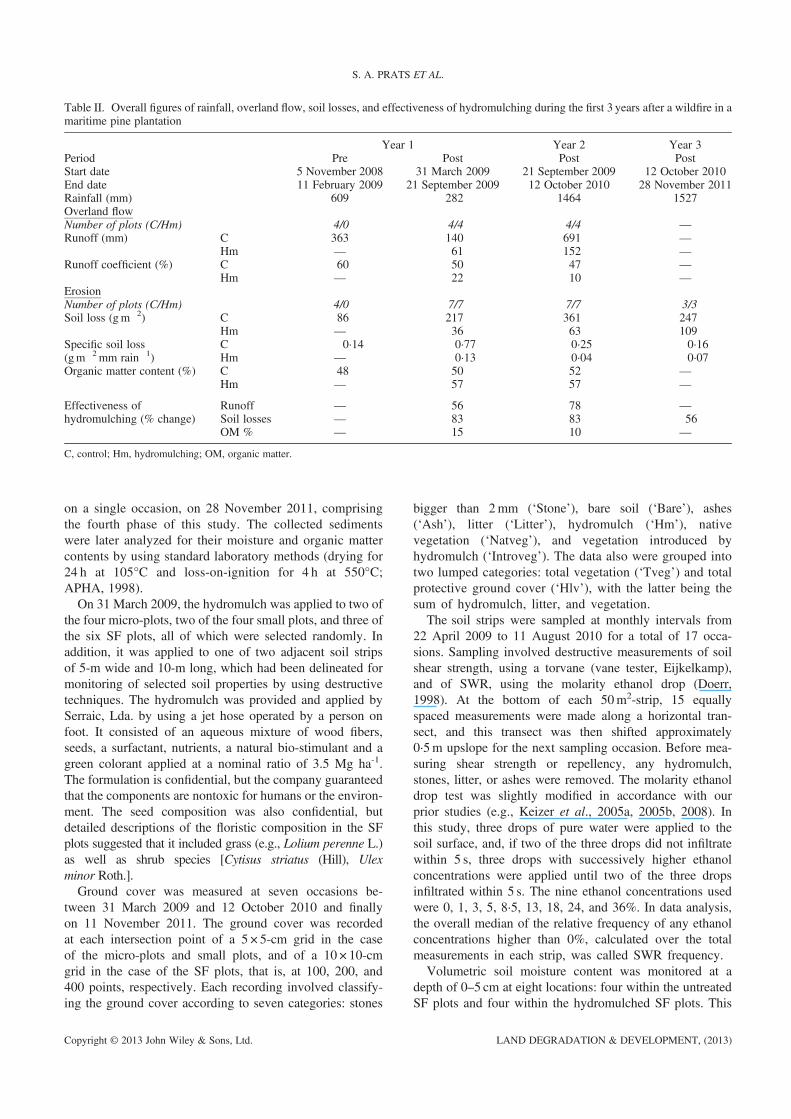
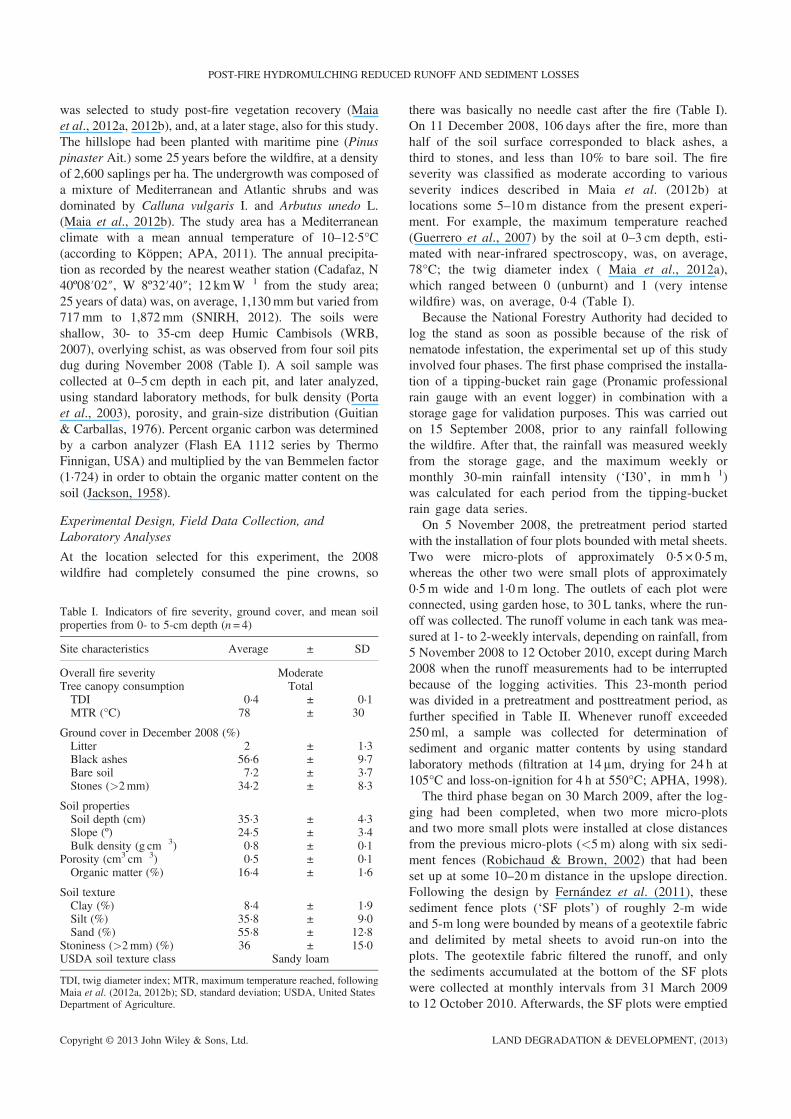
Table II. Overall figures of rainfall, overland flow, soil losses, and effectiveness of hydromulching during the first 3 years after a wildfire in amaritime pine plantation
Year 1 Year 2 Year 3Period Pre Post Post PostStart date 5 November 2008 31 March 2009 21 September 2009 12 October 2010End date 11 February 2009 21 September 2009 12 October 2010 28 November 2011Rainfall (mm) 609 282 1464 1527Overland flowNumber of plots (C/Hm) 4/0 4/4 4/4 —Runoff (mm) C 363 140 691 —
Hm — 61 152 —Runoff coefficient (%) C 60 50 47 —
Hm — 22 10 —ErosionNumber of plots (C/Hm) 4/0 7/7 7/7 3/3Soil loss (gm�2) C 86 217 361 247
Hm — 36 63 109Specific soil loss(gm�2mm rain�1)
C 0·14 0·77 0·25 0·16Hm — 0·13 0·04 0·07
Organic matter content (%) C 48 50 52 —Hm — 57 57 —
Effectiveness ofhydromulching (% change)
Runoff — �56 �78 —Soil losses — �83 �83 �56OM % — 15 10 —
C, control; Hm, hydromulching; OM, organic matter.
S. A. PRATS ET AL.
on a single occasion, on 28 November 2011, comprisingthe fourth phase of this study. The collected sedimentswere later analyzed for their moisture and organic mattercontents by using standard laboratory methods (drying for24 h at 105°C and loss-on-ignition for 4 h at 550°C;APHA, 1998).On 31 March 2009, the hydromulch was applied to two of
the four micro-plots, two of the four small plots, and three ofthe six SF plots, all of which were selected randomly. Inaddition, it was applied to one of two adjacent soil stripsof 5-m wide and 10-m long, which had been delineated formonitoring of selected soil properties by using destructivetechniques. The hydromulch was provided and applied bySerraic, Lda. by using a jet hose operated by a person onfoot. It consisted of an aqueous mixture of wood fibers,seeds, a surfactant, nutrients, a natural bio-stimulant and agreen colorant applied at a nominal ratio of 3.5 Mg ha-1.The formulation is confidential, but the company guaranteedthat the components are nontoxic for humans or the environ-ment. The seed composition was also confidential, butdetailed descriptions of the floristic composition in the SFplots suggested that it included grass (e.g., Lolium perenne L.)as well as shrub species [Cytisus striatus (Hill), Ulexminor Roth.].Ground cover was measured at seven occasions be-
tween 31 March 2009 and 12 October 2010 and finallyon 11 November 2011. The ground cover was recordedat each intersection point of a 5 × 5-cm grid in the caseof the micro-plots and small plots, and of a 10 × 10-cmgrid in the case of the SF plots, that is, at 100, 200, and400 points, respectively. Each recording involved classify-ing the ground cover according to seven categories: stones
Copyright © 2013 John Wiley & Sons, Ltd.
bigger than 2mm (‘Stone’), bare soil (‘Bare’), ashes(‘Ash’), litter (‘Litter’), hydromulch (‘Hm’), nativevegetation (‘Natveg’), and vegetation introduced byhydromulch (‘Introveg’). The data also were grouped intotwo lumped categories: total vegetation (‘Tveg’) and totalprotective ground cover (‘Hlv’), with the latter being thesum of hydromulch, litter, and vegetation.The soil strips were sampled at monthly intervals from
22 April 2009 to 11 August 2010 for a total of 17 occa-sions. Sampling involved destructive measurements of soilshear strength, using a torvane (vane tester, Eijkelkamp),and of SWR, using the molarity ethanol drop (Doerr,1998). At the bottom of each 50m2-strip, 15 equallyspaced measurements were made along a horizontal tran-sect, and this transect was then shifted approximately0·5m upslope for the next sampling occasion. Before mea-suring shear strength or repellency, any hydromulch,stones, litter, or ashes were removed. The molarity ethanoldrop test was slightly modified in accordance with ourprior studies (e.g., Keizer et al., 2005a, 2005b, 2008). Inthis study, three drops of pure water were applied to thesoil surface, and, if two of the three drops did not infiltratewithin 5 s, three drops with successively higher ethanolconcentrations were applied until two of the three dropsinfiltrated within 5 s. The nine ethanol concentrations usedwere 0, 1, 3, 5, 8·5, 13, 18, 24, and 36%. In data analysis,the overall median of the relative frequency of any ethanolconcentrations higher than 0%, calculated over the totalmeasurements in each strip, was called SWR frequency.Volumetric soil moisture content was monitored at a
depth of 0–5 cm at eight locations: four within the untreatedSF plots and four within the hydromulched SF plots. This
LAND DEGRADATION & DEVELOPMENT, (2013)

POST-FIRE HYDROMULCHING REDUCED RUNOFF AND SEDIMENT LOSSES
was carried out using eight EC-5 sensors linked to twoEm5b data loggers (Decagon Devices, Inc.) and recordingdata at 10min intervals. For each read-out period, initial soilmoisture content (‘Sm’) was calculated as the soil moistureat the start of the largest rainfall event during that 1- to 2-weekly period by using the data of the automatic rainfallgage to identify this event.
Data Analysis
For the statistical analyses described in the succeeding text,runoff volumes and (specific) soil losses were fourth-roottransformed so that the residuals did not fail the assumptionof normality according to the Kolmogorov–Smirnov test atα≤ 0·05, whereas runoff coefficients were square-roottransformed for the same reason. Furthermore, 16 read-outswith low rainfall amounts (less than 6mm) had to beremoved from the data set to prevent non-normality of theresiduals.The effects of hydromulching, plot size, and time-since-
hydromulching on the dependent variables (runoff volume,runoff coefficient, soil losses, specific soil losses, andorganic matter content of the eroded sediments) wereassessed by means of a three-way repeated measures analy-sis of variance (ANOVA) (Ott & Longnecker, 2001). Thevariance–covariance structure of each dependent variablewas selected according to the lowest values of the Akaikeinformation criterion and the restricted maximum likelihood(REML) fit (Littell et al., 2006). The heterogeneous first-order auto-regressive variance–covariance structure wasselected for all dependent variables except runoff coefficient,for which a spatial power structure was selected. In addition,specific contrasts between the treated and control plots, foreach individual read-out as well as between the three plotsizes, were tested by means of the least squares means andadjusted by the Tukey–Kramer method (Kramer, 1956).Repeated measures ANOVA was also used to test the treat-ment and time effects on the seven ground cover categoriesand the initial soil moisture content. In the case of soilresistance and SWR frequency, however, the treatment effect
Logg
ing
H
m
Fire
Pre-trt609 mm
Post-yr1282 mm
Post-yr21464 mm
0
50
100
150
200
250
300
Aug
-08
Sep
-08
Oct
-08
Nov
-08
Dec
-08
Jan-
09F
eb-0
9M
ar-0
9A
pr-0
9M
ay-0
9Ju
n-09
Jul-0
9A
ug-0
9S
ep-0
9O
ct-0
9N
ov-0
9D
ec-0
9Ja
n-10
Feb
-10
Mar
-10
Apr
-10
Rai
nfal
l am
ount
(m
m)
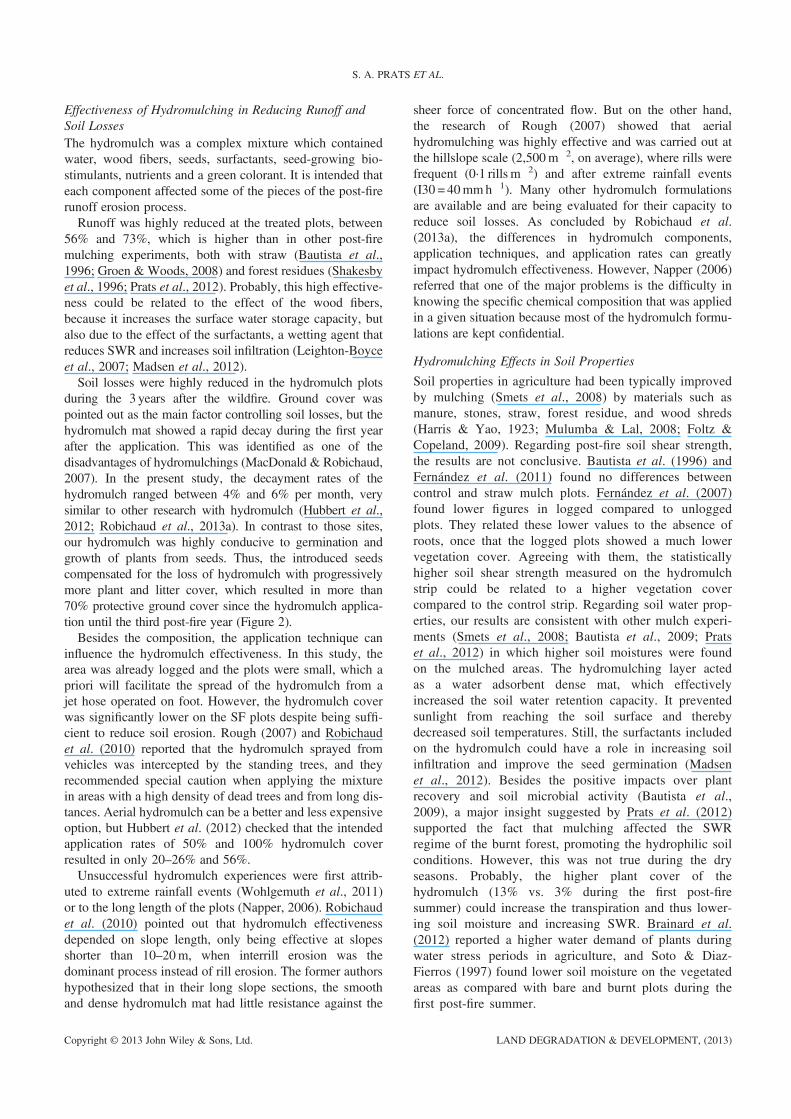
Figure 1. Monthly rainfall (mm) and maximum monthly 30-min rainfall intensity ointensity data were collected. Arrows indicate the date of the fire,
Copyright © 2013 John Wiley & Sons, Ltd.
could only be tested using a nonparametric test, that is, theMann–Whitney U-test (α≤ 0·05).Stepwise multiple linear regressions using the REG
procedure in SAS (Littell et al., 1996) were used to determinehow well the weekly runoff volumes (n = 35) and themonthly soil losses (n= 17) could be explained by a set ofindependent variables. These variables were selectedsequentially in a forward selection procedure, in order ofdecreasing significance by using a minimum p value of0·05. The 16 independent variables were plot size (‘Plotsz’),rainfall amount (‘Rain’), 30-min maximum rainfall intensity(‘I30’), days since the last rainy day (‘Drain’), the sevenindividual (‘Stone’, ‘Bare’, ‘Ash‘, ‘Litter‘, ‘Hm’, ‘Natveg’,and ‘Introveg’), the two lumped categories (‘Tveg’ and‘Hlv’), soil shear strength (‘Storv’), SWR frequency, andinitial soil moisture content (‘Sm’). Especially because thevarious cover categories can be expected to reveal strongcorrelations, collinearly tests were included in the stepwiseprocedure, removing independent variables with a conditionindex higher than 30 (Belsley et al. 1980) from the regres-sion models.
RESULTS
Rainfall Amount and Intensity
Rainfall was considerably lower during the first year afterthe wildfire (1,014mm) than during the two subsequentyears (1,464 and 1,527mm, respectively; Table II). Eventhough this study did not commence until 8 December2008 and had to be interrupted, because of the salvagelogging, during March 2009, the present analysis coveredalmost 90% of the rainfall during the first post-fire year(891mm; Figure 1). From these 891mm, 609mm fell beforethe logging and the hydromulch application (designated hereas ‘pretreatment period’), and 282 were measured until theend of post-fire year 1. The highest rainfall amounts weremeasured during winter, in January 2009 and 2010 with244 and 262mm, respectively. The highest rainfall intensi-ties, however, occurred during different times of the first
Post-yr31527 mm
0
5
10
15
20
25
30
35
40
May
-10
Jun-
10Ju
l-10
Aug
-10
Sep
-10
Oct
-10
Nov
-10
Dec
-10
Jan-
11F
eb-1
1M
ar-1
1A
pr-1
1M
ay-1
1Ju
n-11
Jul-1
1A
ug-1
1S
ep-1
1O
ct-1
1N
ov-1
1
I30_
max
(m
m h
-1)
ver the study period. Black columns represent total rainfall where no rainfalllogging, and the hydromulch application (Hm), respectively.
LAND DEGRADATION & DEVELOPMENT, (2013)
S. A. PRATS ET AL.
post-fire year, during May 2009 and September 2009 withmaximum I30 of 29mmh�1 and 21mmh�1. During thesecond post-fire year, I30s of 15mmh�1 occurred at leastonce a month from October 2009 to April 2010.
Ground Cover
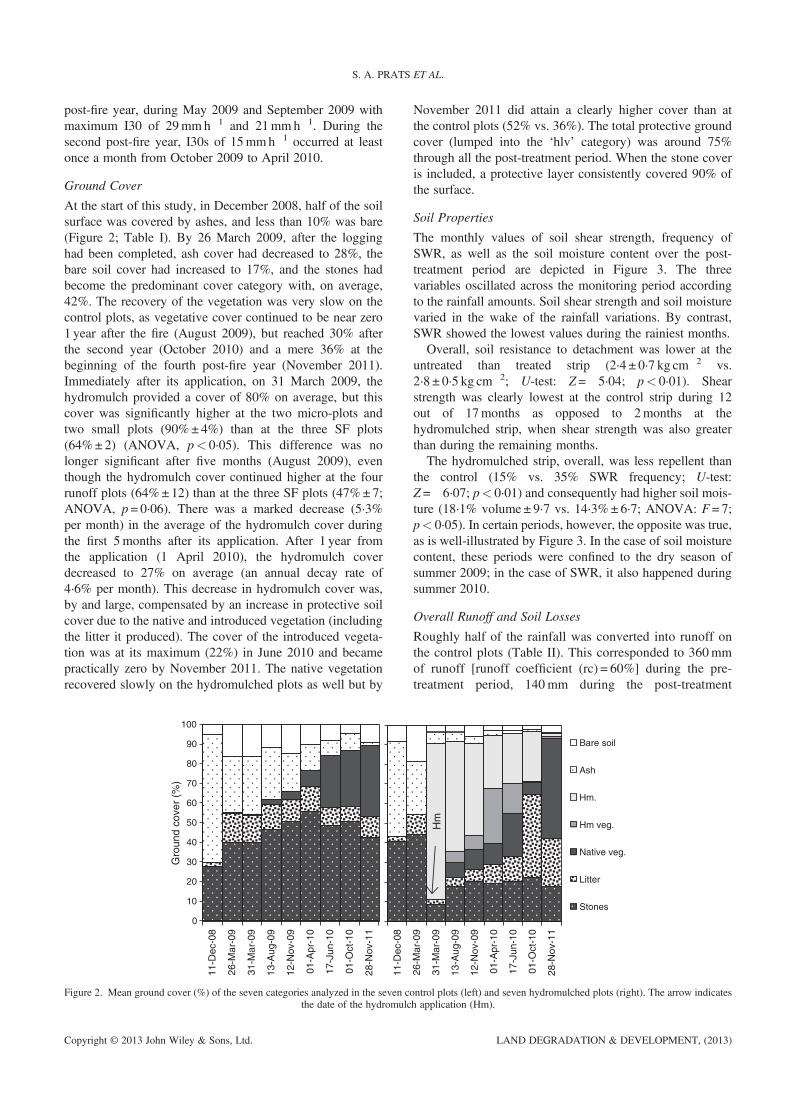
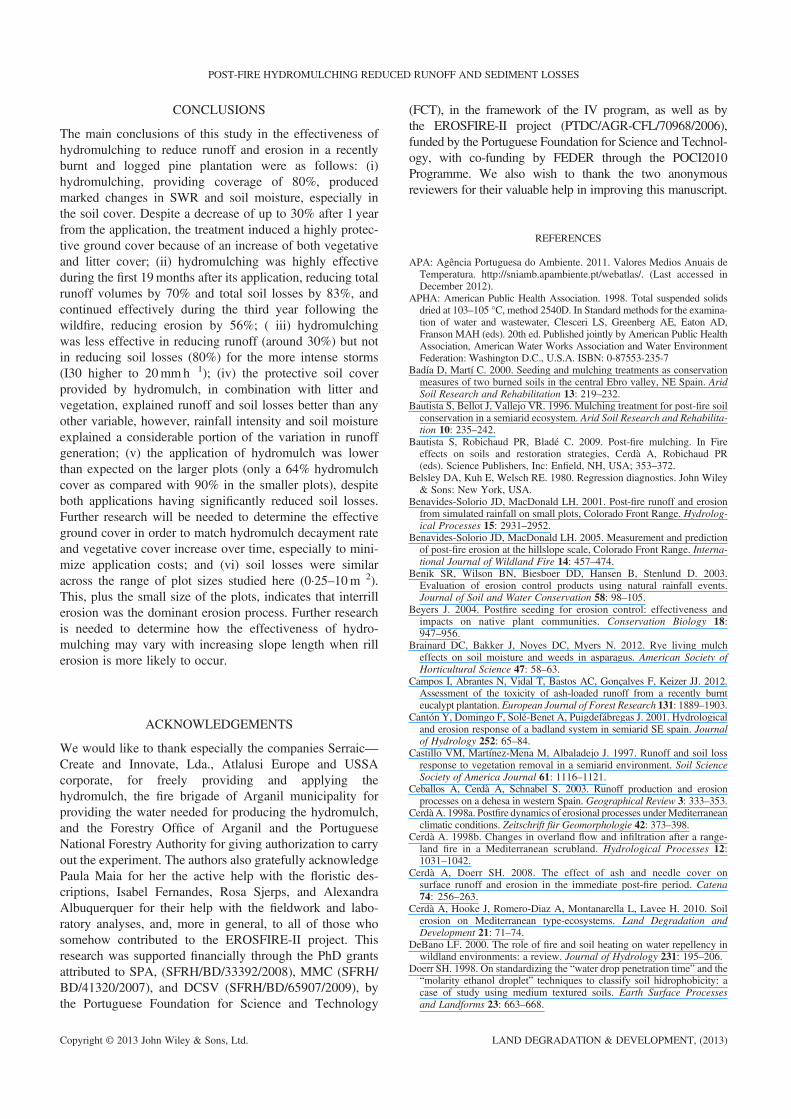
At the start of this study, in December 2008, half of the soilsurface was covered by ashes, and less than 10% was bare(Figure 2; Table I). By 26 March 2009, after the logginghad been completed, ash cover had decreased to 28%, thebare soil cover had increased to 17%, and the stones hadbecome the predominant cover category with, on average,42%. The recovery of the vegetation was very slow on thecontrol plots, as vegetative cover continued to be near zero1 year after the fire (August 2009), but reached 30% afterthe second year (October 2010) and a mere 36% at thebeginning of the fourth post-fire year (November 2011).Immediately after its application, on 31 March 2009, thehydromulch provided a cover of 80% on average, but thiscover was significantly higher at the two micro-plots andtwo small plots (90%± 4%) than at the three SF plots(64%± 2) (ANOVA, p< 0·05). This difference was nolonger significant after five months (August 2009), eventhough the hydromulch cover continued higher at the fourrunoff plots (64%± 12) than at the three SF plots (47%± 7;ANOVA, p = 0·06). There was a marked decrease (5·3%per month) in the average of the hydromulch cover duringthe first 5months after its application. After 1 year fromthe application (1 April 2010), the hydromulch coverdecreased to 27% on average (an annual decay rate of4·6% per month). This decrease in hydromulch cover was,by and large, compensated by an increase in protective soilcover due to the native and introduced vegetation (includingthe litter it produced). The cover of the introduced vegeta-tion was at its maximum (22%) in June 2010 and becamepractically zero by November 2011. The native vegetationrecovered slowly on the hydromulched plots as well but by
0
10
20
30
40
50
60
70
80
90
100
11-D
ec-0
8
26-M
ar-0
9
31-M
ar-0
9
13-A
ug-0
9
12-N
ov-0
9
01-A
pr-1
0
17-J
un-1
0
01-O
ct-1
0
28-N
ov-1
1
Gro
und
cove
r (%
)
11-D
ec-0
8
Figure 2. Mean ground cover (%) of the seven categories analyzed in the seven cothe date of the hydromulc
Copyright © 2013 John Wiley & Sons, Ltd.
November 2011 did attain a clearly higher cover than atthe control plots (52% vs. 36%). The total protective groundcover (lumped into the ‘hlv’ category) was around 75%through all the post-treatment period. When the stone coveris included, a protective layer consistently covered 90% ofthe surface.
Soil Properties
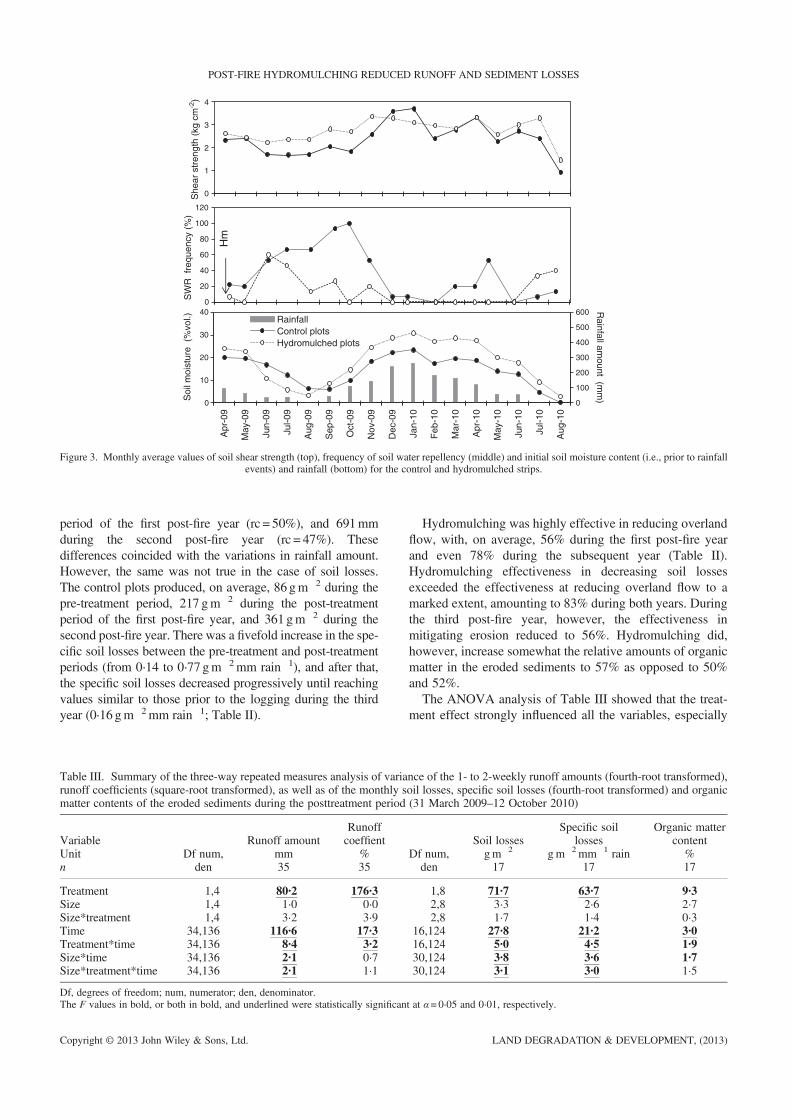
The monthly values of soil shear strength, frequency ofSWR, as well as the soil moisture content over the post-treatment period are depicted in Figure 3. The threevariables oscillated across the monitoring period accordingto the rainfall amounts. Soil shear strength and soil moisturevaried in the wake of the rainfall variations. By contrast,SWR showed the lowest values during the rainiest months.Overall, soil resistance to detachment was lower at the
untreated than treated strip (2·4 ± 0·7 kg cm�2 vs.2·8 ± 0·5 kg cm�2; U-test: Z=�5·04; p< 0·01). Shearstrength was clearly lowest at the control strip during 12out of 17months as opposed to 2months at thehydromulched strip, when shear strength was also greaterthan during the remaining months.The hydromulched strip, overall, was less repellent than
the control (15% vs. 35% SWR frequency; U-test:Z=�6·07; p< 0·01) and consequently had higher soil mois-ture (18·1% volume ± 9·7 vs. 14·3%± 6·7; ANOVA: F= 7;p< 0·05). In certain periods, however, the opposite was true,as is well-illustrated by Figure 3. In the case of soil moisturecontent, these periods were confined to the dry season ofsummer 2009; in the case of SWR, it also happened duringsummer 2010.
Overall Runoff and Soil Losses
Roughly half of the rainfall was converted into runoff onthe control plots (Table II). This corresponded to 360mmof runoff [runoff coefficient (rc) = 60%] during the pre-treatment period, 140mm during the post-treatment
Hm
26-M
ar-0
9
31-M
ar-0
9
13-A
ug-0
9
12-N
ov-0
9
01-A
pr-1
0
17-J
un-1
0
01-O
ct-1
0
28-N
ov-1
1
Bare soil
Ash
Hm.
Hm veg.
Native veg.
Litter
Stones
ntrol plots (left) and seven hydromulched plots (right). The arrow indicatesh application (Hm).
LAND DEGRADATION & DEVELOPMENT, (2013)
0
1
2
3
4
She
ar s
tren
gth
(kg
cm-2
)
0
20
40
60
80
100
120
SW
R f
requ
ency
(%
)
Hm
0
100
200
300
400
500
600
0
10
20
30
40
Apr
-09
May
-09
Jun-
09
Jul-0
9
Aug
-09
Sep
-09
Oct
-09
Nov
-09
Dec
-09
Jan-
10
Feb
-10
Mar
-10
Apr
-10
May
-10
Jun-
10
Jul-1
0
Aug
-10
Rainfall am
ount (mm
)Soi
l moi
stur
e (
%vo
l.) Rainfall Control plotsHydromulched plots
Figure 3. Monthly average values of soil shear strength (top), frequency of soil water repellency (middle) and initial soil moisture content (i.e., prior to rainfallevents) and rainfall (bottom) for the control and hydromulched strips.
POST-FIRE HYDROMULCHING REDUCED RUNOFF AND SEDIMENT LOSSES
period of the first post-fire year (rc = 50%), and 691mmduring the second post-fire year (rc = 47%). Thesedifferences coincided with the variations in rainfall amount.However, the same was not true in the case of soil losses.The control plots produced, on average, 86 gm�2 during thepre-treatment period, 217 gm�2 during the post-treatmentperiod of the first post-fire year, and 361 gm�2 during thesecond post-fire year. There was a fivefold increase in the spe-cific soil losses between the pre-treatment and post-treatmentperiods (from 0·14 to 0·77 gm�2mm rain�1), and after that,the specific soil losses decreased progressively until reachingvalues similar to those prior to the logging during the thirdyear (0·16 gm�2mm rain�1; Table II).
Table III. Summary of the three-way repeated measures analysis of variarunoff coefficients (square-root transformed), as well as of the monthly smatter contents of the eroded sediments during the posttreatment period
VariableDf num,den
Runoff amountRunoffcoeffient
Unit mm %n 35 35
Treatment 1,4 80·2 176·3Size 1,4 1·0 0·0Size*treatment 1,4 3·2 3·9Time 34,136 116·6 17·3Treatment*time 34,136 8·4 3·2Size*time 34,136 2·1 0·7Size*treatment*time 34,136 2·1 1·1
Df, degrees of freedom; num, numerator; den, denominator.The F values in bold, or both in bold, and underlined were statistically significan
Copyright © 2013 John Wiley & Sons, Ltd.
Hydromulching was highly effective in reducing overlandflow, with, on average, 56% during the first post-fire yearand even 78% during the subsequent year (Table II).Hydromulching effectiveness in decreasing soil lossesexceeded the effectiveness at reducing overland flow to amarked extent, amounting to 83% during both years. Duringthe third post-fire year, however, the effectiveness inmitigating erosion reduced to 56%. Hydromulching did,however, increase somewhat the relative amounts of organicmatter in the eroded sediments to 57% as opposed to 50%and 52%.The ANOVA analysis of Table III showed that the treat-
ment effect strongly influenced all the variables, especially
nce of the 1- to 2-weekly runoff amounts (fourth-root transformed),oil losses, specific soil losses (fourth-root transformed) and organic(31 March 2009–12 October 2010)
Df num,den
Soil lossesSpecific soil
lossesOrganic matter
contentgm�2 gm�2mm�1 rain %17 17 17
1,8 71·7 63·7 9·32,8 3·3 2·6 2·72,8 1·7 1·4 0·3
16,124 27·8 21·2 3·016,124 5·0 4·5 1·930,124 3·8 3·6 1·730,124 3·1 3·0 1·5
t at α= 0·05 and 0·01, respectively.
LAND DEGRADATION & DEVELOPMENT, (2013)

S. A. PRATS ET AL.
in the case of runoff coefficient (F value of 176) and lessimportant in the case of the organic matter content (F= 9).The strong treatment effect, especially in the case of runoffcoefficient as highlighted by the big F value (176),contrasted with the lack of effect of the plot size.In Figure 4 it can be observed that the differences in
runoff between plot sizes were very low (in the order of12–20%, for micro-plots and small plots, respectively).The runoff on the control plots decreased with increasingplot size mainly because of the low runoff amount of oneof the small plots (684mm), whereas the same was truebut in the opposite sense in the case of one smallhydromulched plot (309mm). These opposite tendenciesresulted in a higher hydrological effectiveness ofhydromulching for the micro-plots compared with the smallplots (on average, 80% vs. 68%). Plot size also did not playa clear-cut role in soil losses, but the variance increased,especially in the case of the control SF plots (up to 70%).Consequently, the overall reduction in soil losses on themicro-plots and small plots was somewhat higher comparedwith the SF plots (90%, 89%, and 76%, respectively).
Temporal Patterns in Overland Flow and Soil Losses
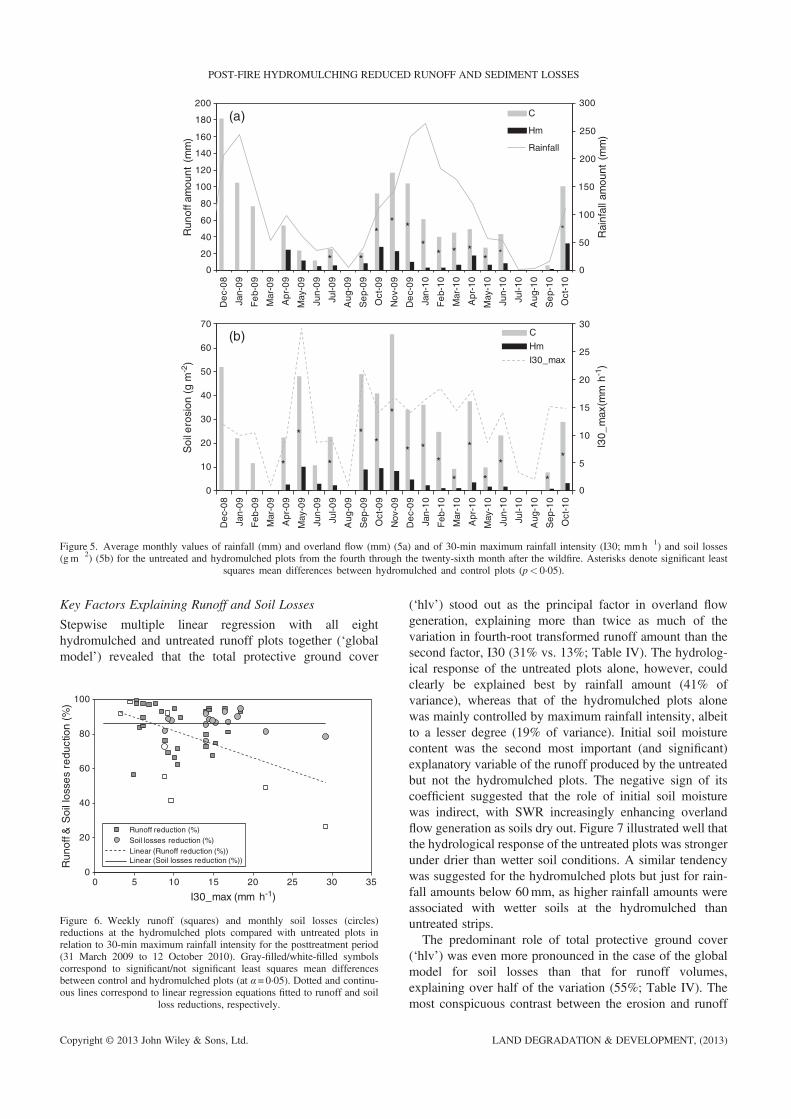
The average monthly runoff amounts produced by theuntreated plots revealed a marked seasonal pattern in whichpeak runoff values appeared to antecede the maximummonthly rainfall values during the winter season (Figure 5a).As a result, runoff coefficients were highest during theautumn months, varying between about 80% to 90% inDecember 2008, November 2009, and October 2010. Highrunoff coefficients were also observed during late springand early summer, when rainfall amounts were compara-tively small (<53mm), attaining 62% in July 2009 and81% in June 2010. The average monthly soil losses at theuntreated plots revealed a less obvious temporal pattern(Figure 5b). The four peak losses of 50 gm�2month�1 ormore occurred during autumn (December 2008, Septemberand November 2009) and spring (May 2009). Apparently,the latter peak was associated with the elevated maximumrainfall intensity (I30 = 29mmh�1), whereas the December2008 and November 2009 ones were rather related to runoff
0
200
400
600
800
1000
0.1 1.0 10.0
Run
off a
mou
nt (
mm
)
Plot surface (m2)
runoff Crunoff Hm
-2
Figure 4. Total overland flow (mm) and total soil losses (gm�2) of the individuposttreatment period (31 March
Copyright © 2013 John Wiley & Sons, Ltd.
peaks. The average specific soil losses suggested a contrastbetween the two months with the highest maximum rainfallintensities—that is, May and September 2009—and theremaining months. The specific losses during these twomonths amounted to 0·8 and 1·2 gm�2mm rain�1, respec-tively, as opposed to the baseline monthly average of0·25 gm�2mm rain�1 for the rest of the study period.The hydromulched plots produced, on average, consis-
tently lower amounts of monthly runoff as well as monthlysoil losses than the untreated plots (Figure 5a and 5b). Inthe case of runoff, these monthly differences were statisticallysignificant from July 2009 onwards, with the exception of thesummer 2009 and 2010 months with little to no rainfall. In thecase of soil losses, however, the monthly differences werealso statistically significant for the first 2months followinghydromulching and, thus, for basically all of the 19monthswith noticeable rainfall. Even so, the three-way ANOVAresults indicated that hydromulching did not have an unequiv-ocal statistically significant effect on monthly soil losses, asthe triple interaction term of treatment x time-since-mulchingx plot size was statistically significant (Table III). The sameapplied to the corresponding specific soil losses as well asto the 1- to 2-weekly runoff volumes and mutatis mutandis(i.e., because of a significant treatment x time-since-mulchinginteraction) to the runoff coefficients and the organic mattercontent of the eroded sediments.Hydromulching failed to produce significant reductions in
overland flow generation (average 1- to 2-weekly values)across the whole range of maximum rainfall intensities(Figure 6). There was, however, a tendency for the hydrolog-ical effectiveness of hydromulching to decrease with maxi-mum rainfall intensity, reflecting first and foremost thecomparatively low effectiveness (<50%) for the two moreintense measurement periods that happened in May andSeptember 2009. Also, the effectiveness of hydromulchingto reduce average monthly soil losses was comparativelylow for these two highest maximum rainfall intensities, albeitit still amounted to some 80% and corresponded to a statisti-cally significant difference between the hydromulched anduntreated plots. In overall terms, however, the reduction in soillosses lacked an obvious relationship with rainfall intensity.
0
200
400
600
800
1000
0.1 1.0 10.0
Soi
l ero
sion
(g
m)
Plot surface (m2)
soil erosion Csoil erosion Hm
al untreated and hydromulched plots over the first and second year of the2009 to 12 October 2010).
LAND DEGRADATION & DEVELOPMENT, (2013)
* *
** *
** * *
**
*
0
50
100
150
200
250
300
0
20
40
60
80
100
120
140
160
180
200
De
c-0
8
Jan-
09
Fe
b-0
9
Mar
-09
Apr
-09
May
-09
Jun-
09
Jul-0
9
Aug
-09
Se
p-0
9
Oct
-09
Nov
-09
De
c-0
9
Jan-
10
Fe
b-1
0
Mar
-10
Apr
-10
May
-10
Jun-
10
Jul-1
0
Aug
-10
Se
p-1
0
Oct
-10
De
c-0
8
Jan-
09
Fe
b-0
9
Mar
-09
Apr
-09
May
-09
Jun-
09
Jul-0
9
Aug
-09
Se
p-0
9
Oct
-09
Nov
-09
De
c-0
9
Jan-
10
Fe
b-1
0
Mar
-10
Apr
-10
May
-10
Jun-
10
Jul-1
0
Aug
-10
Se
p-1
0
Oct
-10
Rai
nfal
l am
ount
(m
m)
Run
off a
mou
nt (
mm
)
(a) C
Hm
Rainfall
*
*
*
**
*
* **
*
*
**
*
*
0
5
10
15
20
25
30
0
10
20
30
40
50
60
70
I30
_m
ax(m
m h
-1)
(b) C
Hm
I30_max
Soi
l ero
sion
(g
m-2
)
Figure 5. Average monthly values of rainfall (mm) and overland flow (mm) (5a) and of 30-min maximum rainfall intensity (I30; mmh�1) and soil losses(gm�2) (5b) for the untreated and hydromulched plots from the fourth through the twenty-sixth month after the wildfire. Asterisks denote significant least
squares mean differences between hydromulched and control plots (p< 0·05).
POST-FIRE HYDROMULCHING REDUCED RUNOFF AND SEDIMENT LOSSES
Key Factors Explaining Runoff and Soil Losses
Stepwise multiple linear regression with all eighthydromulched and untreated runoff plots together (‘globalmodel’) revealed that the total protective ground cover
0
20
40
60
80
100
0 5 10 15 20 25 30 35
Run
off &
Soi
l los
ses
redu
ctio
n (%
)
I30_max (mm h-1)
Runoff reduction (%)Soil losses reduction (%)Linear (Runoff reduction (%))Linear (Soil losses reduction (%))
Figure 6. Weekly runoff (squares) and monthly soil losses (circles)reductions at the hydromulched plots compared with untreated plots inrelation to 30-min maximum rainfall intensity for the posttreatment period(31 March 2009 to 12 October 2010). Gray-filled/white-filled symbolscorrespond to significant/not significant least squares mean differencesbetween control and hydromulched plots (at α= 0·05). Dotted and continu-ous lines correspond to linear regression equations fitted to runoff and soil
loss reductions, respectively.
Copyright © 2013 John Wiley & Sons, Ltd.
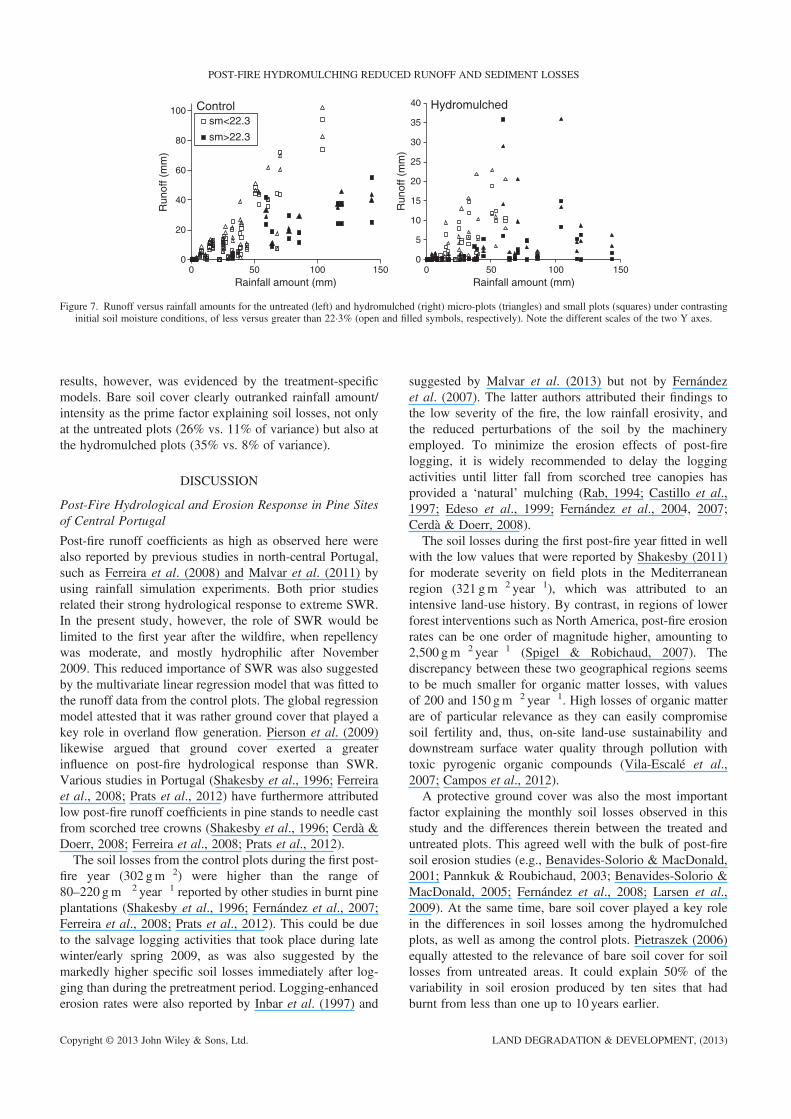
(‘hlv’) stood out as the principal factor in overland flowgeneration, explaining more than twice as much of thevariation in fourth-root transformed runoff amount than thesecond factor, I30 (31% vs. 13%; Table IV). The hydrolog-ical response of the untreated plots alone, however, couldclearly be explained best by rainfall amount (41% ofvariance), whereas that of the hydromulched plots alonewas mainly controlled by maximum rainfall intensity, albeitto a lesser degree (19% of variance). Initial soil moisturecontent was the second most important (and significant)explanatory variable of the runoff produced by the untreatedbut not the hydromulched plots. The negative sign of itscoefficient suggested that the role of initial soil moisturewas indirect, with SWR increasingly enhancing overlandflow generation as soils dry out. Figure 7 illustrated well thatthe hydrological response of the untreated plots was strongerunder drier than wetter soil conditions. A similar tendencywas suggested for the hydromulched plots but just for rain-fall amounts below 60mm, as higher rainfall amounts wereassociated with wetter soils at the hydromulched thanuntreated strips.The predominant role of total protective ground cover
(‘hlv’) was even more pronounced in the case of the globalmodel for soil losses than that for runoff volumes,explaining over half of the variation (55%; Table IV). Themost conspicuous contrast between the erosion and runoff
LAND DEGRADATION & DEVELOPMENT, (2013)

Table
IV.Multip
leregression
modelsfor1-
to2-weeklyrunoff
amounts(n=35)andmonthly
soillosses
(n=17)forallplotstogether
(‘Global’)andfortheuntreated(‘Control’)
and
hydrom
ulched
plotsseparately
Selectedvariable
Globalmodels
Control
models
Hydromulchingmodels
Param
eter
estim
ate
Variable
name
Partial
r2Param
eter
estim
ate
Variable
name
Partial
r2Param
eter
estim
ate
Variable
name
Partial
r2
Runoffam
ount
(mm;4throot
transformed)
Intercept
1·86
1·97
0·40
1stvariable
�0·01
Hlv
0·31
0·01
Rain
0·41
0·05
I30
0·19
2ndvariable
0·02
I30
0·13
�0·03
Sm
0·11
0·01
Hm
0·05
3rdvariable
�0·02
Sm
0·06
�0·01
Tveg
0·03
4thvariable
0·01
Rain
0·03
Cum
ulativer2
0·53
0·54
0·24
Soillosses
(gm
�2;
4throot
transformed)
Intercept
1·65
1·58
0·76
1stvariable
�0·01
Hlv
0·55
0·03
Bare
0·26
0·08
Bare
0·35
2ndvariable
0·03
Bare
0·07
0·03
I30
0·11
0·02
I30
0·08
3rdvariable
0·03
I30
0·05
�0·01
Hlv
0·06
Cum
ulativer2
0·68
0·43
0·43
The
independentv
ariables
selected
(statistically
significant
atα=0·05)were:Rain,rainfallam
ount;I30,30-minrainfallintensity
,totalprotectiv
eground
cover;Hlv,the
sum
ofhydrom
ulch,litter,and
vegetatio
ncover;
Hm,hydrom
ulch
cover;Tveg,
totalvegetatio
ncover;Bare,bare
soilcover;Sm,initialsoilmoisture.
S. A. PRATS ET AL.
Copyright © 2013 John Wiley & Sons, Ltd. LAND DEGRADATION & DEVELOPMENT, (2013)
0
5
10
15
20
25
30
35
40
0 50 100 150
Run
off (
mm
)
Rainfall amount (mm)
Hydromulched
0
20
40
60
80
100
0 50 100 150
Run
off (
mm
)
Rainfall amount (mm)
Controlsm<22.3
sm>22.3
Figure 7. Runoff versus rainfall amounts for the untreated (left) and hydromulched (right) micro-plots (triangles) and small plots (squares) under contrastinginitial soil moisture conditions, of less versus greater than 22·3% (open and filled symbols, respectively). Note the different scales of the two Y axes.
POST-FIRE HYDROMULCHING REDUCED RUNOFF AND SEDIMENT LOSSES
results, however, was evidenced by the treatment-specificmodels. Bare soil cover clearly outranked rainfall amount/intensity as the prime factor explaining soil losses, not onlyat the untreated plots (26% vs. 11% of variance) but also atthe hydromulched plots (35% vs. 8% of variance).
DISCUSSION
Post-Fire Hydrological and Erosion Response in Pine Sitesof Central Portugal
Post-fire runoff coefficients as high as observed here werealso reported by previous studies in north-central Portugal,such as Ferreira et al. (2008) and Malvar et al. (2011) byusing rainfall simulation experiments. Both prior studiesrelated their strong hydrological response to extreme SWR.In the present study, however, the role of SWR would belimited to the first year after the wildfire, when repellencywas moderate, and mostly hydrophilic after November2009. This reduced importance of SWR was also suggestedby the multivariate linear regression model that was fitted tothe runoff data from the control plots. The global regressionmodel attested that it was rather ground cover that played akey role in overland flow generation. Pierson et al. (2009)likewise argued that ground cover exerted a greaterinfluence on post-fire hydrological response than SWR.Various studies in Portugal (Shakesby et al., 1996; Ferreiraet al., 2008; Prats et al., 2012) have furthermore attributedlow post-fire runoff coefficients in pine stands to needle castfrom scorched tree crowns (Shakesby et al., 1996; Cerdà &Doerr, 2008; Ferreira et al., 2008; Prats et al., 2012).The soil losses from the control plots during the first post-
fire year (302 gm�2) were higher than the range of80–220 gm �2 year�1 reported by other studies in burnt pineplantations (Shakesby et al., 1996; Fernández et al., 2007;Ferreira et al., 2008; Prats et al., 2012). This could be dueto the salvage logging activities that took place during latewinter/early spring 2009, as was also suggested by themarkedly higher specific soil losses immediately after log-ging than during the pretreatment period. Logging-enhancederosion rates were also reported by Inbar et al. (1997) and
Copyright © 2013 John Wiley & Sons, Ltd.
suggested by Malvar et al. (2013) but not by Fernándezet al. (2007). The latter authors attributed their findings tothe low severity of the fire, the low rainfall erosivity, andthe reduced perturbations of the soil by the machineryemployed. To minimize the erosion effects of post-firelogging, it is widely recommended to delay the loggingactivities until litter fall from scorched tree canopies hasprovided a ‘natural’ mulching (Rab, 1994; Castillo et al.,1997; Edeso et al., 1999; Fernández et al., 2004, 2007;Cerdà & Doerr, 2008).The soil losses during the first post-fire year fitted in well
with the low values that were reported by Shakesby (2011)for moderate severity on field plots in the Mediterraneanregion (321 gm�2 year�1), which was attributed to anintensive land-use history. By contrast, in regions of lowerforest interventions such as North America, post-fire erosionrates can be one order of magnitude higher, amounting to2,500 gm�2 year�1 (Spigel & Robichaud, 2007). Thediscrepancy between these two geographical regions seemsto be much smaller for organic matter losses, with valuesof 200 and 150 gm�2 year�1. High losses of organic matterare of particular relevance as they can easily compromisesoil fertility and, thus, on-site land-use sustainability anddownstream surface water quality through pollution withtoxic pyrogenic organic compounds (Vila-Escalé et al.,2007; Campos et al., 2012).A protective ground cover was also the most important
factor explaining the monthly soil losses observed in thisstudy and the differences therein between the treated anduntreated plots. This agreed well with the bulk of post-firesoil erosion studies (e.g., Benavides-Solorio & MacDonald,2001; Pannkuk & Roubichaud, 2003; Benavides-Solorio &MacDonald, 2005; Fernández et al., 2008; Larsen et al.,2009). At the same time, bare soil cover played a key rolein the differences in soil losses among the hydromulchedplots, as well as among the control plots. Pietraszek (2006)equally attested to the relevance of bare soil cover for soillosses from untreated areas. It could explain 50% of thevariability in soil erosion produced by ten sites that hadburnt from less than one up to 10 years earlier.
LAND DEGRADATION & DEVELOPMENT, (2013)
S. A. PRATS ET AL.
Effectiveness of Hydromulching in Reducing Runoff andSoil LossesThe hydromulch was a complex mixture which containedwater, wood fibers, seeds, surfactants, seed-growing bio-stimulants, nutrients and a green colorant. It is intended thateach component affected some of the pieces of the post-firerunoff erosion process.Runoff was highly reduced at the treated plots, between
56% and 73%, which is higher than in other post-firemulching experiments, both with straw (Bautista et al.,1996; Groen & Woods, 2008) and forest residues (Shakesbyet al., 1996; Prats et al., 2012). Probably, this high effective-ness could be related to the effect of the wood fibers,because it increases the surface water storage capacity, butalso due to the effect of the surfactants, a wetting agent thatreduces SWR and increases soil infiltration (Leighton-Boyceet al., 2007; Madsen et al., 2012).Soil losses were highly reduced in the hydromulch plots
during the 3 years after the wildfire. Ground cover waspointed out as the main factor controlling soil losses, but thehydromulch mat showed a rapid decay during the first yearafter the application. This was identified as one of thedisadvantages of hydromulchings (MacDonald & Robichaud,2007). In the present study, the decayment rates of thehydromulch ranged between 4% and 6% per month, verysimilar to other research with hydromulch (Hubbert et al.,2012; Robichaud et al., 2013a). In contrast to those sites,our hydromulch was highly conducive to germination andgrowth of plants from seeds. Thus, the introduced seedscompensated for the loss of hydromulch with progressivelymore plant and litter cover, which resulted in more than70% protective ground cover since the hydromulch applica-tion until the third post-fire year (Figure 2).Besides the composition, the application technique can
influence the hydromulch effectiveness. In this study, thearea was already logged and the plots were small, which apriori will facilitate the spread of the hydromulch from ajet hose operated on foot. However, the hydromulch coverwas significantly lower on the SF plots despite being suffi-cient to reduce soil erosion. Rough (2007) and Robichaudet al. (2010) reported that the hydromulch sprayed fromvehicles was intercepted by the standing trees, and theyrecommended special caution when applying the mixturein areas with a high density of dead trees and from long dis-tances. Aerial hydromulch can be a better and less expensiveoption, but Hubbert et al. (2012) checked that the intendedapplication rates of 50% and 100% hydromulch coverresulted in only 20–26% and 56%.Unsuccessful hydromulch experiences were first attrib-
uted to extreme rainfall events (Wohlgemuth et al., 2011)or to the long length of the plots (Napper, 2006). Robichaudet al. (2010) pointed out that hydromulch effectivenessdepended on slope length, only being effective at slopesshorter than 10–20m, when interrill erosion was thedominant process instead of rill erosion. The former authorshypothesized that in their long slope sections, the smoothand dense hydromulch mat had little resistance against the
Copyright © 2013 John Wiley & Sons, Ltd.
sheer force of concentrated flow. But on the other hand,the research of Rough (2007) showed that aerialhydromulching was highly effective and was carried out atthe hillslope scale (2,500m�2, on average), where rills werefrequent (0·1 rills m�2) and after extreme rainfall events(I30 = 40mmh�1). Many other hydromulch formulationsare available and are being evaluated for their capacity toreduce soil losses. As concluded by Robichaud et al.(2013a), the differences in hydromulch components,application techniques, and application rates can greatlyimpact hydromulch effectiveness. However, Napper (2006)referred that one of the major problems is the difficulty inknowing the specific chemical composition that was appliedin a given situation because most of the hydromulch formu-lations are kept confidential.
Hydromulching Effects in Soil Properties
Soil properties in agriculture had been typically improvedby mulching (Smets et al., 2008) by materials such asmanure, stones, straw, forest residue, and wood shreds(Harris & Yao, 1923; Mulumba & Lal, 2008; Foltz &Copeland, 2009). Regarding post-fire soil shear strength,the results are not conclusive. Bautista et al. (1996) andFernández et al. (2011) found no differences betweencontrol and straw mulch plots. Fernández et al. (2007)found lower figures in logged compared to unloggedplots. They related these lower values to the absence ofroots, once that the logged plots showed a much lowervegetation cover. Agreeing with them, the statisticallyhigher soil shear strength measured on the hydromulchstrip could be related to a higher vegetation covercompared to the control strip. Regarding soil water prop-erties, our results are consistent with other mulch experi-ments (Smets et al., 2008; Bautista et al., 2009; Pratset al., 2012) in which higher soil moistures were foundon the mulched areas. The hydromulching layer actedas a water adsorbent dense mat, which effectivelyincreased the soil water retention capacity. It preventedsunlight from reaching the soil surface and therebydecreased soil temperatures. Still, the surfactants includedon the hydromulch could have a role in increasing soilinfiltration and improve the seed germination (Madsenet al., 2012). Besides the positive impacts over plantrecovery and soil microbial activity (Bautista et al.,2009), a major insight suggested by Prats et al. (2012)supported the fact that mulching affected the SWRregime of the burnt forest, promoting the hydrophilic soilconditions. However, this was not true during the dryseasons. Probably, the higher plant cover of thehydromulch (13% vs. 3% during the first post-firesummer) could increase the transpiration and thus lower-ing soil moisture and increasing SWR. Brainard et al.(2012) reported a higher water demand of plants duringwater stress periods in agriculture, and Soto & Diaz-Fierros (1997) found lower soil moisture on the vegetatedareas as compared with bare and burnt plots during thefirst post-fire summer.
LAND DEGRADATION & DEVELOPMENT, (2013)
POST-FIRE HYDROMULCHING REDUCED RUNOFF AND SEDIMENT LOSSES
CONCLUSIONS
The main conclusions of this study in the effectiveness ofhydromulching to reduce runoff and erosion in a recentlyburnt and logged pine plantation were as follows: (i)hydromulching, providing coverage of 80%, producedmarked changes in SWR and soil moisture, especially inthe soil cover. Despite a decrease of up to 30% after 1 yearfrom the application, the treatment induced a highly protec-tive ground cover because of an increase of both vegetativeand litter cover; (ii) hydromulching was highly effectiveduring the first 19months after its application, reducing totalrunoff volumes by 70% and total soil losses by 83%, andcontinued effectively during the third year following thewildfire, reducing erosion by 56%; ( iii) hydromulchingwas less effective in reducing runoff (around 30%) but notin reducing soil losses (80%) for the more intense storms(I30 higher to 20mmh�1); (iv) the protective soil coverprovided by hydromulch, in combination with litter andvegetation, explained runoff and soil losses better than anyother variable, however, rainfall intensity and soil moistureexplained a considerable portion of the variation in runoffgeneration; (v) the application of hydromulch was lowerthan expected on the larger plots (only a 64% hydromulchcover as compared with 90% in the smaller plots), despiteboth applications having significantly reduced soil losses.Further research will be needed to determine the effectiveground cover in order to match hydromulch decayment rateand vegetative cover increase over time, especially to mini-mize application costs; and (vi) soil losses were similaracross the range of plot sizes studied here (0·25–10m 2).This, plus the small size of the plots, indicates that interrillerosion was the dominant erosion process. Further researchis needed to determine how the effectiveness of hydro-mulching may vary with increasing slope length when rillerosion is more likely to occur.
ACKNOWLEDGEMENTS
We would like to thank especially the companies Serraic—Create and Innovate, Lda., Atlalusi Europe and USSAcorporate, for freely providing and applying thehydromulch, the fire brigade of Arganil municipality forproviding the water needed for producing the hydromulch,and the Forestry Office of Arganil and the PortugueseNational Forestry Authority for giving authorization to carryout the experiment. The authors also gratefully acknowledgePaula Maia for her the active help with the floristic des-criptions, Isabel Fernandes, Rosa Sjerps, and AlexandraAlbuquerquer for their help with the fieldwork and labo-ratory analyses, and, more in general, to all of those whosomehow contributed to the EROSFIRE-II project. Thisresearch was supported financially through the PhD grantsattributed to SPA, (SFRH/BD/33392/2008), MMC (SFRH/BD/41320/2007), and DCSV (SFRH/BD/65907/2009), bythe Portuguese Foundation for Science and Technology
Copyright © 2013 John Wiley & Sons, Ltd.
(FCT), in the framework of the IV program, as well as bythe EROSFIRE-II project (PTDC/AGR-CFL/70968/2006),funded by the Portuguese Foundation for Science and Technol-ogy, with co-funding by FEDER through the POCI2010Programme. We also wish to thank the two anonymousreviewers for their valuable help in improving this manuscript.
REFERENCES
APA: Agência Portuguesa do Ambiente. 2011. Valores Medios Anuais deTemperatura. http://sniamb.apambiente.pt/webatlas/. (Last accessed inDecember 2012).
APHA: American Public Health Association. 1998. Total suspended solidsdried at 103–105 °C, method 2540D. In Standard methods for the examina-tion of water and wastewater, Clesceri LS, Greenberg AE, Eaton AD,Franson MAH (eds). 20th ed. Published jointly by American Public HealthAssociation, American Water Works Association and Water EnvironmentFederation: Washington D.C., U.S.A. ISBN: 0-87553-235-7
Badía D, Martí C. 2000. Seeding and mulching treatments as conservationmeasures of two burned soils in the central Ebro valley, NE Spain. AridSoil Research and Rehabilitation 13: 219–232.
Bautista S, Bellot J, Vallejo VR. 1996. Mulching treatment for post-fire soilconservation in a semiarid ecosystem. Arid Soil Research and Rehabilita-tion 10: 235–242.
Bautista S, Robichaud PR, Bladé C. 2009. Post-fire mulching. In Fireeffects on soils and restoration strategies, Cerdà A, Robichaud PR(eds). Science Publishers, Inc: Enfield, NH, USA; 353–372.
Belsley DA, Kuh E, Welsch RE. 1980. Regression diagnostics. John Wiley& Sons: New York, USA.
Benavides-Solorio JD, MacDonald LH. 2001. Post-fire runoff and erosionfrom simulated rainfall on small plots, Colorado Front Range. Hydrolog-ical Processes 15: 2931–2952.
Benavides-Solorio JD, MacDonald LH. 2005. Measurement and predictionof post-fire erosion at the hillslope scale, Colorado Front Range. Interna-tional Journal of Wildland Fire 14: 457–474.
Benik SR, Wilson BN, Biesboer DD, Hansen B, Stenlund D. 2003.Evaluation of erosion control products using natural rainfall events.Journal of Soil and Water Conservation 58: 98–105.
Beyers J. 2004. Postfire seeding for erosion control: effectiveness andimpacts on native plant communities. Conservation Biology 18:947–956.
Brainard DC, Bakker J, Noyes DC, Myers N. 2012. Rye living mulcheffects on soil moisture and weeds in asparagus. American Society ofHorticultural Science 47: 58–63.
Campos I, Abrantes N, Vidal T, Bastos AC, Gonçalves F, Keizer JJ. 2012.Assessment of the toxicity of ash-loaded runoff from a recently burnteucalypt plantation. European Journal of Forest Research 131: 1889–1903.
Cantón Y, Domingo F, Solé-Benet A, Puigdefábregas J. 2001. Hydrologicaland erosion response of a badland system in semiarid SE spain. Journalof Hydrology 252: 65–84.
Castillo VM, Martínez-Mena M, Albaladejo J. 1997. Runoff and soil lossresponse to vegetation removal in a semiarid environment. Soil ScienceSociety of America Journal 61: 1116–1121.
Ceballos A, Cerdà A, Schnabel S. 2003. Runoff production and erosionprocesses on a dehesa in western Spain. Geographical Review 3: 333–353.
CerdàA. 1998a. Postfire dynamics of erosional processes underMediterraneanclimatic conditions. Zeitschrift für Geomorphologie 42: 373–398.
Cerdà A. 1998b. Changes in overland flow and infiltration after a range-land fire in a Mediterranean scrubland. Hydrological Processes 12:1031–1042.
Cerdà A, Doerr SH. 2008. The effect of ash and needle cover onsurface runoff and erosion in the immediate post-fire period. Catena74: 256–263.
Cerdà A, Hooke J, Romero-Diaz A, Montanarella L, Lavee H. 2010. Soilerosion on Mediterranean type-ecosystems. Land Degradation andDevelopment 21: 71–74.
DeBano LF. 2000. The role of fire and soil heating on water repellency inwildland environments: a review. Journal of Hydrology 231: 195–206.
Doerr SH. 1998. On standardizing the “water drop penetration time” and the“molarity ethanol droplet” techniques to classify soil hidrophobicity: acase of study using medium textured soils. Earth Surface Processesand Landforms 23: 663–668.
LAND DEGRADATION & DEVELOPMENT, (2013)

S. A. PRATS ET AL.
Edeso JM, Merino A, González MJ, Marauri P. 1999. Soil erosion underdifferent harvesting managements in steep forestlands from northernSpain. Land Degradation and Development 10: 79–88.
Emanual DM. 1976. Hydromulch: a potential use for hardwood barkresidue. USDA Forest Service Research Note NE-226.
Fernández C, Vega JA, Gras JM, Fonturbel T, Cuiñas P, Dambrine E,Alonso M. 2004. Soil erosion after Eucalyptus globulus clearcutting: dif-ferences between logging slash disposal treatments. Forest Ecology andManagement 195: 85–95.
Fernández C, Vega JA, Fonturbel MT, Pérez-Gorostiaga P, Jiménez E,Madrigal J. 2007. Effects of wildfire, salvage logging and slashtreatments on soil degradation. Land Degradation and Development 18:591–607.
Fernández C, Vega JA, Fonturbel T, Jiménez E, Pérez JR. 2008. Immediateeffects of prescribed burning, chopping and clearing on runoff,infiltration and erosion in a shrubland area in Galicia (NW Spain). LandDegradation and Development 19: 502–515.
Fernández C, Vega JA, Jiménez E, Fonturbel T. 2011. Effectiveness ofthree post-fire treatments at reducing soil erosion in Galicia (NW Spain).International Journal of Wildland Fire 20: 104–114.
Fernández-Abascal I, Tárrega R, Luis-Calabuig E, Marcos E. 2003. Effectsof sowing native herbaceous species on the post-fire recovery in aheathland. Acta Oecologica 24: 131–138.
Ferreira AJD, Coelho COA, Ritsema CJ, Boulet AK, Keizer JJ. 2008. Soiland water degradation processes in burned areas: lessons learned from anested approach. Catena 74: 273–285.
Foltz RB, Copeland NS. 2009. Evaluating the efficacy of wood shreds formitigating erosion. Journal of Environmental Management 90: 779–785.
García-Orenes F, Cerdà A, Mataix-Solera J, Guerrero C, Bodí MB,Arcenegui V, Zornoza R, Sempere JG. 2009. Effects of agriculturalmanagement on surface soil properties and soil-water losses in easternSpain. Soil and Tillage Research 106: 117–123.
García-Orenes F, Guerrero C, Roldán A, Mataix-Solera J, Cerdà A,Campoy M, Zornoza R, Bárcenas G, Caravaca F. 2010. Soil microbialbiomass and activity under different agricultural management systemsin a semiarid Mediterranean agroecosystem. Soil and Tillage Research109: 110–115.
Gautier CR. 1983. Sedimentation in burned chaparral watersheds: isemergency revegetation justified? Water Resources Bulletin 19: 793–801.
Giménez-Morera A, Ruiz Sinoga JD, Cerdà A. 2010. The impact of cottongeotextiles on soil and water losses in Mediterranean rainfed agriculturalland. Land Degradation and Development 21: 210–217.
Grismer ME, Hogan MP. 2005. Simulated rainfall evaluation of revegeta-tion/mulcherosion control in the Lake Tahoe Basin—3: soil treatmenteffect. Land Degradation and Development 16: 489–501.
Groen AH, Woods SW. 2008. Effectiveness of aerial seeding and strawmulch for reducing post-wildfire erosion, north-western Montana, USA.International Journal of Wildland Fire 17: 559–571.
Guerrero C, Mataix-Solera J, Arcenegui V, Mataix-Beneyto J, Gómez I.2007. Near-infrared spectroscopy to estimate the maximum temperaturesreached on burned soils. Soil Science Society American Journal 71:1029–1037.
Guitian F, Carballas T. 1976. Técnicas de análisis de suelos, Pico Sacro:Santiago de Compostela, Spain; 288. ISBN: 84-85170-09-1
Harris FS, Yao HH. 1923. Effectiveness of mulches in preserving soilmoisture. Journal of Agricultural Research 9: 727–742
Hubbert KR, Wohlgemuth PB, Beyers JB. 2012. Effects of hydromulchon post-fire erosion and plant recovery in chaparral shrublands ofsouthern California. International Journal of Wildland Fire 21:155–167.
Inbar M, Wittenberg L, Tamir M. 1997. Soil erosion and forestry manage-ment after wildfire in a Mediterranean woodland, Mt. Carmel, Israel.International Journal of Wildland Fire 7: 285–294.
Jackson ML. 1958. Soil chemical analysis, Prentice-Hall Inc.: EnglewoodCliffs, New Jersey, USA.
Jordán A, Zavala LM. 2008. Soil loss and runoff rates on unpaved forestroads in southern Spain after simulated rainfall. Forest Ecology andManagement 255: 913–919.
Jordán A, Zavala LM, Gil J. 2010. Effects of mulching on physicalproperties and runoff under semi-arid conditions in southern Spain.Catena 81: 77–85.
Keizer JJ, Coelho COA, Shakesby RA, Domingues CSP, Malvar MC, PerezIMB, Matias MJS, Ferreira AJD. 2005a. The role of soil water repellencyin overland flow generation in pine and eucalypt forest stands in coastalPortugal. Australian Journal of Soil Research 43: 337–349.
Copyright © 2013 John Wiley & Sons, Ltd.
Keizer JJ, Ferreira AJD, Coelho COA, Doerr SH, Malvar MC, DominguesCSP, Perez IMB, Ruiz C, Ferrari K. 2005b. The role of tree stemproximity in the spatial variability of soil water repellency in a eucalyptplantation in coastal Portugal. Australian Journal of Soil Research 43:251–260.
Keizer JJ, Doerr SH, Malvar MC, Prats SA, Ferreira RSV, Oñate MG,Coelho COA, Ferreira AJD. 2008. Temporal variation in topsoil waterrepellency in two recently burnt eucalypt stands in north-central Portugal.Catena 74: 192–204.
Kim C-G, Shin K, Joo K-Y, Lee K-S, Shin S-S, Choung Y. 2008. Effects ofsoil conservation measures in a partially vegetated area after forest fires.Science of the Total Environment 399: 158–164.
Kraebel CJ. 1934. The La Crescenta flood. American Forest 40: 251–254.Kramer CY. 1956. Extension of multiple range tests to group means withunequal numbers of replications. Biometrics 12: 307–310.
Kruse R, Bend E, Bierzychudek P. 2004. Native plant regeneration andintroduction of non-natives following post-fire rehabilitation withstraw mulch and barley seeding. Forest Ecology and Management196: 299–310
Larsen IJ, MacDonald LH, Brown E, Rough D, Welsh MJ, Pietraszek JH,Libohova Z, Benavides-Solorio JD, Schaffrath K. 2009. Causes ofpost-fire runoff and erosion: water repellency, cover, or soil sealing? SoilScience Society of American Journal 73: 1393–1407.
Leighton-Boyce G, Doerr SH, Shakesby RA, Walsh RPD. 2007. Quantify-ing the impact of soil water repellency on overland flow generation anderosion: a new approach using rainfall simulation and wetting agent onin situ soil. Hydrological Processes 21: 2337–2345.
Littell RC, Milliken GA, Stroup WS, Wolfinger RD. 1996. SAS®. TheREG procedure. SAS Institute Inc.: Cary, NC.
Littell RC, Milliken GA, Stroup WW, Wolfinger RD, Schabenberger O.2006. SAS for mixed models, 2nd ed. SAS Institute Inc.: Cary, NC.
Llorens P, Domingo F. 2006. Rainfall partitioning by vegetation underMediterranean conditions. A review of studies in Europe. Journal ofHydrology 335: 37–57.
Lyles L, Dickerson JD, Schmeidler NF. 1974. Soil detachment from clodsby rainfall: effects of wind, mulch cover, and initial soil moisture.Transactions of ASAE 17: 697–700.
MacDonald LH, Robichaud PR. 2007. Post fire erosion and the effective-ness of emergency rehabilitation treatments over time. Joint Fire ScienceProgram (JFSP) Final Report 03-2-3-22. http://www.fws.gov/fire/ifcc/Esr/Library/MacDonald%20and%20 Robichaud%20JFSP%20Final%20Report.pdf. (Last accessed in Accessed in June 2012].
Madsen MD, Kostka SJ, Inouye AL, Zvirzdin DL. 2012. Postfire Restora-tion of soil hydrology and wildland vegetation using surfactant seedcoating technology. Rangeland Ecology & Management 65: 253–259.
Maia P, Pausas JG, Arcenegui V, Guerrero C, Pérez-Bejarano A, Mataix-Solera J, Varela MET, Fernandes I, Pedrosa ET, Keizer JJ. 2012a.Wildfire effects on the soil seed bank of a maritime pine stand—theimportance of fire severity. Geoderma 191: 80–88.
Maia P, Pausas JG, Vasques A, Keizer JJ. 2012b. Fire severity as a keyfactor in post-fire regeneration of Pinus pinaster (Ait.) in central Portugal.Annals of Forest Science 69: 499–507.
Malvar MC, Prats SA, Nunes JP, Keizer JJ. 2011. Post fire overlandflow generation and inter rill erosion under simulated rainfall intwo eucalypt stands in north-central Portugal. EnvironmentalResearch 111: 222–236.
Malvar MC, Martins MAS, Nunes JP, Robichaud PR, Keizer JJ. 2013.Assessing the role of pre-fire ground preparation operations and soilwater repellency in post-fire runoff and inter-rill erosion by repeatedrainfall simulation experiments in Portuguese eucalypt plantations.Catena 108: 69–83.
McIver JD, Starr L. 2000. Environmental effects of Postfire logging:literature review and annotated bibliography. General Technical ReportPNW-GTR-486. U.S. Department of Agriculture, Forest Service, PacificNorthwest Research Station.
Meyer LD, Wischmeier WH, Foster GR. 1970. Mulch rates required forerosion control on steep slopes. Soil Science Society AmericanProccedings 34: 928–931.
Meyer LD, Dabney SM, Murphree CE, Harmon WC, Grissinger EH. 1999.Crop production systems to control erosion and reduce runoff fromupland silty soils. Transactions of ASAE 42: 1645–1652.
Mulumba NL, Lal R. 2008. Mulching effects on selected soil physicalproperties. Soil & Tillage Research 98: 106–111.
Munns EN. 1919. The control of flood water in southern California. Journalof Forestry 17: 423–429.
LAND DEGRADATION & DEVELOPMENT, (2013)

POST-FIRE HYDROMULCHING REDUCED RUNOFF AND SEDIMENT LOSSES
Napper C. 2006. Burned Area emergency response treatment catalog.Watershed, Soil, Air Management 0625 1801-SDTDC. U.S. Departmentof Agriculture, Forest Service, San Dimas Technology and DevelopmentCenter, San Dimas, CA.
Naveh Z. 1975. Degradation and rehabilitation of Mediterranean land-scapes:neotechnological degradation of Mediterranean landscapes and theirrestoration with drought resistant plants. Landscape Planning 2: 133–146.
Ott RL, Longnecker M. 2001. An introduction to statistical methodsand data analysis, 5th ed. Duxbury Press: Garland, Texas, USA.ISBN: 0-534-25122-6
Pannkuk CD, Roubichaud PR. 2003. Effectiveness of needle cast atreducing erosion after forest fires. Water Resources Research 39: 1333.DOI: 10.1029/2003WR002318.
Peppin D, Fulé PZ, Sieg CH, Beyers JL, Hunter ME. 2010. Post-wildfireseeding in forests of the western United States: an evidence-basedreview. Forest Ecology and Management 260: 573–586.
Pierson FB, Moffet CA, Williams CJ, Hardegree SP, Clark PE. 2009.Prescribed-fire effects on rill and interrill runoff and erosion in amountainous sagebrush landscape. Earth Surface Processes andLandforms 34: 193–203.
Pietraszek HP. 2006. Controls on post-fire erosion at the hillslope scale,Colorado Front Range. M.S. thesis, Colorado State University, FortCollins, Colorado, USA.
Pinaya I, Soto B, Arias M, Díaz-Fierros F. 2000. Revegetation of burntareas: relative effectiveness of native and commercial seed mixtures.Land Degradation and Development 11: 93–98.
Porta J, López-Acevedo M, Roquero C. 2003. Edafología para la agriculturay el medio ambiente, 3rd ed. Mundi Prensa: Madrid, Spain; 849.
Prats SA, MacDonald LH, Monteiro M, Ferreira AJD, Coelho COA, KeizerJJ. 2012. Effectiveness of forest residue mulching in reducing post-firerunoff and erosion in a pine and a eucalypt plantation in north-centralPortugal. Geoderma 191: 115–124.
Rab MA. 1994. Changes in physical properties of a soil associated withlogging of Eucalyptus regnans forest in southeastern Australia. ForestEcology and Management 70: 215–229.
Robichaud PR, Brown RE. 2002. Silt fences: an economical technique formeasuring hillslope soil erosion. USDA Forest Service General Techni-cal Report RM-GTR-94, Fort Collins, CO.
Robichaud PR, Beyers JL, Neary DG. 2000. Evaluating the effectiveness ofpostfire rehabilitation treatments. General Technical Report RMRS-GTR-63. Department of Agriculture, Forest Service, Rocky MountainResearch Station, Fort Collins, Colorado, USA. 85.
Robichaud PR, Lillybridge TR, Wagenbrenner JW. 2006. Effects of post-fireseeding and fertilizing on hillslope erosion in north-central Washington,USA. Catena 67: 56–67.
Robichaud PR, Wagenbrenner JW, Brown RE, Wohlgemuth PM, BeyersJL. 2008. Evaluating the effectiveness of contour-felled log erosionbarriers as a post-fire runoff and erosion mitigation treatment in thewestern United States. International Journal of Wildland Fire 17:255–273.
Robichaud PR, Ashmun LE, Sims BD. 2010. Post-fire treatment effectivenessfor hillslope stabilization. General Technical Report, RMRS-GTR-240. U.S. Department of Agriculture, Forest Service, Rocky Mountain ResearchStation, Fort Collins, CO.
Copyright © 2013 John Wiley & Sons, Ltd.
Robichaud PR, Lewis SA, Ashmun LE, Wagenbrenner JW, Brown RE.2013a. Postfire mulching for runoff and erosion mitigation part I:effectiveness at reducing hillslope erosion rates. Catena 105: 75–92.
Robichaud PR, Wagenbrenner JW, Lewis SL, Ashmun LE, Brown RE,Wohlgemuth PM. 2013b. Post-fire mulching for runoff and erosion mit-igation part II: effectiveness in reducing runoff and sediment yields fromsmall catchments. Catena 105: 93–111.
Rough D. 2007. Effectiveness of rehabilitation treatments in reducing post-fire erosion after the Hayman and Schoonover fires, Colorado FrontRange. Fort Collins, CO: Colorado State University. MsC. Thesis; 186.
Shakesby RA. 2011. Post-wildfire soil erosion in the Mediterranean: reviewand future research directions. Earth-Science Reviews 105: 71–100.
Shakesby RA, Doerr SH. 2006. Wildfire as a hydrological and geomorpho-logical agent. Earth-Science Reviews 74: 269–307.
Shakesby RA, Boakes JD, Coelho COA, Bento-Gonçalves JA, Walsh RPD.1996. Limiting the soil degradational impacts of wildfire in pine andEucalyptus forests in Portugal. Applied Geography 16: 337–355.
Smets T, Poesen J, Knapen A. 2008. Spatial scale effects on the effective-ness of organic mulches in reducing soil erosion by water. Earth-ScienceReviews 89: 1–12.
SNIRH: Servico Nacional de Informacao sobre Recursos Hidricos. 2012.Boletim de Precipitação www.snirh.pt. (Last accessed in January 2012).
Soto B, Diaz-Fierros F. 1997. Soil water balance as affected by throughfallin gorse (Ulex europaeus, L.) shrubland after burning. Journal ofHydrology 195: 218–231.
Spigel KM, Robichaud PR. 2007. First-year post-fire erosion rates in Bitter-root National Forest, Montana. Hydrological Processes 21: 998–1005.
Taskey R, Curtis CL, Stone J. 1989. Wildfire, ryegrass seeding, andwatershed rehabilitation. In: Proceedings of the Symposium on Fire andWatershed Management; October 1988, Sacramento, California. GTR-PSW-109. U.S. Department of Agriculture, Forest Service, PacificSouthwest Forest and Range Experiment Station; 149–161.
Vila-Escalé M, Vegas-Vilarrúbia T, Prat N. 2007. Release of polycyclicaromatic compounds into a Mediterranean creek (Catalonia, NE Spain)after a forest fire. Water Research 41: 2171–2179.
Wagenbrenner JW, MacDonald LH, Rough D. 2006. Effectiveness of threepost-fire rehabilitation treatments in the Colorado Front Range.Hydrological Processes 20: 2989–3006.
Wilson GV, Dabney SM, McGregor KC, Barkoll BD. 2004. Tillage andresidue effects on runoff and erosion dynamics. Transactions of ASAE47: 119–128.
Wohlgemuth PM, Beyers JL, Hubbert KR. 2009. Rehabilitation strategiesafter fire: the California, USA experience. In Fire effects on soils andrestoration strategies, Cerdà A, Robichaud PR (eds). Science Publishers,Inc: Enfield, NH, USA; 511–535.
Wohlgemuth PM, Beyers JL, Robichaud PR. 2011. The effectiveness ofaerial hydromulch as an erosion control treatment in burned chaparralwatersheds, southern California. In: Observing, studying, and managingfor change–Proceedings of the Fourth Interagency Conference onResearch in the watersheds. Medley N, Patterson G, Parker M (eds).Scientific Investigations Report 2011-5169: Reston, VA, USA; 162–167.
WRB: World Reference Base for Soil Resources. 2007. WRB Dominant SoilMaps. http://www.fao.org/nr/land/soils/soil/wrb-soil-maps/en/. (Accessedin February 2012).
LAND DEGRADATION & DEVELOPMENT, (2013)