Rapid genetic adaptation to recently colonized environments ...
16
RESEARCH ARTICLE Open Access Rapid genetic adaptation to recently colonized environments is driven by genes underlying life history traits Xiaoshen Yin 1 , Alexander S. Martinez 1 , Maria S. Sepúlveda 2 and Mark R. Christie 1,2* Abstract Background: Uncovering the mechanisms underlying rapid genetic adaptation can provide insight into adaptive evolution and shed light on conservation, invasive species control, and natural resource management. However, it can be difficult to experimentally explore rapid adaptation due to the challenges associated with propagating and maintaining species in captive environments for long periods of time. By contrast, many introduced species have experienced strong selection when colonizing environments that differ substantially from their native range and thus provide a “natural experiment” for studying rapid genetic adaptation. One such example occurred when sea lamprey (Petromyzon marinus), native to the northern Atlantic, naturally migrated into Lake Champlain and expanded their range into the Great Lakes via man-made shipping canals. Results: Utilizing 368,886 genome-wide single nucleotide polymorphisms (SNPs), we calculated genome-wide levels of genetic diversity (i.e., heterozygosity and π) for sea lamprey collected from native (Connecticut River), native but recently colonized (Lake Champlain), and invasive (Lake Michigan) populations, assessed genetic differentiation between all populations, and identified candidate genes that responded to selection imposed by the novel environments. We observed a 14 and 24% reduction in genetic diversity in Lake Michigan and Lake Champlain populations, respectively, compared to individuals from the Connecticut River, suggesting that sea lamprey populations underwent a genetic bottleneck during colonization. Additionally, we identified 121 and 43 outlier genes in comparisons between Lake Michigan and Connecticut River and between Lake Champlain and Connecticut River, respectively. Six outlier genes that contained synonymous SNPs in their coding regions and two genes that contained nonsynonymous SNPs may underlie the rapid evolution of growth (i.e., GHR), reproduction (i.e., PGR, TTC25, STARD10), and bioenergetics (i.e., OXCT1, PYGL, DIN4, SLC25A15). (Continued on next page) © The Author(s). 2021 Open Access This article is licensed under a Creative Commons Attribution 4.0 International License, which permits use, sharing, adaptation, distribution and reproduction in any medium or format, as long as you give appropriate credit to the original author(s) and the source, provide a link to the Creative Commons licence, and indicate if changes were made. The images or other third party material in this article are included in the article's Creative Commons licence, unless indicated otherwise in a credit line to the material. If material is not included in the article's Creative Commons licence and your intended use is not permitted by statutory regulation or exceeds the permitted use, you will need to obtain permission directly from the copyright holder. To view a copy of this licence, visit http://creativecommons.org/licenses/by/4.0/. The Creative Commons Public Domain Dedication waiver (http://creativecommons.org/publicdomain/zero/1.0/) applies to the data made available in this article, unless otherwise stated in a credit line to the data. * Correspondence: [email protected] 1 Department of Biological Sciences, Purdue University, 915 W. State St., West Lafayette, Indiana 47907-2054, USA 2 Department of Forestry and Natural Resources, Purdue University, 715 W. State St., West Lafayette, Indiana 47907-2054, USA Yin et al. BMC Genomics (2021) 22:269 https://doi.org/10.1186/s12864-021-07553-x
-
Upload
khangminh22 -
Category
Documents
-
view
5 -
download
0
Transcript of Rapid genetic adaptation to recently colonized environments ...

RESEARCH ARTICLE Open Access
Rapid genetic adaptation to recentlycolonized environments is driven by genesunderlying life history traitsXiaoshen Yin1, Alexander S. Martinez1, Maria S. Sepúlveda2 and Mark R. Christie1,2*
Abstract
Background: Uncovering the mechanisms underlying rapid genetic adaptation can provide insight into adaptiveevolution and shed light on conservation, invasive species control, and natural resource management. However, itcan be difficult to experimentally explore rapid adaptation due to the challenges associated with propagating andmaintaining species in captive environments for long periods of time. By contrast, many introduced species haveexperienced strong selection when colonizing environments that differ substantially from their native range andthus provide a “natural experiment” for studying rapid genetic adaptation. One such example occurred when sealamprey (Petromyzon marinus), native to the northern Atlantic, naturally migrated into Lake Champlain andexpanded their range into the Great Lakes via man-made shipping canals.
Results: Utilizing 368,886 genome-wide single nucleotide polymorphisms (SNPs), we calculated genome-widelevels of genetic diversity (i.e., heterozygosity and π) for sea lamprey collected from native (Connecticut River),native but recently colonized (Lake Champlain), and invasive (Lake Michigan) populations, assessed geneticdifferentiation between all populations, and identified candidate genes that responded to selection imposed by thenovel environments. We observed a 14 and 24% reduction in genetic diversity in Lake Michigan and LakeChamplain populations, respectively, compared to individuals from the Connecticut River, suggesting that sealamprey populations underwent a genetic bottleneck during colonization. Additionally, we identified 121 and 43outlier genes in comparisons between Lake Michigan and Connecticut River and between Lake Champlain andConnecticut River, respectively. Six outlier genes that contained synonymous SNPs in their coding regions and twogenes that contained nonsynonymous SNPs may underlie the rapid evolution of growth (i.e., GHR), reproduction(i.e., PGR, TTC25, STARD10), and bioenergetics (i.e., OXCT1, PYGL, DIN4, SLC25A15).
(Continued on next page)
© The Author(s). 2021 Open Access This article is licensed under a Creative Commons Attribution 4.0 International License,which permits use, sharing, adaptation, distribution and reproduction in any medium or format, as long as you giveappropriate credit to the original author(s) and the source, provide a link to the Creative Commons licence, and indicate ifchanges were made. The images or other third party material in this article are included in the article's Creative Commonslicence, unless indicated otherwise in a credit line to the material. If material is not included in the article's Creative Commonslicence and your intended use is not permitted by statutory regulation or exceeds the permitted use, you will need to obtainpermission directly from the copyright holder. To view a copy of this licence, visit http://creativecommons.org/licenses/by/4.0/.The Creative Commons Public Domain Dedication waiver (http://creativecommons.org/publicdomain/zero/1.0/) applies to thedata made available in this article, unless otherwise stated in a credit line to the data.
* Correspondence: [email protected] of Biological Sciences, Purdue University, 915 W. State St., WestLafayette, Indiana 47907-2054, USA2Department of Forestry and Natural Resources, Purdue University, 715 W.State St., West Lafayette, Indiana 47907-2054, USA
Yin et al. BMC Genomics (2021) 22:269 https://doi.org/10.1186/s12864-021-07553-x

(Continued from previous page)
Conclusions: By identifying the genomic basis of rapid adaptation to novel environments, we demonstrate thatpopulations of invasive species can be a useful study system for understanding adaptive evolution. Furthermore,the reduction in genome-wide levels of genetic diversity associated with colonization coupled with theidentification of outlier genes underlying key life history traits known to have changed in invasive sea lampreypopulations (e.g., growth, reproduction) illustrate the utility in applying genomic approaches for the successfulmanagement of introduced species.
Keywords: Founder effects, Genetic bottleneck, Invasive species, Selection, Rapid genetic adaptation, RNA-seq, Sealamprey Petromyzon marinus
BackgroundInvasive species can rapidly establish and spread in newenvironments that often have substantially different abi-otic and biotic conditions than found throughout their na-tive range [1, 2]. This widely observed phenomenon hastriggered investigations into how invasive species are ableto quickly adapt to such different conditions [1]. Identify-ing the genes that drive rapid genetic adaptation can pro-vide a better framework for understanding how and whenrapid adaptation is likely to occur, shedding light on con-servation, invasive species control, and natural resourcemanagement [3, 4]. For many species, experimental ma-nipulations investigating rapid genetic adaptation can bedifficult due to long generation times and the challengesassociated with propagating species in captive environ-ments. Introduced species, by contrast, can sometimesprovide a natural “experiment” for identifying the geneticbasis underlying the rapid genetic adaptation associatedwith the colonization of novel environments [5, 6]. Onesuch example occurred when sea lamprey (Petromyzonmarinus), a parasitic, jawless vertebrate native to thenorthern Atlantic, invaded the Laurentian Great Lakes.In their native range, which includes most of the
northern Atlantic and surrounding regions [7], sea lam-prey are an anadromous, semelparous species with a bi-partite life cycle consisting of distinct larval and adultstages. During their larval stages, sea lamprey burrowinto soft and sandy substrates in freshwater streams andfilter feed for an average of four to eight years (reportedrange is 2–19 years) [8]. After undergoing a series of be-havioral and physiological modifications essential for ahematophagous, parasitic lifestyle, larval sea lamprey(i.e., ammocoetes) transform into parasitic juveniles [9]and migrate out to the ocean. Once in the ocean, sealamprey parasitize many host species such as herring(Clupea harengus), mackerel (Scomber scombrus), andAtlantic salmon (Salmo salar) [10]. Juvenile sea lampreyattach to their hosts using sharp teeth and are able tocontinuously feed on the blood and tissue of their hostsby secreting anticoagulants [11]. The parasitic feedingstage in sea lamprey lasts between 20 to 36 months, afterwhich sea lamprey return to rivers and streams for
spawning. Instead of returning to their natal streams,like many other anadromous fishes (e.g., salmon), sealamprey rely on a pheromone produced by larvae instreams and rivers as a cue for migration [12–15]. Thus,the choice of which stream to spawn in is largely drivenby larval abundance, where high larval abundance resultsin more pheromone released and can generate a strongsignal to attract adult sea lamprey for spawning. Thisprocess results in few lamprey returning to spawn in thepopulations where they were born and the subsequenthigh gene flow among populations means that sea lam-prey populations are largely panmictic [7, 12, 16].Sea lamprey are native to the northern Atlantic coast [17],
and migrated into Lake Ontario and Lake Champlain, wherethey were first observed in 1835 and 1841, respectively [18–20], through natural migrations via the St. Lawrence River[7]. The construction and improvement of shipping canals inthe early 1800s allowed sea lamprey to expand their rangesto Lake Erie and then colonize Lakes Huron, Michigan, andSuperior [7, 21, 22]. The first documented observations ofsea lamprey for Lake Erie was in 1921 [22], Lake Michigan in1936 [21], Lake Huron in 1937 [20], and Lake Superior in1946 [20]. These colonization events were followed by sub-stantial declines in native, commercially and ecologically im-portant fishes such as lake trout (Salvelinus namaycush),burbot (Lota lota), lake whitefish (Coregonus clupeaformis),and walleye (Sander vitreus). In order to rehabilitate localfisheries, 3-trifluoromethyl-4-nitrophenol (TFM), a pesticidethat targets the larval stage of sea lamprey, has been appliedin Lake Michigan since 1960 and in Lake Champlain since1990 [23, 24].The ecology and environmental conditions found in
the Great Lakes are substantially different from thosefound throughout the sea lamprey’s native range [17],and have changed some of sea lamprey’s life historycharacteristics. For example, invasive sea lamprey spendtheir parasitic life history stage entirely in the freshwaterenvironment of the Great Lakes instead of migrating tothe ocean. Thus, invasive sea lamprey never acclimate tohigh-salinity ocean environments. Sea lamprey in theGreat Lakes also exhibit a faster growth rate, a shorterlarval stage, a smaller adult body size, and a lower
Yin et al. BMC Genomics (2021) 22:269 Page 2 of 16
fecundity in comparison to individuals from native pop-ulations [25, 26]. Lastly, invasive sea lamprey spendmore time feeding parasitically on a single host individ-ual, and greater numbers of individual sea lamprey areoften found attached to a single adult fish in the GreatLakes than in the Atlantic Ocean.While these differences in life history characteristics of
invasive sea lamprey are suggestive of genetic adaptation,many of these traits may simply be a plastic response todifferent environments [27–29]. Determining which geneshave responded to selection in the novel, recently colo-nized environment is valuable for understanding rapidgenetic adaptation (i.e., occurring in fewer than 200 yearsin invasive sea lamprey) to new environments in both sealamprey and other species. To achieve this objective, wesampled larval sea lamprey from three locations: (1) theConnecticut River, a native-range tributary of the AtlanticOcean, (2) Lake Michigan, where sea lamprey are invasive,and (3) Lake Champlain, an additional freshwater environ-ment that sea lamprey colonized through natural migra-tions (Fig. 1a). Although sea lamprey may be native toLake Champlain [7], they still needed to adjust to a novel,entirely-freshwater environment with vastly different eco-logical conditions. We used genome-wide single nucleo-tide polymorphisms (SNPs) identified via RNA-seq tocalculate genome-wide levels of genetic diversity, assessgenetic differentiation among populations, and identifygenes that may have responded to selection imposed bythe novel environments. By conducting this set ofanalyses, we aim to answer two primary questions: (1) Didsea lamprey populations colonizing Lake Michigan andLake Champlain undergo a genetic bottleneck duringcolonization (i.e., founder effects), and (2) what genes haveresponded to selection in the novel environments andhow do they relate to the documented phenotypic shifts inlife history traits?
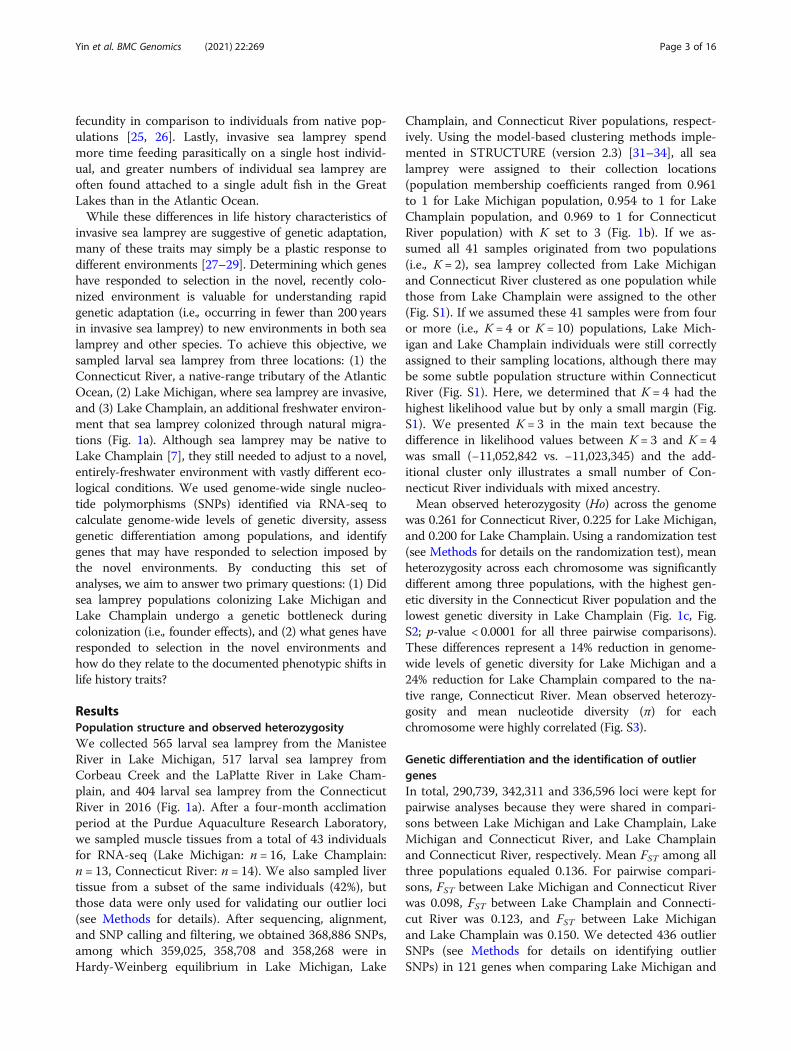
ResultsPopulation structure and observed heterozygosityWe collected 565 larval sea lamprey from the ManisteeRiver in Lake Michigan, 517 larval sea lamprey fromCorbeau Creek and the LaPlatte River in Lake Cham-plain, and 404 larval sea lamprey from the ConnecticutRiver in 2016 (Fig. 1a). After a four-month acclimationperiod at the Purdue Aquaculture Research Laboratory,we sampled muscle tissues from a total of 43 individualsfor RNA-seq (Lake Michigan: n = 16, Lake Champlain:n = 13, Connecticut River: n = 14). We also sampled livertissue from a subset of the same individuals (42%), butthose data were only used for validating our outlier loci(see Methods for details). After sequencing, alignment,and SNP calling and filtering, we obtained 368,886 SNPs,among which 359,025, 358,708 and 358,268 were inHardy-Weinberg equilibrium in Lake Michigan, Lake
Champlain, and Connecticut River populations, respect-ively. Using the model-based clustering methods imple-mented in STRUCTURE (version 2.3) [31–34], all sealamprey were assigned to their collection locations(population membership coefficients ranged from 0.961to 1 for Lake Michigan population, 0.954 to 1 for LakeChamplain population, and 0.969 to 1 for ConnecticutRiver population) with K set to 3 (Fig. 1b). If we as-sumed all 41 samples originated from two populations(i.e., K = 2), sea lamprey collected from Lake Michiganand Connecticut River clustered as one population whilethose from Lake Champlain were assigned to the other(Fig. S1). If we assumed these 41 samples were from fouror more (i.e., K = 4 or K = 10) populations, Lake Mich-igan and Lake Champlain individuals were still correctlyassigned to their sampling locations, although there maybe some subtle population structure within ConnecticutRiver (Fig. S1). Here, we determined that K = 4 had thehighest likelihood value but by only a small margin (Fig.S1). We presented K = 3 in the main text because thedifference in likelihood values between K = 3 and K = 4was small (−11,052,842 vs. −11,023,345) and the add-itional cluster only illustrates a small number of Con-necticut River individuals with mixed ancestry.Mean observed heterozygosity (Ho) across the genome
was 0.261 for Connecticut River, 0.225 for Lake Michigan,and 0.200 for Lake Champlain. Using a randomization test(see Methods for details on the randomization test), meanheterozygosity across each chromosome was significantlydifferent among three populations, with the highest gen-etic diversity in the Connecticut River population and thelowest genetic diversity in Lake Champlain (Fig. 1c, Fig.S2; p-value < 0.0001 for all three pairwise comparisons).These differences represent a 14% reduction in genome-wide levels of genetic diversity for Lake Michigan and a24% reduction for Lake Champlain compared to the na-tive range, Connecticut River. Mean observed heterozy-gosity and mean nucleotide diversity (π) for eachchromosome were highly correlated (Fig. S3).
Genetic differentiation and the identification of outliergenesIn total, 290,739, 342,311 and 336,596 loci were kept forpairwise analyses because they were shared in compari-sons between Lake Michigan and Lake Champlain, LakeMichigan and Connecticut River, and Lake Champlainand Connecticut River, respectively. Mean FST among allthree populations equaled 0.136. For pairwise compari-sons, FST between Lake Michigan and Connecticut Riverwas 0.098, FST between Lake Champlain and Connecti-cut River was 0.123, and FST between Lake Michiganand Lake Champlain was 0.150. We detected 436 outlierSNPs (see Methods for details on identifying outlierSNPs) in 121 genes when comparing Lake Michigan and
Yin et al. BMC Genomics (2021) 22:269 Page 3 of 16

Connecticut River populations and 209 outlier SNPs in43 genes when comparing Lake Champlain and Con-necticut River populations (Fig. 2, Fig. S4, Table S2). Wedid not find a single outlier SNP (and consequently out-lier gene) when comparing the Lake Michigan and LakeChamplain populations (Fig. 2c, Fig. S4) despite nearly
identical sample sizes, read depth, and numbers of SNPsfor all pairwise comparisons (Fig. S5). In the comparisonbetween Lake Michigan and Connecticut River, 14 outof 121 outlier genes contained outlier SNPs causing non-synonymous changes (Fig. 2d, Table S2). Similarly, sixout of 43 genes contained nonsynonymous outlier SNPs
Fig. 1 Map of sampling sites, population structure, and genetic diversity (observed heterozygosity). Larval sea lamprey were collected from Lake Michigan, LakeChamplain, and the Connecticut River, where the numbers reflect the number of muscle and liver samples of larval sea lamprey that were sequenced and usedin this study (a). Larval sea lamprey collected from the three locations cluster clearly into three distinct groups (b). Mean observed heterozygosity across thegenome is indicated by dashed lines and observed heterozygosity of chromosomes is indicated by points. Genetic diversity is the highest in Connecticut River,followed by Lake Michigan and Lake Champlain (c). Sea lamprey have 99 chromosomes, among which the first 90 are assembled. The map in (a) is modifiedwith permission from Yin et al. [30]
Yin et al. BMC Genomics (2021) 22:269 Page 4 of 16

in the comparison between Lake Champlain and Con-necticut River (Fig. 2e, Table S2). Two genes, CLTC(clathrin heavy chain) and RALA (RAS like proto-oncogene A), were found to be in common in bothcomparisons involving the native, anadromous popula-tion (i.e., Lake Michigan vs. Connecticut River andLake Champlain vs. Connecticut River) (Table S2; see
Table S3 for all gene names and identities). The iden-tification of outlier SNPs and corresponding geneswas supported by FST, allele frequency difference(AFD), and genome scans based on k-nearest neigh-bor (kNN) techniques (Fig. S6, Table S2; see Methodsbelow and Results in Supplementary Information fordetails).
Fig. 2 Genetic differentiation (FST) and outlier genes for the three pairwise comparisons. FST is plotted across the 90 assembled chromosomes for thecomparison between Lake Michigan and Connecticut River (a) and the comparison between Lake Champlain and Connecticut River (b). All SNPs onneighboring outlier genes are indicated by points in alternating colors, blue and black, with SNPs causing nonsynonymous mutations in red. FSTaveraged across SNPs in 100 Kb windows is plotted for chromosomes 1–90 in alternating colors, purple and grey. The dashed line indicates a thresholdZ(FST) of 5 for identifying outlier SNPs. While no outlier SNPs were detected in the comparison between Lake Michigan and Lake Champlain (c; LM vs.LC), 436 outlier SNPs, corresponding to 121 outlier genes, among which 14 contain outlier SNPs causing nonsynonymous substitutions, and 209 outlierSNPs, corresponding to 43 outlier genes, among which 6 contain outlier SNPs causing nonsynonymous substitutions, were detected between LakeMichigan and Connecticut River (d; LM vs. CT) and between Lake Champlain and Connecticut River (e; LC vs. CT)
Yin et al. BMC Genomics (2021) 22:269 Page 5 of 16

Gene ontology (GO) hierarchy networks of outlier genesWith GO terms associated with outlier genes (Table S4),we identified 57 and 26 biological processes from GOhierarchy networks in comparisons between Lake Mich-igan and Connecticut River and between Lake Champlainand Connecticut River, respectively, among which 13 werecommon to both pairwise comparisons (Fig. 3, Fig. S7).According to the hierarchy networks of GO terms associ-ated with one (Fig. S7) and more than one (Fig. 3) outliergene, all biological processes can be categorized into sixbroad groups: biological adhesion, biological regulation,cellular process, localization, metabolic process, andgrowth (note that “growth” is in Fig. S7). Two of these bio-logical processes, biological adhesion (Fig. 3) and growth(Fig. S7), only appear when comparing Lake Michigan andConnecticut River sea lamprey, suggesting that LakeMichigan sea lamprey may have adapted to their novel, in-troduced range by adjusting their growth (Fig. S7) and celladhesion-mediated signal transduction pathways (Fig. 3).In contrast, the other four groups, cellular process, meta-bolic process, localization, and biological regulation, arecommon in both pairwise comparisons, with cellular andmetabolic processes containing the largest number of bio-logical processes (Fig. 3, Fig. S7). These four groups of bio-logical processes may potentially indicate that theadaptation to the recently colonized, freshwater environ-ments in Lake Michigan and Lake Champlain populationsmay be achieved through changes in DNA transcriptionand translation, cellular component organization, signaltransduction, within-cell transport, and metabolism (Fig.3, Fig. S7). Among biological processes corresponding toGO terms associated with more than one outlier gene,regulation of DNA transcription was common to bothpairwise comparisons, while translation was only detectedin comparison between Lake Michigan and ConnecticutRiver (Fig. 3). This difference may reflect different evolu-tionary strategies the two recently colonized sea lampreypopulations adopt to adapt to their novel environments,one of which is mediated exclusively at the transcriptomiclevel while the other is mediated through both DNA tran-scription and translation.
Outlier genes underlying key life history differences andbioenergeticsSix out of 121 outlier genes in comparison between LakeMichigan and Connecticut River (i.e., GHR, PGR,TTC25, STARD10, OXCT1, SLC25A15) and two out of43 outlier genes in comparison between Lake Champlainand Connecticut River (i.e., DIN4, PYGL) may poten-tially explain changes in growth, reproduction, and bio-energetics in sea lamprey in response to novel ecologicalconditions (Fig. 4, Fig. S8). For all eight of these outliergenes, both FST and nucleotide diversity between popu-lations increased while nucleotide diversity within
populations decreased at outlier SNPs, further suggest-ing that genetic differentiation at these genes are drivenby local adaptation (Fig. S9) [35].GHR, which has a Z(FST) of 6.39 and codes for a trans-
membrane receptor for growth hormone, can directlyaffect the growth rate of fish [36] (Fig. 4a). Lake Michiganand Connecticut River populations are fixed for alternativealleles at this gene (Fig. 4a). PGR, which has a Z(FST) of5.51 and encodes a nuclear progesterone receptor, plays acrucial role in the development of testis, the arrangementof spermatogenic cysts, sperm count, sperm motility, andovulation [37, 38] (Fig. 4b). Lake Champlain and Con-necticut River are almost fixed for the same PGR allele,while Lake Michigan is nearly fixed for the other (Fig. 4b).Two additional outlier genes, STARD10 (Z(FST) = 5.05),encoding a STAR-related lipid transfer protein, and cilia-related TTC25 (Z(FST) = 6.13), encoding a tetratricopep-tide repeat domain-containing protein, may also affect themotility, maturation, or fertilization ability of sperm [39–42] (Fig. S8a, b).We next identified a number of outlier genes directly
related to bioenergetics. We first identified a gene con-taining nonsynonymous outlier SNPs when comparingLake Michigan and Connecticut River populations,OXCT1, which has a Z(FST) of 5.83 and codes for en-zymes essential for the catabolism of ketone bodies thatserve as an important fuel during starvation (Fig. 4c,Table S2) [43, 44]. Since ketone bodies serve as a pri-mary fuel during starvation, functional differences at thisgene may suggest a lower abundance or lower energeticquality of food in Lake Michigan. Another outlier genecontaining nonsynonymous outlier SNPs, PYGL, was de-tected in the comparison between Lake Champlain andConnecticut River with a Z(FST) of 5.05, which encodesan enzyme that promotes the release of glucose-1-phosphate from liver glycogen stores (Fig. S8c, Table S2)[45]. An additional gene containing synonymous outlierSNPs detected in comparison between Lake Champlainand Connecticut River with a Z(FST) of 5.05, DIN4, isfound to be activated under sugar starvation (Fig. S8d,Table S2) [46]. Metabolisms of ketone bodies and glyco-gen, which may compensate for energy deficiency understarvation, are potential indicators of adaptation to a dif-ferent (and potentially lower quality) food supply in LakeMichigan and Lake Champlain.Lastly, SLC25A15, which is detected in comparison be-
tween Lake Michigan and Connecticut River with aZ(FST) of 5.72, codes for an ornithine mitochondrialtransporter, which is a key component in urea cycle es-sential for nitrogen metabolism, and may suggest a shiftin diet [47] (Fig. 4d). It has been shown that the urea ex-cretion rate of sea lamprey removed from sharks is ~ 5to 30 times higher than that of those removed from rain-bow trout [48], suggesting that urea excretion in sea
Yin et al. BMC Genomics (2021) 22:269 Page 6 of 16

Fig. 3 Gene ontology (GO) hierarchy networks. The GO hierarchy networks are constructed from GO terms associated with two or more outliergenes in the comparisons between Lake Michigan and Connecticut River (a) and between Lake Champlain and Connecticut River (b). Branch andnode colors indicate the biological process child term to which distal nodes belong and the central grey node represents the biological processlevel of the GO hierarchy
Yin et al. BMC Genomics (2021) 22:269 Page 7 of 16

Fig. 4 (See legend on next page.)
Yin et al. BMC Genomics (2021) 22:269 Page 8 of 16

lamprey is affected by what prey they are feeding on.Thus, adaptive differentiation at SLC25A15 may be a re-flection of changes in sea lamprey’s prey and their capacityof adjusting nitrogen metabolism depending on whichhost fishes are available. Additionally, SLC25A15 couldalso be potentially related to osmoregulation, ammoniadetoxification, or even as a response to TFM treatmentsince the protein is located within mitochondria [30].
DiscussionGenetic differentiation and genetic diversityA total of 121 outlier genes were identified in the com-parison between Lake Michigan and Connecticut Riverand a total of 43 outlier genes were identified in thecomparison between Lake Champlain and ConnecticutRiver. While the highest genome-wide level of geneticdifferentiation across all loci were detected in the com-parison between Lake Michigan and Lake Champlain(mean FST = 0.150), not a single outlier SNP was foundbetween these two entirely-freshwater populations (Fig.S4a). These results were not driven by differences insample sizes, read depth and numbers of loci in com-mon, or insufficient power to detect outliers (Fig. S5).This striking result suggests that sea lamprey in LakeMichigan and Lake Champlain may have experiencedparallel evolution whereby the differences in ecologicalconditions between the two lakes may not be largeenough to exert strong differential selection when adapt-ing to the novel environment. Furthermore, sharedcoancestry among Lake Michigan and Lake Champlainpopulations may further decrease the likelihood of de-tecting outliers between these populations. Parallel evo-lution and shared coanscestry are not mutually exclusiveprocesses (i.e., both phenomena could be at work in thissystem), yet we think the absence of outliers in the com-parison between Lake Michigan and Lake Champlainmay have been more likely to be driven by relatively highcoancestry. Nevertheless, the two entirely-freshwaterpopulations have likely experienced moderate levels ofgenetic drift, either via founder effects or higher variancein reproductive success, given the observation that meanFST was highest between these two populations.The average FST of all three pairwise population com-
parisons was moderately high (Lake Michigan vs. Lake
Champlain: mean FST = 0.150; Lake Michigan vs. Con-necticut River: mean FST = 0.098; Lake Champlain vs.Connecticut River: mean FST = 0.123) and sea lampreycollected from Lake Michigan, Lake Champlain andConnecticut River clearly clustered into three distinctgroups (Fig. 1b), suggesting that there is little ongoinggene flow among these populations. Genome-wide mea-surements of genetic diversity (measured as observedheterozygosity; Ho) were significantly different from eachother (p-value < 0.0001 for all three pairwise compari-sons), with the highest genetic diversity in the native-range Connecticut River population, followed by theLake Michigan and Lake Champlain populations (Fig.1c, Fig. S2). The reduction in genome-wide levels of gen-etic diversity in Lake Michigan and Lake Champlain arelikely to be a result of founder effects; only a small num-ber of sea lamprey may have been able to successfullycolonize these environments [49].
Candidate genes underlying rapid genetic adaptationInvasive sea lamprey in the Great Lakes exhibit a fastergrowth rate, a shorter larval stage, a smaller adult bodysize, and a lower fecundity [25, 26]. Sea lamprey havevery large effective population sizes, so we suggest that,at genes related to these changes, selection is most likelyto have acted on the standing genetic variation alreadypresent within the population and did not depend on denovo mutations. Body size has been repeatedly shown tobe a highly heritable trait in fishes [50, 51]. GHR (growthhormone receptor) was identified as an outlier in thecomparison between Lake Michigan and ConnecticutRiver. GHR encodes a transmembrane growth hormonereceptor. The dimerization of the growth hormone re-ceptor occurs upon the binding of growth hormone, anda signal transduction pathway involved in growth isturned on. As such, GHR plays a crucial role in fishgrowth [36] and may account for the faster growth rateand smaller adult size of sea lamprey colonizing theGreat Lakes and Lake Champlain. Additionally, selectionat the outlier genes, PGR, STARD10, and TTC25, couldexplain the lower fecundity observed in Lake Michigansea lamprey since these genes are known to affect ovula-tion and sperm production and quality [37, 38]. TheLake Champlain population showed no evidence of
(See figure on previous page.)Fig. 4 Z-transformed FST, genomic regions, and allele frequencies of SNPs on outlier genes. Z(FST) of all SNPs on outlier genes identified withmuscle samples that may contribute to adaptation to novel environments (i.e., growth, reproduction, bioenergetics) in sea lamprey from LakeMichigan, Lake Champlain, and Connecticut River are shown along corresponding chromosomes with SNPs located on introns, untranslatedregions (UTR), and coding regions (CDS) indicated with different colors (left panels). Shifts in allele frequency of SNPs with the highest Z(FST) orcausing nonsynonymous mutations on outlier genes in Lake Michigan, Lake Champlain, and Connecticut River populations are almost identicalacross different tissue types (i.e., muscle and liver shown in middle and right panels, respectively). The dark grey horizontal bar on the top left ofthe left panel represents the length of an outlier gene. GHR is associated with growth (a), PGR with reproduction (b), and OXCT1 and SLC25A15with bioenergetics (c, d)
Yin et al. BMC Genomics (2021) 22:269 Page 9 of 16

changes in allele frequencies compared to the nativeConnecticut River population at PGR and STARD10, butdid show evidence of adaptive evolution at TTC25 (Fig.4b, Fig. S8a, b). Together, these candidate genes mayunderlie a novel life history strategy that optimizes theclassic tradeoff between growth and reproduction [52].Lake Champlain and Connecticut River populations aregenetically distinct, but no outlier gene related to lifehistory traits (e.g., growth, reproduction) was detected inthe comparison between these two populations. This re-sult may suggest that changes in life history strategiesessential for sea lamprey’s colonization in Lake Cham-plain may be mediated by plasticity or the genetic differ-entiation between these two populations driving changesin life history strategies is not strong enough to bedetected.In the Great Lakes, sea lamprey spend more time feed-
ing on a single host, and more sea lamprey are found toattach to one adult fish than in the Atlantic Ocean [25,26]. This observation could be driven by the high ratioof sea lamprey to host fishes, suggesting that foodsources may have been limited in the invasive rangegiven the high abundance of sea lamprey prior to treat-ment with lampricides. Interestingly, we find two candi-date genes containing nonsynonymous outlier SNPs (i.e.,OXCT1 and PYGL) and one containing synonymousoutlier SNPs (i.e., DIN4) that support this hypothesis atthe genomic level. OXCT1 is involved in the catabolismof a primary fuel under starvation (i.e., ketone bodies),PYGL participates in the production of glucose fromliver glycogen stores, and DIN4 is activated under sugarstarvation. While OXCT1 is identified in the comparisonbetween Lake Michigan and Connecticut River, PYGLand DIN4 are detected in the comparison between LakeChamplain and Connecticut River, suggesting that sealamprey in both Lake Michigan and Lake Champlainhave responded to the selection imposed by the differ-ences in food sources and availability in these novel,freshwater environments.Instead of migrating to the ocean, Lake Michigan and
Lake Champlain sea lamprey spend their entire life infreshwater and never acclimate to salt water environ-ments. Previous work has shown that 11-deoxycortisol,Na-K-Cl cotransporter 1, and Na+-K+-ATPase may en-gage in sea lamprey’s osmoregulation [53–55]. Wewould expect to detect genetic differentiation at genesencoding these components involved in osmoregulation,but we did not find any direct evidence at the geneticlevel (i.e., SNPs) to support this hypothesis. However,both growth hormone and glycogen metabolism havebeen shown to be related to seawater adaptation [56–58], suggesting that GHR and PYGL may also play a rolein the successful colonization of freshwater environ-ments. Our inability to uncover a clearer genetic signal
related to sea lamprey’s adaptation to freshwater envi-ronments could be due to a lack of power (e.g., samplesizes). Alternatively, sea lamprey may respond tochanges in salinity plastically by differentially expressingrelevant genes at the transcriptomic level, and the selec-tion imposed by differences in salinity may not be strongenough to shift allele frequencies among populations atthe genomic level [54, 59].
Future directionsWhile we have identified a series of outlier genes that maybe driving sea lamprey’s rapid adaption to novel environ-ments, several outstanding questions remain. Althoughour study identified outlier genes that are likely drivingrapid adaptation at the genomic level, we do not know yethow these genes perform at the proteomic and metaboliclevel to support variation at the physiological, individual,and population level in recently colonized sea lampreypopulations. Additionally, four large classes of genes werefound to be related to cell cycle progression, cellular com-ponent assembly, cellular transporting, and cellular signal-ing. These genes together regulate the replication,transcription, and translation of DNA, the assembly ofchromatin and ribosome, and some cellular enzymatic re-actions. How these genes work concurrently and coordin-ate to help sea lamprey colonize new environmentsremains unknown and merits further investigation. Lastly,these genetic changes in life history traits may be drivenby selection to escape treatment from the lampricide 3-trifluoromethyl-4-nitrophenol (TFM), which is applied inboth Lake Michigan and Lake Champlain. Recent theoret-ical work suggests that a rapid decrease in the size and ageat metamorphosis could be driven by TFM-induced selec-tion [60]. Determining whether these changes in life his-tory associated genes we documented here are driven bythe natural environment, treatment with TFM, or bothwill be important for the successful management of inva-sive sea lamprey.We cannot exclude the possibility that some of the
outlier genes detected using FST are false positives, andcaution is warranted when using FST as an indicator forlocal adaptation [35, 61, 62]. Although FST has beenwidely used to assess genetic differentiation betweenpopulations, there are some caveats for using it to detectlocal adaptation. The correlated coancestry among or-ganisms living in the long one-dimensional landscapesmay generate many false positives [61, 62]. It is thereforeimportant to take the characteristics of the study systeminto consideration when using FST as an estimator forgenetic differentiation. Furthermore, a FST outlier maynot necessarily indicate local adaptation because it couldalso be driven by global adaptation or genetic drift [35].Therefore, we suggest a combination of FST, AFD, kNN-based approach, and nucleotide diversity within and
Yin et al. BMC Genomics (2021) 22:269 Page 10 of 16
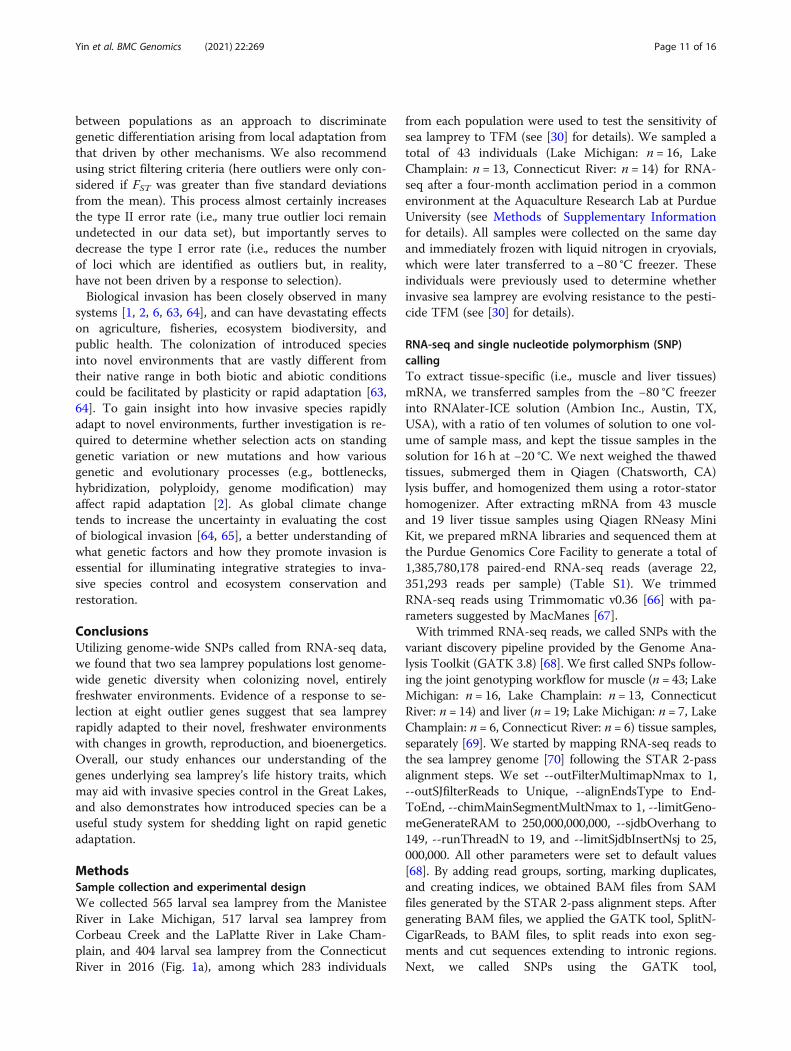
between populations as an approach to discriminategenetic differentiation arising from local adaptation fromthat driven by other mechanisms. We also recommendusing strict filtering criteria (here outliers were only con-sidered if FST was greater than five standard deviationsfrom the mean). This process almost certainly increasesthe type II error rate (i.e., many true outlier loci remainundetected in our data set), but importantly serves todecrease the type I error rate (i.e., reduces the numberof loci which are identified as outliers but, in reality,have not been driven by a response to selection).Biological invasion has been closely observed in many
systems [1, 2, 6, 63, 64], and can have devastating effectson agriculture, fisheries, ecosystem biodiversity, andpublic health. The colonization of introduced speciesinto novel environments that are vastly different fromtheir native range in both biotic and abiotic conditionscould be facilitated by plasticity or rapid adaptation [63,64]. To gain insight into how invasive species rapidlyadapt to novel environments, further investigation is re-quired to determine whether selection acts on standinggenetic variation or new mutations and how variousgenetic and evolutionary processes (e.g., bottlenecks,hybridization, polyploidy, genome modification) mayaffect rapid adaptation [2]. As global climate changetends to increase the uncertainty in evaluating the costof biological invasion [64, 65], a better understanding ofwhat genetic factors and how they promote invasion isessential for illuminating integrative strategies to inva-sive species control and ecosystem conservation andrestoration.
ConclusionsUtilizing genome-wide SNPs called from RNA-seq data,we found that two sea lamprey populations lost genome-wide genetic diversity when colonizing novel, entirelyfreshwater environments. Evidence of a response to se-lection at eight outlier genes suggest that sea lampreyrapidly adapted to their novel, freshwater environmentswith changes in growth, reproduction, and bioenergetics.Overall, our study enhances our understanding of thegenes underlying sea lamprey’s life history traits, whichmay aid with invasive species control in the Great Lakes,and also demonstrates how introduced species can be auseful study system for shedding light on rapid geneticadaptation.
MethodsSample collection and experimental designWe collected 565 larval sea lamprey from the ManisteeRiver in Lake Michigan, 517 larval sea lamprey fromCorbeau Creek and the LaPlatte River in Lake Cham-plain, and 404 larval sea lamprey from the ConnecticutRiver in 2016 (Fig. 1a), among which 283 individuals
from each population were used to test the sensitivity ofsea lamprey to TFM (see [30] for details). We sampled atotal of 43 individuals (Lake Michigan: n = 16, LakeChamplain: n = 13, Connecticut River: n = 14) for RNA-seq after a four-month acclimation period in a commonenvironment at the Aquaculture Research Lab at PurdueUniversity (see Methods of Supplementary Informationfor details). All samples were collected on the same dayand immediately frozen with liquid nitrogen in cryovials,which were later transferred to a −80 °C freezer. Theseindividuals were previously used to determine whetherinvasive sea lamprey are evolving resistance to the pesti-cide TFM (see [30] for details).
RNA-seq and single nucleotide polymorphism (SNP)callingTo extract tissue-specific (i.e., muscle and liver tissues)mRNA, we transferred samples from the −80 °C freezerinto RNAlater-ICE solution (Ambion Inc., Austin, TX,USA), with a ratio of ten volumes of solution to one vol-ume of sample mass, and kept the tissue samples in thesolution for 16 h at −20 °C. We next weighed the thawedtissues, submerged them in Qiagen (Chatsworth, CA)lysis buffer, and homogenized them using a rotor-statorhomogenizer. After extracting mRNA from 43 muscleand 19 liver tissue samples using Qiagen RNeasy MiniKit, we prepared mRNA libraries and sequenced them atthe Purdue Genomics Core Facility to generate a total of1,385,780,178 paired-end RNA-seq reads (average 22,351,293 reads per sample) (Table S1). We trimmedRNA-seq reads using Trimmomatic v0.36 [66] with pa-rameters suggested by MacManes [67].With trimmed RNA-seq reads, we called SNPs with the
variant discovery pipeline provided by the Genome Ana-lysis Toolkit (GATK 3.8) [68]. We first called SNPs follow-ing the joint genotyping workflow for muscle (n = 43; LakeMichigan: n = 16, Lake Champlain: n = 13, ConnecticutRiver: n = 14) and liver (n = 19; Lake Michigan: n = 7, LakeChamplain: n = 6, Connecticut River: n = 6) tissue samples,separately [69]. We started by mapping RNA-seq reads tothe sea lamprey genome [70] following the STAR 2-passalignment steps. We set --outFilterMultimapNmax to 1,--outSJfilterReads to Unique, --alignEndsType to End-ToEnd, --chimMainSegmentMultNmax to 1, --limitGeno-meGenerateRAM to 250,000,000,000, --sjdbOverhang to149, --runThreadN to 19, and --limitSjdbInsertNsj to 25,000,000. All other parameters were set to default values[68]. By adding read groups, sorting, marking duplicates,and creating indices, we obtained BAM files from SAMfiles generated by the STAR 2-pass alignment steps. Aftergenerating BAM files, we applied the GATK tool, SplitN-CigarReads, to BAM files, to split reads into exon seg-ments and cut sequences extending to intronic regions.Next, we called SNPs using the GATK tool,
Yin et al. BMC Genomics (2021) 22:269 Page 11 of 16

HaplotypeCaller, in which we set --genotyping_mode toDISCOVERY, --emitRefConfidence to GVCF, --variant_index_type to LINEAR, --variant_index_parameter to 128,000, -pairHMM to VECTOR_LOGLESS_CACHING,-ploidy to 2, and -maxAltAlleles to 100. Lastly, we per-formed joint genotyping using the GATK tool, Genoty-peGVCFs, with --max_alternate_alleles set to 100, andremoved all indels. To validate SNPs called from theGATK joint genotyping workflow with RNA-seq reads, weadditionally called SNPs following the RNA-seq variantcalling pipeline. The differences between the joint geno-typing workflow and the RNA-seq variant calling pipelinebegin with the application of HaplotypeCaller. In compari-son to the joint genotyping workflow, we supplied onesample to HaplotypeCaller at a time when applying theRNA-seq variant calling pipeline, in which we picked theoption -dontUseSoftClippedBases, and set -stand_call_conf to 20.0 and -maxAltAlleles to 100. Finally, we filteredvariants using the GATK tool, VariantFiltration, by setting-window to 35 and -cluster to 3 and applying filters “FS >30.0” and “QD < 2.0”, and removed indels.We used the SNPs that were identified in both the
GATK joint genotyping workflow and the RNA-seqpipeline in all subsequent analyses. For a subset of 18 in-dividuals, we sequenced both muscle and liver tissues.By independently calling SNPs with muscle and liver tis-sue samples from the same individuals, we were able tovalidate our SNP calling pipeline (i.e., we used genotypescalled from liver tissue as a validation for those calledfrom muscle tissue, see Fig. 4). Genotypes were identicalbetween muscle and liver tissues of the same individualat 93% of loci. For each individual, genotypes called atloci with fewer than five reads were set as missingvalues. Muscle samples from two individuals 401 (LakeChamplain) and 402 (Lake Michigan) (Table S1) hadover 90% missing data and thus were excluded from fur-ther analyses. Finally, we retained loci genotyped acrossat least 80% of all muscle samples or all liver samplesand removed loci with a minor allele frequency smallerthan 0.025 (i.e., an alternative allele had to be present inat least two out of 41 muscle samples and one out of 19liver samples).
Assessment of population structure, Hardy-Weinbergequilibrium, and genetic differentiationWe first tested population structure using the programSTRUCTURE (version 2.3) [31–34] using the options“admixture model” and “correlated allele frequenciesamong populations”. When running STRUCTURE, weset the length of burnin period to 50,000, the numberof MCMC reps after burnin to 50,000, and the numberof populations assumed (K) to 2 to 10. Since samplinglocations can assist the clustering for datasets with arelatively weak signal of structure when used as prior
information, we chose to use location information (i.e.,Lake Michigan, Lake Champlain, Connecticut River).With the 41 muscle samples (Lake Michigan: n = 15;
Lake Champlain: n = 12; Connecticut River: n = 14), wefirst excluded loci out of Hardy-Weinberg equilibriumidentified using the package HWxtest in R 3.6.1 (likeli-hood ratio p-value < 0.05) [71, 72] for each population.We calculated observed heterozygosity at each locus foreach population with SNPs that were in Hardy-Weinberg equilibrium and common to all three popula-tions. Sea lamprey have 99 chromosomes [70], 90 ofwhich are assembled, so we next calculated observedheterozygosity of each of the 90 assembled chromo-somes for each population by averaging observed hetero-zygosity across all loci within each chromosome in apopulation. We ran randomization tests to test whetherobserved heterozygosity at each locus and each chromo-some varied among the Lake Michigan, Lake Champlain,and Connecticut River populations. For a randomizationtest, we pooled the heterozygosity of all samples fromtwo populations, and randomly generated 10,000 pairs ofsubsamples of heterozygosity with two subsample sizesequal to sizes of two populations in a particular com-parison by sampling from the pooled heterozygositywithout replacement. For each of the 10,000 draws, wecalculated the absolute difference between the mean het-erozygosity of two subsamples as our test statistic, andcompared the absolute difference between each pair ofmean subsampled heterozygosity to the observed differ-ences in heterozygosity (Fig. S2). Additionally, we calcu-lated nucleotide diversity within each of the threepopulations (i.e., Lake Michigan, Lake Champlain, Con-necticut River; π) and between all three pairwise com-parisons (i.e., Lake Michigan vs. Lake Champlain, LakeMichigan vs. Connecticut River, Lake Champlain vs.Connecticut River) at each locus using the R packagePopGenome [73]. We averaged nucleotide diversitywithin populations across all loci on a chromosome andcompared mean observed heterozygosity and mean nu-cleotide diversity for each chromosome.We next calculated pairwise, unbiased FST for each
locus in Hardy-Weinberg equilibrium among all threepopulations (i.e., Lake Michigan vs. Lake Champlain,Lake Michigan vs. Connecticut River, and LakeChamplain vs. Connecticut River) using vcftools (ver-sion 0.1.16) [74]. To assess genetic differentiation atthe population level, we averaged FST across all lociin each comparison. To detect significant outliers, wez-transformed FST in each comparison to get Z(FST),and defined loci with FST greater than five standarddeviations from the mean as outlier loci (i.e., Z(FST) >5) [6]. To validate outliers identified by FST, we alsocalculated pairwise allele frequency difference (AFD)at each locus, z-transformed AFD to get Z (AFD),
Yin et al. BMC Genomics (2021) 22:269 Page 12 of 16

and compared analysis results based on FST and AFD[75]. We additionally ran genome scans based on k-nearest neighbor (kNN) techniques to assess whetheran outlier locus is driven by selection [76]. With pair-wise FST of all population comparisons, the kNN-based approach, which is implemented in the R pack-age PopGenome [73, 77], assigns all SNPs to multidi-mensional space [76]. SNPs that cluster together arelocated on potential genomic regions evolving neu-trally, while SNPs that are detected as outliers in thisspace are likely to be under selection. The entry ofthe ΔFST vector, which is calculated by subtractingthe medoid from the pairwise FST vector, indicateslocal adaptation when positive but introgression orselection reducing genetic divergence when negative[76]. After identifying outlier SNPs, we identified cor-responding genes (i.e., outlier genes) on which outlierloci were located by mapping outlier loci to the sealamprey genome [70] and calculated the allele fre-quency at each outlier locus. Lastly, we constructedgene ontology (GO) hierarchy networks of GO termsin the domain of “biological process” associated withoutlier genes, which were retrieved from Gene Ontol-ogy and GO Annotations (https://www.ebi.ac.uk/QuickGO/), for each pairwise comparison using themetacoder package [78].
Candidate genesBy examining the position of outlier loci on the anno-tated sea lamprey genome [70], we determined whetheran outlier SNP was located on introns, coding regions(CDS), or untranslated regions (3′ or 5′ UTR). For thoseon CDS of an outlier gene, we found open readingframes using the NCBI Open Reading Frame Finder bysetting minimal ORF length (nt) to 30 and ORF startcodon to “ATG and alternative initiation codons”. Whenthere were multiple open reading frames for a coding re-gion, we picked the longest one [6]. For the identifiedopen reading frame, we found the position where theoutlier SNP was located, set the outlier locus to refer-ence (i.e., ref ORF) and alternative (i.e., alt ORF) alleles,and translated the ref and alt ORFs for the same codingregion into reference and alternative amino acid se-quences, respectively. If reference and alternative aminoacid sequences were identical, the SNP located at theoutlier locus was classified as a synonymous change;otherwise, the SNP was classified as nonsynonymous. Alloutlier genes were assigned to one of two categories:those containing outlier SNPs causing synonymous sub-stitutions or outlier SNPs causing nonsynonymoussubstitutions.
Supplementary InformationThe online version contains supplementary material available at https://doi.org/10.1186/s12864-021-07553-x.
Additional file 1: Figure S1. Population structure of Lake Michigan,Lake Champlain, and Connecticut River sea lamprey (K = 2, 4, 10).Likelihood values for K = 2, K = 4 and K = 10 are −11,693,170, −11,023,345,and −11,043,300, respectively. Figure S2. Randomization tests onobserved heterozygosity among three populations. Observedheterozygosity (Ho) of each chromosome (by chr; sea lamprey have 99chromosomes, 90 of which are assembled) and at SNPs (by SNP)calculated using 346,280 SNPs across the genome that are in Hardy-Weinberg equilibrium and in common to Lake Michigan (LM), LakeChamplain (LC) and Connecticut River (CT) populations differs signifi-cantly between each pairwise comparison (LM vs. LC, LM vs. CT, LC vs.CT; p < 0.0001 for all three pairwise comparisons). Figure S3. Observedheterozygosity and nucleotide diversity (π) of three populations. Sea lam-prey have 99 chromosomes, of which the first 90 are assembled. Meanobserved heterozygosity and mean nucleotide diversity across eachchromosome are highly correlated in Lake Michigan (a), Lake Champlain(b), and Connecticut River (c) populations. Mean nucleotide diversityacross the genome is indicated by dashed lines and nucleotide diversityof chromosomes is indicated by points (d). Nucleotide diversity (π) showsa similar pattern as observed heterozygosity, which is the highest in Con-necticut River, followed by Lake Michigan and Lake Champlain (d). Fig-ure S4. Z(FST) along 90 chromosomes in three pairwise comparisons. Sealamprey have 99 chromosomes, 90 of which are assembled. In compari-son to Fig. 2a & b, this figure shows Z(FST) of all SNPs in comparisons be-tween Lake Michigan and Lake Champlain (a), Lake Michigan andConnecticut River (b), and Lake Champlain and Connecticut River (c), ra-ther than mean Z(FST) (Fig. 2 main text) of SNPs on genes without outlierSNPs. Alternating colors purple and grey represent Z(FST) of SNPs on dif-ferent chromosomes and alternating colors blue and black representZ(FST) of SNPs on neighboring outlier genes. Outlier SNPs with Z(FST) butin purple and grey are those that are not located on any annotated gene.Figure S5. Mean read depth of each population and number of sharedloci in each pairwise comparison. Mean read depths in three populationsare almost identical (a) and numbers of shared loci used to calculate FSTand AFD for three pairwise comparisons among Lake Michigan (LM), LakeChamplain (LC), and Connecticut River (CT) are almost identical (b). Fig-ure S6. Correlations between FST and AFD in three pairwise comparisons.Figure S7. Gene ontology (GO) hierarchy networks. The GO hierarchynetworks are constructed from GO terms associated with one outliergene in comparisons between Lake Michigan and Connecticut River (a)and between Lake Champlain and Connecticut River (b) using the meta-coder package in R. Branch and node colors indicate the biologicalprocess child term to which distal nodes belong and the central greynode represents the biological process level of the GO hierarchy. FigureS8. Z-transformed FST (i.e., Z(FST)), genomic regions, and allele frequencyof SNPs for additional outlier genes. Z(FST) of all SNPs on outlier genesidentified with muscle samples that may contribute to adaptation to localenvironments (i.e., reproduction, bioenergetics) in sea lamprey are shownalong corresponding chromosomes with SNPs on introns, untranslatedregions (UTR), and coding regions (CDS) indicated in different colors (leftpanels). Shifts in allele frequency of SNPs with the highest Z(FST) or caus-ing nonsynonymous mutations on outlier genes in Lake Michigan, LakeChamplain, and Connecticut River populations are almost identical acrossdifferent tissue types (i.e., muscle and liver shown in middle and rightpanels, respectively). The dark grey horizontal bar on the top left of theleft panel represents the length of an outlier gene. STARD10 and TTC25are associated with reproduction (a, b), and PYGL and DIN4 with bioener-getics (c, d). Figure S9. FST, nucleotide diversity within populations, andnucleotide diversity between populations at outlier and surroundingSNPs. Dashed lines represent average FST (black lines), nucleotide diversitywithin populations (blue lines), and nucleotide diversity between popula-tions (red lines) of all SNPs 50 Kb upstream and downstream (i.e., 100 Kbwindow) from the outlier SNP with the highest FST. Points indicate FST(black), nucleotide diversity within populations (blue), and nucleotide di-versity between populations (red) of outlier SNPs. Plots were qualitativelyand nearly numerically identical for ±10 Kb, ±100 Kb, and ± 500 Kb
Yin et al. BMC Genomics (2021) 22:269 Page 13 of 16
windows (with the exception of PGR at the ±10 Kb and ± 500 Kb win-dows, which had slightly higher within population nucleotide diversitythan the ±10 Kb and ± 500 Kb averages). Single window averages wereused instead of a standard sliding window approach because RNA-seqdata generates SNP loci that are highly clustered within, but not be-tween, genic regions. Where necessary, points were jittered for visual clar-ity. At all eight outlier genes, FST and nucleotide diversity betweenpopulations tend to increase while nucleotide diversity within popula-tions tends to decrease at outlier SNPs in compaSTrison to the average,suggesting that divergence at these genes is driven by local adaptation.Table S1. Summary of tissue samples used for RNA-seq. Table S2. Sum-mary of outlier SNPs and outlier genes. LM vs. CT stands for the pairwisecomparison between Lake Michigan and Connecticut River populations,and LC vs. CT stands for the pairwise comparison between Lake Cham-plain and Connecticut River populations. See Table S3 for full genenames. Table S3. Full gene names of outlier genes retrieved fromhttps://david.ncifcrf.gov/list.jsp. Table S4. Gene ontology (GO) terms ofbiological process associated with outlier genes retrieved from https://www.ebi.ac.uk/QuickGO/.
AcknowledgementsWe thank the editor and three anonymous reviewers for comments thatgreatly improved this manuscript. We also thank B.J. Allaire, Bryan Apell,William Ardren, Steve Gephard, Nick Johnson, Robert Stira, Bradley Young,the Conte Anadromous Fish Research Laboratory, Michigan DNR,Connecticut Department of Energy and Environmental Protection,Hammond Bay Biological Station, and U.S. Fish & Wildlife for assistance withcollecting larval lamprey. Abigail Perkins, Morgan Sparks, Avril Harder, JannaWilloughby, Lori Criger, Sam Guffey, Elizabeth LaRue, Phillip San Miguel, BobRode, Mike Siefkes, Jeramiah Smith, Benson Solomon, and the PurdueGenomics Core provided assistance with experimental design, execution,and analyses. Matthew Byrnes, Matthew Campbell, Lindsey Dice, JessicaElliott, Megan Gannon, Nathan Greiling, Kimberly Gulbranson, Jason Jaworski,Tara Novak, Ashe Owens, Emily Reverman, and Cassidy Robinson providedassistance at the aquaculture research lab. We additionally thank JannaWilloughby for sharing the map used in Fig. 1.
Authors’ contributionsMRC, XY, and MSS designed the project, ASM performed molecular analyses,XY performed genomic analyses, and XY and MRC wrote the manuscript withinput from all authors. The authors read and approved the final manuscript.
FundingThis research was funded by the Great Lakes Fishery Commission Project ID:2016_CHR_54053.
Availability of data and materialsCode and scripts are available at https://github.com/ChristieLab/sea_lamprey_adaptation. Trimmed reads are available via https://www.ncbi.nlm.nih.gov/srawith BioProject accession number PRJNA667554.
Declarations
Ethics approval and consent to participateThis study was conducted in accordance with the recommendations in theGuide for the Care and Use of Laboratory Animals of the National Institutesof Health. The Purdue Animal Care and Use Committee (PACUC) wasinformed of this study, but did not require animal care protocols for thelarval sea lamprey used in this study.
Consent for publicationThe authors consent to the publication of this manuscript.
Competing interestsThe authors declare that they have no competing interests.
Received: 9 December 2020 Accepted: 23 March 2021
References1. Lee CE. Evolutionary genetics of invasive species. Trends Ecol Evol. 2002;
17(8):386–91. https://doi.org/10.1016/S0169-5347(02)02554-5.2. Prentis PJ, Wilson JRU, Dormontt EE, Richardson DM, Lowe AJ. Adaptive
evolution in invasive species. Trends Plant Sci. 2008;13(6):288–94. https://doi.org/10.1016/j.tplants.2008.03.004.
3. Stockwell CA, Hendry AP, Kinnison MT. Contemporary evolution meetsconservation biology. Trends Ecol Evol. 2003;18(2):94–101. https://doi.org/10.1016/S0169-5347(02)00044-7.
4. Carlson SM, Cunningham CJ, Westley PAH. Evolutionary rescue in achanging world. Trends Ecol Evol. 2014;29(9):521–30. https://doi.org/10.1016/j.tree.2014.06.005.
5. Sax DF, Stachowicz JJ, Brown JH, Bruno JF, Dawson MN, Gaines SD, et al.Ecological and evolutionary insights from species invasions. Trends EcolEvol. 2007;22(9):465–71. https://doi.org/10.1016/j.tree.2007.06.009.
6. Willoughby JR, Harder AM, Tennessen JA, Scribner KT, Christie MR. Rapidgenetic adaptation to a novel environment despite a genome-widereduction in genetic diversity. Mol Ecol. 2018;27(20):4041–51. https://doi.org/10.1111/mec.14726.
7. Bryan MB, Zalinski D, Filcek KB, Libants S, Li W, Scribner KT. Patterns ofinvasion and colonization of the sea lamprey (Petromyzon marinus) in NorthAmerica as revealed by microsatellite genotypes. Mol Ecol. 2005;14(12):3757–73. https://doi.org/10.1111/j.1365-294X.2005.02716.x.
8. Lampreys of the world. An annotated and illustrated catalogue of lampreyspecies known to date. FAO Species Catalogue for Fishery Purposes No. 5.ISSN 1020-8682. Accessible at http://www.fao.org/3/i2335e/i2335e.pdf.
9. Youson JH. The biology of metamorphosis in sea lampreys: endocrine,environmental, and physiological cues and events, and their potentialapplication to lamprey control. J Gt Lakes Res. 2003;29:26–49. https://doi.org/10.1016/S0380-1330(03)70476-6.
10. Handbook of European Freshwater Fishes. https://www.nhbs.com/handbook-of-european-freshwater-fishes-book. Accessed 21 Jan 2020.
11. Gage SH, Gage-Day M. The anti-coagulating action of the secretion of thebuccal glands of the lampreys (petromyzon, Lampetra and Entosphenus).Science. 1927;66(1708):282–4. https://doi.org/10.1126/science.66.1708.282.
12. Bjerselius R, Li W, Teeter JH, Seelye JG, Johnson PB, Maniak PJ, et al. Directbehavioral evidence that unique bile acids released by larval sea lamprey(Petromyzon marinus) function as a migratory pheromone. Can J Fish AquatSci. 2000;57:557569.
13. Sorensen PW, Vrieze LA. The chemical ecology and potential application ofthe sea lamprey migratory pheromone. J Gt Lakes Res. 2003;29:66–84.https://doi.org/10.1016/S0380-1330(03)70478-X.
14. Sorensen P, Hoye T. A critical review of the discovery and application of amigratory pheromone in an invasive fish, the sea lamprey, Petromyzonmarinus L. J Fish Biol. 2007;71:100–14. https://doi.org/10.1111/j.1095-8649.2007.01681.x.
15. Teeter J. Pheromone communication in sea lampreys (Petromyzon marinus):implications for population management. Can J Fish Aquat Sci. 2011;37:2123–32.
16. Waldman J, Grunwald C, Wirgin I. Sea lamprey Petromyzon marinus: anexception to the rule of homing in anadromous fishes. Biol Lett. 2008;4(6):659–62. https://doi.org/10.1098/rsbl.2008.0341.
17. Potter IC. The Petromyzoniformes with particular reference to pairedspecies. Can J Fish Aquat Sci. 1980;37(11):1595–615. https://doi.org/10.1139/f80-207.
18. Halnon L. Historical survey of Lake Champlain’s fishes. Federal Aid JobPerformance Report F-1-R-10, Job 6. Montpelier: Vermont Fish and GameDepartment; 1963.
19. Lark JGI. An early record of the sea lamprey (Petromyzon marinus) from LakeOntario, vol. 30; 1973.
20. Wigley RL. Life history of the sea lamprey of Cayuga Lake. New York FishBull. 1959;59:56.
21. Natural history of the sea lamprey (Petromyzon marinus) in Michigan.Scientific Publications Office. https://spo.nmfs.noaa.gov/content/natural-history-sea-lamprey-petromyzon-marinus-michigan. Accessed 22 Jan 2020.
22. Smith BR, Tibbles JJ. Sea lamprey (Petromyzon marinus) in lakes Huron,Michigan, and superior: history of invasion and control, 1936–78. Can J FishAquat Sci. 1980;37(11):1780–801. https://doi.org/10.1139/f80-222.
Yin et al. BMC Genomics (2021) 22:269 Page 14 of 16

23. Lavis DS, Henson MP, Johnson DA, Koon EM, Ollila DJ. A case history of sealamprey control in Lake Michigan: 1979 to 1999. J Gt Lakes Res. 2003;29:584–98. https://doi.org/10.1016/S0380-1330(03)70518-8.
24. Ellen Marsden J, Chipman BD, Nashett LJ, Anderson JK, Bouffard W, DurfeyL, et al. Sea lamprey control in lake Champlain. J Gt Lakes Res. 2003;29:655–76. https://doi.org/10.1016/S0380-1330(03)70522-X.
25. Heinrich JW, Weise JG, Smith BR. Changes in biological characteristics of thesea lamprey (Petromyzon marinus) as related to lamprey abundance, preyabundance, and sea lamprey control. Can J Fish Aquat Sci. 1980;37(11):1861–71. https://doi.org/10.1139/f80-228.
26. Young RJ, Kelso JRM, Weise JG. Occurrence, relative abundance, and size oflandlocked sea lamprey (Petromyzon marinus) ammocoetes in relation tostream characteristics in the Great Lakes. Can J Fish Aquat Sci. 1990;47(9):1773–8. https://doi.org/10.1139/f90-201.
27. Dybdahl MF, Kane SL. Adaptation vs. phenotypic plasticity in the success of aclonal invader. Ecology. 2005;86(6):1592–601. https://doi.org/10.1890/04-0898.
28. Schmidt L, Schmid B, Oja T, Fischer M. Genetic differentiation, phenotypicplasticity and adaptation in a hybridizing pair of a more common and a lesscommon Carex species. Alp Bot. 2018;128(2):149–67. https://doi.org/10.1007/s00035-018-0211-8.
29. Sabino-Pinto J, Goedbloed DJ, Sanchez E, Czypionka T, Nolte AW, SteinfartzS. The role of plasticity and adaptation in the incipient speciation of a firesalamander population. Genes. 2019;10(11):1. https://doi.org/10.3390/genes10110875.
30. Yin X, Martinez AS, Perkins A, Sparks MM, Harder AM, Willoughby JR, et al.Incipient resistance to an effective pesticide results from genetic adaptationand the canalization of gene expression. Evol Appl. 2020;00(3):1–13. https://doi.org/10.1111/eva.13166.
31. Pritchard JK, Stephens M, Donnelly P. Inference of population structureusing multilocus genotype data. Genetics. 2000;15:945.
32. Falush D, Stephens M, Pritchard JK. Inference of population structure usingmultilocus genotype data: Linked loci and correlated allele frequencies.Genetics. 2003;164(4):1567.
33. Falush D, Stephens M, Pritchard JK. Inference of population structure usingmultilocus genotype data: dominant markers and null alleles. Mol EcolNotes. 2007;7(4):574–8. https://doi.org/10.1111/j.1471-8286.2007.01758.x.
34. Hubisz MJ, Falush D, Stephens M, Pritchard JK. Inferring weak populationstructure with the assistance of sample group information. Mol Ecol Resour.2009;9(5):1322–32. https://doi.org/10.1111/j.1755-0998.2009.02591.x.
35. Booker TR, Yeaman S, Whitlock MC. Global adaptation complicates theinterpretation of genome scans for local adaptation. Evol Lett. 2021;5(1):4–15. https://doi.org/10.1002/evl3.208.
36. Cavari B, Funkenstein B, Chen TT, Gonzalez-Villasenor LI, Schartl M. Effect ofgrowth hormone on the growth rate of the gilthead seabream (Sparusaurata), and use of different constructs for the production of transgenic fish.In: Gall GAE, Chen H, editors. Genetics in aquaculture. Amsterdam: Elsevier;1993. p. 189–97. https://doi.org/10.1016/B978-0-444-81527-9.50022-1.
37. Zhu Y, Liu D, Shaner ZC, Chen S, Hong W, Stellwag EJ. Nuclear progestinreceptor (Pgr) knockouts in zebrafish demonstrate role for Pgr in ovulationbut not in rapid non-genomic steroid mediated meiosis resumption. FrontEndocrinol. 2015;6:1. https://doi.org/10.3389/fendo.2015.00037.
38. Fang X, Wu L, Yang L, Song L, Cai J, Luo F, et al. Nuclear progestin receptor(Pgr) knockouts resulted in subfertility in male tilapia (Oreochromis niloticus).J Steroid Biochem Mol Biol. 2018;182:62–71. https://doi.org/10.1016/j.jsbmb.2018.04.011.
39. Albalat R, Brunet F, Laudet V, Schubert M. Evolution of retinoid and steroidsignaling: vertebrate diversification from an amphioxus perspective.Genome Biol Evol. 2011;3:985–1005. https://doi.org/10.1093/gbe/evr084.
40. Xu Y, Cao J, Huang S, Feng D, Zhang W, Zhu X, et al. Characterization oftetratricopeptide repeat-containing proteins critical for cilia formation andfunction. PLoS One. 2015;10(4):e0124378. https://doi.org/10.1371/journal.pone.0124378.
41. Huizar RL, Lee C, Boulgakov AA, Horani A, Tu F, Marcotte EM, et al. A liquid-like organelle at the root of motile ciliopathy. eLife. 2018;7:e38497. https://doi.org/10.7554/eLife.38497.
42. Li J, Yu H, Wang W, Fu C, Zhang W, Han F, et al. Genomic andtranscriptomic insights into molecular basis of sexually dimorphic nuptialspines in Leptobrachium leishanense. Nat Commun. 2019;10(1):5551. https://doi.org/10.1038/s41467-019-13531-5.
43. Zammit VA, Newsholme EA. Activities of enzymes of fat and ketone-bodymetabolism and effects of starvation on blood concentrations of glucose
and fat fuels in teleost and elasmobranch fish. Biochem J. 1979;184(2):313–22. https://doi.org/10.1042/bj1840313.
44. McCue MD. Starvation physiology: reviewing the different strategies animalsuse to survive a common challenge. Comp Biochem Physiol A Mol IntegrPhysiol. 2010;156(1):1–18. https://doi.org/10.1016/j.cbpa.2010.01.002.
45. Chang C-H, Huang J-J, Yeh C-Y, Tang C-H, Hwang L-Y, Lee T-H. Salinityeffects on strategies of glycogen utilization in livers of euryhaline milkfish(Chanos chanos) under hypothermal stress. Front Physiol. 2018;9:1. https://doi.org/10.3389/fphys.2018.00081.
46. Fujiki Y, Ito M, Nishida I, Watanabe A. Multiple signaling pathways in geneexpression during sugar starvation. Pharmacological analysis of din geneexpression in suspension-cultured cells of Arabidopsis. Plant Physiol. 2000;124(3):1139–48. https://doi.org/10.1104/pp.124.3.1139.
47. Mitchell S, Ellingson C, Coyne T, Hall L, Neill M, Christian N, et al. Geneticvariation in the urea cycle: a model resource for investigating key candidategenes for common diseases. Hum Mutat. 2009;30(1):56–60. https://doi.org/10.1002/humu.20813.
48. Wilkie MP, Turnbull S, Bird J, Wang YS, Claude JF, Youson JH. Lampreyparasitism of sharks and teleosts: high capacity urea excretion in an extantvertebrate relic. Comp Biochem Physiol A Mol Integr Physiol. 2004;138(4):485–92. https://doi.org/10.1016/j.cbpb.2004.06.001.
49. Dlugosch KM, Parker IM. Founding events in species invasions: geneticvariation, adaptive evolution, and the role of multiple introductions. MolEcol. 2008;17(1):431–49. https://doi.org/10.1111/j.1365-294X.2007.03538.x.
50. Carlson SM, Seamons TR. A review of quantitative genetic components offitness in salmonids: implications for adaptation to future change. Evol Appl.2008;1(2):222–38. https://doi.org/10.1111/j.1752-4571.2008.00025.x.
51. Ye B, Wan Z, Wang L, Pang H, Wen Y, Liu H, et al. Heritability of growthtraits in the Asian seabass (Lates calcarifer). Aquac Fish. 2017;2(3):112–8.https://doi.org/10.1016/j.aaf.2017.06.001.
52. Christie MR, McNickle GG, French RA, Blouin MS. Life history variation ismaintained by fitness trade-offs and negative frequency-dependentselection. Proc Natl Acad Sci. 2018;115(17):4441–6. https://doi.org/10.1073/pnas.1801779115.
53. Barany A, Shaughnessy CA, Fuentes J, Mancera JM, McCormick SD.Osmoregulatory role of the intestine in the sea lamprey (Petromyzonmarinus). Am J Physiol-Regul Integr Comp Physiol. 2019;318:R410–7.
54. Shaughnessy CA, McCormick SD. Functional characterization andosmoregulatory role of the Na+−K+-2Cl− cotransporter in the gill of sealamprey (Petromyzon marinus), a basal vertebrate. Am J Physiol-Regul IntegrComp Physiol. 2019;318:R17–29.
55. Shaughnessy CA, Barany A, McCormick SD. 11-Deoxycortisol controlshydromineral balance in the most basal osmoregulating vertebrate, sealamprey (Petromyzon marinus). Sci Rep. 2020;10(1):12148. https://doi.org/10.1038/s41598-020-69061-4.
56. Sakamoto T, Shepherd BS, Madsen SS, Nishioka RS, Siharath K, Richman NH,et al. Osmoregulatory actions of growth hormone and prolactin in anadvanced teleost. Gen Comp Endocrinol. 1997;106(1):95–101. https://doi.org/10.1006/gcen.1996.6854.
57. Chang JC-H, Wu S-M, Tseng Y-C, Lee Y-C, Baba O, Hwang P-P. Regulation ofglycogen metabolism in gills and liver of the euryhaline tilapia (Oreochromismossambicus) during acclimation to seawater. J Exp Biol. 2007;210(Pt 19):3494–504. https://doi.org/10.1242/jeb.007146.
58. Gong N, Ferreira-Martins D, McCormick SD, Sheridan MA. Divergent genesencoding the putative receptors for growth hormone and prolactin in sealamprey display distinct patterns of expression. Sci Rep. 2020;10(1):1674.https://doi.org/10.1038/s41598-020-58344-5.
59. Lema SC, Carvalho PG, Egelston JN, Kelly JT, McCormick SD. Dynamics ofgene expression responses for ion transport proteins and aquaporins in thegill of a euryhaline pupfish during freshwater and high-salinity acclimation.Physiol Biochem Zool. 2018;91(6):1148–71. https://doi.org/10.1086/700432.
60. Dunlop ES, Christie MR, McLaughlin R, Steeves TB. Life history evolution ofsea lamprey predicted to reduce the effectiveness of pesticide control. J GtLakes Res Press.
61. Fourcade Y, Chaput-Bardy A, Secondi J, Fleurant C, Lemaire C. Is localselection so widespread in river organisms? Fractal geometry of rivernetworks leads to high bias in outlier detection. Mol Ecol. 2013;22(8):2065–73. https://doi.org/10.1111/mec.12158.
62. Bierne N, Roze D, Welch JJ. Pervasive selection or is it … ? Why are FSToutliers sometimes so frequent? Mol Ecol. 2013;22(8):2061–4. https://doi.org/10.1111/mec.12241.
Yin et al. BMC Genomics (2021) 22:269 Page 15 of 16

63. Posavi M, Gulisija D, Munro JB, Silva JC, Lee CE. Rapid evolution of genome-wide gene expression and plasticity during saline to freshwater invasions bythe copepod Eurytemora affinis species complex. Mol Ecol. 2020;29(24):4835–56. https://doi.org/10.1111/mec.15681.
64. Stern DB, Lee CE. Evolutionary origins of genomic adaptations in an invasivecopepod. Nat Ecol Evol. 2020;4(8):1084–94. https://doi.org/10.1038/s41559-020-1201-y.
65. Hellmann JJ, Byers JE, Bierwagen BG, Dukes JS. Five potential consequencesof climate change for invasive species. Conserv Biol. 2008;22(3):534–43.https://doi.org/10.1111/j.1523-1739.2008.00951.x.
66. Bolger AM, Lohse M, Usadel B. Trimmomatic: a flexible trimmer for Illuminasequence data. Bioinforma Oxf Engl. 2014;30(15):2114–20. https://doi.org/10.1093/bioinformatics/btu170.
67. MacManes MD. On the optimal trimming of high-throughput mRNAsequence data. Front Genet. 2014;5:1. https://doi.org/10.3389/fgene.2014.00013.
68. McKenna A, Hanna M, Banks E, Sivachenko A, Cibulskis K, Kernytsky A, et al.The genome analysis toolkit: a MapReduce framework for analyzing next-generation DNA sequencing data. Genome Res. 2010;20(9):1297–303.https://doi.org/10.1101/gr.107524.110.
69. Brouard J-S, Schenkel F, Marete A, Bissonnette N. The GATK jointgenotyping workflow is appropriate for calling variants in RNA-seqexperiments. J Anim Sci Biotechnol. 2019;10(1):44. https://doi.org/10.1186/s40104-019-0359-0.
70. Smith JJ, Timoshevskaya N, Ye C, Holt C, Keinath MC, Parker HJ, et al. Thesea lamprey germline genome provides insights into programmed genomerearrangement and vertebrate evolution. Nat Genet. 2018;50(2):270–7.https://doi.org/10.1038/s41588-017-0036-1.
71. Engels WR. Exact tests for hardy-Weinberg proportions. Genetics. 2009;183(4):1431–41. https://doi.org/10.1534/genetics.109.108977.
72. R Core Team. R: A language and environment for statistical computing. RFoundation for Statistical Computing, Vienna, Austria. 2019. URL https://www.R-project.org/.
73. Pfeifer B, Wittelsbürger U, Ramos-Onsins SE, Lercher MJ. PopGenome: anefficient Swiss army knife for population genomic analyses in R. Mol BiolEvol. 2014;31(7):1929–36. https://doi.org/10.1093/molbev/msu136.
74. Weir BS, Cockerham CC. Estimating F-statistics for the analysis of populationstructure. Evolution. 1984;38(6):1358–70. https://doi.org/10.1111/j.1558-5646.1984.tb05657.x.
75. Berner D. Allele frequency difference AFD–an intuitive alternative to FST forquantifying genetic population differentiation. Genes. 2019;10(4):308.https://doi.org/10.3390/genes10040308.
76. Pfeifer B, Alachiotis N, Pavlidis P, Schimek MG. Genome scans for selectionand introgression based on k-nearest neighbour techniques. Mol EcolResour. 2020;20(6):1597. https://doi.org/10.1111/1755-0998.13221.
77. Schubert E, Zimek A. ELKI: A large open-source library for data analysis -ELKI Release 0.7.5 “Heidelberg”. 2019. https://arxiv.org/abs/1902.03616v1.Accessed 13 Nov 2020.
78. Foster ZSL, Sharpton TJ, Grünwald NJ. Metacoder: an R package forvisualization and manipulation of community taxonomic diversity data.PLoS Comput Biol. 2017;13(2):e1005404. https://doi.org/10.1371/journal.pcbi.1005404.
Publisher’s NoteSpringer Nature remains neutral with regard to jurisdictional claims inpublished maps and institutional affiliations.
Yin et al. BMC Genomics (2021) 22:269 Page 16 of 16