Effect of Weight Loss by Diet or Gastric Bypass Surgery on Peptide YY3–36 Levels
13
Effect of Weight Loss by Diet or Gastric Bypass Surgery on Peptide YY 3–36 Levels Blanca Oliván, MD * , Julio Teixeira, MD † , Mousumi Bose, PhD * , Baani Bawa, BA * , Tangel Chang, MS * , Heather Summe, MS * , Hongchan Lee, MD † , and Blandine Laferrère, MD * * Obesity Research Center, St. Luke’s-Roosevelt Hospital Center, Columbia University College of Physicians and Surgeons, New York, NY † Bariatric Division, St. Luke’s-Roosevelt Hospital Center, Columbia University College of Physicians and Surgeons, New York, NY. Abstract Objective—To examine the effect of an equivalent weight loss, by gastric bypass surgery (GBP) or by diet, on peptide YY 3–36 (PYY 3–36 ), ghrelin, and leptin levels and to determine the effect of diabetes status on PYY 3–36 levels. Summary Background Data—The increased PYY 3–36 levels after GBP may be involved in the magnitude and the sustainability of weight loss after surgery. Methods—Of the 30 morbidly obese women who participated in the study, 21 had type 2 diabetes mellitus, and were studied before and after equivalent weight loss of 10 kg by either GBP (n = 11) or by diet (n = 10). Results—PYY 3–36 levels were higher in obese diabetic as compared with nondiabetic individuals (64.1 ± 34.4 pg/mL vs. 39.9 ± 21.1 pg/mL; P < 0.05). PYY 3–36 levels increased markedly in response to oral glucose after GBP (peak: 72.3 ± 20.5 pg/mL–132.7 ± 49.7 pg/mL; P < 0.001; AUC 0–180 : 51.5 ± 23.3 pg/mL.min −1 –91.1 ± 32.2 pg/mL.min −1 P < 0.001), but not after diet (peak: 85.5 ± 51.9 pg/ mL–84.8 ± 41.13 pg/mL; P = NS; AUC 0–180 : 68.3 ± 38.5 pg/mL.min −1 –61.1 ± 42.2 pg/mL.min −1 P = NS). Fasting ghrelin levels increased after diet (425 ± 91 pg/mL–519 ± 105 pg/mL; P < 0.05), but did not change after GBP (506 ± 121 pg/mL–482 ± 196 pg/mL; P = NS). Conclusions—Diabetes status seems to be a determinant of PYY 3–36 levels. GBP, but not diet- induced weight loss, resulted in markedly increased glucose-stimulated PYY 3–36 levels. The increase in stimulated PYY 3–36 levels after GBP is likely a result of the surgery rather than a secondary outcome of weight loss. Changes in PYY 3–36 levels and ghrelin could contribute to the success of GBP in sustaining weight loss. Weight loss by diet is often of small magnitude and difficult to sustain over time. On the contrary, bariatric surgery, particularly Roux-en-Y gastric bypass (GBP), typically results in loss of 50% excess body weight within the first year, and the effect is often sustained at 10 years. The rapid and dramatic resolution of type 2 diabetes mellitus (T2DM) after GBP has led to the hypothesis that some of the metabolic effects of the surgery may be independent of weight loss1 – 3 and may be related to the changes in incretins, gut hormones that stimulate insulin secretion.4 , 5 The mechanisms by which GBP suppresses appetite are not clear. The Copyright © 2009 by Lippincott Williams & Wilkins Reprints: Blandine Laferrère, MD, New York Obesity Research Center, Babcock Room 1024, 1111 Amsterdam Ave, New York, NY 10025. [email protected]. J.T., B.B., H.S., T.C., M.B., H.L., and B.O. have nothing to declare. NIH Public Access Author Manuscript Ann Surg. Author manuscript; available in PMC 2010 June 1. Published in final edited form as: Ann Surg. 2009 June ; 249(6): 948–953. doi:10.1097/SLA.0b013e3181a6cdb0. NIH-PA Author Manuscript NIH-PA Author Manuscript NIH-PA Author Manuscript
-
Upload
independent -
Category
Documents
-
view
0 -
download
0
Transcript of Effect of Weight Loss by Diet or Gastric Bypass Surgery on Peptide YY3–36 Levels
Effect of Weight Loss by Diet or Gastric Bypass Surgery onPeptide YY3–36 Levels
Blanca Oliván, MD*, Julio Teixeira, MD†, Mousumi Bose, PhD*, Baani Bawa, BA*, TangelChang, MS*, Heather Summe, MS*, Hongchan Lee, MD†, and Blandine Laferrère, MD**Obesity Research Center, St. Luke’s-Roosevelt Hospital Center, Columbia University College ofPhysicians and Surgeons, New York, NY†Bariatric Division, St. Luke’s-Roosevelt Hospital Center, Columbia University College of Physiciansand Surgeons, New York, NY.
AbstractObjective—To examine the effect of an equivalent weight loss, by gastric bypass surgery (GBP)or by diet, on peptide YY3–36 (PYY3–36), ghrelin, and leptin levels and to determine the effect ofdiabetes status on PYY3–36 levels.
Summary Background Data—The increased PYY3–36 levels after GBP may be involved in themagnitude and the sustainability of weight loss after surgery.
Methods—Of the 30 morbidly obese women who participated in the study, 21 had type 2 diabetesmellitus, and were studied before and after equivalent weight loss of 10 kg by either GBP (n = 11)or by diet (n = 10).
Results—PYY3–36 levels were higher in obese diabetic as compared with nondiabetic individuals(64.1 ± 34.4 pg/mL vs. 39.9 ± 21.1 pg/mL; P < 0.05). PYY3–36 levels increased markedly in responseto oral glucose after GBP (peak: 72.3 ± 20.5 pg/mL–132.7 ± 49.7 pg/mL; P < 0.001; AUC0–180: 51.5± 23.3 pg/mL.min−1–91.1 ± 32.2 pg/mL.min−1 P < 0.001), but not after diet (peak: 85.5 ± 51.9 pg/mL–84.8 ± 41.13 pg/mL; P = NS; AUC0–180: 68.3 ± 38.5 pg/mL.min−1–61.1 ± 42.2 pg/mL.min−1
P = NS). Fasting ghrelin levels increased after diet (425 ± 91 pg/mL–519 ± 105 pg/mL; P < 0.05),but did not change after GBP (506 ± 121 pg/mL–482 ± 196 pg/mL; P = NS).
Conclusions—Diabetes status seems to be a determinant of PYY3–36 levels. GBP, but not diet-induced weight loss, resulted in markedly increased glucose-stimulated PYY3–36 levels. The increasein stimulated PYY3–36 levels after GBP is likely a result of the surgery rather than a secondaryoutcome of weight loss. Changes in PYY3–36 levels and ghrelin could contribute to the success ofGBP in sustaining weight loss.
Weight loss by diet is often of small magnitude and difficult to sustain over time. On thecontrary, bariatric surgery, particularly Roux-en-Y gastric bypass (GBP), typically results inloss of 50% excess body weight within the first year, and the effect is often sustained at 10years. The rapid and dramatic resolution of type 2 diabetes mellitus (T2DM) after GBP has ledto the hypothesis that some of the metabolic effects of the surgery may be independent ofweight loss1–3 and may be related to the changes in incretins, gut hormones that stimulateinsulin secretion.4,5 The mechanisms by which GBP suppresses appetite are not clear. The
Copyright © 2009 by Lippincott Williams & WilkinsReprints: Blandine Laferrère, MD, New York Obesity Research Center, Babcock Room 1024, 1111 Amsterdam Ave, New York, NY10025. [email protected]., B.B., H.S., T.C., M.B., H.L., and B.O. have nothing to declare.
NIH Public AccessAuthor ManuscriptAnn Surg. Author manuscript; available in PMC 2010 June 1.
Published in final edited form as:Ann Surg. 2009 June ; 249(6): 948–953. doi:10.1097/SLA.0b013e3181a6cdb0.
NIH
-PA Author Manuscript
NIH
-PA Author Manuscript
NIH
-PA Author Manuscript
marked increase in levels of 2 anorexigenic hormones, peptide YY (PYY),6–10 and glucagon-like peptide 1 (GLP-1),4,7 could explain the increased satiety after GBP. A greater PYY releaseis associated with greater weight loss after GBP11 and weight regain has been shown withlower PYY levels in a rodent model.12 Previous reports on change in PYY levels after dietintervention are scarce, report only fasting levels, and are inconsistent.13,14
The gastric hormone ghrelin may also be implicated in meal-to-meal regulation.15 Its levelsincrease in anticipation of a meal and decrease after feeding, suggesting a role in short-termmeal-to-meal regulation.16 Ghrelin levels vary as a function of body mass index (BMI) andare low in obese individuals.17 The increase in ghrelin levels may explain weight regain aftera diet-induced weight loss.18 Contrary to weight loss by diet, most studies agree that ghrelinlevels decrease18,19 or do not increase in proportion to weight loss after GBP,6,20 an effectthat could favor a better control of appetite and the decreased food intake observed after thissurgery.
In addition to gut hormones, the adipocyte-secreted hormone, leptin, is also an importantregulator of energy balance in humans.21 Restriction of food intake or diet-induced weight lossdecreases plasma leptin levels. This decrease in leptin signals the hypothalamus a state ofnegative energy balance and thus triggers food intake.22 After GBP, leptin levels have beenfound to be lower than expected for a given BMI.6
The first goal of this study was to examine the effect of a short-term equivalent weight loss,by GBP or by diet, on PYY3–36, ghrelin, and leptin levels. Our secondary goal was to determinethe effect of BMI and diabetes status on PYY3–36 levels. Partial data on GLP-1 levels afterGBP and diet have been published before.2
SUBJECTS AND METHODSSubjects
A total of 30 women participated in the study: 21 morbidly obese with T2DM and 9 withoutT2DM. Inclusion criteria for obese patients were BMI >35 kg/m2and age <60 years and normalliver enzymes, thyroid function tests, and blood pressure. Obese individuals without T2DM (n= 9), on no medications that could interfere with glucose homeostasis, served as controls anddid not undergo weight loss. Patients with T2DM were diagnosed with T2DM less than 5 yearsago, were not on insulin, thiazolinediones, exenatide or dipeptidyl peptidase-IV inhibitors, andhad a hemoglobin A1C <8%. All patients with T2DM (n = 21) underwent weight loss and werestudied before and after 10 kg weight loss by GBP (surgical group, n = 11) or by diet (dietgroup, n = 10). Diabetes medications (sulfonylureas and/or metformin) were discontinued 3days before baseline studies and were adjusted during the diet-induced weight loss to avoidhypoglycemia. Patients after GBP discontinued their diabetes medications the day of thesurgery. Patients from the diet and surgical groups were matched for age, body weight, BMI,diabetes duration and control (hemoglobin A1C), and weight loss. The study was approved bythe review board of our institution and written informed consent was obtained from allparticipants before enrollment.
Diet-Induced Weight LossAs described previously,2 the diet consisted of a meal replacement plan of 1000 kcal/day. A1-week supply of meal replacement products (Robard Corporation, Mt. Laurel, NJ), includinghigh protein shakes, bars, fruit drinks, and soups, was given to each patient during individualweekly visit at the CRC. Fresh fruits and vegetables were allowed. Body weight was measuredweekly and the diet adjusted when necessary. If no weight loss, or if weight gain occurred bythe second consecutive weekly visit, the patients were excluded from the study. Although there
Oliván et al. Page 2
Ann Surg. Author manuscript; available in PMC 2010 June 1.
NIH
-PA Author Manuscript
NIH
-PA Author Manuscript
NIH
-PA Author Manuscript

was no time limit, the expectation was that patients would lose 10 kg in 4 to 8 weeks. Duringthe weight loss, patients were asked to monitor blood glucose levels by finger stick and bykeeping daily logs of measurements. Diabetes medications were adjusted by a nurse educatoror a diabetologist to avoid hypoglycemia and to fulfill the American Diabetes Associationstandard of treatment, based on fasting and postprandial glucose levels. Some diabetic patientson sulfonylureas had to decrease their medication and other subjects to stop it to avoidhypoglycemia.
Roux-en-Y Gastric Bypass ProtocolAll patients underwent a laparoscopic GBP. In brief, the jejunum was divided 30 cm from theligament of Treitz and anastomosed to a 30-mL proximal gastric pouch. The jejunum wasreanastomosed 150 cm distal to the gastrojejunostomy. All mesenteric defects were closed.The post-GBP diet recommendations included a daily intake of 600 to 800 kcal, 70 g of protein,and 1.8 L of fluid. This was achieved, on an individual basis, with multiple small meals andsnacks with various commercial protein supplements. The diet after GBP was monitored byfood records, but not directly supervised. The diet in the few days preceding the testing insurgical or diet patients before weight loss was not controlled for.
Three-Hour Oral Glucose Tolerance TestAll patients underwent a 3-hour oral glucose tolerance test (OGTT) with 50 g of glucose (200mL of noncarbonated glucose drink) in the morning after a 12-hour overnight fast in the CRC.After IV insertion, at 8:00 AM, subjects received 50 g of glucose orally. Blood samples werecollected at −15, 0, 15, 30,45, 60, 90, 120, and 180 minutes on chilled EDTA tubes with addedaprotinin (500 KIU)/mL of blood) and dipeptidyl peptidase-IV inhibitor (Millipore, St. Charles,MO) (10 µL/mL of blood) and centrifuged at 4°C, before storage at −70°C. Baseline valueswere the average of the blood samples obtained at −15 and 0 minutes before glucose intake.
Hormonal MeasurementsPYY3–36, total ghrelin, total GLP-1, leptin, and insulin were measured by radioimmunoassay(Millipore). All intra- and interassay CVs ranged from 3.4% to 7.4% and 4.4% to 7.4%,respectively. Samples for ghrelin assay were only available for 9 patients in the diet group; forthe leptin assay, samples were only available for 9 patients in the diet and for 8 in the GBPgroup. Blood glucose concentrations were measured at the bedside by the glucose oxidasemethod (Beckman glucose analyzer, Fullerton, CA). All hormonal and metabolite assays wereperformed at the Hormones and Metabolites Core Laboratory of the New York ObesityResearch Center.
Statistical AnalysisOutcome variables were fasting serum glucose, PYY3–36, insulin, GLP-1, leptin, and ghrelinconcentrations. The changes in the outcome variables during the OGTT were assessed by peaklevels (glucose, PYY3–36, insulin, GLP-1), maximum suppression (ghrelin), and total areasunder the curve (AUC0–180) calculated using the trapezoidal method. General linear modelwith repeated measures was used to detect hormonal changes over time during the OGTT withineach condition and before and after GBP. Paired t tests were used to compare data betweenbefore and after weight loss within each group. Unpaired t tests were used for comparisons ofhormonal levels between obese diabetic and obese nondiabetic patients. Data are expressed asthe mean ± SD except in figures, where they appear as mean ± SEM for graphic clarity.Significance was assumed for P < 0.05. Statistical analyses were performed with SPSS, Inc.version 16.0, Chicago, Illinois.
Oliván et al. Page 3
Ann Surg. Author manuscript; available in PMC 2010 June 1.
NIH
-PA Author Manuscript
NIH
-PA Author Manuscript
NIH
-PA Author Manuscript
RESULTSEffect of Weight Loss in Patients With T2DM: Comparison GBP Versus Diet
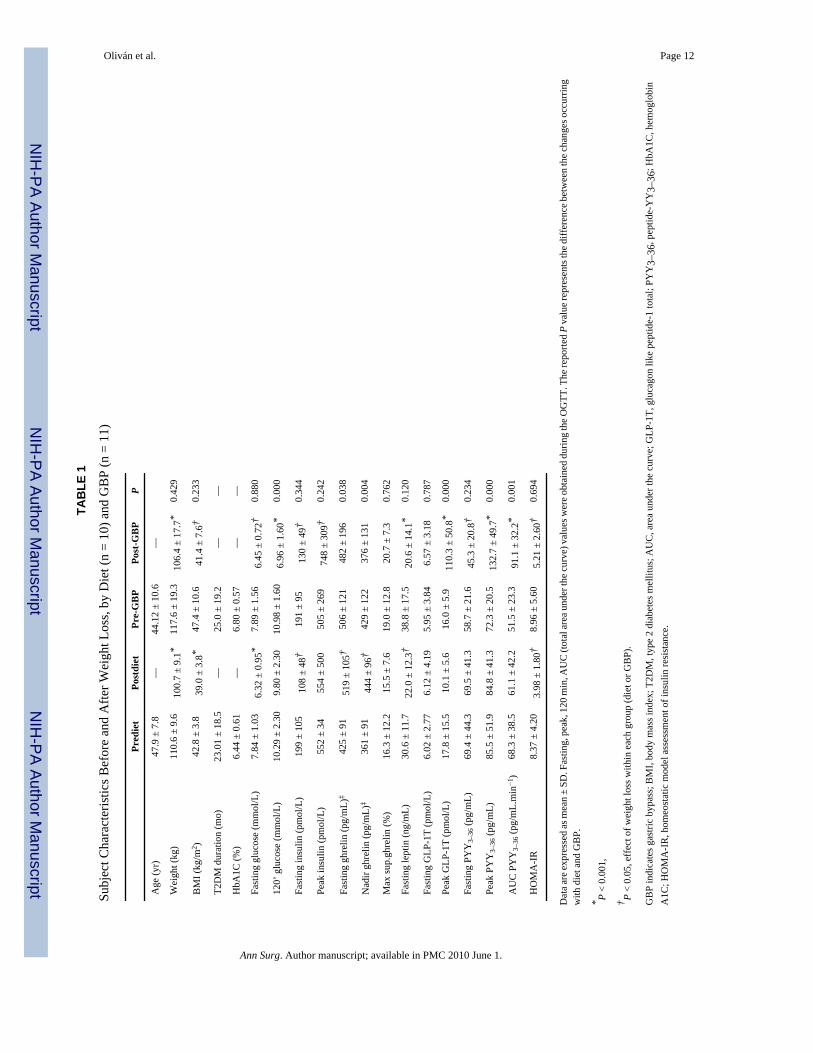
Clinical Characteristics of Study Groups—Subject characteristics are shown in Table1. There was no difference in glucose, fasting PYY3–36, GLP-1, ghrelin, and leptin serumconcentrations between the GBP and the diet group at baseline. The duration of weight losswas shorter for the GBP group (32.3 ± 13.1 days) compared with the diet group (55.0 ± 9.9days, P = 0.001) (Table 1).
Side Effects—Five of 11 patients experienced stomach cramping and discomfort, nausea,sweating, flushing, and palpitations 5 to 20 minutes into the 50 g OGTT, after GBP. No severeadverse effects were observed. There were no adverse effects after diet-induced weight loss.
Effect of Weight Loss on Fasting Glucose and Hormone Levels—After a meanweight loss of 10.6 kg (P = NS between groups), fasting glucose and insulin and HOMA-IRdecreased significantly and equally in the GBP and the diet group (Table 1). FastingPYY3–36 levels decreased after GBP (P = 0.016) but not after diet (P = 0.99) (Table 1). Fastingghrelin levels increased after diet (P = 0.017). On the contrary, after GBP, there was trend ofa decrease in ghrelin levels, although this was not significant (P = 0.28) (Table 1).
Leptin decreased by 50% after GBP (38.8 ± 17.5 ng/mL– 20.6 ± 14.1 ng/mL, P < 0.001) andby only 28% after diet (30.6 ± 11.7 ng/mL–22 ± 12.3 ng/mL, P = 0.012) (Table 1). Althoughfasting leptin levels decreased more in the GBP group as compared with the diet group, thedifference in the change between groups was not significant (P = 0.12).
Hormonal Response to Oral Glucose in Patients With T2DM: GBP Versus Diet—PYY3–36 levels increased markedly after GBP during the OGTT. Peak concentrationsoccurred at 45 minutes and remained significantly elevated compared with baseline for 180minutes (Table 1, Fig. 1). Stimulated PYY3–36 levels did not change after diet (Table 1, Fig.1, Fig. 2). Ghrelin levels (fasting and nadir after oral glucose) were higher after diet than afterGBP. However, the maximum ghrelin suppression did not change with either weight lossintervention (P = 0.762) (Table 1).
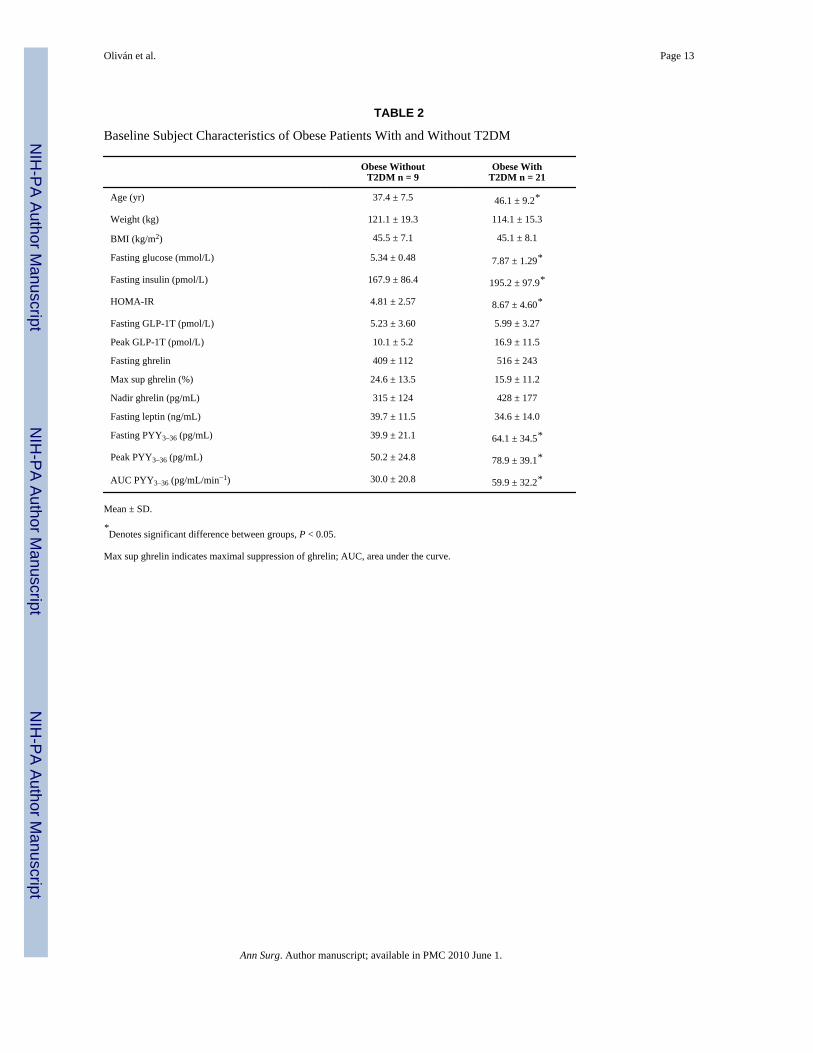
Effect of Diabetes Status on Hormone Levels—Subject characteristics of morbidlyobese with and without T2DM are shown in Table 2. Obese with T2DM had higher fastingPYY3–36 levels (P = 0.048) and oral glucose stimulated peak (P = 0.039) and AUC0–180 (P =0.011) PYY3–36 serum levels than obese without T2DM. PYY3–36 levels did not correlate withany markers of insulin resistance or secretion. Fasting leptin and ghrelin levels were notaffected by diabetes status. There was no correlation between leptin and PYY3–36 levels beforeor after weight loss or between changes in leptin with changes in PYY3–36.
DISCUSSIONOur goal was to assess changes of gut peptides after short-term weight loss by 2 differentmethods, diet and GBP surgery. We wished to elucidate possible hormonal mechanisms ofenergy homeostasis responsible for the greater efficacy of GBP compared with diet.
The main result of this study is that PYY3–36 levels increased markedly in response to oralglucose after GBP surgery, but not after an equivalent weight loss by diet. These results confirmprevious data from cross-sectional6,8 and prospective7,9–11 studies showing increased gutpeptide levels after GBP or jejuno-ileal bypass.23 Our data demonstrate that weight loss alonedoes not contribute to the changes in PYY levels observed after GBP, as stimulatedPYY3–36 levels did not increase after a diet-induced weight loss. To our knowledge, these are
Oliván et al. Page 4
Ann Surg. Author manuscript; available in PMC 2010 June 1.
NIH
-PA Author Manuscript
NIH
-PA Author Manuscript
NIH
-PA Author Manuscript
the first data on stimulated PYY3–36 level after diet-induced weight loss. Similarly to our resultsafter diet, PYY levels do not increase after purely restrictive surgeries such as gastric banding,8,24 although they increase after vertical banded gastroplasty.25 The mechanism by whichstimulated PYY levels increase after GBP could be related to the more rapid delivery ofnutrients, as intestinal transit time is accelerated after GBP7 and as suggested by studies afterileal transposition in rats.26 In our study, fasting PYY3–36 levels decreased after GBP but didnot change after diet. These findings are in contrast to those of Roth et al,13 who showed thatdiet-induced weight loss in obese children increased fasting PYY levels and of Pfluger et al,14 who showed a decrease in fasting PYY levels after diet in adults. Discrepancies betweenstudies could be related to age, sex, diabetes status, and/or energy balance differences.
PYY is rapidly cosecreted with GLP-1 from intestinal L-cells in response to food intake.27,28 We4 and others29 have shown a marked increase in GLP-1 levels in response to oral glucoseor a meal after GBP. The administration of PYY3–36
30 or of GLP-131–34 reduces food intakein lean and in obese human individuals. GLP-1 and PYY infused simultaneously lower foodintake more than either peptide administered alone in lean and obese rodents and in leanhumans.35 The increase in the levels of these 2 anorexigenic peptides in concert with thedecrease in the orexigenic peptide ghrelin, may act together with pancreatic and adiposehormones to inhibit energy intake and favor weight loss after GBP.12 Examples of theseinteractions have been demonstrated in rats: ghrelin attenuates, dose-dependently, the anorecticeffect of PYY and GLP-1,36 and the coadministration of leptin with PYY3–36 enhances theanoretic effects of PYY3–36.37
The compensatory increase in ghrelin levels after diet-induced weight loss was not observedafter GBP. Although conflicting results on the changes in plasma ghrelin after GBP have beenreported,6,18,24,38–43 most studies agree that ghrelin levels either decrease or do not increasein proportion to the amount of weight loss after GBP surgery. Ghrelin15,44 and ghrelinanalogs45,46 stimulate food intake in lean and obese humans and increase body weight andadiposity in rodents.15 The increase in ghrelin levels after diet may play a role in weight regainand explain, in part, the lower effectiveness of diet for sustained weight loss compared withGBP.
Despite similar weight loss, leptin levels decreased more after GBP than after diet, althoughthis did not reach statistical significance. Others have found lower leptin levels after GBPsurgery compared with a BMI-matched group.24 The relatively low levels of leptin after GBPmay indicate that factors other than the change in adipose mass may be responsible for thedecrease in circulating leptin concentration after GBP. In our study, the level of energyrestriction could account for variability in the decrease in leptin levels after GBP and diet.21
Different patterns in gut and pancreatic hormones resulting from GBP could also play a rolein the regulation of plasma leptin levels. In vitro, ghrelin stimulates the differentiation ofpreadipocytes47 and inhibits adipocyte apoptosis.48 The fall of ghrelin levels after GBP couldalter its effect on adipose tissue and modulate circulating leptin levels. In addition, leptin is notonly produced by adipose tissue but also in small amounts by the stomach,49 which is alteredafter surgery.
We found higher fasting and postprandial PYY3–36 levels in obese with T2DM compared withobese without T2DM. English et al also reported that fasting PYY levels were significantlyhigher in T2DM than in controls.50 However, other studies reported low fasting PYY plasmalevels in first-degree relatives of subjects with T2DM51 and blunted postprandial PYY levelsin early stages of T2DM development in genetically susceptible individuals.52 It is unclearwhether PYY levels contribute to the pathogenesis of T2DM and/or whether glucosehomeostasis modulates circulating PYY levels. As previously reported,50 we did not findsignificant correlation between PYY levels and markers of insulin secretion or sensitivity.
Oliván et al. Page 5
Ann Surg. Author manuscript; available in PMC 2010 June 1.
NIH
-PA Author Manuscript
NIH
-PA Author Manuscript
NIH
-PA Author Manuscript

Future larger studies are needed to clarify the role of PYY, if any, in the physiopathology ofT2DM. As shown by others,6,18,24,39–43,53 diabetes status had no effect on leptin or ghrelinlevels.
Our study has some limitations. The small amount of glucose administered in our study (50 gglucose, 200 Kcal) may have been insufficient to stimulate PYY3–36 release before weight lossintervention. PYY release is influenced by amount of calories54 and the nutrient compositionof the meal, with dietary carbohydrates being weaker stimulants of PYY than protein or fat.27,55–57 However, the same stimulus was able to markedly increase PYY3–36 levels after GBPto levels that could contribute to higher postprandial satiety and weight loss after GBP. Oralglucose is a clinical research tool, used by diabetologists, that reflects poorly on daily foodintake. Whether the large increase in PYY levels after oral glucose has any clinical relevanceunder conditions of normal feeding will remain to be determined. Another limitation of ourstudy is the lack of measurement of hunger or satiety ratings of ad libitum food intake. However,the changes in circulating levels of peptides implicated with meal-to-meal regulation correlatespoorly with quantified measures of hunger after GBP6,58 and ad libitum food intake is difficultto study in the early stages after GBP. Another limitation is the absence of perfect matchingin calorie restriction between the GBP and the diet group. The diet arm was designed to matchthe weight loss of the GBP group, not their calorie intake. However, the overall calorie deficitand weight loss were identical.
In summary, we show that the increase in PYY3–36 levels after GBP, but not after diet-inducedweight loss, results from the surgical procedure, independently of weight loss. The changes ofPYY3–36, ghrelin, and leptin levels, all important regulators of food intake and energyhomeostasis, may explain, in part, the greater effectiveness of GBP in sustaining weight losscompared with diet. Understanding the mechanisms involved in the changes of these peptidesafter the surgery could lead to new treatments for obesity and related metabolic conditions.
AcknowledgmentsThe authors thank our volunteer participants, Ping Zhou and Yim Dam for their technical help with hormonal assays,Drs. James McGinty and Ninan Koshy for referring patients to the study, and Antonia Colarusso and Betty Kovacsfor their help with recruitment and the diet-induced weight loss.
This work was funded by grants from the American Diabetes Association CR-7-05 CR-18, NIH R01-DK67561, GCRC1 UL1 RR024156-02, ORC DK-26687, DERC DK-63068-05, and Amylin Investigator Initiated Studies Program.B.L. received grant support through Amylin Investigator Initiated Studies Program in 2007.
REFERENCES1. Pories WJ, Caro JF, Flickinger EG, et al. The control of diabetes mellitus (NIDDM) in the morbidly
obese with the Greenville Gastric Bypass. Ann Surg 1987;206:316–323. [PubMed: 3632094]2. Laferrére B, Teixeira J, McGinty J, et al. Effect of weight loss by gastric bypass surgery versus
hypocaloric diet on glucose and incretin levels in patients with type 2 diabetes. J Clin EndocrinolMetab 2008;93:2479–2485. [PubMed: 18430778]
3. Rubino F, Gagner M, Gentileschi P, et al. The early effect of the Roux-en-Y gastric bypass on hormonesinvolved in body weight regulation and glucose metabolism. Ann Surg 2004;240:236–242. [PubMed:15273546]
4. Laferrére B, Heshka S, Wang K, et al. Incretin levels and effect are markedly enhanced 1 month afterRoux-en-Y gastric bypass surgery in obese patients with type 2 diabetes. Diabetes Care 2007;30:1709–1716. [PubMed: 17416796]
5. Rodieux F, Giusti V, D’Alessio DA, et al. Effects of gastric bypass and gastric banding on glucosekinetics and gut hormone release. Obesity (Silver Spring) 2008;16:298–305. [PubMed: 18239636]
Oliván et al. Page 6
Ann Surg. Author manuscript; available in PMC 2010 June 1.
NIH
-PA Author Manuscript
NIH
-PA Author Manuscript
NIH
-PA Author Manuscript
6. Korner J, Bessler M, Cirilo LJ, et al. Effects of Roux-en-Y gastric bypass surgery on fasting andpostprandial concentrations of plasma ghrelin, peptide YY, and insulin. J Clin Endocrinol Metab2005;90:359–365. [PubMed: 15483088]
7. Morinigo R, Moize V, Musri M, et al. Glucagon-like peptide-1, peptide YY, hunger, and satiety aftergastric bypass surgery in morbidly obese subjects. J Clin Endocrinol Metab 2006;91:1735–1740.[PubMed: 16478824]
8. le Roux CW, Aylwin SJ, Batterham RL, et al. Gut hormone profiles following bariatric surgery favoran anorectic state, facilitate weight loss, and improve metabolic parameters. Ann Surg 2006;243:108–114. [PubMed: 16371744]
9. Chan JL, Mun EC, Stoyneva V, et al. Peptide YY levels are elevated after gastric bypass surgery.Obesity (Silver Spring) 2006;14:194–198. [PubMed: 16571843]
10. Morinigo R, Vidal J, Lacy AM, et al. Circulating peptide YY, weight loss, and glucose homeostasisafter gastric bypass surgery in morbidly obese subjects. Ann Surg 2008;247:270–275. [PubMed:18216532]
11. le Roux CW, Welbourn R, Werling M, et al. Gut hormones as mediators of appetite and weight lossafter Roux-en-Y gastric bypass. Ann Surg 2007;246:780–785. [PubMed: 17968169]
12. Meguid MM, Glade MJ, Middleton FA. Weight regain after Roux-en-Y: a significant 20%complication related to PYY. Nutrition 2008;24:832–842. [PubMed: 18725080]
13. Roth CL, Enriori PJ, Harz K, et al. Peptide YY is a regulator of energy homeostasis in obese childrenbefore and after weight loss. J Clin Endocrinol Metab 2005;90:6386–6391. [PubMed: 16204364]
14. Pfluger PT, Kampe J, Castaneda TR, et al. Effect of human body weight changes on circulating levelsof peptide YY and peptide YY3-36. J Clin Endocrinol Metab 2007;92:583–588. [PubMed:17119001]
15. Wren AM, Seal LJ, Cohen MA, et al. Ghrelin enhances appetite and increases food intake in humans.J Clin Endocrinol Metab 2001;86:5992–5995. [PubMed: 11739476]
16. Cummings DE, Purnell JQ, Frayo RS, et al. A pre-prandial rise in plasma ghrelin levels suggests arole in meal initiation in humans. Diabetes 2001;50:1714–1719. [PubMed: 11473029]
17. Tschop M, Weyer C, Tataranni PA, et al. Circulating ghrelin levels are decreased in human obesity.Diabetes 2001;50:707–709. [PubMed: 11289032]
18. Cummings DE, Weigle DS, Frayo RS, et al. Plasma ghrelin levels after diet-induced weight loss orgastric bypass surgery. N Engl J Med 2002;346:1623–1630. [PubMed: 12023994]
19. Tritos NA, Mun E, Bertkau A, et al. Serum ghrelin levels in response to glucose load in obese subjectspost-gastric bypass surgery. Obes Res 2003;11:919–924. [PubMed: 12917494]
20. Karamanakos SN, Vagenas K, Kalfarentzos F, et al. Weight loss, appetite suppression, and changesin fasting and postprandial ghrelin and peptide-YY levels after Roux-en-Y gastric bypass and sleevegastrectomy: a prospective, double blind study. Ann Surg 2008;247:401–407. [PubMed: 18376181]
21. Havel PJ. Role of adipose tissue in body-weight regulation: mechanisms regulating leptin productionand energy balance. Proc Nutr Soc 2000;59:359–371. [PubMed: 10997652]
22. Flier JS. Clinical review 94: what’s in a name? In search of leptin’s physiologic role. J Clin EndocrinolMetab 1998;83:1407–1413. [PubMed: 9589630]
23. Naslund E, Gryback P, Hellstrom PM, et al. Gastrointestinal hormones and gastric emptying 20 yearsafter jejunoileal bypass for massive obesity. Int J Obes Relat Metab Disord 1997;21:387–392.[PubMed: 9152741]
24. Korner J, Inabnet W, Conwell IM, et al. Differential effects of gastric bypass and banding oncirculating gut hormone and leptin levels. Obesity (Silver Spring) 2006;14:1553–1561. [PubMed:17030966]
25. Alvarez BM, Borque M, Martinez-Sarmiento J, et al. Peptide YY secretion in morbidly obese patientsbefore and after vertical banded gastroplasty. Obes Surg 2002;12:324–327. [PubMed: 12082881]
26. Strader AD, Vahl TP, Jandacek RJ, et al. Weight loss through ileal transposition is accompanied byincreased ileal hormone secretion and synthesis in rats. Am J Physiol Endocrinol Metab2005;288:E447–E453. [PubMed: 15454396]
27. Adrian TE, Ferri GL, Bacarese-Hamilton AJ, et al. Human distribution and release of a putative newgut hormone, peptide YY. Gastroenterology 1985;89:1070–1077. [PubMed: 3840109]
Oliván et al. Page 7
Ann Surg. Author manuscript; available in PMC 2010 June 1.
NIH
-PA Author Manuscript
NIH
-PA Author Manuscript
NIH
-PA Author Manuscript
28. Ekblad E, Sundler F. Distribution of pancreatic polypeptide and peptide YY. Peptides 2002;23:251–261. [PubMed: 11825640]
29. Morinigo R, Lacy AM, Casamitjana R, et al. GLP-1 and changes in glucose tolerance followinggastric bypass surgery in morbidly obese subjects. Obes Surg 2006;16:1594–1601. [PubMed:17217635]
30. Batterham RL, Cohen MA, Ellis SM, et al. Inhibition of food intake in obese subjects by peptideYY3-36. N Engl J Med 2003;349:941–948. [PubMed: 12954742]
31. Verdich C, Flint A, Gutzwiller JP, et al. A meta-analysis of the effect of glucagon-like peptide-1 (7–36) amide on ad libitum energy intake in humans. J Clin Endocrinol Metab 2001;86:4382–4389.[PubMed: 11549680]
32. Naslund E, Gutniak M, Skogar S, et al. Glucagon-like peptide 1 increases the period of postprandialsatiety and slows gastric emptying in obese men. Am J Clin Nutr 1998;68:525–530. [PubMed:9734726]
33. Naslund E, Barkeling B, King N, et al. Energy intake and appetite are suppressed by glucagon-likepeptide-1 (GLP-1) in obese men. Int J Obes Relat Metab Disord 1999;23:304–311. [PubMed:10193877]
34. Degen L, Oesch S, Matzinger D, et al. Effects of a preload on reduction of food intake by GLP-1 inhealthy subjects. Digestion 2006;74:78–84. [PubMed: 17135729]
35. Neary NM, Small CJ, Druce MR, et al. Peptide YY3-36 and glucagon-like peptide-17–36 inhibit foodintake additively. Endocrinology 2005;146:5120–5127. [PubMed: 16150917]
36. Chelikani PK, Haver AC, Reidelberger RD. Ghrelin attenuates the inhibitory effects of glucagon-likepeptide-1 and peptide YY(3–36) on food intake and gastric emptying in rats. Diabetes 2006;55:3038–3046. [PubMed: 17065340]
37. Unniappan S, Kieffer TJ. Leptin extends the anorectic effects of chronic PYY(3–36) administrationin Ad lib fed rats. Am J Physiol Regul Integr Comp Physiol 2008;295:R51–R58. [PubMed:18417649]
38. Geloneze B, Tambascia MA, Pilla VF, et al. Ghrelin: a gut-brain hormone: effect of gastric bypasssurgery. Obes Surg 2003;13:17–22. [PubMed: 12630608]
39. Mancini MC, Costa AP, de Melo ME, et al. Effect of gastric bypass on spontaneous growth hormoneand ghrelin release profiles. Obesity (Silver Spring) 2006;14:383–387. [PubMed: 16648608]
40. Couce ME, Cottam D, Esplen J, et al. Is ghrelin the culprit for weight loss after gastric bypass surgery?A negative answer. Obes Surg 2006;16:870–878. [PubMed: 16839485]
41. Mingrone G, Granato L, Valera-Mora E, et al. Ultradian ghrelin pulsatility is disrupted in morbidlyobese subjects after weight loss induced by malabsorptive bariatric surgery. Am J Clin Nutr2006;83:1017–1024. [PubMed: 16685041]
42. Stratis C, Alexandrides T, Vagenas K, et al. Ghrelin and peptide YY levels after a variant ofbiliopancreatic diversion with Roux-en-Y gastric bypass versus after colectomy: a prospectivecomparative study. Obes Surg 2006;16:752–758. [PubMed: 16756737]
43. Lee H, Te C, Koshy S, et al. Does ghrelin really matter after bariatric surgery? Surg Obes Relat Dis2006;2:538–548. [PubMed: 17015210]
44. Druce MR, Wren AM, Park AJ, et al. Ghrelin increases food intake in obese as well as lean subjects.Int J Obes (Lond) 2005;29:1130–1136. [PubMed: 15917842]
45. Laferrére B, Abraham C, Russell CD, et al. Growth hormone releasing peptide-2 (GHRP-2), likeghrelin, increases food intake in healthy men. J Clin Endocrinol Metab 2005;90:611–614. [PubMed:15699539]
46. Laferrére B, Hart A, Bowers C. Obese subjects respond to the stimulatory effect of the ghrelin agonistgrowth hormone releasing peptide-2 (GHRP-2) on food intake. Obesity 2006;14:1056–1063.[PubMed: 16861611]
47. Thompson NM, Gill DA, Davies R, et al. Ghrelin and des-octanoyl ghrelin promote adipogenesisdirectly in vivo by a mechanism independent of the type 1a growth hormone secretagogue receptor.Endocrinology 2004;145:234–242. [PubMed: 14551228]
48. Kim MS, Yoon CY, Jang PG, et al. The mitogenic and antiapoptotic actions of ghrelin in 3T3-L1adipocytes. Mol Endocrinol 2004;18:2291–2301. [PubMed: 15178745]
Oliván et al. Page 8
Ann Surg. Author manuscript; available in PMC 2010 June 1.
NIH
-PA Author Manuscript
NIH
-PA Author Manuscript
NIH
-PA Author Manuscript
49. Sobhani I, Bado A, Vissuzaine C, et al. Leptin secretion and leptin receptor in the human stomach.Gut 2000;47:178–183. [PubMed: 10896907]
50. English PJ, Ashcroft A, Patterson M, et al. Fasting plasma peptide-YY concentrations are elevatedbut do not rise postprandially in type 2 diabetes. Diabetologia 2006;49:2219–2221. [PubMed:16832662]
51. Boey D, Heilbronn L, Sainsbury A, et al. Low serum PYY is linked to insulin resistance in first-degree relatives of subjects with type 2 diabetes. Neuropeptides 2006;40:317–324. [PubMed:17045646]
52. Viardot A, Heilbronn LK, Herzog H, et al. Abnormal postprandial PYY response in insulin sensitivenondiabetic subjects with a strong family history of type 2 diabetes. Int J Obes (Lond) 2008;32:943–948. [PubMed: 18317469]
53. Geloneze B, Tambascia MA, Pareja JC, et al. Serum leptin levels after bariatric surgery across a rangeof glucose tolerance from normal to diabetes. Obes Surg 2001;11:693–698. [PubMed: 11775566]
54. Pedersen-Bjergaard U, Host U, Kelbaek H, et al. Influence of meal composition on postprandialperipheral plasma concentrations of vasoactive peptides in man. Scand J Clin Lab Invest1996;56:497–503. [PubMed: 8903111]
55. Lin HC, Chey WY. Cholecystokinin and peptide YY are released by fat in either proximal or distalsmall intestine in dogs. Regul Pept 2003;114:131–135. [PubMed: 12832101]
56. Feinle-Bisset C, Patterson M, Ghatei MA, et al. Fat digestion is required for suppression of ghrelinand stimulation of peptide YY and pancreatic polypeptide secretion by intraduodenal lipid. Am JPhysiol Endocrinol Metab 2005;289:E948–E953. [PubMed: 15998659]
57. Batterham RL, Heffron H, Kapoor S, et al. Critical role for peptide YY in protein-mediated satiationand body-weight regulation. Cell Metab 2006;4:223–233. [PubMed: 16950139]
58. Chanoine JP, Mackelvie KJ, Barr SI, et al. GLP-1 and appetite responses to a meal in lean andoverweight adolescents following exercise. Obesity (Silver Spring) 2008;16:202–204. [PubMed:18223636]
Oliván et al. Page 9
Ann Surg. Author manuscript; available in PMC 2010 June 1.
NIH
-PA Author Manuscript
NIH
-PA Author Manuscript
NIH
-PA Author Manuscript
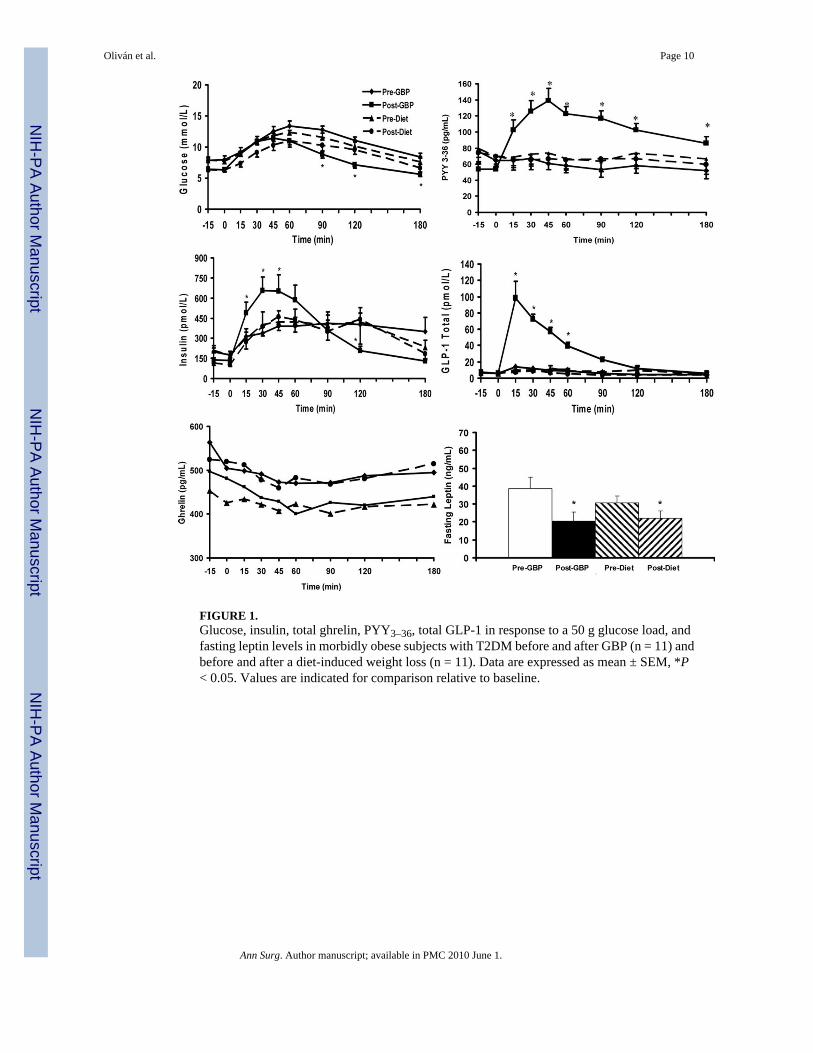
FIGURE 1.Glucose, insulin, total ghrelin, PYY3–36, total GLP-1 in response to a 50 g glucose load, andfasting leptin levels in morbidly obese subjects with T2DM before and after GBP (n = 11) andbefore and after a diet-induced weight loss (n = 11). Data are expressed as mean ± SEM, *P< 0.05. Values are indicated for comparison relative to baseline.
Oliván et al. Page 10
Ann Surg. Author manuscript; available in PMC 2010 June 1.
NIH
-PA Author Manuscript
NIH
-PA Author Manuscript
NIH
-PA Author Manuscript
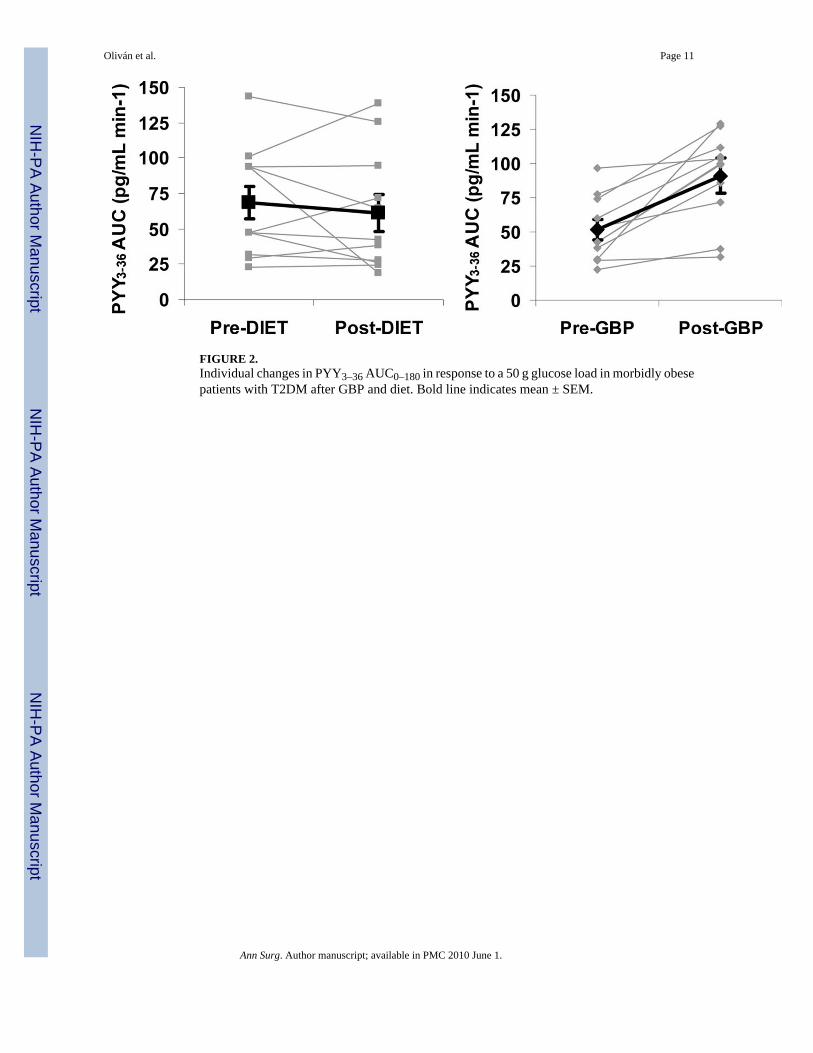
FIGURE 2.Individual changes in PYY3–36 AUC0–180 in response to a 50 g glucose load in morbidly obesepatients with T2DM after GBP and diet. Bold line indicates mean ± SEM.
Oliván et al. Page 11
Ann Surg. Author manuscript; available in PMC 2010 June 1.
NIH
-PA Author Manuscript
NIH
-PA Author Manuscript
NIH
-PA Author Manuscript
NIH
-PA Author Manuscript
NIH
-PA Author Manuscript
NIH
-PA Author Manuscript
Oliván et al. Page 12
TAB
LE 1
Subj
ect C
hara
cter
istic
s Bef
ore
and
Afte
r Wei
ght L
oss,
by D
iet (
n =
10) a
nd G
BP
(n =
11)
Pred
iet
Post
diet
Pre-
GB
PPo
st-G
BP
P
Age
(yr)
47.9
± 7
.8—
44.1
2 ±
10.6
—
Wei
ght (
kg)
110.
6 ±
9.6
100.
7 ±
9.1*
117.
6 ±
19.3
106.
4 ±
17.7
*0.
429
BM
I (kg
/m2 )
42.8
± 3
.839
.0 ±
3.8
*47
.4 ±
10.
641
.4 ±
7.6
†0.
233
T2D
M d
urat
ion
(mo)
23.0
1 ±
18.5
—25
.0 ±
19.
2—
—
HbA
1C (%
)6.
44 ±
0.6
1—
6.80
± 0
.57
——
Fast
ing
gluc
ose
(mm
ol/L
)7.
84 ±
1.0
36.
32 ±
0.9
5*7.
89 ±
1.5
66.
45 ±
0.7
2†0.
880
120’
glu
cose
(mm
ol/L
)10
.29
± 2.
309.
80 ±
2.3
010
.98
± 1.
606.
96 ±
1.6
0*0.
000
Fast
ing
insu
lin (p
mol
/L)
199
± 10
510
8 ±
48†
191
± 95
130
± 49
†0.
344
Peak
insu
lin (p
mol
/L)
552
± 34
554
± 50
050
5 ±
269
748
± 30
9†0.
242
Fast
ing
ghre
lin (p
g/m
L)‡
425
± 91
519
± 10
5†50
6 ±
121
482
± 19
60.
038
Nad
ir gh
relin
(pg/
mL)
‡36
1 ±
9144
4 ±
96†
429
± 12
237
6 ±
131
0.00
4
Max
sup.
ghre
lin (%
)16
.3 ±
12.
215
.5 ±
7.6
19.0
± 1
2.8
20.7
± 7
.30.
762
Fast
ing
lept
in (n
g/m
L)30
.6 ±
11.
722
.0 ±
12.
3†38
.8 ±
17.
520
.6 ±
14.
1*0.
120
Fast
ing
GLP
-1T
(pm
ol/L
)6.
02 ±
2.7
76.
12 ±
4.1
95.
95 ±
3.8
46.
57 ±
3.1
80.
787
Peak
GLP
-1T
(pm
ol/L
)17
.8 ±
15.
510
.1 ±
5.6
16.0
± 5
.911
0.3
± 50
.8*
0.00
0
Fast
ing
PYY
3–36
(pg/
mL)
69.4
± 4
4.3
69.5
± 4
1.3
58.7
± 2
1.6
45.3
± 2
0.8†
0.23
4
Peak
PY
Y3–
36 (p
g/m
L)85
.5 ±
51.
984
.8 ±
41.
372
.3 ±
20.
513
2.7
± 49
.7*
0.00
0
AU
C P
YY
3–36
(pg/
mL.
min−1
)68
.3 ±
38.
561
.1 ±
42.
251
.5 ±
23.
391
.1 ±
32.
2*0.
001
HO
MA
-IR
8.37
± 4
.20
3.98
± 1
.80†
8.96
± 5
.60
5.21
± 2
.60†
0.69
4
Dat
a are
expr
esse
d as
mea
n ±
SD. F
astin
g, p
eak,
120
min
, AU
C (t
otal
area
und
er th
e cur
ve) v
alue
s wer
e obt
aine
d du
ring
the O
GTT
. The
repo
rted
P va
lue r
epre
sent
s the
diff
eren
ce b
etw
een
the c
hang
es o
ccur
ring
with
die
t and
GB
P.
* P <
0.00
1,
† P <
0.05
, eff
ect o
f wei
ght l
oss w
ithin
eac
h gr
oup
(die
t or G
BP)
.
GB
P in
dica
tes g
astri
c by
pass
; BM
I, bo
dy m
ass i
ndex
; T2D
M, t
ype
2 di
abet
es m
ellit
us; A
UC
, are
a un
der t
he c
urve
; GLP
-1T,
glu
cago
n lik
e pe
ptid
e-1
tota
l; PY
Y3–
36, p
eptid
e-Y
Y3–
36; H
bA1C
, hem
oglo
bin
A1C
; HO
MA
-IR
, hom
eost
atic
mod
el a
sses
smen
t of i
nsul
in re
sist
ance
.
Ann Surg. Author manuscript; available in PMC 2010 June 1.
NIH
-PA Author Manuscript
NIH
-PA Author Manuscript
NIH
-PA Author Manuscript
Oliván et al. Page 13
TABLE 2
Baseline Subject Characteristics of Obese Patients With and Without T2DM
Obese WithoutT2DM n = 9
Obese WithT2DM n = 21
Age (yr) 37.4 ± 7.5 46.1 ± 9.2*
Weight (kg) 121.1 ± 19.3 114.1 ± 15.3
BMI (kg/m2) 45.5 ± 7.1 45.1 ± 8.1
Fasting glucose (mmol/L) 5.34 ± 0.48 7.87 ± 1.29*
Fasting insulin (pmol/L) 167.9 ± 86.4 195.2 ± 97.9*
HOMA-IR 4.81 ± 2.57 8.67 ± 4.60*
Fasting GLP-1T (pmol/L) 5.23 ± 3.60 5.99 ± 3.27
Peak GLP-1T (pmol/L) 10.1 ± 5.2 16.9 ± 11.5
Fasting ghrelin 409 ± 112 516 ± 243
Max sup ghrelin (%) 24.6 ± 13.5 15.9 ± 11.2
Nadir ghrelin (pg/mL) 315 ± 124 428 ± 177
Fasting leptin (ng/mL) 39.7 ± 11.5 34.6 ± 14.0
Fasting PYY3–36 (pg/mL) 39.9 ± 21.1 64.1 ± 34.5*
Peak PYY3–36 (pg/mL) 50.2 ± 24.8 78.9 ± 39.1*
AUC PYY3–36 (pg/mL/min−1) 30.0 ± 20.8 59.9 ± 32.2*
Mean ± SD.
*Denotes significant difference between groups, P < 0.05.
Max sup ghrelin indicates maximal suppression of ghrelin; AUC, area under the curve.
Ann Surg. Author manuscript; available in PMC 2010 June 1.