Effect of vibrations on tractor driver under different surface conditions
12
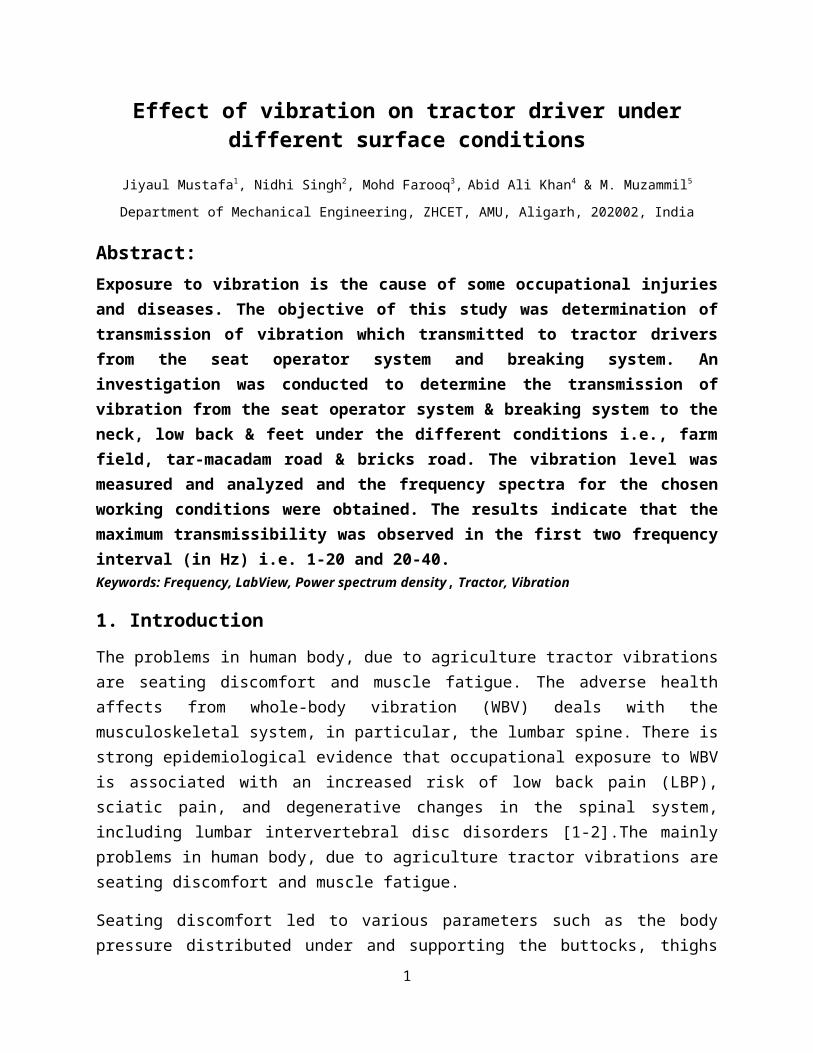
Effect of vibration on tractor driver under different surface conditions Jiyaul Mustafa 1 , Nidhi Singh 2 , Mohd Farooq 3 , Abid Ali Khan 4 & M. Muzammil 5 Department of Mechanical Engineering, ZHCET, AMU, Aligarh, 202002, India Abstract: Exposure to vibration is the cause of some occupational injuries and diseases. The objective of this study was determination of transmission of vibration which transmitted to tractor drivers from the seat operator system and breaking system. An investigation was conducted to determine the transmission of vibration from the seat operator system & breaking system to the neck, low back & feet under the different conditions i.e., farm field, tar-macadam road & bricks road. The vibration level was measured and analyzed and the frequency spectra for the chosen working conditions were obtained. The results indicate that the maximum transmissibility was observed in the first two frequency interval (in Hz) i.e. 1-20 and 20-40. Keywords: Frequency, LabView, Power spectrum density, Tractor, Vibration 1. Introduction The problems in human body, due to agriculture tractor vibrations are seating discomfort and muscle fatigue. The adverse health affects from whole-body vibration (WBV) deals with the musculoskeletal system, in particular, the lumbar spine. There is strong epidemiological evidence that occupational exposure to WBV is associated with an increased risk of low back pain (LBP), sciatic pain, and degenerative changes in the spinal system, including lumbar intervertebral disc disorders [1-2].The mainly problems in human body, due to agriculture tractor vibrations are seating discomfort and muscle fatigue. Seating discomfort led to various parameters such as the body pressure distributed under and supporting the buttocks, thighs 1
-
Upload
jamiamilliaislamia -
Category
Documents
-
view
1 -
download
0
Transcript of Effect of vibrations on tractor driver under different surface conditions
Effect of vibration on tractor driver underdifferent surface conditions
Jiyaul Mustafa1, Nidhi Singh2, Mohd Farooq3, Abid Ali Khan4 & M. Muzammil5
Department of Mechanical Engineering, ZHCET, AMU, Aligarh, 202002, India
Abstract:Exposure to vibration is the cause of some occupational injuriesand diseases. The objective of this study was determination oftransmission of vibration which transmitted to tractor driversfrom the seat operator system and breaking system. Aninvestigation was conducted to determine the transmission ofvibration from the seat operator system & breaking system to theneck, low back & feet under the different conditions i.e., farmfield, tar-macadam road & bricks road. The vibration level wasmeasured and analyzed and the frequency spectra for the chosenworking conditions were obtained. The results indicate that themaximum transmissibility was observed in the first two frequencyinterval (in Hz) i.e. 1-20 and 20-40.Keywords: Frequency, LabView, Power spectrum density, Tractor, Vibration
1. IntroductionThe problems in human body, due to agriculture tractor vibrationsare seating discomfort and muscle fatigue. The adverse healthaffects from whole-body vibration (WBV) deals with themusculoskeletal system, in particular, the lumbar spine. There isstrong epidemiological evidence that occupational exposure to WBVis associated with an increased risk of low back pain (LBP),sciatic pain, and degenerative changes in the spinal system,including lumbar intervertebral disc disorders [1-2].The mainlyproblems in human body, due to agriculture tractor vibrations areseating discomfort and muscle fatigue.
Seating discomfort led to various parameters such as the bodypressure distributed under and supporting the buttocks, thighs
1
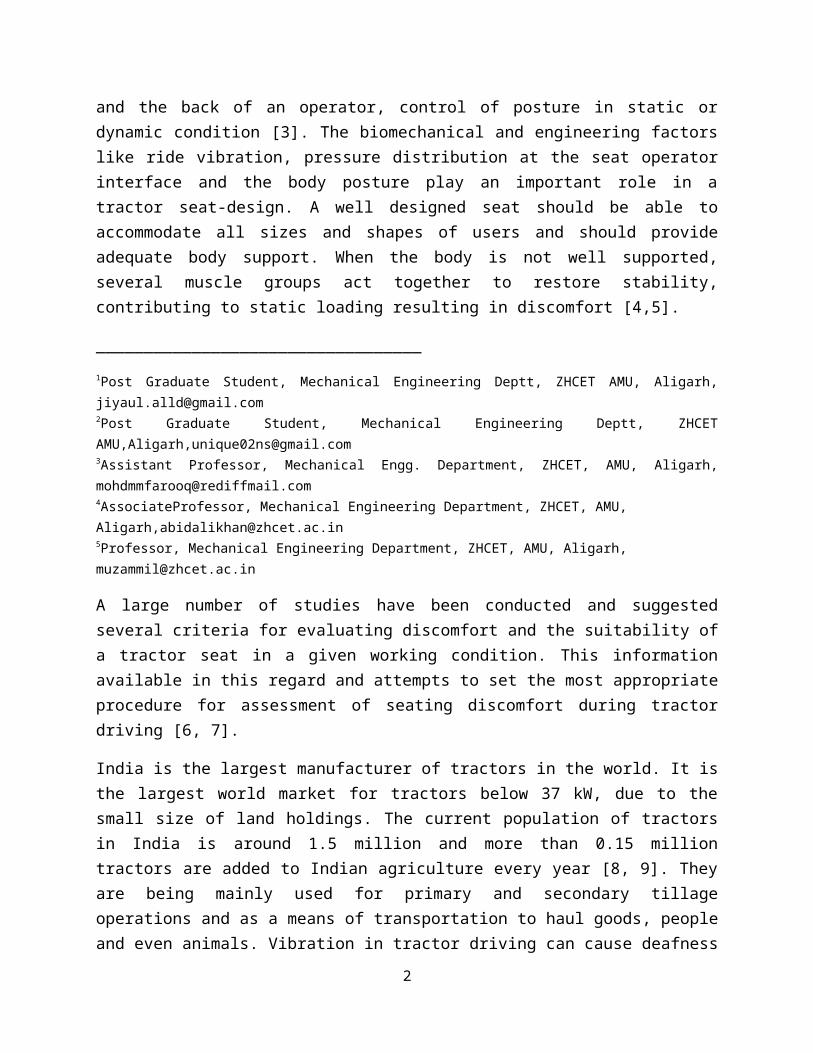
and the back of an operator, control of posture in static ordynamic condition [3]. The biomechanical and engineering factorslike ride vibration, pressure distribution at the seat operatorinterface and the body posture play an important role in atractor seat-design. A well designed seat should be able toaccommodate all sizes and shapes of users and should provideadequate body support. When the body is not well supported,several muscle groups act together to restore stability,contributing to static loading resulting in discomfort [4,5].
__________________________________1Post Graduate Student, Mechanical Engineering Deptt, ZHCET AMU, Aligarh,[email protected] Graduate Student, Mechanical Engineering Deptt, ZHCETAMU,Aligarh,[email protected] 3Assistant Professor, Mechanical Engg. Department, ZHCET, AMU, Aligarh,[email protected], Mechanical Engineering Department, ZHCET, AMU, Aligarh,[email protected] 5Professor, Mechanical Engineering Department, ZHCET, AMU, Aligarh, [email protected]
A large number of studies have been conducted and suggestedseveral criteria for evaluating discomfort and the suitability ofa tractor seat in a given working condition. This informationavailable in this regard and attempts to set the most appropriateprocedure for assessment of seating discomfort during tractordriving [6, 7].
India is the largest manufacturer of tractors in the world. It isthe largest world market for tractors below 37 kW, due to thesmall size of land holdings. The current population of tractorsin India is around 1.5 million and more than 0.15 milliontractors are added to Indian agriculture every year [8, 9]. Theyare being mainly used for primary and secondary tillageoperations and as a means of transportation to haul goods, peopleand even animals. Vibration in tractor driving can cause deafness
2
and disorders of the spinal column and stomach. The effect ofimplements on tractor ride is not well understood in India [10].
Agricultural tractors are extensively used for on-road and off-road transportation and for different field operations. It iswidely recognized that tractor operators are exposed to highlevels of whole-body vibration during farm operations [11, 12].In order to predict the ride vibration of an agriculturaltractor, the vibrations transmitted to the driver's seat of anagricultural tractor, an analytical model has been constructedthrough the assembly of tyre model & cab and seat suspensionmodels [13, 14].
2. Method
2.1 Materials
Mahindra Bhoomiputra 265 DI Model tractor was carried underworking condition. It has a horse power of 30 H.P categories withbore and stroke of 88.9 x 96 mm. It is couched with threecylinders whereas the cubic capacity of 1788 cc. The make andmodel of this variant is Mahindra MDI- 1785 and its total weightsomewhere comes to around 1735 kgs.
2.2 Approach
It was tried to study the effect of transfer of vibration overwhole body system in tractor seat operator system and breakingsystem.
2.3 Participants
In the present experiment, two healthy male participants wereparticipated.
2.4 Apparatus
A Lab VIEW code was written to design the instrument for therecording of vibration level. The data acquisition was made
3
possible using tri axial transducer (model no. SEN041F was madeby PCB piezoelectronics, NEW YORK, USA; having 10.23mV/g,10.66mV/g and 10.41Mv/g sensitives in x, y, z directionrespectively, the certificate is enclosed as appendix A) that wasconnected to NI card (Model No. NI9234 made by Nationalinstruments) using lead and the card was interfaced with a Wiprolaptop (specifications P6000 PROCESSOR, 3 GB RAM).The setup wassupportive to the sampling rate of 26,400 per second.
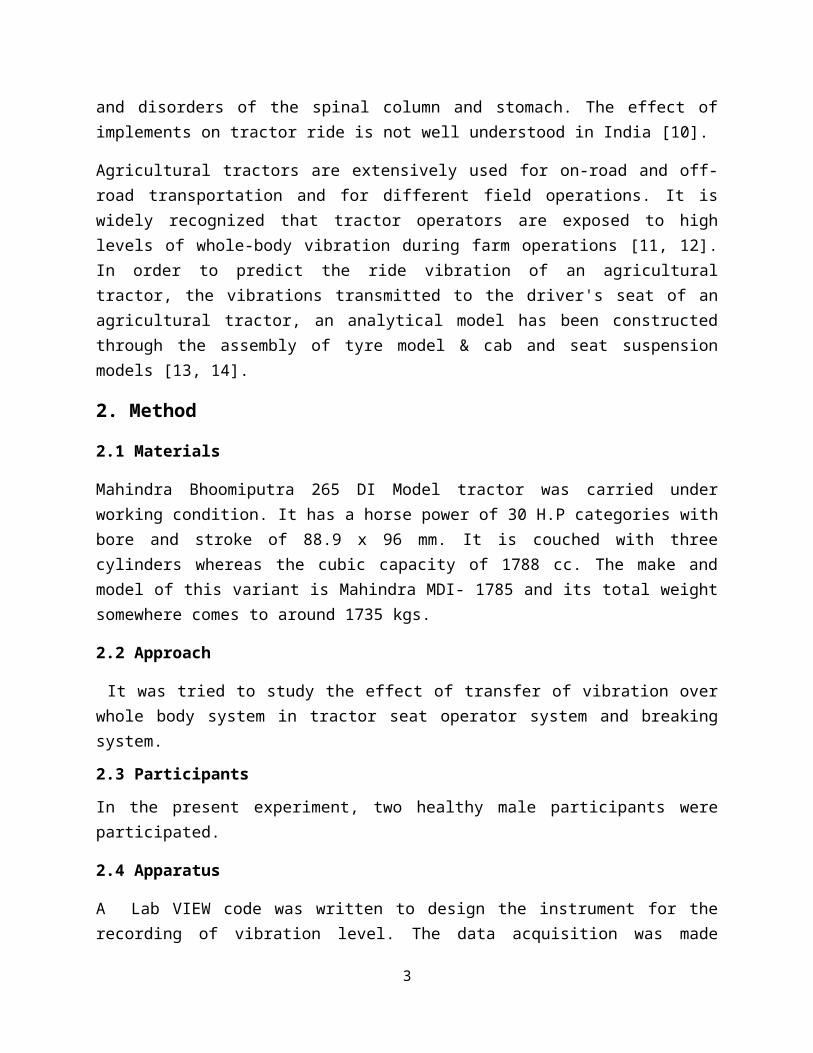
Figure 1: The items used in data acquisition process (Triaxiltransducer, Adaptor to hold transducer, data acquisition card and
interfacing with Laptop).
However, the mean values were only recorded .The recorded datawas auto stored in text/excel files in the laptop. The items usedin the experimental setup are shown in figure 1. Procedure tomeasure the vibration on tractor steering is very muchstandardized. Vibration measurement on tractor seat pad &breaking system have been performed, vibration are measured alongz- axis vertical axis. We were used NI USB-9233 data acquisitiondevice. The USB-9233 consists of two components: an NI 9233module and aUSB-9162 USB carrier, for vibration measurement, NIUSB-9233 connected with personal computer through lead.
2.5 Procedure
4

For vibration measurement from the seat operator system &breaking system to the neck, low back & feet of driver, thetractor was carried out under the different conditions i.e.,farm field, tar-macadam road & bricks road. Subjects wereconsidered to be healthy with no signs of musculo-skeletal systemdisorders. It was used two integrated electronic piezoelectric(IEPE) sensor connected to BNC connector. For the measurement ofvibration in z direction, first sensor is SEN041F triaxial shearicp accelerometer, this recognized as a z-base sensor, it isattached to tractor seat pad & breaking system. The first set ofexperiment was carried out by one of the sensor are attached toseat pad (z-base) and second one sensor are attached to driverneck and low back (z-target) & second set of experiment wascarried out by attached the one sensor to breaking system (z-base) & second one sensor were attached to driver feet (z-target)as shown in figure 2,so we get The collected data was processedand analyzed with Lab View TM and by using MATLAB programme foreach test.
Figure2: Mahindra Bhoomiputra 265 DI Model tractor on farm fieldconditions (a) Breaking system arrangement (b) Seat pad
arrangement.
5
The first set of experiment was carried out by one of the sensorare attached to seat pad (z-base) and second one sensor areattached to driver neck and low back (z-target) & second set ofexperiment was carried out by attached the one sensor to breakingsystem (z-base) & second one sensor were attached to driver feet(z-target) as shown in figure 2, So we get the collected datawas processed and analyzed with Lab View TM and by using MATLABprogramme for each test.
3. Results & Discussion
The analysis for vibration was done through the MATLAB. A programwas written in MATLAB for that purpose. In the analysis, somegraphs were obtained between the different variables fordifferent condition of the sensor and for each participant.
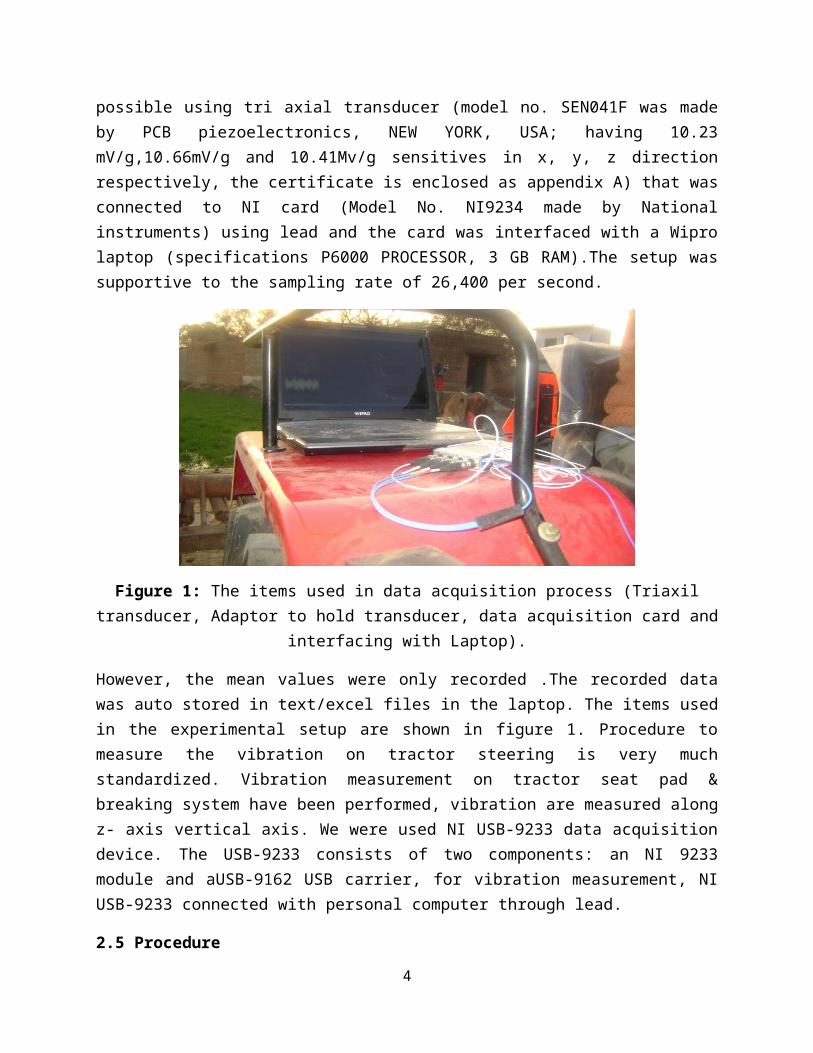
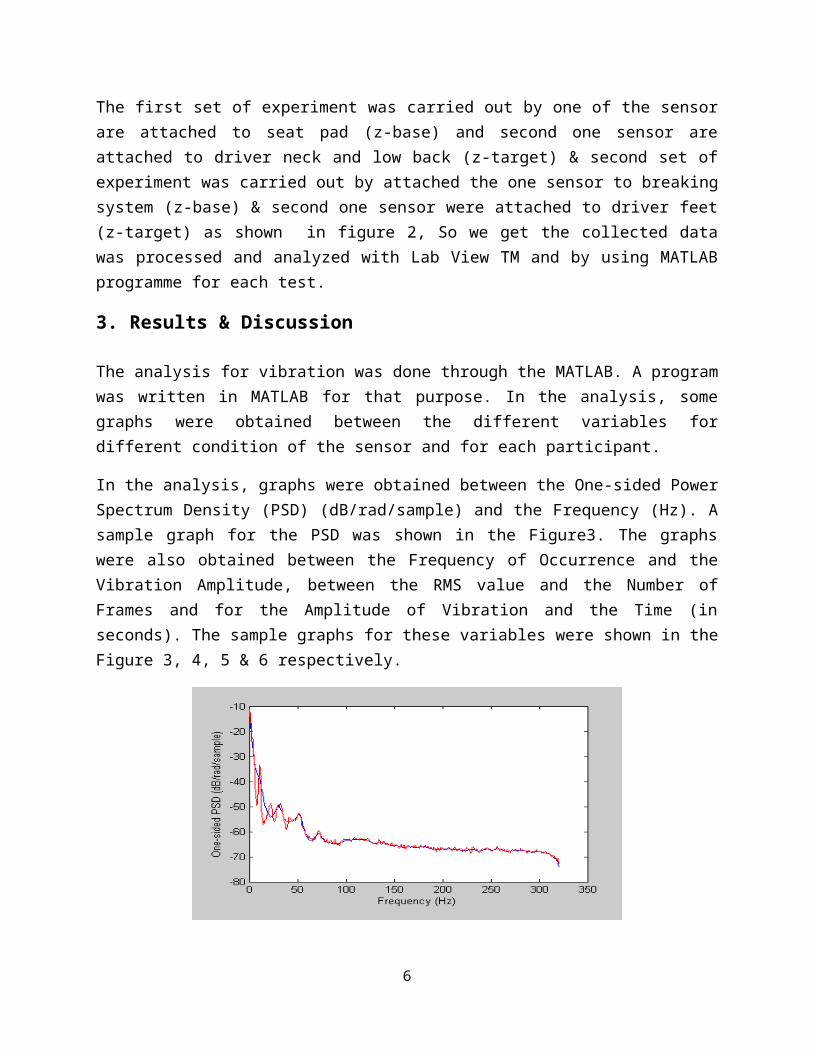
In the analysis, graphs were obtained between the One-sided PowerSpectrum Density (PSD) (dB/rad/sample) and the Frequency (Hz). Asample graph for the PSD was shown in the Figure3. The graphswere also obtained between the Frequency of Occurrence and theVibration Amplitude, between the RMS value and the Number ofFrames and for the Amplitude of Vibration and the Time (inseconds). The sample graphs for these variables were shown in theFigure 3, 4, 5 & 6 respectively.
6
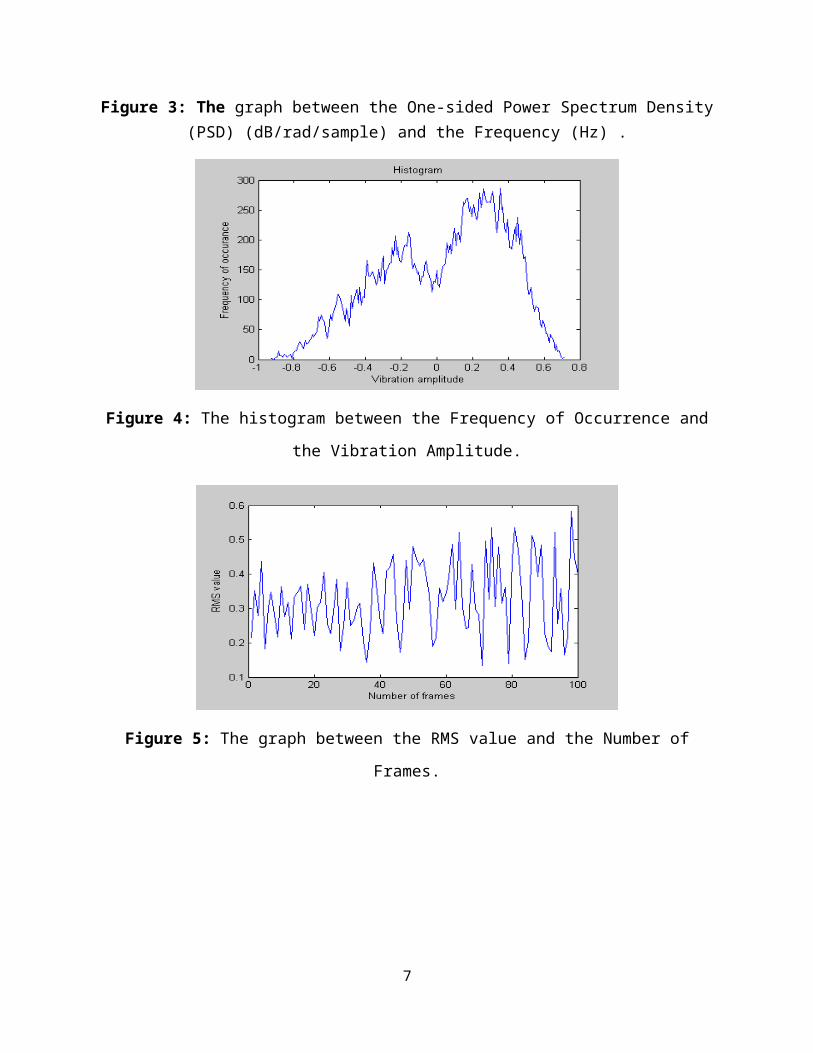
Figure 3: The graph between the One-sided Power Spectrum Density(PSD) (dB/rad/sample) and the Frequency (Hz) .
Figure 4: The histogram between the Frequency of Occurrence and
the Vibration Amplitude.
Figure 5: The graph between the RMS value and the Number of
Frames.
7
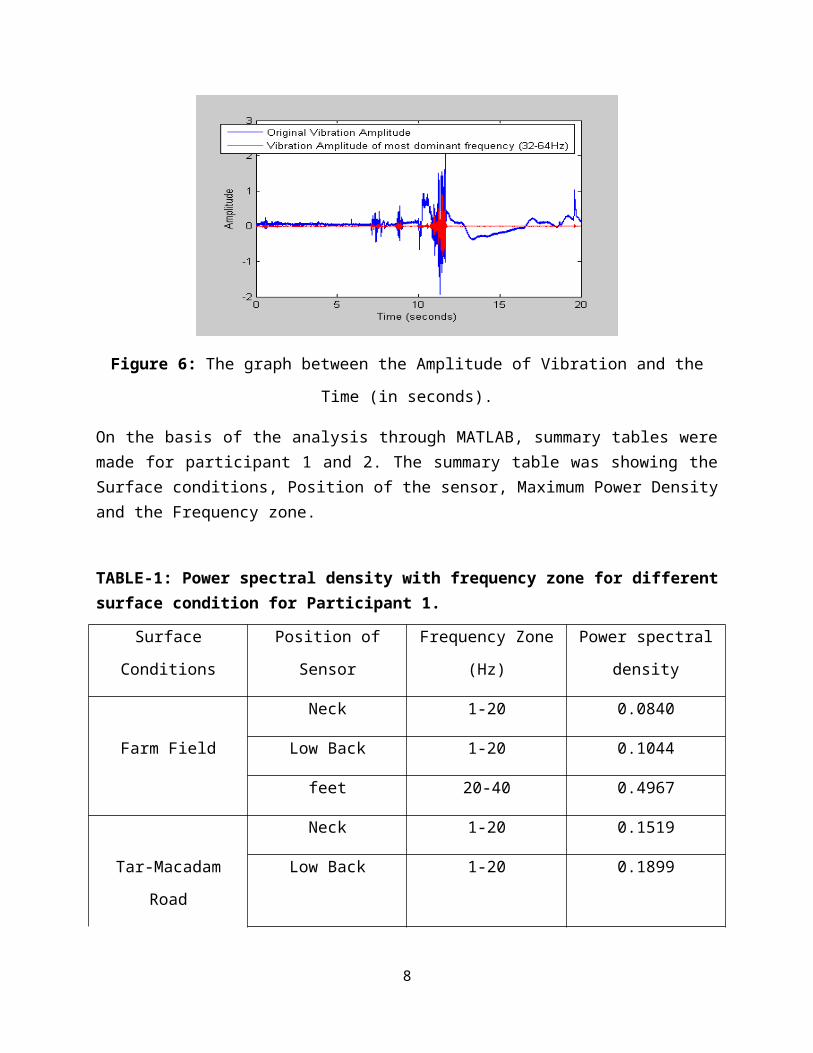
Figure 6: The graph between the Amplitude of Vibration and the
Time (in seconds).
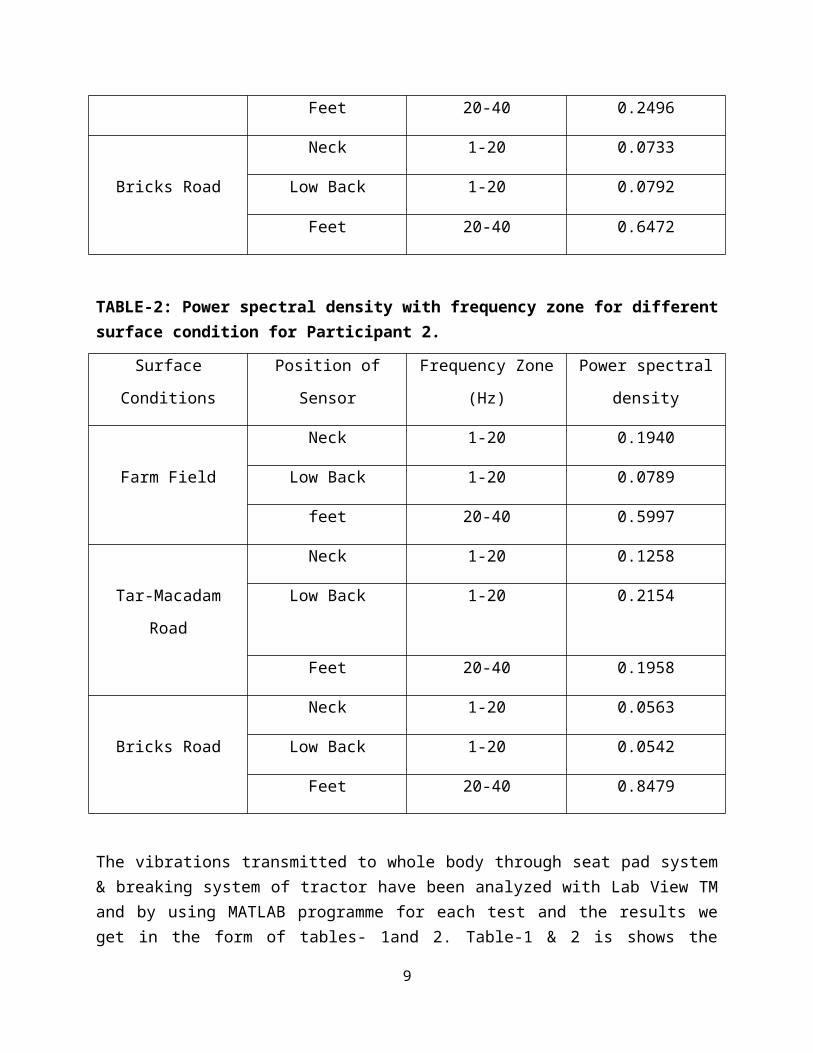
On the basis of the analysis through MATLAB, summary tables weremade for participant 1 and 2. The summary table was showing theSurface conditions, Position of the sensor, Maximum Power Densityand the Frequency zone.
TABLE-1: Power spectral density with frequency zone for differentsurface condition for Participant 1.
Surface
Conditions
Position of
Sensor
Frequency Zone
(Hz)
Power spectral
density
Neck 1-20 0.0840
Farm Field Low Back 1-20 0.1044
feet 20-40 0.4967
Neck 1-20 0.1519
Tar-Macadam
Road
Low Back 1-20 0.1899
8
Feet 20-40 0.2496
Neck 1-20 0.0733
Bricks Road Low Back 1-20 0.0792
Feet 20-40 0.6472
TABLE-2: Power spectral density with frequency zone for differentsurface condition for Participant 2.
Surface
Conditions
Position of
Sensor
Frequency Zone
(Hz)
Power spectral
density
Neck 1-20 0.1940
Farm Field Low Back 1-20 0.0789
feet 20-40 0.5997
Neck 1-20 0.1258
Tar-Macadam
Road
Low Back 1-20 0.2154
Feet 20-40 0.1958
Neck 1-20 0.0563
Bricks Road Low Back 1-20 0.0542
Feet 20-40 0.8479
The vibrations transmitted to whole body through seat pad system& breaking system of tractor have been analyzed with Lab View TMand by using MATLAB programme for each test and the results weget in the form of tables- 1and 2. Table-1 & 2 is shows the
9
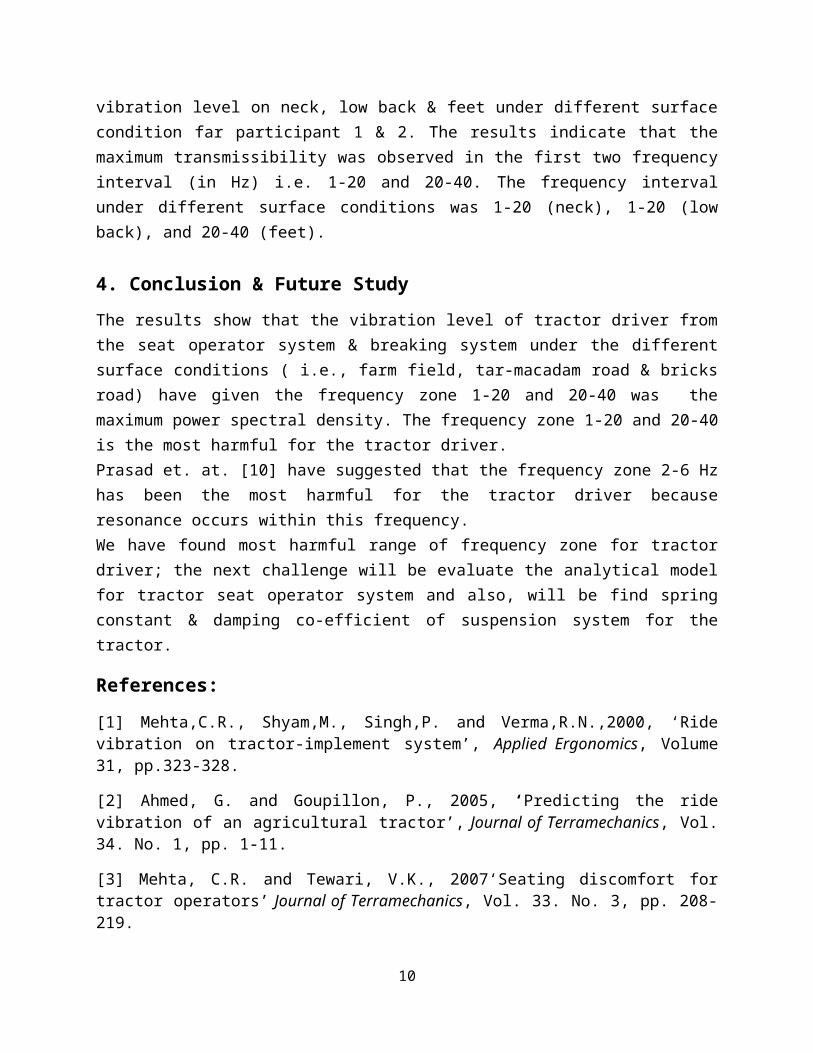
vibration level on neck, low back & feet under different surfacecondition far participant 1 & 2. The results indicate that themaximum transmissibility was observed in the first two frequencyinterval (in Hz) i.e. 1-20 and 20-40. The frequency intervalunder different surface conditions was 1-20 (neck), 1-20 (lowback), and 20-40 (feet).
4. Conclusion & Future StudyThe results show that the vibration level of tractor driver fromthe seat operator system & breaking system under the differentsurface conditions ( i.e., farm field, tar-macadam road & bricksroad) have given the frequency zone 1-20 and 20-40 was themaximum power spectral density. The frequency zone 1-20 and 20-40is the most harmful for the tractor driver. Prasad et. at. [10] have suggested that the frequency zone 2-6 Hzhas been the most harmful for the tractor driver becauseresonance occurs within this frequency. We have found most harmful range of frequency zone for tractordriver; the next challenge will be evaluate the analytical modelfor tractor seat operator system and also, will be find springconstant & damping co-efficient of suspension system for thetractor.
References:[1] Mehta,C.R., Shyam,M., Singh,P. and Verma,R.N.,2000, ‘Ridevibration on tractor-implement system’, Applied Ergonomics, Volume31, pp.323-328.
[2] Ahmed, G. and Goupillon, P., 2005, ‘Predicting the ridevibration of an agricultural tractor’, Journal of Terramechanics, Vol.34. No. 1, pp. 1-11.
[3] Mehta, C.R. and Tewari, V.K., 2007‘Seating discomfort fortractor operators’ Journal of Terramechanics, Vol. 33. No. 3, pp. 208-219.
10
[4] Tiwari, V.K. and Prasad, N., 1999, ‘Three-DOF modeling oftractor seat-operator system’, Journal of Terramechanics, Vol. 36, pp.207-218.
[5] Dewangan, K.N., and Tewari, V.K.,2009, ‘Characteristics ofhand transmitted vibration of a hand tractor used in threeoperational modes’ , International Journal of Industrial Ergonomics , volume39, issue 1, pp 239-245.
[6] Scarlett, S.S. and Goupillon, P., 2001, ‘Whole-bodyvibration: evaluation of emission and exposure levels arisingfrom agricultural tractors’, International Journal of Industrial Ergonomics ,volume 29, pp. 209-215.
[7] Dewangan, K.N., and Tewari, V.K., 2008, ‘Characteristics ofvibration transmission in the hand arm system and subjectiveresponse during field operation of a hand tractor’, BiosystemEngineering, volume 100, issue 4, pp 535-546.
[8] Clijmans, L., Ramon, H., Langenakens, J. and Baerdemaeker,J., (1996). ‘The influence of tyres on the dynamic behavior of alawn mower’, Journal of Terramechanics, 33(4), 195–208.
[9] Crolla, D. A. and Horton, D. N. L.,(1984) ‘Factors affectingthe dynamic behavior of higher speed agricultural vehicles’.Journal of Agricultural Engineering Research, 30, 277–288.
[10] Goglia, V., Gospodaric, Z., Kosutic, S., and Filipovic, D.,2002, ‘Hand transmitted vibration from the steering wheel todrivers of a small four-wheel drive tractor’, Applied ergonomics,volume 34, issue1, pp 45-49.
[11] Adewusi,S.A., Rakheja, S., Marcotte,P. and Boutin,J.,2010, ‘Vibration transmissibility characteristics of the humanhand–arm system under different postures, hand forces andexcitation levels’, Journal of Sound and Vibration ,Volume 329, Issue14, pp.. 2953-2971.
[12] Prasad, N., Tewari, V.K., and Yadav, R., 1996, ‘Tractor ridevibration--a review’, Journal of Terramechanics, Vol. 32. No. 4, pp.205-219.
11
[13] Deprez, K., Moshou, D., Anthonis J., Baerdemaeker, J. D. andRamon, H., (2005b) ‘Improvement of vibrational comfort by passiveand semi-active cabin suspensions’, Computers and Electronics inAgriculture, 49, 431–440.[14] Kennes, P., Anthonis, J., Clijmans, L. and Ramon, H., (1999)‘Construction of a portable test rig to perform experimentalmodal analysis on mobile agricultural machinery’, Journal of Soundand Vibration, 228(2), 421–441.
[15] Bouazara, M., Richard, M. J. and Rakheja, S., 2006, ‘Safetyand comfort analysis of a 3-D vehicle model with optimal non-linear active seat suspension’, Journal of Terramechanics, 43, 97–118.
[16] Clijmans, L., Ramon, H. and Baerdemaeker, J., 1998,‘Structural modification effects on the dynamic behavior of anagricultural tractor’, Transactions of the ASAE, 41(1), 5–10.
[17] Crolla, D. A., Horton, D. N. L. and Stayner, R. M., (1990)‘Effect of tyre modeling on tractor ride vibration prediction’,Journal of Agricultural Engineering Research, 47, 55–77.
[18] Deprez, K., Moshou, D. and Ramon, H., (2005a) ‘Comfortimprovement of a non-linear suspension using global optimization’Journal of Sound and Vibration, 284, 1003 1014.
[19] Kumar, A., Mahaian, P., Mohan, D. and Varghese, M., (2001)‘Tractor vibration severity an driver healt: a study from ruralIndia’, Journal of Agricultural Engineering Research, 80(4), 313–328.
12