Stabilisation of CO2 concentrations: Mitigation scenarios using the Petro model

Original article
Effect of using bentonite during fermentation on protein
stabilisation and sensory properties of white wine
Eugenio Lira,1 Fernando N. Salazar,2 Juan J. Rodr�ıguez-Bencomo,1 Simone Vincenzi,3 Andrea Curioni3 &
Francisco L�opez1*
1 Departament d’Enginyeria Qu�ımica, Facultat d’Enologia, Universitat Rovira i Virgili, Av. Pa€ısos Catalans 26, 43007 Tarragona, Spain
2 Escuela de Alimentos, Facultad de Recursos Naturales, Pontificia Universidad Cat�olica de Valpara�ıso, Waddington 716, Valpara�ıso, Chile
3 Dipartimento di Agronomia Animali Alimenti Risorse Naturali e Ambiente (DAFNAE) and Centro Interdipartimentale per la Ricerca in
Viticoltura ed Enologia (C.I.R.V.E.), Universit�a di Padova, via dell’Universit�a 16, 35020 Legnaro (PD), Italy
(Received 16 May 2013; Accepted in revised form 25 September 2013)
Summary The bentonite use to remove proteins from white wine is a widespread practice that prevents protein haze
formation after bottling. However, an excess of bentonite can have negative effects on both the aromatic
profile of young white wines and the quality of the foam of sparkling wines. Therefore, the optimisation
of bentonite amount to be used and the moment of its application during winemaking to minimise wine
quality losses are of great interest for winemakers. This paper analyses how applying an equal bentonite
dose at different stages (must clarification; beginning, middle and end of fermentation) on two scales
(industrial and pilot) affects the protein content and stability, physical–chemical characteristics, aromatic
profile and foam quality of the obtained wines. No important differences in the oenological parameters
were observed between industrial and pilot scales, whereas the scale of the experimental treatments
affected protein stability, aroma composition and foam quality of the wines.
Keywords Bentonite, foamability, protein stability, white wine, wine aroma.
Introduction
Turbidity formation in bottled white wines is mainlycaused by the tendency of wine proteins to insolubiliseduring wine storage. Wine proteins mainly derive fromgrapes and yeasts, although some proteins producedby yeasts could contribute to stabilise the wine(Moine-Ledoux & Dubourdieu, 1999; Dizy & Bisson,2000; Dupin et al., 2000). The turbidity potential of awine is then affected by variations in the relative pro-portions of these macromolecules at the beginning ofthe vinification (Vincenzi et al., 2011).
In general, the winemakers try to minimise the risk ofhaze formation, reducing the protein contents of winesusing fining agents such as bentonite (Waters et al.,2005). However, although effective in preventing proteinhaze formation, bentonite treatments have several draw-backs, especially at high doses (Waters et al., 2005).First, it is not selective enough, causing a significantremoval of aroma compounds and the occasional alter-ation in colour. Second, the treatment results in a sub-stantial loss of wine (3–10% in volume), is a significant
source of waste and needs to be handled with care tocomply with occupational health and work safety regu-lations.Bentonite can be used before, during or after fermen-
tation. Some old studies (e.g. Miller et al., 1985)reported that bentonite addition during fermentationwas more efficient requiring 0.6 g L�1, compared withthe 0.8 and 1.2 g L�1 needed before and after fermenta-tion, respectively. On the other hand, Somers & Ziemelis(1973) reported that the addition of bentonite postfer-mentation is more efficient in removing proteins. Morerecently, Lambri et al. (2012), by studying the effects ofbentonite addition on a microvinification scale, demon-strated that the treatment that best removed proteinswas the addition of bentonite to must only. In contrast,Pocock et al. (2011), at a laboratory scale, showed thatthe addition of bentonite during fermentation, com-pared with the use before and after fermentation,allowed to minimise the dosage (and subsequent wastedisposal) and the effects on the sensory properties oftwo white wines. All these contradictory results indicatethat there is no adequate information available for wine-makers to help them in taking the decision on when andhow to use bentonite to stabilise wines.*Correspondent: E-mail: [email protected]
International Journal of Food Science and Technology 2014, 49, 1070–1078
doi:10.1111/ijfs.12402
© 2013 Institute of Food Science and Technology
1070

In addition to the effect on protein removal, it isequally important to consider the effect of bentoniteon the aroma of the final wine, because fining agentscan perform unpredictably and may result in overfin-ing, excessive lees production and loss in wine quality(Sanborn et al., 2010). Fining agents have been shownto reduce the concentration of total flavonoids andaromatic compounds such as ethyl esters, acetates andalcohols in various wine typologies (Moio et al., 2004).The knowledge on the effects of bentonite fining onthe removal of aroma compounds from wine is scant.In general, studies have been focused on the effects ofbentonite on finished wines considering the fermenta-tive and varietal aroma compounds (Lambri et al.,2010; Sanborn et al., 2010). In contrast, very few stud-ies have considered the effects on aroma compoundswhen bentonite is used in musts (Lambri et al., 2012)and none the addition during fermentation. Also theeffect of bentonite addition to the base wines onfoamability of sparkling wines has to be considered.The foamability of a sparkling wine is actually relatedto the presence of macromolecules (L�opez-Barajaset al., 2001; Vincenzi et al., 2014), including the pro-teins that are removed by bentonite, and achieving sta-ble wines and foam quality is a challenge for theindustry. Removing proteins using bentonite can seri-ously affect the foaming ability of base wine for cava(Vanrell et al., 2007) reducing maximum height andpersistence of the wine foam (Salazar et al., 2010).
On the other hand, an important aspect to considerin this type of studies is the scale in which the experi-ments are performed. In general, the published studieshave been carried out at laboratory or pilot scales, butit is of major importance to know whether the resultsobtained in terms of bentonite dose, effectiveness,moment of application and effects on the wine qualitycan be extrapolated to the industrial winemaking prac-tice. In some experiments, pilot-scale fermentationsgave wines with sensory profiles that are well adaptedto industrial fermentations (Aguera & Sablayrolles,2005), and similar fermentation kinetics were reportedfor different winemaking scales (Malherbe, 2003).However, Vila (1998) showed that the production ofaromatic compounds during fermentation was differentin laboratory and pilot scales. Casalta et al. (2010)found that the size of the tank results in significant dif-ferences in fermentation kinetics and production ofvolatile compounds. However, differences were small,and in practice, laboratory fermentations reproducedpilot-scale and, to a lesser extent, industrial-scalefermentations.
To improve the knowledge on the points mentionedabove, in this study, the effects of the addition of thesame dose of bentonite at different stages of the wine-making process and at two scale levels (industrial andpilot) are described. The same bentonite dose was used
to compare the effect of the time of application ondifferent quality parameters including wine stability,chemical composition, foam quality and aroma profile.Macabeo white grape variety was chosen to carry outthis study because it is used to produce dry whitewines and sparkling base wines (cava). According toSalazar et al. (2006), its protein content is usually low,but the obtained wines still have protein instability. Asthese wines are not very expressive aromatically, it isvery important to remove unstable proteins only andgenerate the best possible foam quality. Therefore, theaim of this study was to evaluate the effect of the dos-ing time of bentonite in both industrial and pilot scaleson different parameters such as protein content, fer-mentation rate, aroma profile and foamability.
Materials and methods
Fermentation process
The alcoholic fermentation of the Macabeo wine onindustrial scale was carried out in the Vila-rodonaCooperative (CEVIPE) in September and October 2010.The volume of the fermentation tanks was 50 000 L(height, 8.0 m; diameter, 3.0 m). Tanks were filled up tothe recommended height with the grape free-run juiceobtained at low pressures previously clarified withpectolytic enzymes (Lafazym CL, Laffort, Renter�ıa,Spain) at low temperatures (15 °C). All the grapes usedcame from the same vineyard located at 20 km fromthe sea at mean altitude of 259 m (GPS X:1.3581089791432599, Y: 41.3096674636529). Threesmall tanks (100 L; height, 1.0 m; diameter, 0.4 m) werefilled with 90 L of the same must used for each of theindustrial-scale experiments. Five tanks (four treatmentsand a control) were used for the industrial scale, and fif-teen, for the pilot scale (four treatments and control intriplicate). The fermentation was carried out with astrain of S. cerevisiae selected by CEVIPE. The fourtreatments applied at both the industrial and pilot scaleswere (i) 25 g hL�1 of bentonite added to the must priorto the start of alcoholic fermentation and removed bysettling beforehand, (ii) 25 g hL�1 of bentonite added atthe beginning of the alcoholic fermentation, (iii)25 g hL�1 of bentonite added at the middle of the alco-holic fermentation, (iv) 25 g hL�1 of bentonite added atthe end of the alcoholic fermentation and (v) no addi-tion of bentonite at any point in the fermentation pro-cess (control). The dose of 25 g hL�1 bentonite isusually employed by the winery. Bentonite (BentogramAEB Group, Brescia, Italy) was hydrated in water at100 g L�1 24 h before the use according to the sup-plier’s instructions. The fermentation process tookbetween 15 and 20 days, and the fermentation tempera-ture was controlled at 18 � 2 °C. At the end of fermen-tation, each tank received 40 mg L�1 of potassium
© 2013 Institute of Food Science and Technology International Journal of Food Science and Technology 2014
Bentonite effect on wine sensory properties E. Lira et al. 1071

metabisulphite. The wines were checked 24 h later tokeep 35 mg L�1 of free SO2.
Chemical analysis of musts and wines
The musts and wines were chemically analysed follow-ing the International Organization of Vine and Wine(OIV) official methods. The chemical parameters weredetermined by an infrared technique using the Wine-Scan FT120 Basic (Foss, Denmark). Titratable and vol-atile acidity, expressed as g tartaric acid/L and g aceticacid/L, respectively, and pH were determined usingFourier transform infrared (FTIR) technology with aFoss and Flexible Foss Integrator Software platform.A liquid flow system and a 0.4-mm calcium fluoridecuvette (Foss, Foss Electric Espa~na, S.A.) were used togenerate the FTIR spectra. The calibration providedwith the equipment enabled to determine the pH andvolatile acidity immediately (resolution OIV/OENO390/2010). The samples were automatically thermo-stated at 20 °C in the spectrometer before analysis. TheIR spectrum was scanned between 2000 nm and10 000 nm (NIR and MIR). The spectra were obtainedin triplicate and averaged for each sample.
Protein content determination
The protein content of musts and wines was deter-mined by two different methods:
Bradford’s method. The total protein concentrationwas measured using Coomassie brilliant blue reagentand reading absorbance at 595 nm on a spectropho-tometer (Cecil CE2021, Cambridge, England) after5 min of incubation (Bradford, 1976). The proteincontent was expressed as mg L�1 of bovine serumalbumin (Sigma, cat. no. A-3803, Madrid, Spain).
KDS/BCA method. Total protein concentration wasdetermined according to Vincenzi & Curioni (2005).Sodium dodecyl sulphate (SDS) (Bio-Rad, Milano,Italy) from a 10% stock solution was added to wine toa final concentration of 0.1%. Samples were gentlymixed and then heated in a boiling water bath for5 min. Potassium chloride (KCl) (1M) was then addedto reach a final concentration of 200 mM. Samples weregently mixed for a further 2 h, and KDS–protein pelletswere recovered by centrifugation at 14 000 g for 15 minat 4 °C. Pellets were washed three times with 1 M KClbefore protein quantification with the BCA assay kit(Pierce) (Vincenzi & Curioni, 2005). The protein con-tent was expressed as mg L�1 of bovine serum albumin.
Electrophoretic analyses
The proteins of the samples were analysed bySDS-PAGE according to Laemmli (1970). The pro-teins recovered from 1.0 mL of wine by the KDS
procedure described above were solubilised with200 lL of 62.5 mM Tris–HCl buffer pH 6.8, containing5% (w/v) 2-mercaptoethanol, 1.3% (w/v) SDS and10% (w/v) glycerol. Samples were then heated at100 °C for 5 min, and 30 lL was loaded onto 14%SDS-PAGE gels. Two BSA standards (2 and 4 lg)were solubilised and electrophoresed in parallel.SDS-PAGE was carried out in a Mini Protean IIIapparatus (Bio-Rad) at 18 mA until the tracking dyebromophenol blue ran off the gel. Gels were stainedwith 0.05% (w/v) Coomassie brilliant blue R-250, 5%(w/v) TCA, 17% (v/v) methanol and 6% (v/v) aceticacid and destained in 7% (v/v) acetic acid.
Heat stability test
A wine sample of 20 mL was filtered through a cellulosenitrate membrane with a pore size of 0.45 lm (What-man, cat. no. 7184009, Maidstone, Kent, UK) andheated for 2 h at 80 °C in a bath equipped with a digitalcontrol immersion thermostat (Digiterm 100 model). Itwas then incubated for 2 h at 4 °C. Finally, the turbid-ity was measured by nephelometry (Turbiquant 1000 IRturbidimeter) and expressed in nephelometric turbidityunits (NTU). The difference in turbidity between the ini-tial wine and the wine after the thermal test was propor-tional to the protein instability. The wines wereconsidered stable if this difference did not exceed 2NTU (Moine-Ledoux & Dubourdieu, 1999). All analy-ses were carried out in triplicate.
Aroma analysis
Volatile fermentative compounds (esters, organic acidsand isoamyl alcohol) were extracted and concentratedby stir bar sorptive extraction with subsequent separa-tion by gas chromatography with detection by massspectroscopy (SBSE-GC/MS) (Coelho et al., 2009),which gave a quantitative analysis of the aromaticcompounds of the stable wine samples. The repeatabil-ity of the analytical method was more than 90%. Forthe theoretical estimation of the sensory importance ofeach compound, the odour activities values (OAV)(concentration of compound X/odour threshold ofcompound X, expressed in units of aroma, u.a.) werecalculated using the odour thresholds published in thebibliography (Escudero et al., 2004; Campo et al.,2006).
Foam quality
The foam quality of sparkling base wines was mea-sured using the Mosalux method (Maujean et al.,1990). The foam parameters measured in this studycorresponded to the maximum height reached by thefoam (HM) and the height of the foam at stability
© 2013 Institute of Food Science and TechnologyInternational Journal of Food Science and Technology 2014
Bentonite effect on wine sensory properties E. Lira et al.1072
(HS). HM represents foamability and HS foam persis-tence (the wine’s ability to produce a stable foam)(Maujean et al., 1990). Before measuring the foamparameters, the samples were degassed using a mag-netic stirrer for 15 min and centrifuged at 4000 g at4 °C for 5 min. A glass cylinder placed on a glass fritwas filled with 100 mL of sparkling base wine. Carbondioxide was injected into the glass cylinder through theglass frit with a constant gas flow of 115 mL min�1nat a constant pressure of 200 kPa. During gas purging,the foam height, measured in millimetres, was moni-tored by photoelectric cells (infrared beams). Eachsample was analysed in triplicate.
Statistical analysis
All the statistical analyses were performed withthe SPSS statistical package (version 17.0, SPSS Inc.,Chicago, IL, USA). One-way analysis of variance(ANOVA) was applied to the data for scale and treat-ment effect.
Results and discussion
Chemical analysis of wines
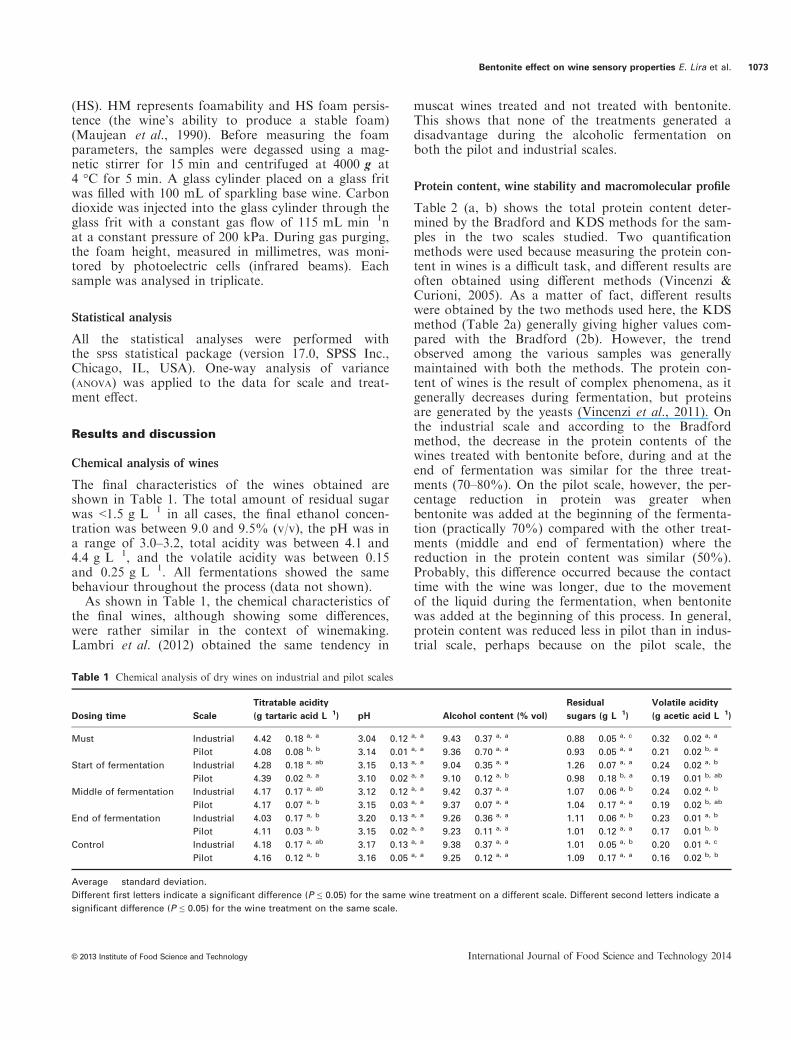
The final characteristics of the wines obtained areshown in Table 1. The total amount of residual sugarwas <1.5 g L�1 in all cases, the final ethanol concen-tration was between 9.0 and 9.5% (v/v), the pH was ina range of 3.0–3.2, total acidity was between 4.1 and4.4 g L�1, and the volatile acidity was between 0.15and 0.25 g L�1. All fermentations showed the samebehaviour throughout the process (data not shown).
As shown in Table 1, the chemical characteristics ofthe final wines, although showing some differences,were rather similar in the context of winemaking.Lambri et al. (2012) obtained the same tendency in
muscat wines treated and not treated with bentonite.This shows that none of the treatments generated adisadvantage during the alcoholic fermentation onboth the pilot and industrial scales.
Protein content, wine stability and macromolecular profile
Table 2 (a, b) shows the total protein content deter-mined by the Bradford and KDS methods for the sam-ples in the two scales studied. Two quantificationmethods were used because measuring the protein con-tent in wines is a difficult task, and different results areoften obtained using different methods (Vincenzi &Curioni, 2005). As a matter of fact, different resultswere obtained by the two methods used here, the KDSmethod (Table 2a) generally giving higher values com-pared with the Bradford (2b). However, the trendobserved among the various samples was generallymaintained with both the methods. The protein con-tent of wines is the result of complex phenomena, as itgenerally decreases during fermentation, but proteinsare generated by the yeasts (Vincenzi et al., 2011). Onthe industrial scale and according to the Bradfordmethod, the decrease in the protein contents of thewines treated with bentonite before, during and at theend of fermentation was similar for the three treat-ments (70–80%). On the pilot scale, however, the per-centage reduction in protein was greater whenbentonite was added at the beginning of the fermenta-tion (practically 70%) compared with the other treat-ments (middle and end of fermentation) where thereduction in the protein content was similar (50%).Probably, this difference occurred because the contacttime with the wine was longer, due to the movementof the liquid during the fermentation, when bentonitewas added at the beginning of this process. In general,protein content was reduced less in pilot than in indus-trial scale, perhaps because on the pilot scale, the
Table 1 Chemical analysis of dry wines on industrial and pilot scales
Dosing time Scale
Titratable acidity
(g tartaric acid L�1) pH Alcohol content (% vol)
Residual
sugars (g L�1)
Volatile acidity
(g acetic acid L�1)
Must Industrial 4.42 � 0.18 a, a 3.04 � 0.12 a, a 9.43 � 0.37 a, a 0.88 � 0.05 a, c 0.32 � 0.02 a, a
Pilot 4.08 � 0.08 b, b 3.14 � 0.01 a, a 9.36 � 0.70 a, a 0.93 � 0.05 a, a 0.21 � 0.02 b, a
Start of fermentation Industrial 4.28 � 0.18 a, ab 3.15 � 0.13 a, a 9.04 � 0.35 a, a 1.26 � 0.07 a, a 0.24 � 0.02 a, b
Pilot 4.39 � 0.02 a, a 3.10 � 0.02 a, a 9.10 � 0.12 a, b 0.98 � 0.18 b, a 0.19 � 0.01 b, ab
Middle of fermentation Industrial 4.17 � 0.17 a, ab 3.12 � 0.12 a, a 9.42 � 0.37 a, a 1.07 � 0.06 a, b 0.24 � 0.02 a, b
Pilot 4.17 � 0.07 a, b 3.15 � 0.03 a, a 9.37 � 0.07 a, a 1.04 � 0.17 a, a 0.19 � 0.02 b, ab
End of fermentation Industrial 4.03 � 0.17 a, b 3.20 � 0.13 a, a 9.26 � 0.36 a, a 1.11 � 0.06 a, b 0.23 � 0.01 a, b
Pilot 4.11 � 0.03 a, b 3.15 � 0.02 a, a 9.23 � 0.11 a, a 1.01 � 0.12 a, a 0.17 � 0.01 b, b
Control Industrial 4.18 � 0.17 a, ab 3.17 � 0.13 a, a 9.38 � 0.37 a, a 1.01 � 0.05 a, b 0.20 � 0.01 a, c
Pilot 4.16 � 0.12 a, b 3.16 � 0.05 a, a 9.25 � 0.12 a, a 1.09 � 0.17 a, a 0.16 � 0.02 b, b
Average � standard deviation.
Different first letters indicate a significant difference (P ≤ 0.05) for the same wine treatment on a different scale. Different second letters indicate a
significant difference (P ≤ 0.05) for the wine treatment on the same scale.
© 2013 Institute of Food Science and Technology International Journal of Food Science and Technology 2014
Bentonite effect on wine sensory properties E. Lira et al. 1073

tanks had a lower height, and so the bentonite tookless time to settle resulting in a shorter contact timebetween the bentonite and the wine.
The wines treated with bentonite during fermenta-tion were all protein stable, on both the industrial andpilot scales, while the wine obtained from the musttreated with bentonite was unstable on the pilot scale,but stable on the industrial scale, although the differ-ences between the two scales were small (close DNTU= 2). Finally, as expected, the control wines wereunstable on both scales. These results show that thestability of the obtained wines has a similar trend forboth scales with these types of bentonite treatments.Unstable wines were treated with an additional doseof 5 g hL�1 of bentonite. This additional treatmentwas sufficient to stabilise the wines, although itapparently affected only minimally their final proteinconcentration, as measured with the systems hereadopted.
The protein profile of musts and wines was analysedby electrophoresis at the different stages of this study.Figure 1 shows that Macabeo grape juice presentedfour main groups of protein bands, which corre-sponded to the classical pattern found in previouslypublished papers (Vincenzi & Curioni, 2005; Vincenziet al., 2011). Based on previous data, the band with
the highest molecular weight can be ascribed toinvertases, followed by b-glucanases, chitinases andfinally Thaumatin-like proteins (TLP).However, the band identifiable as b-glucanase
appears only during fermentation as can be observed inFig. 1, which compares the initial must of the control
Table 2 (a) Protein content by Bradford method (mg L�1 BSA). (b) Protein content by KDS method (mg L�1 BSA)
Dosing time Scale Dry wine Stabilised wine (5 g hL�1 of bentonite) Protein decrease dry wine (mg L�1) (%)a
(a)
Must clarification Industrial 8.4 � 0.7 a, a 8.4 � 0.7 a, a 3.4 (29)
Pilot 8.0 � 0.6* a, a 7.5 � 0.5 a, a 3.8 (32)
Start of fermentation Industrial 2.5 � 0.3 a, b 2.5 � 0.3 a, b 9.2 (78)
Pilot 3.7 � 1.6 a, d 3.7 � 1.6 a, d 8.1 (69)
Middle of fermentation Industrial 3.5 � 0.7 b, b 3.5 � 0.7 b, b 8.3 (71)
Pilot 5.8 � 0.3 a, c 5.8 � 0.3 a, c 5.9 (50)
End of fermentation Industrial 2.4 � 0.4 b, b 2.4 � 0.4 b, b 9.3 (79)
Pilot 6.2 � 0.7 a, bc 6.2 � 0.7 a, bc 5.6 (47)
Control Industrial 8.7 � 0.5* a, a 8.9 � 0.5 a, a 3.0 (26)
Pilot 7.4 � 0.9* a, ab 7.8 � 1.0 a, ab 4.4 (37)
(b)
Must clarification Industrial 13.0 � 1.6 a, a 13.0 � 1.6 a, a 2.4 (16)
Pilot 12.7 � 1.1* a, ab 11.6 � 0.4 a, b 2.7 (18)
Start of fermentation Industrial 6.4 � 0.1 a, b 6.4 � 0.1 a, b 9.0 (59)
Pilot 5.9 � 1.0 a, c 5.9 � 1.0 a, c 9.5 (62)
Middle of fermentation Industrial 6.0 � 1.0 b, b 6.0 � 1.0 b, b 9.4 (61)
Pilot 11.3 � 2.4 a, b 11.3 � 2.4 a, b 4.1 (27)
End of fermentation Industrial 11.8 � 0.4 b, a 11.8 � 0.4 b, a 3.6 (23)
Pilot 14.1 � 0.3 a, a 14.1 � 0.3 a, a 1.3 (8)
Control Industrial 12.5 � 0.9* a, a 11.6 � 0.4 a, a 2.9 (19)
Pilot 12.1 � 0.8* a, b 13.6 � 2.6 a, ab 3.3 (21)
aDecrease percentage.
*Unstable wines at the end of the fermentation.
Average � standard deviation. Initial must value: 15.4 � 1.9 mg L�1.
Different first letters indicate a significant difference (P ≤ 0.05) for the same wine treatment on a different scale. Different second letters indicate a
significant difference (P ≤ 0.05) for the wine treatment on the same scale.
T04i T04A T04D T04ST05i T05S T05E T02i T02A T02D T02S F13A F13D F13S
Invertase
ββ-glucanase
chitinase
TLPs
Figure 1 SDS-PAGE analysis (Coomassie staining) of the original
wines (lanes T05i, T04i and T02i initial must sample; lanes T05S,
T04S, T02S and F13S dry wine/end of fermentation; lane T05E
bentonite-treated stable wine; lanes T04A, T02A and F13A prior to
bentonite addition during fermentation; lanes T04D, T02D and
F13D 24 h after bentonite addition during fermentation). T lanes
are from the industrial scale, and F lanes are from the pilot scale.
© 2013 Institute of Food Science and TechnologyInternational Journal of Food Science and Technology 2014
Bentonite effect on wine sensory properties E. Lira et al.1074
sample (lane T05i) with the corresponding dry wine(lane T05S). In contrast, chitinases seem to disappearduring fermentation not only for the samples obtainedafter all the different treatments, in which the proteinshould be obviously removed by bentonite, but also forthe untreated control (Fig. 1). Similar results wereobtained by Ferreira et al. (2000). Also the group ofbands corresponding to TLPs diminished in wines trea-ted with bentonite during fermentation, appearing to bestable at the end of the fermentation. These proteins,although being more stable compared with chitinases,are known to be involved in protein haze (Waters et al.,1996; Vincenzi et al., 2011). In the case of the controlwine, which was unstable after alcoholic fermentation,the intensity of the TLP bands decreased slightlybecause on the industrial scale, only a small dose ofbentonite was used to treat the wine (see lanes T05Sand T05E). Treatments with bentonite significantlydecreased the intensity of all the bands at 24 h of treat-ment. This effect can be observed by comparing the winebefore (lane T04A) and after (T04D) bentonite treat-ment and was greater at the end of the fermentation(lane T04S). Moreover, SDS-PAGE analysis revealedthe similarity of protein profiles of the wines producedon the industrial and the pilot scales, the results beingthe same during the vinification (lanes T02 I-A-D-S andF13 A-D-S). Lanes T05S and T05E correspond to theunstable and stable wines of the control treatment. Theprotein profiles of the control sample before (lane T05S)and after (lane T05E) stabilisation were also quite simi-lar for both wines are quite similar. In this case, the sta-bilising dose of bentonite added was very low, andtherefore, protein removal was low as well, confirmingthe results of protein quantification (Table 2).
The above results show that the industrial- andpilot-scale control wines and the pilot-scale wineobtained from the grape juice clarified with bentonitewere unstable once the fermentation had finished. Inthese cases, the final protein concentrations werehigher, in the range from 7.5 to 9 mg L�1 of BSA,and the bands corresponding to b-glucanases were stillpresent. On the other hand, the protein profiles ofwines treated during fermentation varied, with the dis-appearance of the b-glucanases and the decrease in thestaining intensity of the other bands. These results andthose of protein quantification (Table 2) indicate thateffectiveness of bentonite tended to increase the earlierthe bentonite was added. This may be due to the effectof the ethanol that is produced by fermentation. It hasbeen reported that the size of ethanol molecules isgreater than that of water molecules, so they can bet-ter separate the bentonite layers and lead to a higherprotein trapping capacity (Achaerandio et al., 2001).In addition, it has been suggested that there is a com-petition between proteins and smaller nitrogen com-pounds on the bentonite surface, resulting in a lower
deproteinising capacity in grape juice than in finishedwine (Somers & Ziemelis, 1973).
Aroma fermentative compounds
Table 3(a, b) presents the concentrations of the aromacompounds analysed in this study. In addition, in thesame table are also presented the odour activity values(OAV) of each compound and the total OAV for eachchemical family with sensory importance (consideringonly the compounds with OAV > 1 u.a). As can beseen, the results seem to indicate that the addition ofbentonite affects the wine aroma not only by theadsorption of compounds (Waters et al., 2005), butalso by the production of these compounds during fer-mentation. In this sense, our results showed higherinfluence on fermentative aroma compounds of theaddition of bentonite than other studies in which thefining with bentonite was carried out in final wines(Sanborn et al., 2010).The calculation of OAV has shown that most of the
aroma compounds studied were presented in contentshigher their odour thresholds, so they will contributeddirectly to the wine aroma. With regard to the totalaroma intensity of wines estimated by the total OAV,this ranged between 970 and 1279 u.a for pilot scaleand between 1073 and 1172 u.a for industrial scale.Although were not observed important differencesbetween scales (differences lower than 17%), which isconsistent with the results obtained by Casalta et al.(2010), the total estimated odour impact of wines forthe different treatments was less dispersed in the case ofindustrial winemaking. Considering the different treat-ments, the differences in the contents of aroma com-pounds could affect the some aroma notes of wines.Thus, in general, for pilot scale, the OAVs for ethylesters and acetates were higher for wines treated withbentonite at the end of fermentation and in the case ofmust clarification and lower in the case of addition ofbentonite during winemaking (beginning and half).However, in the case of industrial winemaking withmust clarification, the tendency for ethyl esters and ace-tates was contrary, the differences for other treatmentsbeing less important. The sensory effect of esters couldbe evaluated by the use of OAV ratio of ethyl esters toacetates that may indicate the tendency to express notesto tropical fruit (low ratio) or tree fruit (high ratio)(Ferreira et al., 1995). Thus, in the case of pilot scale,the ratio was similar to control wine for all treatmentswith bentonite except for the addition at the end of fer-mentation (13% higher than the control value). How-ever, in the case of industrial scale, the higherdifference was observed for the addition of bentonite tothe must (25% lower than the control value).Other chemical group with sensory importance is the
fatty acid family. The OAV for fatty acids in pilot-scale
© 2013 Institute of Food Science and Technology International Journal of Food Science and Technology 2014
Bentonite effect on wine sensory properties E. Lira et al. 1075

winemaking for bentonite-treated wines was in generallower than in the control wine. However, for industrialwinemaking, the behaviour was contrary for the mustclarification and for the addition of bentonite at the endof fermentation (higher than control) than during thefermentation (lower than control). Acids contribute tofreshness of wine and to equilibrate the fruity aromanotes (Etievant, 1991).
Foam quality
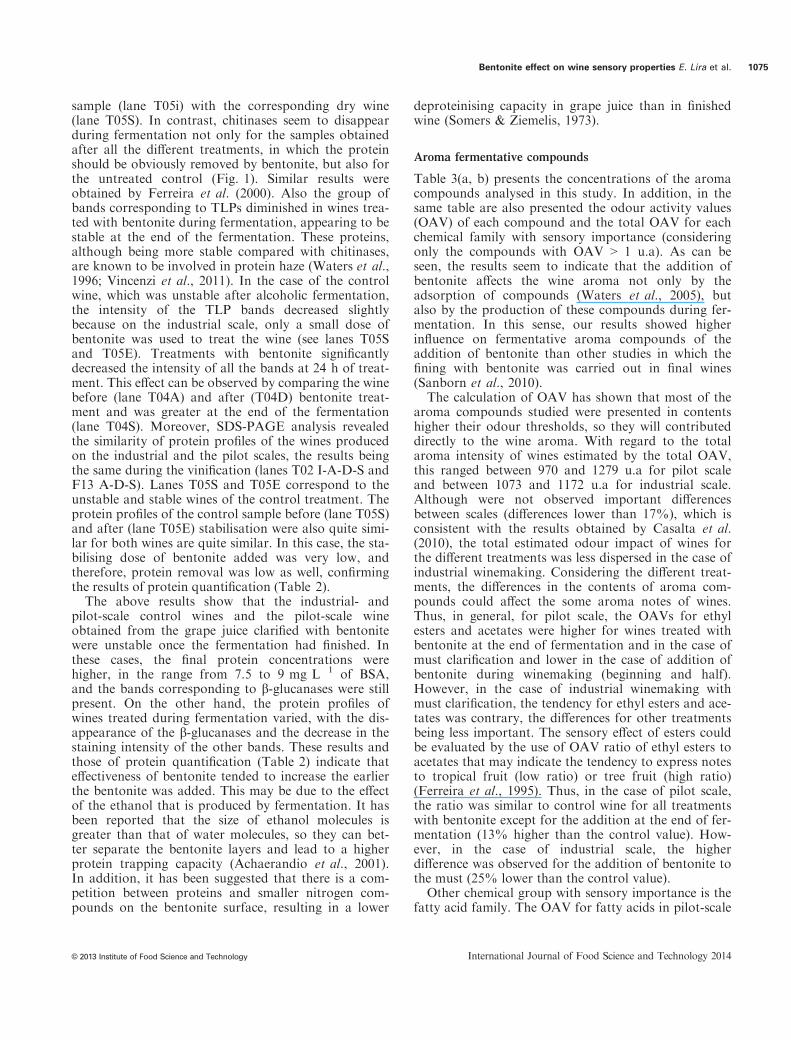
Figure 2 shows the results of the foamability (HM)and foam persistence (HS) of wines obtained from thedifferent treatments. Foamability and persistence werehigher on the industrial scale than on the pilot scale,indicating that the treatments performed on the pilot
scale had a more aggressive effect on the foamingproperties, irrespective of the lower removal of pro-teins in this case as reported in Table 2.The foamability (HM) on an industrial scale is
greater in wines treated in the middle and at the endof fermentation, while on a pilot scale it is greater inwines treated in the middle and in the end of fermen-tation, as shown in Fig. 2a. The treatments tended tohave the similar effect on the two scales studied(industrial and pilot). The only exception was theeffect of adding bentonite at the end of the fermenta-tion on the pilot scale, which led to an HM valueof 128 mm, lower than the same treatment on theindustrial scale.Industrial-scale wines treated during alcoholic fer-
mentation have lower values of foam persistence (HS)
Table 3 (a) Fermentative aroma compounds in industrial-scale winemaking. (b) Fermentative aroma compounds in pilot-scale winemaking
Compound [odour threshold
(mg L�1)] Must Clarification Start of fermentation Middle of fermentation End of fermentation Control
(a)
Ethyl acetate (12.3) 129.6 [10.54] 135.9 [11.05] 145.3 [11.81] 159.9 [13.00] 150.9 [12.27]
Isoamyl acetate (0.03) 12.85 [428.3] 12.19 [406.3] 11.28 [376.0] 11.77 [392.3] 11.48 [382.7]
n-Hexyl acetate (1.5) 1.33 [<1 u.a.] 1.19 [<1 u.a.] 1.30 [<1 u.a.] 1.23 [<1 u.a.] 1.28 [<1 u.a.]
Isoamyl alcohol (30) 66.48 [2.22] 60.58 [2.02] 63.67 [2.12] 61.68 [2.06] 61.70 [2.06]
Ethyl butyrate (0.02) 0.03 [1.50] 0.04 [2.00] 0.03 [1.50] 0.03 [1.50] 0.04[1.75]
Ethyl hexanoate (0.014) 0.79 [56.43] 0.57 [40.71] 0.57 [40.71] 0.55 [39.29] 0.53 [37.86]
Ethyl octanoate (0.005) 2.78 [556.0] 3.48 [696.0] 3.53 [706.0] 3.54 [708.0] 3.51 [702.0]
Ethyl decanoate (0.2) 0.61 [3.05] 0.33 [1.65] 0.37 [1.85] 0.42 [2.10] 0.53 [2.65]
Isoamyl octanoate (0.125) 0.00 [<1 u.a.] 0.02 [<1 u.a.] 0.02 [<1 u.a.] 0.04 [<1 u.a.] 0.03 [<1 u.a.]
Octanoic acid (0.5) 6.04 [12.08] 2.96 [5.92] 3.02 [6.04] 3.76 [7.52] 4.74 [9.48]
Dodecanoic acid (1) 3.39 [3.39] 0.33 [0.33] 2.32 [2.32] 6.61 [6.61] 1.37 [1.37]
OAV (ethyl esters)* 617.0 740.4 750.1 750.9 744.3
OAV (acetates) 438.9 417.4 387.8 405.3 394.9
Ratio OAV ethyl/acetates 1.41 1.77 1.93 1.85 1.88
OAV (acids)* 15.47 6.25 8.36 14.13 10.85
OAV total 1073 1166 1148 1172 1152
(b)
Ethyl acetate (12.3) 84.03 [6.83] 132.8 [10.80] 49.82 [4.05] 66.46 [5.40] 71.34 [5.80]
Isoamyl acetate (0.03) 12.33 [411.0] 9.41 [313.7] 11.07 [369.0] 12.22 [407.3] 11.23 [374.2]
n-Hexyl acetate (1.5) 1.46 [<1 u.a.] 0.93 [<1 u.a.] 1.34 [<1 u.a.] 1.39 [<1 u.a.] 1.30 [<1 u.a.]
Isoamyl alcohol (30) 77.93 [2.6] 59.99 [2] 62.87 [2.1] 67.07 [2.24] 84.56 [2.82]
Ethyl butyrate (0.02) 0.03 [1.50] 0.03 [1.50] 0.03 [1.50] 0.03 [1.50] 0.03 [1.50]
Ethyl hexanoate (0.014) 0.55 [39.29] 0.54 [38.57] 0.59 [42.14] 0.60 [42.86] 0.56 [39.64]
Ethyl octanoate (0.005) 3.83 [766.0] 2.92 [584.0] 3.04 [608.0] 3.98 [796.0] 3.21 [642.0]
Ethyl decanoate (0.2) 1.05 [5.25] 0.88 [4.40] 0.92 [4.60] 0.97 [4.85] 0.99 [4.95]
Isoamyl octanoate (0.125) 0.03 [<1 u.a.] 0.03 [<1 u.a.] 0.03 [<1 u.a.] 0.03 [<1 u.a.] 0.04 [<1 u.a.]
Octanoic acid (0.5) 9.09 [18.18] 4.98 [9.96] 7.60 [15.2] 7.56 [15.12] 9.36 [18.71]
Dodecanoic acid (1) 4.44 [4.44] 5.39 [5.39] 2.29 [2.29] 3.39 [3.39] 4.03 [4.03]
OAV (ethyl esters)* 812.0 628.5 656.2 845.2 688.1
OAV (acetates)* 417.8 324.5 373.1 412.7 380.0
Ratio OAV ethyl/acetates 1.94 1.94 1.76 2.05 1.81
OAV (acids)* 22.62 15.35 17.49 18.51 22.74
OAV total 1254 970 1049 1279 1093
*Significant differences, ANOVA (P ≤ 0.05).
Concentration expressed in mg L�1.
Odour activity values indicate in brackets.
© 2013 Institute of Food Science and TechnologyInternational Journal of Food Science and Technology 2014
Bentonite effect on wine sensory properties E. Lira et al.1076
than the control and the must clarified with bentonite,while five treatments presented the same level of per-sistence on the pilot scale (see Fig. 2b). As in thepilot-scale study by Salazar et al. (2010), the additionof bentonite to the final wines led to similar persistencein all wines regardless of the dose applied. This maybe due to the reduction in the 60-kDa protein fraction(invertase) that took place in this study (see Fig. 1). Inthe study by Vanrell et al. (2007), the addition of ben-tonite to facilitate the riddling process seriouslyaffected the foam quality, although the champanisa-tion process does not seem to be so important. Thisaddition caused a statistically significant decrease infoamability (HM) and foam persistence (HS) andremoved nearly all the proteins from fractionsof molecular weight of 60 kDa (invertase) and20–30 kDa (chitinase and TLP), reducing the total sol-uble protein concentration by more than 80%.
Conclusions
The results show scale effects in the effectiveness ofbentonite addition and in the parameters of foam
quality. Considering the theoretical estimation of thesensory impact of the wine aroma, have not foundimportant differences between winemaking scales, andin a first view, the wines with higher sensory impact/quality could be the wines treated with bentonite atthe end of fermentation. However, further work,including sensory analysis, is required to be able toidentify the best moment for bentonite treatment as afunction of the destination of the wine obtained.
Acknowledgments
JJRB thanks the fellowship of the program ‘Beatriu dePin�os’ with the support of the Secretariat d’Universi-tats i Recerca del Departament d’Economia i Coneixe-ment de la Generalitat de Catalunya and theEuropean Union. We thank Mr. Joan Rabad�a andMs. Laia Valldosera (CEVIPE, Vila-rodona) for tech-nical assistance during the industrial-scale fermenta-tions.
References
Achaerandio, I., Pachova, V., Guell, C. & Lopez, F. (2001). Proteinadsorption by bentonite in a white wine model solution: effect ofprotein molecular weight and ethanol concentration. AmericanJournal of Enology and Viticulture, 52, 122–126.
Aguera, E. & Sablayrolles, J.M. (2005). Vinification �a l’�echelle pilote(100L) . II Caract�erisation–Int�eret. Wine Internet Technical Jour-nal, 7, (http://www.infowine.com/Default.asp?scheda=2581).
Bradford, M. (1976). A rapid and sensitive method for the quantifi-cation of microgram quantities of proteins utilizing the principle ofprotein-dye binding. Analytical Biochemistry, 72, 248–254.
Campo, E., Ferreira, V., Escudero, A., Marqu�es, J.C. & Cacho, J.(2006). Quantitative gas chromatography–olfactometry and chemi-cal quantitative study of the aroma of four Madeira wines. Analyti-ca Chimica Acta, 563, 180–187.
Casalta, E., Aguera, E., Picou, C., Rodr�ıguez-Bencomo, J.J.,Salmon, J.M. & Sablayrolles, J.M. (2010). A comparison of labora-tory and pilot-scale fermentations in winemaking conditions.Applied Microbiology and Biotechnology, 87, 1665–1673.
Coelho, E., Coimbra, M.A., Nogueira, J.M.F. & Rocha, S.M.(2009). Quantification approach for assessment of sparkling winevolatiles from different soils, ripening stages, and varieties by stirbar sorptive extraction with liquid desorption. Analytica ChimicaActa, 635, 214–221.
Dizy, M. & Bisson, L.F. (2000). Proteolytic activity of yeast stainsduring grape juice fermentation. American Journal of Enology andViticulture, 51, 155–167.
Dupin, I.V.S., McKinnon, B.M., Ryan, C. et al. (2000). S. cerevisiaemannoproteins that protect wine from protein haze: their releaseduring fermentation and lees contact and a proposal for theirmechanism of action. Journal of Agricultural and Food Chemistry,48, 3098–3105.
Escudero, A., Gogorza, B., Melus, M.A., Ort�ın, N., Cacho, J. &Ferreira, V. (2004). Characterization of the aroma of a wine fromMaccabeo. Key role played by compounds with low odor activityvalues. Journal of Agricultural and Food Chemistry, 52, 3516–3524.
Etievant, P. (1991). Wine. In: Volatile Compounds in Foods andBeverages. (edited by H. Maarse). Pp. 483–546. New York: MarcelDekker.
Ferreira, V., Fernandez, P., Pena, C., Escudero, A. & Cacho, J.(1995). Investigation on the role played by fermentation esters in
0
50
100
150
200
250
300
350
PilotIndustrial
PilotIndustrial
Foam
abili
ty, H
M (m
m)
ControlMust clarificationStart of fermentationMiddle of fermentationEnd of fermentation
(a,b) (a,b)
(a,c)
(a,a) (a,a)
(b,a)
(b,c)(b,c)(b,b)
(b,ab)
0
10
20
30
40
50
Foam
per
sist
ence
, HS
(mm
) ControlMust clarificationStart of fermentationMiddle of fermentationEnd of fermentation
(a,a)
(b,a)
(a,b)
(a,a)
(a,b)(a,b)
(b,a) (b,a) (b,a) (b,a)
Figure 2 Foamability and foam persistence of sparkling base wine
on industrial and pilot scales. Different first letters in each bar indi-
cate a significant difference (P ≤ 0.05) for the same wine treatment on
a different scale. Different second letters in each bar indicate a signifi-
cant difference (P ≤ 0.05) for the wine treatment on the same scale.
© 2013 Institute of Food Science and Technology International Journal of Food Science and Technology 2014
Bentonite effect on wine sensory properties E. Lira et al. 1077

the aroma of young Spanish wines by multivariate analysis. Journalof the Science of Food and Agriculture, 67, 381–392.
Ferreira, R., Monteiro, S., Pic�arra-Pereira, M.A., Conceic�ao-Tanganho, M., Loureiro, V.B. & Teixeira, A.R. (2000). Character-ization of the Proteins from Grapes and Wines by ImmunologicalMethods. American Journal of Enology and Viticulture, 51, 22–28.
Laemmli, U.K. (1970). Cleavage of structural proteins during theassembly of the head of bacteriophage T4. Nature, 227, 680–685.
Lambri, M., Dordoni, R., Silva, S. & De Faveri, D.M. (2010). Effectof bentonite fining on odor-active compounds in two differentwhite wine styles. American Journal of Enology and Viticulture, 61,225–233.
Lambri, M., Dordoni, R., Silva, S. & De Faveri, D.M. (2012). Com-paring the impact of bentonite addition for both must clarificationand wine fining on the chemical profile of wine from ChambaveMuscat grapes. International Journal of Food Science & Technology,47, 1–12.
L�opez-Barajas, M., L�opez-Tamames, E., Buxaderas, S., Suberbiola,G. & Torre-Boronat, M.C. (2001). Influence of wine polysaccha-rides of different molecular mass on wine foaming. American Jour-nal of Enology and Viticulture, 52, 146–150.
Malherbe, S. (2003). Modeling of alcoholic fermentation in wine-making conditions. Thesis. Montpellier, France: University ofMontpellier II.
Maujean, A., Poinsaut, P., Dantan, H., Brissonnet, F. & Cossiez, E.(1990). �Etude de la tenue et de la qualit�e de mousse des vins effer-vescents. II. Mise au point d’une technique de mesure de la mous-sabilit�e, de la tenue et de la stabilit�e de la mousse des vinseffervescents. Bulletin de l’OIV, 63, 405–426.
Miller, G.C., Amon, J.M., Gibson, R.L. & Simpson, R.F. (1985).Loss of wine aroma attributable to protein stabilization with ben-tonite or ultrafiltration. Australian Grapegrower & Winemaker, 256,49–50.
Moine-Ledoux, V. & Dubourdieu, D. (1999). An invertase fragmentresponsible for improving the protein stability of dry white wines.Journal of the Science of Food and Agriculture, 79, 537–543.
Moio, L., Ugliano, M., Gambuti, A., Genovese, A. & Piombino, P.(2004). Influence of clarification treatment on concentrations ofselected free varietal aroma compounds and glycoconjugates inFalanghina (Vitis vinifera L.) must and wine. American Journal ofEnology and Viticulture, 55, 7–12.
Pocock, K.F., Salazar, F.N. & Waters, E.J. (2011). The effect ofbentonite fining at different stages of white winemaking on protein
stability. Australian Journal of Grape and Wine Research, 17,280–284.
Salazar, F.N., Achaerandio, I., Labb�e, M.A., G€uell, C. & L�opez, F.(2006). Comparative study of protein stabilization in white wineusing zirconia and bentonite: physicochemical and wine sensoryanalysis. Journal of the Science of Food and Agriculture, 54,9955–9958.
Salazar, F.N., Zamora, F., Canals, J.M. & L�opez, F. (2010). Proteinstabilization in sparkling base wine using zirconia and bentonite:influence on the foam parameters and protein fractions. JournalInternational des Sciences de la Vigne et du Vin, special issue Mac-rowine, June 2010, 51–58.
Sanborn, M., Edwards, C.G. & Ross, C.F. (2010). Impact of finingon chemical and sensory properties of Washington State Chardon-nay and Gew€urztraminer wines. American Journal of Enology andViticulture, 61, 31–41.
Somers, T.C. & Ziemelis, G. (1973). The use of gel column analysisin evaluation of bentonite fining procedures. American Journal ofEnology and Viticulture, 24, 51–55.
Vanrell, G., Canals, R., Esteruelas, M., Fort, F., Canals, J.M. &Zamora, F. (2007). Influence of the use of bentonite as a riddlingagent on foam quality and protein fraction of sparkling wines(Cava). Food Chemistry, 104, 148–155.
Vila, I. (1998). Les levures aromatiques en vinification: �evaluation dece caract�ere par l’analyse sensorielle et l’analyse chimique. D�eter-minisme biochimique des facteurs responsables. Thesis., Montpel-lier, France: University of Montpellier II.
Vincenzi, S. & Curioni, A. (2005). Anomalous electrophoretic behav-ior of a chitinase isoform from grape berries and wine in glycolchitin containing SDS-PAGE gels. Electrophoresis, 26, 60–63.
Vincenzi, S., Marangon, M., Tolin, S. & Curioni, A. (2011). Proteinevolution during the early stages of white winemaking and its rela-tions with wine stability. Australian Journal of Grape and WineResearch, 17, 20–27.
Vincenzi, S., Crapisi, A. & Curioni, A. (2014). Foamability of Prose-cco wine: cooperative effects of high molecular weight glycocom-pounds and wine PR-proteins. Food Hydrocolloids, 34, 202–207.
Waters, E.J., Shirley, N.J. & Williams, P.J. (1996). Nuisance proteinsof wine are grape pathogenesis-related proteins. Journal of Agricul-tural and Food Chemistry, 44, 3–5.
Waters, E.J., Alexander, G., Muhlack, R. et al. (2005). Preventingprotein haze in bottled white wine. Australian Journal of Grape andWine Research, 11, 215–225.
© 2013 Institute of Food Science and TechnologyInternational Journal of Food Science and Technology 2014
Bentonite effect on wine sensory properties E. Lira et al.1078
Copyright © 2022 FDOKUMEN