Synchrotron light: From basics to coherence and coherence ...
Upload
independentCategory
view
0download
0
Effect of Scan Quality on Diagnostic Accuracy ofSpectral-Domain Optical Coherence Tomography
in Glaucoma
HARSHA L. RAO, UDAY K. ADDEPALLI, RAVI K. YADAV, SIRISHA SENTHIL, NIKHIL S. CHOUDHARI, ANDCHANDRA S. GARUDADRI
� PURPOSE: To evaluate the effect of scan quality on thediagnostic accuracies of optic nerve head (ONH), retinalnerve fiber layer (RNFL), and ganglion cell complex(GCC) parameters of spectral-domain optical coherencetomography (SD OCT) in glaucoma.� DESIGN: Cross-sectional study.� METHODS: Two hundred fifty-two eyes of 183 controlsubjects (mean deviation [MD]:L1.84 dB) and 207 eyesof 159 glaucoma patients (MD: L7.31 dB) underwentONH, RNFL, and GCC scanning with SD OCT. Scanquality of SD OCT images was based on signal strengthindex (SSI) values. Influence of SSI on diagnostic accu-racy of SD OCT was evaluated by receiver operatingcharacteristic (ROC) regression.� RESULTS: Diagnostic accuracies of all SD OCT param-eters were better when the SSI values were higher. Thiseffect was statistically significant (P < .05) for ONHand RNFL but not for GCC parameters. Inmild glaucoma(MD of L5 dB), area under ROC curve (AUC) for rimarea, average RNFL thickness, and average GCC thick-ness parameters improved from 0.651, 0.678, and0.726, respectively, at an SSI value of 30 to 0.873,0.962, and 0.886, respectively, at an SSI of 70. AUCsof the same parameters in advanced glaucoma (MDof L15 dB) improved from 0.747, 0.890, and 0.873,respectively, at an SSI value of 30 to 0.922, 0.994, and0.959, respectively, at an SSI of 70.� CONCLUSION: Diagnostic accuracies of SD OCTparameters in glaucoma were significantly influenced bythe scan quality even when the SSI values were withinthe manufacturer-recommended limits. These resultsshould be considered while interpreting the SD OCTscans for glaucoma. (Am J Ophthalmol 2014;157:719–727. � 2014 by Elsevier Inc. All rights reserved.)
Accepted for publication Dec 6, 2013.From the Vazir Sultan Tobacco (VST) Glaucoma Center (H.L.R.,
U.K.A., R.K.Y., S.S., N.S.C., C.S.G.) and the Center for ClinicalEpidemiology and Biostatistics (H.L.R.), L. V. Prasad Eye Institute,Banjara Hills, Hyderabad, India.
Inquiries to Harsha L. Rao, Kallam Anji Reddy Campus, L. V. PrasadEye Institute, Banjara Hills, Hyderabad - 500034, India; e-mail:[email protected], [email protected]
0002-9394/$36.00http://dx.doi.org/10.1016/j.ajo.2013.12.012
� 2014 BY ELSEVIER INC.
SPECTRAL-DOMAIN OPTICAL COHERENCE TOMOGRA-
phy (SD OCT) is a recent technique that enablesimaging the ocular structures with higher resolution
and faster scan rate compared to the previous version of thistechnology (Stratus OCT; Carl Zeiss Meditec, Inc, Dublin,California, USA).1,2 Several studies have reported gooddiagnostic ability of SD OCT in glaucoma.3–6 Twofactors that are known to influence the diagnostic abilityof SD OCT in glaucoma are severity of disease and sizeof the optic disc.7,8 Diagnostic accuracy of SD OCTparameters is shown to be significantly better in eyes withmore severe damage.7,8 Sensitivity of optic nerve head(ONH) parameters of SD OCT are shown to be greaterin large optic discs compared to small discs.7
In addition to the above 2 factors, another factor that hasbeen found to affect the parameter measurements of OCTis the quality of scan. Various studies with Stratus OCThave found a significant effect of scan quality on ONH,retinal nerve fiber layer (RNFL), and macular measure-ments.9–13 Kim and associates have also reported asignificant effect of scan quality on the RNFLmeasurements of SD OCT.14 Evaluating the influence ofscan quality on the diagnostic ability of imaging devicesin glaucoma, Sung and associates found that the scan qual-ity affected the diagnostic performance of the RNFLparameters of Stratus OCT.15 In a study on normal subjectsof Indian origin with SD OCT, Rao and associates foundthat signal strength of the scan, a measure of scan quality,affected the measurements of ONH but not the RNFL organglion cell complex (GCC) parameters; ONH rim mea-surements increased and cup measurements decreased withincreasing signal strengths.16 However, the effect of scanquality on the diagnostic ability of SD OCT in glaucomahas not been evaluated.The aim of this study was to evaluate the effect of scan
quality on the diagnostic performance of ONH, RNFL,and GCC parameters of SD OCT in glaucoma.
METHODS
THIS WAS AN OBSERVATIONAL, CROSS-SECTIONAL STUDY
of consecutive subjects referred by general ophthalmolo-gists to a tertiary eye care facility between September
719ALL RIGHTS RESERVED.
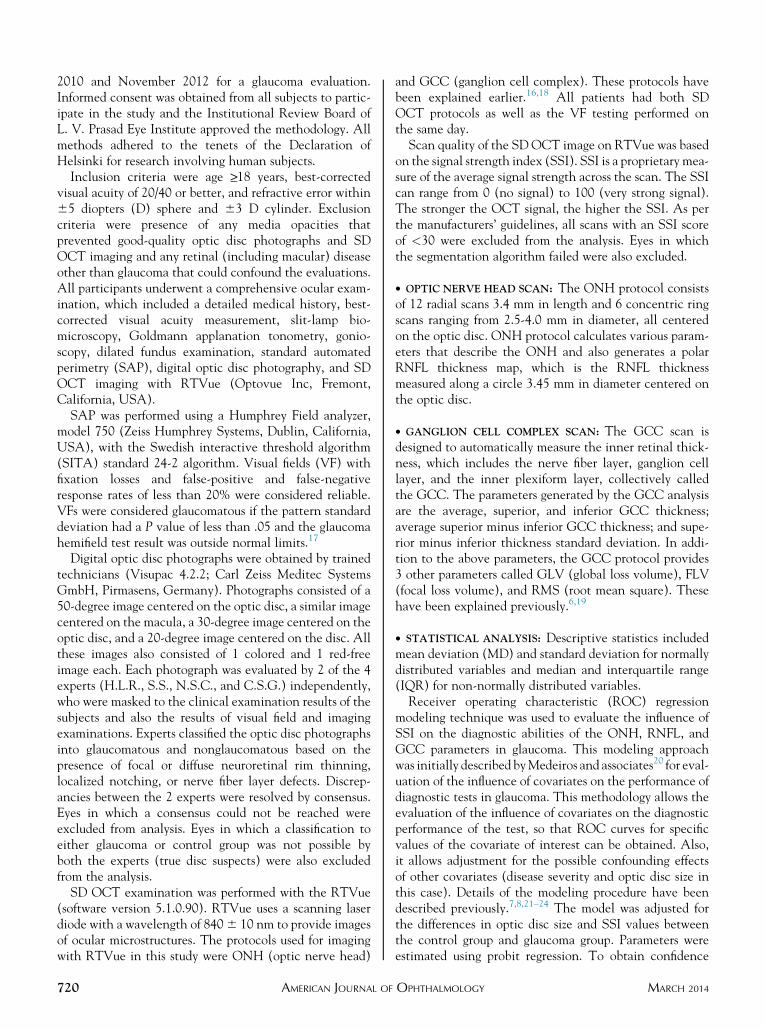
2010 and November 2012 for a glaucoma evaluation.Informed consent was obtained from all subjects to partic-ipate in the study and the Institutional Review Board ofL. V. Prasad Eye Institute approved the methodology. Allmethods adhered to the tenets of the Declaration ofHelsinki for research involving human subjects.
Inclusion criteria were age >_18 years, best-correctedvisual acuity of 20/40 or better, and refractive error within65 diopters (D) sphere and 63 D cylinder. Exclusioncriteria were presence of any media opacities thatprevented good-quality optic disc photographs and SDOCT imaging and any retinal (including macular) diseaseother than glaucoma that could confound the evaluations.All participants underwent a comprehensive ocular exam-ination, which included a detailed medical history, best-corrected visual acuity measurement, slit-lamp bio-microscopy, Goldmann applanation tonometry, gonio-scopy, dilated fundus examination, standard automatedperimetry (SAP), digital optic disc photography, and SDOCT imaging with RTVue (Optovue Inc, Fremont,California, USA).
SAP was performed using a Humphrey Field analyzer,model 750 (Zeiss Humphrey Systems, Dublin, California,USA), with the Swedish interactive threshold algorithm(SITA) standard 24-2 algorithm. Visual fields (VF) withfixation losses and false-positive and false-negativeresponse rates of less than 20% were considered reliable.VFs were considered glaucomatous if the pattern standarddeviation had a P value of less than .05 and the glaucomahemifield test result was outside normal limits.17
Digital optic disc photographs were obtained by trainedtechnicians (Visupac 4.2.2; Carl Zeiss Meditec SystemsGmbH, Pirmasens, Germany). Photographs consisted of a50-degree image centered on the optic disc, a similar imagecentered on the macula, a 30-degree image centered on theoptic disc, and a 20-degree image centered on the disc. Allthese images also consisted of 1 colored and 1 red-freeimage each. Each photograph was evaluated by 2 of the 4experts (H.L.R., S.S., N.S.C., and C.S.G.) independently,who were masked to the clinical examination results of thesubjects and also the results of visual field and imagingexaminations. Experts classified the optic disc photographsinto glaucomatous and nonglaucomatous based on thepresence of focal or diffuse neuroretinal rim thinning,localized notching, or nerve fiber layer defects. Discrep-ancies between the 2 experts were resolved by consensus.Eyes in which a consensus could not be reached wereexcluded from analysis. Eyes in which a classification toeither glaucoma or control group was not possible byboth the experts (true disc suspects) were also excludedfrom the analysis.
SD OCT examination was performed with the RTVue(software version 5.1.0.90). RTVue uses a scanning laserdiode with a wavelength of 8406 10 nm to provide imagesof ocular microstructures. The protocols used for imagingwith RTVue in this study were ONH (optic nerve head)
720 AMERICAN JOURNAL OF
and GCC (ganglion cell complex). These protocols havebeen explained earlier.16,18 All patients had both SDOCT protocols as well as the VF testing performed onthe same day.Scan quality of the SD OCT image on RTVue was based
on the signal strength index (SSI). SSI is a proprietary mea-sure of the average signal strength across the scan. The SSIcan range from 0 (no signal) to 100 (very strong signal).The stronger the OCT signal, the higher the SSI. As perthe manufacturers’ guidelines, all scans with an SSI scoreof <30 were excluded from the analysis. Eyes in whichthe segmentation algorithm failed were also excluded.
� OPTIC NERVE HEAD SCAN: The ONH protocol consistsof 12 radial scans 3.4 mm in length and 6 concentric ringscans ranging from 2.5-4.0 mm in diameter, all centeredon the optic disc. ONH protocol calculates various param-eters that describe the ONH and also generates a polarRNFL thickness map, which is the RNFL thicknessmeasured along a circle 3.45 mm in diameter centered onthe optic disc.
� GANGLION CELL COMPLEX SCAN: The GCC scan isdesigned to automatically measure the inner retinal thick-ness, which includes the nerve fiber layer, ganglion celllayer, and the inner plexiform layer, collectively calledthe GCC. The parameters generated by the GCC analysisare the average, superior, and inferior GCC thickness;average superior minus inferior GCC thickness; and supe-rior minus inferior thickness standard deviation. In addi-tion to the above parameters, the GCC protocol provides3 other parameters called GLV (global loss volume), FLV(focal loss volume), and RMS (root mean square). Thesehave been explained previously.6,19
� STATISTICAL ANALYSIS: Descriptive statistics includedmean deviation (MD) and standard deviation for normallydistributed variables and median and interquartile range(IQR) for non-normally distributed variables.Receiver operating characteristic (ROC) regression
modeling technique was used to evaluate the influence ofSSI on the diagnostic abilities of the ONH, RNFL, andGCC parameters in glaucoma. This modeling approachwas initially described byMedeiros and associates20 for eval-uation of the influence of covariates on the performance ofdiagnostic tests in glaucoma. This methodology allows theevaluation of the influence of covariates on the diagnosticperformance of the test, so that ROC curves for specificvalues of the covariate of interest can be obtained. Also,it allows adjustment for the possible confounding effectsof other covariates (disease severity and optic disc size inthis case). Details of the modeling procedure have beendescribed previously.7,8,21–24 The model was adjusted forthe differences in optic disc size and SSI values betweenthe control group and glaucoma group. Parameters wereestimated using probit regression. To obtain confidence
MARCH 2014OPHTHALMOLOGY

TABLE 1. Demographics, Visual Fields, and Spectral-Domain Optical Coherence Tomographic Characteristics of Control andGlaucoma Group
Control Group (n ¼ 252 Eyes of 183 Subjects) Glaucoma Group (n ¼ 207 Eyes of 159 Patients) P Value
Age (y) 54 (45, 62) 55 (48, 63) .34
Disc area (mm2) 2.21 (1.84, 2.56) 1.95 (1.61, 2.34) <.001
Mean deviation (dB) �1.84 (�3.08, �0.70) �7.31 (�14.60, �4.65) <.001
Pattern standard deviation (dB) 1.68 (1.47, 1.98) 7.62 (3.80, 10.35) <.001
Visual field index (%) 99 (98, 99) 82 (63, 92) <.001
Optic nerve head parameters
Signal strength index 51 (45, 59) 48 (41, 55) .003
Cup area (mm2) 1.37 (0.97, 1.84) 1.59 (1.26, 1.98) <.001
Rim area (mm2) 0.81 (0.51, 1.08) 0.27 (0.12, 0.53) <.001
Temporal rim area (mm2) 0.07 (0.03, 0.15) 0.03 (0.01, 0.09) <.001
Superior rim area (mm2) 0.26 (0.18, 0.35) 0.11 (0.03, 0.20) <.001
Nasal rim area (mm2) 0.25 (0.12, 0.35) 0.05 (0.02, 0.15) <.001
Inferior rim area (mm2) 0.19 (0.11, 0.29) 0.03 (0.01, 0.09) <.001
Rim volume (mm3) 0.06 (0.03, 0.10) 0.01 (0.00, 0.03) <.001
Cup volume (mm3) 0.40 (0.20, 0.66) 0.54 (0.33, 0.82) <.001
Cup-disc area ratio 0.64 (0.48, 0.78) 0.87 (0.73, 0.94) <.001
Horizontal cup-disc ratio 0.89 (0.76, 0.97) 0.98 (0.93, 1.00) <.001
Vertical cup-disc ratio 0.80 (0.71, 0.89) 0.96 (0.89, 0.99) <.001
Retinal nerve fiber layer parameters
Temporal quadrant (mm) 77.0 (70.3, 84.6) 63.2 (54.3, 72.2) <.001
Superior quadrant (mm) 123.9 (111.8, 135.6) 91.3 (80.8, 107.9) <.001
Nasal quadrant (mm) 80.5 (71.8, 88.5) 65.9 (55.3, 74.9) <.001
Inferior quadrant (mm) 129.3 (115.4, 141.7) 89.5 (81.3, 101.8) <.001
Average thickness (mm) 103.5 (94.6, 109.9) 78.2 (70.6, 87.5) <.001
Ganglion cell complex parameters
Signal strength index 61 (54, 69) 59 (51, 67) .01
Average (mm) 93.5 (88.6, 98.9) 76.9 (70.4, 84.4) <.001
Superior (mm) 94.1 (88.7, 98.4) 80.1 (71.2, 88.5) <.001
Inferior (mm) 93.7 (88.3, 99.4) 73.9 (67.1, 82.8) <.001
GCC FLV (%) 1.2 (0.3, 2.5) 6.7 (4.0, 9.7) <.001
GCC GLV (%) 5.8 (2.7, 10.0) 21.9 (14.4, 27.9) <.001
GCC RMS 0.1 (0.1, 0.1) 0.2 (0.1, 0.2) <.001
FLV ¼ focal loss volume; GCC ¼ ganglion cell complex; GLV ¼ global loss volume; RMS ¼ root mean square.
All values are median and interquartile ranges.
intervals (CI) for regression parameters, a bootstrapresampling procedure was used (n ¼ 1000 resamples).25
As measurements from both eyes of the same subject arelikely to be correlated, the standard statistical methods forparameter estimation lead to underestimation of standarderrors.26 Therefore, the cluster of data for the study subjectwas considered as the unit of resampling when calculatingstandard errors.23,25 Statistical analyses were performedusing commercial software (Stata ver. 11.2; StataCorp,College Station, Texas, USA).
RESULTS
SIX HUNDRED AND SEVENTY EIGHT EYES OF 382 CONSECU-
tive subjects referred for glaucoma evaluation to our centerwere analyzed. Forty-two eyes with unreliable VFs and 7
VOL. 157, NO. 3 SCAN QUALITY AND DIAGNOSTIC ABI
eyes with poor-quality disc photographs were excluded.Further, 12 eyes with segmentation algorithm failure onSD OCT, 7 eyes with SSI <30 on ONH scans, 3 eyeswith SSI <30 on GCC scans, and 3 eyes with SSI <30both on ONH and GCC scans were excluded. Of theremaining, 145 eyes in which the masked optic disc classifi-cation on photographs did not correlate with the VF classi-fication were excluded, leaving behind 459 eyes for theanalysis. Of these, 207 eyes with the optic disc and VF clas-sification as ‘‘glaucoma’’ formed the glaucoma group and 252eyes with optic disc and VF classification as ‘‘nonglaucoma’’formed the control group. Table 1 shows the demographic,visual field, and SDOCT parameters of the 2 groups. All VFand SD OCT parameters were significantly different in theglaucoma compared to the control group. Glaucomapatients had significantly smaller optic discs than thecontrol subjects. SSI values were statistically significantlyhigher in the control compared to glaucomatous group,
721LITY OF SD OCT IN GLAUCOMA
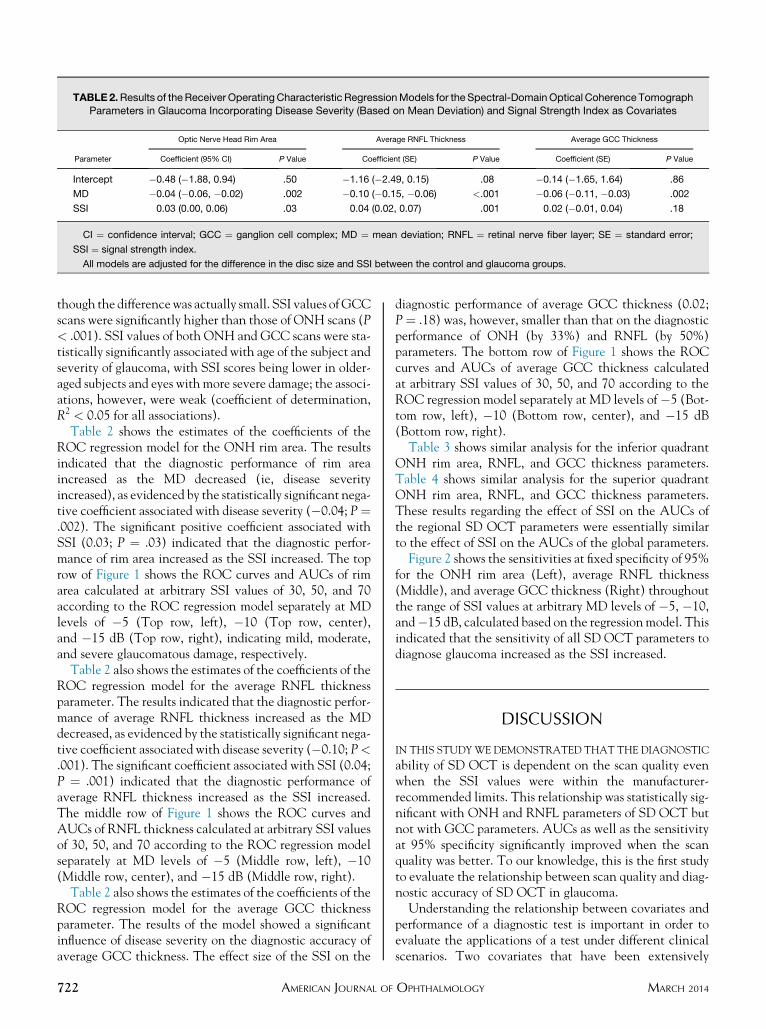
TABLE2.Results of theReceiverOperatingCharacteristic RegressionModels for the Spectral-DomainOptical Coherence TomographParameters in Glaucoma Incorporating Disease Severity (Based on Mean Deviation) and Signal Strength Index as Covariates
Parameter
Optic Nerve Head Rim Area Average RNFL Thickness Average GCC Thickness
Coefficient (95% CI) P Value Coefficient (SE) P Value Coefficient (SE) P Value
Intercept �0.48 (�1.88, 0.94) .50 �1.16 (�2.49, 0.15) .08 �0.14 (�1.65, 1.64) .86
MD �0.04 (�0.06, �0.02) .002 �0.10 (�0.15, �0.06) <.001 �0.06 (�0.11, �0.03) .002
SSI 0.03 (0.00, 0.06) .03 0.04 (0.02, 0.07) .001 0.02 (�0.01, 0.04) .18
CI ¼ confidence interval; GCC ¼ ganglion cell complex; MD ¼ mean deviation; RNFL ¼ retinal nerve fiber layer; SE ¼ standard error;
SSI ¼ signal strength index.
All models are adjusted for the difference in the disc size and SSI between the control and glaucoma groups.
though the differencewas actually small. SSI values ofGCCscans were significantly higher than those of ONH scans (P< .001). SSI values of both ONH and GCC scans were sta-tistically significantly associated with age of the subject andseverity of glaucoma, with SSI scores being lower in older-aged subjects and eyes with more severe damage; the associ-ations, however, were weak (coefficient of determination,R2 < 0.05 for all associations).
Table 2 shows the estimates of the coefficients of theROC regression model for the ONH rim area. The resultsindicated that the diagnostic performance of rim areaincreased as the MD decreased (ie, disease severityincreased), as evidenced by the statistically significant nega-tive coefficient associated with disease severity (�0.04; P¼.002). The significant positive coefficient associated withSSI (0.03; P ¼ .03) indicated that the diagnostic perfor-mance of rim area increased as the SSI increased. The toprow of Figure 1 shows the ROC curves and AUCs of rimarea calculated at arbitrary SSI values of 30, 50, and 70according to the ROC regression model separately at MDlevels of �5 (Top row, left), �10 (Top row, center),and �15 dB (Top row, right), indicating mild, moderate,and severe glaucomatous damage, respectively.
Table 2 also shows the estimates of the coefficients of theROC regression model for the average RNFL thicknessparameter. The results indicated that the diagnostic perfor-mance of average RNFL thickness increased as the MDdecreased, as evidenced by the statistically significant nega-tive coefficient associated with disease severity (�0.10; P<.001). The significant coefficient associated with SSI (0.04;P ¼ .001) indicated that the diagnostic performance ofaverage RNFL thickness increased as the SSI increased.The middle row of Figure 1 shows the ROC curves andAUCs of RNFL thickness calculated at arbitrary SSI valuesof 30, 50, and 70 according to the ROC regression modelseparately at MD levels of �5 (Middle row, left), �10(Middle row, center), and �15 dB (Middle row, right).
Table 2 also shows the estimates of the coefficients of theROC regression model for the average GCC thicknessparameter. The results of the model showed a significantinfluence of disease severity on the diagnostic accuracy ofaverage GCC thickness. The effect size of the SSI on the
722 AMERICAN JOURNAL OF
diagnostic performance of average GCC thickness (0.02;P¼ .18) was, however, smaller than that on the diagnosticperformance of ONH (by 33%) and RNFL (by 50%)parameters. The bottom row of Figure 1 shows the ROCcurves and AUCs of average GCC thickness calculatedat arbitrary SSI values of 30, 50, and 70 according to theROC regression model separately at MD levels of�5 (Bot-tom row, left), �10 (Bottom row, center), and �15 dB(Bottom row, right).Table 3 shows similar analysis for the inferior quadrant
ONH rim area, RNFL, and GCC thickness parameters.Table 4 shows similar analysis for the superior quadrantONH rim area, RNFL, and GCC thickness parameters.These results regarding the effect of SSI on the AUCs ofthe regional SD OCT parameters were essentially similarto the effect of SSI on the AUCs of the global parameters.Figure 2 shows the sensitivities at fixed specificity of 95%
for the ONH rim area (Left), average RNFL thickness(Middle), and average GCC thickness (Right) throughoutthe range of SSI values at arbitrary MD levels of �5, �10,and�15 dB, calculated based on the regressionmodel. Thisindicated that the sensitivity of all SD OCT parameters todiagnose glaucoma increased as the SSI increased.
DISCUSSION
IN THIS STUDYWE DEMONSTRATED THAT THE DIAGNOSTIC
ability of SD OCT is dependent on the scan quality evenwhen the SSI values were within the manufacturer-recommended limits. This relationship was statistically sig-nificant with ONH and RNFL parameters of SD OCT butnot with GCC parameters. AUCs as well as the sensitivityat 95% specificity significantly improved when the scanquality was better. To our knowledge, this is the first studyto evaluate the relationship between scan quality and diag-nostic accuracy of SD OCT in glaucoma.Understanding the relationship between covariates and
performance of a diagnostic test is important in order toevaluate the applications of a test under different clinicalscenarios. Two covariates that have been extensively
MARCH 2014OPHTHALMOLOGY
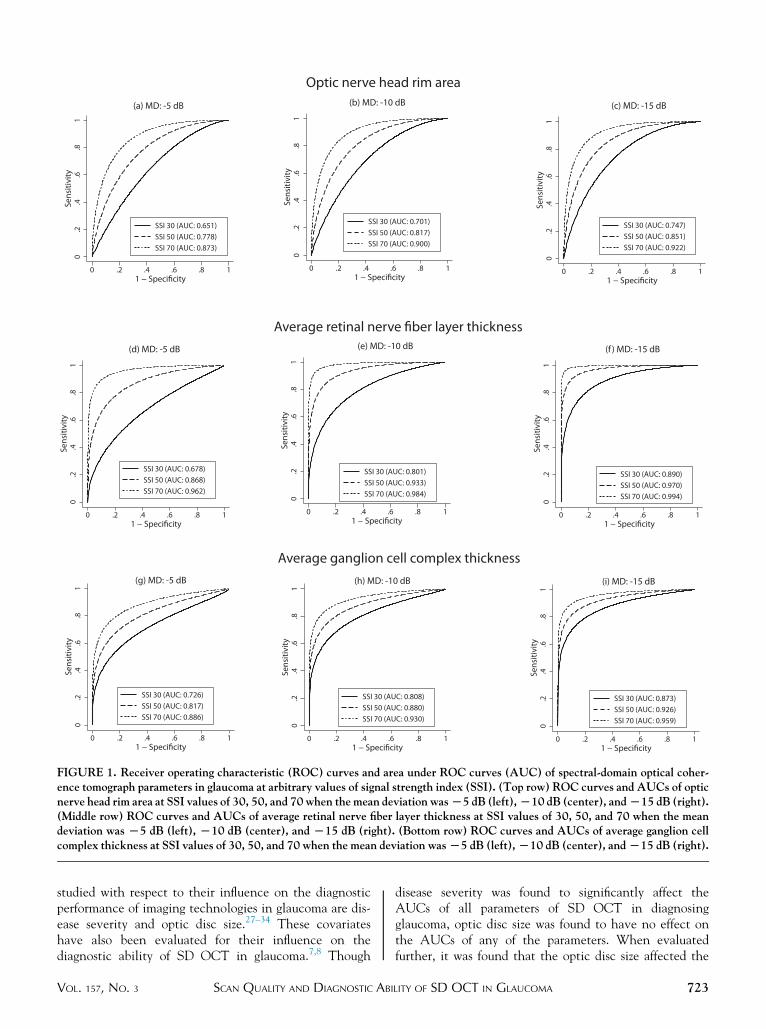
FIGURE 1. Receiver operating characteristic (ROC) curves and area under ROC curves (AUC) of spectral-domain optical coher-ence tomograph parameters in glaucoma at arbitrary values of signal strength index (SSI). (Top row) ROC curves and AUCs of opticnerve head rim area at SSI values of 30, 50, and 70 when the mean deviation wasL5 dB (left),L10 dB (center), andL15 dB (right).(Middle row) ROC curves and AUCs of average retinal nerve fiber layer thickness at SSI values of 30, 50, and 70 when the meandeviation was L5 dB (left), L10 dB (center), and L15 dB (right). (Bottom row) ROC curves and AUCs of average ganglion cellcomplex thickness at SSI values of 30, 50, and 70 when the mean deviation wasL5 dB (left),L10 dB (center), andL15 dB (right).
studied with respect to their influence on the diagnosticperformance of imaging technologies in glaucoma are dis-ease severity and optic disc size.27–34 These covariateshave also been evaluated for their influence on thediagnostic ability of SD OCT in glaucoma.7,8 Though
VOL. 157, NO. 3 SCAN QUALITY AND DIAGNOSTIC ABI
disease severity was found to significantly affect theAUCs of all parameters of SD OCT in diagnosingglaucoma, optic disc size was found to have no effect onthe AUCs of any of the parameters. When evaluatedfurther, it was found that the optic disc size affected the
723LITY OF SD OCT IN GLAUCOMA
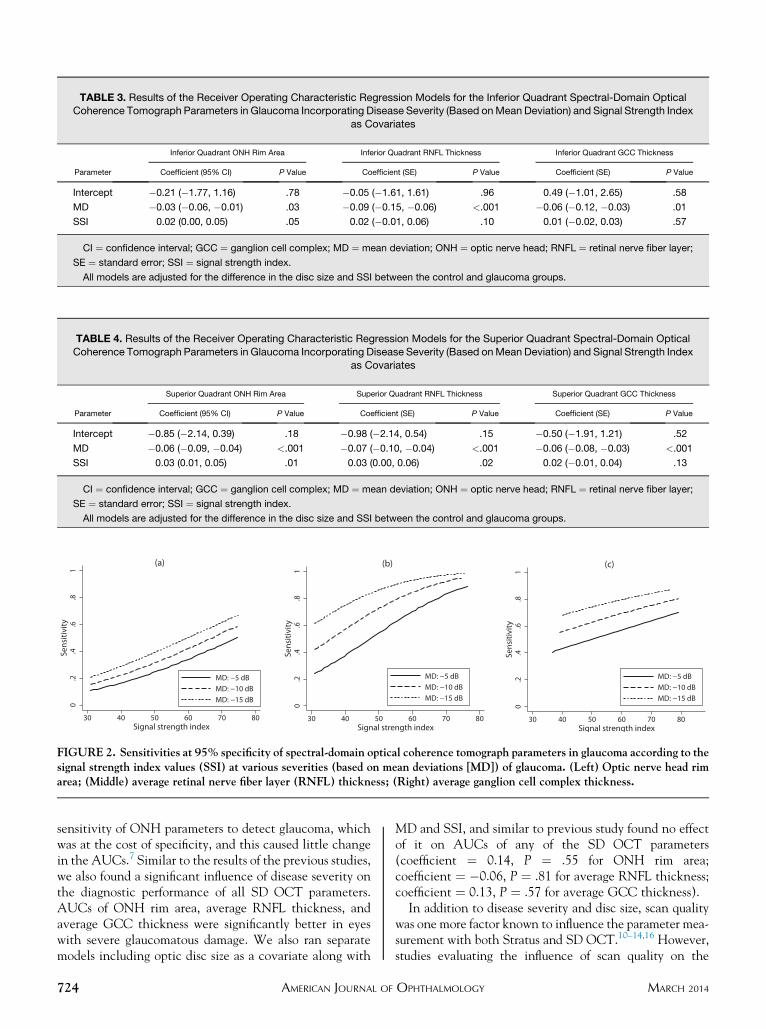
TABLE 3. Results of the Receiver Operating Characteristic Regression Models for the Inferior Quadrant Spectral-Domain OpticalCoherence Tomograph Parameters in Glaucoma Incorporating Disease Severity (Based onMean Deviation) and Signal Strength Index
as Covariates
Parameter
Inferior Quadrant ONH Rim Area Inferior Quadrant RNFL Thickness Inferior Quadrant GCC Thickness
Coefficient (95% CI) P Value Coefficient (SE) P Value Coefficient (SE) P Value
Intercept �0.21 (�1.77, 1.16) .78 �0.05 (�1.61, 1.61) .96 0.49 (�1.01, 2.65) .58
MD �0.03 (�0.06, �0.01) .03 �0.09 (�0.15, �0.06) <.001 �0.06 (�0.12, �0.03) .01
SSI 0.02 (0.00, 0.05) .05 0.02 (�0.01, 0.06) .10 0.01 (�0.02, 0.03) .57
CI ¼ confidence interval; GCC ¼ ganglion cell complex; MD ¼ mean deviation; ONH ¼ optic nerve head; RNFL ¼ retinal nerve fiber layer;
SE ¼ standard error; SSI ¼ signal strength index.
All models are adjusted for the difference in the disc size and SSI between the control and glaucoma groups.
TABLE 4. Results of the Receiver Operating Characteristic Regression Models for the Superior Quadrant Spectral-Domain Optical
Coherence Tomograph Parameters in Glaucoma Incorporating Disease Severity (Based onMean Deviation) and Signal Strength Index
as Covariates
Parameter
Superior Quadrant ONH Rim Area Superior Quadrant RNFL Thickness Superior Quadrant GCC Thickness
Coefficient (95% CI) P Value Coefficient (SE) P Value Coefficient (SE) P Value
Intercept �0.85 (�2.14, 0.39) .18 �0.98 (�2.14, 0.54) .15 �0.50 (�1.91, 1.21) .52
MD �0.06 (�0.09, �0.04) <.001 �0.07 (�0.10, �0.04) <.001 �0.06 (�0.08, �0.03) <.001
SSI 0.03 (0.01, 0.05) .01 0.03 (0.00, 0.06) .02 0.02 (�0.01, 0.04) .13
CI ¼ confidence interval; GCC ¼ ganglion cell complex; MD ¼ mean deviation; ONH ¼ optic nerve head; RNFL ¼ retinal nerve fiber layer;
SE ¼ standard error; SSI ¼ signal strength index.
All models are adjusted for the difference in the disc size and SSI between the control and glaucoma groups.
FIGURE 2. Sensitivities at 95% specificity of spectral-domain optical coherence tomograph parameters in glaucoma according to thesignal strength index values (SSI) at various severities (based on mean deviations [MD]) of glaucoma. (Left) Optic nerve head rimarea; (Middle) average retinal nerve fiber layer (RNFL) thickness; (Right) average ganglion cell complex thickness.
sensitivity of ONH parameters to detect glaucoma, whichwas at the cost of specificity, and this caused little changein the AUCs.7 Similar to the results of the previous studies,we also found a significant influence of disease severity onthe diagnostic performance of all SD OCT parameters.AUCs of ONH rim area, average RNFL thickness, andaverage GCC thickness were significantly better in eyeswith severe glaucomatous damage. We also ran separatemodels including optic disc size as a covariate along with
724 AMERICAN JOURNAL OF
MD and SSI, and similar to previous study found no effectof it on AUCs of any of the SD OCT parameters(coefficient ¼ 0.14, P ¼ .55 for ONH rim area;coefficient ¼ �0.06, P ¼ .81 for average RNFL thickness;coefficient ¼ 0.13, P ¼ .57 for average GCC thickness).In addition to disease severity and disc size, scan quality
was one more factor known to influence the parameter mea-surement with both Stratus and SD OCT.10–14,16 However,studies evaluating the influence of scan quality on the
MARCH 2014OPHTHALMOLOGY
diagnostic ability of OCT are sparse. Sung and associatesevaluated the influence of scan quality on the diagnosticability of imaging technologies in glaucoma and found thatthe scan quality affected the performance of Stratus OCTbut not that of scanning laser polarimetry or confocalscanning laser ophthalmoscopy.15 They found that the sensi-tivity of RNFL parameters of OCT to detect glaucomadecreased in scans with higher signal strengths while thespecificity remained the same. This is contradictory to the re-sults of our study, where we found that the sensitivities atfixed specificity of 95% in addition to AUCs got betterwith better SSI values. The possible reasons for the contra-dictory results between our study and the study by Sungand associates may be manifold. One is because of thedifferent OCT devices used in the 2 studies. We used anSDOCT device, whereas Sung and associates had used Stra-tus OCT. The measure of scan quality in the 2 OCT devicesis different and is based on different proprietary softwares.Scan quality on RTVue SD OCT is based on SSI values,which range from 0-100, while the same on Stratus OCT isbased on signal strength, which ranges from 0-10. We hadincluded all images with an SSI value of better than 30 inour study, whereas Sung and associates had included allimages with signal strength of better than 5. Second isbecause of the analytical model used. The model used inour study was based on ROC regression, whereas Sung andassociates had used a logistic regression model and had eval-uated the probability of glaucoma based on the signalstrength.15Webelieve that theROC regressionmodel is bet-ter than a logistic regression model in this situation becausethe ROC regression model directly evaluates the effect ofcovariates on diagnostic ability parameters like AUCs andsensitivity.Thismodelwould also evaluate the effect of cova-riates on the entire range of the covariate valueswithout hav-ing to categorize them. Categorization of a covariate wouldlead to a loss of power to detect significant relationships.35
Theother advantage of theROCregressionmodel is the abil-ity to account for multiple covariates simultaneously. Whileevaluating for the influence of scan quality on ROC curves,we therefore also could simultaneously account for theconfounding effect of disease severity. This, however, wasnot done by Sung and associates and could possibly beanother reason for the difference in the results. Our resulttherefore shows that scan quality had an independent influ-ence (unrelated to the effect of disease severity) on the diag-nostic ability of SD OCT parameters. We also included aninteraction term between MD and SSI to evaluate if theeffect of SSI on diagnostic ability was different at differentdisease severities of glaucoma. The coefficient associatedwith the interaction term, however, was not statisticallysignificant for any of the SD OCT parameters.
Examining the coefficients associated with SSI valuesrevealed that it appeared that the influence of SSI valuewas greater on the diagnostic performance of RNFLcompared to ONH and GCC parameters. Though thisappears to be an interesting finding, the reason for this
VOL. 157, NO. 3 SCAN QUALITY AND DIAGNOSTIC ABI
finding is unclear. Itmay represent higher likelihood of inac-curate segmentation of RNFL in scans with low SSI values.It is important to note that our definition of glaucoma
required the presence of both a glaucomatous structuralabnormality (detected on optic disc photographs bymasked experts) and a glaucomatous VF defect on SAP.Therefore we had to exclude eyes where the structuraland functional test assessments did not correlate witheach other. These subjects in whom the disc and the VFclassification did not agree with each other are indeed aclinically important group, as this is the group in whichthe OCT results are useful to rule in or rule out the diag-nosis of glaucoma. However, a longitudinal study with asufficient follow-up duration is necessary to conclusively di-agnose glaucoma in this group. Exclusion of these subjectsis unlikely to have affected the results of our study signifi-cantly. The control group in our study was selected fromthe group of subjects referred as glaucoma suspects basedon their optic disc appearance by general ophthalmologists.Therefore, a possible limitation of our study is the inclusionof a few preperimetric glaucoma cases into the controlgroup. This is, however, less likely as 2 glaucoma expertsindependently identified the optic discs as nonglaucoma-tous. There was no ambiguity in their classification bythe glaucoma experts. Therefore, in the true sense, opticdiscs included in the control group, though they werereferred as suspects for glaucoma, were not true suspectsbut were discs with large physiologic cups that caused adiagnostic uncertainty among general ophthalmologists.We excluded such true disc suspects (optic discs thatwere unable to be classified into the glaucoma or nonglau-coma group, by 1 or both of the experts) from the analysis.Such true disc suspects would require a longitudinal studyto look for progressive structural changes and to definitivelyclassify them into glaucoma or nonglaucoma groups.36 Webelieve that including a control group that is likely to causesome amount of diagnostic uncertainty is more meaningfuland better mimics the real-life clinical situation than acontrol group with no suspicious findings of the disease,as was used in the previous studies. We have earlier re-ported the effect of the control group on the diagnosticability of SD OCT in glaucoma.18 We also ran the entireanalysis using a control group consisting of eyes with no sus-picious findings for glaucoma. The characteristics of thiscontrol group have been detailed earlier.16,18 The resultsof the ROC regression analysis remained similar, withSSI significantly affecting the AUCs of ONH rim area(coefficient: 0.05, 95% CI: 0.01-0.14) and average RNFLthickness (0.03, 0.01-0.06) but not average GCCthickness (0.02, �0.02-0.05).It is also important to note that the results of our study
with RTVue SD OCT may not be directly applicableto SD OCT devices from other manufacturers becausethe parameters representing scan quality are based on pro-prietary scales that may not be comparable betweendifferent SD OCT devices. For example, the SSI of RTVue
725LITY OF SD OCT IN GLAUCOMA
ranges from 0-100, while that of Cirrus HD OCT (CarlZeiss Meditec, Inc, Dublin, California, USA), which isan SD OCT device from a different manufacturer, rangesfrom 0-10. It is also difficult from our study to recommenda cutoff for the SSI value, above which the diagnostic per-formance of SD OCT is not affected by scan quality. Ourstudy only demonstrates the importance of acquiring
726 AMERICAN JOURNAL OF
good-quality scans and that the manufacturers’ guidelinesmay be inadequate to define a good-quality scan.In conclusion, diagnostic performance of SD OCT
in glaucoma was significantly influenced by the scan qualityeven when the SSI values were within the manufacturer-recommended limits. These results should be consideredwhile interpreting SD OCT scans for glaucoma.
ALL AUTHORSHAVE COMPLETED AND SUBMITTED THE ICMJE FORM FOR DISCLOSUREOF POTENTIAL CONFLICTS OF INTEREST.Drs Rao and Garudadri are paid advisory board members for Allergan. Dr Garudadri is also a paid advisory board member for Alcon and Merck and hasreceived research grant from Optovue. Funding was provided by Hyderabad Eye Research Foundation, Hyderabad, India. Contributions of authors: designand conduct of study (H.L.R., U.K.A., R.K.Y., S.S., N.S.C., C.S.G.); collection, management, analysis, and interpretation of the data (H.L.R., U.K.A.,R.K.Y., C.S.G.); preparation, review, or approval of the manuscript (H.L.R., U.K.A., R.K.Y., S.S., N.S.C., C.S.G.).
REFERENCES
1. Nassif N, Cense B, Park B, et al. In vivo high-resolution video-rate spectral-domain optical coherence tomography of thehuman retina and optic nerve.OptExpress 2004;12(3):367–376.
2. WojtkowskiM, Srinivasan V, Ko T, Fujimoto J, Kowalczyk A,Duker J. Ultrahigh-resolution, high-speed, Fourier domainoptical coherence tomography and methods for dispersioncompensation. Opt Express 2004;12(11):2404–2422.
3. Leung CK, Cheung CY, Weinreb RN, et al. Retinal nervefiber layer imaging with spectral-domain optical coherencetomography: a variability and diagnostic performance study.Ophthalmology 2009;116(7):1257–1263.
4. Knight OJ, Chang RT, Feuer WJ, Budenz DL. Comparison ofretinal nerve fiber layer measurements using time domain andspectral domain optical coherent tomography. Ophthalmology2009;116(7):1271–1277.
5. Sung KR, Kim DY, Park SB, Kook MS. Comparison of retinalnerve fiber layer thickness measured by Cirrus HD and Stratusoptical coherence tomography. Ophthalmology 2009;116(7):1264–1270.
6. Rao HL, Zangwill LM, Weinreb RN, Sample PA,Alencar LM, Medeiros FA. Comparison of different spectraldomain optical coherence tomography scanning areas forglaucoma diagnosis. Ophthalmology 2010;117(9):1692–1699.
7. Rao HL, Leite MT, Weinreb RN, et al. Effect of diseaseseverity and optic disc size on diagnostic accuracy of RTVuespectral domain optical coherence tomograph in glaucoma.Invest Ophthalmol Vis Sci 2011;52(3):1290–1296.
8. Leite MT, Zangwill LM, Weinreb RN, et al. Effect of diseaseseverity on the performance of Cirrus spectral-domain OCTfor glaucoma diagnosis. Invest Ophthalmol Vis Sci 2010;51(8):4104–4109.
9. Stein DM, Wollstein G, Ishikawa H, Hertzmark E,Noecker RJ, Schuman JS. Effect of corneal drying on opticalcoherence tomography.Ophthalmology 2006;113(6):985–991.
10. Wu Z, VazeenM, Varma R, et al. Factors associated with vari-ability in retinal nerve fiber layer thickness measurementsobtained by optical coherence tomography. Ophthalmology2007;114(8):1505–1512.
11. Cheung CY, Leung CK, Lin D, Pang CP, Lam DS. Relation-ship between retinal nerve fiber layer measurement and signalstrength in optical coherence tomography. Ophthalmology2008;115(8):1347–1351.
12. Wu Z, Huang J, Dustin L, Sadda SR. Signal strength is animportant determinant of accuracy of nerve fiber layer thick-ness measurement by optical coherence tomography. J Glau-coma 2009;18(3):213–216.
13. Samarawickrama C, Pai A, Huynh SC, Burlutsky G,Wong TY, Mitchell P. Influence of OCT signal strengthon macular, optic nerve head, and retinal nerve fiber layerparameters. Invest Ophthalmol Vis Sci 2010;51(9):4471–4475.
14. Kim JH, Kim NR, Kim H, Lee ES, Seong GJ, Kim CY. Effectof signal strength on reproducibility of circumpapillary retinalnerve fiber layer thickness measurement and its classificationby spectral-domain optical coherence tomography. Jpn JOphthalmol 2011;55(3):220–227.
15. Sung KR,Wollstein G, Schuman JS, et al. Scan quality effecton glaucoma discrimination by glaucoma imaging devices. BrJ Ophthalmol 2009;93(12):1580–1584.
16. Rao HL, Kumar AU, Babu JG, Kumar A, Senthil S,Garudadri CS. Predictors of normal optic nerve head, retinalnerve fiber layer, and macular parameters measured by spec-tral domain optical coherence tomography. Invest Ophthalmol
Vis Sci 2011;52(2):1103–1110.17. Anderson DR, Patella VM. Automated Static Perimetry. 2nd
ed. St. Louis: Mosby; 1999:152.18. Rao HL, Kumbar T, Addepalli UK, et al. Effect of spectrum
bias on the diagnostic accuracy of spectral-domain opticalcoherence tomography in glaucoma. Invest Ophthalmol Vis
Sci 2012;53(2):1058–1065.19. Tan O, Chopra V, Lu AT, et al. Detection of macular gan-
glion cell loss in glaucoma by Fourier-domain opticalcoherence tomography. Ophthalmology 2009;116(12):2305–2314.
20. Medeiros FA, Sample PA, Zangwill LM, Liebmann JM,Girkin CA, Weinreb RN. A statistical approach to the eval-uation of covariate effects on the receiver operating charac-teristic curves of diagnostic tests in glaucoma. InvestOphthalmol Vis Sci 2006;47(6):2520–2527.
21. Pepe MS. Three approaches to regression analysis of receiveroperating characteristic curves for continuous test results.Biometrics 1998;54(1):124–135.
22. Pepe MS. An interpretation for the ROC curve and inferenceusing GLM procedures. Biometrics 2000;56(2):352–359.
23. Alonzo TA, Pepe MS. Distribution-free ROC analysis usingbinary regression techniques. Biostatistics 2002;3(3):421–432.
MARCH 2014OPHTHALMOLOGY
24. Janes H, Pepe MS. Adjusting for covariates in studies of diag-nostic, screening, or prognostic markers: an old concept in anew setting. Am J Epidemiol 2008;168(1):89–97.
25. Zhou XH, Obuchowski NA, McClish DK. Analysis of corre-lated ROC data. In: Zhou XH, Obuchowski NA,McClish DK, eds. Statistical Methods in Diagnostic Medi-cine. New York: John Wiley & Sons, Inc; 2002:274–306.
26. Glynn RJ, Rosner B. Accounting for the correlation betweenfellow eyes in regression analysis. Arch Ophthalmol 1992;110(3):381–387.
27. Iester M, Mikelberg FS, Drance SM. The effect of optic discsize on diagnostic precision with the Heidelberg retina tomo-graph. Ophthalmology 1997;104(3):545–548.
28. Bathija R, Zangwill L, Berry CC, Sample PA, Weinreb RN.Detectionof early glaucomatous structural damagewith confocalscanning laser tomography. J Glaucoma 1998;7(2):121–127.
29. Mardin CY, Horn FK. Influence of optic disc size on the sensi-tivity of the Heidelberg Retina Tomograph.Graefes Arch ClinExp Ophthalmol 1998;236(9):641–645.
30. Wollstein G, Garway-Heath DF, Hitchings RA. Identifica-tion of early glaucoma cases with the scanning laser ophthal-moscope. Ophthalmology 1998;105(8):1557–1563.
31. Ford BA, Artes PH, McCormick TA, Nicolela MT,LeBlanc RP, Chauhan BC. Comparison of data analysis tools
VOL. 157, NO. 3 SCAN QUALITY AND DIAGNOSTIC ABI
for detection of glaucoma with the Heidelberg Retina Tomo-graph. Ophthalmology 2003;110(6):1145–1150.
32. Medeiros FA, Zangwill LM, Bowd C, Sample PA,Weinreb RN. Influence of disease severity and optic discsize on the diagnostic performance of imaging instrumentsin glaucoma. Invest Ophthalmol Vis Sci 2006;47(3):1008–1015.
33. Zangwill LM, Jain S, Racette L, et al. The effect of discsize and severity of disease on the diagnostic accuracyof the Heidelberg Retina Tomograph Glaucoma Probabil-ity Score. Invest Ophthalmol Vis Sci 2007;48(6):2653–2660.
34. Hoesl LM, Mardin CY, Horn FK, Juenemann AG,Laemmer R. Influence of glaucomatous damage and opticdisc size on glaucoma detection by scanning laser tomogra-phy. J Glaucoma 2009;18(5):385–389.
35. Streiner DL. Breaking up is hard to do: the heartbreak ofdichotomizing continuous data. Can J Psychiatry 2002;47(3):262–266.
36. Medeiros FA, Ng D, Zangwill LM, Sample PA, Bowd C,Weinreb RN. The effects of study design and spectrum biason the evaluation of diagnostic accuracy of confocal scanninglaser ophthalmoscopy in glaucoma. Invest Ophthalmol Vis Sci
2007;48(1):214–222.
727LITY OF SD OCT IN GLAUCOMA

Biosketch
Harsha L. Rao, MD, completed his residency from Bangalore Medical College, Bengaluru, India in 2005 followed by
fellowships in Glaucoma from L V Prasad Eye Institute, Hyderabad, India and University of California, San Diego. He
is currently a Glaucoma Consultant at the L V Prasad Eye Institute, India. His research interests include diagnostics
and decision making in glaucoma.
727.e1 MARCH 2014AMERICAN JOURNAL OF OPHTHALMOLOGY
Copyright © 2022 FDOKUMEN