High-temperature plastic deformation of Er 2O 3-doped ZrO 2 single crystals
Effect of oxygen partial pressure on propertiesof asymmetric bipolar pulse dc magnetronsputtered TiO2 thin filmsS. MAIDUL HAQUE,1 PANKAJ R. SAGDEO,2 ARCHNA SAGDEO,3 S. N. JHA,4
D. BHATTACHARYYA,4,* AND N. K. SAHOO4
1Atomic and Molecular Physics Division, Bhabha Atomic Research Center, VIZAG Center, Visakhapatnam 530012, India2Discipline of Physics and Center for Material Science and Engineering, Indian Institute of Technology, Indore 452017, India3Indus Synchrotron Utilization Division, Raja Raman Center for Advanced Technology, Indore 452013, India4Atomic and Molecular Physics Division, Bhabha Atomic Research Center, Mumbai 400094, India*Corresponding author:[email protected]
Received 29 January 2015; revised 28 March 2015; accepted 31 March 2015; posted 1 April 2015 (Doc. ID 232061); published 21 April 2015
A set of titanium dioxide thin films have been deposited on fused silica substrates by the novel asymmetric bipolarpulsed dc reactive sputtering technique using different oxygen partial pressures in the sputtering ambient in therange of 0%–21%. For investigating long-range structural properties of the samples, grazing incidence x-ray dif-fraction (GIXRD) measurements and for probing local structure surrounding Ti sites, extended x-ray absorptionfine structure (EXAFS) measurements have been carried out. Optical properties of the films have been investigatedby transmission spectrophotometry in UV–visible–near IR range and it has been observed that as oxygen partialpressure in the sputtering ambient is increased, refractive index of the films varies in a nonlinear fashion.Microscopically, it has been found that this nonlinear variation can be explained by the local structure toolEXAFS, while GIXRD which works on average long-range order fails to explain this. Such a variation of opticalproperties with increase in oxygen partial pressure during deposition of the films is attributed to the competitionbetween the two processes, viz., improvement in the stoichiometry of the films and reduction in the mobility ofthe adatoms on the surface of the growing films. © 2015 Optical Society of America
OCIS codes: (310.6860) Thin films, optical properties; (160.4760) Optical properties; (310.6628) Subwavelength structures,
nanostructures.
http://dx.doi.org/10.1364/AO.54.003817
1. INTRODUCTION
Titanium dioxide being a large band gap and high indexmaterial has been of wide research interest for its applicationin multilayer optical interference coatings [1,2]. Excellentchemical stability of TiO2 makes it an important choice forhigh-index material in multilayer interference coatings [3]. Ithas also been used in various semiconductor devices like insensors [4], photocatalysts [5] and transistors [6,7]. Several dep-osition techniques have been adopted to deposit TiO2 films ofthe desired optical and electronic properties including sput-tering [8], solgel [9], atomic layer deposition (ALD) [10],plasma enhanced chemical vapor deposition [11], and so on.Even though electron beam (EB) evaporation technique [12]is most widely employed for preparation of TiO2 thin films,the method generally produces films with significant amountof voids. This drawback of EB evaporation technique encour-ages one to deposit dense TiO2 films using ion-assisteddeposition (IAD); IAD though has limitation in producing
large-area multilayer thin films due to its inherent limitationpertaining to unavailability and high cost of large-area ionsources [13]. Magnetron sputtering, on the other hand, hasseveral advantages in achieving improved morphology, micro-structure, and interfaces [14–16] of oxide thin films. Singh andKaur, for example, have used dc magnetron sputtering [17] toproduce high-quality TiO2 thin films, having refractive index(RI) in the range of 2.24–2.5. In case of magnetron sputtering,due to the presence of a suitable magnetic field near the target,electrons execute helical motions leading to enhanced ioniza-tion of the plasma. This in turn enhances the sputteringefficiency and so generally, magnetron sputtering yields adeposition rate which is 1 order of magnitude higher than thatobtained by conventional sputtering technique. Also with a bal-anced magnetron design, secondary electrons can be trappednear the target so that they do not strike the substrate and thusdo not contribute to substrate heating [18]. Compared to theRF magnetron sputtering technique which is generally adopted
Research Article Vol. 54, No. 13 / May 1 2015 / Applied Optics 3817
1559-128X/15/133817-09$15/0$15.00 © 2015 Optical Society of America
for sputtering of insulating oxide materials, the asymmetricbipolar pulsed dc (ABPDC) magnetron sputtering techniquemakes it possible to overcome the problem of accumulationof space charge through a relatively simpler way that doesnot need any critical impedance matching of the load andthe power supply and helps in producing high-quality, low-defect oxide dielectric films required for precise coatingprocesses [15–18].
In a typical magnetron sputtering deposition of oxide thinfilm, the percentage of oxygen present with respect to argon,i.e., oxygen partial pressure in the sputtering ambient acts as animportant controlling parameter because it controls the stoichi-ometry of the deposited oxide samples and also the depositionrate since sputtering efficiency of oxygen is less compared toargon. Also the density of gas molecules in the sputteringambient determines the energy of the sputtered species [19]reaching the substrate surface and thus in turn determinesmorphology and crystallinity of the films.
There are plenty of reports on structural investigation ofTiO2 thin films prepared by various methods, which revealrealization of the films in three major crystalline phases namely,rutile, anatase, and brookite, even though brookite form ofTiO2 is comparatively less studied than the more commonrutile and anatase polymorphs [20]. Addamo et al. [21] demon-strated an easy way to prepare thin films of all three TiO2
phases (anatase, rutile, and brookite) starting from aqueousdispersions of TiO2 obtained by hydrolysis of TiCl4. Lin et al.[22] identified anatase-type TiO2 nanoparticles prepared bysolgel synthetic route. An interesting study by Ohara et al.[23] showed that TiO2 films prepared by sol suspension on sil-icon substrate shows pure anatase phase whereas the one pre-pared on soda glass substrate is the mixture of anatase andbrookite phases due to the Na diffusion from the substrate tothe film. Reactive RF sputter-deposited undoped and Fe-dopedTiO2 thin films [24] showed that undopedTiO2 films crystallizein a mixed rutile/anatase phase whereas Fe-doped films exhibitthe rutile phase only. Moret et al. [25] found that pulse laserdeposited TiO2 films on silicon and other substrates are brook-ite. In many cases formation of nano-crystalline and amorphousTiO2 thin films have also been reported [26].
In the present work, a set of TiO2 (titanium dioxide) thinfilms has been deposited by ABPDC sputtering technique us-ing different oxygen partial pressures in the sputtering ambient.The samples have been characterized by grazing incidencex-ray diffraction (GIXRD) technique to probe the long-rangeorder in the films, while synchrotron-based extended x-rayabsorption fine structure (EXAFS) measurements have beenemployed to investigate the local structure surrounding Tiatoms in the films and structural information obtained bythe previously mentioned two techniques have been compared.Further, optical transmission spectrophotometry has been usedto investigate the optical properties of the films which havebeen correlated finally with the results of previously mentionedstructural investigations.
2. EXPERIMENT
TiO2 thin films have been deposited on fused silica substratesby ABPDC magnetron sputtering technique. Prior to each
deposition, a base pressure of 2 × 10⁻⁶ mbar was achieved inthe deposition chamber and TiO2 target having 3 in.(7.62 cm) diameter and 5.5 mm thickness was pre-sputteredfor ∼400 s to remove surface contamination, if any. The rateof sputtering and thickness of the films were monitored using amultichannel quartz crystal monitor (Maxtech Inc., ModelMDC-360C). For this work, TiO2 films were sputter depos-ited at six different oxygen flow rates, namely 0, 1, 3, 7, 9, and13 sccm vis-a-vis a constant argon flow rate of 50 sccm corre-sponding to oxygen partial pressure of 0%, 2%, 5.6%, 12%,15%, and 21%, respectively. The total pressure in the chamberwas maintained at a fixed value by throttling the gate valvebetween the turbo pump and the deposition chamber. The de-tailed pulse shape of the power supply used during depositionhas been given elsewhere [18]. For this work, an optimizedpulse frequency of 127 kHz and optimized pulse width of816 ns and a power level of 230 W were used to depositthe films. All the samples were deposited for 1 h except the0 sccm sample, which was deposited for 12.5 min since thedeposition rate for this film was significantly higher than thatof the others. The substrates were kept at ambient during dep-osition; however, it has however been observed that substratetemperature reaches up to 60°C–80°C during the process ofdeposition.
The grazing incidence x-ray diffraction experiments wereperformed by detector scan in the range of 2θ from 20° to60° in step of 0.03° using a Bruker D-8 discover diffractometermounted on a sealed tube x-ray generator equipped with a cop-per target (kα) operating at 3 kW output power. Rocking curvemeasurements have been done prior to each measurement foraligning the sample. The RI and direct band gap of the filmswere estimated by optical transmission measurements using aJasco V-630 UV–visible-near IR (NIR) spectrophotometer inthe range of 190–1100 nm. EXAFS measurements of the sam-ples have been carried out at the energy scanning EXAFS beamline (BL-9) in fluorescence mode at the INDUS-2 synchrotronsource (2.5 GeV, 125 mA) at Raja Ramanna Center forAdvanced Technology (RRCAT), Indore, India [27,28].
3. RESULTS AND DISCUSSION
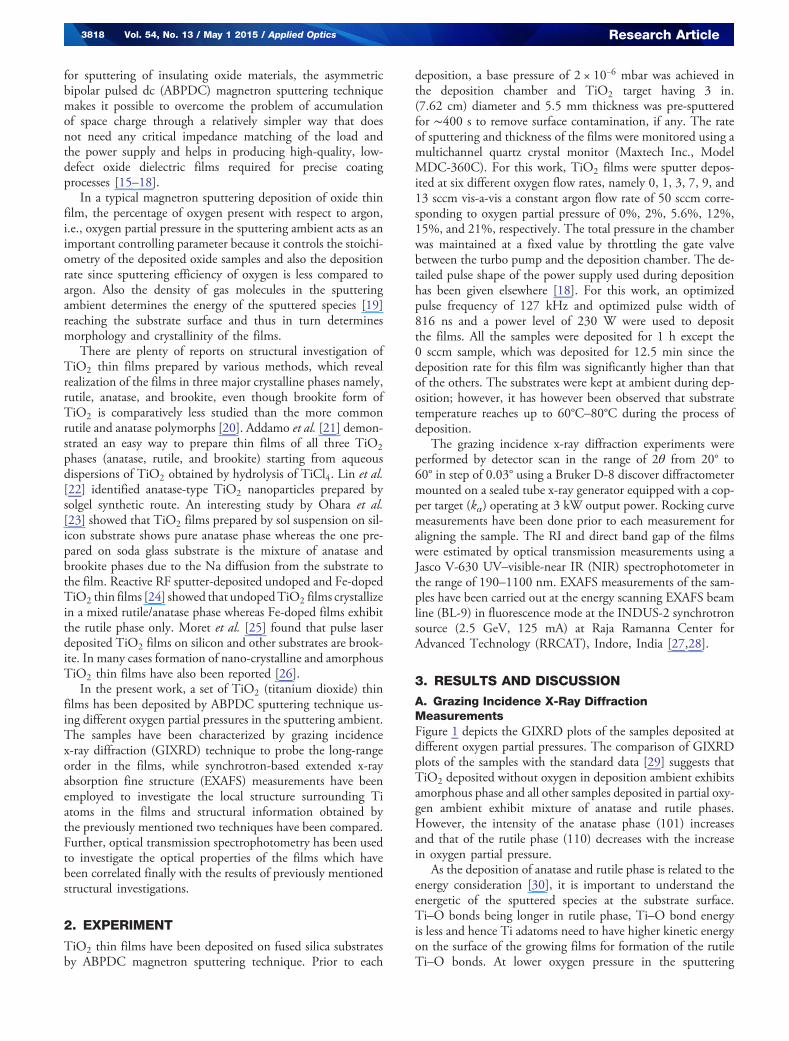
A. Grazing Incidence X-Ray DiffractionMeasurementsFigure 1 depicts the GIXRD plots of the samples deposited atdifferent oxygen partial pressures. The comparison of GIXRDplots of the samples with the standard data [29] suggests thatTiO2 deposited without oxygen in deposition ambient exhibitsamorphous phase and all other samples deposited in partial oxy-gen ambient exhibit mixture of anatase and rutile phases.However, the intensity of the anatase phase (101) increasesand that of the rutile phase (110) decreases with the increasein oxygen partial pressure.
As the deposition of anatase and rutile phase is related to theenergy consideration [30], it is important to understand theenergetic of the sputtered species at the substrate surface.Ti–O bonds being longer in rutile phase, Ti–O bond energyis less and hence Ti adatoms need to have higher kinetic energyon the surface of the growing films for formation of the rutileTi–O bonds. At lower oxygen pressure in the sputtering
3818 Vol. 54, No. 13 / May 1 2015 / Applied Optics Research Article
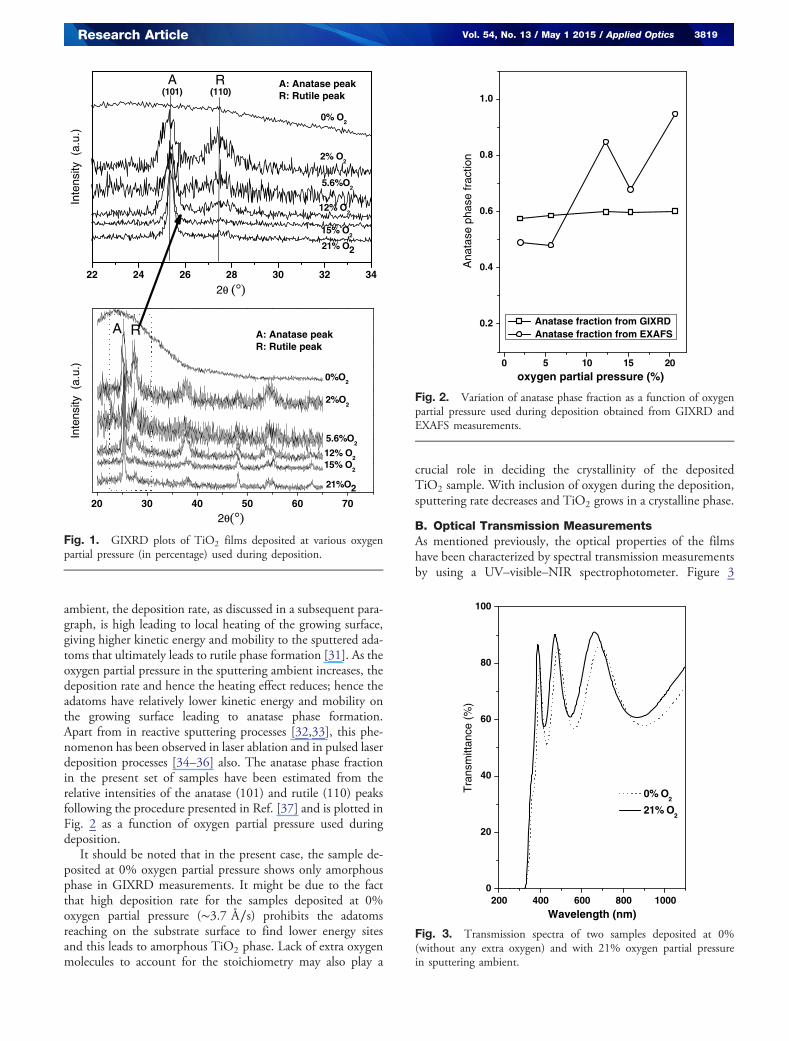
ambient, the deposition rate, as discussed in a subsequent para-graph, is high leading to local heating of the growing surface,giving higher kinetic energy and mobility to the sputtered ada-toms that ultimately leads to rutile phase formation [31]. As theoxygen partial pressure in the sputtering ambient increases, thedeposition rate and hence the heating effect reduces; hence theadatoms have relatively lower kinetic energy and mobility onthe growing surface leading to anatase phase formation.Apart from in reactive sputtering processes [32,33], this phe-nomenon has been observed in laser ablation and in pulsed laserdeposition processes [34–36] also. The anatase phase fractionin the present set of samples have been estimated from therelative intensities of the anatase (101) and rutile (110) peaksfollowing the procedure presented in Ref. [37] and is plotted inFig. 2 as a function of oxygen partial pressure used duringdeposition.
It should be noted that in the present case, the sample de-posited at 0% oxygen partial pressure shows only amorphousphase in GIXRD measurements. It might be due to the factthat high deposition rate for the samples deposited at 0%oxygen partial pressure (∼3.7 Å∕s) prohibits the adatomsreaching on the substrate surface to find lower energy sitesand this leads to amorphous TiO2 phase. Lack of extra oxygenmolecules to account for the stoichiometry may also play a
crucial role in deciding the crystallinity of the depositedTiO2 sample. With inclusion of oxygen during the deposition,sputtering rate decreases and TiO2 grows in a crystalline phase.
B. Optical Transmission MeasurementsAs mentioned previously, the optical properties of the filmshave been characterized by spectral transmission measurementsby using a UV–visible–NIR spectrophotometer. Figure 3
22 24 26 28 30 32 34
20 30 40 50 60 70
2θ (°)
Inte
nsity
(a.
u.)
A: Anatase peakR: Rutile peak
0%O2
RA
2%O2
21%O2
15% O2
12% O2
5.6%O2
Inte
nsity
(a.
u.)
2θ(°)
A: Anatase peakR: Rutile peak
0% O2
2% O2
21% O2
15% O2
12% O2
5.6%O2
A R(101) (110)
Fig. 1. GIXRD plots of TiO2 films deposited at various oxygenpartial pressure (in percentage) used during deposition.
0 5 10 15 20
0.2
0.4
0.6
0.8
1.0
Ana
tase
pha
se fr
actio
n
oxygen partial pressure (%)
Anatase fraction from GIXRD Anatase fraction from EXAFS
Fig. 2. Variation of anatase phase fraction as a function of oxygenpartial pressure used during deposition obtained from GIXRD andEXAFS measurements.
200 400 600 800 10000
20
40
60
80
100
Tra
nsm
ittan
ce (
%)
Wavelength (nm)
0% O2
21% O2
Fig. 3. Transmission spectra of two samples deposited at 0%(without any extra oxygen) and with 21% oxygen partial pressurein sputtering ambient.
Research Article Vol. 54, No. 13 / May 1 2015 / Applied Optics 3819
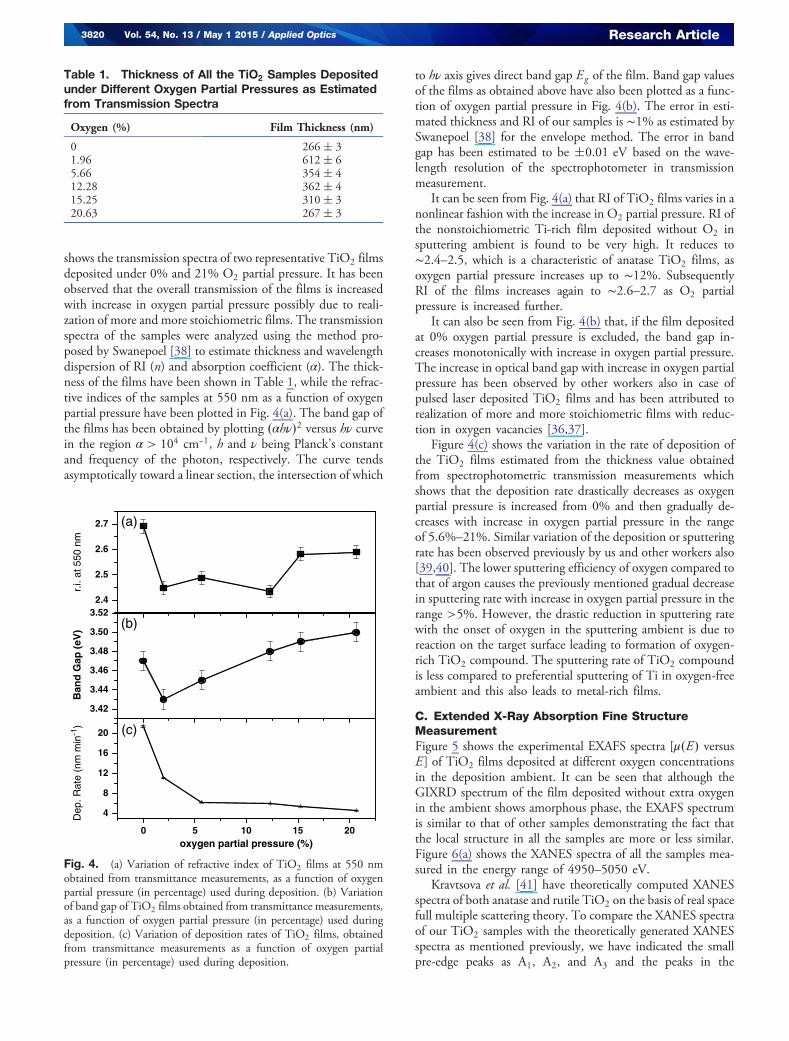
shows the transmission spectra of two representative TiO2 filmsdeposited under 0% and 21% O2 partial pressure. It has beenobserved that the overall transmission of the films is increasedwith increase in oxygen partial pressure possibly due to reali-zation of more and more stoichiometric films. The transmissionspectra of the samples were analyzed using the method pro-posed by Swanepoel [38] to estimate thickness and wavelengthdispersion of RI (n) and absorption coefficient (α). The thick-ness of the films have been shown in Table 1, while the refrac-tive indices of the samples at 550 nm as a function of oxygenpartial pressure have been plotted in Fig. 4(a). The band gap ofthe films has been obtained by plotting �αhν�2 versus hν curvein the region α > 104 cm−1, h and ν being Planck’s constantand frequency of the photon, respectively. The curve tendsasymptotically toward a linear section, the intersection of which
to hν axis gives direct band gap Eg of the film. Band gap valuesof the films as obtained above have also been plotted as a func-tion of oxygen partial pressure in Fig. 4(b). The error in esti-mated thickness and RI of our samples is ∼1% as estimated bySwanepoel [38] for the envelope method. The error in bandgap has been estimated to be �0.01 eV based on the wave-length resolution of the spectrophotometer in transmissionmeasurement.
It can be seen from Fig. 4(a) that RI of TiO2 films varies in anonlinear fashion with the increase inO2 partial pressure. RI ofthe nonstoichiometric Ti-rich film deposited without O2 insputtering ambient is found to be very high. It reduces to∼2.4–2.5, which is a characteristic of anatase TiO2 films, asoxygen partial pressure increases up to ∼12%. SubsequentlyRI of the films increases again to ∼2.6–2.7 as O2 partialpressure is increased further.
It can also be seen from Fig. 4(b) that, if the film depositedat 0% oxygen partial pressure is excluded, the band gap in-creases monotonically with increase in oxygen partial pressure.The increase in optical band gap with increase in oxygen partialpressure has been observed by other workers also in case ofpulsed laser deposited TiO2 films and has been attributed torealization of more and more stoichiometric films with reduc-tion in oxygen vacancies [36,37].
Figure 4(c) shows the variation in the rate of deposition ofthe TiO2 films estimated from the thickness value obtainedfrom spectrophotometric transmission measurements whichshows that the deposition rate drastically decreases as oxygenpartial pressure is increased from 0% and then gradually de-creases with increase in oxygen partial pressure in the rangeof 5.6%–21%. Similar variation of the deposition or sputteringrate has been observed previously by us and other workers also[39,40]. The lower sputtering efficiency of oxygen compared tothat of argon causes the previously mentioned gradual decreasein sputtering rate with increase in oxygen partial pressure in therange >5%. However, the drastic reduction in sputtering ratewith the onset of oxygen in the sputtering ambient is due toreaction on the target surface leading to formation of oxygen-rich TiO2 compound. The sputtering rate of TiO2 compoundis less compared to preferential sputtering of Ti in oxygen-freeambient and this also leads to metal-rich films.
C. Extended X-Ray Absorption Fine StructureMeasurementFigure 5 shows the experimental EXAFS spectra [μ�E� versusE ] of TiO2 films deposited at different oxygen concentrationsin the deposition ambient. It can be seen that although theGIXRD spectrum of the film deposited without extra oxygenin the ambient shows amorphous phase, the EXAFS spectrumis similar to that of other samples demonstrating the fact thatthe local structure in all the samples are more or less similar.Figure 6(a) shows the XANES spectra of all the samples mea-sured in the energy range of 4950–5050 eV.
Kravtsova et al. [41] have theoretically computed XANESspectra of both anatase and rutile TiO2 on the basis of real spacefull multiple scattering theory. To compare the XANES spectraof our TiO2 samples with the theoretically generated XANESspectra as mentioned previously, we have indicated the smallpre-edge peaks as A1, A2, and A3 and the peaks in the
2.4
2.5
2.6
2.7
3.42
3.44
3.46
3.48
3.50
3.52
0 5 10 15 20
4
8
12
16
20
r.i.
at 5
50 n
m
(a)
Ban
d G
ap (
eV) (b)
Dep
. Rat
e (n
m m
in-1
)
oxygen partial pressure (%)
(c)
Fig. 4. (a) Variation of refractive index of TiO2 films at 550 nmobtained from transmittance measurements, as a function of oxygenpartial pressure (in percentage) used during deposition. (b) Variationof band gap of TiO2 films obtained from transmittance measurements,as a function of oxygen partial pressure (in percentage) used duringdeposition. (c) Variation of deposition rates of TiO2 films, obtainedfrom transmittance measurements as a function of oxygen partialpressure (in percentage) used during deposition.
Table 1. Thickness of All the TiO2 Samples Depositedunder Different Oxygen Partial Pressures as Estimatedfrom Transmission Spectra
Oxygen (%) Film Thickness (nm)
0 266� 31.96 612� 65.66 354� 412.28 362� 415.25 310� 320.63 267� 3
3820 Vol. 54, No. 13 / May 1 2015 / Applied Optics Research Article
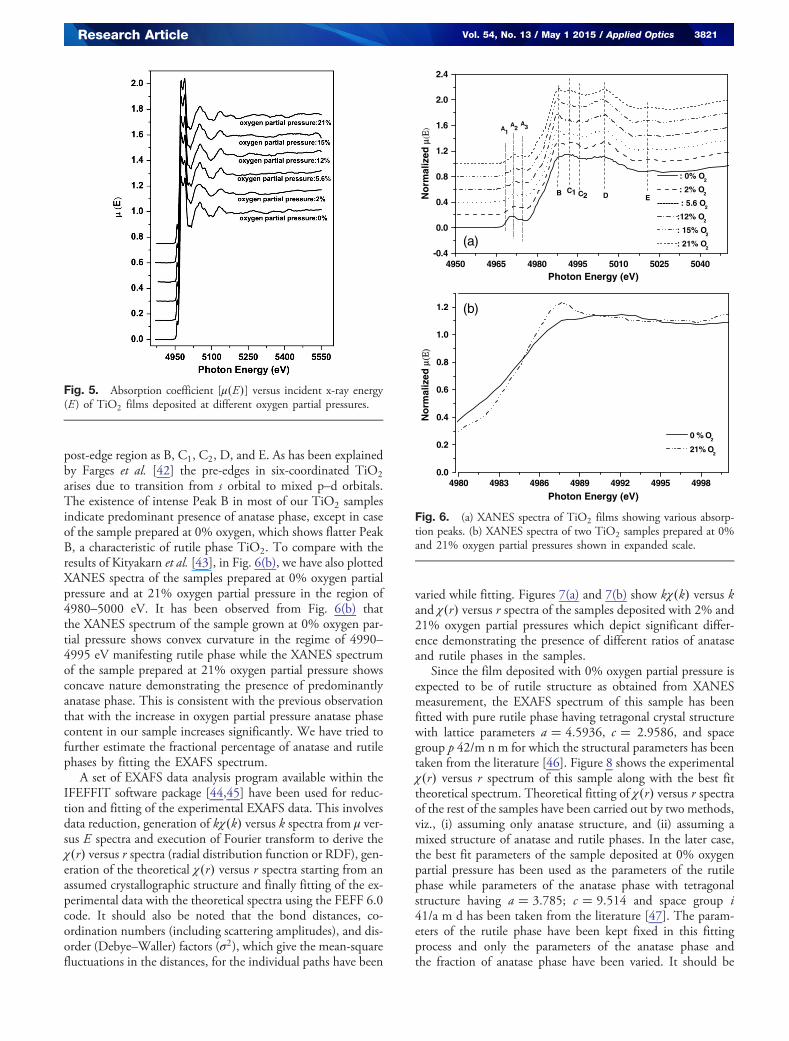
post-edge region as B, C1, C2, D, and E. As has been explainedby Farges et al. [42] the pre-edges in six-coordinated TiO2
arises due to transition from s orbital to mixed p–d orbitals.The existence of intense Peak B in most of our TiO2 samplesindicate predominant presence of anatase phase, except in caseof the sample prepared at 0% oxygen, which shows flatter PeakB, a characteristic of rutile phase TiO2. To compare with theresults of Kityakarn et al. [43], in Fig. 6(b), we have also plottedXANES spectra of the samples prepared at 0% oxygen partialpressure and at 21% oxygen partial pressure in the region of4980–5000 eV. It has been observed from Fig. 6(b) thatthe XANES spectrum of the sample grown at 0% oxygen par-tial pressure shows convex curvature in the regime of 4990–4995 eV manifesting rutile phase while the XANES spectrumof the sample prepared at 21% oxygen partial pressure showsconcave nature demonstrating the presence of predominantlyanatase phase. This is consistent with the previous observationthat with the increase in oxygen partial pressure anatase phasecontent in our sample increases significantly. We have tried tofurther estimate the fractional percentage of anatase and rutilephases by fitting the EXAFS spectrum.
A set of EXAFS data analysis program available within theIFEFFIT software package [44,45] have been used for reduc-tion and fitting of the experimental EXAFS data. This involvesdata reduction, generation of kχ�k� versus k spectra from μ ver-sus E spectra and execution of Fourier transform to derive theχ�r� versus r spectra (radial distribution function or RDF), gen-eration of the theoretical χ�r� versus r spectra starting from anassumed crystallographic structure and finally fitting of the ex-perimental data with the theoretical spectra using the FEFF 6.0code. It should also be noted that the bond distances, co-ordination numbers (including scattering amplitudes), and dis-order (Debye–Waller) factors (σ2), which give the mean-squarefluctuations in the distances, for the individual paths have been
varied while fitting. Figures 7(a) and 7(b) show kχ�k� versus kand χ�r� versus r spectra of the samples deposited with 2% and21% oxygen partial pressures which depict significant differ-ence demonstrating the presence of different ratios of anataseand rutile phases in the samples.
Since the film deposited with 0% oxygen partial pressure isexpected to be of rutile structure as obtained from XANESmeasurement, the EXAFS spectrum of this sample has beenfitted with pure rutile phase having tetragonal crystal structurewith lattice parameters a � 4.5936, c � 2.9586, and spacegroup p 42/m n m for which the structural parameters has beentaken from the literature [46]. Figure 8 shows the experimentalχ�r� versus r spectrum of this sample along with the best fittheoretical spectrum. Theoretical fitting of χ�r� versus r spectraof the rest of the samples have been carried out by two methods,viz., (i) assuming only anatase structure, and (ii) assuming amixed structure of anatase and rutile phases. In the later case,the best fit parameters of the sample deposited at 0% oxygenpartial pressure has been used as the parameters of the rutilephase while parameters of the anatase phase with tetragonalstructure having a � 3.785; c � 9.514 and space group i41/a m d has been taken from the literature [47]. The param-eters of the rutile phase have been kept fixed in this fittingprocess and only the parameters of the anatase phase andthe fraction of anatase phase have been varied. It should be
Fig. 5. Absorption coefficient [μ�E�] versus incident x-ray energy(E) of TiO2 films deposited at different oxygen partial pressures.
4950 4965 4980 4995 5010 5025 5040-0.4
0.0
0.4
0.8
1.2
1.6
2.0
2.4
4980 4983 4986 4989 4992 4995 49980.0
0.2
0.4
0.6
0.8
1.0
1.2
: 0% O2
: 2% O2
-------- : 5.6 O2
:12% O2
: 15% O2
: 21% O2
EDC2C1B
A3A2
No
rmal
ized
μ(Ε
)
Photon Energy (eV)
A1
(a)
No
rmal
ized
μ(Ε
)
Photon Energy (eV)
0 % O2
21% O2
(b)
Fig. 6. (a) XANES spectra of TiO2 films showing various absorp-tion peaks. (b) XANES spectra of two TiO2 samples prepared at 0%and 21% oxygen partial pressures shown in expanded scale.
Research Article Vol. 54, No. 13 / May 1 2015 / Applied Optics 3821
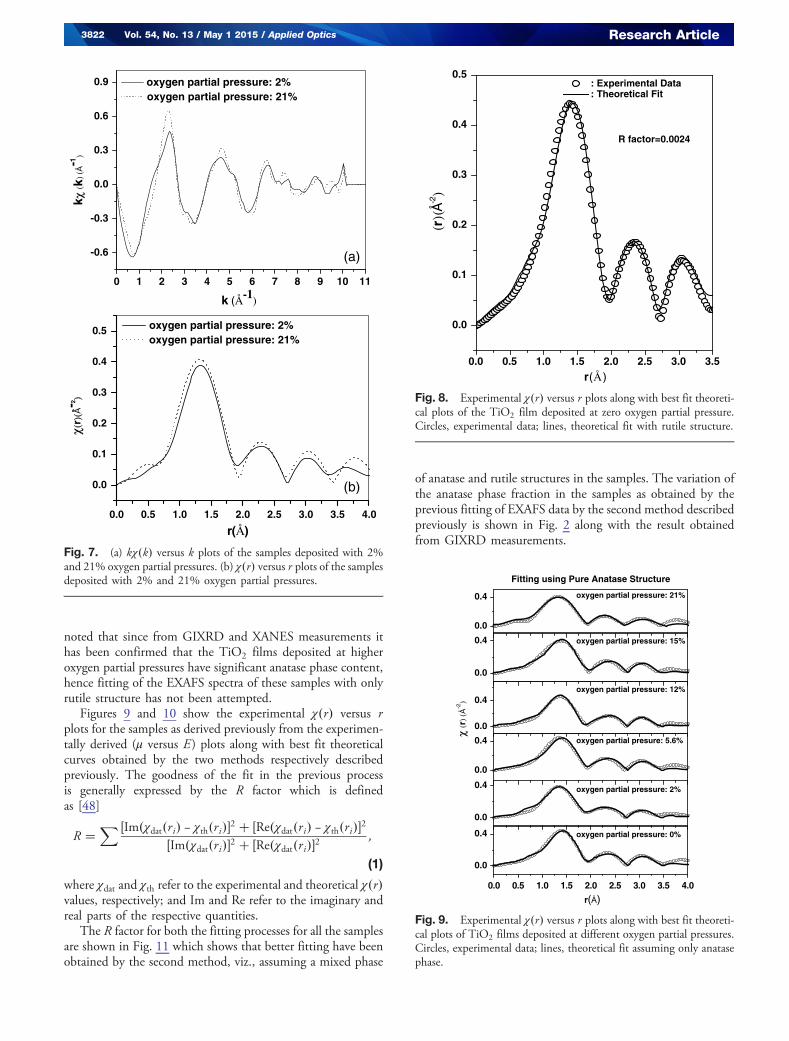
noted that since from GIXRD and XANES measurements ithas been confirmed that the TiO2 films deposited at higheroxygen partial pressures have significant anatase phase content,hence fitting of the EXAFS spectra of these samples with onlyrutile structure has not been attempted.
Figures 9 and 10 show the experimental χ�r� versus rplots for the samples as derived previously from the experimen-tally derived (μ versus E ) plots along with best fit theoreticalcurves obtained by the two methods respectively describedpreviously. The goodness of the fit in the previous processis generally expressed by the R factor which is definedas [48]
R �X �Im�χdat�ri� − χth�ri��2 � �Re�χdat�ri� − χth�ri��2
�Im�χdat�ri��2 � �Re�χdat�ri��2;
(1)
where χdat and χth refer to the experimental and theoretical χ�r�values, respectively; and Im and Re refer to the imaginary andreal parts of the respective quantities.
The R factor for both the fitting processes for all the samplesare shown in Fig. 11 which shows that better fitting have beenobtained by the second method, viz., assuming a mixed phase
of anatase and rutile structures in the samples. The variation ofthe anatase phase fraction in the samples as obtained by theprevious fitting of EXAFS data by the second method describedpreviously is shown in Fig. 2 along with the result obtainedfrom GIXRD measurements.
0.0 0.5 1.0 1.5 2.0 2.5 3.0 3.5 4.0
0.0
0.1
0.2
0.3
0.4
0.5
χ(r)
(-2 )
oxygen partial pressure: 2% oxygen partial pressure: 21%
(b)
r(Å)
0 1 2 3 4 5 6 7 8 9 10 11
-0.6
-0.3
0.0
0.3
0.6
0.9k χ
( k) (
-1)
k (Å-1)
oxygen partial pressure: 2% oxygen partial pressure: 21%
(a)
Fig. 7. (a) kχ�k� versus k plots of the samples deposited with 2%and 21% oxygen partial pressures. (b) χ�r� versus r plots of the samplesdeposited with 2% and 21% oxygen partial pressures.
0.0 0.5 1.0 1.5 2.0 2.5 3.0 3.5
0.0
0.1
0.2
0.3
0.4
0.5 : Experimental Data : Theoretical Fit
(r)(Å
-2)
r(Å)
R factor=0.0024
Fig. 8. Experimental χ�r� versus r plots along with best fit theoreti-cal plots of the TiO2 film deposited at zero oxygen partial pressure.Circles, experimental data; lines, theoretical fit with rutile structure.
0.0
0.4
0.0
0.4
χ (r
) (-2
)
0.0
0.4
0.0
0.4
0.0
0.4 oxygen partial pressure: 2%
0.0 0.5 1.0 1.5 2.0 2.5 3.0 3.5 4.0
0.0
0.4
oxygen partial pressure: 21%
oxygen partial pressure: 15%
oxygen partial pressure: 12%
oxygen partial presure: 5.6%
r( )
oxygen partial pressure: 0%
Fitting using Pure Anatase Structure
Fig. 9. Experimental χ�r� versus r plots along with best fit theoreti-cal plots of TiO2 films deposited at different oxygen partial pressures.Circles, experimental data; lines, theoretical fit assuming only anatasephase.
3822 Vol. 54, No. 13 / May 1 2015 / Applied Optics Research Article
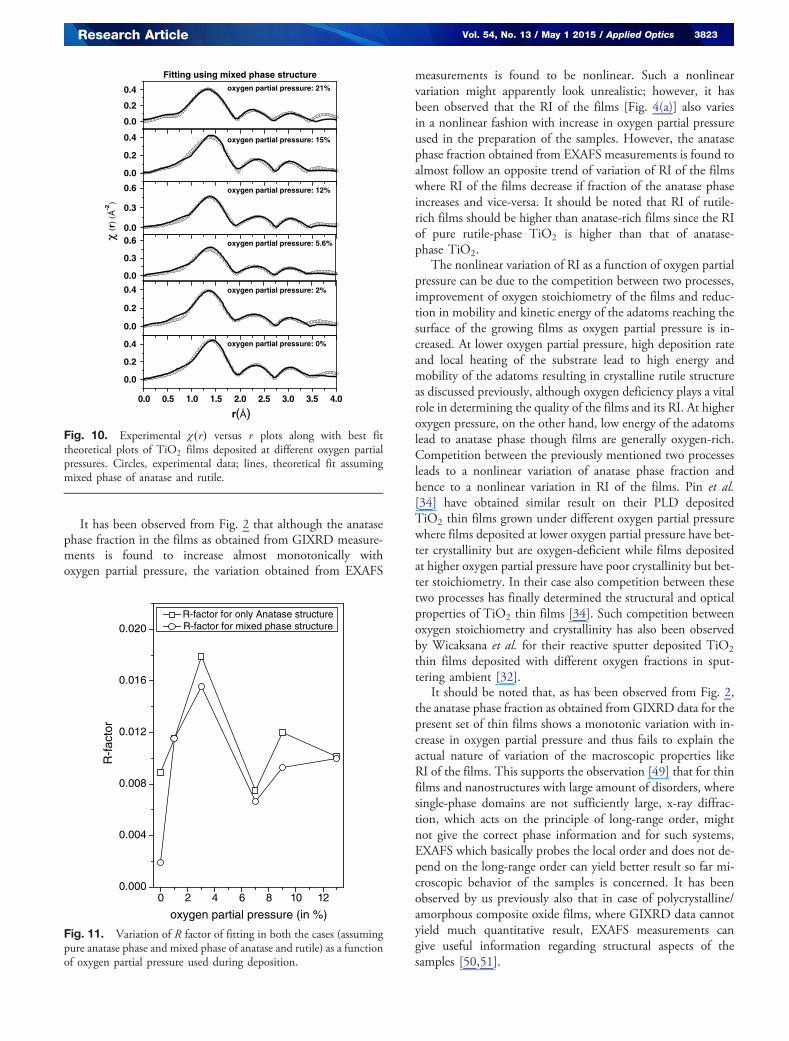
It has been observed from Fig. 2 that although the anatasephase fraction in the films as obtained from GIXRD measure-ments is found to increase almost monotonically withoxygen partial pressure, the variation obtained from EXAFS
measurements is found to be nonlinear. Such a nonlinearvariation might apparently look unrealistic; however, it hasbeen observed that the RI of the films [Fig. 4(a)] also variesin a nonlinear fashion with increase in oxygen partial pressureused in the preparation of the samples. However, the anatasephase fraction obtained from EXAFS measurements is found toalmost follow an opposite trend of variation of RI of the filmswhere RI of the films decrease if fraction of the anatase phaseincreases and vice-versa. It should be noted that RI of rutile-rich films should be higher than anatase-rich films since the RIof pure rutile-phase TiO2 is higher than that of anatase-phase TiO2.
The nonlinear variation of RI as a function of oxygen partialpressure can be due to the competition between two processes,improvement of oxygen stoichiometry of the films and reduc-tion in mobility and kinetic energy of the adatoms reaching thesurface of the growing films as oxygen partial pressure is in-creased. At lower oxygen partial pressure, high deposition rateand local heating of the substrate lead to high energy andmobility of the adatoms resulting in crystalline rutile structureas discussed previously, although oxygen deficiency plays a vitalrole in determining the quality of the films and its RI. At higheroxygen pressure, on the other hand, low energy of the adatomslead to anatase phase though films are generally oxygen-rich.Competition between the previously mentioned two processesleads to a nonlinear variation of anatase phase fraction andhence to a nonlinear variation in RI of the films. Pin et al.[34] have obtained similar result on their PLD depositedTiO2 thin films grown under different oxygen partial pressurewhere films deposited at lower oxygen partial pressure have bet-ter crystallinity but are oxygen-deficient while films depositedat higher oxygen partial pressure have poor crystallinity but bet-ter stoichiometry. In their case also competition between thesetwo processes has finally determined the structural and opticalproperties of TiO2 thin films [34]. Such competition betweenoxygen stoichiometry and crystallinity has also been observedby Wicaksana et al. for their reactive sputter deposited TiO2
thin films deposited with different oxygen fractions in sput-tering ambient [32].
It should be noted that, as has been observed from Fig. 2,the anatase phase fraction as obtained from GIXRD data for thepresent set of thin films shows a monotonic variation with in-crease in oxygen partial pressure and thus fails to explain theactual nature of variation of the macroscopic properties likeRI of the films. This supports the observation [49] that for thinfilms and nanostructures with large amount of disorders, wheresingle-phase domains are not sufficiently large, x-ray diffrac-tion, which acts on the principle of long-range order, mightnot give the correct phase information and for such systems,EXAFS which basically probes the local order and does not de-pend on the long-range order can yield better result so far mi-croscopic behavior of the samples is concerned. It has beenobserved by us previously also that in case of polycrystalline/amorphous composite oxide films, where GIXRD data cannotyield much quantitative result, EXAFS measurements cangive useful information regarding structural aspects of thesamples [50,51].
0.0
0.2
0.4
0.0
0.2
0.4
χ (r
) (-2
)
0.0
0.3
0.6
0.0
0.3
0.6
0.0
0.2
0.4
0.0 0.5 1.0 1.5 2.0 2.5 3.0 3.5 4.0
0.0
0.2
0.4
oxygen partial pressure: 21%
oxygen partial pressure: 15%
oxygen partial pressure: 12%
oxygen partial pressure: 5.6%
oxygen partial pressure: 2%
r( )
oxygen partial pressure: 0%
Fitting using mixed phase structure
Fig. 10. Experimental χ�r� versus r plots along with best fittheoretical plots of TiO2 films deposited at different oxygen partialpressures. Circles, experimental data; lines, theoretical fit assumingmixed phase of anatase and rutile.
0 2 4 6 8 10 120.000
0.004
0.008
0.012
0.016
0.020
R-f
acto
r
oxygen partial pressure (in %)
R-factor for only Anatase structure R-factor for mixed phase structure
Fig. 11. Variation of R factor of fitting in both the cases (assumingpure anatase phase and mixed phase of anatase and rutile) as a functionof oxygen partial pressure used during deposition.
Research Article Vol. 54, No. 13 / May 1 2015 / Applied Optics 3823
4. CONCLUSIONS
In summary, a set of TiO2 thin films has been deposited byasymmetric bipolar pulse dc sputtering technique using differ-ent oxygen partial pressures in the sputtering ambient. Thestructural properties of the samples have been studied byGIXRD and EXAFS measurements while the optical propertiesof the films have been studied by transmission spectrophotom-etry. The data were analyzed and the following observationshave been made:
(i) The RI of TiO2 films varies in a nonlinear fashion withincrease in O2 partial pressure in the sputtering ambient.(ii) The band gap, however increases monotonically withincrease in oxygen partial pressure and this has been attributedto the realization of more and more stoichiometric films withreduction in oxygen vacancies, as oxygen partial pressure isincreased in deposition ambient.(iii) GIXRD measurements show that the anatase phase frac-tion in the films increases slowly and monotonically as oxygenpartial pressure is increased which cannot explain the observednonlinear variation of RI of the films with increase in oxygenpartial pressure.(iv) However, local structure investigation by EXAFS mea-surements shows that anatase phase fraction also varies in anonlinear fashion with increase in oxygen partial pressureand almost follows an opposite trend observed for the variationof RI of the films.(v) Finally, the nonlinear variation of macroscopic and mi-
croscopic properties of the TiO2 films with increase in oxygenpartial pressure has been attributed to the competition betweentwo processes during the film growth, viz., improvement ofoxygen stoichiometry of the films and reduction in mobilityand kinetic energy of the adatoms reaching the surface ofthe growing films.
The authors wish to acknowledge the help of Shri D. D. Shindeand Shri J. S. Misal of BARC, Vizag Center in preparation ofthe samples and Dr. Sanjay Rai, ISUD, RRCAT, Indore inGIXRD measurements.
REFERENCES1. P. Eiamchai, P. Chindaudom, A. Pokaipisit, and P. Limsuwan,
“A spectroscopic ellipsometry study of TiO2 thin films prepared byion-assisted electron-beam evaporation,” Curr. Appl. Phys. 9,707–712 (2009).
2. K. Jiang, A. Zakutayev, J. Stowers, M. D. Anderson, J. Tate,D. H. McIntyre, D. C. Johnson, and D. A. Keszler, “Low-temperature,solution processing of TiO2 thin films and fabrication of multilayerdielectric optical elements,” Solid State Sci. 11, 1692–1699 (2009).
3. L. Miao, L. F. Su, S. Tanemura, C. A. J. Fisher, L. L. Zhao, Q. Liang,and G. Xu, “Cost-effective nanoporous SiO2–TiO2 coatings on glasssubstrates with antireflective and self-cleaning properties,” Appl.Eng. 112, 1198–1205 (2013).
4. P. M. Perillo and D. F. Rodriguez, “A room temperature chloroformsensor using TiO2 nanotubes,” Sens. Actuators B 193, 263–266(2014).
5. F. Meng, X. Song, and Z. Sun, “Photocatalytic activity of TiO2
thin films deposited by RF magnetron sputtering,” Vacuum 83,1147–1151 (2009).
6. W. S. Shih, S. J. Young, L. W. Ji, W. Water, T. H. Meen, K. T. Lam, J.Sheen, and W. C. Chu, “Thin film transistors based on TiO2 fabricatedby using radio-frequency magnetron sputtering,” J. Phys. Chem.Solids 71, 1760–1762 (2010).
7. P.-C. Yao, J.-L. Chiang, and M.-C. Lee, “Application of sol–gel TiO2
film for an extended-gate H+ ion-sensitive field-effect transistor,”Solid State Sci. 28, 47–54 (2014).
8. S.-F. Wang, Y.-F. Hsu, and Y.-S. Lee, “Microstructural evolution andoptical properties of doped TiO2 films prepared by RF magnetronsputtering,” Ceram. Int. 32, 121–125 (2006).
9. H.-Q. Jiang, Q. Wei, Q.-X. Cao, and X. Yaob, “Spectroscopic ellips-ometry characterization of TiO2 thin films prepared by the sol–gelmethod,” Ceram. Int. 34, 1039–1042 (2008).
10. M.-L. Lee, C.-Y. Su, Y.-H. Lin, S.-C. Liao, J.-M. Chen, T.-P. Perng,J.-W. Yeh, and H. C. Shih, “Atomic layer deposition of TiO2 onnegative electrode for lithium ion batteries,” J. Power Sources244, 410–416 (2013).
11. D. Li, M. Carette, A. Granier, J. P. Landesman, and A. Goullet,“Spectroscopic ellipsometry analysis of TiO2 films deposited byplasma enhanced chemical vapor deposition in oxygen/titaniumtetraisopropoxide plasma,” Thin Solid Films 522, 366–371 (2012).
12. O. Duyar, F. Pacido, and H. Z. Durusoy, “Optimization of TiO2 filmsprepared by reactive electron beam evaporation of Ti3O5,” J. Phys. D41, 095307 (2008).
13. F. Flory, E. Pelletier, G. Albrand, and Y. Hu, “Surface optical coatingsby ion assisted deposition techniques: Study of uniformity,” Appl.Opt. 28, 2952–2959 (1989).
14. S. Berg and T. Nyberg, “Fundamental understanding and modeling ofreactive sputtering processes,” Thin Solid Films 476, 215–230 (2005).
15. H. Kuo, C. H. Chien, and C. H. Huang, “Zirconia and zirconia–silicathin films deposited by magnetron sputtering,” Thin Solid Films 420,47–53 (2002).
16. W. Kwasny, L. A. Dobrzanski, M. Pawlyta, and W. Gulbinski, “Fractalnature of surface topography and physical properties of the coatingsobtained using magnetron sputtering,” J. Mater. Process. Technol.157–158, 188–193 (2004).
17. P. Singh and D. Kaur, “Room temperature growth of nanocrystallineanatase TiO2 thin films by dc magnetron sputtering,” Physica B 405,1258–1266 (2010).
18. P. R. Sagdeo, D. D. Shinde, J. S. Misal, N. M. Kamble, R. B. Tokas, A.Biswas, A. K. Poswal, S. Thakur, D. Bhattacharyya, N. K. Sahoo, andS. C. Sabharwal, “Deposition and characterization of titania–silicaoptical multilayers by asymmetric bipolar pulsed dc sputtering ofoxide targets,” J. Phys. D 43, 045302 (2010).
19. H. Kersten, H. Deutsch, H. Steffen, G. M. W. Kroesen, and R. Hippler,“The energy balance at substrate surfaces during plasma process-ing,” Vacuum 63, 385–431 (2001).
20. M. N. Iliev, V. G. Hadjiev, and A. P. Litvinchuk, “Raman and infraredspectra of brookite (TiO2): experiment and theory,” Vib. Spectrosc.64, 148–152 (2013).
21. M. Addamo, M. Bellardita, A. Di Paola, and L. Palmisano,“Preparation and photoactivity of nanostructured anatase, rutileand brookite TiO2 thin films,” Chem. Commun. 4943–4945 (2006).
22. K.-S. Lin, H.-W. Cheng, W.-R. Chen, and J.-F. Wu, “Synthesis, char-acterization and application of anatase-typed titania nanoparticles,”J. Environ. Eng. Manage. 20, 69–76 (2010).
23. C. Ohara, T. Hongo, A. Yamazaki, and T. Nagoya, “Synthesis andcharacterization of brookite/anatase complex thin film,” Appl. Surf.Sci. 254, 6619–6622 (2008).
24. D. Mardare, V. Nica, C.-M. Teodorescu, and D. Macovei, “Fe-dopedTiO2 thin films,” Surf. Sci. 601, 4479–4483 (2007).
25. M. P. Moret, R. Zallen, D. P. Vijay, and S. B. Desu, “Brookite-richtitania films made by pulsed laser deposition,” Thin Solid Films366, 8–10 (2000).
26. H.-J. Jung, “Characterization of TiO2 nanocrystalline films for highperformance dye-sensitized solar cells,” Trans. Electron. Electron.Mater. 12, 123–126 (2011).
27. S. Basu, C. Nayak, A. K. Yadav, A. Aggarwal, A. K. Poswal, D.Bhattacharyya, S. N. Jha, and N. K. Sahoo, “A comprehensive facilityfor EXAFS measurements at the INDUS-2 synchrotron source atRRCAT, Indore, India,” J. Phys. 493, 012032 (2014).
28. A. K. Poswal, A. Agrawal, A. K. Yadav, C. Nayak, S. Basu, S. R. Kane,C. K. Garg, D. Bhattachryya, S. N. Jha, and N. K. Sahoo,“Commissioning and first results of scanning type EXAFS beamline
3824 Vol. 54, No. 13 / May 1 2015 / Applied Optics Research Article
(BL-09) at INDUS-2 synchrotron source,” AIP Conf. Proc. 1591,649–651 (2014).
29. Powder diffraction file–International Center for Diffraction Data, PDFNos. 86–0147 and 84–1286, http://www.icdd.com.
30. H. Zhang and J. F. Banfield, “New kinetic model for the nanocrystal-line anatase-to-rutile transformation revealing rate dependence onnumber of particles,” Am. Mineral. 84, 528–535 (1999).
31. A. N. Pargellis, “Evaporating and sputtering: Substrate heatingdependence on deposition rate,” J. Vac. Sci. Technol. A 7, 27–30(1989).
32. D. Wicaksana, A. Kobayashi, and A. Kinbara, “Process effects onstructural properties of TiO2 thin films by reactive sputtering,”J. Vac. Sci. Technol. A 10, 1479–1482 (1992).
33. A. Buranawong, N. Witt-Anun, and S. Chaiyakun, “Total pressureand annealing temperature effects on structure and photo-inducehydrophilicity of reactive DC sputtered TiO2 thin films,” Eng. J. 16,79–90 (2012).
34. M. Pin, G. Lee, W. Lee, E. Choi, and Y. Yoo, “Effects of oxygen work-ing pressure on structural and optical properties of TiO2 films grownon glass substrate,” Jpn. J. Appl. Phys. 51, 09MF12 (2012).
35. S. J. Wang, W. T. Chang, J. Y. Chou, M. K. Wie, and M. S. Wong,“Preparation of TiO2 thin films by laser ablation for photocatalyticapplications,” J. Vac. Sci. Technol. A 26, 898–902 (2008).
36. H. Long, G. Yang, A. Chen, Y. Li, and P. Lu, “Growth and character-istics of laser deposited anatase and rutile TiO2 films on Si sub-strates,” Thin Solid Films 517, 745–749 (2008).
37. F. C. Gennari and D. M. Pasquevich, “Kinetics of the anatase–rutiletransformation in TiO2 in the presence of Fe2O3,” J. Mater. Sci. 33,1571–1578 (1998).
38. R. Swanepoel, “Determination of the thickness and optical constantsof amorphous silicon,” J. Phys. E 16, 1214–1222 (1983).
39. S. M. Haque, P. R. Sagdeo, S. Balaji, S. Kumar, D. Bhattacharyya, D.Bhattacharyya, and N. K. Sahoo, “Effect of substrate bias and oxygenpartial pressure on properties of RF magnetron sputtered HfO2 thinfilms,” J. Vac. Sci. Technol. B 32, 03D104 (2014).
40. W. D. Sproul, D. J. Christie, and D. C. Carter, “Control of reactivesputtering processes,” Thin Solid Films 491, 1–17 (2005).
41. A. N. Kravtsova, A. V. Soldatov, M. Nachtegaal, M. W. Tew, and J. A.van Bokhoven, “Influence of the Muffin–Tin approximation on thesimulation of titanium K-edge X-ray absorption spectra of TiO2 (rutileand anatase phases),” Physica B 405, 724–726 (2010).
42. F. Farges, G. E. Brown, Jr., and J. J. Rehr, “Ti K-edge XANES studiesof Ti coordination and disorder in oxide compounds: comparison be-tween theory and experiment,” Phys. Rev. B 56, 1809–1819 (1997).
43. S. Kityakarn, A. Worayingyong, A. Suramitr, and M. F. Smith,“Ce-doped nanoparticles of TiO2: Rutile-to-brookite phase transitionand evolution of Ce local-structure studied with XRD and XANES,”Mater. Chem. Phys. 139, 543–549 (2013).
44. D. C. Konigsberger and R. Prince, X-Ray Absorption: Principles,Applications, Techniques of EXAFS, SEXAFS and XANES (Wiley,1988).
45. M. Newville, B. Ravel, D. Haskel, J. J. Rehr, E. A. Stern, and Y.Yacoby, “Analysis of multiple-scattering XAFS data using theoreticalstandards,” Physica B 208–209, 154–156 (1995).
46. http://cars9.uchicago.edu/atomsdb/TiO2–rut.inp.47. http://cars9.uchicago.edu/atomsdb/TiO2–ana.inp.48. B. Ravel, “Commentary on EXAFS analysis with FEFF and IFEFFIT,
Part 2, 2004. http://cars9.uchicago.edu/~ravel/course/notes.pdf.49. M. F. Smith, W. Klysubun, S. Kityakarn, A. Worayingyong, S. B.
Zhang, S.-H. Wei, D. Onkaw, P. Songsiriritthigul, S. Rujirawat, andS. Limpijumnong, “Determination of phase ratio in polymorphicmaterials by X-ray absorption spectroscopy: The case of anataseand rutile phase mixture in TiO2,” J. Appl. Phys. 105, 024308 (2009).
50. N. C. Das, N. K. Sahoo, D. Bhattacharyya, S. Thakur, D. Nanda, S.Hazra, J. K. Bal, J. F. Lee, Y. L. Tai, and C. A. Hsieh, “Modifications oflocal structures of Gd2O3 on incorporation of SiO2,” J. Appl. Phys.110, 063527 (2011).
51. N. C. Das, N. K. Sahoo, D. Bhattacharyya, S. Thakur, N. M. Kamble,D. Nanda, S. Hazra, J. K. Bal, J. F. Lee, Y. L. Tai, and C. A. Hsieh,“Correlation between local structure and refractive index of e-beamevaporated (HfO2–SiO2) composite thin films,” J. Appl. Phys. 108,023515 (2010).
Research Article Vol. 54, No. 13 / May 1 2015 / Applied Optics 3825
Copyright © 2022 FDOKUMEN