
Controlled Thermtetus: Processes andtfilas Physics (UC-2O ...
662
ANL/CTX-76-3 Controlled Thermtetus: Processes andtfilas Physics (UC-2O) CTR Progran ARGONNE NATIONAL LABORATORY 9700 South Cass Avenue Argonne, Illinois 60439 TOKAMAK EXPERIMEKTAL POWER REACTOR CONCEPTUAL DESICN VOLUME I Weston M. Stacey, Jr.-—Project Manager Mohamed A. Abdou Peter J. Bertoncini Christian C. Bolta Jeffrey K. Brooks Kenneth Evans, Jr. John A. Fasolo Jung C. Jung Robert L. Kustom Victor A. Maroni Richard F. Mattas Frederick E. Mills Balabhadra Misra John S. Moenich Alfred Moretti James H. Norera John S. Patten Walter F. Praeg Peter Sraelser Dale L. Snith Herbert C. Stevens Larry Turner Sou-Tien Wang Carl K. Youngdahl August, 1976 ' —- ifcr V, Ifiru ' JUfufen ni.i siti t. riff*-** r ih*u i r, [rep rnnnrn»»T«l> •mrrJfi •-'7 :
-
Upload
khangminh22 -
Category
Documents
-
view
1 -
download
0
Transcript of Controlled Thermtetus: Processes andtfilas Physics (UC-2O ...

ANL/CTX-76-3Controlled Thermtetus:
Processes andtfilasPhysics (UC-2O)
CTR ProgranARGONNE NATIONAL LABORATORY
9700 South Cass AvenueArgonne, Illinois 60439
TOKAMAK EXPERIMEKTAL POWER REACTOR CONCEPTUAL DESICN
VOLUME I
Weston M. Stacey, Jr.-—Project ManagerMohamed A. AbdouPeter J. BertonciniChristian C. BoltaJeffrey K. BrooksKenneth Evans, Jr.John A. FasoloJung C. JungRobert L. KustomVictor A. MaroniRichard F. MattasFrederick E. Mills
Balabhadra MisraJohn S. MoenichAlfred MorettiJames H. NoreraJohn S. PattenWalter F. PraegPeter SraelserDale L. SnithHerbert C. StevensLarry TurnerSou-Tien WangCarl K. Youngdahl
August, 1976
' —-ifcr V,
Ifiru '
JUfufen
ni.i siti
t. riff*-**
r ih*u i
r, [rep
rnnnrn»»T«l> •mrrJfi
•-'7:

ABSTRACT
A conceptual design has been developed for a tokat&.ik Kxpcriaoncal
Power Reactor to operate at net e l e c t r i c a l power condit ions with a plant
capacity factor of 50* for 10 yea r s . The Kl'R operates in a pulsed mode
a t a frequency of "- 1/tnin. , with a - 75'i duty cyc le , is capable of pro-
ducing "- 72 MWe and requires M2 MWe. The annual t r i t i u m consumption is
16 kg.
The EPR vacuum chamber i s 6-25 m in major radius .;ind 7..U vx in minor
rad ius , i s constructed of 2-cm thick s t a i n l e s s s t e e l , and lias 2-cm thick
detachable , beryl l ium-coated coolant panels raounted on the i n t e r i o r . An
0.28 m s t a i n l e s s s t e e l blanket ond a sh i e ld ranging from 0.6 to 1.0 ra
surround the vacuum vesse l . The coolant i s HjO.
Sixteen niobium-ti tanium superconducting toroidal—field c o i l s provide
a f i e ld of 10 T a t the co i l and A.47 T at the plasma. Superconducting
ohmic-heating and equ i l ib r ium-f i e ld co i l s provide 135 V-s to drive the
plastui c u r r e n t . Plasma hea t ing is accomplished by 12 neut ra l bean i n j e c t o r s ,
which provide 60 MK. . ie »gy t . msfer and storage system cons i s t s of a
cen t r a l superconducting s torage r i ng , a hoaopolar energy s torage u n i t , and
a varietv of inductor-converters.

FOREWORD
The experimental power reactor (EPR) will have a wajor role in the
U.S. tokamak reactor development program. The current ERDA/CMFE program
plan (WASH-1290) projects a tokamak fusion test reactor (TFTR) to begin
operation in the early-19801s, a tokamak EPR to begin operation in the
mid-1980's, possibly a second EPR to begin operation in the early 1990's,
and a demonstration reactor to begin operation in the late 1990's.
In August, 1974, an interdisciplinary project was organized at Angon
.National Laboratory so perform a scoping and project definition study
(ANL/CTR-75-2) for the first EPK. This study was extended during thet pas
year to develop a conceptual design for the EPR. These studies were in-
tended to define the characteristics of and requirements for an EPR vrithi
the context of the general objectives and schedule of the current ERQ&/DM
program plan.
Partly as a result of the focus provided by these studies on th«h-t»c
nological and plasma physics extrapolations required for an EPR, the up-
dated ERDA/DMFE reference plan (currently in draft) projects a deferral
of the EPR initial operation until the late-1980's and the introduction
of ii reactor intermediate to the TFTR and the EPR. Subsequent scudieHwi
address modifications of the EPR design that are required by this ne* rol
in the program.

ACKNOWLEDGEMENTS
An undertaking of this magnitude owes its success to the assistance and
support of many people in addition to the authors. Although it is impractical
to site all of the contributors, certain substantive contributions are spe-
cifically acknowledged.
At Argonne, a number of people contributed directly to the design.
T. K. Khoe assisted in the design of the beam line for the neutral beam in-
jection system. S. H. Kim assisted in the design of the magnet system.
R. E. Fuja assisted in the design of the inductor-converter system for the
equilibrium field coil energy transfer system. H. J. Moe performed the
potential off-site tritium exposure calculations. T. C. Chawla developed
rauch of the information on hazards analysis and safeguards, as well as
initiating the adaption of an analytical formalism for fusion reactor safety
analysis. Numerous other people at the laboratory advised upon various as-
pects of the design.
Several people at other institutions made important direct contributions.
J. N. Davidson (Georgia Tech) developed the field ripple criterion for the
toroidal field. D. W. DeMichele (Texas A & M) provided valuable support for
the toroidal field coil computations and assisted in some of these analyses.
T. W. Petrie (Univ. of Illinois) performed the calculations for alpha particle
slowing down and escape, 'f. K. Sung (Univ. of Wisconsin) assisted with the
radioactive inventory calculations. C. A. Trachsel and B. A. Cramer
(McDonald-Douglas Astronautics) performed the analysis of the structural
support system for the magsets and provided valuable suggestions on the
engineering design of the blanket and shield. T. Yang and R. W. Conn
(Univ. of Wisconsin) performed the preliminary design calculations for a
non-circular plasma option.
The preparation of the report for publication was handled by C. S. Bury,
who was assisted by C. A. Poore, C. M. Hytry and J. S. Lind. T. J. Lucitt,
E. L. Singleton and many others were responsible for the drafting. The extra
effort of these people made it possible to meet a demanding publication
schedule.
TABLE OF CONTENTS
VOLUME I
Page
LIST OF FIGURES xoii
LIST OF TABLES ^^
CHAPTER I. INTRODUCTION . 1-1
CHAPTER II. SUMMARY II-l
A. Reference Design . II-l
B. Plasma Physics and Performance Analysis . . . . . . . . . II-8
1. MHD Equilibria and Steady-State Plasma Perfor-mance . . . . . . . . . . . . . . . . . . . . . . . II-8
2. Transient Performance 11-10
3. Plasma Initiation 11-19
C. Magnet System 11-19
1. Toroidal-Field (TF) Coils 11-22
2. Poloidal-Field Coils 11-28
3. Structural Support 11-29
D. Plasma Heating 11-32
1. Neutral Beam Injection H-32
2. Radio-Frequency Heating . . . * 11-34
E. Energy Storage and Transfer System . . . 11-36
1. Ohmic Heating System 11-36
2. Equilibrium-Field Coil System 11-40
3. Neutral Beam Injection System 11-42
4. RF Heating System 11-42
5. Central Energy Storage Inductor . . . . . . . . . . 11-43
F. Vacuum Systems , 11-43
G. First Wall 11-45
H. Blanket /Shield System 11-50
I. Access and Maintenance . . . . . 11-62

Page
J. Tritium 11-63
K, Facility Description 11-66
L. Costs and Schedule. 11-69
CHAPTER III. PLASMA PHYSICS & PERFORMANCE ANALYSIS III-l
A. MHD Equilibria and Steady-State Plasma Performance . . . III-l
1. MHD Equilibria III-l
2. Steady-State Performance . . . . . . . III-ll
3. Subignition Plasma Performance Analysis 111-19
4. Particle and Radiation Fluxes on the Tirst Wall . . 111-23
5. Suprathermal Alpha Particle Effects . 111-28
6. Toroidal-Field Ripple Effects 111-31
B. Transient Performance Analysis 111-33
1. MHD Equilibria During the Burn Cycle 111-33
2. Plasma Driving and Heating System . . 111-36
3. Startup Requirements . . . 111-40
4. Reference Case Burn Cycle Simulation . . . 111-50
5. Power Performance . . . . . . . . . . . . 111-70
6. Plasma Heating III-S1
7. Plasma Refueling and Recycling . . . . 111-87
C. Plasma Initiation 111-92
1. Normal Initiation Mode 111-92
2. Alternatives 111-96
3. Requirements for Initiation of Discharge III-100
D. Research Requirements . . . . . . . . . . . . . . . . . . IIX-103
1. Confinement . . . . . III-103
2. MHD Equilibria and Stability Ill-104
3. Impurity Control . . . . . III-104
4. Heating . . . , III-105
5. Refueling III-106
6. Plasma Initiation III-106

Page
CHAPTER IV. MAGNET SYSTEMS JV-1
A. Toroidal-Field Coil System . . , JV-3
1. Maximum Practical Field . JV-3
2. Field Ripple, Access and Coil Size . -IV-5
3. Pure-Tension Toroidal-Field Coil Characteristics
and In-Plane Hoop Stress JV-7
4. Nuclear Heating and Radiation Damage JV-14
5. Superimposing Fields and Out-of-Plane Load . . . . JV-15
6. Superimposing Field and AC Losses JV-19
7. Normal Metal Field Shielding Design . . . . . . . JV-26
8. Shield Option - Superconducting Field Shield . . . JV-37
9. Cryostatic Stability JA'-39
10. Conductor Design, Coil Structure and Coil
Winding 3V-46
11. The Effects of Fabrication Tolerances JV-54
12. Coil Protection and Magnet Safety Analysis . . . . JV-5713. Summation of Dissipation Loss and the Refriger-
ation Requirements JV-63
14. Refrigeration System Evaluation . . . . JV-64
11-. Cryostat Design JV-72
16. Toroidal-Field Coil Support JV-77
B. Poloidal Coil System JV-78
1. Superconducting Ohmic-Heating Coil Design . . . . JV-79
2. Superconducting Equilibrium-Field Coil Design . . JEV-83
3. Plasma Initiation-Trimming (IT) Coil JV-87
4. Axial Forces, Hoop Stresses and Coil Inter-actions - JV-89
5. Coil Stability and Magnet Protection JV-96
6. Conductor Design and Coil Structure . . . . . . . JV-98
7. AC Loss Estimation and Refrigeration Require-
ments > « . . . .IV-10 3
8. Poloidal Ceil Cryostat Design JV-105
9. Equilibrium Field Flux Penetration on the Blanketand Shield JV-107

Page
C. Research and Development Requirements 1BV—i:
1. Toroidal-Field Coil System IBV-l]
2. Ohmic-Heating Coils and Equilibrium-Field Coils . » tty-51
3. Structural Material Development DBJ/-11
CHAPTER V. PLASMA HEATING SYSTEMS . V-l
A. Neutral Beam Injector Design V-l
1. Ion Sources * V-42. Atomic Ion and Neutral Beam Transport for
Reference Designs 1 and 2 V-5
3. Molecular Beam Transport i V-l/
4. EPR Neutral Injector Power Flow Model for
Reference Designs 1 and 2 . . . . . . . . . . . . . »V-l^
5. Injector Gas Flow Diagram f V-1J
6. Final Reference Design 1 . . . . . . >V-2l
7. Reference Design 2 i V-2i
6. Overall Injector Efficiency ' V-27
9. Reference Design 3 r V-27
10. Overall Injector Efficiency as a Function ofBeam Energy : V-32
11. Injector Mechanical Design Description . . . . . . . > V-35
B. Radio-Frequency Heating of EPR r ; V-38
1. Lower Hybrid Resonance Heating . . . . . . . . . . . V-40
2. LHRH RF Power Source . . r V-44
3. Ion Cyclotron Resonance Heating (ICRH) 7-47
C. Research and Development Requirements V-51
1. Neutral Beam Injectors , V-51
2. RF Heating Systems V-51
CHAPTER VI. ENERGY STORAGE AND TRANSFER VI-1
A. Toroidal-Field Coil Power Supply VI-2
B. Ohmic-Heating Coil System VI-2
C. Equilibrium-Field Coil System . VI-14

Pagel
D. Neutral Beam Power Supplies . . . . . i?I-22
E. RF Heating System Power Supply JJ1-28
F. Energy Storage Inductor . . . . JI-29
G. Research and Development Requirements . . . . . . . . . JfI-35
CHAPTER VII. VACUUM SYSTEMS J.I-W-
A. Toroidal Vacuum System J.I-V
B. Neutral Beam Vacuum System . . . . . . .CI-B2
C. Waveguide Vacuum System ,[1-15
CHAPTER VIII. THE FIRST-WALL SYSTEM =, . . . .[MST
A. Design Description of the EPK First-Wall Jystem II-VS.1
1. Vacuum Vessel
2. Coolant Panel
3. Current Breaker [M5J3
A. Limiter
B. First-Wall Materials
1. Structural Materials [I-VD3
2. Liner Materials ll-KSL
3. Insulator Materials . . . . . . . . . . . . . . . .[I42K
4. Coolant
C. Thermal Analysis
D. Stress Analysis :i-V35!
1. Vacuum Vessel . . . . . . . . . . . . . . . . . . .!I4QDI
2. Coolant Fanels .X-VEH
E. Research and Development Requirements . « . . . . . . . . . 1 - W 3 E I
1. Materials . . . , . ,1-WH2. Coolant Technology . I-W3S
3. Structural Mechanics I-VS3

Page
CHAPTER IX. BLANKET/SHIELD SYSTEM , IX-1
A. Nuclear Design of the Blanket/Shield System 1X-5
1. Primary Design Criteria and Constraints IX-5
2. Description of the Nuclear Systems for the EPR:Reference Design and Calculational Models . . . . . IX-9
3. Toroidal Geometry Effects in the ReferenceDesign . -. IX-15
4. Neutrosiics Effects in the F i r s t Wall and
Blanket . . . . . . . . . . . . . . . . IX-28
5. Neutronics Analysis of the Bulk Shield IX-33
f>. Neutronics Effects in the Toroidal-Field (TF)Coils IX-39
7. Nuclear Design of Penetrations Shield IX-44
B. Blanket and. Shield Materials . . . . . . . . . . . . . . . IX-59
C. Pulsed Magnetic Field Requirements and Torque Effects
, on Blanket/Shield Design . IX-63D. Mechanical Design~1}ese.ription of the Blanket/Shield
Systemi .;\. . . . . S / IX-66
1. Description of the Reference Blanket Design . . .•.•'-•. IX-68
2. Description dt the Slab-type Blanket -Design . . . . IX-71
3.; Description of the Reference Design^ Shield ;;
I System . '. • •_. . . C . . ,. . ./^.V^djfc . . . ''. . ,, :JIX-71
4. Penetration Shield System / .T. N,>. IX-73
5. Maintenance and Repair Scenario IX-73
E. Thermal Analyses , . . . ? . . . . . . . . . . . . IX-74
.'""'"'1. Blanket .t'% . • i . . ... . . ' •' IX-74
2. Magnet Shield Thermal Analysis . . . . . . . . . . IX-76
F. Resaarch and Development Requirements ; . . IX-77
1. Neutronics ,. . . . . . i-% . IX-77
2. , Coolant Technology . . . IX-78
3. Mechanics IX-78
4. Shield Technology . . . . . . . . . .'%. IX-79
5. Electromagnetics . . . . ' : . . . . . <ff. . . . . . IX-79
x

Page
CHAPTER X. TRITIUM HANDLING FAClLIiY X-l
A. Introduction X-l
B. Tritium Inventory and Reactor Fueling (Logistics) . . . X-4
C. Fuel Circulation and Processing X-5
1. Debris Reparation and Handling X-5
2. Nonrcef-allic Impurity Removal X-6
3. Isotopic Enrichment X-7
4. Fuel Cycle Design and Hardware X-7
D. Design Description of the Cryogenic DistillationCascade X-J.0
1. Summary Design Description . „ . .
2. Analysis of the Distillation Cascade . *
3. Column Dimensions and Inventories
4. Comments on the Level A Cascade
E. Atmospheric Detritiation Systems
1. Estimates of Gas Handling Requirements
2. Catalyst Requirements . . . . .
3. Atmospheric Clean-up Scenario and AssociatedCosts
F. Pressurized Water Handling Practices
G. Comments on Blanket Processing Test Modules for
Stage II .
H. Research and Development Requirements
1. Fueling Technology
2. Tritium Storage and Transportation . . . . . . . .
3. Fuel Conditioning and Purification
4. Tritium Circulation Technology
5. Tritium Control Technology
6. Blanket Processing Technology
7. Instrumentation and Control Technology . . . . . .
an
CHAPTER XI. INSTRUMENTATION AND CONTROL XI-1
A. Tokamak EPR Plasma Diagnostics XI-1
B. First Wall, Blanket and Shield Systems XI-4
C. Tritium Facility XI-6
D. Plasma Support Systems XI—7
E. Magnet System XI-8
CHAPTER XII. REACTOR ENGINEERING SYSTEMS XII-1
A. Structural Support Systems XII-1
1. Blanket/Shield System Support XII-1
2. Magnet Coil Structural Support XII-3
B. Reactor Assembly XII-9
1. Prerequisites - Pre-assembly Status XII-9
2. Assembly . . . . . XII-10
3. Schedule Sequence XII-13
C. Remote Maintenance XII-14
1. General Approach XII-14
2. Specific Repairs XII-18
3. Blanket and Shield Block Removal and Replace-ment Procedure XII-19
CHAPTER XIII. REACTOR AND FACILITIES . . • XIII-1
A. Reactor Building , XIII-1
B. Mockup Maintenance Building XIII-5
C. Tritium Facility . . . . . XIII-6
D. Power Supply Facilities . « TIII-6
E. Cryogenic Facilities XIII-7
F. Heat Transport and Cooling Tower Facilities XIII-7
G. Control Center XIII-8

Page
H. Turbine Generator Facility XIII-8
I. Power Substation XIII-8
CHAPTER XIV. ENVIRONMENTAL AND ENGINEERING SAFEGUARDS XIV-1
A. Preliminary Hazard Analysis XIV-1
B. Potential Off-site Tritium Exposures XIV-4
C. Radioactivity, Afterheat, and Biological Dose XIV-7
CHAPTER XV. RESOURCE REQUIREMENTS XV-1
A« Materials Inventory . . . . . . XV-I
B. Cost Estimate XV-1
C. Manpower and Funding Profiles XV-1
D. Schedule XV-4
VOLUME II
LIST OF FIGURES ^
LIST OF TABLES _,-
APPENDIX A. SoI-iMARY OF EPR DESIGN PARAMETERS A-l
APPENDIX B. IMPURITY CONTROL B-l
1. Computational Model B-l
2. Analysis B-18
3. Technological Feasibility of First-Wall SurfaceModifications B-25
a. Low-Z Coating . B-28
b. Low-Z Separated Monolithic Liner B-31
c. Carbon Curtain Liner . . . . . . . . . . B-33
d. Low-Sputtering Coating . . . . . . B-34
APPENDIX C, PLASMA CALCULATIONAL MODELS C-l
1. Global Model C-l
a. Balance Equations C-l
xiii.

Page
b. Transport Model C-4
c. Trapped Ion Mode (Particles, Electron Energy,
and Ion Energy) C-6
2. MHD Equilibrium Model C-7
3. Global Model Parameters •. C-12
4. Plasma Control Algorithm C-15
5. Core-Corona Model C-17
6. Plasma Initiation Model ,- . . C-22
a. Electron, Ion, and Neutral Density C-22
b. Electron and Ion Energy Balance C-23
c. Plasma Current , C-24
d. Runaway Electrons C-24
APPENDIX D. STRUCTURAL SUPPORT SYSTEM D-l
1. Summary D-l
2. EPR Definition D-4
3. Material Selection D-7
4. Structural Analysis Considerations D-9
5. Magnet Support Considerations . D-10
6. Design Development D-12
a. The Torque Shell D-13
b. Torque Frame Concept D-19
7. Concept Comparison D-22
a. TF Coil Support , D-22
b. Overhead Support Frames D-23
c. Access/Maintenance D-23
d. Weight Comparisons . . . . . D-24
e. Cost Comparisons D-248. Recommendations for Further Study D-26
xvo

Page
APPENDIX E. MATERIALS CONSIDERATIONS FOR THE PRIMARY ENERGYCONVERSION SYSTEM E-l
1. Structural Materials E"2
a. Austenitic Stainless Steel E-3
b. Alternate Structural Materials . 4E-L
2. Insulators i E-l!
a. Electrical Properties , . . . . > E-K
b. Radiation Swelling 1 E-l:
c. Mechanical Properties TE-li
d. Physical Properties . J E-lf
3. Low-Z Liner Materials $ E-l{
4. Blanket and Shield Materials > E-2C
a., Boron Carbide ) E-2C
b-. Graphite }E-2:
c. Lead Mortar and Aluminum > E-2f
APPENDIX F. MAGNETXS F-l
1. Normal Metal Flux Shield for Toroidal Field Coils . . . F-l
2. Eddy Current Effects in, the Subdivided Blanket arid
Shield F-3
a. Unsegraented Blanket and Shield F-3
b. Blanket and Shield Segmented Toroidally F-4
c. Subdivided Blanket and Shield Represented by
a Brick Mode] , F-5
d. Limitations to the Model Due to Assumptions . . . . F-6
e. Phase Delay and Time Delay F-7
APPENDIX G. NEUTRONICS PENETRATION ANALYSIS G-l
1. General Considerations •. ,s. ........ G-l
2. Calculational Model G-3
3. Analysis of Unshielded Penetrations . G-6
4. Shielding of Major Penetrations G-10
xt>
APPENDIX H. FIRST WALL STRESS ANALYSIS H-l
1. Effect of Constraints on F i r s t Wall Thermal S t resses . . H-5
2. S t ress in Uniform-Thickness Wall i H-8
a. Solid Wall H_g
b. Sandwich Wall 0 H-l
3. Stress in Ring-Stiffened Shell 3H-l
a. Effect of Ring Weight, Shell Weight, and PressureDifferential on Ring Dimensions JH-1
b. Effect of Support Location on Ring Dimensions . . . 6H-l
c. Tapered Rings 9 H-l
d. Effect of Coolant Panel Weight on Ring Di-mensions 0 H-2
e. Stress Concentrations 0 H-2
4. Buckling 3 H-2
5. Strain Cycling of Coolant Panels 8 H-2
a. Fixed Supports 0 H-3
b. Sliding Supports 4 H-3
APPENDIX I. ENRICHMENT OF ISOTOPES OF HYDROGEN BY CRYOGENIC
DISTILLATION 1-1
1. Development of the Computer Program 1-1
a. General Considerations 1-2
b. Mathematical Formulation 1-4
c. Convergence Criteria 1-5
d. Description of the Computer Code . 1-6
e. General Features of the Analysis Results 1-72. Cryogenic Enrichment Scenario for the EPR 71-2
a. Analysis of the EPR Cascade 7 1-2
b. Equilibration 9 1-2!
3. Cryogenic Enrichment Scenario for More Stringent Enrich-ment Requirements 71-3
4. Conclusions 5 I-4(
APPENDIX J. NONCIRCULAR PLASMA CONSIDERATIONS J-l
XV-i

LIST OF FIGURES
Page 1
II-l Perspective View El-2 •
II-2 EPR Vertical Section Dimensions [1-3 :
II-3 Detailed Vertical Section of EPR [1-5 :
II-4 EPR Plan View [1-6 3
TFrII-5 MHD Equilibria at B = 10 T — Total Beta [1-9!
n maxII-6 Burn Cycle Scenario [1-12
II-7 Effect of OH Current Reversal Time on Plasma Driving
and Heating System Requirements . . . . . [1-141
II-8 Power Components During Reference Burn Cycle [1-16
II-9 Net Energy Flow in Reference Burn Cycle LI-18
11-10 Power Performance as a Function of Operating Mode . . LI-20
11-11 Plasma Breakdown — Normal Start-up Cycle [I-2I
11-12 EPR Magnet Schematics [1-241
11-13 Reference Sheet Conductor (60 KA) for TF Coi l and i t s
Coi l Cross Sec t ion ( J e l l y R o l l Winding) 'I—271
11-14 40 KA Cable for P o l o i d a l C o i l s : i - 3 I
11-15 Beam Line Design : i -33
11-16 Circui t Diagram :i-39
11-17 Cross Section of the Region of Insulat ing Cylinders
and Conducting Drums for a Typical CCG . . . . . . . . I-4D
11-18 Vacuum Vessel Structure I-46I
11-19 Coolant Panel I-47T
11-20 Transient temperature h i s t o r i e s (0.5 MW/'m2) locat ionson the coolant ex i t plane at the surface of the berylliumcoating (upper curve), a t the surface of the s t a in l e s ss t a e l in contact with the coating (middle curve) , anda t the s t a in l e s s s t ee l surface in contact with thecoolant (lower curve) <, 1-52
11-21 EPR Blanket/Shield Arrangement I-52I

Page
11-22 Blanket Block 11-53
11-23 Nuetron heating in the water coolant as a function ofdepth in the blanket/shield for three locations withrespect to the neutral beam duct: a - at the wall ofthe beam duct, b - at 10 cm from the wall of the beamduct, and c - at 30 cm from the wall of the beamduct 11-58
11-24 Atomic displacement in stainless steel as a function ofdepth in the blanket/shield for three locations withrespect to the neutral beam duct: a - at the wall ofthe beam duct, b - at 10 cm from the wall of the beamduct, and c - at 30 cm from the wall of the beamduct 11-59
11-25 Radioactivity and Biological Hazard Potential as aFunction of Time After Shutdown Following Two Yearsof Operation 11-61
11-26 Fuel Cycle Scenario for the ANL/EPR 11-65
11-27 Reactor Containment Building 11-67
I I I - l Radial Profiles c IIT-3
TFf1
III-2 MHD Equilibria at B = 10 T — Total Beta III-5maxTFr
III-3 MHD Equilibria at B = 10 T — Poloidal Beta . . . . III-6m a xT F r
I I I - 4 MHD E q u i l i b r i a a t B = 1 0 T — S a f e t y F a c t o r . . . . I I I - 7M m a xTFP
III-5 MHD Equilibria at B = 10 T — Flux and CurrentContours mf X III-9
TFrIII-6 MHD Equilibria at B = 10 T — Profiles 111-10
maxIII-7 Confinement Requirement for Subignition, Bean>-Driven
Operation . . . . 111-21
III-8 Power Amplification for Subignition, Beam-Driven
Operation 111-22
III-9 Power Output for Subignition, Beam-Driven Operation . . 111-24
111-10 Neutron Wall Load for Subignition, Beam-Driven
Operation 111-25
I i l - l l Fast Alpha Escape Fraction 111-29
111-12 Alpha Power Deposition Profile 111-30
xov

Page
111-13 Toroidal Field Ripple 111-34
III-14 Plasma Driving System Circuit Diagram Il l-35
111-15 Burn Cycle Scenario 111-41
111-16 Effect of OH Current Reversal Time on Plasma Drivingand Heating System Requirements . . 111-44
111-17 Effect of Beam .Initiation Time on Plasma Driving andHeating System Requirements 111-45
111-18 Effect of Beam Power on Plasma liriving and HeatingSystem Requirements . . . . 111-46
III-19 Effect of Plasma Resistivity on Plasma Driving andHeating System Requirements . Ill—47
111-20 Effect of Oxygen Iinpurity on Plasma Driving and HeatingSystem Requirements . . 111-48
111-21 Plasma, OH and EF Currents During Reference Burn
Cycle 111-54
111-22 Poloidal Beta During Reference Burn Cycle 111-55
111-23 OH Coil System Power and Energy Transfer During
Reference Burn Cycle 111-56111-24 EF Coil System Power and Energy Transfer Driving
Reference Burn Cycle . . 111-57
111-25 Power and Energy Transfer Out of the Energy StorageUnit During Reference Burn Cycle 111-58
I11-26 Particle Densities and Refueling Current DuringReference Burn Cycle 111-60
111-27 Ion and Electron Temperatures During Reference Burn
Cycle 111-62
111-28 Power Components During Reference Burn Cycle 111-65
111-29 Power Components During Startup 111-66
111-30 Cumulative Energy Components During Reference Burr.
Cycle 111-69
I I I -31a Net Energy Flow in Reference Burn Cycle 111-71
III-31b Net Energy Flow in Reference Burn Cycle . 111-74

Page
111-32 Power Performance as a Function of Operating Mode . . . . 111-75
I11-33 Power Performance as a Function of OH Current Re-versal and Beam Turn On Times 111-77
111-34 Power Performance as a Function of Injected BeamPower 111-79
111-35 Power Performance as a Function of Energy TransferEfficiencies 111-80
111-36 Power Performance as a Function Plasma Edge
Temperature 111-82
111-37 Power Deposition Profile, Per Unit Volume 111-84
111-38 Power Deposition Profile, Per Plasma Ion 111-85
III-39 Plasma Breakdown — Normal Start-up Cycle 111-93
111-40 Plasma Breakdown — Sensitivity 111-95
111-41 Voltages During Startup 111-97
111-42 Plasma Breakdown — Alternate Start-up Cycle 111-99
111-43 Effect of Oxygen Impurity on Volt-Second Requirements . • III-102
IV-1 J-H Curve for NbTi versus Temperature IV-4
IV-2 Field Ripple Versus Extension of Outer Coil Leg IV-6
IV-3 EPR Magnet Schematics IV-8
IV-4 Hoop Stresses Distribution of Argonne Pure Tension
Coil IV-11
IV-5 Pure Tension C o i l C h a r a c t e r i s t i c s IV-12
IV-6 Pure Tension C o i l P r o f i l e Versus Number of C o i l s . . . . IV-13
IV-7 Reference Cycles f o r OH C o i l , Plasma and EF C o i l . . . . IV-17
IV-8 Time E v a l u a t i o n of Out of P l ane Load (no s h i e l d ) . . . . IV-18
IV-9a BI' to TF C o i l Due to EF, PL, and OH IV-20
IV-9b B l t o TF Coi l Due to EF, PL and OH IV-21
IV-10 Cross S e c t i o n of C r y o s t a t and Co i l Form , . IV-22
IV-11 M a g n e t o r e s i s t a n c e of Copper IV-28
xx

Page
IV-12 Resistivity of Aluminum as Function of Purity, Tempera-ture and Magnetic Field IV-29
IV-13 AC Losses Distribution Along TF Coil IV-33
IV-14 Out of Plane Load on Al Shield IV-36
"V-15 Locations of Superconducting Shield Coils IV-40
IV-16 Field Screening by Superconducting Shield Coils . . . . IV-41
IV-17 Distributions of Heat Sources and Heat Sinks 1V-43
IV-18 Heat Transfer Characteristics of Boiling Helium . , . . IV-44
IV-19 Reference Sheet Conductor (60 KA) for TF Coil and its
Coil Cross Section (Jelly Roll Winding) IV-49
IV-20 10 KA Cable Conductor and its Cryostat IV-52
IV-21 A Conceptual Winding Line for TF Coil IV-53
IV-22 Five Possible Fabrication Tolerances IV-55
IV-23 Tension Distortion of Coil Displacement and Coil ShapeDeflection IV-56
IV-24 Out of Plane Load Due to Errors of Rotation, Twist
and Tilt , IV-58
IV-25 Dumping Circui t IV-59
IV-26 Optimum Operating Temperature of Aluminum Shield . . . 1V-67
IV-27 3°K Refrigeration Schematics IV-68
IV-28 Relative Compressor Power for 3°K Refrigerator . . . . IV-69IV-29 Relative F i r s t Stage Displacement for 3°K Re-
f r igera tor IV-70
IV-30 Relative Mass Flow Rate for 3°K Refrigerators IV-71
IV-31 Schematics of Central Refrigeration Fac i l i t y . . „ . . IV-73
IV-32a TF Magnat Structural Support IV-75
IV -32b TF Magnet St ructura l Support (Cross-section) IV-76
IV-33 Circular Plasma Boundary IV-85
IV-34 Flux Contour IV-86
Page
IV-35 ITC Magnet Characteristics IV-88
IV-36 Vertical Force per Unit Length During Burn Phase IV-91
IV-37 Axial Force per Unit Coil Length (103 kg/m) IV-92
IV-38a Axial Pressure, P (kg/cm2) and Vertical Force, F (tons). . IV-93
IV-38b Axial Pressure, P (kg/cm2) and Vertical Force, F (tons). . IV-94
IV-39 40 KA Cable for Poloidal Coils IV-100
IV-AO Poloidal Coil Structure and its Cryostat Con-figuration ' IV-102
IV-41 Fiberglass Braiding Machine for Nonmetallic PoloidalCoil Cryostat IV-106
V-l Preliminary Beam Line Design. R is the Bending Radius,6 is the Bending Angle in M-l. for 180 keV D+, the GapField B = 575 Gauss in M-l V-6
oV-2 Schematic of Ion Source and Accelerator for a Diverging I
Ion Beam. For the initial version of Reference Design 1,u = 0.020 Rad., n = 0.0735 Rad., R = 2.225 m,o , _ o max n „ on = 4 o r 5 V-8
V-3 Division of the neutralizer into segments for numericalintegration. The second term in the expression for r1
is an allowance for beam scattering , V-13
V-4 EPR injector power flow diagram V-15
V-5 Gas flow diagram for EPR V-20
V-6 Neutralizer — Plasma Portions of the Beam Lines forReference Designs 1 and 2 and Preliminary Layouts ofthe Direct Converters and Magnetic Separators inChamber II V~23
V-7 Power Flow Diagram for Reference Design 3 V-31
V-8 Preliminary layout of D beam line for Reference Design3-a , V-33
V-9 Maximum Power Efficiencies for the NeutralizationProcesses D~-* D° and D. •> D°, j = 1, 2, 3 as Functionscf Energy per Deuteron V-34
V-10 ANL Experimental Power Resctor Plan View V-36
V-ll ANL Neutral Beam Injector V-37
xxii

Ii
I
i1I
V-12
V-13
V-14
V-15
V-16
VI-1
VI-2
VI-3
VI-4
VI-5
VI-6
VI-7
VI-8
VI-9
VI-10
VI-11
VI-12
VI-13
VI-14
VI-15
VI-16
Page
The "Grill" Structure /or LHRH Heating V-41
Details of Right Angle H-Plane Angle H-Plane Bend and"Grill" V-42
High Power rf LHRH System for one Port . , v~ 4 3
A Block Diagram of the High Power Source and LowPower Drive~Train for a "Grill". v"46
Details of the Loops and Power Feed System of ICRH . . . V-48
Cross Section nf the Region of Insulating Cylinders
and Conducting Drums for a Typical CCG tfI-4
Sketch of CCG Geometry .VI-6
Magnetic Field Plot for CCG .VI-7
Goodman Endurance Chart for CCG 17-4 Stainless SteelCylinders . . . .VI-10
Circuit Representation for Ohmic Heating Coil System . .VI-13
Inductor-Converter Bridge Circuit Diagram . . . . . . iJI-15
Inductor-Converter Voltage Wave forms when I >> I . HI-17s ti
Inductor-Converter Voltage Wave Forms when I = I . . .VI-18
Inductor-Converter Voltage Wave forms when I « I_, . .VI-20
Relative Timing Sequence for Switching SCR's to Pro-duce Symmetrical Voltage Waves with Induetor-ConverterNetwork for I » I,,, I = I,,, and I « I . . . . . .VI-21
Conventional NBI Power Supply System . . . . . . . . . .VI-24
HV Power Supply for NBI Block Diagram . . . . . . . . .VI-24
10 kHz 3-Phase Switching Circuit for Neutral Beam
Injector Power Control . . . . . . . . #1-27
Power and Energy Balance in Pulsed System .VI-31
Energy Storage and Transfer System . . . .VI-33
40 kA Energy Storage Conductor -.• .VI-36
XXVII,

VI I-1
VI I-2
VII-3
VII1-1
VIII-2
VII1-3
VII1-4
VII1-5
VIII-6
VIII-7
VIII-8
VIII-9
VIII-10
• •''•'"• ••"':,.. •-.- Page
Vacuum Port Configuration . . . . .,:. VII-7 I
Adsorption of hydrogen on molecular sieve 5A a t lowtemperatures and pressures . . . . . . . VII-8
Adsorption of helium on molecular sieve 5A a t low . i
temperatures and pressures ? ^ « . . . VII-8 :|
Vacuum Vessel Torus VIII-6 j
Coolant Manifold /r.rangements '.-"..... . . . VIII-7 !
Crossover Manifold Section with Current Breaker . . . „ VIII -8
Coolant Channel Arrangeirient for Coolant Panels and i'tS- iF i r s t Wall . . . . . . . .,: . . . . .,..,.... .;,,.,... . . . . . VXII-10;Photograph of Panel Coil Section Manufactured by ; i
Dean Products , I n c . , Brooklyn, N. Y. . . . . . . . . . " V I I I - l l
Vacuum Wall Segment . . . . . . . . . . . . . . . . . . VIII-14
Typical Manifold Section Piping, . . VIII-16
Elevated Temperature Fatigue of Aus ten i t ic^Sta in lessStee l -V. -1 - •'•• • • • • -'"• • • • VIII-20Energy Dependent Physical Sput ter ing Yields of Ironand Beryllium I r r ad i a t ed with D; Ions tha t have Mono-energe t i c and Maxwellian Energy" Dis t r ibu t ions . . . . . VIII-25
Temperature Dis t r ibu t ion through the Beryllium-Coated °S ta in le s s Steel Panel a f te r ; the F i r s t Burn Pulse (45 s)
—for"toca-tions-cn--tha-CQGLlant_Xnle_t Plane (lower curve)and Exit Plane (upper curve) . . . ,-~. i l~~;~^\T^^^::~~~¥¥£I=35=^
Temperature Distribution through the^Beryllium-Coated =Stainless Steel Panel after-the Sixth JBurn Pulse(345 s) for Locations on the Coolant Inlet Plane(lower curve) and ExitrPiane (upper curve) . . . . . . VIII-36
ajTransient Temperature Histories (0.5 MW/m2)-Locationson the Coolant tvjlet>?iane at the Surface of ' the BerylliumCoating (upper curve) , at the Surface of the StairilessSteel in Contact with the Coating (middle curve), and «.^at the Stainless Steel Surface in Contact with the . " 'Coolant (lower curve) ^ ; V1 .—.--•-----.-;-—- ,- . v =r"v". "• '•"""" "VHI-3v=^
xxvv

Page
VI1I-13
VIII-14
VI1I-15
VI11-16
IX-1
IX-2
IX-3
IX-4
IX-5
IX-6
IX-7
IX-8
Transient Temperature Histories (0.5 MW/m ) Locationson the Coolant Exit Plane at the Surface of the BerylliumCoating (upper curve), at the Surface of the StainlessSteel in Contact with the Coating (middle curve), andat the Stainless Steel Surface in Contact with theCoolant (lower curve) VIII-3;
Transient Temperature Histories (1.0 MW/m2) Locationson the Coolant Inlet Plane at the Surface of theBeryllium Coating (upper' curve), at the Surface ofthe Stainless Steel in Contact with the Coating (middlecurve), and at the Stainless Steel Surface in Contactwith the Coolant (lower curve) . . . ,
Transient Temperature Histories (1.0 MW/mz) Locationson the Coolant Exit Plane at the Surface of theBeryllium Coating (upper curve), at the Surface of theStainless Steel in Contact with the Coating (middlecurve), and at the Stainless Steel Surface in Contactwith the Coolant (lower curve)
Maximum Stress in Reinforcing Ring Supported atVarious Locations
EPR Circular Blanket/Shield Layout . . . .
A Schematic Reference of Toroidal Geometry
Source Strength, S(R,Z), of the D-T Neutrons in thePlasma Region as a Function of Major Radius at SeveralValues of Z
Isometric View of the DT Neutron Source Strength in theEPR Plasma Region , . . .
Variation of the Neutron Wall Loading with the PoloidalAngle x f ° r Three Casesi a = neutron so»rre distr ibutionas derived from the MHD equil ibr ia in the reference plasmacalculations, b - uniform neutron source dis t r ibut ion,c - the nominal case of a uniform source dis t r ibut ion inan inf ini te cylinder approximation . . . .
Variation of the Helium Production Rate within the Firs t1-cm o£ the Firs t Wall with the Poloidal Angle x • . . •
Variation of Atomic Displacements within the Fi rs t 1-cmof the Fi rs t Wall with the Poloidal Angle v . . , , , , ,
VIII-35
VIXI-42
IX-1C
IX-16
IX-1E
IX-19
Atomic Displacement as a Function of Distance fromFirst Wall in the Reference EPR Design (Reference Source)at x = 4° and x = 176°
IX-20
1X-22
IX-23
IX-26
XXV

Fage
IX-9 Helium and Hydrogen Production as Functions of Distancefrom First Wall in the Reference EPR Design (ReferenceSource) at x = 4° and X = 176° IX-27
IX-10 Spatial Distribution of Nuclear Heating in the EPRFirst Wall and Blanket for a Neutron Wall Loadingof fl,S MW/m2 IX-30
IX-11 Spatial Distribution of Atomic Displacement in theEPR First Wall and Blanket IX-31
IX-12 Spatial Distribution of Helium and Hydrogen ProductionRates in the EPR First Wall and Blanket. Also -shown isthe Spatial Dependence of He-to-dpa Ratio IX-32
IX-13 Spatial Distribution of Heating Rates in the EPR OutarShield for a Neutron Wall Loading of 0.5 MW/m2 . . . . . IX-34
IX-14 Spatial Distribution of Heating Rates in the EPRInner Shield for a Neutron Wall Loading of 0.5 MW/m2 . . IX-35
IX-15 Spatial Distribution of Helium and Hydrogen ProductionRates in the Inner Shield (in the raidplane) of theEPE Design IX-38
IX-16 Spatial Distribution of Nuclear Heating in the InnerSegment of the EPR Toroidal Field Coil (in the mid-plane) for a Neutron Wall Loading of 0.5 MW/m2 IX-40
IX-17 Atomic Displacements and Radiation-induced Resistivity(pr) in Copper (stabilizer) as a Function of Depthwithin the Inner Segment of the TF Coils after ReactorOperation for an Integral Wall Loading of 1 MW-yr/m2 . . IX-42
IX-18 Dose Absorbed in Mylar and EPOXY (with aromatic typecuring agent) Insulators as Function of Depth withinthe Inner Segment of the Toroidal Field Coil IX-43
IX-19 Schematic of Geometry Representation for Analysis ofNeutral Beam Penetrations and their Shield IX-46
IX-20 Total Neutron Flux (normalized to a neutron wall loadingof 1 MW/m2) as a function of Depth within the Blanketand Bulk Shield at Two Locations; a - a radial line farremoved from penetration effects, and b - a surfaceparallel to the walls of the neutral beam duct and is5 cm away IX-54
XXVI

Page
IX-21 Neutron Heating in the Water Coolant as a Function ofDepth in the Blanket/Shield for Three Locations withRespect to the Neutral Beam Duct: a - at the wall ofthe beam duct, b - at 10 cm from the wall of the beamduct, and c - at 30 cm from the wall of the beamduct IX-56
1X-22 Atomic Displacement in Stainless Steel as a Functionof Depth in the Blanket/Shield for Three Locations withRespect to the Neutral Beam Duct: a - at the wall of thebeam duct, b - at 10 cm from the wall of the beam duct,and c - at 30 cm from the wall of the beam duct . . . . IX-58
IX-23 A Vertical Cross Section for the Blanket/Shield ShowingSchematically the Movable Shield Plug for the Evacua-tion Ducts IX-60
IX-24 EPR Blanket/Shield Arrangement Circular Option IX-65
IX-25 EPR Alternate Slab Type Blanket/Shield Arrangement . . . IX-67
IX-26 Typical Blanket Block IX-70
X-l Fuel Cycle Scenario for ANL/EPR X-8
X-2 Fuel Cycle Module Connection Housing X-ll
X-3 Cryogenic Enrichment Scenario for EPR-1 . . . X-13
X-4 Block Diagram of the Detr i t ia t icn System X-25
X-5 Tritium Accumulation in the EPR Firs t Wall Cooling
Water Circuit X-27
XII-1 Shield Support Framework XII-2
XII-2 Torque Shell Structural Support XTI-4
XII-3 EPR Torque Frame Structural Support XII-6
XII-4 Reactor Assembly Sequence XII-11
XII-5 Reactor Assembly Sequence XII-12
XII-6 Basic Conceptual Design of Internal Remote Repair
Machine XII-16
XIII-1 Overall Site View XIII-2
XIII-2 Reactor Facili ty Elevation . XIII-3

Page
XIII-3 Reactor Facility Plan View Xlll-4
XIV-1 Radioactivity XIV-8
XIV-2 Afterheat as a Function of Time after ShutdownFollowing Two Years of Operation XIV-12
XV-1 EPR Design and Construction Schedule XV-7
xxv i H

i.lHT OK TABI.K.S
Page
1-1 KS'R Objectives 1-1
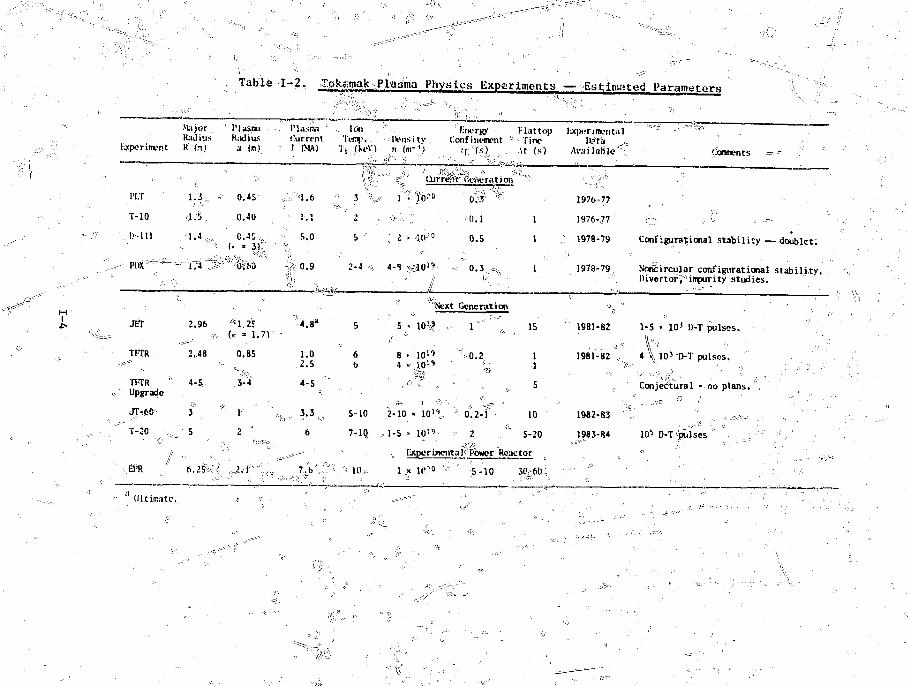
1-2 Tokaronk Plasma i'hysles Ksjjserisxrnt.s >••- Kxiicwted
Parameters . . 1-4
11.-1 KP." (a-onccric.-ii j'ar.'iraeter.s 11—4
11-2 Steady-State i'la.sna Parameters — Kyferotic*,;Ik-sign .- 11-11
i 1—3 Plasma Driving ami Heating Systosi Haxinua Require-ment* 11-15
12--4 F.wry,y iS.il.incu — Rcfcronce Cast- Burn Cycle 11-17
11-5 Toroidal Field Coil System 11-23
11-6 TF Coil Heat Dissipat ion Sucr.u-y 11-^6
11-7 OH/EK Coi l Ma Knot C h a r a c t c - i s t i c s I I -^O
II.-8 Neu t r a l litmm I n j e c t i o n Sys ten C h a r a c t L - r i s t i c s . . . . 11-33
H - 9 RF H e a t i n g Pa rame te r s 11-37
11-10 Energy Transfer and Storage Systems — M.ixi
Ratings 11-38
11-11 Vacuum System Parameters II- t4
11-12 First-Wa'l Design Parameters . 11-48
11-13 First-Wall Operating Parameters and Design Limits . . 11-49
I l - | i Summary of Blanket Design Parameters 11-56
11—15 Summary of Shield Design Parameters 11-57
11-16 Summary of Tritiurn-Handling Facility Parameters . . . 11-64
11-17 Atmospheric Cleanup System . . . . . 11-66
11-18 P l a n t C a p i t a l Inves tment Di recc Cost E s t i m a t e . . . . 11-69111-1 Plasma Performance Reference Design Summary - S t e a d y -
S t a t e Cond i t i ons 111-12
III—2 Sensitivity of the Plasma Performance to the Diagmag-nctic/Paramagnetic Parameter, 6 111-14

Page
111-3 Plasma Performance of the Optimum Equilibria as aFunction of Profile 111-15
II1-4 Plasma Performance as a Function of Temperature
=»nd Density Profiles III-17
HI—5 Plasma Performance as a Function of Temperature . . . 111-18
111-6 Subignition Plasma Performance as a Function of
Neutral Beam Power 111-20HI-"/ First-Wall P a r t i c l e s and Radiation Currents for
the EPR Reference Design 111-26
III-8 Neutron Flux and Currents at the Inner Surface ofthe EPR First Wall 111-27
III-9 MHD Equilibria for the Peak Plasma Current, IinaX =
7.58 MA p. . . . 111-37
111-10 Capacitance Requirements for OH Homopolar Generator . 111-42
III-ll Plasma Driving and Heating System Requirements . . . 111-43
111-12 Plasma Heating and Driving System Reference Case
Parameters 111-51
II1-13 Energy Balance — Reference Case Burn Cycle 111-72
111-14 Refueling and Replenishment Rates-Reference Case . . 111-88
IV-1 ANL-EPR Toroidal Field Coil System IV-9
IV-2 Typical Specifications of 60 kA TF Coil Conductor . . IV-24
IV-3 AC Loss in Aluminum Shield IV-34
IV-4 TF Coil Heat Dissipation Summary IV-65
IV-5 Pressure Range of Dense Gas Refrigerator IV-72
IV-6 Poloidal Coil Winding Configurations IV-81
IV-7 Poloidal Coil Magnet Characteristics IV-82
IV-8 Hoop Stress and Radial Pressure of Poloidal Coils
During Burn Phase IV-97IV-9 Induced Field in the Plasma Region due to Eddy
Currents in the Segmented or Subdivided Blanketand Shield IV-108
XXX

ageP
V-l Ion Source Design Characteristics V-3
V-2 Results of Calculations for D and D° Beam Transportand NeutraHzer Gas Loads (Case I) V-9
V-3 Results of Calculations for D and D° Beam Transportand Neutralizer Gas Loads (Case II) V-10
V-4 Results of Calculations for D and D° Beam Transportand Neutralizar Gas Loads (Case III) V-12
V-5 Results of D2, and D3 Beam Transport Calculationsfor the Beam Line of Figure V-l V-14
V-6 Cross Sections for Charge Changing Collisions andDissociation for 90 keV Hydrogen and 180 keVDeuterium Particles V-16
V-7 Gas Loads to Pump Chamber I, II and Torus V-18
V-8 Neutral Injector Gas Loads (per Injector) for theDesign of Table V-4 with Pg = 60 MW and N = 24 IonSources (in Twelve Injectors) V-19
V-9 Chamber I Pumping Speeds and Pressures and FractionalLosses of D , D2 and D3 for the Design of Table V-4with ?„ = 60 MW and N_ = 24 Ion Sources V-21
V-10 Chamber II Pumping Speeds and Pressures and Fractional .Losses of D° and D+ for the Design of Table V-4 withP_ = 60 MW and N = 24 Ion Sources V-24
V-ll Neutral Beam Reference Design Summaries V-25
V-12 Values of the Components of Fractional RecoveredPower in the Power Flow Diagram of Figure V-4 forReference Designs 1 and 2 with V+ = 0.18 MV V-28'
V-13 Calculated Values of Ion Beam Power, P , Ion BeamPower Recovery Efficiency, PR/P+> and Overall NeutralInjector Efficiency, e., , for Reference Designs 1 and2 with P = 60 MW, nj = n2 = 0.85, TI3 = 0.3 and k =1.1 IT-291
V-14 Values of P+f k P+, P P PIpg and forl,i J
Reference Designs 1 and 2 /-29
V-15 RF Heating Parameters /-50^
XXXV

Page
VI-1 Parameters for a Sinpie CCf. Module VI-8
VI-2 SCR Design Parameters fur EK Coil Invertt:r-ConvorterXetwork Design VI-22
VI-3 Energy Transfer and Storage Systems — Maximum
Ratings VI- 36
V1I-1 EPR Gas Load After Hum . , V1I-2
VII-2 EPR Toroidal Vacuum System Parameters VII-4
VII-3 Contribution to EPR Gas Load from First Wall ParticleCurrents During Burn VI1—4
VII-4 Cryosorption Pumping of Helium as a Function ofTemperature VI1-9
VII-5 Cryogenic Requirements for Thirty-Two 25,000 SL/s
(Hydrogen) Cryosorption Pumps VI1-9
VII-6 Neutral Beam Vacuum System Parameters V1I-14
VII-7 Cryogenic Requirements for 12 Neutral Beam
Injectors VII-14
VIII-1 Firs t Wall Design and Operating Parameters VIII-2
VIII-2 First-Wall Materials Selection VIII-17
VIII-3 Assessment of Water and Helium as Primary Coolantsfor an EPR VIII-30
VIII-4 Summary of Coolant Panel Heat-Transfer Analysisfor the Eight Panel VIII-33
IX-1 Summary of Blanket/Shield Design Parameters forthe ANL-EPR IX-2
IX-2 Dimensions and Material Compositions of the EPR InnerBlanket/Shield at Midplane IX-12
IX-3 Dimensions and Material Compositions of the EPR Outer
Blanket-Bulk Shield at Midplane IX-13
IX-4 Composition and Atom Densities of Lead Mortar . . . . IX-14
IX-5 Rates of Helium and Hydrogen Production in SeveralLow-Z Coating Materials IX-28
IX-6 Helium and Tritium Production Rates in Boron Carbidein the ANL-EPR Inner Shield = IX-36
xxxii

Page
IX-7 Tot,ai Neutron Fluxes in the Toroidal-Field Coils andBeam Ducts (normalized to a neutron wall loading of1 MW/in ) for three cases: (1) no penet ra t ions , \2)unshielded neutral beam ducts, and (3) pa r t i a l shieldof neutral beam duct .1X-48
1X-8 Torques on Typical Blanket and Shield Blocks JX-64
IX-9 Thermal Fluid Analysis for a PressuriEed w'ater CooledEPR Blanket Module JX-75
IX-10 Thermal Fluid Analysis for a Water Cooled EPR Shield
Block , JX-76
X-l Summary of Tritium Handling Fac i l i ty Parameters . . . . X-2
X-2 Summary of Operating Parameters for the EPR CryogenicD i s t i l l a t i o n Cascade X-14
X-3 Column Diameters and Liquid Holdup for Selected
Superficial Vapor Veloci t ies . X-17
X-4 Analysis of Recycle Flow Scenario . X-20
X-5 Analysis of Cyclic Flushing Scenario , X-20
X-6 Scrubber Plant Catalyst Cost Versus Clean-Up Require-ments Catalyst Operating Temperature and Flow Rate . . . X-23
XI-1 Plasma Diagnostic Requirements JCI-3
XI-2 Instrument Requirements for the Magnet Systems . . . . XI-10
Xl-3 Toroidal Magnet Alarm and Inter lock Actions 0(1-12
XII-1 Weights of Major Reactor Components X.II-14
XIV-1 Potent ia l Hazard Sources XIV-2
XIV-2 Specific Radioactivity in F i r s t Wall XJV-10
XIV-3 Biological Dose, in mrem/hr, After Shutdown Following
Two Years of Operation XIV-13
XV-1 Materials Requirement JCV-2
XV-2 Plant Capital Investment Direct Cost Estimate . . . . XM~3
XV-3 Project Manpower and Cost Prof i les JCV-5
XXXt/11

CHAPTER I
INTRODUCTION
The objectives vhich guided this EPR design evolved from technological
and programmatic considerations. Hie EPR should demonstrate the tech-
nological feasibility of tokamak power reactors. This requirement must
be reconciled with the current status and projected program in plasma
physics, the state-of-the-art and development requirements for the various
technologies, with the programmatic requirement for initial operation in
the mid-to-late 1980's or early 1990's, and with the resources which may
reasonably be expected to be available for the task. On the basis of these
considerations, the objectives shown in Table 1-1 were identified.
Table 1-1. EPR Objectives
• Operate at or near net electrical power conditions.
• Operate with a plant capacity factor of 25-50% for a designlifetime of 5-10 years.
• Demonstrate plasma confinement, stability, fueling, heating,control, etc. in the reactor regime.
• Demonstrate most fusion reactor technologies in a power reactorenvironment.
• Provide for materials irradiation testing.
• Demonstrate tritium breeding, advanced coolants and materials,and advanced blanket concepts in test modules.
Operation at or near net electrical-power conditions imposes four im-
portant secondary requirements upon the EPR. First, a D-T plasma must be
confined at or near ignition conditions. Second, the reactor thermal power
output must be several hundred megawatts. Third, the reactor must operate
with a significant duty cycle, probably ^ 50%. Fourth, sensible heat must
be removed from the blanket in a form suitable for conversion to electr^jcit;
vising conventional power cycle technology, with a reasonable efficiency,
probably 20-30%. These secondary requirements can be traded off against
each other, to some extent.
1-1
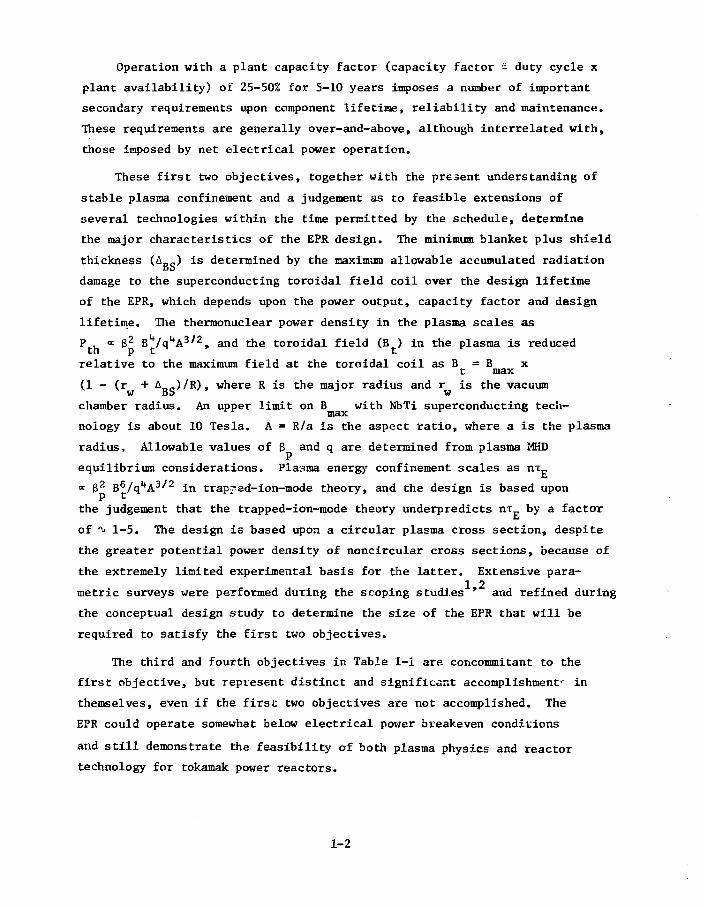
Operation with a plant capacity factor (capacity factor = duty cycle x
plant availability) of 25-50% for 5-10 years imposes a number of important
secondary requirements upon component lifetirae, reliability and maintenance.
These requirements are generally over-and-above, although interrelated with,
those imposed by net electrical power operation.
These first two objectives, together with the present understanding of
stable plasma confinement and a judgement as to feasible extensions of
several technologies within the time permitted by the schedule, determine
the major characteristics of the EPR design. The minimum blanket plus shield
thickness (dD?) is determined by the maximum allowable accumulated radiation
damage to the superconducting toroidal field coil over the design lifetime
of the EPR, which depends upon the power output, capacity factor and design
lifetime. The thermonuclear power density in the plasma scales as
P , = g2 B^/q^A3^2, and the toroidal field (B ) in the plasma is reduced
relative to the maximum field at the toroidal coil as B = B xt max
(1 - (r + AT)_)/R), where R is the major radius and r is the vacuumw oi> w
chamber radius. An upper limit on B with NbTi superconducting tech-T&3X
nology is about 10 Tesla. A = R/a is the aspect ratio, where a is the plasma
radius, Allowable values of 3 and q are determined from plasma MHD
equilibrium considerations. Plasma energy confinement scales as nxg
•x g2 B^/q^A3''2 in trapjsd-ion-mode theory, and the design is based upon
the judgement that the trapped-ion-mode theory underpredicts nx by a factor
of *v 1-5. The design is based upon a circular plasma cross section, despite
the greater potential power density of noncircular cross sections, because of
the extremely limited experimental basis for the latter. Extensive para-1 2
metric surveys were performed during the scoping studies ' and refined during
the conceptual design study to determine the size of the EPR that will be
required to satisfy the first two objectives.
The third and fourth objectives in Table 1-1 are concommitant to the
first objective, but represent distinct and significant accomplishment^ in
themselves, even if the first two objectives are not accomplished. The
EPR could operate somewhat below electrical power breakeven conditions
and still demonstrate the feasibility of both plasma physics and reactor
technology for tokamak power reactors.
1-2

An EPR which accomplish the first two objectives will represent a unique
test facility. Its utilization as such was considered a design objective,
albeit with the constraint that the primary design objectives were not com-
promised,
The EPR represents a considerable extrapolation in plasma conditions
beyond those achieved to date and those which are anticipated for the
"current generation" of tokamalt experiments — those which will be coming
on line in the next few years —- which must provide its plasma physics
design basis (see 'fable I~2). The reference design point is defined by a
reasonable set of assumptions about the plasma parameters, but provision
is made for operation with less favorable parameters. For example, supple-
mental beam heating is provided for operation in the bean-driven mode in
the event that the energy confinement turns out to be subigriition.
The EPR also represents a considerable extrapolation in many areas of
fusion reactor technology. The design philosophy in this regard was to
minimize technology extrapolations, consistent with accomplishing,!the £PR
objectives, while insuring, insofar as possible, that the necessary tech-
nology developments would be relevant to subsequent tokamak reactors.
Identification of R&D required for the EPR was a specific goal of the.design3 • •-! - :
study, and a separate report has been issued on this subject.
The general design philosophy was to develop an integrated design in•';
sufficient detail that the major design problems would be uncovered and
realistic solutions found. A balanced solution, in which the performance
requirements for the various systems represent roughly comparable demands
upon the respective technologies, was stressed for those design»problem!=
that involved two or more interacting systems. Special emphasis was placed
upon developing realistic and credible solutions to design problems, sub-
ject to the constraints imposed by the schedule on technology development.
1. W. M. Stacey, Jr., et al., "Tokamak Experimental Power Reactor Studies,"ANL/CTR-75-2, Argontie National Laboratory (June 1975).
2. W. M. Stacey, Jr., P. Bertoncini, J. Brooks, and K. Evans, "Effect ofPlasma Confinement and Impurity Level Upon the Performance of a D-TBurning Tokamak Experimental Power Reactor," ANL/CTR/T>^53, ArgonneNational Laboratory (August 1975).
3. F. E. Mills, et al., "Research and Development Required for the TokamakExperimental Power Reactor," ANL/CTR/TM-65, Argonne national Laboratory(May 1976).
1-3
biperinvnt
P1.T
T-10
!)-MI
- Pl« ~ " ^ =
JCT
TFTR
TFTRUpgrade
JT-60
T-20
: EPR
• • • • , ( ' " '
Mi j orRadiusK (ra)
1.3 o . r
1.5
2.96
2 ,,48
4-S,
3
. . / s -•
fcidiu*a (is)
0.45
0.40
0.45 ,.,(• • Mt.
if1.2J(« - 1.71
0.85
.3-4'
" 1°
2
Pjii.-iKvi ~
1'urrcnt• 1 (MA)
i . i
; s-°ii%0.9
"•4.8"
1.02.5
4-5
"V-. o 3 , ' 3 ^
6
•-.. I « lT«T.
Ij ,.fJ(fV)
' • \ "
:; J V2
5
2-4 .;
5
6b
5-10
7-iq.
' • • : : - . ^ ' •
Ikvnsitvn (m- ' }
"a ,^"'
: 2 '
4-i) ,
5 •
8 >4 <•
" , . r
2-10
, 1-5 >
1
1 „>
• -- -iS'tiirn
• fo-1"
. ,y)-'
%10'^
J
liricrgy('onfinonpnt -
iiir~&fici«ition
' 0# "*^
0.1
0.5
-- 0.3 =j
"Next Generation
• l O "
' 10"r%
• 1 0 ' ^
• -I?1'*
.. 1 *'" ,(
" ' 0 . 2
' 0.2-1
' 2
FlattopTime
'At fs)
1
1
1
15
11
5
10
5-20
jeporunentarspower Reactor
< 1(''° , ' 5-10 3r£(io;
lixperimcntalHarii ,„_
Available •"*;,
1976-77
1976-77
; 1978-79
1978-79
1981-82
1981-82 ,
1982-83 •'!
1985-84
Comments •=-•
71 *
Configurational stability — doublet.
Noncircular configurational stability.Oiverto?;impurity studies.
1-5 » 10J D-T pulses.lU '\ i '.'• ..• •
4 \ 1 0 3 D-T pulses.
Conjectural - no plans.
105 D-T pulses '" ' - ^ -';'..'

CHAPTER II
SUMMARY
An integrated conceptual design has been developed for a tokamak Experi-
mental Power Reactor (EPR) that would accomplish the objectives that were des-
cribed in the previous chapter. Whenever there was a choice of design options,
the conservative approach, with minimum technological extrapolation, was chosen
in order to develop a realistic design. This chapter summarizes the conceptual
design, including the performance evaluation and cost estimate.
A. Reference Design
The EPR is a tokamak with a major radius of 6.25 m and a circular plasma
of 2.1 m radius, which is designed to achieve ignition conditions with energy
confinement r\xv = 2.4 x lO21^ s/m3. Operating in a repetively pulsed mode, with
"v 1 pulse/min. and 'v- 75% duty cycle, the EPR is capable of producing 72 MWe gross
power and 30 MWe net power.
The design-basis performance objective of the EPR is to operate for 10 years
with a plant capacity factor of 50%. The plant capacity factor is defined as
the product of the duty cycle (75%) and the plant availability (67%).
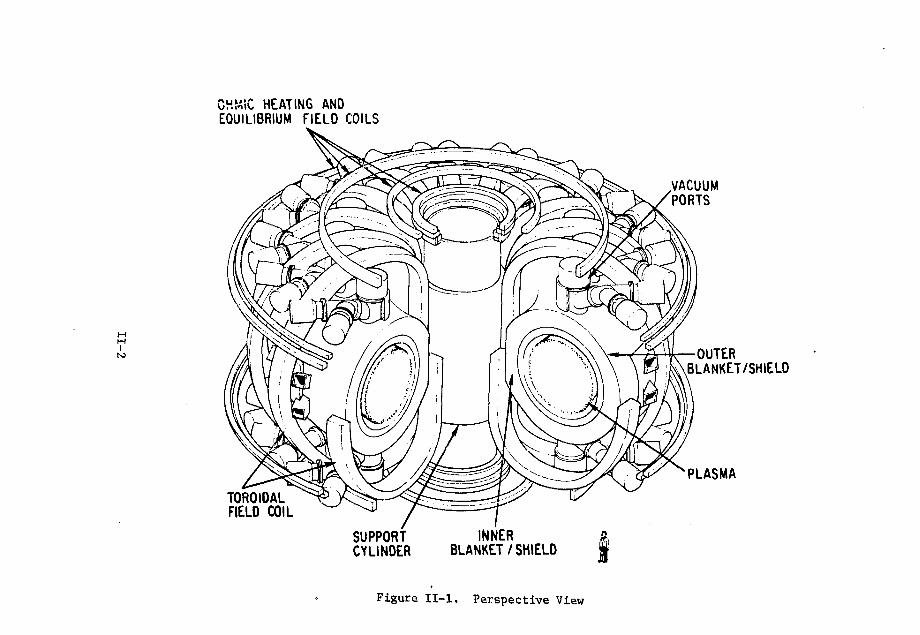
A perspective view of the EPR is shown in Figure II-l. The principal geo-
metric parameters a.r<? given in Table II-l and in the vertical section view shown
in Figure II-2. A detailed vertical section view is shown in Figure II-3, and
a plan view is shown in Figure II-4.
Surrounding the plasma is a stainless steel vacuum vessel with detachable,
beryllium-coated cooling panels mounted on the interior (plasma) side. An 0.28 m
thick blanket, assembled from 272 stainless steel blocks, surrounds the vacuum
vessel. Shield blocks, varying from 0.6 m to 1 m in thickness, surround the
blanket. The inner shield is constructed of alternating layers of stainless
steel and B C to achieve high radiation attenuation in a limited space. Thb
outer shield is constructed primarily of lead mortar and graphite. Special
local shielding around penetrations is constructed of stainless steel and B.C.
The first wall, blanket and shield are cooled by pressurized H.O and are sup-
ported from beneath by 16 frames.
A toroidal field at the center of the plasma of 4.47 T is provided by 16
cryostatically-stable, NbTi superconducting toroidal field (TF) coils operating
II-l
i-l
CHMiC HEATING ANOEQUILIBRIUM FIELD COILS
TOROIDALFIELD COIL T
SUPPORTCYLINDER
INNERBLANKET/SHIELD
VACUUMPORTS
OUTERBLANKET/SHIELD
PLASMA
Figure I I - l . Perspective View

Figure II-2. EPR Vertical Section Dimensions
TI-3
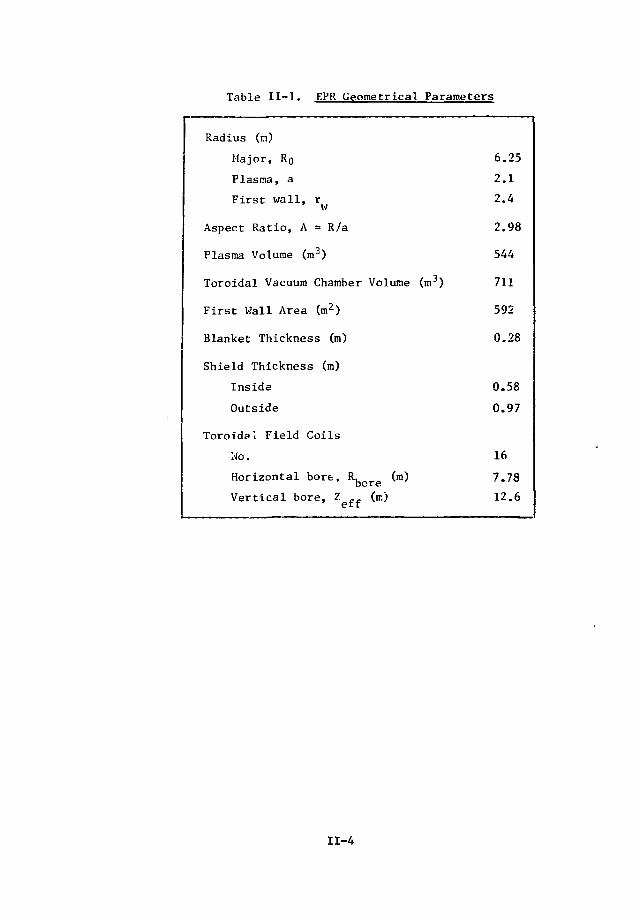
Table II-l. EPR Geometrical Parameters
Radius (n)
Major, Ro
Plasma, a
First wall, rw
Aspect Ratio, A = R/a
Plasma Volume (m3)
Toroidal Vacuum Chamber Volume (m3)
First Wall Area (m2)
Blanket Thickness (m)
Shield Thickness (m)
Inside
Outside
Toroidal Field Coils
No.
Horizontal bore, R, (m)
Vertical bore, Z (in)
6.25
2.1
2.4
2.98
544
711
592
0.28
0.58
0.97
16
7.78
12.6
II-4

I] ..
«AH-HT| n l BOO N 't j BORON C.V)WK .B.( >O L I A l ' W S U k^ S'AlNLi'.' SitFl OR >|tLUMINlj
Figure II-3. Detailed Vertical Section of EPR
II-5

Id I a -JL
II-6

I
r
at 3°K with a maximum fifcld in the coil of 10 T. The TF coils are supported
by an inner cryogenically-cooled support cylinder and by lower support legs and
are restrained against out-of-plane loads by a torque shell.
Cryostatically-stable, NbTi superconducting ohmic-heating (OH) and equilib-
| rium-field (EF) coils are located external to the TF coils. The OH coil system
consists of 10 ring coils and a central solenoid and is designed to provide
85 V-s to the plasma. The EF coil system consists of 16 ring coils and is de-
signed to provide 50 V-s to the plasma. The OH coils are designed to operate
at a peak field of 5 T, a peak field rise of 6.7 T/s, a peak current of 80 kA
and a peak voltage of 48 kV. Operating conditions for the EF coils are less
demanding. The OH solenoid and the inner OH and EF coils are supported by the
central pede.tal assembly, and the outer OH and EF coils are supported by the
external support assembly frame.
Water-cooled copper initiation-trimming (IT) coils are located in the
blanket close to the first wall. The IT coils provide 4 V-s in 10 ms to initi-
ate the plasma breakdown and are also used for fine control of the plasma
position.
.Supplemental plasma heating is provided by 12 neutral beam injector units
each consisting of two ion sources and two beam lines, which inject 60 MW of
180 keV D beams into the plasma for 'v 5 s. The beams are aimed tangentially
into the plasma in a symmetrical pattern of clockwise and counter-clockwise
injection. The injection system has a power efficiency of 34% or better. Pro-
vision is also made for launching 25 MW of rf power into the plasma through
four ports.
The toroidal vacuum chamber is evacuated to 10~5 Torr in < 15 s after a
burn pulse through 32 0.95 m diameter porrj, each of which is pumped by a 25,000
i/s cryosorption pump. The neutral beam injector vacuum conditions are main-
tained by 100 m2 of cryosorption panels per injector unit. Two sets of pumps
and panels must be provided to allow regeneration without shutdown.
Gigajoules of energy must be efficiently stored and transferred in the
plasma driving (OH/EF) and haating systems. A superconducting ring dipole
inductor is used as a central energy storage inductor (ESI) to store 3.2 GJ of
energy. Energy is transferred between the ESI and the EF coil by a three-phase
inductor-convertor (I-C) SCR bridge, and between the ESI and the neutral beam
11-7
injection system by a transfer network in which an I-C drives a high-frequency
polyphase rectifier. A separate inertial energy storage unit capable of storing
1200 MJ, consisting of radially-stacked, drum-type homopolar generators, is used
for the OH systera,with energy losses being made up from the central ESI. An
average power of 21 MW from the power grid to the ESI is required to make up
for energy losses in the plasma driving and heating systems.
The EPR will consume 16 kg of tritium annually and will have a plant in-
ventory of 1.5 kg. The fuel cycla system removes debris and nommetallic ele-
ments from the vacuum chamber xhaust, isotopically enriches the tritium by
cryogenic distillation, then stores and delivers the processed tritium to the
vacuum chamber.
The reactor complex consists of 11 major facilities covering 65,000 m2.
The reactor containment building is 73.2 m in diameter and 50 m high, con-
structed of 1.5 =i thick reinforced concrete with a 1 cm thick steel liner
forming a barrier against tritium escape.
The total direct cost of the EPR is estimated at $579 M. Adding 25%
each for engineering and contingency raises the total cost to $868 M.
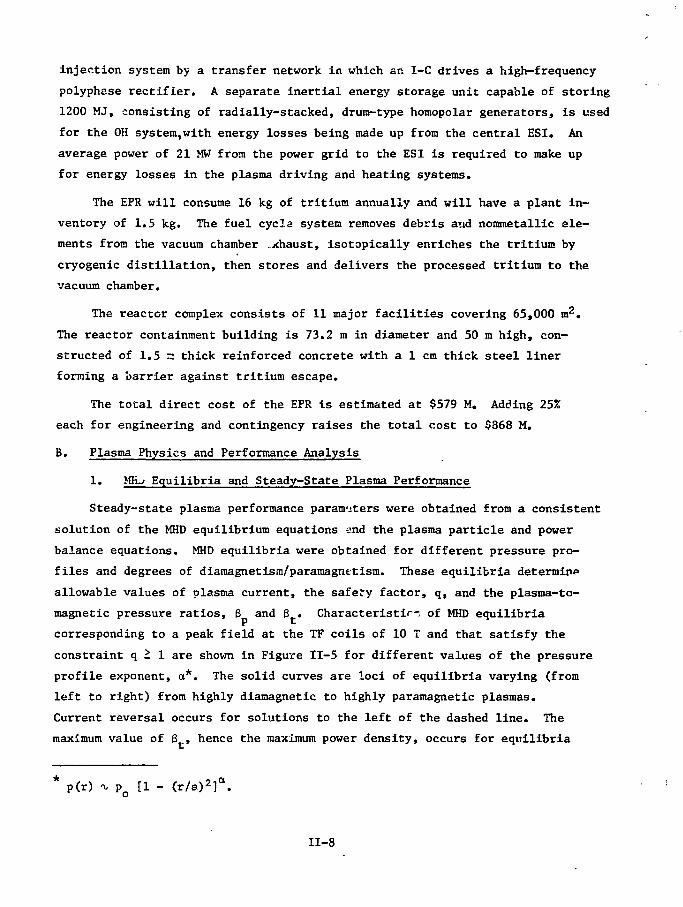
B. Plasma Physics and Performance Analysis
1. MIL; Equilibria and Steady-State Plasma Performance
Steady-state plasma performance parameters were obtained from a consistent
solution of the MHD equilibrium equations and the plasma particle and power
balance equations. MHD equilibria were obtained for different pressure pro-
files and degrees of diamagnetisin/paramagnttism. These equilibria determine
allowable values of plasma current, the safety factor, q, and the plasma-to-
magnetic pressure ratios, 3 and (5 . Characteristic-, of MHD equilibria
corresponding to a peak field at the TF coils of 10 T and that satisfy the
constraint q - 1 are shown in Figure II-5 for different values of the pressure
profile exponent, a*. The solid curves are loci of equilibria varying (from
left to right) from highly diamagnetic to highly paramagnetic plasmas.
Current reversal occurs for solutions to the left of the dashed line. The
maximum value of Q , hence the maximum power density, occurs for equilibria
* P(r) * Po [1 - (r/a)2]a.
II-8

0.10,
0.081
0.061
0.041
0.021
o.oo!
J t < 0 SOMEWHEREw
/
w
a = B = 1 . 0
J t > 0 EVERYWHERE
Ip. MA
Figure II-5. MHD Equilibria at B = 10 T — Total Betamax
Tb T5

slightly less diaraagnetic than those for which current reversal occurs. Thus,
the dashed line represents a locus of "optimal" solutions — the value of
6 along this locus is confined to a rather narrow range of 1.8 2 6 £1.6.P P
The safety factor evaluated at the plasma surface, q(a), increases with the
degree of peaking in the pressure profile (i.e. with increasing a). The
reference design point was chosen by selecting the pressure profile whose
optimum solution has q(a) = 3.0, a value below which confinement has experi-
mentally been found to deteriorate.
Steady-state plasma parameters corresponding to the reference design MHDTFC
solution of Figure II-5, and. a similar solution for B = 8 T, are given ininfix
Table II-2. A wide range of performance parameters is possible, corresponding
to the range of MHD equilibria depicted in Figure II-5, and to the range of
operating temperatures and values of energy confinement that may be obtained.
Extensive analyses were performed to insure that the parameters shown in
Table II-2 are representative of the range of plasma conditions that may be
obtained in EPR. With supplemental beam heating, the power output is not
jeopardized by the possibility of subignition energy confinement.
2. Transient Performance
Requirements on the plasma drivi.ig and heating systems and the power per-
formance characteristics are determined from burn cycle dynamics simulations
of the plasma, the ohmic-heating (OH) and equilibrium-field (EF) coil systems,
and the neutral-beam injection system. The basic burn cycle is depicted sche-
matically in Figure II-6, where the times correspond to the reference burnTFC
cycle. The plasma conditions of the reference case at B = 10 T (see Table
II-2) are approximated during the burn (flat-top) phase, and the dynamics cal-
culations are constrained by the limit 6 1 B = 1.71.P P
A variety of startup procedures were simulated in order to determine a
compromise among several conflicting economical and technological limitations.
The critical parameters that, to some, extent, can be traded-off against each
other are: (1) energy transfer from the homopolar Oh supply (U Q H); (2) peak
power required from the EF supply (?„-); (3) total energy drawn from the
energy storage unit for beam heating (Un_); (4) maximum rate of change of the
field in the OH coil (Bnu); and (5) maximum field in the OH coil (B.,,).
Initiation of beam heating midway through the OH current reversal, thereby
11-10

Table II-2. Steady-State Plasma Parameters — Reference Design
Poloidal beta, (3
Total beta, B
Safety factor
Magnetic axis, q(0)
Plasma surface, q(a)
Plasma radius, a (m)
Aspect ratio, A
Average temperature T (keV)
Effective ion charge, Z ._
Confinement for ignition, nt (s/tn3)t.
TPCPeak field at TF coils, B (T)
wield at centerline, B (T)
Plasma current, 1 (M.ijp
Average D-T ion density, n _ (m~3)
Power output, P (MW)
Neutron wall load, P (MW/m2)w
Ratio of nTg required for ignition
to TIM value of ntg, <*„,_,
10.0
4.47
7.58
9.4 x
638
0.86
1.0
1.7
0.048
1.00
3.05
2.1
2.98
10
1.3
2.4 x
1019
10 2 0
8.0
3.58
6.06
6.0 x io19
261
0.35
4.0
11-11

i : < | u i 1 i h r i n n i K i i ' l e l C u r r i ' i i t
OH
P l a s m a Down _ | ^Time
I. U
Cliaraber hvacuat loiiiand Preparations ;for Nuxt Pul.si; L
I . . . R amp U p
|
H.iKir Uurn
Beam Hi-atlng Burn
1 R am[> Down .
Sliutdnwn Phase
Heat ing ~ j
J0 1
Timi', s
i'j
Figure II-6. Burn Cycle Scenario

reducing resistive losses during startup, was found to be beneficial. The
time of the OH current reversal, Atnu, is an important factor in determining
the requirements of the plasma driving and heating systems, as indicated in
Figure 11-7. On the basis of these results, At... = 2 s was chosen for theOil
reference case. The sffects of varying beam power and of uncertainties in
plasma resistivity and oxygen impurity concentration were analyzed in a
sitpilar manner. As a result of these extensive studies, the maximum require-
ments shown in Table II-3 were identified.
The reference burn cycle was analyzed in detail. This cycle was initi-
ated by the OH current reversal in the interval 0 £ t £ 2 s. Neutral beam
power, P_ = 60 MW, was injected in the interval 1 i t i 5.77 s. The burn
pulse terminated due to the accumulation of He and wall-sputtered Be impurities
at t = 55 s. Various power components in the plasma are shown in Figure 11-8;
P is the neutron power, P is the radiation (line, recombination, bremsstrah-
lung and cyclotron) power, and P_ is the power conducted or convected to the
wall.
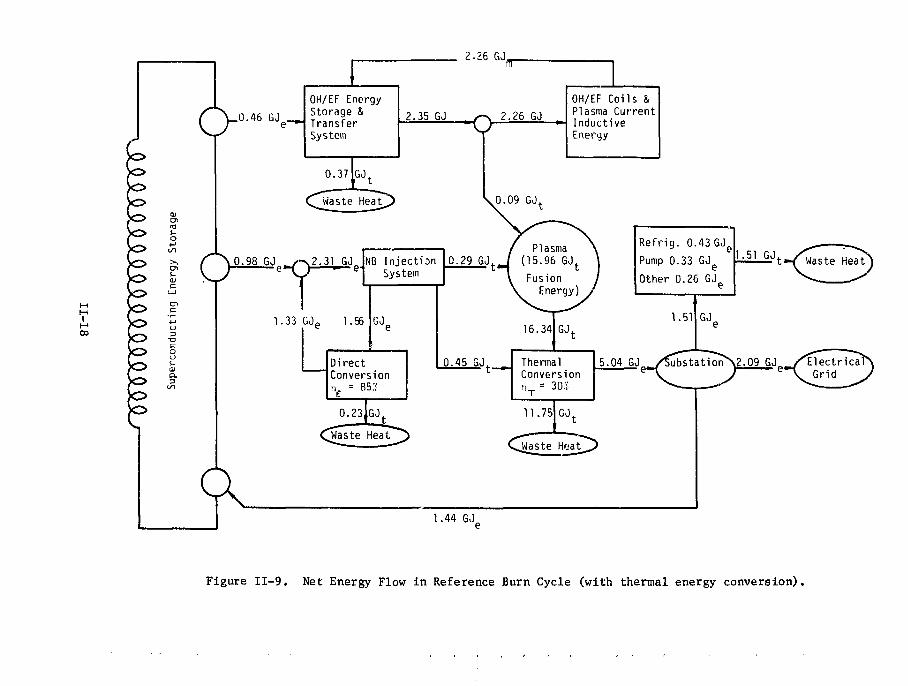
An energy balance on the entire system is given in Table II-4, and the
net energy flow is shown schematically in Figure II-9. A total of 16.34 GJ
of energy is incident on the first wall; of this, 15.96 GJ is produced by
fusion and 0.38 GJ results from beam and ohmic heating of the plasma. An
additional 0.45 GJ of thermal energy is recovered from the beam injection
system, so that 16.79 GJ of thermal energy is available for conversion to
electricity. With a conversion efficiency r|T = 30%, this would result in 5.04
GJ of electrical energy. Deducting the 2.95 GJ of electrical energy required
to run the plant — 1.51 GJ to run the auxiliary systems and 1.44 GJ to jsake
up deficits in the energy storage system caused by energy losses in the
injection (0.9S GJ) and 0H/EF (0.46 GJ) systems — results in 2.09 GJ net
electrical energy. Averaging this over a 70 s operating cycle (a 55 s burn
plus a 15 s replenishment period) results in a net electrical power of 29.9
MW. The EPR may well operate without a thermal conversion system, in which
case 2.95 GJ per cycle, or a continuous power of 42.1 MW, is required from
the electric power grid.
Burn cycles shorter than 55 s can be achieved either by injection of a
high-Z gas to radiatively cool the plasma or by termination of refueling.
H-13

" • \ \
: CASE
PEF
P (GW) U (GJ) B (T/s) B (T)
0.6 —
0.5 —
Ik"•y
6.3 —
0.2 —
0.1 —
so —i
1.2 —
1.0 —
0.8 —
0.6 —
0.1 —
0.2:: —
0 —
ID- —
8 ~
6 —
1 —
2 —
0 ^
— 0.6 — 6 — 3
— 0.4 — H —12
OH Reversal Time, At , s
Figure I I - 7 . Effect of OH Current Reversal Time on Plasmaf-irJriving and HeatingSystem Requirements : - •&
1 1 - 1 4

Table II-3. Plasma Driving and Heating System Maximum Requirements
Ohmic 1 eating Coil System
Volt-seconds to plasma
Peak field, B Q H (T)
Maximum field rise, B (T/s)Orl
Maximum voltage, V n H (kV)
Maximum current, I,.., (kA)OH
Maximum power required, P (MW)
Maximum energy transfered, U (MJ)OH
Minimum current reversal tine, £tn (s)OH
Equilibrium Field Coil System
Volt-seconds to plasma
Maximum-voltage, V_ (kV)
Maximum current, I" (kA)
Maximum power required, P__ (MW)
Maximum energy transfered, U_ (MJ)
Neutral Beam Injection System
Deuteron energy (keV)
Power to plasma, P (MW)a
Energy to plasma, U (MJ)D
Energy from energy storage, U (MJ)
85
5,0
I 6,7
51
80
1900
1200
2
50
21
80
420
1500
180
60
300
1000
11-15

400 -
50 55
Figure II-8. Power Components During Reference Burn Cycle
11-16

Table II-4. Energy Balance — Reference Case Burn Cycle
Thermonuclear energy produced
Energy input to plasma
Beam injectionOhmic heating
Energy to first wall
NeutronsTransportRadiation
Thermal energy from injectors
Electrical energy produced (TU = 30%)
Electrical energy required
Makeup to energy storageAuxiliaries
Net electrical energy
Waste heat to environment
AuxiliariesOH/EF systemNB direct conversionThermal conversion
Waste heat rejected to environment,average over operating cycle
Electrical power required to operate EPR
Gross electrical power
Averaged over burn cycle, At = 55 s
Averaged over operating cycle, At = 70
Net electrical pother
Averaged over burn cycle, At = 55 s
Averaged over operating cycle, At = 70
0.290.09
78%13%9%
1.441.51
1.510.370.2311.75
s
s
GJGJ
GJGJ
GJGJGJGJ
15
0
16
0
5
2
.96 GJ
.38 GJ
.34 GJ
.45 GJ
.04 GJ
.95 GJ
2.09 GJ
13.86 GJ
198 MW
42.1 MW
91.6 MW
72.
38.
29.
0 MW
0 Mtt
9 MW
11-17
IM00
S_
o
01Q.
I/)
2-26 GJ.
OH/EF EnergyStorage STransferSystem
0.37
2.35 GJ•o 2.26 GJ
GJ.
(^Waste HejaT)
OH/EF Coils &Plasma CurrentInductiveEnergy
.0.09 GJ
0.98 GJ 2.31 GJ NB InjectionSystem
1.33 GJO 1.56 GJ
DirectConversionnt. = 85%
16.34
0.45 GJL 1
GJt
ThermalConversionn T = 30?.
0.23JGJ• &
'Waste Heat
11.75 GJt
Refrig.
Pump 0.
Other 0
1.
0
33
43GJ
.26 G
SI GJ
e
e
1.51 GJ
5.04 GJ /5ubstation\2.09 GJ,_/Electrica
1.44 GJ
Figure II-9. Net Energy Flow in Reference Burn Cycle (with thermal energy conversion),

Longer burn cycles can be achieved by using supplemental beam heating to main-
tain thermonuclear temperatures, the required beam power increasing with time
to offset the accumulation of He and wall-sputtered Be. It is assumed that
the plasma density can be maintained by a combination of recycling from the
wall and refueling, but limited operation without refueling appears feasible.
The power performance with only recycling, with recycling and refueling
(reference case) and with supplemental beam heating, is shown in Figure 11-10
as a function of the burn cycle length. The required supplemental beam power
increases with time to a maximum of 35 MW for a 95 s burn pulse. An increase
of as much as 30% in net electrical power, relative to the reference case,
can be achieved by using supplemental beam heating to extend the burn.
3. Plasma Initiation
The time development of the plasma at the initiation of the discharge
has been studied. A small plasma (a = 0.35 m) will be created at the center
of the chamber (R = 6.25 m) by a toroidal electric field. Certain features of
the initiation are illustrated in Figure 11-11. The driving voltage, VTOOP»
produced by the changing flux in a special startup coil rises in about 2 is to
500 V, and holds for ^ 6 ms. In the first 1.2 ms, the electron avalanche
converts essentially all the neutral gas in the chamber to plasma. As soon
as the electron density is sufficiently large, the plasma current starts to
rise and ohmic heating occurs. When the plasma heats up, the resistance drops
and it becomes possible to maintain the plasma current with a reduced voltage.
A discharge with a plasma current of 115 kA and an electron temperature of
^ 130 eV can be maintained with a voltage of 28 V.
The voltage induced by the sinusoidal OH current reversal should reach
25 to 30 V at about 0.3 s; thus, the special startup coil should be pulsed
about 0.3 s after the initiation of the OH current reversal, forming the
plasma at this time. Creatir.g the plasma at 0.3 s will waste only about 4 V-s
of the OH inductive flux. After the plasma is created and the OH and EF coils
are providing the driving voltage, additional gas can be added to the chamber
and the plasma radius and current can be increased simultaneously.
C. Magnet System
The EPR magnet system consists of the toroidal-field (TF) coil system
and the polcidal-field coil system. These coils interact with one another
11-19

I
O
60
50
40
30
20
10
0
-10
-20
-30
-40
-50
-60
/ s*20 / /30
^-NO
140
REFERENCE CASE
REFUELING
50 60
BURN CYCLE, S
WITH
1
70
SUPPLEMENTAL" —
I
80
BEAM
i
90\
100
Figure 11-10. Power Performance as a Function of Operating Mode

0 L _
0.1
0.01
1 I. 1
I / ^ POWER/ / FROM \%
1 \ 1 1
1~ •
^
LOSSOXYGEN
P0H
N
1
- • — - .
^ \ . —
\
I
TIME, ms
10
Figure 11-11. Plasma Breakdown — Normal Start-up Cycle
12
11-21

during operation and also interact with the other systems of the EPR. The
magnet system design was developed in sufficient detail to evaluate problems
in the construction and operation of EPR magnets.
1. Toroidal-Field (TF) Coils
The TF coils use NbTi as the superconductor because of its good ductility
and proven performance in large magnets. The toroidal fisld strength should
be as high as practical in order to enhance the plasma confinement and boost
the power performance. A peak field of 10 T can be achieved with a large
amount of superconductor at 4.2°K or with much less superconductor at 3°K.
It is more economical to operate the 10 T TF coil at 3CK because the difference
in refrigeration cost is much smaller than the difference in the cost of the
superconductor. The problem of refrigeration at temperatures lower than 4.2°K
for large systems was evaluated. The TF coils will achieve 10 T peak field at
3°K and 8 T peak field at 4.2°K with about 0.5°K temperature allowance for
each case; 8 T is the minimum goal and 10 T is the maximum goal in the TF
coil design.
A TF coil system, consisting of 16 pure-tension "D"-shape coils with a
horizontal bore of 7.78 m, provides adequate space for the vacuum chamber,
blanket and shield, provides adequate access for assembly and repair, and has
a satisfactorily small maximum field ripple of 1.3%. The TF coil syst ra is
summarized in Table II-5, and depicted schematically in Figure 11-12.
The superimposing field on the TF coils from the poloidal coils was found
to be the most troublesome factor in the TF coil design. The out-of-plane
load is large and creates serious problems for the structural design as well
as a threat to the coil stability from bending moments and shear stresses in
the coil structure. Moreover, unacceptably large ac losses will occur in the
TF coil unless either the conductor is made of cable or the coil is shielded
against changing fields. Both of these possibilities were evaluated.
The sponginess of cable conductor threatens coil structure integrity. In
addition, cabling the conductor does not overcome all ac losses; changing the
parallel field still couples filaments in a single strand. These ac losses,
proportional to the conductor length, are still unacceptably large and the
conductor stability is very poor. One possible solution is periodic twist-
pitch reversal, but this is as yet only a hypothesis.
11-22

TabJe II-5. Toroidal Field Coil System
Superconductor/Stabilizer/Insulator/Support
No. of c-ils
Coil shape
Field ripple (%)
Maximum access (n)
Peak fi«ld (T)
Bore (ra;VerticalHorizontal
Field in plasma, B (T)10 T peak field8 T peak field
Stability
Teraperature allowance (°K)
Conductor design
Cooling
Operational current (kA/turn)
Stored energy (CJ)TotalCoil
Inductance (H)TotalCoil
Ampere-turns (MAT)TotalCoil
Turns/coil
Mean turn length (m)
Total conductor Ipngth/coil (A-in)
Coil we(ght/coil (Ton)
Coil and bobbin cross section (tir}
BobbinMaterialThickness (cm)
Winding cross section (ra2)
Average current density (A/cm2)Over bobbin and coilOver coll windingOver ccpper
Smallest radius of curvature atM O T field region (m)
Average hoop for«~.,/turn (lb>
Average turn cross sect ion (cm )
Cross section ratio, SS/Cu
Overall average stress (psi)Stainless sEi»elCopper
Length of straight segment (m)
Compressive pressure (psi)
Ciicuirferential stress (psi)
Refrigeration power (MW)
Nb-TI/Cu/fiberglass epoxy/SS
16
Pure tension
Rjij x 2.45 in
R20 - 11.1 n
1.3
--3
10 ? 3°K8 ? 4.2°K
12.67.78
4.323.46
Cryoscatic
0.5
Mono lienic
Pool boiling
301.875
16.71.04
1348.37
70 • 2
36
151.2 - I0£
•ooa
0.619
316 SS1.25
0.572
135214633660
1.98
133 • 10s
40.6
M.5
26,00014.500
8.56
7660
<74,000
14.1
11-23
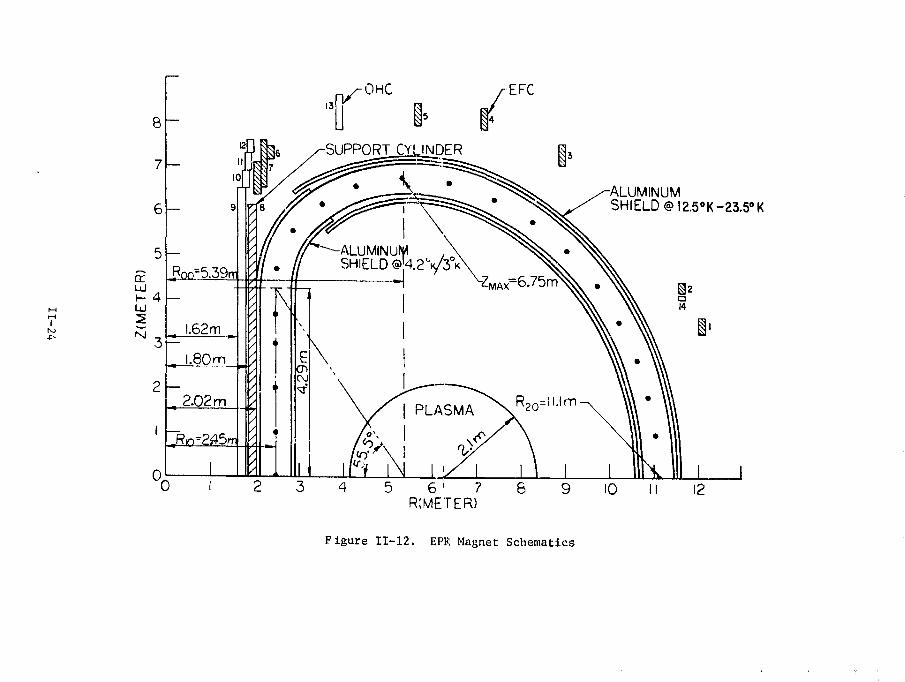
EFC
ALUMINUMSHIELD @I2.5°K-23.5°K
SUPPORT CYLINDER
05 6 ' 7
R:METER>10 II 12
Figure 11-12. EPR Magnet Schematics
For the EPR, the option of a field shield was chosen. It was found that
an aluminum shield operating at a mean temperature of 18°K is a reliable means
of overcoming the varying field superimposed by the poloidal-field coils and
plasma. Detail analyses of ac loss in field shields, the out-of-plane load
and dc field soaking were completed. A summary of the heat dissipation in the
TF coils is shown in Table II-6. Superconducting shields were also considered,
but were not adopted because their use would require considerable development
work.
With the coils shielded, a monolithic conductor can be used. A conductor
0.5 cm thick and 30 to 50 cm wide has been chosen as the reference conductor.
It will carry a current of 60 kA. Each TF coil will consist of two jelly-
rolled windings side by side with a central rib between them, as shown in
Figure 11-13. The combination of the central rib and the flat conductor with
one turn per layer makes a strong structure with good transfer for hoop stress
and centering force, good mechanical stability, good rigidity against out-of-
plane load and assurance of cryogenic stability for the TF coils.
Coil protection is also facilitated by this conductor design with a high
current and relatively few turns. During a rapid (8-1/2 minute) discharge,
the voltage between neighboring turns will be low; and even the maximum vol-
tage with respect to ground can be limited to 2,000 V.
The TF coils i.iust: be operated in series at all times; otherwise unequal
currents in different coils could create large forces and torques between
coils and large bending moments in each TF coil, even if the TF coil is in
pure-tension shape. These would produce catastrophic damage to the TF coil
system.
The TF coil geometry is of a pure-tension shape. Because the stresses
with the pure-tension shape are so dramatically lower than those with other
shapes such as a circle, an oval or the simple D, it was feared that a small
deviation from the correct shape, as might occur during construction, might
introduce large stresses, forces and torques. To study that possibility, the
effects of five kinds of fabrication errors were calculated. Distortions of
5 cm from the ideal shape or displacement of 2 cm vertically or radially
introduces nonuniform hoop tension. Of the. angular deviations considered, a
11-25
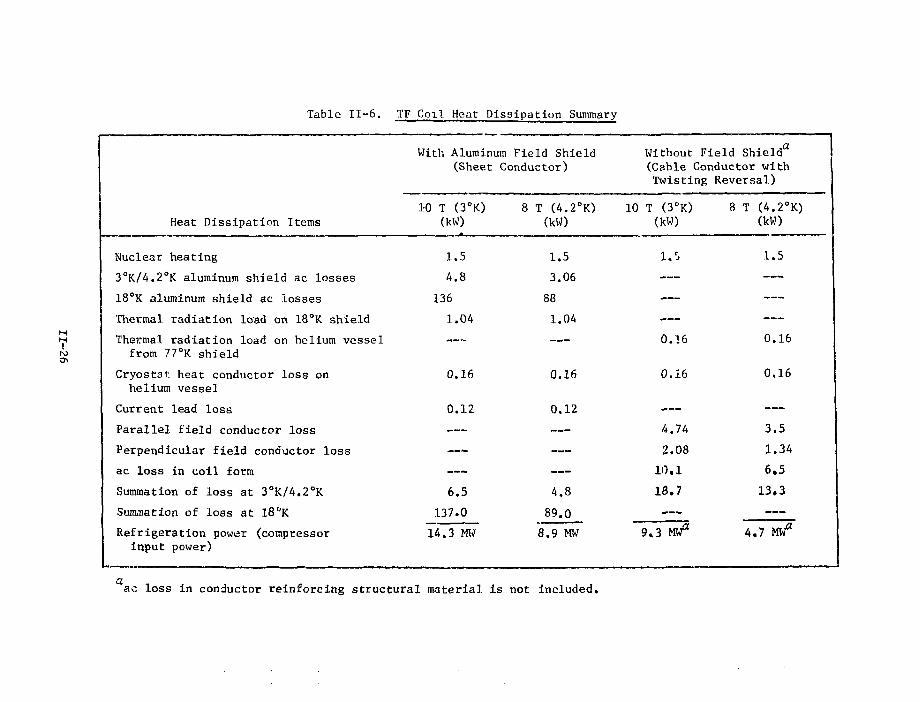
Table II-6. TF Coil Heat Dissipation Summary
Heat Dissipation Items
Nuclear heating
3°K/4.2°K aluminum shield ac losses
18°K aluminum shield ac losses
Thermal radiation load on 18°K shield
Thermal radiation load on helium vesselfrom 77°K shield
Cryostat heat conductor loss onhelium vessel
Current lead loss
Parallel field conductor loss
Perpendicular field conductor loss
ac loss in coil form
Summation of loss at 3°K/4.2°K
Summation of loss at 18*K
Refrigeration power (compressorinput power)
With Aluminum Field Shield(Sheet Conductor)
10 T (3°!O(kW)
1.5
4.8
136
1.04
0.16
0.12
6.5
137.0
14.3 MW
8 T (4.2°K)(kW)
1.5
3.06
88
1.04
0.16
0.12
4,8
89.0
8.9 MW
Without Field Shield^(Cable Conductor withTwisting Reversal)
10 T (3°K)(kW)
I.'J
0.16
0.16
4.74
2.08
10.1
18.7
9.3 M?
8 T (4.2°K)(kW)
.1.5
0.16
0.16
3.5
1.34
6.5
13.3
4.7 mf
ac loss in conductor reinforcing structural material is not included.
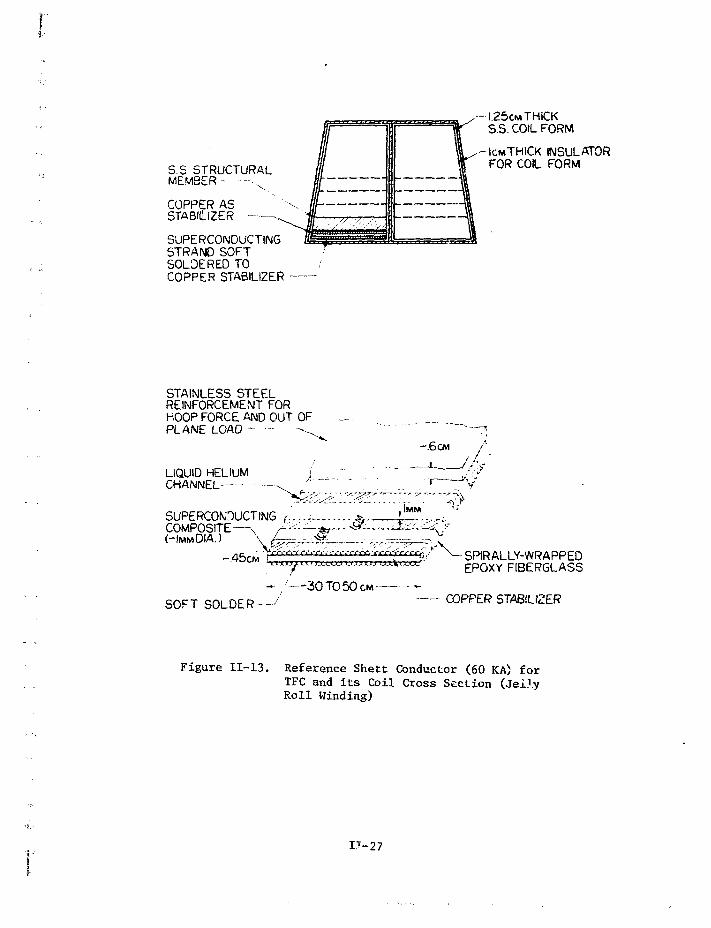
S.S STRUCTURALMEMBER- -
COPPER ASSTABlipZER
SUPERCONDUCTINGSTRAND SOFTSOLDERED TOCOPPER STABILIZER
1.25CM THICKS.S. COIL FORM
ICMTHICK INSULATORFOR COIL FORM
STAINLESS STEELREINFORCEMENT FORHOOP FORCE AND OUT OF __ ___PLANELOAD- -~ - - ^ - . - . - - - — . ^
- .6CM
LIQUID HELIUM j . " "* (^CHANNEL — \ ' " r 'V
SUPERCO^UCTINGCOMPOSITE — N(-IMMOIA.) \ (-—-r^<**^.^z,•-,;.,.•—-^_r-.^
~.45CM i ^v"•<~'"''^:"•-.•.-.-<v.v»^»-<yiwffft/X_SPIRALLY-WRAPPED•-.^^.,^^.,^.^0,,,..^- EPOXY FIBERGLASS
- ' — 3 0 TO 50 CM -«-SOFT SOLDER — / C 0 P P E R STABILIZER
Figure 11-13. Reference Shett Conductor (60 KA) forTFC and i t s Coil Cross Section (Jei.lyRoll Winding)
17-27

rotation of 0.5° in the toroidal direction had the greatest effect — an
inter-coil force of about 4 x 10⁵ kg/m is generated.
The radiation shield is designed to protect the TF coils from nuclear
heating and radiation damage. The nuclear heat load is 1.5 kW, which is
negligible in comparison with other heat dissipation in the TF coils, as
shown in Table II-6. The copper stabilizer is designed to tolerate a ra-
diation-induced resistivity of 1.5 * 10~8 ft-cm. The shield is designed so
that this value occurs after 2.5 MW-yr/m2 integrated, first-wall neutron
load, which corresponds to 10 years of operation at iihe nominal wall load of
0.5 MW/m2 and a 50% capacity factor. The aromatic-base epoxy insulator in-
side the conductor receives a dose of 3.5 x 10⁸ rads at the design lifetime
integrated wall load of 2.5 MW-yr/m2 — this dose is safely below the range
109 - 10 1 0 rads at which the properties of the insulator are thought to de-
grade, although there are few data to support this conclusion.
2. Poloidal-Field Coils :
The polbidal-field coils present problems different from those of the TF
coils, but equally challenging, the poloidal-fitld coils consist of the
initiation-trimming (IT) coils, the ohjnic-heating (OH) coils and the equilib-
rium-field (EF) coils. The OH coils and the EF coils are superconducting and
are located outside the TF coils ias shown in Figure 11-12. The smaller IT
coil system is made of water-cooled copper and is located near the first wall.
The IT coils initiate plasma discharge by delivering 4 V-s in 10 ms. The
field from the IT coils can also be used to trim the plasma position.
Although the OH coils serve as the transformer primary for producing the
plasma current and the EF coils provide equilibrium for the plasina, both coil
systems have nearly identical problems, e.g. large stored energy, high opera-
tional current, rapid charging and discharging and ring coil configuration.
For this reason, the conceptual design of the eight pairs of EF coils and
six pairs of OH coils were carried out together.
The design requirements',for the OH and EF coil systems were specified as
a result of a detailed trade-off study and are summarized in Table II-3,
Burn cycle dynamic simulations of the plasma, the coupled OH and EF systems
and the plasma heating systems were performed. Free-boundary plasma MHD
11-28

Iequilibrium calculations were utilized in the design of an equilibrium field
that would produce the circular plasma.
Characteristics of the OH and EF coils are given in Table 11-7. The OH
coils and EF coils both have a maximum operational current of 80 kA sup-
plied by two parallel 40 kA cables with fully transposed strands. The OH
coils have 837 turns in each parallel path; the EF coils have 464. The
charging voltage for the OH coils is 48 kV and the turn-to-turn voltage is
about 60 V. The charging voltage for the EF coils is 21 kV and the turn-to-
turn voltage is about 50 V. In the helium gas environment, the minimum
turn-tb-turn separation must be about 0.3 mm.
Multilayer coils would require large gaps between layers and present an
awkward: probj^t11 for coil design, especially for the long OH solenoids. There-
fore, each coil will be wound with a single-layer conductor 15 cm wide. The
40 kA cable design is illustrated l(in Figure 11-14.
The EF coils and OH coils will be cooled by helium pool boiling at 4.2°K,
1 atm pressure. Pool boiling is simple, inexpensive, reliable and easy to con-
trol. Above all, a rather small heat transfer flux is adequate to remove the
conductor :ac losses if the helium bubbles can be properly vented to avoid bub-
ble accumulation within the winding. Under this circumstance, the heat
transfer flux ceases to be an important factor in determining the coil sta-
bility; instead the coil stability depends on the conductor current density,
the amount of liquid helium surrounding the conductor and the extent of coil
disturbances.
The equilibrium,field must penetrate the blanket and shield to act on the
plasma, but the blanket and shield are about a meter thick and consist mostly
of metal such as stainless steel. Eddy currents in this material would
distort the equilibrium field and delay its penetration if the blanket and
shield were not sufficiently segmented. For a blanket and shield design of
16 segments, each made of 43 blocks, field distortion or time delay will be
reduced to an insignificant level.
3. Structural Support
Two structural support concepts, a torque shell and a torque frame, were
developed.* The torque shell design uses shear webs located between the TF
* This work was performed by McDonnell-Douglas Astronautics Company-East incollaboration with ANL.
11-29
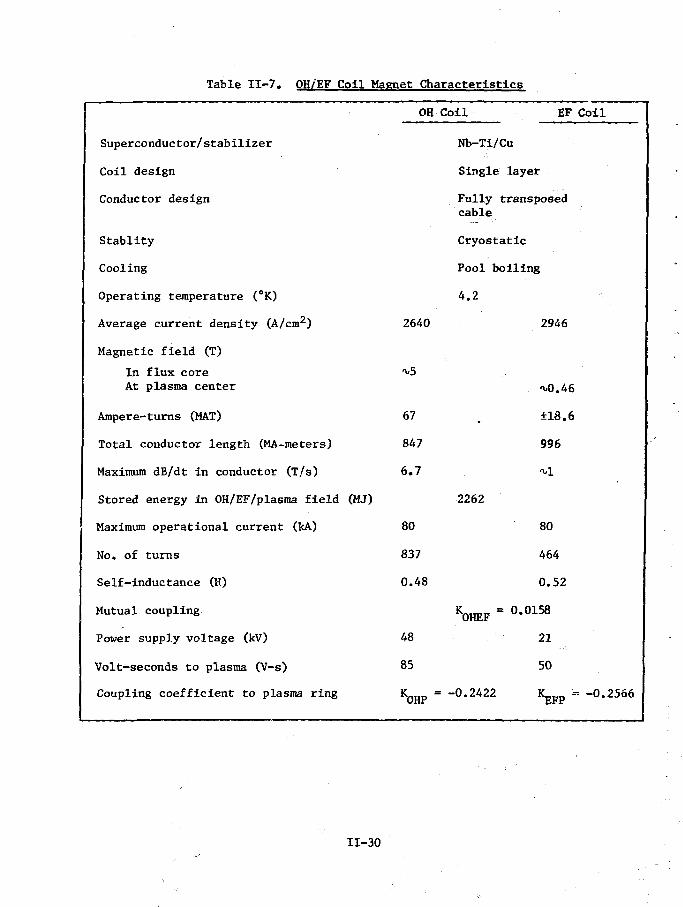
Table II-7. OH/EF Coil Magnet Characteristics
Superconductor/stabilizer
Coil design
Conductor design
Stablity
Cooling
Operating temperature (°K)
Average current density (A/cm2)
Magnetic field (T)
In flux coreAt plasma center
Ampere-turns (MAT)
Total conductor length (MA-meters)
Maximum dB/dt in conductor (T./s)
Stored energy in OH/EF/plasma field (MJ)
Maximum operational current (kA)
No. of turns
Self-inductance (H)
Mutual coupling
Power supply voltage (kV)
Volt-seconds to plasma (V-s)
Coupling coefficient to plasma ring
OH
2640
-v5
67
847
6.7
80
837
0.48
48
85
KOHP
Coil EF Coil
Nb-Ti/Cu
Single
Fully
cable
layer
transposed
Cryostatic
Pool boiling
4.2
2262
K0HEF =
= -0.2422
2946
-x-0.46
±18.6
996
-x,l
80
464
0.52
• 0.0158
21
50
K E F p •- -0.2566
11-30
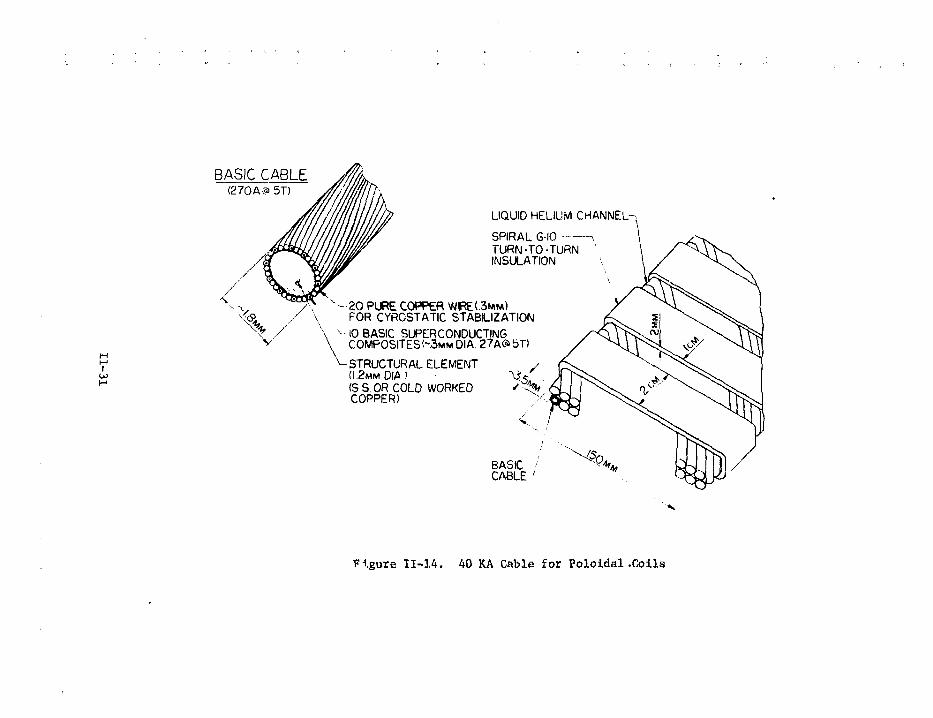
BASIC CABLE
LIQUID HELIUM CHANNEL-
SPIRAL G-IOTURN-TO-TURNINSULATION
\
i
2 0 PURE COPPER W R E ( . 3 M M )FOR CYROSTATIC STABILIZATION
10 BASIC SUPERCONDUCTINGCOMPOSITES <~.3MMDIA. 2?A6>5T)
-STRUCTURAL ELEMENT(1.2MM DIA.)
(S S OR COLD WORKEDCOPPER)
BASICCA8LE '
Figure 11-14. 40 KA Cable for Poloidal .Coils

coil cryostats to provide continuous support for the coil and to cancel the
induced torques. This design provides the lightest weight design but requires
removal of the shear web panels to permit access to the blanket and shield.
The torque frame concept uses a frame at the top and bottom of the reactor to
transfer the TF coil loads to the reactor building wall and floor, respectively.
Both concepts provide blanket and shield access through an approximately 3 by
8 m opening between TF coils. Very little access, if any, will be available
from above and below the TF coil because of required structure. Openings for
vacuum ducts and instrumentation, however, can be provided through this struc-
ture. The floor area around the reactor will not be restricted by structural
members with either concept, thereby providing for ease of locating components
such as neutral beam injectors and for freedom of movement for maintenance
equipment- The outer snd upper poloidal coils can be removed using their
supporting structure as a lifting fixture, and the combined weight is com-
patible with planned crane capacity. The lower poloidal coils are captivated
by the various support columns and require an in-place repair/replacement
facility, which was conceptually included in the design. Use of 7075-T6
aluminum alloy joined by bolting, results in a substantially lighter and lower
cost structural support design than can be achieved using welded stainless
steel. The torque shell concept has been tentatively chosen as the reference
option.
D. Plasma Heating
Supplemental heating, in addition to ohmic heating, is required to heat
the EPR plasma to ignition temperatures. A power input to the plasma of 60 MW
is needed for about 5 s during startup, and somewhat less power may be re-
quired for periods up to a minute to maintain the burn in the face of un-
favorable plasma conditions. Current experience dictates that neutral beam
heating be the reference option for this supplement. Radio-frequency heating
is considered as the primary backup option.
1. Neutral Beam Injection
Three neutral beam injection systems hava been designed. These are
summarized in Table II-8.
Beam penetration calculations indicate that a beam energy of 180 keV
is required for adequate penetration. The reference design is based on modest
11-32
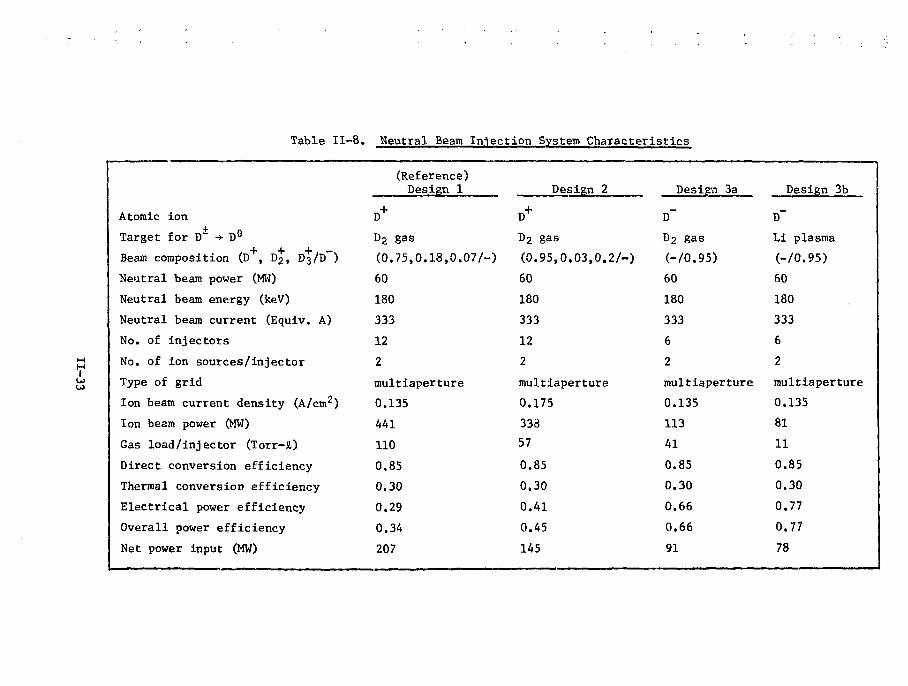
Table II-8. Neutral Beam Injection System Characteristics
r
Atomic ion
Target for D~ •+ D°
Beam composition (D , D2, D3/D~)
Neutral beam power (MW)
Neutral beam energy (keV)
Neutral beam current (Equiv. A)
No. of injectors
No. of ion sources/injector
Type of grid
Ion beam current density (A/cm2)
Ion beam power (MW)
Gas load/injector (Torr-a)
Direct conversion efficiency
Thermal conversion efficiency
Electrical power efficiency
Overall power efficiency
Net power input (MW)
(Reference)Design 1
D+
D 2 gas
(0.75,0.18,0.07/-)
60
180
333
12
2
multiaperture
0.135
441
110
0.85
0.30
0.29
0.34
207
Design 2
D+
D2 gas
(0.95,0.03,0.2/-)
60
180
333
12
2
multiaperture
0.175
33d
57
0.85
0.30
0.41
0.45
145
Design 3a
D~
D 2 gas
(-/O.95)
60
180
333
6
2
multiaperture
0.135
113
41
0.85
0.30
0.66
0.66
91
Design 3b
D"
Li plasma
(-70.95)
60
180
333
6
2
multiaperture
0.135
81
11
0.85
0.30
0.77
0.77
78

extrapolations beyond presently achieved results with D sources. The second
design is based upon improved D sources. The third design, which would re-
quire considerable advances in source technology, is based upon direct-extrac-
tion D sources, with neutralization by a gas target (3a) or by a lithium
plasma (3b). All designs employ energy recovery, and the first two designs
inject only the D ->• D° component into the plasma.
In the reference design, twelve injectors, arranged as shown in Figure II-4
to tangeatially inject into the plasma in a symmetrical clockwise and counter-
clockwise pattern, provide 60 MW of 180 keV deuteron beams to the plasma. (An
additional 20 MW could be proviced by utilizing the four ports dedicated to
radio-frequency heating experiments.) Each injector has two ion sources. The
baam line for each ion source includes an. accelerator to increase the energy of
the D ions, a magnet separator and energy grid to remove molecular ions and
directly convert their energy into electricity, a neutralizer to form the
neutrals, and a thermal energy recovery system. A schematic of the beam line
is shown in Figure 11-15. The pair of beams in each injector travels •»» 4 m
along a beam duct and passes through an 0.75 m diameter port in the toroidal
vacuum chamber wall. An electrical power efficiency (neglecting thermal energy
recovery) of 0.29 and an overal power efficiency (including thermal energy re-
covery) of 0.34 is achieved with the reference design. These power effi-
ciencies decrease rapidly with beam energy because of a decrease in the
neutralization efficiency in D gas.
Substantial improvements in power efficiency and corresponding reductions
in power requirements and gas loads could be realized if D ion sources are
developed with a very high atomic ion component, as indicated by Design 2 in
Table II-8. Even more dramatic improvements could be realized if direct-
extraction D" sources are developed.
2. Retdio-Frequency Heating
Radio-frequency (rf) wave heating is an attractive alternative to neutral
beam heating from the technological point of view, since efficient power sources
exist for several heating modes and the neutron penetration problems intrinsic
to the neutral beam injectors can be ameliorated. However, wave heating ex-
periments have not encountered the same degree of success as neutral beam ex-
periments in heating plasmas.
II-34

V
SOURCE PLUSACCELERATOR
0.3m-
JR0(jn) fl(dcQ)
D+ (.5 90.0
73.0
2.6 64,9
D j 2.12
Figure 11-15. Beam line design. (RQ is the bending radius, 9 is the BendingAngle in M-l. For 180 keV D+, the gap field Bo - 575 gauss in M-l.)

Two rf heating designs were developed, one based upon heating in the lower
hybrid resonance (LHRH) and the other in the ion cyclotron resonance (ICRH).
The EPR reference design has four rf heating stations supplying 25 MW to the
plasma, for added heating capability and experimentation. If rf heating be-
comes the primary option, the EPR design can accommodate 16 rf stations by re-
placing the neutral beam injectors with rf systems. The characteristics of
ICRH and LHRH systems, which could provide 25 MW (4 stations) and 60 MW (10
stations) of heating power to the plasma, are shown in Table TT--9.
E. Energy Storage and Transfer System
The energy storage and transfer (EST) system for the EPR consists of a
central energy storage inductor (ESI), rectifiers to transfer energy between
the ESI and the OH, EF and neutral beam systems and a rectifier to transfer
energy from the substation into the ESI. A separate inertial energy storage
unit, consisting of radially-stacked homopolar generators, is incorporated in
the OH system, so that the inductive energy in the OH system is essentially
transferred between the OH coil and the inertial storage inductor, with the
central ESI providing makeup for losses. Inductive energy is transferred
between the OH/EF coils and the plasma current, with some dissipative loss in
the plasma. The neutral beam energy is deposited in the plasma or dissipated
in the injection system. Electrical energy is recovered directly and recir-
culated in the neutral beam injection system. If rf plasma heating is used
instead of neutral beam injection heating, the required energy is transferred
from the ESI by a rectifier. The EST system is depicted schematically in
Figure 11-16 and summarized in Table 11-10.
A constant power of 42 MW is required to operate the EPR, half of this
going to the ESI to make up losses and the other half going to auxiliary sys-
tems. This power would come directly from the electrical power grid, unless
a thermal conversion system is included in the EPR design. Overall energy
flows for the EPR are described in Figure II-9.
1. Ohmic Heating System
The OH coil current is reversed at the start and end of the burn cycle.
The OH coil energy storage unit is designed to transfer and store the bulk of
the OH coil stored energy during the reversal periods by using radially-stacked
H-36

Table IT-9. RF Heating Parameters
V
Pump frequency (MHz)
8 T10 T
Output power (MW)
4 ports10 ports
Transmission efficiency fromsource to port (%)
Pulse duration, heating (s)
25 MW60 MW
Duty Cycle (%)
25 MW60 MW
Launcher
Transmission scheme
High power source
ICRH
54.068.6
2560
64
12.95.4
17.27.2
1/4 turn loops
Coaxial cables
Tetrode amplifier
LHRH
11201190
2560
48
12.95.4
17.27.2
"Grill" waveguide8 across x 2 high
Waveguides
Klystron

Table 11-10. Energy Transfer and Storage Systems — Maximum Ratings
Ohmic Heating Systems
Drum homcpolar generatorsNo. of generators in seriesNo. of dn mis /genera torTotal energy transfer (MJ)Peak power (MW)Peak voltage (kV)Peak current (kA)Equivalent capacitance (F)
Rectifier systemTypeEnergy transfer (MJ)Peak power (MW)Peak current (kA)Peak voltage .(kV)
Equilibrium Field System
TypeEnergy transfer (MJ)Peak power (MW)Peak current (kA)Peak voltage (kV)Peak switching frequency (Hz)
Neutral Beam System2* (60 MW)
TypeEnergy transfer (GJ)Voltage (kV)Power (MW)
RF System (60 MW) &
TypeVoltage (kV)ICRLHR
Power (MW)ICRLHR
Central Energy Storage Inductor
TypeEnergy stored (GJ)Energy transfer (GJ)Peak current (kA)Peak power (MW)Average power from 60 Hz line (MW)
1661200190051680.897
Inductor-converter bridge600C6800.8
Inductor-converter bridge150041680211330
*
SCR, DC/AC/DC at 10 kHs1180207
5 phase inductor-converter bridge
18.064.5
94125
Superconductive ring dipole inductor3.22.48062021
Assumes electrical energy recovery in power supply.
Neutral beam and rf are alternative options.
11-38

EnergyStorageInductor \
3.2 GJStored
ooe
OH System
OH Rectifier
Inverter
EF Rectifer
Inverter
N8 dc/^c
Converter
yI Homopolar_L Generator
L0H<\
Plasma
EF System
ooofo
k
Neutral Beam (or H O System j
!
1NB(or RF)Supply
il iaries
Make-up Rectifiera Power GridSubstation
Figure 11-16. Circuit Diagram
drum-type homopolar generators. Additional energy required to provide 5 V-s
for resistive plasma losses is transferred into and out of the OH coil during
tha burn cycle using an SCR-type inductor-converter bridge as the major trans-
fer mechanism between the OH coil and a central superconducting energy storage
inductor. The central ESI makes up the 0.46 GJ of energy that is dissipated
in the OH plasma system each burn cycle.
The design of the homopolar generators is based on radially-stacked epoxy
fiberglass insulating cylinders and 17-4 stainless steel cylinders. The
11-39

insulated cylinders are rigidly supported and aligned with respect tc the
central axis. The conducting cylinders rotate independently on a type of air
bearing designed into the insulating cylinders. The innermost and outermost
cylinders are made of insulating materials, so that high voltages can be
achieved by electrically connecting many generators in series. A radially-
directed, azimuthaily-uniform magnetic field of about 5 T is produced by NbTi
superconducting coils. Brushes are located along the edges of the cylinders
and connected so that current flows back and forth in the axial direction.
Adjacent cylinders counter rotate. The arrangement is called the counter
cyclonic generator (CCG).and is illustrated in Figure 11-17.
A series connection of 16 CCG modules, each of which contains six 0.5S iu
long stainless steel drums of varying radii between 0.55 and 0.85 m, are able
to store 1256 MJ of energy and develop a peak voltage of 60,794 V. The CCG
arrangement behaves like an electrical capacitor with a minimum value of 0.68
F. The OH coil is electrically shorted with a parallel connection of mechan-
ical switches and vacuum breakers. The mechanical switch is opened, followed
as rapidly as possible by the vacuum breakers, at the start of the energy
transfer cycle. The. shortest energy reversal time with the present CCG design
is 1.8 s, neglecting lead and stray inductances. Longer reversal times are
achieved by lowering the exciting field on the CCG.
The inductor-converter network used for OH coil control during the burn
cycle is similar in operation to the EF coil energy transfer system described
next. Aii average coil voltage of 625 V is developed by the OH coil inductor-
converter. Approximately 500 MJ of energy is transferred between the OH coil
and a central superconducting energy storage inductor.
2. Equilibrium-Field Coil System
The energy transfer system for the EF coils must be actively controlled
because the power demand varies with plasma current and temperature. The
design of the power supply is based on storing and transferring the energy
between the EF coils and the superconducting energy storage inductor using
an inductor-converter (I-C) capacitor bridge.
The design of the EF coil power supply uses typical SCR units currently
available on the market. A three-phase bridge is used with 35 mF, 10 kV capac-
itors in each phase. The integrated average EF coil voltage varies from 900 V
11-40

RADIALLY DIRECTEDMAGNETIC FIELD
ROTATING CONDUCTING-CYLINDER CTYF?)
ELECTRICALCONNECTIONS TOEDGES OF CYLINDERSTHROUGH BRUSHES
MAGNETIC FLUX
RETURN PATH
I, ' ••' T V
RIGIDLY FIXEDINSULATINGCYLINDERS
(TYR)
INPUT AND OUTPUT LEADS
•AIR BEARING LINE<TYf?>
MAGNETIC FLUXRETURN PATH
OF GENERATOR
Figure 11-17. Cross section of the region of insulating cylinders andconducting drums for a typical CCG.
when switching the bridge at 1330 Hz to 21,000 V when switching the bridge at
120 Hz. The I-C network design has the additional capability to increase the
integrated average voltage by about 50 to 60% on demand dictated by the pres-
ently anticipated fusion cycle at the most favorable ratio in current between
the EF coil and the central energy storage inductor. A total energy of about
1.5 GJ is transferred to and from the central ESI.
Each arm of the I-C bridges consists of an array of 14 SCR unite in
series arid 76 SCR units in parallel. Sach SCR unit is designed to operate at
a current of 75% of the continuous current handling limit and a reverr/e fcir-s
voltage of two-thirds of the peak inverse rating cf presently available
components.
3. Neutral Beam Injection System
The design of the neutral beam injector energy transfer system is coat-
posed of two major components; a saturated time-delay transformer (STDT),
which uses the saturation effects of magnetic cores to act as a current surge •
limiter, and a high-frequency, polyphase-controlled rectifier using SCR
switches to enable rapid de-energization of the beam in periods of less than
100 vis.
The beam heating pulse is designed to last for 5 s. Energy is added' to
the central ESI throtighout the fusion reactor cycle. The injector power
supply extracts energy directly from the ESI during the beam heating phase, so
that the power grid never sees a power bump. An I-C drives a high-frequency
polyphase inverter. A 10 kHz voltage is developed in a summing transformer,
filtered and subsequently rectified. The output lead is connected to the
injector through an STDT. A 'coil on the STDT is connected to a controlled
time delay circuit that will trigger a crowbar and interrupting switches in
the event the primary neutral beam injector protection systems fail.
4. RF Heating System
The power supplies for thti ion cyclotron region and the lower hybrid
region rf heating systems are designed using the I-C concept used for the EF
coil. Five-phase I-C bridge networks are designed to transfer energy from
the ESI *-o the rf conversion units. Five-phase networks are used to avoid
objactionably large vol'cage fluctuations on the frequency conversion tubes.
11-42

A loiter hybrid region heating module generates 64.5 kV and 61 A. Switching
steps on the bridge vary from 250 to 830 us.: Each phase has a 77.5 uF,
32,250 V'Scapacitor. Eight power supply nodules are operated froa the ESI.
Anode voltage variations are kept to within ± 17.. Each SCR switch consists of
10 SCR units in parallel and 33 units in series;
The IGR heating module generates 18,000 V and '{71 A. Each T-C phase
has a 555 uF, 9000 V capacitor. Four power supply todules ate operated from
the ESI. Anode voltage variations are kept to within i IX. Each SCR switch
consists of 19 SCR units in parallel and 9 SCR units in series.
5. Central Energy Storage Inductor
^ " \ . - ••' if
In order to operate the poloidal coil, neutral bean and rf sys?/< it
will be necessary to store energy on site so that large power pulses required
to initiate and terminate the tokamak discharge do not perturb the electrical
power network. A superconductive energy storage inductor was designed to
handle these energy pulses. The energy storage ring uses 21.4 MW at a con-
stant iny«-?\rate and provides a peak net withdrawal of 2.4 GJJ at the end cf
beam heating. 12.* maximum current is 80 kA at a maximum short time-average 1
voltege of 15 kV. Ihe ring has a major radius of 5.7 m and a minor radius
of 0.8 m. The coil will use 10.58 m 3 of NbTi and is constructed of pancakes
separated by micarta or fiberglass-epexy boards. Alternate pancakes are vround
clockwise and counter-clockvjise to facilitate layer-to-layer connections. ;" • " :-y • '' v _ ' •- • • --. "
Conductor transposition :'.s achieved by winding top and bottom halves with 40
kA cable and operating coil halves in parallel. There are a total of 12
layers of coil«>
\i
Vacuum Systems ^ = a = • ;
The EPR toroidal vacuum system must: (1) reduce the residual ;gas"pres-
sure in the toroidal chamber frqm iio2 * 10" 3 to 'v 1 x 10"*5 torr in ^ 15 s j
after trfie burn pulse; and (2)° achieve a base pressure of less than 10~8 tp'rr
at the beginning of an operational period. These criteria can be satisfied
by thirty-two 25,000 t/s cryosorption pumps, each connected through a 1.1 'm
diameter duct to an 0.95-m diameter port in the vacuum chamber wall, to |
minimize the tritium inventory, the cryosorption0pumps will be regenerated!
using zirconium/aluminum getter pumps, every four hours to remove the tritium
and deuterium that has accumulated on the liquid helium cooled panels. An!1 =i
1"•J

additional 32 cryosorption pumps are provided to allow for continued operation
during the regeneration period.
Pumping requirements for the neutral beam injectors are very demanding.
Twelve injectors will each have gas loads of 110 torr-£/s during operation.
The required pumping speed of * 5 * 106 Jl/s will be provided by 100 m2 of cryo-
sorption panel in each injector. To avoid shutdown during regeneration, an
additional 100 m2 of panel area must be provided and the design mist allow for
isolation of that portion of the cryosorption panel to be regenerated.
The principal parameters of the toroidal and neutral bean vacuua systems
are shown in Table 11-11.
The high impedance characteristics of the waveguide used for lower hybrid
rf heating will necessitate a separate pumping system to insure adequate vacuum
along the length of the waveguide. Each waveguide must have either a mercury
diffusion or turbomolecular pump with an effective pumping speed of 10,000 1/s
to maintain the required 1 x 1O~6 Torr vacuum at the waveguide window.
Table 11-11. Vacuum System Parameters
Volume
Surface area
Gas load
Cryosorption pumping
Effective pumping speed
Secondary pumps
Al/Zr getter pumps
No. 1300 CFM blower stations
No. 1400 Jl/s turbomolecularrumps
Toroidal
754 m3
771 m2
2588 Torr-2.
32 - 25000 Jl/spumps
4.25 x io5 Z/s
32 - 10000 Jl/s
16
16
Neutral Beam
250 m3/injector
254 m2/injector
110 Torr-Jl/s per injector
100 m2 panel/injector
5 x io6 t/s per injector
12 - 25000 Jl/s
Use same pumps
Use same pumps
11-44
G. First Wall
The first wall system consists of a vacuum wall and detachable coolant
panels. The free-standing vacuum vessel is constructed from 16 cylindrical
segments of 2-cni thick stainless steel plate and is reinforced with an ex-
ternal ring and spar framework. Locations of the two circumferential support
rings and ten longitudinal spars on each segment are shown in Figure 11-18.
The 16 segments are joined by formed rings ^hat are welded to the enfig of
each segment. A chemically bonded Cr.,0 coating is applied to the joining
surfaces in two of these rings to form a current breaker in the vacuua wall.
Detachable stainless steel coolant panels are roll-bonded to the inside of
the vacuum wall, as illustrated in Figure 11-19.
The surface of the coolant panel facing the plasma is coated with 100-
200 microns of beryllium to control impurity contamination of the plasma by
stainless steel. The substantial porosity (10-152) and fine aicrostruccure
obtainable with the plasma spray-coating process facilitates gas re-emission,
particularly helium, and minimizes blistering erosion.
Water is supplied to the coolant panels by manifolds located in the con-"
necting rings that join the first-wall segments. The toroidal vacuum wall ,
is supported by a three-point per segment, roller/slide pad-type support from
the blanket to the lower rings and spars. The three-point support minimizes
the size of the reinforcing ring and the roller/slide support minimizes ther-
mal stresses by allowing for expansion of the vessel. The first wall design
is summarized in Table 11-12. —:
Extensive thermal-hydraulic, mechanical, materials performance and | ,
radiation damage analyses Have been performed to evaluate the first wall'
performance and to determine the design limits. Results are suanarized
in Table 11-13. The stainless steel vacuum wall should maintain its struc-
tural integrity for the 10 year design life under the nominal operating con-
ditions, viz., integrated wall loading of 2.5 MW-yr/m2, maximum annual neutron
fluence of 6 * 1025 n/ra2 (2.8 dpa/year,54 appm/year helium and 133 appn/year
hydrogen) and maximum wall temperature of < 50Q°C. For these conditions the
predicted radiation swelling of < 4% is tolerable. The limiting criterion is
loss of ductility caused by displacement damage and helium generation. For
11-45

VACUUM PORTS(16 PLACES-32 PORTS)
RF HEATINGPORTS <4>
EXPERIMENTAL^PORTS (4> / ,
PARTIAL PLAN VIEW -VACUUM VESSEL TORUS
RF HEATINGPORTS <4>
/5 -D lAINJECTIONPORT
Figure 11-18. Vacuum Vessel Structure
11-46 //

FIRST WALLCOOLANT MANIFOLDS-
CROSSOVER MANFOLDSECTION
FIRST WALLCOOLANT CROSSOVER
VACUUM VESSELCOOLANTCROSSOVER
INLET/OUTLETMANIFOLD SECTION
•COOLANT PANEL ^MOUNTING BRACKET
TvPICAL COOLING PANELS
EXPANSION BELLOWS(TYP. ALL NLET/OUTLETMANFOLDS)
VACUUM VESSELCOOLANT MANIFOLD
VACUUM VESSELCOOLANT PANFl
RESISTANCE WELDS
F*IHST WALLCOOLANT PANEL
HRST WALL COATING »
MATERIAL: TYPE 316 STANLESS
Figure 11-19. Coolant Panel
11-47
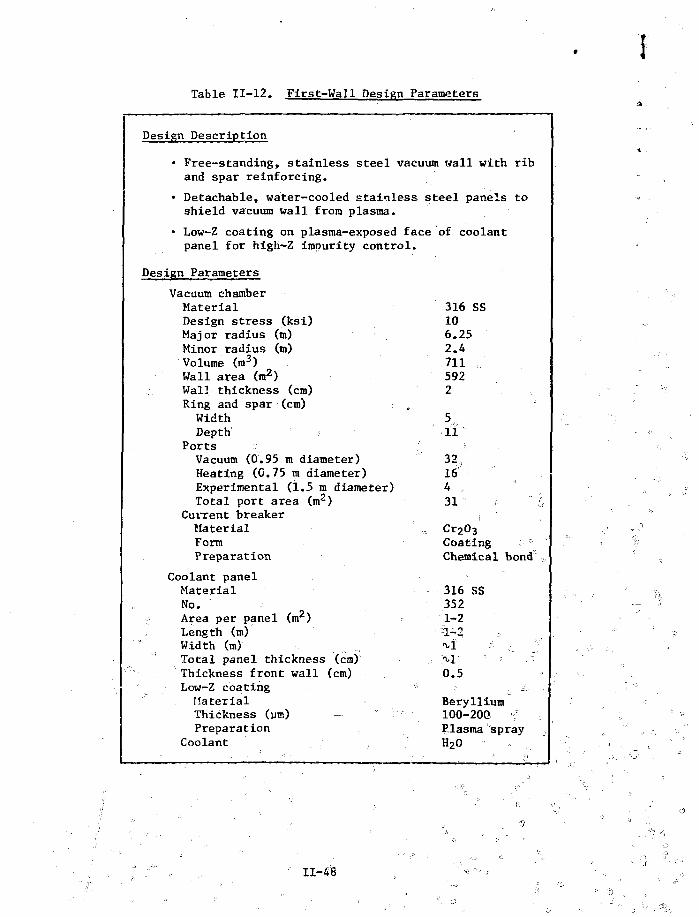
Table 11-12. First-Wall Design Parameters
Design Description
• Free-standing, stainless steel vacuum wall with riband spar reinforcing.
• Detachable, water-cooled stainlessshield vacuum wall from plasma.
steel panels to
• Low-Z coating on plasma-exposed face of coolantpanel for high-Z impurity control.
Design Parameters
Vacuum chamberMaterialDesign stress (ksi)Major radius (m)Minor radius (m)Volume (m3)Wall area (m2)Wall thickness (cm)Ring and spar (cm)WidthDepth
PortsVacuum (0.95 m diameter)Heating (0.75 m diameter)Experimental (1.5 m diameter)Total port area (m2)
Current breakerMaterialFormPreparation
Coolant panelMaterialNo.Area per panel (m2)Length (m)Width (m)Total panel thickness (cm)Thickness front wall (cm)Low-Z coatingMaterialThickness (um)Preparation
Coolant
316 SS106.252.47115922
511
3216431 >•-• ' 5
Cr2O3
Coating °Chemical bond ..,
'••
316 SS3521-2
-=]A2v L ^ , •>-
.-. 'M-' ' •• -.
0.5
Beryllium100-200Plasma sprayH20
11-48

Table 11-13. First-Wall Operating Parameters and Design Limits*
Nominal Operating Conditions
Capacity factor (Z)
Operating cycle (s)StartupBurnShutdownExhaust and replenishment
Average power loading during burn (MV»7m2)NeutronRadiation, conduction, convection
Operating Parameters
Stainless iteel vacuum wallMaximum tenperatu* * (*C)-Minimum yield stress at 500*C (Icsi)Maximum annuai fluence (n/m2)Neutron Damage '.ipalyt)Helium generation (appm/yr)Hydrogen generation (appm/yr)
Stainless steel coolant panelHaximus) temperature (*C)Mlniiium yield stress at 500'C (ksi)Max . ua annual f luence (n/m2)Neutron Damage (dpa/yr)Helium generation (appm/yr)Hydrogen generation (appm/yr)Maxinum heat deposition (V/cra^)Maximum £T across panel surface ( V )Maxinum iT through panel face ("O
With Argon shutdownWithout Argon shutdown
Maximum AT during burn cycle (*C)Maxinusi thermal strain range (2)
Operating cycleBurn cycle
Beryllium coatingMaKimum surface temperature (*C)Helium generation (uppn/yr)Hydrogen generation (appn/yr)- ,; :
Maximum erqsjon rate (un/yr)
Water coolantMaxlsum pressure (pi1)Velocity (ra/s)Inlet temperature — first pane! (*C)Exit temperature — eighth panel (*C>Pumping power (MW) ±
Vacuura wall %Design life (y?),Integrated neutron wall loading (MV-yr/m*)Yield strength —• 10 yr (ksi)Uniform elongation — 10 yr (X)Radiation swelling_»— 10 yr (X) . , ;,Limiting criterion \, -:
. Coolant panel -: 'Design" life ,(yr):- s ,
1 Total burn cycles — 5 yrFatigue lifetime (yr) . 'Radiation lifetime (yr) %.Lilsiting criterion ,' . .
Low-E coating ••' •'
Design life (yr) ' ^Limiting criterion A
50
535515
0.50.13
<500176 » 10 2 5
2.854133 •:
380176 » 1 0 "2.8541335.S20
100751 0 0 •x-.-v
0.14 ^
0.09
40.7 ..7801330 :;
•~: " ' " ' ' - .
200(i -\
1.64 0 • .... •?
310»<i i
10* 2.5 :j
.."•75 „ o :: .
>V,..a - =• '<4Ductility
% °5 v ., . -• '
•• 1 0 6 '' 'a •
. 5./ ," . .,
Thenul fatigue
• - ^ - " , V ' ' J <^.
3-5"' ' " , ,;/
D-T sputtering
Based on a neutron wall load of 0.5 MW/n2 and a'plant capaclty.factorof 50X. '" o ""°-., " , ; .
11-49
'if

temperatures below 500°C, the residual uniform elongation, which is estimated
to be - 1% at the end of the 10 year life, is considered to be acceptable.
The lifetime of the low-Z coating is limited by erosion caused primarily by
D-T physical sputtering. A design life of 5 years for a 100 to 200-nm thick
beryllium coating appears feasible. Only limited data exists with which to
estimate the lifetime of the ceramic current breaker; however, bulk radiation
effects will likely be the limiting criteria.
In addition to the extensive radiation damage, the coolant panel will be
subjected to severe thermal cycling produced by heat deposition on the surface
during the plasma burn. Temperature variations in the hottest coolant panel
during operation are shown in Figure 11-20. The spike is caused by the radi-
ation when argon is injected to terminate the burn. The strain range for the
burit cycle depends on the difference between the maximum and minimum values of
AT during the cycle, and the strain range for the plant warm-up/cool-down
operating cycle is a function of the average AT during the burn cycle. Assuming
that the duration of the operating cycle is long enough that stress relief
occurs, the strain range for the coolant panels with sliding supports is
0.085% for the burn cycle and 0.14% for the warm-up/cool-down operating cycle.
These values correspond to fatigue design lifetimes for the coolant panels
of 5 x 10⁶ burn cycles and 1 x 10s operating cycles. Thus, thermal fatigue
will limit the life of the coolant panel to 5 years, which corresponds to
•v 106 burn cycles, for the current design parameters.
Although the current first-wall system design is based to a large extent
on available materials and existing technology* it appears that adequate
mechanical integrity of the system can be maintained for suitable reactor life-
times under the postulated :EPR conditions.
H. Blanket/Shield System ;, ,. J
The blanket/shield system consists of the blanket, the inner bulk shield,
the vacuum duct penetration shield, and" the biological shield. In order to
insure penetration of the equilibrium field into the plasma*{region without
intolerable distortion or phase delay, the blanket and bulk shield are con-
structed of 688 electrically insulated blocks, as illustrated in Figure 11-21.
The blanket is made up of 0.28-m thick stainless steel bltS'cks, as shown
in Figure 11-22. Each of the 16 segments of the vacuum chamber ±s covered by
11-50

or2
" V.
000-0
700-0
600-0
SOO'O
m-tr
10-0 80-0 120-0 160-0 200-0TIME (SECONDS)
210*0 280-0 320-0 360-0
Figure 11-20. Transient temperature histories (0.5 MW/m2). Locations onthe coolant exit plane at the surface of the berylliumcoating (upper curve), at the surface of the stainlesssteel in contact with the coating (middle curve), and atthe stainless steel surface in contact with the coolant
•\\ (lower curve).

INNER SHIELDBLOCK
-OUTER SHIELDTOP SECTION
NNCR BLANKET9LOCK
SHIELD SEGMFNT ASSEMBLY
OUTER SHIELDTOP SECTION
•OUTER, SHIELDLOWER SECTION
F - 3? '••
F-2f- l
SUPPORTSTRUCTURE
TF COILS
SHIELD Si&MENT-
i KEY PLAN
Figure 11-21. EPR ..Blanket/Shield Arrangement
11-52
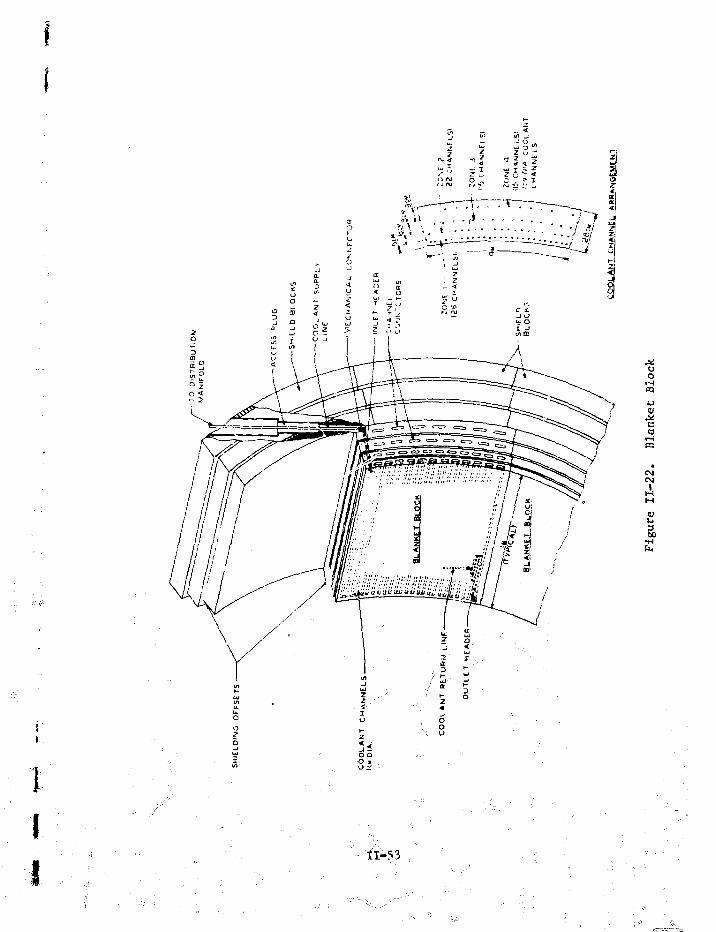
18
CM
1•il-5.3
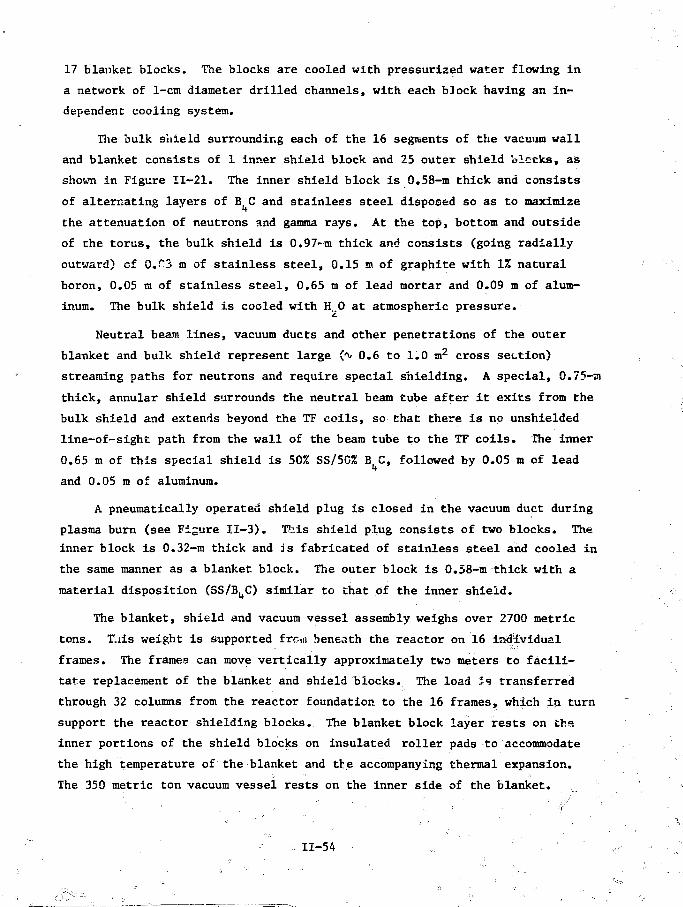
17 blanket blocks. The blocks are cooled with pressurized water flowing in
a network of 1-cm diameter drilled channels, with each block having an in-
dependent cooling system.
The bulk shield surrounding each of the 16 segments of the vacuum wall
and blanket consists of 1 inner shield block and 25 outer shield blccks, as
shown in Figure 11-21. The inner shield block is 0.58-m thick and consists
of alternating layers of B C and stainless steel disposed so as to maximize
the attenuation of neutrons and gamma rays. At the top, bottom and outside
of the torus, the bulk shield is 0.97-m thick and consists (going radially
outward) of 0.^3 m of stainless steel, 0.15 m of graphite with 1% natural
boron, 0.05 m of stainless steel, 0.65 m of lead mortar and 0.09 m of alum-
inum. The bulk shield is cooled with H,,0 at atmospheric pressure.
Neutral beam lines, vacuum ducts and other penetrations of the outer
blanket and bulk shield represent large (*> 0.6 to 1.0 m2 cross section)
streaming paths for neutrons and require special shielding. A special, 0.75-m
thick, annular shield surrounds the neutral beam tube after it exits from the
bulk shield and extends beyond the TF coils, so that there is no unshielded
line-of-sight path from the wall of the beam tube to the TF coils. The inner
0.65 m of this special shield is 50% SS/50% B C, followed by 0.05 m of lead
and 0.05 m of aluminum.
A pneumatically operated shield plug is closed in the vacuum duct during
plasma burn (see Figure II-3). This shield plug consists of two blocks. The
inner block is 0.32-m thick and is fabricated of stainless steel and cooled in
the same manner as a blanket block. The outer block is 0.58-m thick with a
material disposition (SS/B^C) similar to Chat of the inner shield.
The blanket, shield and vacuum vessel assembly weighs over 2700 metric
tons. T.iis weight is supported frc-m beneath the reactor on 16 individual
frames. The frames can move vertically approximately two meters to facili-
tate replacement of the blanket and shield blocks. The load is transferred
through 32 columns from the reactor foundation to the 16 frames, which in turn
support the reactor shielding blocks. The blanket block layer rests on the
inner portions of the shield blocks on insulated roller pads to accommodate
the high temperature of the blanket and the accompanying thermal expansion.
The 350 metric ton vacuum vessel rests on the inner side of the blanket.
11-54

Extensive analyses have been performed to evaluate the performance of
the blanket/shield system. These analyses are based 01; a nominal neutron
wall load of 0.5 MW/ta2 and a plant capacity factor of 50%. Tnt neutronics ..,
effects vary significantly around the wall in. the poloidal direction, and a
conservative analysis is employed. Results are sunmarizad in Tables 11-14
and II-15. Radial distributions of\,the neutron heating raze and of the
atomic displacement are shown in Figures 11-23 and 11-24. .
The 4-cffi first wall and the 28-*smablanke£ region receive £ 90% of the =
neutron and gaiipa energy. For the most part, the properties and requirements
of the blanket material are the same as those of the first wall. The nuclear
heating varies from a maximum of 3.5 W/cm2 to a minimum of 6.3 W/cm3. The3
radiation damage level adjacent to the first wall is 1.7 dpa/year and drops
by a factor of two every ^ 7 cm going through the blanket. » Operating ternr %
peratures in the load bearinig portions of the blanket are, like the first
wall teraperaturiss, restricted to 5;500°C, but may be allowed to rise above
this level in non-structural components. In general, the less severe radi-;
ation environment of the blanket will'"mean ,t:hat property changes will be
than in the first wall. After 10 years at a wall loading of 0.5 MW/m2 and
a 50% capacifry factor, the swelling in the bl ii et adjacent to the-. first /wall ^
is expected to remain below 2%, the uniform elongation will drop to A- "H%.\ and ?!
the yield strength will increase to i> 75 ksi. As the neutron radiation is^_^^
attenuated through the blanket, the swelling will be reduced to zero after ,
a few cm, and the, tensile properties willcapprbach these of unirradiated
material ('v 22% uniform elongation and *>» 2d ksi yield^strengtH). The effect
of creep and fatigue will be less than in the first wall since ;the blanket
is not exposed to the surface radiation from the plasma and will; not undergo
the large thermal cycling of the first wall. Helium production rates will
still be high in the first few cm, but tKe jtemperature limit ofo500°C should *;,
insure against helium esnbrittlement, which is observed at temperatures above >i
5 5 0 ° C . ••• ';"''"' ; , ' ; . ' " , '= ^ ) ° , ' / •
The bulk shield will receive i> 1% at the total radiation energy pro- ° • '"
duced in the EPR. No degradation of the bulk properties3of stainless steel is
expected. The boron carbide located ih^he inner shleld\ls a brittle mat^
with moderate tensile strength and high cbiapressive' strength. The major
. A , - .
- (I •, •,,/ >
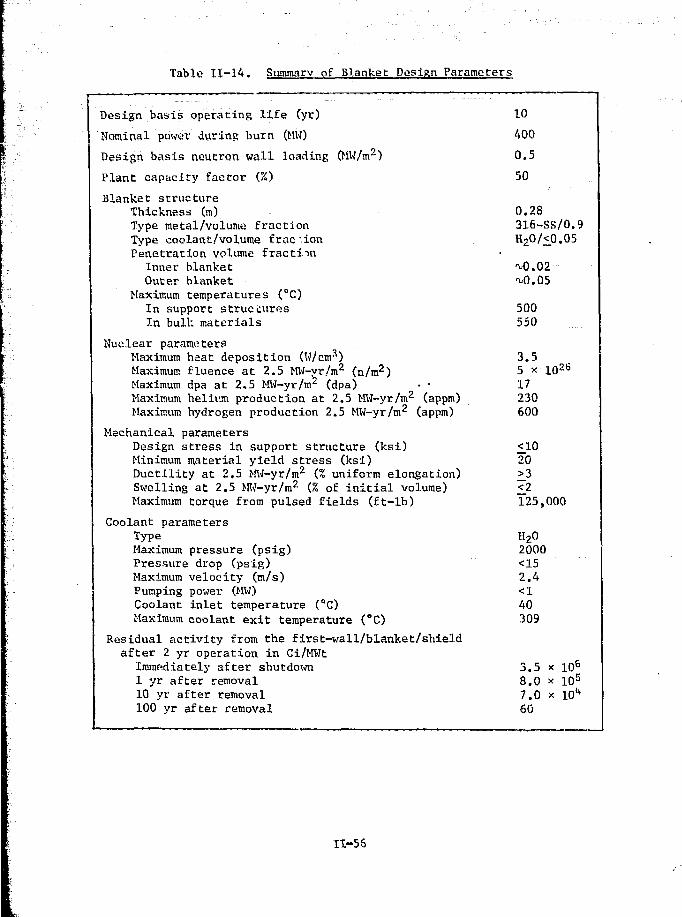
Table II-lA, Summary of Blanket Design Parameters
Design basis operating l i fe (yr)
Nominal power during burn (MW)
Design basis neutron wall loading (MW/m2)
Plant capacity factor (%)
Blanket structureThickness (m)Type metal/volume fractionType coolant/volume fractionPenetration volume fractiin
Inner blanketOuter blanket
Maximum temperatures (°C)In support structuresIn bull; materials
Nuclear parametersMaximum hsat deposition (W/cms)Maximum fluence at 2.5 MW-yr/m2 (n/m2)Maximum dpa at 2.5 MW-yr/m2 (dpa) • •Maximum helium production at 2.5 MW-yr/m2 (appm)Maximum hydrogen production 2.5 MW-yr/m2 (appm)
Mechanical parametersDesign stress in support structure (ksi)Minimum material yield stress (ksi)Ductility at 2.5 MW-yr/m2 (.% uniform elongation)Swelling at 2.5 MW-yr/m2 (% of i n i t i a l volume)Maximum torque from pulsed fields (ft- lb)
Coolant parametersTypeMaximum pressure (psig)Pressure drop (psig)Maximum velocity (m/s)Pumping power (MW)Coolant inlet temperature (°C)Maximum coolant exit temperature (°C)
Residual activity from the first-wall/blanket/shieldafter 2 yr operation in Ci/MWt
Immediately after shutdown1 yr after removal10 yr after removal100 yr after removal
10
400
0 . 5
50
0,28316-SS/0.9H20/<0.05
M).O2M).05.
500550
3 .55 * 1026
17230600
<1020>3<2125,000
H202000<152 . 4<140309
3.5 x io6
8.0 x 10⁵
7.0 x lO4
60
11-56
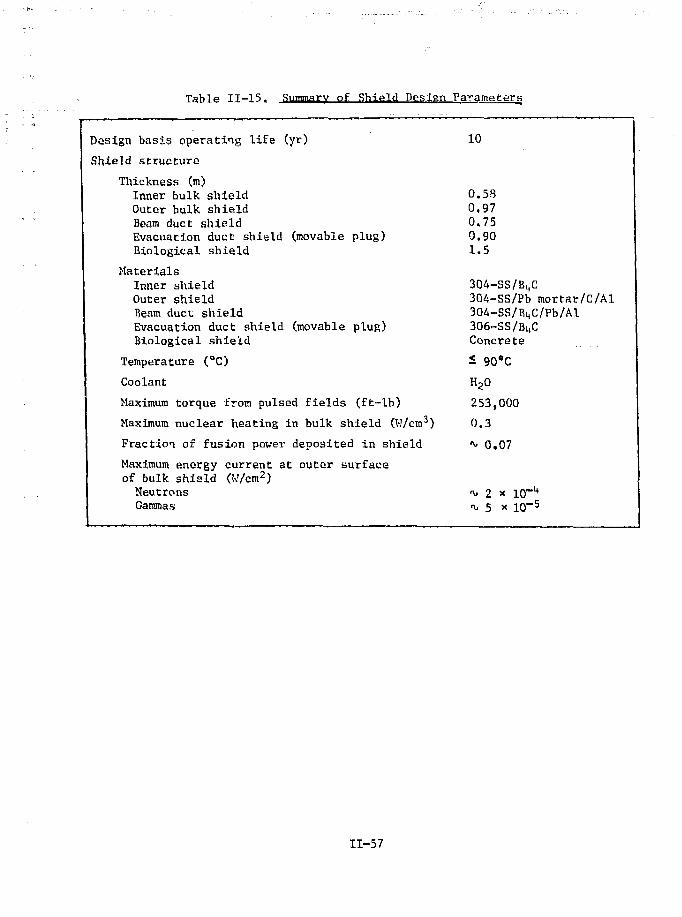
Table 11-15, Summary nf Shield Design Parameters
Design basis operating life (yr)
Shield structure
Thickness (m)Inner bulk shieldOuter bulk shieldBeam duct shieldEvacuation duct shield (movable plug)Biological shield
MaterialsInner shieldOuter shieldBeam duct shieldEvacuation duct shield (movable plug)Biological shield
Temperature (°C)
Coolant
Maximum torque from pulsed fields (ft-lb)
Maximum nuclear heating in bulk shield (W/cm3)
Fraction of fusion power deposited in shield
Maximum energy current at outer surfaceof bulk shiald (W/cm2)NeutronsGammas
10
0.5S0,970.750.901,5
30A-SS/B4C304-SS/Pb mortar/C/Al304-SS/B4C/Pb/Al306~SS/Bi,CConcrete
S 90"C
H20
253,000
0.3
* 0,07
^ 2 x lO"1*-v 5 * 10"5
11-57

10c
coI.
10"
10"
with penetration shield
with penetration shield
without penetrationshield
with penetration shield
20 40 60 80 100
Distance From First Wall, cm
120 130
Figure 11-23. Neutron Heating in the Water Coolant as a Function ofDepth in the Blanket/Shield for Three Locations withRespect to the Neutral Beam Duct: a-at the wall ofthe beam duct, b-at 10 cm from the wall of the b amduct, and c-at 30 cm from the wall of the beam duct.
11-58

10°
u
-5"
10"
with penetration shield
with penetration shield'
» without penetration shield
with penetration shield
20 40 60 80 100
Distance From First Wall, cm
120 130
Figure 11-24. Atomic Displacement, in StalnLess Steel as a Function ofDepth in the Blanki't/Shield for Three Locations withRespect to the Neutral Beam Duct: a-ac the wall of thebeam duct, b-at 10 cm from the wall of the beam duct,and c-at 20 cm from the wall of die beam duct.
11-59
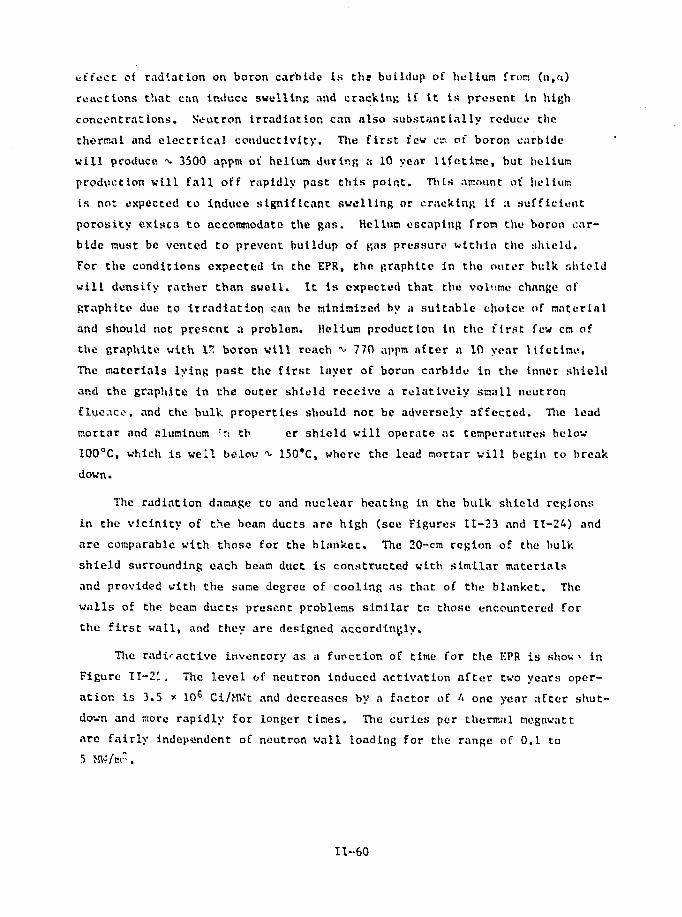
effect of radiation on boron carbide is the buildup of helium from (n,a)
reactions that can Induce swelling and cracking if it is present in high
concentrations. Neutron irradiation can also substantially reduce the
thermal and electrical conductivity. The first few ea of boron carbide
will produce "<•> 3500 appm ot heliusn during a 10 year lifetime, but helium
production will fall off rapidly past this point. This amount of helium
is no* expected to induce significant swelling or cracking if a sufficient
porosity exists to accommodate the gas. Helium escaping from the boron car-
bide must be vented to prevent buildup of gas pressure within the shield.
For the conditions expected in the EPR, the graphite in the outer bulk nhield
will densify rather than swell. It is expected that the volume change of
graphite due to irradiation can be minimised by a suitable choice of material
and should not present a problem. Helium production in the first few cm of
the graphite with 13 boron will roach ** 770 appm after a 10 year lifetime.
The materials lying past the first layer of boron carbide in the inner shield
and the graphite in the outer shield receive a relatively small neutron
flucico, and the bulk properties should not be adversely affected. The lead
mortar and aluminum in tb er shield will operate at temperatures below
IOO°C, which is well below ^ 150*C, where the lead mortar will begin to break
down.
The radiation damage to and nuclear heating in the bulk shield regions
in the vicinity of t>.e beam ducts are high (see Figures 11-23 and 11-24) and
are comparable with those for the blanket. The 20-cm region of the bulk
shield surrounding each beam duct is constructed with similar materials
and provided with the same degree of cooling .is that of the blanket. The
walls of the beam ducts present problems similar to those encountered for
the first wall, and they are designed accordingly.
The radioactive inventory as a function of time for the EPR is show' in
Figure 11-21, The level of neutron induced activation after two years oper-
ation is 3.5 * 105 Ci/MWt and decreases by a factor of A one year after shut-
down and more rapidly for longer times. The curies per thermal megawatt
are fairly independent of neutron wall loading for the range of 0.1 to
5 MW/nr.
11-60

IK I Mo Iv lOv 10O\
i n * 1 0 ' i o > u>'4 i n - ' I O 6 H i 7 i o 5 nV 3 i t ) 1 0
Tino After Shutdown in Seconds
Figure 11-25. Radioactivity and Biological Hazard Potential as aFunction of Time aftur Shutdown Following Two Yearsof Operation
11-61

At shutdown, the decay heat is 2,5% of operating power and only drops
about,20% during the first few minutes after shutdown, which is the period
of time that Is very crucial to emergency cooling.
I. Access and Maintenance
During operation, the biological dose in regions external to the TF
colls is about 106 mrem/hr, which is too high to permit access to the in-
side of the reactor building for any reasonable length o.f time. Outside
the 1.5-m thick concrete building wall, the dose is about 1 mrem/hr. The
biological dose in the vacuum chamber inside the first wall is 6 x 10^
mrem/hr at shutdown and after one year of cooldown the dose is 1 x 10^
mrem/hr. After one-day of cooling, the dose is 600 mrem/hr at a position
above the reactor at the location of the TF coils and 2 mrem/hr outside
the TF coils. The latter result is based upon adequate shielding of
penetrations and of the neutral beam injector. These calculations indicate
that the dose rate is too high to permit unshielded personnel access to the
reactor during operation. At best, limited access would be allowed within a
few days of shutdown. Personnel exposure can be reduced by two orders of
magnitude by 10 cm of lead shielding.
The general approach to maintenance for the EPR Is by use of remote
handling apparatus. All large components will be repaired in place, where
possible. This includes the vacuum vessel and the lowex EF and OH coils.
Smaller components like the blanket and shield blocks, will be repaired in
the hot cells. Special in-vessel remotely operated equipment will be
designed to repair, replace and inspect any portions of the vacuum vessel or
first-wall panels that have been damaged. Support facilities for remote
operations include a remotely-operated overhead crane/manipulator with a
shielded personnel cab, floor-mounted snorkel type units for servicing, the
vertical portions of the reactor and basement-positioned apparatus for
maintaining the lower components of the reactor. A full-scale, quarter
section mockup of the reactor is vital to all remote operations because it
will be used to program the repair apparatus and perform practice runs.
11-62
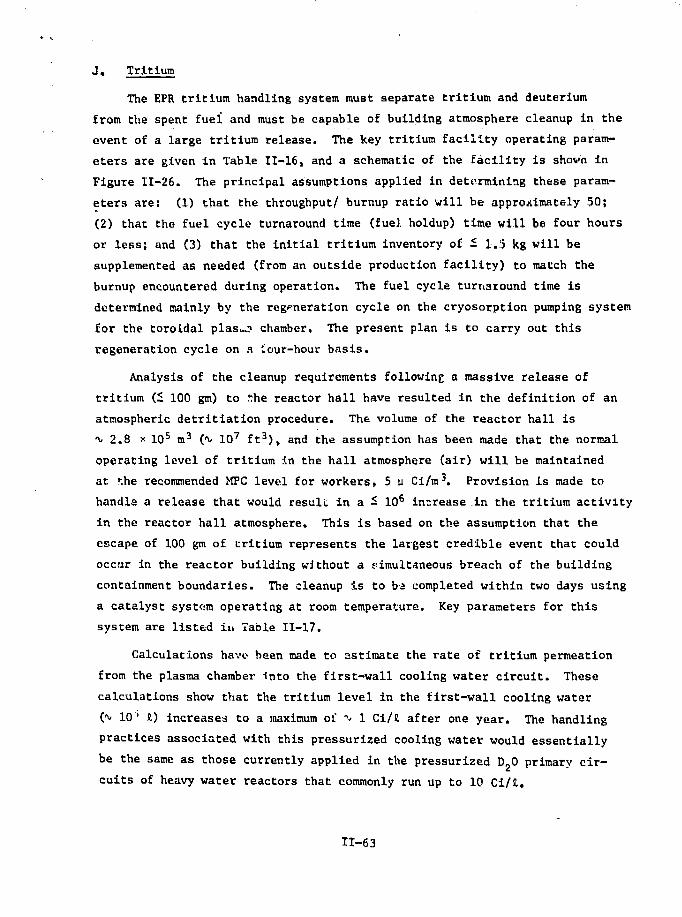
J, Tritium
The EPR tritium handling system must separate tritium and deuterium
from the spent fuel and must be capable of building atmosphere cleanup in the
event of a large tritium release. The key tritium facility operating param-
eters are given in Table 11-16, and a schematic of the facility is shown in
Figure 11-26. The principal assumptions applied in determining these param-
eters are: (1) that the throughput/ burnup ratio will be approximately 50;
(2) that the fuel cycle turnaround time (fuel holdup) time will be four hours
or less; and (3) that the initial tritium inventory of i 1.5 kg will be
supplemented as needed (from an outside production facility) to match the
burnup encountered during operation. The fuel cycle turnaround time is
determined mainly by the regeneration cycle on the cryosorption pumping system
for the toroidal plas...? chamber. The present plan is to carry out this
regeneration cycle on a iour-hour basis.
Analysis of the cleanup requirements following a massive release of
tritium (£ 100 gm) to *he reactor hall have resulted in the definition of an
atmospheric detritiation procedure. The volume of the reactor hall is
^ 2.8 * 105 m3 ('v 107 ft 3), and the assumption has been made that the normal
operating level of tritium in the hall atmosphere (air) will be maintained
at r.he recommended MPC level for workers, 5 y Ci/m3. Provision is made to
handls a release that would result in a £ 106 increase in the tritium activity
in the reactor hall atmosphere. This is based on the assumption that the
escape of 100 gm of tritium represents the largest credible event that could
occur in the reactor building without a s<imultaneous breach of the building
containment boundaries. The cleanup is to ba completed within two days using
a catalyst system operating at room temperature. Key parameters for this
system are listed in Table 11-17.
Calculations have- been made to estimate the rate of tritium permeation
from the plasma chamber into the first-wall cooling water circuit. These
calculations show that the tritium level in the first-wall cooling water
Ov 10 ' !,) increases to a maximum oi ^ 1 Ci/H after one year. The handling
practices associated with this pressurized cooling water would essentially
be the same as those currently applied in the pressurized D,0 primary cir-
cuits of heavy water reactors that commonly run up to 10 Ci/S,.
11-63

Table 11-16. Summary of Tritium-Handling Facility Parameters
General
Power during burn (MW)
Burn cycle duty cycle (%)
Plant availability factor (%)
Tritium burnup (g/day)
Throughpuc/burnup ratio
Tritium delivery rate (g/hr)
Fuel cycle turnaround time (hr)
Pl.nnt Inventory (kg)
Annual tritivim consumption at50% capacity factor (kg)
Tritium Inventory Disposition
Cryosorption pumps (g)
Getter beds (g)
Distillation columns (g)
Fuel cycle hardware (g)
Storage (g)
Anticipated mean inventory (g)
Fuel Cycle
Nature of fuel processingand recycle systems
Type of mainstream enrichment
No, of columns
No. of equilibrators
_8 T
200
75
67
26
50
60
A
0.6
6.-'.
f
^500c
600
BTFCmax
10 T
500
7 ft
67
6-'.
50
150
k
1.5
16
600"1 600*'
1 Cl
1500
Nonmetallic element removalDebris removalIsotopic enrichmentFuel storageFuel delivery
Cryogenic distillation
6
1
Maximum va^ue at any single time.
11-64

CRYOSORPTION PUMPSWITH THERMAL ECONOMIZER
DEBRISSEPARATOR
e
ien
MULTISTAGE—jWA8BLE PUMPS j
MERCURY'EJECTOR
DIAPHRAGMCOMPRESSOR
FUEL INTEGRITY
CRYOGENIC* }
TRITIUMSCRUBBER
COLD FUEL CONDITIONEF
1 TRITIUM iSTORAGE I
IRESERVCMR'| J
DISTILLATION I x -2 '{ CASCADEv lr—-
COLD FUELSUPPLY STREAM
LOCAL /CONTAINMENT ~<
^TRITIUM SUPPLY
-M
STREAM
FUELBLENDER
T
NEUTRAL INJECTORSUPPLY STREAM
( 9 8 % D2)
D° NEUTRAL INJECTOR( D = PALLADIUM DIFFUSER
Figure 11-26. Fuel Cycle Scenario for the ANL/EPR

Ti>.1e» TT-17. Atmospheric Cleanup System
Re«tfctor ball volume (m3) ^
Baseline tritium lev^l (u Ci/m3)
Clean-up time (days)
Maximum decontamination factor
Air circulation rate (emergency) (cfm)
Volume of catalyst (m3)
Catalyst operating temperature (0C)
2.8 x 10⁵
5
1 2
10s
> 105
20
27
Potential off-sire tritium exposure calculations have been made. Two
events leading to off-site exposure due to the release of tritium have been
considered. The first event considers 2% ( 4 * 10s Ci) of a total inventory
of 2 kg of tritium released at ground level as water vapor in an accident.
The dose commitment for an individual at che site boundary is 23.5 re.n (whole
body) at 500 m and 7.4 rem (whole body) at 1000 m as compared to the 10 CFR
100 guideline for total body dose in an accident of 25 rem. The second event
is the continuous daily release of 100 Ci oi tritium, for which the concentra-
tion at 500 m is 5 * 10~9 Ci/n3 and at 1000 m is 'v- 2 x 10~9 Ci/m3. ERDA
Manual 0524 gives the uncontrolled concentrations guide as 2 * 10~7 Ci/m3.
K, Facility Description
The reactor complex consists of eleven major facilities covering an
area of 65,000 square meters. The fncai point is the reactor containment
building (Figure 11-27), a structure 73.2 m in diameter by 50 m high made,
of reinforced concrete, 1.5 m thick, to meet both structural and biological
requirements. A thin steel membrane, 1 cm thick, lines the inside walls
of the building, forming a barrier in the event of a tritium release.
The seal is carried through all penetrations and access ways. A reactor
pedestal is provided slightly offset from the center of the building for
convenience in positioning the 300 ton overhead polar crane used in
assembly and maintenano of the reactor. The building is equipped for
remote maintenance of the reactor.
11-66

Figure 11-27. Reactor Containment Building

A second containment building, ^ 26 m diameter and 24 m hig'u wjth a
two-story laboratory wing, i s provided for tr i t ium storage and fuel
reprocessing. This building can be sealed in the event of accidental
critiun.-release.--A tnockup-and- maintenance building, 38 m wide,-85-m-long —
and 24 in high with a full coverage-230 ton bridge crane, is located adjacent-
to, the reactor containment and tritium fac i l i ty . Thio building contains two
hot ce l l s tot reactor component repair and experimental services. Non-
functioning neutral oV-aro injectors are transferred directly through an
access door from the reactor building. An area for magnet coil winding
and assembly along with a full-size quarter-section mockup of the reactor is
•provided. An experimental apparatus setup area is available,-as well as
storage fac i l i t ies located in the lower area of this building. A .power,
supply fac i l i ty ("iO m by 32 m) is located adjacent" to the -reactor building,
housing the hull; of the magnat and plasma heating power supply equipment.
Directly connected to this faci l i ty , but"located below grade some 70 min-
distance, i s a cryogenically-cooled energy storage fac i l i ty , 15 m In diameter
by 3 m deep.
A control center consisting of the control room, computer center,
laboratories and offices i s housed in a four-;story building 50 m by 62 m.
r^her structures include the reactor ventilation building, the cooling
tower? and fc}>? -power supply substation.
transport and cooling tower fac i l i t i e s capable of removing up to
550 MW ot tractor -ind component waste heat are provided. These consist of a
beat exchange1 building, a pump house with denuneralizer equipment and six
cooling trjvr'.-'j mounted in tvu banks. Cryogenic equipment, dominated by the
TF coil system requirements, atv. located adjacent "to the reactor In a
buiVding having ^ 200 nr of floor space. This facil i ty is complete with a
liquid Ka~ storage vessel, He gasometer, compresser area and a sat of high
pressure.helium storage vessels.
. -ft-building 75 m by 48 m capable of"housing a 100 MWe turbine generator
""sysUim is- included'in the s i t e plan. The size and scheduling of this unit
is uvtifcatt1 u but is included in the ini t ia] design, A power substation
rated at 'b0 W maximum, 132 kV power feeds the fac i l i ty . Emergency power
of *> 2 MV will also be provided in strategic areas by diesel driven MG sets .
•11-68

igosts and Schedule
i^^^--^;ai«c t-^t^.c«t .fo^ mi . W H Adding
25% for engineering and 25% for _ontingency brings the grand total to $868 M.
,\"cost"breakdown_is_given in Table 11-18.
^ • " - V W t a d dealg.. and construction schedule has been developed. Eight
years are required from the initiation of preliminary design to inrtxal
operation, and s i , years a « required from the initiation of detailed
4 l e XI engineer^ design to ttttlal o^aUon aft EPR. ThiS schedule
is based on two-shif t/5-days-a-week operation.
nftr- tcal Investmeal: Direct Cost EstimateTable II-W.
Structures and Si£e Facilities
ReactorReactor Plant Facilities
Auxiliaries
TJtal
Engineering (25%)
Contingency
Grand-total
11-69
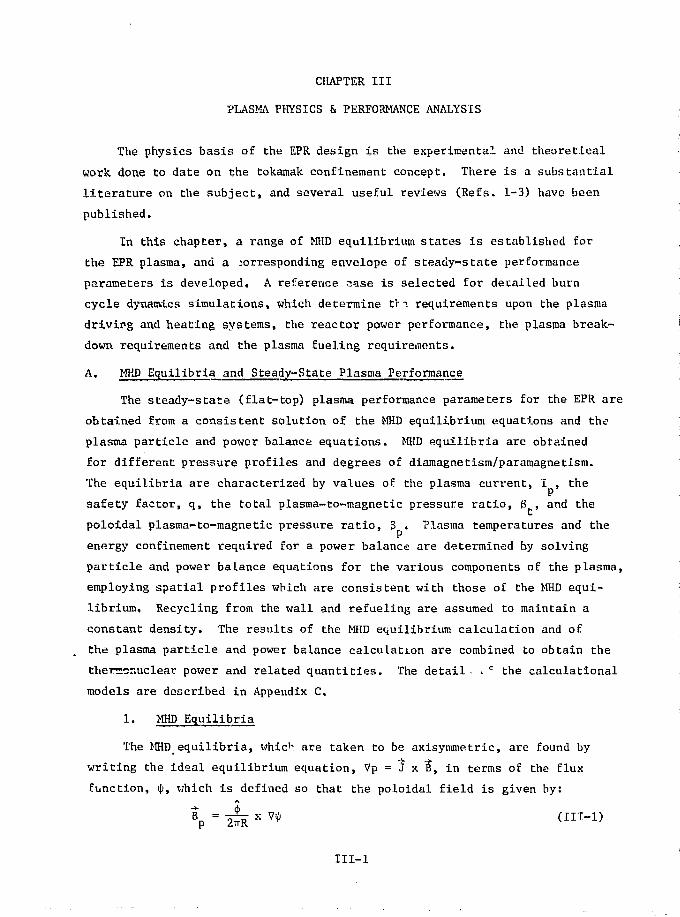
CHAPTER III
PLASMA PHYSICS & PERFORMANCE ANALYSIS
The physics basis of the EPR design is the experimental and theoretical
work done Co date on the tokamak confinement concept. There is a substantial
literature on the subject, and several useful reviews (Refs. 1-3) have been
published.
In this chapter, a range of MHD equilibrium states is established for
the EPR plasma, and a :orresponding envelope of steady-state performance
parameters is developed, A reference ease is selected for detailed burn
cycle dynanvlcs simulations, which determine th?. requirements upon the plasma
driving and heating systems, the reactor power performance, the plasma break-
down requirements and the plasma fueling requirements.
A, MHD Equilibria and Steady-State Plasma Performance
The steady-state (flat-top) plasma performance parameters for the EPR are
obtained from a consistent solution of the MHD equilibrium equations and the
plasma particle and power balance equations. MHD equilibria are obtained
for different pressure profiles and degrees of diamagnetism/paramagnetism.
The equilibria are characterized by values of the plasma current, I , the
safety factor, q, the total plasma-to-magnetic pressure ratio, (5 , and the
poloidal plasma-to-magnetic pressure ratio, 3 . Plasma temperatures and the
energy confinement required for a power balance are determined by solving
particle and power balance equations for the various components of the plasma,
employing spatial profiles which are consistent with those of the MHD equi-
librium. Recycling from the wall and refueling are assumed to maintain a
constant density. The results of the MHD equilibrium calculation and of
the plasma particle and power balance calculation are combined to obtain the
thermonuclear power and related quantities. The detail. . e the calculational
models are described in Appendix C.
1• MHD Equilibria
The MHD equilibria, which are taken to be. axisymmetric, are found by
writing the ideal equilibrium equation, Vp = J x 5, in terms of the flux
function, 1(1, which is defined so that the poloidal field is given by:
III-l

where $ is the unit vector in the aaimuthal direction. It can be shown that
Che magnetic field lines are tangent to the surfaces IJJ = const, and that
the pressure, p, and the quantity, F = RB s are functions of i|t only, where
R is the major radius and B is the toroidal field. Thus, p and F are also
constant on the flux surfaces, The equilibrium equation is usually solved
by specifying p(t|)> and F(iji) and solving for i|)(r). This procedure is treated
in more detail, and definitions of the various quantities are given, in
Appendix C«
The parameterization of p and F that is used in this reoort is:
p Q £a (III-2)
F2(if>) = F2 (1 - Sip3) (III-3)o
JVlLl .1°;at liraiter , .
(III-4)1 at magnetic axis
where iK i s the value of I|I at the edge (limiter), and if) is the value of i>
at the magnetic axis. The parameters a and $ characterize the profiles in*\
terms of the function v» and 6 is a parameter that characterizes the dia-
magnetic/paramagnetic effect of the plasma. (The plasma is paramagnetic if
5 < 0 and diamagnetic if 6 > 0.) Outside the plasma p = 0, and F = F =
R „ . x B = const., where R „ is the position of the superconductormagnet max magnet _on the inside leg of the TF coil, and B is the field at the superconductor.
max
Only equilibria with a = B are considered here. In the usual large aspect
ratio approximation, which is valid near the magnetic axis, |i « r!, The
profiles are then approximately:
(III-5)
where a is the plasma radius. These shapes are shown in Figure III-l for a
variety of values of a.
As shown in Appendix C, if IJJ is a solution corresponding to a given
and F(iJO , then Xif» is also a solution, provided:
p -o
6 •+ X26
F , . Fo o
III-2

0.0
lll-l. Radial Profiles
III-J

where \ is an arbitrary positive constant. The associated quantities which
characterize the solution, ip, scale as:
p P
q -> \"1 q.
Thus, for a given profile shape (« = 6) one would .like to take A as large as
possible in order to get the highest B . Tokamaks are unstable, however,
if q < 1, so the largest allowable X is the one that makes q (0) ~ I. (For
a = S > 0 , q>,q (0),) In this section \ is chosen so that q(Q) 3 I for all
the equilibria considered. (It is also possible to scale the solution with
F > but the highest 6t is the one for the highest F , so that F will be
taken to be R m a g n e t B ^ . )
Figures III-2 to IH-4 show the parameters (p , B , q(iJO and I ) which
characterize the equilibria that may be obtained for various values of the
profile exponent (a = B) and diamagnetic/paramagnetic (i5) parameters in a
circular tokamak plasma with dimensions (R = 6.25 m, a = 2.1 m, R , =e ° TFC magnet
2.79 m) and maximum toroidal field strength (B = 10 T) corresponding to
the ANL EPR design. For each value of the profile, there exists a range of
equilibria corresponding to different values of the diamagnetic/paramagnetic
parameter, 5. For a fixed profile, as the parameter 6 is increased (which is
equivaL'.'K. to increasing g ), the plasma current distribution becomes in-
creasingly pushed to the outside of the torus, with current reversal eventually
occurring on the inside of the torus. The dashed line in Figures III--2 to
III-4 defines the locus of points at which current reversal occurs.
For a given profile, the maximum value of B — hence, the maximum thermo-
nuclear power — occurs for a value of the parameter 6 that is nearly the same
as the value for which current reversal occurs. Thus, for a given profile,
the equilibrium corresponding to the value of 6 for which current reversal
occurs is designated as the "optimum" solution and is shown by the dashed
line in Figures III-2 to III-4. It is interesting that the value of 6P
*In this report B is defined as in Appendix C. Other definitions, althoughthey agree at lower values of 6p, do not agree at high Bp. In particular,the definition used by Callen and Dory^ is always higher for the sameequilibrium. For example the Shafranov limit5 for the definition usedhere is 6 <. 1/2 A, but for the Callen and Dory definition is 8CD <. «,
III-4

0.10
I
0.08
0.06
0.04
0.02
0-00
Jt < 0 SOMEWHERE * = f- = 1.0
3 4 5 6 7 8 9 10 ii 12 13 14 15 16
Ip, MA
Figure III-2. MHD Equilibria at B " = 10 T — Total Beta.nmx

3.0
i
0.0
Jt< 0 SOMEWHERE
Jt> 0 EVERYWHERE
a * B = 1.0
3 4 5 6 7 8 9 10 11 12 13 14 15 16I p i MA
Figure III-3. MHD Equilibria at B T F C = 10 T Poloidal Beta.max

«••«
10
Jt<0 SOMEWHERE
Jt>0 EVERYWHEREa = 3 = 1.0
3 4 5 6 7 8 9 10 11 12 13 14 15 16
Ip. MA
Figure III-4. MHD Equilibria at B m a x = 10 T Safety Factor.

corresponding to this optimum solution is confined to the rather narrow range
1.8 i S > 1.6 for the profile range 1 > a = 6 >. 2, although the corres-P
ponding variation in 6 is quite large. This value of 0 is approximately5the Shafranov limit S <. A/2 = 1,5, although the separatrix is not es-
Ppecially close to the plasma, as can be seen in Figure IV-3. The optimum
equilibrium not only has the largest value of 8 , for a given profile, but
also has the largest value of qCijO and the smallest value of I which canK. p
be obtained with that profile without current reversal in any part of the
toroidal cross section of the plasma. Since a higher q(iJO is favorable
for stability and a lower I implies less demanding requirements on the
plasma driving system, the dashed lines in Figures III-2 to III-4 represent
optimal solution loci in these two respects as well.
It is apparent from Figure III-2 that broader profiles are associated
with higher values of 8 and I and lower values of q('lO. The ranget P K
1 <. a = S <. 2 is thought to include the equilibria relevant to an EPR plasma.
The reference design profile was chosen by selecting the profile whose optimum
solution has qOl O = 3.0, a value below which confinement has experimentally' 6
been found to deteriorate."' From Figure III-4, this is seen to correspondto a = 8 % 1.3.
The poloidal magnetic fields and the toroidal current density are shown
in Figure III-5. The flux lines for the poloidal field are calculated by
constraining the plasma boundary to be a circle of radius 2.1 m. The field
due to the plasma current loop alone is calculated, and the remaining part
is the required external field. Alternatively, one could specify the place-
ment of the external coils and their currents, along with the plasma current,
and let the plasma boundary be determined. It is found that if the external
coils are such as to give a nearly circular plasma edge, then the MUD
equilibrium parameters obtained in the two ways are the same. The parameters
in this section were calculated by the fixed boundary method, and a combina-
tion of the two methods was used, as described in Chapter IV, to determine
the location of the coils and currents that would give this equilibrium.
The field lines are shown separated by equal amounts of fl«.x, <i'. The
same lines are also pressure,? = KB , and safety factor contours, al-
though not separated by equal p, F or q intervals. Figure II1-6 shows the
III-8

TOTAL POLG1DAJ. FIELD FLUX SURFACES CURRENT DENSITY CONTOURS
5.0 6.0 7.0 B.0 4.0 5.0 6.0 7.0
I 2.5
2.0
1.5
1.0
0.5
4.0
EXTERNAL FIELD FLUX SURFACES
A
5.0 6.0 7.0
\
B.0
0.5 ~
R, m
PLASMA FIELD FLUX SURFACES
inr*Figure III-5. HHD Equilibria at B = 10 T
Current Contours
-Flux and

FLUX FUNCTION PRESSURE
o TOROIDAL CURRENT DENSITY
0.0
TFCFigure III-6. MHD Equilibria at B" = 10 T Profiles.

flux function, pressure, and current density profiles along the mid-plane, and
q as a Junction of 1J1, The pressure in this high beta equilibrium is peaked
substantially toward the outside, with the current density being peaked even
more to the outside.
2. '•ce. dy-State Performance
Using the p-rameters (qOlO, & , 3 , I ) of this reference design MHDx t p p
equilibrium solution, the performance parameters of the reference design were
calculated with the global plasma particle and power balance code described
in Appendix C, for an average electron temperature of T =10 keV, a value
chosen on the basis of studies discussed in Reference 7. In performing the
global calculations, which are based upon spatial averages over the plasma,
it was necessary to decompose the pressure profile into the product of tem-
perature and density profiles — this was done by assuming the functional
form of Equation III-5 for both and requiring that a + aT = a = 1.3. A
relatively broad density profile (a =0,3) was chosen to reflect the effect
of recycling, and a parabolic (a = 1.0) temperature profile was ohosen. An
impurity concentration of 0.5% background ls0 and 5.0% wall-sputtered 9Be
was chosen based on burn cycle dynamics calculations that will be discussed
in a subsequent section. The D-T ion density, hence the thermonuclear power,
is limited By the value of 3 which is determined by the MHD solution — these
relationships are discussed in Appendix C. The performance parameters for
the reference, design are summarized in Table III-l, for two values of themaximum toroidal field, B . Operating at B =10 T, the upper l imit
' max r ° max
for NbTi superconductor, and 0 = 0.048, the reference design produces
638 MWt during the flattop portion of the burn pulse and will be an ignition
device if energy confinement is as good as predicted by trapped-ion-modeTTrp(TIM) theory. At li = 8 T, the reference design produces 261 MWt and will
max
be an ignition device if energy confinement is about 4 times the TIM pre-
diction.
The reference design point serves to provide a set of nominal parameters
which characterize the plasma performance of the EPR. However, as i s
apparent from Figures III-2 to I I I -4 , there is a rather wide range of MHD
equilibria which may obtain, depending upon the pressure profile (a = B) and
111-11

1—* ESfjr-
, _ - ;
_
Table TI I -1 . Plasma Performance Design SummarySteady-State Conditions
^="-^ - - - = " — - - — - -
Beta poloidal, 8p
Beta -toroidal, 8t —Safety factor, q(0)Safety factor, q(ijii) - -
|P laama c a n t e r , - RQ (m)
-
- - -_
—
_: — ~_-_
- ~ -
-
- - -
—
v -
- , - -
- .
1
Magnetic axis, R^'m)Minor radiusr a (ra) •Aspect ratio,~A_Volume, Vp ,m!) ""Profile exponents
- Pressure,--a-« 3Density, an
- -.Temperature, cxj , .
Biawagnetlc/paraaagneticparaBieter,- Silacerori" tempera cure,' fe (keV) . -Loti"temperature, TDT (kt-V)
Confinement requited for-ignition, IIT (s/m3)
. 1 6 o '".-]--•'9 B e
Effect ive charge, Z~^~
Paak-.fleld at TF coils,-"BTrC (T)
Vacuum f ie ld at centerl ine , Bt (T)
Vacuum F. F0-(T)
Plasma current, Ip"~(MA)
Plasma pressure (Nt/m2)
Peak. p0 - ' - - - - - - - - . - -
—Average, -p • 1
Flux function (Kb)
_ Magnetic ax'is, iji *"
Lio i ter , <i>
Density (m"3) " "-- -
D " T V"DTElectron,-iiAlpha, n •
Thcrnonuclear power, PT (MWt)
Neutron wall load, P_i (MW/n2)
lat io of nT requ:reil' foi ignJci c m to nxpredicted by TE;,_j _ _
_
-
""
-
-
10.04.47
27.97.58
10;4 "x
-f.b x
0.0
39.5
9.4 »" "1.0 x
1.1 x638 -0.86
1.0
__ 1.70.0481.003.05
' 6.256.862.1
2.98544
1.3
0.3
1.0
0.059-10.0
976"
2 .4 x
• 0 . 5
5.0
1.3
•165-"
105 .
101"
10*°
IO'S
-
1020
-
8.0 -3.'58
22.36.06
6.6 =<2.4 "
0.0
31.6=-
6.0 x6.5 x6.9 x
261
0.354 0
-
-
-
10*
105
-
1019
l o i s
1017
_
-
-
1
- .
-
- '
—
-
111-12

the diamagnetic/paramagnetic parameter, 6. Furthermore, for each MHD
equilibrium solution, a range of plasma conditions is possible. Thus,
it is necessary to consider the range of MHD and plasma power balance
solutions which define a performance" envelope for the"EPR plasma.
Variation of "the diamagnetic/paramagnetic parameter, 6,-for the
'reference profile (a = 3 = 1.3, c^ = 0.3, «T = 1,0), is examined in
Table III-2", This variation corresponds to a curve of the type shown in
Figures III-2-to III-A for a = 1.3. The peak pressure (Po)» thermo-
nuclear power CPT), neutron vail load (P ), average DT density (n^,) and 3£
all have their maximum, values at the optimum MHD solution. Similarly,
the ratio (a, „) of the energy confinement predicted by TIM to the value re-
quired for ignition is minimized at the optimal MHD solution. There is
no incentive tp operate in the questionable regime where current reversal
(J < 0) occurs. Operation below the optimum, B = 1.72, results in lower
power, a"lower safety factor, qOJJ8), higher confinement requirements,-and
larger required plasma current thanffor the refi r?nce design point.
Variation of the profile (a = 3) is examined in Tablt III-3, where
the performance parameters for the optimum MHD solution for each nrofile
are tabulated. This variation corresponds to the loci defined by the dashed
lines in Figures III-2 to III-4. For the plasma power balance calculations,
a broad density profile (a =0.3) was fixed, and the temperature profile
was varied as required (a = a - a ) . The plts,ma performance parameters
are strongly dependent upon the pressure profile. The power output (P ,)
and related parameters (n^,, T^, p Q, Bt) increase dramatically with a broaden-
— ing- pressure profile.- The value -of- nT—required-for- -ignition increases .only
slightly, but the ratio a decreases rapidly with a broadening pressure pro-
file, if energy confinement does not degrade in the EPR for qOl^) < 3> then
the EPR could operate at higher plasma currents with broader pressure profiles
(a < 1.3) to achieve higher S and power output than are associated with the
reference design.
Even if the pressure profile (o = S) and the diamagnetic/paramagnetic
parameter (6) are fixed, there exists a wide range of solutions to the plasma
power balance equations, corresponding to different plasma conditions. Thus,
the reference design MHD solution corresponds to a variety of possible plasma
solutions with corresponding performance parameters.
111-13

Table I I I -2 . Sensitivlny ojs: tire Plasma Performance to; the Diagmagnetic/Paramagnetie Parameter, 5
( T e = 1 0 , x 1020 s/ra3, 0.5% 160 and 5%;9Be impurities, Z1 1.3, a = 0.3 a,, = 1.0)
'effq{a) = 1 , ct = 3 -
M.
BTFC
max(T) 6
8.0 -0.061-0.036
i-0.020H 0.000if 0.024IK 0.0371 0.051
!! 0.059M 0.066
0.079;o.09i
10.0 -6.061-0.036-0.0200.00Q0.024
i0.037|0.051i 0.059! 0.066I 0.0791 0.091
6r<
0 .50 .70 . 81.01.21.41.61.71.82 .22 .5
0 . 50.70 . 81.01.21.41.61.71.82 .22 .5
\ q;
0,031^ 3o>o36; a0.039! 10.043i i0.046i ;0.047! i0.048' !0.048i I0.048• :0.046: *0.043 i
0 . 0 3 1 i : |J0.036! ~'i0.039! 00.043 -i '!0.046! 'i0.047! ;0.048! \0.048! q0.0481 •]0.046! S|0.043 7
. • ; 7 : !
• 9!i O :
. 3 !
. 5 :i:'8'i
ib.4;'5%
.7
. 8i9'.'O'.\
i '3 'i.5'. 8.0.4'.15
1D
(MA)
988776
66554
111010
99877765
.0
. 6
.2
.8
. 2
.8, £
.1
.8
.1
.3
.2
.7
. 3
. 8
.0
.5
.9
.6
.2
.3
.3
CO5 Nt/roz)
3.94.65.15.66 .16.46 .56 . 06.76.76.6
6 . 17.27.98.79 .59.9
10.210.410.510.510.3
Rm
(m)
6 ,56 .66 .66.76 ,76 .86.86.96.97.07.1
6.56.66.66.76.76.86 .86.96.97,07.1
DT<1O2D m"3)
0.380.450.490.530.570.59 '0.60 '•0.600.600.580.53
0.600.700.760.83O.900.920.930.940.930.900.83
PT
(MW)
! iO7148175206239
1 253
260261258241205
2613604265035836 1 /635638630588500
PV
CMW/JB 2 )
0.140.200.240.280.320.340.350.350.350.320.28
0.350.480.580.680.790.830.86 ,0.860.850.790.68
i
"TIM
8.56.15.24 .43.93.83.S4.04.23.17.5
2 . 21.61.41.21.01.01.01.01.11.32.0
Jt< 0
nonononononononoyesyesyes
nonononononononoyesyesyes

lable IIJ-3. Plasma Performance of the Optimum ISquiJibria as a Function of Profile
[T = 10 keV, 0-5% 16O and 5% 9Be Impurities, ~Z « = 1,3, q(a) ~ 1]
HM
V
max<T> a
8.0 11111
t-|
2
10.u 1111112
= 6
. 0
.2
.3
.4
.6
. 8
. 0
. 0
. 2. 3. 4.6. 8. 0
a
0
0
n
. 3
. 3
°T
0 . 70 . 91.01.11.31.51.7
0.10 .91.01.11.31.51.7
4
0.0830.0660.059: '0.0530.043!0.036J0.030
•• 1 • •
0.'083:0.066;0.059^0.0530;043; iOi0360i030! :
Is1
jljl1j l
jl
llll111111
p
. 8
. 7
.7
.7
.7
.6
.6
.8
.7
.7
.7
.76
.6
B t
0.0840.0580.0480.0400.0290.0210.016
0.0840.0580.0480.0400.0290.0210.016
q<a)
2 . 42 . 83.03.37 . Q
4.55.2
2.42 . 83 .03 .33 .94 . 55.2
IP
(MA)
7.86 .66 . 15.64 . 84 . :3 .5
9 . 88 .27 .67 .06 , 05 .14.4
Po(105 Nt/ffi3)
9.47.46.66.04.94.0 :3.4
14.611.610.4
9 .37 .66 . 35.3
"BX
1-0910.720,60?0.500.350.250.18
1.701.130.940.780.540.390.28
T
) (keV)
9 . 69,69.69,69.69.79.8
9 . 69 . 69 . 69 . 69 .69 .79.8
P
(MW)
747367261187985329
182089663845723912970
Pw
(MW/ra2)
1 .01
0.500.350,250.130.070.04
2.461.210.860.620.320.170.09
U O " s/n.3
2.72,52.42.42.22,22-1
2.72.52,42 , 42 . 22 . 22 . 1
> a I K
1.42 . S4 . 05.4
10.519.537.2
0.40 . 71.01.42.75.19.7

Different decompositions of the pressure profile (ft) into density (a ) and
temperature («„) profiles such that a = ci + »,., - 1,3 are examined in Table
IIX-4. ^he power output is maximized by a very broad temperature -profile
(a <v .1) and a peaked: density profiles (a ^ 1.2), The energy confinement
required for ignition is minimized by comparable temperature ntul density
profiles. It is more reasonable, however, to expect a broad density profile
with a less broad tetnperatvire profile, and it should be noted chat Che per-
formance is noc so sensitive to a and a for fixed a as tt is to changes
in a.
For comparison, the performance parameters that result froir, the global
plasma power balance when the temperature and density profiles are assumed
Co be flat (« = »T - 0) are also shown in Table III-&. Thost solutions are
based upon the same MHD solution (I » B , 6 , q(i|'})), plasma impurity con-
centration and average electron temperature (T% ~ 10 keV) as are tin1 other
global power balance solutions in the table. Accounting for the temperature
and density profiles in the global power balance model results in a signifi-
cant increase in power output and a significant decrease in the energy con-
finement required for ignition, relative to the use of flat temperature; and
density profiles. The manner in which these profiles are Incorporated into
the global power balance model is described in Appendix C.
For a given set of parameters characterizing the MHD equilibrium, and
for a given decomposition of the pressure profile into temperature and
density profiles, solutions to the plasma power balance equations can be ob-
tained for a range of average ion and electron temperatures as shown in
TableTtt-I-5.For a fixed $ , an increase in average temperature requires
a decrease in average density, and vice-versa. The fusion cross section*
<av> is a rapidly increasing function of the ion temperature in the vicinity
of T _ = 10 keV, and the fusion reactivity parameter, <cv>/T2, has a broad
maximum around T ^ 13 keV. The thermonuclear power is proportional to the
reactivity. Because of higher central temperatures associated with a para-
bolic temperature profile, the total thermonuclear power output is maxi-
mized by operati.'.in at an average ion temperature of T"nT 3} 7-8 keV. The energy
confinement required for ignition decreases with temperature over the range
Fusion cross section data are taken from References 8 and 9 for T <_ 10 keVand from References 10 and 11 for T > 10 keV.
111-16

Table III—U i'laaraa Veriarmmce as n Fnnccion of T<?sKu*ir«tm'e and Ufnailv
(fe = 10 keV, .57. 160 and 57. 31U- tiapuricy, !,„ = 7.58 MA, 2 f f » 1.3, q{0) = 1, q<«) «• 3.0,
V » 1.7, 3 t - V B % )
•itc"inaK
(T>
8.0
10-0
8.0
•.o.o
'X
n
0
0 . 3
0 , 6
0 , 9
1.2
1.3
0
0 . 3
0 . 6
0 . 9
1.2
1.3
0
0
aT
1.3
1.0
0 . 7
0 . 4
O . I
0
1.3
1.0
0 . 7
0 . 4
0 . 1
0
0
0
> • ,
(10- ! J sT3)
0,66
0,60
0,5B
0.60
0.67
0.70
1.03
0.9A
0.91
0.94
1.04
1.10
0.70
1.10
Vr(k ty)
9 . 8
9 .6
9 .5
9 . 5
9 .6
9 . 7
9 . 8
9 .6
9.5
9.5
9 .6
9 .7
9 .6
9 .6
250
26)
271
27H
280
277
611
638
662
hm683
677
188
E'w
{J5W/ra-;)
0 . 3 4
0.35
0.3?
0.3S
0.38
0,37
0.86
0.89
0.92n,92
0,91
0.25
0.62
(10" s/rr) :
2.8 !
2.'«
2 .3
2.A
2,8
3.0
2.i>
' - ' . •
2,3
2J-. i
2.S
3 . 0
1T I M i
&.9
A . (.)
3.6
3.6
4 .2 ;
J . 3
3.0
0 , 9
3.0
1.1
3,2
h.(>
1.7
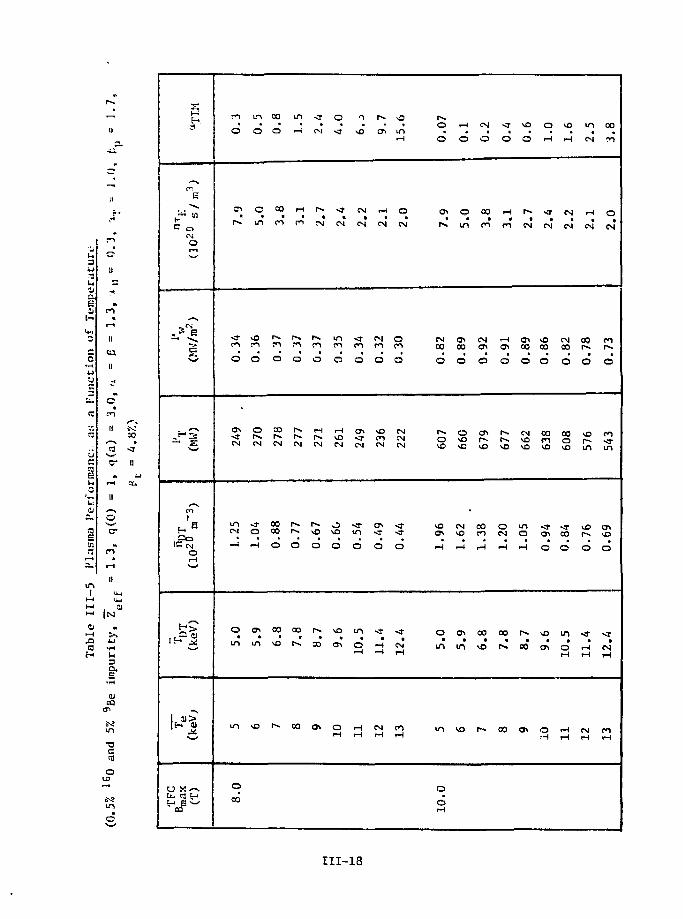
3
uu
o
y
V.
inI
N:CO
©
tcu
caen
in.
o
E-
^S
C o
Or«*
. 3 < S B
s
~ w
Soo
m
O
O
vrCM
m
—i
oin
m
oCO
o
cin
-oroO
270
^t
oi-4
m
vO
oo
O
05
O
o
278
00
o
CO
vO
m
r-i
m
f*N
o
277
r-.
o
00
00
CM
CM
O
271
|N,
vti
O
00
O
•4-
CM
inCO
O
261
ovuo
VO
ON
O1-4
•T
vO
CM
CN
<r
O
ON
CM
•NTin
O
Ot-4
rH
ON
rH
CN
CNenO
236
ON"*
o
i - ll - l
CM
°.in1-4
oCM
OroQ
222
^j.
•*
o
CNiH
nH
I-.Oo
Ov
r».
CNCO
O
607
VD
om
m
odH
r-4
O
O
in
Ov00
o
099
CMVO
in
vo
CM
o
00
CM
O
679
00en
CO
vO
sr
o
r-4
cn
C3N
o
677
oCM
00
'"*
00
VO
o
CM
CO
o
662
mo
CO
ON
ol-l
<rCM
vO00
O
638
ON
o
VO
ON
O
VO
i-l
CM
CM
CM00
O
608
00
o
m
10.
HH
mCM
rH
CN
00
O
j 576
vOr-O
11.
CM
CO
•n
oCN
fN.
o
N3-
m
ONVO
o
12.
r-4
111-18

1 1 / • >
considered, but, since the TIM theory predicts a T " scaling, r*TIj.j
increases with T. It it apparent that the power performance could be im-
proved relative to the reference design by operation at a lower average
temperature.
3. Subignition Plasma Performance Analysis
In the event that the required energy confinement for ignition is greater
than that which is obtained, the EPR plasma can be operated in a beam-driven
mode. The reduction in required energy confinement that results from supple-
mental power injection into the plasma is shown in Table III-6. The parameter
£, is the ratio of the beam heating power (including supra thermal fusion) to
the alpha heating power, and Q is cite ratio of the total power less the in-
jected power to the injected power. Up to I' = 60 MW of supplemental beam
heating is currently included in the EPR design. It can be seen that in-
creased supplemental heating is associated with lower required in and f'TTw.
little change In wall loading, and increased total power. Most of the in-
crease in total power is composed of the injected power itself — the fusion
power, as indicated by the neutron wall loading, is little changed.
Since the confinement that will be obtained in an EPR is uncertain at
this time, it is instructive to look at the performance as a function of
the, confinement parameter, n T E« Trapped-ion-mode (TIM) confinement theory
is the most pessimistic of the confinement theories which are thought to2
be plausible for the reactor regime, so the parameter <*TTM = (nt) * (nT pre-
dicted by TIM) is useful in gauging the reasonableness of a given value of nz
This parameter is shown in Figure III-7 for T = 5 and 10 keV and B = 8e max
and 10 T, It can be seen that a__., < 10 in all cases and that amT,, $, 1 forx IM U N
a wide range of parameters. Thus, it appears that, even with the pessimistic
TIM prediction, there exists a wide range of in. over which operation in the
beam-driven mode is. possible.
The parameter Q , shown in Figure III-8, measures the efficiency with
which thermonuclear power is produced in the beam-driven plasma. At ig-
nLtion, Q = °°, and net electrical power production is plausible for Q ^ 10.
An EPR should achieve Q > 10 if ntE > 1 x 10² 0 s/m3 at ¥ = 10 keV or if
ntg > 4 x 10 2 0 s/m3 at f = 5 keV. For ignition, n-r > 2 x 10 2 0 s/m3 is
required at I = 1 0 keV and or > 8 x 10²⁰ s/m3 is required at T = 5 keV.
111-19

Table XII-6. Subignition Plasma Performance as a Function of Neutral Beam i'ower
= 1.3, q(a) = 3.0, a = 0 = 1.3, t*n = 0.3, a,
e = A.8%)( ? = 10 keV, 0.5% a 6 0 and 5% 9Be impurity, = 1.0, 1.7,
M1-1
BTFCmax
CT)
8.0
10.0
5
0 . 0
0 . 2
0 . 4
0 .6
0 . 8
1.0
2.0
13.8
0 . 0
o.z0 . 4
0.6
0.8
1.0
2 . 0
13.8
'VCO
27.414.0
9 . 5
7.3
5.9
3.2
1.0
27.5
14.1
9.6
7.3
5.9
3 . 2
1.0
Pfl(MW)
0
10
19
29
38
48
93
269
0
24
47
70
94
117
227
658
nDT(10?0 nf 3)
0.600.590.590.580.57
0.J6
0.53
0.2b
0.940.930.920.90
0.89
0.88
0.820.4i
V(keV)
9.6
9 . 7
9 . 8
10.010.1
10.2
10.9
15.7
9.6
9.7
9.8
10.0
10..1
10.2
10.915.7
PT(MW)
263
276
2 9 ;
305
319
332
394
539
638
674
710
745
779
812
961
1320
rV
(MK/ar)
0.350.360.370.370.38
8.38
0.41
0.36
0.860.88
O.900,9!
0.92
0.94
0.99
0.89
' « E
(5 0-'- sAir'j
2 4
1.5
1 .6
1.4
1.2
1.0
0 .6
0.09
3
• ' < <
J..2
1.0
0 . 6
0.09
•-.a3 . 3
2 . 8
2.5
2.3
2 .3
1.5
1.2
1 . 0
0 . 9
0 . 7
0 . 7
0.6
0.5
0 . 4
0 . 3

uV- -
10'
If)
10,-2
10" 3
m a s/
max10T
T = 10 keV_eT = 5 keV
IGNITION
I I I I I I 1 11020
nt , s/m3
Figure III-7. Confinement Requirement for Subignition,Beam-Driven Operation.
111-21
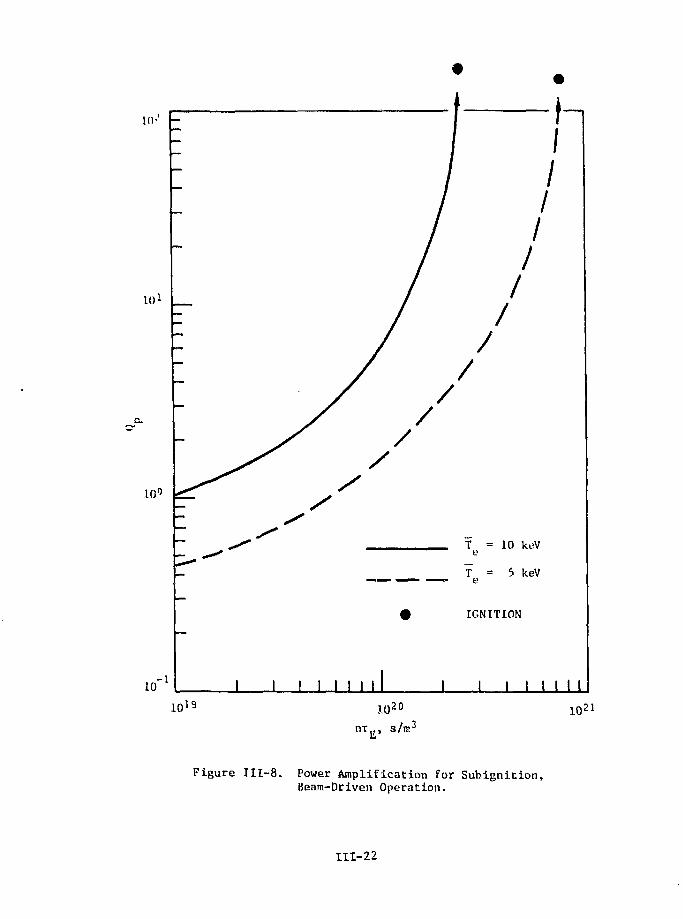
10- -
101
10°
= 10 keV
T = 5 keVa
IGNITION
10-1 I I I I I I I I I I 1 I I 1 I I
10 1 9J.O20
£ , s/m3
10?-1
Figure III-8. Power Amplification for Subignition,Beam-Driven Operation.
ItI-22

Figure 111-9 shows thu total puwer, I', whKh is the thermal power out
of the plasma by nil means (neutrons, radiation, heat). It can be seen
that power production Improves with decreasing nt , so that many of the
technological objectives of an EPR can be met in a subignition device,
even if nee power production is not possible. The increased power output
at low values of ni is, of course, a direct consequence of the increased
supplementary heating, as can be seen in Table III-6,
The wall load, P , of 14 MeV neutrons on the first, wall is shownw
in Figure 111-10. li e wall loading is relatively insensitive to nig,
at T = 10 keV, but can be substantially increased at T = 5 keV by
operation at low m „ . As with the total pwer, however, more supplementary
heating is heeded for operation with low values of ut_.
A, Particle and Radiation Fluxes on the First Wall
A major utilization of the EPR will bt as a radiation test facility.
Its large wall area, A * 592 m2, is an advantage for this purpose. The
particle and radiation currents incident on the first wall and the corres-TFC
ponding spectra are shown in Table III-7 for B = 8 and 10 T. Both ignition
(reference) and highly driven (5 * 1) cases are shown. Table III-8 shows the
neutron flux energy distribution at the firsf. wall, normalized to a mean neu-
tron wall load of P =0.5 MN/m2. The poloidal variations in the neutron wall
w
loading, as well as those in the various response rates, are given in detail
in Section A of Chapter IX. These poloidal variations are affected by
the curvature of the toroidal geometry and even more by the spatial
distribution of the neutron source strength, which is taken to be shifted
according to the magnetic flux surfaces of the reference design.
The fast alphas are those that escape before they undergo a collision.
These alphas fall into two categories: those born on banana orbits that
intersect the wall and those trapped in asymmetries in the toroidal field. *
It is estimated in Section 5 that about 1.2% of the total alphas fall in the
first category for B = 8 T, and about 0.4% ii>r B = 10 T. The number
of alphas falling in the second category depends on the field ripple, which
has a maximum value of 1.38. The alphas lost by this means will be lost near
the outside edge of the plasma in localized regions between the toroidal field
coils. It is assumed that 1% of the total alphas will be lost in this manner.
• % - •
111-23I
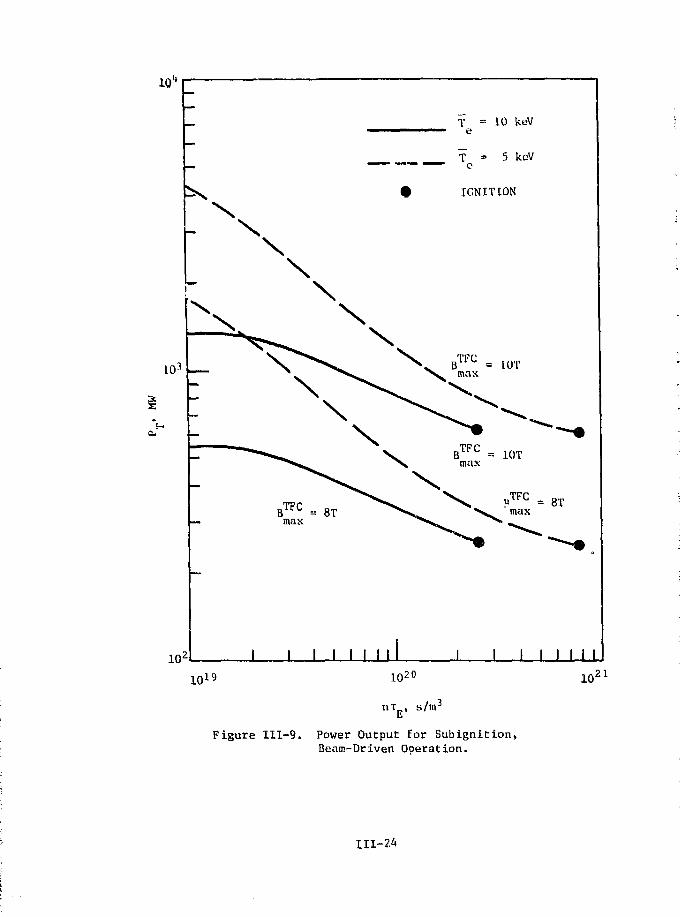
10"
T = 10e
T = 5 keVe
IGNITION
10T
max
10^ I I I I I I 11 I 1 I I I I I I
1019 1020
tit , s/m3
1021
Figure 111-9. Power Output for Subignition,Beam-Driven Ooeration.
III-24

2,1
1.2
0.9
0.6
0.0
T = 10 keVe
T = 5 keVe
IGNITION
B T F C = 8Tmax
J I 1 I M i l l l _ _ J 1 I I
9.0
8.0
7,0
6.0
I4.0 §
2
o
3.0 %
2.0
1.0
1021
Figure 111-20. Neutron Wall Load for Subignition,
Beam-Driven Operation.
111-25

Table I I I -7 . First-Wall Particle and Radiation Currents for the EPR
-r.3, f = 0.048) ^t
— _^-A u i s oa.ti'^aiiii. H u t U*«. At S*'« i ln^ds u^Lape t^Cor-1 «t»«i '^ dywn iar Bl^^ "_*0t JTIJ 2.2^ tuc B ^ ^ • a t , becaunE thfv at* on— — ^j*uooi '*r*>tt^ thu? trtter'iiect. tV*1 w>*iV or ^t»t-aus« thif* atw trappW In aeiEruthat (Hymetr»e5' l» tite mit^netlc f i e l d . .
-njl node! assuac*- Lhe Alpha1* ftlau *lo>*n, then (Uffune out* s j Che a&ptias hiciins the wall have the plasaa edgeip^raturci On the qther ha[\^. thgrg~i»^atv gq'uttbriup dtftHb»tlw» of slowing-dawn alphas vith Garage en^tgv oC 1.3 McV.
^HIMX tsf the e s i l l ru»t likely diffuou out before they siov ism, but J'> • tlaate »t the nu»h..r of them' l» out Inclirtea.""
;*fa?tfra£urtf nf JOO eV is
vim1 uT i lizard recnmbijnt I 'O CttftatJon
n f Z- 1.5Tr.7aJ. Tl« four ia»o In Al t tnli!e";orrcipom! to p^ • 0.H6, 0.W,
" ~ ~
reta wpucttu^i fH included.
111-26

5 r
111-27

5. Suprathermal Alpha Particle Effects*
Some of the fusion-created alpha particles are born on orbits that are
not qcrcttainfd: in the plasma; a;nd are, • hence, lost to th* first wall before
they slow: down,. In otdet EQ calculate the escape fraction, a grouping
technique is employed* Each group is comprised of alpha particles borr.
within a given phase space volume, and a characteristic orbit is plotted
for each group. (At least 38Q0 groups are used.) Groups with orbits
that extend past the plasma boundary are considered lost. The escape
fraction is shown in Figure III-ll as a function of the pressure profile
exponent* a, where the profiles are of the form given in Equation III-5, The
density profile exponent is a = 0,3; the temperature profile exponent is
ct_ = a - a ; and the current denFity exponent is a = a - 1, (The corres-•L It J
ponding performance characteristics are shown in Table III-3.) In neral,
other things: being equal, the loss fraction is lower for the more peaked pro-
files, but higher for lower plasma currents. For Che "optimum" cases shown,
the decrease in current associated with increased peaking is the dominant
effect, and the loss fraction increases with profile peaking. For the referencedesign the loss fraction is 1,2% for B ^ 0 = 8 T and is 0.4% for BTFC = 10 T.
max max
An estimate of the alpha particle heating distribution can also be
made by using the group method. It is assumed that fhere is negligible
pitch angle scattering and that the alpha particle deposits most of its
energy before significant alterations in orbit occur. The energy deposition
is calculated along the orbit as the alpha particle energy decrease? from its
initial value of 3.5 MeV to a final value of 500 keV, at which time it is
assumed to be thermalized. The resulting power deposition profile is shown
in Figure 111-12. Also shown is the case, labeled "In Situ", where the alpha
particle is assumed to slow down on the flux surface on which it is born,
(This is the assumption used in the power balance calculations). It can
be seen that for the EPR parameters the two calculations do not differ
significantly, the maximum difference being about 5%.
*The calculations in this section were performed by T. W. Petrie, NuclearEngineering Department, University of I l l inois , Urbana, I l l inois .
111-28

o
CtT.. <O...u
2.4
2,0;
1.6
1.2
Q:B
0.4
o-n
B T F C =max
- BTFC =max
r — - ^
8 T S
10 T ^ ^ " " ^
I I
1.0 1.2 . 1.4 1.6 1.8
Pressure Prof i le Exponent- a
2.0
Figure I I I - l l . Fast Alpha Escape Fraction (ci = 0.3,a - a - an,f = 10 keVs optimum MHDequilibria)
111-29

1.0-
0.8
1 0.6
Q
a)a
0.4
0.2
ua»3oft.
0.0
RTFC - 8Tmax
= 10T
IN SITU SLOWING DOTO
SLOWING DOW!ALONG ACTU/\J.ORBITS
0.0 0.2 0.4 0.6 0.8 1.0
r / a
Figure 111-12. Alpha Power Deposition P ro f i l e
(a = 1.3, a_ = 1.0, a = 0.3T n
T = 10 keV, reference design)
111-30

6. Toroidal Field-Ripple Effects
The use of a finite number of discrete TF coils to generate the
toroidal field in a tokamalc introduces a field asymmetry that can affect
plasma particle and energy confinement. The ripple can produce particle
and energy transport by two separate mechanisms. In one, Che particles be-
come trapped between maxima in Che ripple field, i.e., Between the planes
defined by tvo adjacent TF coils, and are thereby prevented from encircling
Che plasma in the poloidal direction. Consequently, Che radial component
of the inlvmogeneous magnetic field drift is not averaged by the rotational
transform and these particles are preferentially lost, The fraction of
particles so trapped is small. However, the field ripple asymmetry causes
enhanced diffusion of those particles that are trapped in the ordinary mag-
netic well in tokamaksj i.e. those particles which are in banana orbits.
These particles pass over the local ripple wells, but are trapped, is in an
asymmetric torus, by the poloidal variation in the toroidal field. The
ripple asymmetry introduces a radial drift of the banana guiding centers
and this drift produces the increased transport.
Theoretical expressions for transport coefficients for both mechanisms
have been developed, and numerical studies of these field-ripple transport
effects have been performed for the EPR. With a 2% maximum field ripple,
the diffusion coefficients due to the field ripple mechanisms are generally
several orders of magnitude greater than the neoclassical values, but are one
to two orders of magnitude lass than the trapped-ion-mode values, at all
radial locations. However, uhe ion heat transfer coefficient due to the
banana-drift mechanism is more than 10% of the trapped-ion-mode value over
the outer (r/a 0.8) region of the plasma.
In order for the EPR to operate at ignition, the energy confinement
must be 1-10 times better than the trapped-ion-mode prediction, depending
upon the value of the toroidal field and the MHD equilibrium. The energy
losses due to the field ripple must be no larger than those required for
ignition. A conservative criterion is obtained by requiring that the ion heat
transfer coefficient due to the banana-drift mechanism be everywhere at
least a factor of 10 less than the trapped-ion-mode value.
111-31
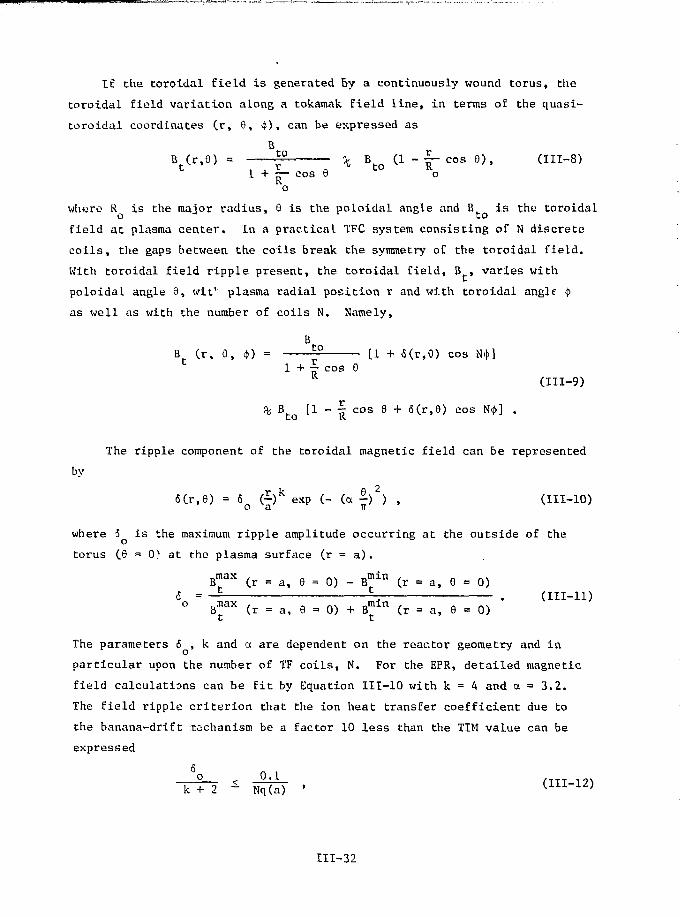
If, the toroidal field is generated By a continuously wound torus, the
toroidal field variation along a tokamak field line, in terms of the quasi-
toroidal coordinates (r, 8, $), can be expressed as
BB (r,6) = £2— ^ B (1 - ~ c o s 6), (III-8)L 1 + ~ cos 9 to o
Ko
whore R is the major radius, 9 is the poloidal angle and B is the toroidal
field at plasma center. In a practical TFC system consisting of N discrete
coils, the gaps between the coils break, the symmetry oE the toroidal field.
With toroidal field ripple present, the toroidal field, B , varies with
poloidal angle 6, wit' plasma radial position r and with toroidal angle <|>
as well as with the number of coils N, Namely,
BB (r, 0, $) = — £ 2 . [X + 6 ( r > 9 ) c o s Nl()]
1 + f- cos 0
B [1 - § cos 0 + 6(r,9) cos N<j>] .to R
(III-9)
The ripple component of the toroidal magnetic field can be represented
by
SCr.e) = 6 £)k exp C- (a V ) , (111-10)o a 7r
where 5 is the maximum ripple amplitude occurring at the outside of the
torus (9 = 0) at the plasma surface (r = a).
f x (r = a, 0 = 0) - B™1 n (r = a, 0 = 0)6 = — —. . (III-ll)0 B^ax (r = a, 0 = 0) + B^ l n (r = a, 0 = 0)
The parameters 6 , k and a are dependent on the reactor geometry and in
particular upon the number of TF coils, N. For the EPR, detailed magnetic
field calculations can be fit by Equation 111-10 with k = 4 and a = 3.2.
The field ripple criterion that the ion heat transfer coefficient due to
the banana-drift mechanism be a factor 10 less than the TIM value can be
expressed
60.1
k + 2 - Nq(a) '
111-32

F . •- -••
where q(a) is the safety factor at the plasma surface. A plot of the maximum
tolerable field ripple versus the number of TF coils is given in Figure 111-13,
as a function of q(a). For N = 1 6 and q(a) = 3.0, the reference design
values, the maximum tolerable field ripple is 5 $1.3%.
B. Transient Performance Analysis
The burn cycle dynamics of the plasma, the plasma driving system (ohmlc
heating and equilibrium field) and the plasma heating system are analyzed
in this section. The plasma dynamics model described in Appendix C, the
neutral injection system model described in Chapter V, and the circuit model
for the ohmic heating and equilibrium field coil systems described in Figure
IIX-14 are used in the analysis. The reference design plasma conditions de-
fined in the previous section are approximated during the flattop portion of
the burn pulse, and the MHD relationships for q, (3 , & and I are used as
limits in the dynamic simulation (e.g. the 3 value front the MHD calculation
is taken as an upper limit which constrains the density and temperature).
The entire burn pulse — startup, burn and shutdown — is included in the
analysis. Requirements for the plasma driving and heating systems are
established for a range of possible startup modes, and a reference mode
is selected. The power performance of the EPR is determined based upon
the burn cycle dynamics simulation, and the sensitivity to various factors
is evaluated.
1. MHD Equilibria During the Burn Cycle
T"FP
During the burn cycle the toroidal field at the coils, B , is held
constant, and it is assumed that the MHD equilibrium evolves with a fixed pro-
file exponent, a = 6 = 1.3. The equilibrium at any time is then uniquely
characterized by the values of I and 6 at that time. The burn cycle
dynamics calculation at each time step involves: (1) determination of
1 and 8 from the coupled plasma power balance and plasma driving system
circuit equations (to be described); (2) determination of the MHD equilibriumthat is characterized by I and B.', (3) determination of the equilibrium
-v P t
field, B _, that is required tor the equilibrium, and (4) determination of
the current, IgF, in the EF coils that is required to produce the equi-
librium field. Thus, this procedure determines a self-consistent relation-
ship IEfl = I E p (I , Bt or B ) that defines the current required in the
equilibrium field coils.
111-33

1
0.016
0.014
0.012
a
"3•y
Q 0.010
0.008
0.006
16 18Number of Coils
20 22 24
Figure 111-13. Toroidal Field Ripple.
Ill-34

PLASMA DRIVING CIRCUIT
HOMOPOLAR
GENERATOR 1
V \ S,VOH \ X
- l / iC" 'OH
DT
OPEN CLOSED
CLOSED OPEN
. SELF- MAXIMUMINDUCTANCE CURRENT
PLASMA U . 5 M H 7.58 MA
OH COIL 0.479 H 80 KA
EFCOIL 0.519 H 80 KA
VOH ~ LOH VoH HP O H = - . 5 7 0 M H , K = - . 2 4 7
V = M I + fl I + L IEF ''OH 'OH ''PEF l P LEF l E F
M p E F = - . 5 2 8 MH, K = - .757
M POHME F 0 H= 7.83 MH, K = .0158
Figure 111-14. Plasma Driving System Circuit Diagram
111-35

The determination of the equilibrium, for a given 1 and 8 , is very
similar to the determination of the optimum eq> ilibrium in the previous
section, except that instead of scaling the solution to give q(0) = 1, the
solution is scaled to give the required T . Characteristics of a range of
equilibria, from 6 near zero to beyond the optimum of 1,7 are shown in
Table III-9 for the case where the current is the peak current (for
B f F C = 10 1), IroaX = 7.5S MA. (It can be seen that equilibria withmas p
$ =• 1.7 have q(0) < 1 as well as regions of current reversal.) Similar
equilibria can be obtained for other values of the plasma current by
scaling the quantities in Table III-9 according the Eqs. ITI-6 and
III-7 with X = X /iraax <_ i, (The external field at the center of thepv P P KF EF FF
chamber, B , scales as B - l\ * = X B ' .) The equilibrium and the re-EF° o o o
quired B corresponding to a particular value of S for that current canChen be found. The equilibrium current, Ipv. is assumed proportional toEFB . Since \ <, 1, this procedure insures q(Q) >. 1 and no reversed currents
if 6 does not exceed 1.7.P
EFFor a given I and (3 it has been found that 8 , q(4».), and B are
relatively insensitive to the profile exponent, a = 6, although q(0) varies
with the profile. Thus, the required current in the EF coils is relatively
insensitive to the choice of profile shape.
2, Plasma Driving and Heating System
In estimating the plasma driving requirements for the EPR, a circuit
model has been used to describe the plasma, the OH coil system, and the EF
coil system. Once the plasma equilibrium condition and current profile are
determined, it is possible to fix the locations of and currents ir the ohmic
heating (OH) and equilibrium field (EF) coils. This in turn fixes the three
self inductances and the three mutual inductances. It is possible to arrive
at a plasma driving system design which (1) meets the requirements for MHD
equilibrium in a circular cross section plasma, (2) decouples the OH and EF
coil systems and (3) keeps the OH field small at the plasma. A free boundary
MHD code is used to determine the exact placement .ind currents for the EF
coils that are required for the plasma equilibrium, as described in Section
IV-B.
The poloidal coil system-plasma circuit is shown in Figure 111-14.
The self and mutual inductances of the plasma, the OH coil, and the EF coil
111-36

Table III-9. MHD Equilibria for the Peak Plasma Current, I = 7.58 MA fa •= R ~ 1.3: B* = in T)
HH
V
ep
0.0018
0.0036
0.0071
0.014
0.028
0.054
0.10
0.19
0.32
0.54
0.70
0.82
1.0
1.2
1.4
1.6
1.7
1.8
2.2
2.5
0.000048
0.000095
0.00019
0.00038
0.00074
0.0014
0.0027
0.0050
0.0083
0.014
0.018
0.021
0.026
0.032
0.037
0.044
0.048
0.053
0.066
0.087
q(
2
2
2
2
2
2
2
2
2.
2.
2.
2.
2.
2.
2.
2.
3.
3.
3.
5.
V
.4
.4
.4
.4
.4
4
4
4
4
4
5
5
6
7
8
9
0
2
7
3
q(0)
1.6
1.6
1.6
1.6
1.6
1.6
1.6
1.6
1.5
1.5
1.4
1.4
1.3
1.2
1.1
1.0
1.0
0.9
0.8
0.7
po(105 Nt/m2)
0.009
0.018
0.037
0.073
0.14
0.28
0.53
0.96
1.6
2.8
3.6
4.3
5.2
6.7
7.8
9.3
10.4
11.5
15.0
21.0
-0
-0
-0
-0
-0
-0.
-0.
-0.
-o.-0.
-0.
-0.
0.
0.
0.
0.
0.
0.
0.
0.
(5
.060
.060
060
059
058
056
054
048
041
028
018
Oil
000
017
029
047
059
073
113
185
o(T)
0,24
0.24
0.24
0.24
0.25
0.25
0.26
0.27
0.28
0.31
0.33
0.34
0.36
0.39
0.41
0.44
0.46
0.48
0.53
0.60
Rm(m)
6,46,4
6.4
6.4
6,4
6.4
6.4
6.4
6.5
6,5
6.6
6,6
6.7
6.7
6.8
6.8
6.9
6.9
7,0
7.0
Jt < 0
no
no
no
no
no
no
no
no
no
nc
no
no
no
no
no
no
no
yes
yes
yes

were calculated using the actual current distribution in the coils and
approximating the plasma by six current blocks. H the sign convention
is chosen so that the plasma, ohmic heating, and equilibrium field currents
are positive at the end of the heating period, then it is clear by Lenz's Law
that the mutual inductances MpQH and Mp are negative. The Er and OH
coils are designed to make M-™,, small. (Coupling constants are defined in
the usual way, K12 = M ^ / ^ i W * ) Power supply losses are not modeled dynamically
since they are small but are reckoned in the energy balance. The average plasma
resistance, R , is calculated using a multiple of the Spitzer formula. For the
reference case n = 3 n has been assumed. The plasma heats up due to I Rsp p p
ohmic heating and subsequently due to beam heating, which reduces the resistivity.
The plasma power and particle balance model of Appendix C is used.
This model is inapplicable during the early stages of the startup, i.e.
when T < 100 eV and I < 100 kA. A separate simulation is done, in which
a special coil is placed near the plasma, providing a higher toroidal electric
field and a high order multipole null in the plasma to get the plasma started
(see section III-C). The principal result of importance here is that the
startup coil, expending about 4 V-s of flux in about 10 ms, will produce
a plasma of sufficient current and electron temperature to continue growing
with the OH coil alone, when the startup coil is fired ^ 0.3 s after the
initiation of the 2 s OH current reversal. At that time only 4 V-s of OH
coil flux have linked the plasma vessel. This is small compared to the
total flux change available. Thus, for OH reversal times in the range of
this study, initial startup does not pose a major problem. Much longer OH
reversal times might pose major power supply and coil problems, however.
The equilibrium field must follow the ramp-up of the plasma current
in order to maintain plasma equilibrium. The required field depends upon
both the plasma current and the plastr; *essure, as discussed in the previous
section. The EF field rises in an almc. linear fashion, minimizing the
EF coil maximum power.
'.Che power supply philosophy for the plasma driving system is as follows.
The EF coil must be programmed and therefore has bfen chosen to be a phase
111-38

controlled rectifier circuit operating out of magnetic energy storage (see
Chapter VI). Since the magnetic energy is fixed by the required equilibrium
field, the principal variable cost is associated with the power. Thus, the
plasma heating cycle should be as slow as possible to minimize this EF
power cost. The OH field need not be programmed but must cycle as rapidly
as possible to build up the plasma current and heat the plasma rapidly in
order to avoid wasting energy. Thus, high power is required in the OH
circuit, and the power supply cost should depend primarily on btored energy,
as opposed to power. High voltage multidrum homopolar generators are well
suited to this task. They can operate efficiently, and have the property
that their effective capacitance can be smoothly varied by changing the
magnetic field, allowing control over the OH cycle time. They further can
be connected in series or parallel to vary the voltage or capacitance. In
this application the OH energy is in the coil, and the drums are nearly
at rest except during OH field reversal, so that losses are minimized. An
additional small phase controlled rectifier provides flux for maintaining
the plasma currant during the burn and for resetting the OH current prior to
current reversal during shutdown. This rectifier can operate out of the same
energy storage unit used with the EF coil.
By reversing the OH current rapidly, the plasma becomes conductive quickly,
and the volt-seconds provided by the EF coil are effective in increasing the
plasma current. Thus, typically, the plasma current reaches 70% of its final
value at the end of the OH current reversal. The remaining current is in-
duced by the EF coil.
The process of plasma heating can be augmented by initiating the beam
injection during the OH current reversal. There is then a trade-off between
the beam energy consumed and the reduction in OH energy requirements which
must be considered.
The basic burn cycle under consideration is then:
(1) Initiation of OH current reversal at t = 0, with reversal time At ;OH
(2) Initiation of beam heating at time t s. At-.,, with beam power P,,a UP a
to the plasma;
(3) EF current ramp-up;
(4) Ignition followed by DT burning; and
(5) Shutdown.
111-39

This burn cycle is shown schematically in Figure IIT-15, with times corres-
ponding tothe reference burncycle.
With reference to Figure 111-14, at the start of the cycle, switch SL
is closed and swicch S2 is opened (at zero voltage) with negative current in
the OH coil. The current in the OH coil flows in the homcpolar generator, C,
accelerating the. drums. The horaopolar generator npnears as a capacitance in
the circuit- When the current 1=? reversed and the voltage i& ae.ro again,
switch S2 is closed and SI is oDened. Henceforth, the current flows through
the power supply, which controls the voltage on the OH coil. At tlic end of
thj.; burn, during shutdown, thv power supply voltage, V -, is reversed and
readjusts the level of T so that reversal with the homopolnr generator " ~
leaves_the stata of I as it was at the'beginning of the cycle. At the
s_tart of cycle, switch S3 is opened and VTV is programmed to maintain
equilibrium. AC the end of beam heating, switch S3 can be closed, or, more
likely, a small control voltage will be maintained to control plasma posi-
tion.- At the fcr.d of the burn, the EF coil is ramped back to zero during
shutdown,'
At this point the importance of decoupling the EF and OH coils becomes
clear. Strong coupling would cause a large induced voltage in the EF circuit,
due to the OH pulse, greatly complicating and increasing the requirements on
tha EF power supply.
It is worth mentioning that, since the plasma is diamagnetic, currents
. flow in the poloidal direction causing a toroidal flux change__which links
the TF coils. For the. cases considered her?., the flux change is about 1/4 V-s
on the time scale of t.he"EF current. The induced voltage in the total TF " "
coil system'is about 600 volts. TF coil stability would be enhanced by main-
taining constant TF coil current, (as opposed to maintaining constant TF coil
flux, which would cause a field change at the coils)." Thus," the TF coil power
supplies must be programmed to cancel this induced voltage.
3. Startup Requirements
The determination of the design requirements for the plasma driving
and heating systems involves finding a compromise among several, often con-
flicting, technological and cost limitations. These design requirements alt
quite sensitive to the time sequence of the startup (and shutdown) proce-
dure. A range of potential startup procedures were simulated dynamically,
111-40

•3
Cau
a
c3
ini-HI
360•Hfa
111-41-

following the format described in the previous section. The main parameters
of interest are: (1) energy transfer from the homopolar supply (U ) — peakOH
OH power (PQH) requirements are less important; (2) peak power in theBR ;-
supply (PEF) — EF energy transfer (UEF) does not varv appreciably since
the plasma is very conductive during most of the EF ramp-up; (3) total
beam ene gy to heat the plasma (IL.) and the total energy (U ) drawn from
tl^ energy storage unit for the beam .heating,; (.4) maximum rate of change of
t M fSMdj-m the QH coil (BQH.) — the maximum coil voltage (¥„,.) is pro-
portionaX to fiQH; and (5) maximum field (B^) in the GH coil -- the OH coil
current: is proportional to BQH« The technological aspects of the tradeoff
between current and voltage are treated in Chapter IV on coil design and in
Chapter VI on power supplies, and the relationship between U and U isB BE
discussed in Chapter V on neutral injectors.
Parameters varied in the study aie: (1) OH current reversal time, AtOH
essentially determined by C, the equivalent capacitance of the homopolar
.system (see Table 111-10) ; (2) time of beam firing, tB; (3) beam power to
the plasma, PB; (4) plasma resistivity, n; and (5) oxygen concentration, as
a measure of the effect of impurities. The results of the study are summarized
in Table III-ll, for a variety of possible startup procedures and conditions.
Selected results are also plotted in Figures III-16 to 111-20, to illustrate
important features.
Table III-1Q. Capacitance Requirements for OH HomopolarGenerator
Reversal Time
0.5
1.0
2V0
3.0
Capacitance(F)
0.050
0.224
3.:-86
111-42

Table I I I - l l . Plasma Driving and Heating System Requirements
Case
1
2
1
4
5
6
7
8
9
10
11
12
13
[4
Cs)
0 . 5
• 1 . 0
^2.0
1.0
2 .0
4 . 0
•' ;2.0
:2.(j
2.0
2 , 0
2.0
2 .0
2 .0
2 .0
( s )
0 .5
1.0
2 . 0
0.5
1.0
2.0
0.5
1.0
1.0
1.0
1.0
1.0
i .o
1.0
P B(MM)
60
60
60
60
60
60
60
20
40
80
60
60
60
60
'. Other! '
a
• § : :
n o • '••oUljc '31 :O :rr .«n v:a. mrr m
S",= :
1 ! t r ' s p:
6 x V"02 "-o
ir 1 5 : i .
i • •;•J ' . '•<,
1 V-si 'Total
44.:0 ;
53;;3';.-
72 :3:
47.9
61:. 2 ;
79.0, „•.
4 7 . 8 ;
7 2 . 9 :
65 .1 j
60.9;
45.9;
78.4
52.6
78.7
!V-sbRes
12.8
21.9
40.6
: i5.a;; 29.9
; 45.6
: i4.8
; 39.9
(• 3 3 . 3
27.8
,.13.6
i 45.8
20.4
. 4 6 . 0
B0HHax
(T/s)
16.6
9 .9
6 .7
9.1
5.8
3.6
4 .6
6.4
6 . 0
5 . 8
4 . 5
,. 7.2
5.0
7 . 3
OH
•"OH«ax
<m.;2.81
3.43
4,40
3.02
3.78
4,;80
3.02
4,65
4.03
3.76
2.90
4.79
3.29
4.76
"OH
:{MJ)
428
603
1060
502
776
1240
503
1140
857
776
474
1210
595
!l24O
P0HMax
<MW>
2390
1790
1620
1520
1220
%m770
1490
1330
1220
722
1910
927
1900
Max(ki\)
45.1
3'-.9
70.4
48.4
60.5
76.8
48.4
74.4
64.5
60.2
46.3
76.7
52.7
7h.2
V0HMax
tkV)
118
71
48
65 .
41
26
33 |
46
43
41
32
51
36
52
EF
? EFHas
(WO
650
365
389
561
416
373
398
291
338
503
403
471
413
-'.32
V iEF :
Max(fcv) :
42.5
17.6
10.4
27.4 !
20.8
30.7*
IS.9
9.1 !
\2.h
25.7
16.9
23.3
27.4
17.4
BE6MS
'm)
263
265
268
283
286
324 i
319!
364
302;
289
301
291
285
321
907
•914
•924
975
986
illl7
WOO
1255
1041
•997
Ifl37
1003
983
1107
P d
Net{MW)
43
44
41
45
43
39
43
35
40
44
43
43
56
28
j ) I f F =; SO W,, UfF = 15U0 M.I, EF Coil Provides 50, V-s to "plasma
!i) H>js isi. ivt- \fM 1 t - s t c • s :
r) max during heating; further increase during burn ' : '
il) ?„._ i.s for max cycle length j ! ;
u) Shortly lifter tnmsfent during beam turn on. .' ; ;
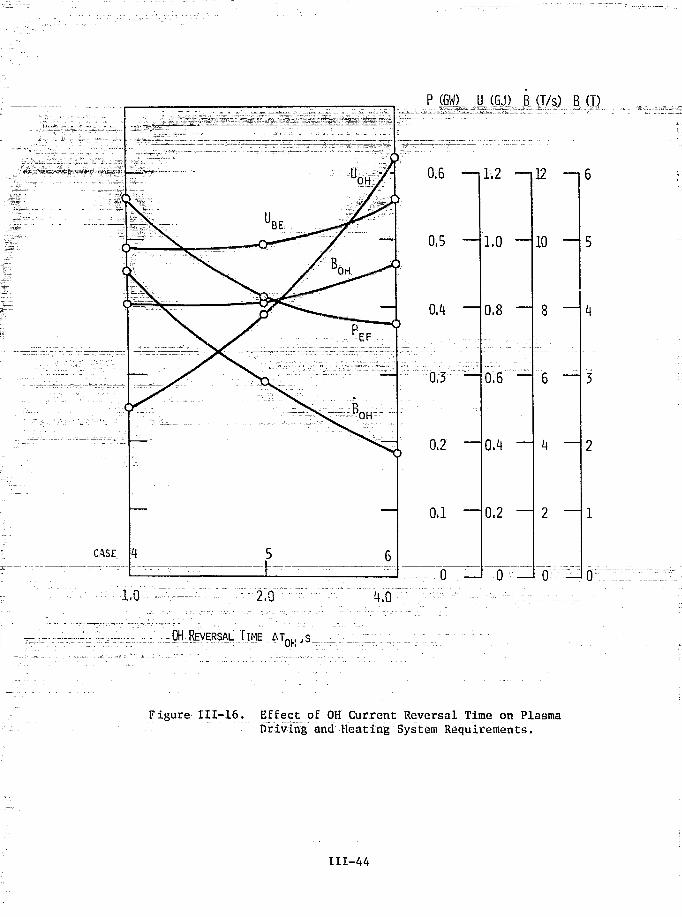
P (GW) U (GJ) B (T/s) B (T)
0.6 —
0.5 —
0.4 —
0.3 —
0.2 —
o.i —
0 —
1 . o Mlli
1.0 —
0.8 —
0.6 —
0.4 —
0.2 —
0 —
]2 —
10 —
8 —
6 —
4 —
2 —
0 —11.0 2.0 4.0
OH REVERSAL TIME A T O K .
Figure 111-16. Effect of OH Current Reversal Time on PlasmaDriving and Heating System Requirements.
111-44
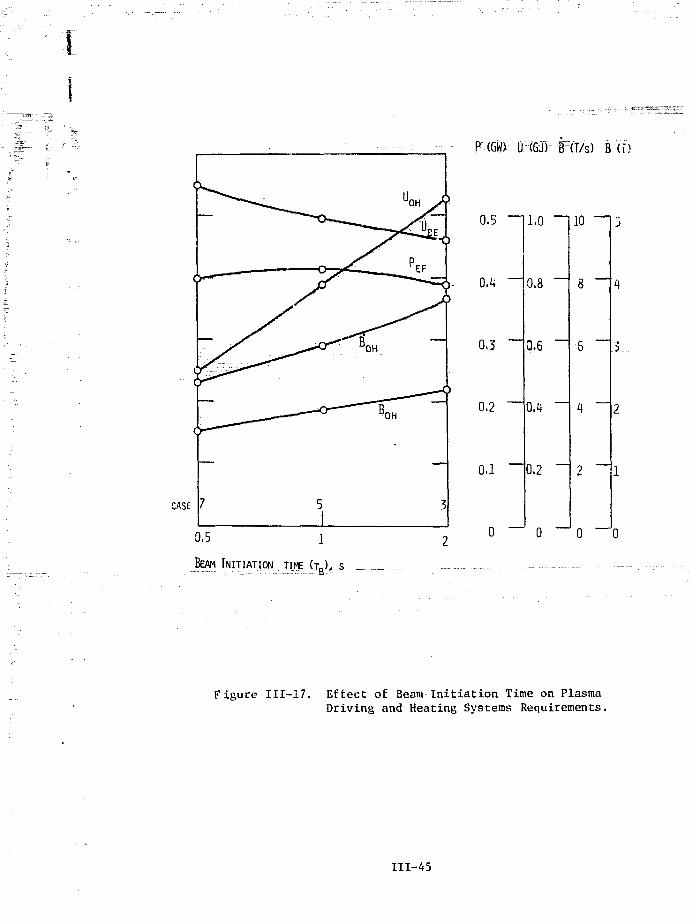
CASE
P (GW) U (GO) B : : a 7 s l B CD
0.5
0.3
0.2
0.1
LO
0.6
0.2
0 — 0
10
0 0
BEAM INITIATION TIME ( T J . , S
Figure III-17. Effect of Beam Ini t iat ion Time on PlasmaDriving and Heating Systems Requirements.
111-45
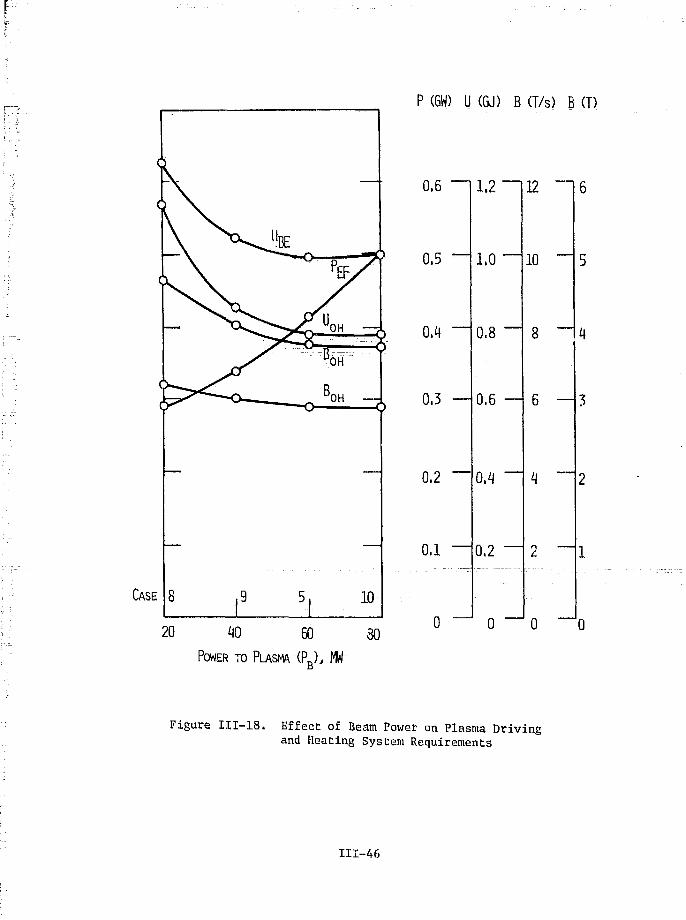
P (GW) U (GJ) B (T/s) B (T)
CASE
20
5, 10
60 30POWER TO PLASMA (PJ, MW
D
0.6
Q.5 —
0.4
0.3 —
0.2 —
o.i —
o —
1.2"~
1,0 ~
0.8 ~
0.6 —
0.4 —
0.2 —
0 ~~
12 —
10 —
8 -™
6 —
n —
2 —
0
Figure 111-18. Effect of Beam Power on Plasma Drivingand Heating System Requirements
111-46

P (GW) U (GJ) B (T/s) B (T)
0,6 —i 1.2
0,5
— 0.3
0.2
0.1
0 —J
1.0
0.8
0.6
0.4 —
0.2
0 —J
12 —I
10
6 —
0 —J
SP
Figure 111-19. Effect of Plasma Resist ivity on PlasmaDriving and Heating System Requirements
iri-47

CASE
0 0.5 1
IMPURITY (OXYGEN) CONCENTRATION (%)
P m U (GJ) B (T/s) B (T)
0.6 —11.2 —112
0,5
— 0.1 —
— 0.3 —
0.2
0.1 ~
0 —J
1.0 —
0.8
0.6
0.1 —
0.2 —
0 —
10 —
8 —
0 —'0
Figure ITI-2O. Effect of Oxygen Impurity on PlasmaDriving and Heating System Requirements
111-48

In Figure 111-16, U^, U^, PEF, B Q H and B Q H are plotted as a function
of the length, At , of the OH current reversal. For times shorter than
2: s, a penalty is paid in the EF power requirement and in a very high
B , with essentially no compensating reduction in U r E or B . On the
other hand, the plasma current and temperature builds up rapidly, and U-,,
and the resistive volt-seconds are considerably reduced by shorter At .
For times longer than 2 s, there are large increases in UQH and V be-
cause the QH voltage is quite ineffective at increasing Che plasma current
in the presence of the higher resistive losses associated with the cooler
plasma. In fact the current rises slowly until UQH reaches its maximum,
wasting about one-half the QH flux, and more beam energy is required to
heat the plasma. ?„„ reaches its minimum for At«u = 4 s, the maximum valuetir ~— ! uti
occurring after ohmic heating, during beam heating. B , on the other hand,
is reduced by the longer At..,, but not to the level of present day technology.
The two second reversal (&tot, = 2s) is chosen as the reference case.
Urt
The ohmic heating requirements can be reduced by using supplemental
beam heating during the OH current reversal period, At , to reduce theUn
resistive volt-seconds. In Figure 111-17, the beam initiation time, t,,,15
is varied during the ohmic heating current reversal, for AtrtU = 2 s.Un
At t = 0.5 s, the plasma current (" 150 kA) has not really started, and
injection heating too early may enhance the formation of plasma skin currents,
leading to unfavorable confinement. (This phenomenon is not included in
the global model simulation.) The compromise position is to adopt L = 1 s
for the reference case, but to design the coils and power supplies for the
more demanding case in which the beam heating is not initiated until the
end of the ohmic heating current reversal (to = At = 2s).
D On
Figure 111-18 shows the dependence upon beam power. At lower beam power,
penalties are paid in all parameters except the EF coil power. The 20 MW
case is singular in that ohmic heating (via the rectifier) is still effective
after the homopolar swing (At-,.) because of the slow plasma heatup with
PB = 20 MW. The EPR will start up satisfactorily with only 40 MW of power,
and there is no reason to go beyond 60 MM. Thus, selection of P_ = 60 MWB
for the reference design provides some margin. •
It is important to test the sensitivity of the desigi; to parameters
less easily controlled Lhan those above. For this purpose the plasma111-49

resistivity and impurity concentrations are varied between n = ns and
x\ = 6n » and from 0-1% oxygen impurity. The results are shown in Figuressp
111-19 and 111-20, The principal effects of increased plasma resistivity
on impurity concentration are increased requirements on the ohmic heating
energy ClU,) and field (BQ,J. Calculations at n = 10 n were unstable,
with small variaCions in ohroic heating stored energy causing large vari-
ations in results, because of difficulty in starting the plasma, Better
results would be obtained by shortening the OH cycle time if the resistivity
were this high. The effect of high impurity concentration (1% oxygen)
is to keep the plasma cool for a longer time (due Co line and recombination
radiation) and to increase the resistivity. The poloidal coil requirements
for this case are similar to the 6 n case.
The considerations above led to a choice of case 5 in Table III-ll as
the reference case for performance calculations. Table 111-12 presents a
more detailed list of the properties of the reference case.
A more demanding case (no. 3 in Table III-ll) was chosen as the design
basis for the power supply, energy storage and coil systems. The EF coil
system is designed to provide 50 V-s to the plasma, and the OH coil system
is designed to provide 85 V-s, for a total of 135 V-s. About 4.5 V-s are
required for a 1 minute burn, so 135 V-s provides an ample margin.
4. Reference Case Burn Cycle Simulation
In order to illustrate features of the burn cycle dynamics of the EPR,
the reference case (case 5 in Table 111-11) has been chosen for detailed
examination.
As an impurity control measure, the reactor first wall is coated with
beryllium. The reasons for this choice are discussed in detail in Appendix
B. Briefly, analysis shows that some form of low-Z coating must be used;
a bare stainless steel wall results in unacceptably high radiation from
the sputtered ions. There are a number of possible coating materials, but
Be appears to give the longest burn times and the best power performance.
The sputtering of Be by incident particles is a function of the particle
kinetic energy. The sputtering coefficients used here have been obtained by
taking a Maxwellian average of the differential-energy sputtering data,
III-5C

Table 111-12. Plasma Heating and Driving SystemReference Case Parameters
Plasma
Maximum CurrentMaximum Thermal EnergyResistive Energy Dissipation (n = 3n, )
Ohmic Heating System
Current Reversal TimePeak CurrentPeak VoltageMaximum Energy TransferPeak PowerEquivalent Capacitance of Homopolar GeneratorMaximum Field in CoilMaximum Field Rise in CoilVolt-seconds to Plasma
Inductive, startupResistive, startupResistive, burn
Equilibrium Field System
Peak CurrentPeak VoltageMaximum Energy TransferPeak PowerVolt-seconds to Plasma
Neutral Beam Injection System
Beam OnBeam DurationBeam EnergyBeam Power to PlasmaEnergy Deposited in PlasmaPower Required to Operate Injection SystemDirectly Recovered.Electrical PowerNet Electrical Power to Operate SystemNet Electrical Energy to Operate System
Magnetic Energies
k L I 2P P
MPOH XP X0H
^EF IP IEF
M I IEFOH EF OHTotal
7.5827090
260.5417761220
MAMJMJ
skAWMJMW
0.896 F3.85.8
31.329.94.0
8020.8
148041650
1.04.77
18060286485278207986
332
1660
876
- 259
- 386
39
2262
TT/s
V.sV.sV-s
kAkVMJMWV-s
sskeVMWMJMWMWMWMJ
MJ
MJ
MJ
MJ
MJ
MJ
MJ
111-51
assuming a fixed plasma edge temperature, of 200 eV. With this assumption,
the average energy of the particles incident on the first wall is
-% x 200 = 3Q0 eV, This corresponds to the peak of the D-T sputtering curve;
a value of S^™ = 0,028. This is therefore a worst case assumption, with
respect to beryllium sputtering, although a quite plausible one. The other
sputtering coefficients used are S = 0,07, Sp - 0.35 and S = 0,0005.° a Be n
Wall reflection coefficients used are R^, = 0,98, R^ s 0.98 and Rfie = 0.05.
The plasma-wall interaction model, which includes recycling and charge-ex-
change, is discussed in Appendix B,
The general features of the burn cycle are shown schematically in
Figure 111-15, The basic burn cycle, which is the focus of this section,
begins just after plasma breakdown and continues for 55 seconds. The
cycle begins when the ohmic heating (OH) system homopular generator is
connected to the previously charged OH primary coil. The OH primary
current then reverses in 2.0 s, inducing about 2/3 of the final plasma
current and ohmically heating the plasma. At t = 2 s, the OH coil is
connected to the OH power supply and is disconnected from the homopolar
generator. Midway during the OH current reversal, at 1.0 s, injection of
60 MM of neutral beam power is initiated. The beam injection is initiated
sarly (before the plasma current is fully ramped up) in order to reduce the
resistive volt-seconds that would otherwise be expended. At about 5.8
seconds the plasma reaches ignition and the beam heating is terminated.
(If confinement is subignition, beam heating is continued as required
during the plasma burn.) During this period, from 0-5,8 s, the current
in the equilibrium field (EF) coil is continuously adjusted to maintain the
plasma in MHD equilibrium. The dependence of the EF current on the plasma
current and on B is determined by MHD equilibrium calculations. At the
time the beam is turned off, the EF current, the pl.-i.-5ma current and the
plasma 0 have reached their maximum values. The OH current continues to.P
increase during the burn phase to offset resistive losses in the plasma.
After about 5 seconds, the plasma is in the burn phase, where sub-
stantial thermonuclear power is produced. Were it not for the buildup of
He and Be, the plasma would remain at this ignition point indefinitely,
in the absence of MHD instabilities. Because of the buildup of He and Be
the plasma gradually cools off. At about 48 s the plasma is no longer
111-52

producing significant power and the shutdown period is initiated. (The
cooling off of the plasma can tie delayed by suppleme\;tal heating — e.g.
with beams.) For the next 5 seconds the OH, EF and plasma currents are
all reduced somewhat in preparation for the final rampdown. During this
period the OH current is reduced to the value it had at t = 2 s, so thar. the
OH homopolar generator will handle the same current swing on shutdown
and startup. The plasma cools rapidly during this time. Finally, for
the last 2 seconds of the burn cycle, the OH homopolar generator is re-
connected, all currents are ramped down, and the cycle terminates. These
currents are shown in Figure 111-21, and 0 is shown in Figure 111-22, In
the next ^ 15 seconds the vacuum ports are opened, the toroidal chamber is
evacuated, and preparations are made for the next burn cycle.
The effect of the burn cycle sequence just described on the pulsed
power and energy requirements is shown in Figure 111-23, 111-24, and
111-25, The total OH coil energy transfer can be seen in Figure. 111-23.
The very large power spikes at the beginning and end of the cycle occur
during the i*eriod when the OH coil current is allowed to flow through the
homopolar generators, leading to a reversal of the OH coil current. During
the burn, power is supplied to the OH coil by a rectifier to provide OH
voltage to maintain plasma current. At the end of the burn, the rectifier
phase is shifted to invert ( 66 MW) to reduce the plasma current and re-
cover the magnetic field energy put in during the burn. During the rectifier
phase, homopolar generator energy losses are replenished by the rectifier.
When the OH current reaches the proper level, the OH coil is again connected
to this homopolar, leading to another current reversal ending at the current
value at which the cycle started. During this reversal, the plasma
current is reduced to essentially zero. The OH system is dormant during
the pumpdown of the vacuum vessel.
Figure 111-24 shows the EF coil energy and power requirements.
Essentially, the coil is ramped up in ^ 7 s during startup and down in
^ 7 s at the end of the burn, with the current chosen to provide equilibrium
for the assumed profile. Some adjustment is necessary during the burn to
accommodate variations in the plasma (5 . Since the EF coil current is ramped
slowly, it does not provide much ohmic heating, but produces the final flux
necessary to induce the final plasma current. As a result, there is little
111-53

V*Z 'DC
• •
1*1 .
8
7
6
5
4
3
2
_l
6
r2
-3
-4
-5
-6
-7
-8
-
._(
„ r
__. —
-" - ;
1.5 .
-
4.it
ft 1 1.15.. 2*5
- —
1 1 1.35
iili
sill
»i48 .. 50 5
= —_J _ --" _
TIME, S
. Figure 111-21. Plasma", "OH and EF Currents DuringReference Burn Cycle
111-54

2.0
0.2-
0.050 55
Figure 111-22. Poloidal Beta During Reference B, -TICycle.
111-55

1500
' * %\
Figure 111-23.
ff\ i i i i \/n 115 25 35 48 50TIME, S
OH Co^l System Fower and EnergyTransfer During RefSreSSd BurnCycle.
I
55
111-56

1500
7 15 25 35TIME.S
48 50
Figure III-24. EF Coil System Power and Energy TransferDuring Reference Burn Cycle
111-57

A) : ENERGY AND POWER DEMAND
3000-
2500 —
2000 —
1500 —
1 0 0 0 -
500 —
8 1015 25 35 45.T-T-T
50
"
TIME.S
•700
•600
- 5 0 0
- 4 0 0
— 300
— 200
100
0
—-100
-200
1 300
oIX
B) POWER CONNECTIONS
1 H
3.2 GJ
OH RECTIFIER 70 \\\ MAX
EF RECTIFIER 412 flW r<wx
NB SUPPLY 207-MM-MAX
MAKEUP RECTIFIER. 20.6PM
ENERGY STORAGEINDUCTOR
I Y SUBSTATION
OTHERSYSTEMS
STEAM TURBINEGENERATOR
Figure 111-25. Power and Energy Transfer Out of the Energy Storage UnitDuring Reference Burn Cycle.
111-58

I^R loss in the EF circuit. The peak power is typically 400 MW and canP Pcome either three quarters of the way through the OH cycle or near the end
of beam heating* depending on the cycle.
The homspQlar generators communicate with che external power grid
only through the OB rectifier and the energy storage system, so that the
peak power produced by the homopolar generators does not appear in the
storage system or the external electric grid. The neutral beam system,
the OH rectifier and the EF rectifier are the elements which operate out
of the energy storage system. In Figure 111-25, the sum of the. powers
and energies of the three systems are shown for the reference burn cycle.
As discussed in Chapter V on neutral beams, an instantaneous electrical
efficiency of 0.29 is assumed for the beams, that is, pulsed electrical
energy of 207 MW must be supplied to produce 60 MW of beam power. This is
because the electrical energy recovery is simultaneous, while the thermal-
electric energy recovery is averaged over the cycle. The net energy with-
drawn at the end of the cycle is 1.44 GJ, of which 986 MJ is due to beams, and
85 MJ is I2R heating. Another 370 MJ musv. be added for power supply losses*p p
so that the average power to operate these systems is 20.6 MW, based upon a 70 s
cycle with a 55 s burn and a 15 s replenishment. This power is provided uni-
formly. The maximum energy withdrawal occurs at the end of beam heating, which
is also the time of maximum power. Then the energy storage unit must providp
2.44 GJ and a power of 620 MW at maximum depletion. This is discussed in .. • re
detail in Chapter VI.
Variation of plasma particle densities during the burn cycle are shown
in Figure 111-26. The initial .D-T ion"density is 0~.ITli 1020ln^37 cmSposed
of equal parts of deuterium and tritium. -Pur-ing- the cycle, the ions can
be lost in two ways, by fusion and by transport to the first wall. The
D-T ion loss can be replenished by a combination of recycling from the
wall and an external refueling source. The neutral beam, when on, can also
help replenish the plasma. By varying the refueling rate from the external
source, the ion dens'.ty can be controlled within certain limits. For the
first 14 seconds of the cycle the density is held constant; the refueling
current needed to do this is shown in Figure 111-26, assuming 98% recycling.
A 5% loss is assumed in the OH/EF energy transfer. This value is sub-stantially larger than the losses explicitly identified in Chapter VI.
111-59

10
TIME, S
50 55
Figure 111-26. Particle Densities and Refueling Current DuringReference Burn Cycle.
111-60

When Che beam Is present Che current can be generally much smaller. (Be-
cause thf beam Cends to change the deuCerium fraction of Che plasma, the
deuterium composition of the refueling current can be lowered slighly to
compensate; this is a minor perturbation.) As soon as the plasma.reaches
thermonuclear temperatures, at about 5 seconds, substantial fusion alpha
heating Cakes place. (The alphas thermalize with the background plasma and
about 99% are retained.) The He density therefore starts to build up, at
nearly a linear rate. As the D, T, He, and neutrons strike Che first wall,
Be atoms sputter off and accumulate in the plasma. When the Be density
reaches abouC 3% of the ion density, the self-sputtering by Be becomes
significant. Since each He or Be ion brings 2 or 4 electrons into the
plasma, the electron density (not shown) soon becomes significantly larger
than the D-T ion density. Since the electrons, Be and He are about as hot
as the D-T, they too contribute to the overall plasma kinetic pressure and
hence to the B . Moreover, the fast alphas and injected beam particles
contribute to the plasma S ... At about 14 seconds the alpha contribution is
about 8% of the total. Since the EPR is assumed to be pressure-limited,
the D-T density must be reduced if the 0 limit is not to be violated.
The assumed limit is B = 1.72, with about a ± 10% deviation allowed.. ,.-,._ _ ., p max ...... . ._., _ ...,..., _.... L;._
To reduce the ion density, the refueling current is lowered, and, in fact,
for a brief period shut off altogether. By 24 seconds n^, (and ng) has
dropped sufficiently so that 6 is within safe bounds. Refueling is
interrupted, and nD_ is held approximately constant thereafter. (The
value then-is iT „ =0.807 x 10²⁰ m~3.) The refueling current is also
shut off atTemperature variations during the burn cycle are shown in Figure I.II-27.
The ion and electron temperatures are 15 eV at the start of the cycle, i.e.
just above the ionization potential for hydrogen. Because of the short
equilibration times beween electron.1? and ions, T and T. are almost equal
at all times. During the first second ohmic heating takes Che plasma
to about 60 eV. (This portion of the burn cycle is examined in greater
detail in Section III-C.) When the beam is turned on, the plasma heats
rapidly, at an average rate of 2.4 keV/s. When the beam is turned off,
the plasma cools slightly, settling into an equilibrium by about 9 s.
111-61
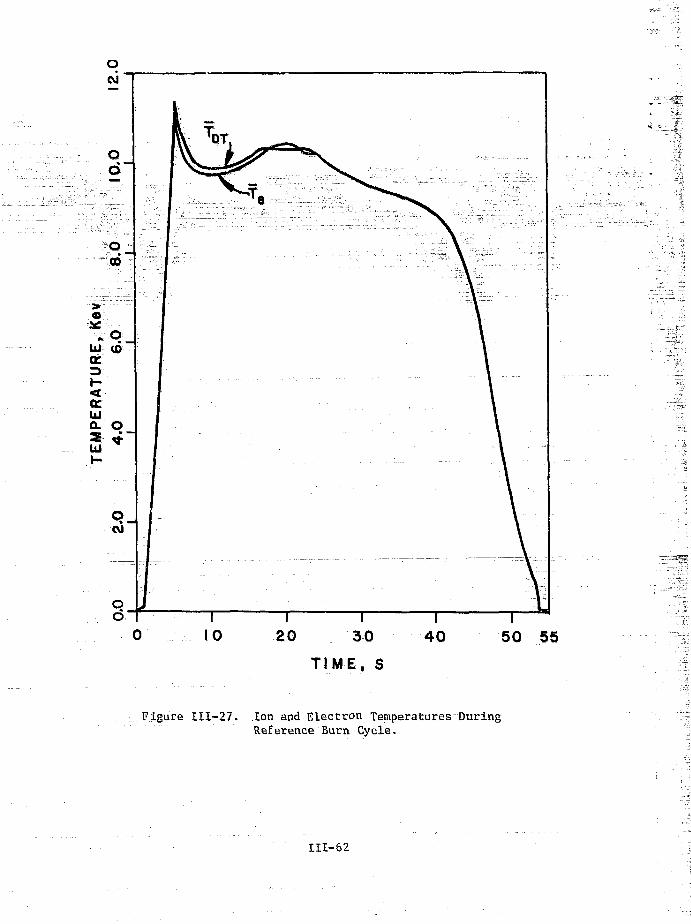
50 55
Figure .111-27. Ion and Electron Temperatures DuringReference Burn Cycle.
111-62

Were it not for the subsequent buildup of He and Be, the plasma would
remain indefinitely at this ignited equilibrium point.* Instead, the
D-T density must be reduced to compensate the He and Be buildup, less
alpha heating of the plasma occurs, and the plasma gradually cools off.
Tlie plasma poloidal beta, B , is the ratio of the plasma kinetic
pressure to the poloidal magnetic pressure. At very low plasma currents,
e.g>i i <_JL££h. t a minimum value of "'?Jf* has b e e n « s c d l n computing
6 in order to avoid certain numerical problems. (This only applies toPthe periods 0 to 0.95 s and 53,7 to 55 s.) During the first second of
beom heating, both the plasma current and the temperature increase. They
tend to offset each other and are responsible for the oscillatory behavior
of 0 shown in Figure 111- 22. At 2 seconds I = 5.32 MA, or about 70%: of
its fiml value. The magnetic pressure* which is proportional to 1^, doubles
by the end of the beam heating period, but the kinetic pressure increases
by almost a factor of 5. S rises accordingly. The cutoff time for the
neutral beam is keyed to 3 -i^When :S :ireaches?the^nominal maximum of 1.72
the beam is turned off. Subsequently, 6 oscillates slowly for a number
of reasons. The accumulation of He and Be tend to raise B because of
their kinetic pressure. As the ion density is reduced, the plasma tem-
perature falls, tending to reduce B . The actual behavior of the pbloidal
beta in a reactor will depend on the control scheme used and the accuracy
and time constants of the plasma diagnostics. The control scheme used for
this analysis (discussed in Appendix C) has been chosen on the basis
of simplicity. Even so, the control scheme is successful in keeping
the plasma within its pressure limit and in limiting' excursions''In"'& to
about ± 5% during most of the burn phase.
After about 40 sec, 3 decreases rapidly as the temperature drops.
Howsverpduring the rampdown period,11 dropsHvery.rapidly, causing an
abrupt spike in p . Because of the uncertainties in the representation
of: this phase; of the burn pulse and because of the numerical treatment
of 0 at low currents, it can be considered that &. could exceed 6_ at
the time of the spike. As a consequence,- MHD equilibrium could be lost
at this time. The plasma could then be assumed to deposit its remaining
energy on the wall in a very short time. The shutdown period might pre-
sent a problem in this regard. The plasma current should be ramped down
* Assuming that recycling and refueling take place.
iri-63
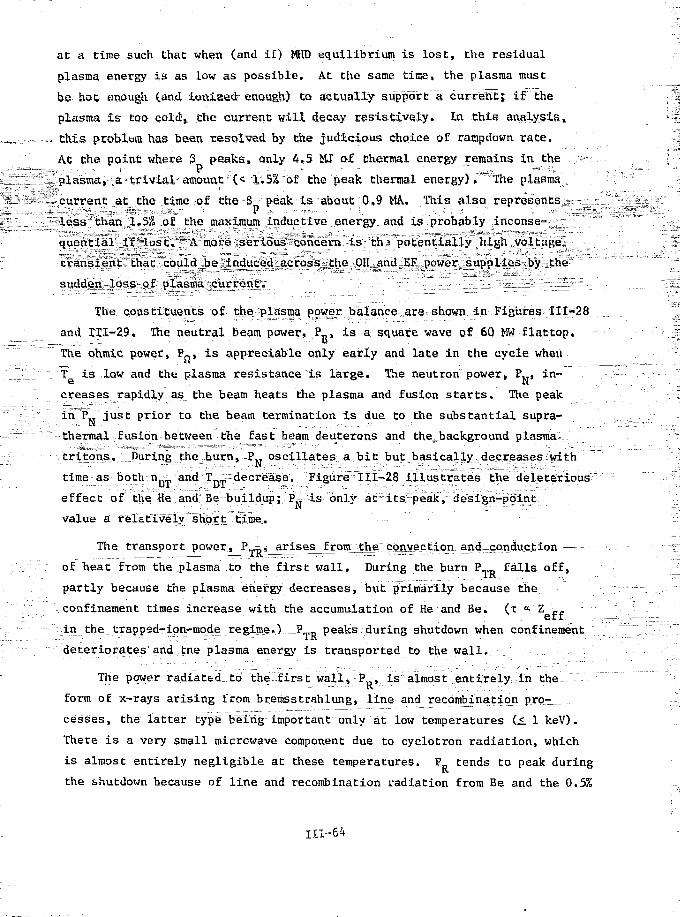
at a time such Chat when (and if) W.V equilibrium is lost, the residual
plasma energy is as low as possible. At the same tine, the plasma must
be hac en&ugh (actd ieitt.Ee.ct enough) to actually support a currenti if the
plasma £s too cold* Che current will decay resistively* In this analysis»
this problem has been, resolved hy the judicious choice of rampdown rate.
At Che point where 3 peaks, only 4.5 MJ of thermal energy remains in the
plasma, a trivial amount (< 1.5% of the peak thermal energy). The plasma
current at the time of the $ peak is about 0,9 MA. This also represents
less than 1.5% of the maximum inductive energy and is probably inconse-
quential if Jose. A more serious concern is th.3 potentially high voltage
transient that could be induced across the OH and EF power supplies by the
sudden loss of plasma current.
The constituents of the plasma power balance are shown in Figures 111-28
and 111-29. The neutral beam power, P , is a square wave of 60 Mflattop.
The ohmic power, ?„» is appreciable only early and late in the cycle when
T is low and the plasma resistance is large. The neutron power, PN, in-
creases rapidly as the beam heats the plasma and fusion starts. The peak
in P just prior to the beam termination is due to the substantial supra-
thermal fusion between the fast beam deuterons and the background plasma
trltons. During the burn, P oscillates a bit but basically decreases with
time as both n D T and T decrease. Figure 111-28 illustrates the deleterious
effect of the He and Ba buildup; P is only at its peak, design-point
value a relatively short time.
The transport power, P_-, arises from thejionvection^and-conduction- ^ ——r—l.IVr.-- -.-'•—r~:r—. : - — — —'•-- --y
of heat from the plasma to the first wall. During the burn P.(T, falls off,
partly because the plasma energy decreases, but primarily because theconfinement times increase with the accumulation of He and Be. (t « Z '_„
eff
in the trapped-ion-mode regime.! :P peaks during shutdown when confinement
deteriorates and the plasma energy is transported to the wall.
The power radiatfed_:to-the:first wall, Pn, is;almost entirely in the
form of x-rays arising from bremsstrahlung, line and recombination pro-
cesses, the latter type being important only at low temperatures (<. 1 keV).
There i s a very small microwave component due to cyclotron radiation, which
is almost entirely negligible at these temperatures. P tends to peak during
the shutdown because of line and recombination radiation from Be and the 0.5%
III-64

400
50 55
Figure 111-28. Power Components During Reference Burn Cycle.
.111-65-

TIMti.S
Figure 111-29. 'nwer Components During Star tup
111-66

oxygen background impurity. The peak is modest but could be quite large if
higher Z materials were present, if for example an element like argon were
injected to intentionally terminate the burn. The amount of argon would
then have to be tailored to keep the radiation power loading on the first-wall
acceptably low. Shut-down with argon injection is a design option.
Figure ITI-29 shows an expanded view of the various power terms during
the startup period. Also shown is the alpha-heating power (P ^ 0.2 ?„)
and the ohmic heating (P_ B I2R ) power. The net power available to heat
the plasma is given by the sum of the ohmic, bean? and slpha components minus
the radiation and transport components.
Ohmic heating increases ac the start of the cycle as the plasma current
is induced. When the beam is turned on, the electron temperature increases
rapidly, R falls rapidly, and Po decreases, in spite of the continued
increase in I from 1-2 s. For the rest of the cycle P is insignificant
(<£ 0,5 MW) except for the shutdown period when the plasma temperature
is again low. The contribution of ohmic heating to the total heating energy
for the startup period is small; however, ohmic heating is very important
in helping to overcome the large radiation peak at 1-1.3 s. This peak is
due to line and recombination radiation arising from the 0.5% oxygen back-
ground of the plasma. The plasma temperature at ^ 1 s is 100-200 eV; this is
the temperature range within which oxygen, in the 0 state, contributes the
most radiation. The net heating power at 1.1 s is only 2 MW; however, at only
0.1 s later, the net heating power has risen to 34 MW. It might appear
that a snaller value of beam power would not be sufficient to heat the
plasma past this point. For smaller P however, the plasma takes longer
to reach the critical temperature. For P_ ~ 20 MW, for example, it takes
1.25 s. The plasma current is higher at this time and sc P, is higher; for
Pg = 20 MW, P™ax = 53 MW, also yielding a net heating power of about 2 MW.
Of course there are conditions that might preclude reaching ignition with
any given beam power, e.g. a higher oxygen concentration.
The transport power ( — - ) varies directly with the plasma temperature
and inversely with the (ion and electron) energy confinement times. As the
plasma is heated the confinement times are determined* by successively less
Neoclassical and anomalous energy confinement times are computed, and theI lesser of the two is used in the calculation.
9 HI-67
f

_ collislonal transport regimes, each of which scales differently with cempera-
ture. The~energy transport mechanism which dominat.es the power loss is
" indicated on tThVP^curve: PSdenotes Pfirsh1.' lu te- , PL~= ^la'teau,
- ' . - L . 8 * * " ****** mijTIM_r.t»pped.-ioiL-Bode. At yery early-times and .low cemporn-
"~"fcutea CT6< lOJeV),~tHere are seveFaFef Cects _(e.Bl eneigy-.reflection from
-- -Che wal-lyrsheath [effects in a par tiaily.Ionized plasma's which would tend to
•: -•-- makB-theleiTectlve energy confinement butter than ci:« Pfirsh-Schluter or
->--- Pseudo-classical formuJds would predict.--These effects arc- modeled hy a
^ - ^ ! 1 S a - r - - i n - ' t S m P e r a ^ U r e ) • t s n h a n c d l l » 1 ? r o r lire" coiifiiieniwi't, roLati ve to the" - theoretical expressions, below V =30 " ev, -so that there is „„ Bnhancon.ent
afc, 30 eV, but a-substantial enhance"ineiic"i7 ~15 "Jv." Cll-ls phase of the bum_..-. cycle -is treated more explici t ly ir Section C-of this chapter,) Thus,
_inltlally^TR_increa.iies becrfuse U£-increasing tempor«tuco mid UocroaBins^^-t-P-*-1 1 6^*'-*- _Af f "c^rent^becojnes signinicant, .the .-onfinetnent,- which
; -1 scales as l | , increased,, and.P^ decreases. After * 1.5 s, the increaser . . i ? ten^erature--ia more important than the decrease-in confinement, and p.,""'" gerier-aiiy 'increases." --- - - - --- • R
"components shown in Figure-III-30 foi the burn cycle arethe integrals.of. the respective power curves,- with the following exceptions:
• -"V- i 8 -*a Plasma thermal enersy and UT Ts_ the total enorgy to the f 1.-st__waU (UT =__UN + UT-R"+ UR). The net electr ical clergy output of the reactor
i s a compo3ite;quantity defined as: :
- B " --
- "' " + V p r o f i l e nT" ' ._ " ' ' (111-18)^r-..--- where *>- > , & - • - • . - - _ • - - .
_ "" _, _ UT / =~~ "thermal energy output! or plasma _ - ' '_'.". 7 'V
-UF - f- ,-ther^onuclear energy output of plasma__
- — ; -„ UB = - b_am heating energy to-plasma-
\ ~ "ohmic heating energy to'plasma
".REF = " r e f r lSeration.energy.needed for- a-single burn pulse = 930 MJ
-LP[!MP = c o o l a n t pumping energy = 0.02 UT
" ""--/ " ~liHp-Sl &-2-way_-_unergy transferred by plasina driving system power supply =
TII-68

100,000 i
50,000 -
1000-
UIzUI
100-
40 5.0.55TIME , S .
V Lgure_ITL-3'J. Cumulative Energy Componentsliuring Reference Burn Cycle.
111-69

U->T.Mrm = contingency allowance. = 260 MJ
n „ = thermal-to-electrical conversion efficiency = 30%
n = neutral beam power efficiency = 3V .. -
n, = energy transfer efficiency = 95%
_ Fusion Powiir with Reference Profiles _ .. / .~ Fusion lowor with Flat Profiles
The burn cycle dynamics calculations are based upon a plasma power balance
model in wvlch t.ho temperature and density profiles arc fLat (u = a ~ 0.0).
It was shown in Table IIT-A that such a model undcrpredicts the. thermonuclear - -
power output by ^ /iO7., relative to a power balj.net1 calculation in which the-tem-
perature and density profiles arc; tri aLt'd.-explicltly, _The_ term_U.,c-- _: _
is aaded to the net energy computation to account for tnis profile effect
upon thcr. onuclear-'enorgy production. For the reference c'ase» U •'-() foe
t v 20 s, and I' = 2.09 GJ ;U t - 55 s. " " "— net e
The cycle averaged net electrical power is defined by:
nn e t end of cycle2.09 GJ
net cycle time 55 s= 38.0 MWe (ilT-lQ)
where the cycle time is 55 s for the reference case. The gross electrical
power, averaged over the cycle, is defined by:
(U + "^Profile + V } t l TPe = cycle
.where, U u ia-tht energy thermallv cecovanod £rqm_tha neutral beam injection
systeu.
5. - Power Performance
The nst energy flow Tor the reference, case burn cycle is shown in Figure
111-313, and the energy balance is summarized in Table TII-13, for the case
with thermal energy conversion, A total, of 16.34 GJ of energy is incident
on tho first wall; of this , 15.96 CJ is produced by fusion and 0.38 GJ results
from beam and ohmic heating of the plas.aa. An additional 0.45 CJ of thermal
energy is recovered from the beam injection system, so that the total thermal
energy to the thermal conversion system is 16.79 GJ. if this energy is
converted to electr ici ty with an efficiency of 30%, then 5.04 GJ of electrical
energy is produced in a burn pulse. Of this , 1.51 GJ are required" to "operate ..
HI-70

V4
2.26 GJ
1 I
6-0.46 G J Q _
OH/EF EnergyStorage 4TransferSystem '
0.37
2.35 GJ 2.26 GJ
GJ.
OH/EF.Coils &Plasma CurrentInductiveEnergy
.98 GJ, 2.31. GJ
v ^NB Injection
System
-1.33 GJe 1.56
DirectConversion
Refr ig . 0.93 GJe
Pump 0.33 GJ
16.34
0.45 GJ t__
GJ.
Thermal 15.04Conversionu = 305
0.23JGJL' 11.751
Qj
GJ,
jaste
1.44 GJ.
Figure III-31a. Net Energy Flow in Reference Burn Cycle'(with Thermal Energy Recovery)

Table 111-13. Energy Balance — Refereace Case Burn Cycle
Thermonuclear energy proclucad ..:.:.-.: 1SS#$ GJ
Energy input to plasma — ~ - . - 0.38-GJ--
• Beam-Injection 0,29 GJ
Ohmlc Heating 0,09 GJ
Energy to first wall 16,34 GJ
Neutrons 782
Transport 13%
Radiation 9%
Thermal energy from injectors 0.45 GJ
Electrical energy produced (i == 30%) 5.04 GJ
Electrical energy required 2.95 CJ
Makeup to Energy Storage 1.44 GJ
Auxilliaries 1.51 GJ
Net Electrical energy 2.09 GJ
Waste heat to environment 13.86 GJ
Auxilliaries 1.51 GJ
OH/EF system 0.37 GJ
N3 direct conversion 0.23 GJ
Thermal Conversion 11.75 GJ
— Waste heat—rejected to environment, - .-average over operaLing cycle 198 MW
ELectrical power required to operate EPR,average ove.. operating cycle 42.1 MW
.Gi-osa electrical power
averaged over burn cycle, At = 55 s 91.6 MW
averaged over operating cycle, At = 70 s 72.0 MW
Net electrical power
averaged over burn cycle, At - 55 s 38.0 MW
averaged over operating cycle, At = 70 s 29.9 MW
111-72

auxiliary systems (refrigeration system - 0.93 GJ; coolant pumping
system -0 .33 CJ; other systems - 0.25 GJ) and 1.44 GJ are required to make
U P decei ts in the energy storage system due to lns S ^# t t : , f e j> fe^« i b e a m
inject .on system (0.98 GJ) and the OH/EF system (0.46 GJ), TMs^leaves 2.09
GJ net energy which would bo available for transfer t o a n electrical -power
grid. Averaged over the reference operating cycle - a series of 55 s urn
cycler, sej.ara.tecl hy 15 s• replenislwenH intervals*- this corresponds to 25,-9
MKQ supplied m Che power grid, Wast© ivgM rejected: to the environment
is 98 Ml-;, averaged over the reference operating cycle.
I Alfrough thermal energy conversion a* rtf - 30% is assumed for the sake
of qompotins «he power parforaanoe, the EFR may well operate without a thermal
conversion eyele. In this case the entire energy requirements to operate the
system would be drawn from the electrical the power grid and the thermal energv
-juld be dumped to the environment. Only 2.95 CJ per burn cycle, or an
average power of 42,1 MM, is required from power grid to operate the EPR
in" the reference operating cycle. In this case, 438 MW- average power would
be rejected to the environment. 'A net energy flow is shown in Figure III-31b.
For the reference case, the burn pulse is of 55 s duration. Both
shorter and longer burn pulses are achievable by varying the mode of opera-
tion. Shorter cycles can be achieved either by "injecting a high-Z impurity
to "poison" the plasma or by not refueling during the burn. Longer cycles
can be achieved by supplementing the"fusion alpha heating with beam heating
when the plasma begins to cool. The net electrical power achievable under
___. __.these_diff ereut operating conditions is .plotted as a func t iono^ the length
of the burn pulse in Figure ITI-32.
Injection of a high-Z material enhances the radiation loss and cools
the plasma. Argon (Z = 18) is an appropriate gas in that i t is easy to
handle and a relatively small amount (1/4% of the" DT density) is-sufficient
to quench the plasma in about 5 seconds. The curve labeled "reference case"
in Figure 111-32 indicates the performance which can be obtained if the
reference case bum pulse is terminated at earlier times (t < 55 s) . The
minimum burn pulse duration for breakeven (l'NcC ii 0) is * 25 s. Generally,
111-73

.2.26 GJ
H
Figure III-31bt Net Energy Flow in Reference Burn Cycle (without Thermal Energy Recovery)

WJTH SUPPLEMENTAL BEAM
Power Performance as a Functicjn of Operating MoS.e

P increases with burn pulse duration because some of the major energy
deficits — beam beating, refrigeration, plasma driving system energ-
transfer-losses — are more-or-less independent of the burn pulse duration,
while" the gros_s_energy_produced increases with thejduration of. the burn
"pulse". Actually," 'quenching the burn pulse a" few seconds before its natural
self-quench eliminates the relatively cool and non-productive' tail of the
burn pulse, thereby increasing the power output averaged over the entire
burn, pulse.
On the other hand, if neutral beam fomating is used to supplement the
fusion alpha heating, the plasma temperature can bo maintained and the
productive duration of the burn pulse can be extended. In the simulations
that are summarized by the curve labeled "supplemental beam" in Figure 111-32
supplemental beam heating was employed to maintain the plasma temperature
as high as possible without violation of the 8max <. 1,72 limitation. TheP
required beam power increases with time — as the impurity radiation losses
increase -- to a maximum value of 35 MW for a 95 s burn pulse. For shorter
burn pulses the required beam power is substantially less — e.g. an 80 s
burn pulse requires a maximum of 15 MW of supplemental heating. An increase
of as much as 30% in pnet> relative to the reference case, can be obtained
by employing supplemental beam heating.
Adequate refueling to replace D and T ions which are burned in fusion
or which fail to recycle (98% reflection is assumed) is assumed in che
reference case. A breakeven (P > 6) burn pulse is predicted without
refueling (but still as suming. 9 8X ..re flection) ;_however,_the-power-performance_._
and maximum burn pulse duration are significantly degraded, relative to the
reference case.
The manner in which the startup is effected and the efficiency of
energy transfer in driving the plasma current and in heating the plasvna
have an effect upon the power performance, as well as upon the requirements
for the plasma driving and heating systems. The power performances of several
cases, which differ only in the length of time, At^, in which the OH current
is reversed and time, tg, at which injection heating is initiated, are shown
in Figure 111-33. These cases correspond to cases 2, 5, 6 and 7 in Table
1H-11. Increasing the startup time has the obvious effect of displacing
the burn pulse to a later time. However, the major effects of increasing the
startup time are: (1) to increase the maximum em -gy transferred in the OH
IIT-76

01
C IflO 0)
•H e
3
CJ E
to co
p -a
o i-lcu ffl
w
o a
CO•H
s o•«*•
oroO o o o
1o ¥ o o- m
1
111-77

system (to offset increased plasma resistive losses), thus to increase the
energy losses in the OH system; and 2) to increase the beam heating energy re-
quired to off§es, Ehe .increased: energjiL transporttot the: wal£::duEtng*the
startup. " ,
The. in-jeqte4 beam heating; power has a substantial.; effect upon the
power performance, as shown in Figure III-34, The cases shown correspond
to cases 5t St 9 and 10 in table 111-11, The time required to heat to
operating temperature varies inversely with the beam power* but not
lineerly. The beam heating energy varies inversely with the beam power
because of the larger energy transp&rt losses associated with the slower
startups. The energy transferred, hence the associated losses in the OH
system varies inversely with the beam power because of the increased plasma
resistive losses associated with the slower startups. Both of these energy
variations tend to saturate for beam powers at and above the reference
value of P = 60 MW. From Figure HI-34, it is apparent that heating with
PB =-40 MW would result in only a slight degradation in performance, and
that even PT> = 20 MW results in satisfactory values of "P . However, wiuho net
P = 20 MW the minimum burn pulse duration required for breakeven is greatly
increased. The longer burn pulse associated with PD = 20 MW results fromo
the delayed buildup of He. With a capability for P = 60 MW, the EPR heating
system appears to have ample margin.
The efficiency with which the injected beam power is produced and
the efficiency with which the "energy transferred in and out of the OH and
EF system during the burn pulse are both important in the determination
of the net electrical power produced. Several representative cases are
shown in Figure III-35. The reference case is based upon a beam power
efficiency, nB» of 34% (which assumes thermal energy recovery at 30% efficiency
and electrical energy recovery at 85% efficiency in the injection system) -
and an energy transfer efficiency, nps , of 95% for the" plasma driving systems.
The use of D ion; sources in injection heating or"the "use of RF heating
could result in heating efficiencies near 60%, while n = 25% represents
a possible consequence of using higher beam energy. Energy transfer
efficiencies on the order of n^ - 85% represent very pessimistic lower
limits. It is apparent that although these efficiencies are important, -
they do not appear to be make-or-break quantities with regard to the
EPR power performance. Tills situation would change if i t were necessary
111-78
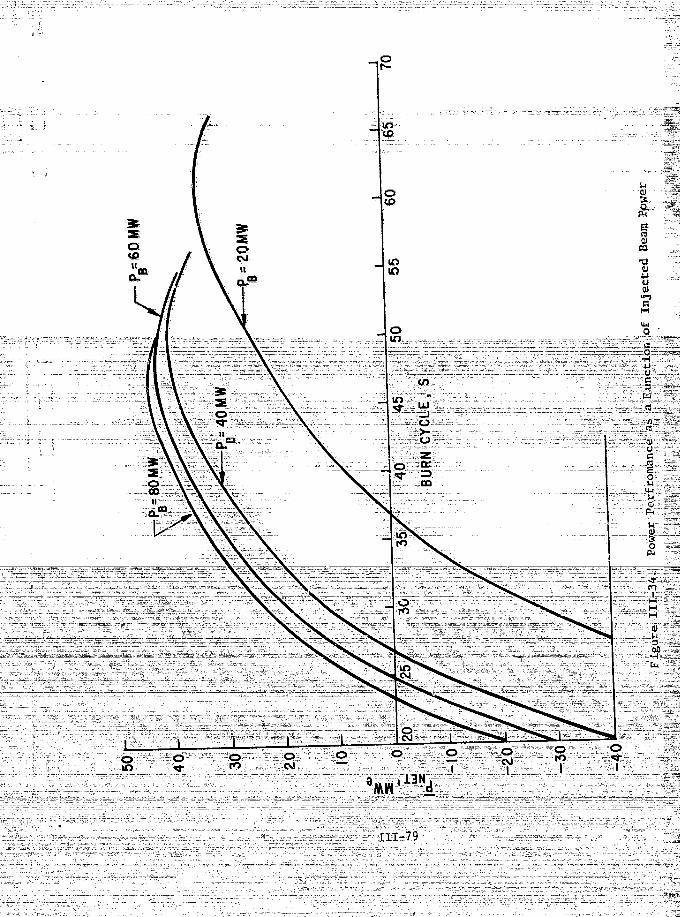
_ o
u01a
ta•a*u
co•H4J
•Jl
oBrt
u
I
i
360•H
111-79

ooo
Figure I I I - J D . Power:Performance as a Function of EnergyTransfer Efficiencies.
•m/iimn\T\ il 1

to constantly provide supplemental beam heating to compensate -for subignitiun
energy confinement.
. - - Calculations-up" to this point have "been-based on-the assumption of-a—
---'". ti-'c-d plasma edge temperature of 200 aV. This temperature affects the :
calculation lr. two ways, "The sputtering coefficients depend upon the mean"
energy of particles leaving the" plasma, hence upon the edge temperature.
Tha charge-excliange" and ioniyaLlon rates depend on Cue edge temperature. -
These ofCecCs are discussed in"Appendix B. . " " " " .
For beryllium, Che maximum in the D-T sputtering yield occurs" For nean
particle energies in the range 200-4QG ev, as shown in Appendix B, Thus,
an ecjgp temperature of 200 eV is a worst case with respect, uo tne "effect
af wall-sp. ered. iinpuri.tfn's "pon cite plasma performance.. Operation with
an edge temperature of 1 koV significantly improves P e t * Operation at
an edge temperature or 60 eV wore than douhles P and results i i very long
burn pulses. These results are shown in Figure HI- % -
6. Plasma Heating -
a. Neutral Beam Penetration
17 18 19
Recent experiments OK ORMAK," ATC and TFK have established the
fcasibilityof neutral beam injection heating of a plasma and havj indicated
that the theoretica] understanding of the phenomenon is quantitatively ade-
quate. However, substantive questions remain about the penetration ar;rf
heating of large plasmas by neutral beams.For .the. b_eam__energies_pf interest, charge exchange accounts for less_
than 5% of the fast ion production; the remaining 95% of the East ions being°0 7
produced by ion impact and, to a minor extent, electron-impact'phenomena." '"•
The ion impact croso sections are functions of the nuclear charge of the
plasma ion, scaling as Z* relative to the proton impact cross section,"
The total "ioni2ation" cross section is oily weakly dependent on plasma
temperature for the energies of interest, allowing tha n.ean~rree path for
attenuation of the neutral deuteron beam to be written
X = 2.7S x 1017 11 (keV)/n (m- 3 ) -? .^
This expression is valid for 40 keV <. U <. 200 VceV.
111-81
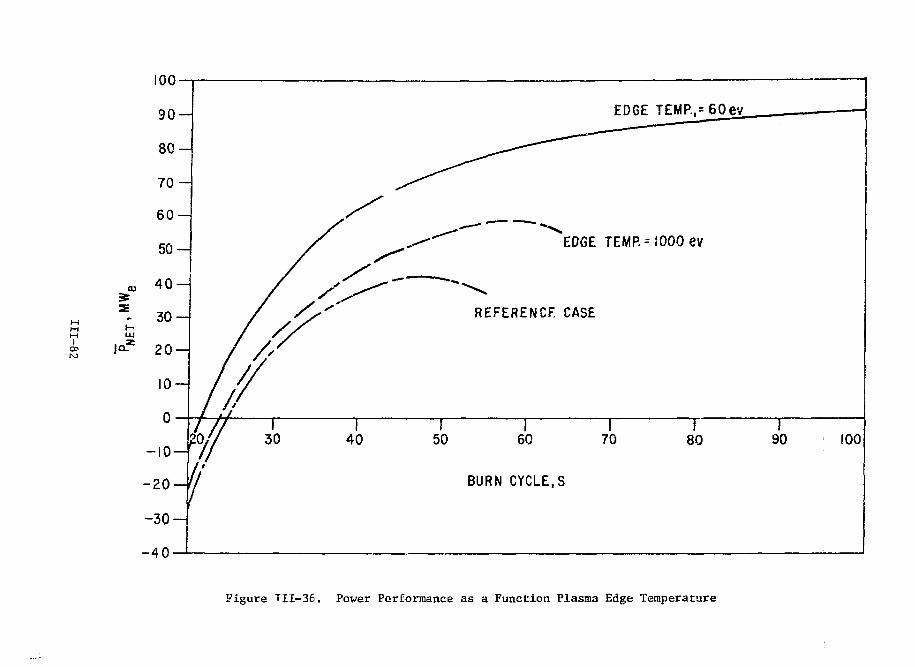
100-
M1
00
-30-1
- 4 0 -
EDGE TEMR,= 60ey
EDGE TEMP. = 1000 ev
BURN CYCLE,S
I90 100
Figure TH-36. Power Performance as a Function Plasma Edge Temperature

?2Analysis' indicates that the ion deposition profile will be concentrated
at the center of a plasma of radius a when X >_a/4. This criterion is
probably valid for perpendicular as well as tangential injection. Using
this criterion, the required beam energies for the EPR are in the range
^ 150-250 keV, depending upon Z cf and the electron density correspondingGil t
to the different cases. A deuteron energy of U = 180 keV has been chosen
as the reference value.
Numerical studies of beam penetration into the EPR plasma have been
carried out to supplement the above analysis. These studies simulated the
injection of a pencil beam, consisting of only the highest energy component,
into a plasma with an assumed radial density distribution comparable to the
reference design case. Power deposition profiles per unit volume and per
plasma ion are shown in Figures 111-37 and III-38, respectively.
The curves labeled 1 and 2 correspond to a relatively broad (a =0.3)
and a parabolic (a = 1) density profile, respectively, a deuteron energy
of 180 keV, Z _f = 1.3 and a plasma density comparable to the referenceTFC
design case at B = 1 0 T. The power deposition per unit volume is rela-max
tively uniform, excepting the geometrical peaking about the plasma axis
at r = 0. However, the power deposition per plasma ion increases with
radius, again excepting the geometrical peaking at r = 0; this implies
preferential heating of ions in the outer regions of the plasma, which cpuld
reduce the effectiveness of the beam in heating the bulk of the plasma and
would tend to broaden the temperature profiles, possibly even resulting in
an inverted profile. The consequences of these power deposition profiles
with regard to plasma heating and temperature profiles depend upon the heat
transport mechanisms within the plasma.
The power deposition profiles, both on a per unit volume and a per
plasma ion basis, can be shifted toward the center of the plasma by re-
ducing the plasma density. Curve 3 in Figures 111-37 and 111-38 was ob-
tained by reducing the average plasma density t:o one-half the value used
to obtain curve 1. The reduced density is comparable to the reference caseTPP
at B = 8 T, A reduced density startup, in which the plasma is heatedmax
to ignition temperatures at reduced density, and then additional fuel is in-
jected, is also a possibility.
111-83
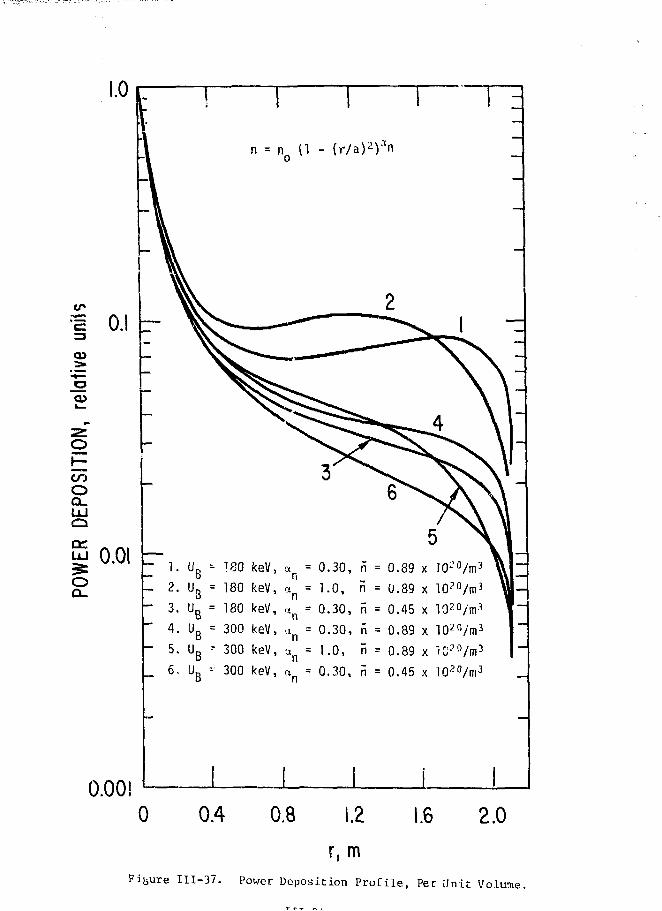
•s 0.!o>
COOa.UJQ
| 0.01oQ_
0.00!
- 180 keV, a = 0.30, n = 0.89 x 10-'°/m3
U B = 180 keV,
U B = 180 keV,
U B = 300 keV,
Ug •- 300 keV,
„ 6. UB * 300 keV,
an = 1.0, n = U.89 x lO-^/m 3
a n = 0 .30, n = 0.45 x 10? 0 /m3
u n = 0 .30, n = 0.89 x 10² n /m3
un = 1 . 0 , n = 0.89 x lC i :>Q/m3
= 0.30, n = 0.45 x 10² 0 /m3
0 0.4 0.8 1.2 1.6 2.0
r, mFigure 111-37. Power Deposition Profile, Per Unit Volume.
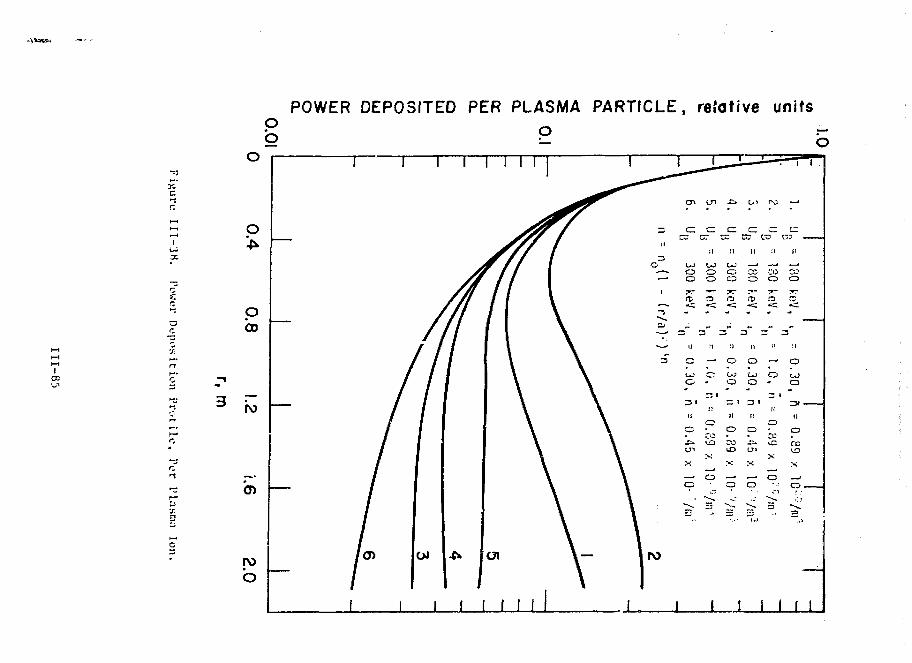
I
ICO
O
b
POWER DEPOSITED PER PLASMA PARTICLE, reJative units
o
p
OCD
3 ^ _
cn
b
i
—
/
/
r/i
I 1
//II
1
OJ
1i i
1
J
///
j
1
11
1 1 1 1
^^^r^ cn
\\ \ " "
\ \ ^
1 1\
1
ro
1
1~ —•
c:
ii
oCD
ft
—
O
s:
CO
o
—r——
M
CO
oo
~ -[1
o
o
r:«no
CO
X
\
t—
[ ]
shi
3
U
O,30,
[i
o
X
o
a
130
fa
3
i !
—
o
111
CD
CO>X3
X
o
' a '
j |
= = f " r
r- —
(I
£3
o
o
II
CO
o
1 1

Increasing the deuterim energy Is another way of shitting the power
deposition profile towards the center of the plasma, if this should prove
to be necessary• Curves 4-6 in Figures tli-37 and II l-'JH correspond u>
curves 1~!1, except that the denieron energy is 300 keV. Of course, in-
creasing the deuteron energy s'mii) 180 to 300 keV results in a substantial
decrease in Injection system power efficiency (see Chapter V) when positive
ion sources are vised.
b. RF Energy Absorption
In rf heating, anergy is imparted to the plasma by means of high
frequency electromagnetic radiation. The basic processes involved are the
initial generation of the rf energy, transmission from the source of an
appropriate liumchini; structure, and absorption of energy by the plasma.
The most likely frequency bands fot rf heating in the Kl'R are the electron
cyclotron resonance (f => 100 OH;:), where the rf power is used to accelerate
electrons perpendicularly to the magnetic field; the ion cyclotron resonance
(f - 25 Ml!?.), where ions are accelerated the same way; and the lower hybrid
re: nnance (f » I GHz), where collective plasma oscillations are excited
which ultimately transf- ..ergy to the plasma particles. Although rf
heating of plasmas has been tried for many years with some success, it is
only recently that high power experiments have been planned or .ittempted
on tokamaks.
At the lower i.ybrid frequency, experiments on the ATC device have
demonstrated effective coupling to the plasma at the 200 kW level." Ions
were heated more than electrons, however. Experiments on Aleator using a
single, grill-type element achieved up to 802 absorption without any
deleterious effects on the plasma."' Edge heating was dominant In these
experiments. For EI'R size devices the central question for lower hybrid
heating concerns possible nonlinear effects that may prevent penetration
of the wave "nto the bulk plasma,
F.xperiments on rf heating at the ion cyclotron frequency also seem
promising. Results fro:n the ST tokamak at the 1 MW level showed that
power could be produced at 902 efficiency, and twenty per cent of this
power was ultimately absorbed by the ions, raising their temperature Several•>5 ->(j
hundred eV." **" Recent experiments in the ATC also indicate successful heating
of ions. A larger machine should have higher absorption efficiency, because
III-B6

surface effects should bv less severe, and confinement uf high energy Ions
should h« better.
Larg*-, Uiiih power (:> ,MU') experiments with ion cyclotron and lower hybrid
resonance hen liny, arc- now planned for I'l.T and !'DX. 'Hie former results should
hi: available by 197 9-1980.
Although y.iinerat ton and transmission of rf power arc well understood
below 10 GHz, above tills frequency high power-tubes have not yet been
available. Recently, Varian"" has surveyed the possibility of producing
ruhus with frequencies in the ECRU range (f = 100 GHz) and has concluded
that 100-200 kW CW operation is possible with efficiencies of up to 30Z,
No devices have yet been produced, however,, and no high power experiments
will be possible until these tubus become available.
'• PUisma Refueling and Recycling
a. Requirements
Based on the analysts of possible operating modes for the KPR it appears
essential to refuel the plasma during the burn pulse; to do otherwise results
in a truncated burn time and severely reduced output power, as shown in
Figure 111-32. An external refusling source can also serve as an effective
control mechanism. The amount of refueling needed is equal to the ditference
bt-tween the gross particle loss rate of the plasma and the natural recycling
that may occur. The combination of recycling plus refueling can be thought
of as the overall "replenishment" rate.
Ions art.- lost from the plasma by burnup from fur! on and by transport
to the wall, lioth burnup and transport losses tend to peak near the start
of the burn a.Ml diminish thereafter as the plasma cools, Kor the reference
case, neglecting the bean heating period itself and the initial transient
thereafter, the peak loss occurs at 8.0 seconds. At this time, the burnup
rate is 0.&53 of the total D-T ions per second and the transport loss is 20K
per second. (The fractional burnup, defined as the ratio of burnup loss to
transport loss, is therefore 0.0225.) At 40 secondr, into the cycle, when the
plasma has cooled off considerably, the burnup rate has decreased to 0.29%
per second, and the transport rate to 7.2% per second.
111-87

In the reference iase analysis it was assumed that all of the ions ro-',
fleeted from the wall were recycled Into the plasma. The particle reflection
coefficient for 0-T, R.yr, w,ns taken as 0.98, but because of neutral
charge-exchange phenomena, the effective recycling is 0.966 (net! Equation C-4),
This means that 96,6% of the D-T particles leaving the plasma will be re-
cycled; in other words for the data at 8 seconds, the recycling rate is
19.3% per second. The refueling requirements would therefore be
20,4 - 19,3 = I.IZ per second. For different reflection coefficients
the recycling fraction scales accordingly.
It should be noted that the concept of a single reflection coefficient
really represents the composite of several phenomena occurring ar the wall:
re-emission, desorption, backseattering, etc. The exact value of the re-
flection coefficient, RnT, is uncertain, but it is believed to be very close
to unity. For a value of R exactly equal to unity, the required refueling
rate would be equal to the burnup rate. If R.Jf were as low as 0.9, the
refueling rate would be 2.5% per second. Maximum refueling and re-
plenishment rates for the reference case are shown in Table III—1A.
Table 111-14. Refueling sad Replenishment Rates-Reference Case
Replenishment Rate
(Total influx required to balanceconfinement and burn up losses)
Refueling Rate
(Replenishnient rate minuswall recycling)
5.60 X 10²⁰
Clearly, the question of recycling is a fundamental one, not only
in determining the amount of external refueling, but in determining whether
the plasma will perform acceptably. The DT ions will, be reflected at the
wall, and there is no mechanism for removing them from the vacuum chamber in
the EPR design. Since the plasma acts as an effective pump for particles
in the vacuum chamber, i t seems reasonable to assume that the reflected
D-T will return to the outer region of the plasma, as i t seems to do in
III-88
those tokamak experiments in which no special measures are taken to in-
hibit recycling. The relevant question is whether the recycled D-T will
diffuse back into the hot plasma core or accumulate in the cool edge region.
In fact, if there is no recycling into the hot core, it is difficult co
visualize how the EPR could be operated for more than a few particle
confinement tiroes (T ^ 5-10 s), since the buildup of DT density in the
edge regions would quickly be many times the bulk density.
A preliminary analysis of this important topic has been performed
using a 2-node model described in Appendix C. This model treats the plasma
as composed of too regions, a hot central core, surrounded by a thin,
relatively cool, corona. The core is coupled to the corona by means of
energy and particle transport. The corona interacts with the wall through
energy and particle transport, wall reflection and sputtering, and charge-
exchange of incoming neutrals.
A series of calculations have been performed for plapr « and wall
conditions typical of the EPR reference design case. The results to date,
while still preliminary, indicate that effective recycling will occur.
It appears that the corona may act as a kind of series connection between
the core and the wall, considerably reducing the particle transport from
the core. The corona density is maintained by recycling. In effect,
the particle confinement time of the plasma core is much larger than the
simpler, global analysis would indicate. (The energy confinement times
are largely unaffected.) Typical effective confinement times for the
core are in the range 50-300 seconds, depending on the specific parameters
used,
A parallel result from the 2-node analysis is that the core density
can be maintained virtually constant by providing an appropriate refueling
current to the corona only. The implication of this result is that re-
fueling can be accomplished by merely pulsing D-T gas in at the outer edge
of the plasma.
These resulcs, although preliminary, are encouraging. However, it
is certainly not possible to conclude at this time that the EPR can
operate without some mechanism for injecMng fuel into the central core
region of the thermonuclear plasma.
111-89

b. Pellet Injection
Considerable theoretical and experimental effort lias been directed
recently at the method of pellet injection, The range of 0-T Ice pellets98 99 30 31
has been estimated by Tonks," Gralniek," Rose, and General Atomic
for thermonuclear plasmas. Although there have been others, the most appli-
cable experiment was done on ORMAK by Foster, Colchin, Hendrlcks, and32 33
Tvirnbull. * In this experiment, pellets 70 u In diameter were success-
fully injected into the ORMAK plasma. The observed range seemed to agree
well with theoretical estimates.
The range of a particle in a thermonuclear plasma goes roughly like
r /V/T ; thus, the highest injection velocities and radii are desired. Two
methods seem most appropriate. The simplest Is release by a centrifuge at
high velocities. The highest obtainable speed of such a device is in the
range of 3-5 x 10i tns, using specially developed materials. Laser ablation
of particles has also achieved some success in acceleration of ice fragments.
In this method, a slow (50 ns) laser pulse is used to vaporize one side of
an ice pellet. The remaining part recoils at high velocities. Existing
ablation techniques tend to fragment the pellet, making these techniques
unsuitable for pellet fueling.In order to achieve a range of 1-2 m with a pe-llet velocity of 5 x 10³
28 ^9 30m/s, theoretical estimates **" * indicate that the pellet radius must be about
2 mm. (The General Atomic model predicts that a larger radius would
be required. ) Pellets of this size would have to be injected at a rate
of 6/s' to satisfy the replenishment requirement shown in Table 111—1*«. When
recycling at the wall is considered, the pellet Injection frequency would he
only 0.35/s to meet the refueling requirement. Replacing the D-T mixture
burned as fuel should require only about two pellets per burn cycle.
In the ORMAK experiment the pellets were formed by a jet of liquid \h.
This method of pellet production produces small pellets at fairly low
velocities (102 m/s) and is difficult to scale ur to the EPR requirements.
A more realistic pellet injector might involve a centrifuge spinning at high
speed in a vacuum with apparatus at the tip to produce D-T ice droplets.
The mechanical problems involved in doing this would be considerable, as
the velocities required would be 10-20 times higher than can be reached
111-90

with a solid rotor of steel or aluminum. Gas guns have also been studied;
however, forming, accelerating and guiding a pellet through a gun at high
velocities are also difficult mechanical problems, and solutions have not
yet been found,
c. Other Hethcds
Since neutral beams are comparatively inefficient and difficult to build
in the sizes required, the other alternatives seem to be methods which refuel
the plasma at its edges. The simplest is, of course, the injection of DT gas.
Another la the cold gas blanket; however, the effects of a high neutral pressure
on the tokamak plasma are not fully understood. In order to circumvent this
problem, the use of plasma guns has also been studied. The net effect of
plasma gun refueling (assuming impurities can be eliminated) would be similar
to that of a cold gas blanket; 'iowever, the neutral gas pressure should be
much lower.
The primary objection to the plasma gun is that the impurity fraction
of existing guns is high. This is primarily due to the fact that the plasma
is produced by means of an arc between two metal electrodes. If the plasma
can be produced away from solid material by means of focused rf beams,
then the contamination due to solid impurities should be negligible. The
plasma could be guided from its point of production to the tokamak plasma
by means of dc electric fields. The required electric force is E = B v,
where B is the toroidal magnetic field, and v is the desired pellet velocity.37
As shown by Baker and Hanunel, plasma should move through the toroidal field
of the tokamak until it reaches a point where the electric field can be
shorted. This would happen at the plasma surface.
Estimates have been made of the required number and size of plasma
guns, assuming guns can be built that can produce 4 x 1 0 ^ ions/s with
low impurities. (Existing guns can now produce 6 x 101' ions/s in 0.1 ms
pulses, with a fairly high impurity content.) Only 15 of these would be
required to replace the plasma lost (T = 4 S, 96.6% reflection), but ifP
the wall reflectivity was neglected, then the number of guns would increase
to 30.
111-91

C. Plasma Initiation
IJSijyation Mode
The quasi-stable plasma in a normal tokamak is produced by a toroidal
electric field. This field serves two purposes: the plasma is created
by a Townsend avalanche process and plasma current is induced. The plasma
current ohmieally heats the plasma and creates the rotational transform.
The time development of an EPR plasma has been studied at early times by
means of a model described in Appendix C, part 6, A typical set of results
from the calculation is shown in Figure 111-39. In this model, che plasma
is considered as an inductance in series with a resistance. Breakdown is
assumed to occur at R - 6.25 m.
The driving voltage, V , produced by changing flux in the ohmicL*oop
heating or startup coil, rises in about 2 ms to about 550 V and stays
at this voltage for *v 6 ms. In the first 1.2 ms, the. electron avalanche
converts essentially all the neutral gas in the tank to plasma. As soon
as the density of electrons is sufficiently high, the current will start
to rise and the power produced by ohmic heating will also rise. When
the plasma heats up, the resistance drops and it becomes possible to main-
tain a current with reduced voltage. During most of this time, the princi-
pal source of power loss is ionization and re-ionization of plasma parti-
cles. Impurities can, however, produce a significant loss of power, as
has been pointed out elsewhere.
The primary problem of startup in large reactors is the constraint
imposed on the current density by the MHD stability condition q ='ID
rBt/RB >. 2.5. As pointed out by Hawryluk and Schmidt, the maximum
allowed average current density J = B /(2 q VnR) decreases with reactor
size, thus the maximum ohmic heating power
P0H " * J 2 r qt"o Rjwould be much less than in existing devices. For a large device like the
EPR, this can impose serious problems. For example, since P,,., is propor-
tional to (B /R) , the maximum power density at the outside edge of the
plasma tank is only about one-tenth of the power available at the inside
111-92

100
p
coo.=-
600
50C
4Q0
300
200
100
0
I I _ I —I. . . . . . . . . - . I - -—.-• ,.••• *—-•• ,- ^ - 7 - - - - - - - > - - J - . . - . ' . : ~~ — %
VL00P
" " / \
- / v^- / >^ \
/ /
'PLASMA
100
— 50
1.0
0.1
0.01 —
!
— /^
— /
/ 1
1 1— • -
f ^ POWER LOSSFROM 1% OXYGEN
1 1
P0H- »
1
1 - ^
N^ —
\1
6
TIME, ms
10 12
Figure 111-39. Plasma Breakdown Normal S ta r t -up Cycle
111-93

edge of the tank. Since the power level required-to create a discharge
is dependent: on Factors like impurity levels, i t is not obvious that i t will
be possible to develop enough power to start the plasma under a l l conditions.
The maximum current, current densities, and P values for different valuesUti
of q, R, and a are shown in Figure 111-40.
In the example'.of Figure I I I - 3 9 , the minor radius of the plasma was held_"
- to a constant 0.35 m during breakdown. This comparatively small r ad ius was
chosen to avoid -the problem of sk in cur ren t s . These skin cur ren ts may prevent
the a p p l i e d - f i e l d from pene t r a t i ng in to Che cen te r of a^large plasma, i n -
h i b i t i n g the development oE the desi red current d i s t r i b u t i o n J ( r ) . The bes t
solut ion seems to be to s t a r t with a small plasma and increase the plasma
.radius and cur ren t s imultaneously, e s s e n t i a l l y by adding current to the39
outside edge of the discharge .
There a re d i f f i c u l t i e s , however, in producing a plasma with a small
radius in a large'vacuum tank. The primary problem i s that the plasma w i l l
tend to~ionize , hence trap", any neu t r a l "atoms whicU pene t ra te I t s s u r f a c e .
This process w i l l tend to pump a I,,1, the res idual gas in the torus i n t o the " "
plasma and- increase- the dens i ty by a factor of (Vol , / V o l , . , ) . Al-- _ _ tank discharge
though t h i s ,or of.'em has not been ser ious with e x i s t i n g devices where the
—" "plasma occupies_-most of the vacuum chamber," the dimensions of the EPR w i l l
again in t roduce d i f f i c u l t i e s . Assuming a plasma radius of 0.24 m (comparable
to what i s planned in the i r i t i a l s tages of the TFTR discharge) in a vacuum
tank 2.4 m i n minor radius and an i n i t i a l plasma densi ty of n = 2 x lO1^ m~5,
the neu t ra l dens i ty in the tank must be 2 x 101 9 x (1/100) = 2 x 10 1 7 atoms/m3,
or 0.6 x 10~5 Torr . If the r e s i d u a l gas were pure I)-T mixture, the re would
be no problem i n using i t ; however, this gas would be expected to conta in
enhanced^.fractions of i m p u r i t i e s , p a r t i c u l a r l y _ h e l i u m , _ w h i c h . w i l l not pump,
out as f a s t as hydrogen. One would l ike to d i l u t e these impur i t i es with
pure gas .
" -Prolonged running a t s m a l l , r a d i i and low cur ren t s should be avoided
because th"e spl asma confinement i s poor under these condi t ions , and the
;-startup becomes very inefficient. -
>\E. shown in Figure III-39, oxygen impurity radiation losses are very large
at about T = 50 V, -causing enhanced power losses at about 50 eV, These
111-94

i 25Q
1 -—
O.I 0.2 0.3MINOR RADIUS a, m
5 6 7
MAJOR RADIUS R, m
0.5 0.6
OH / P O H , R = 6.25
Figure III-AO. Plasma Breakdown Sensitivity
111-95
should probably be minimized by raising the electron temperature above
100 eV as soon as possible.
While plasma power losses are minimized by starting up the plasma
current quickly, the large voltage required to do this could cause runaway
electrons. These runaways are electrons which freely accelerate around the
torus unimpeded by collisions with other electrons, since the collision fre--3/'quency drops as E , where E is the energy of the electron. Runaway
production is strongly related to the ratio E/2E , where E = 2 x 10~19 x
n /T is the Breicer runaway field, Since E ~ nJ, runaway production drops
•when E T /n decreases. Since T and n are essentially constant at break-
down, runaway production can be minimized by making E small at tfhe end of
the avalanche process, when it seems: most runaways are produced.
It has been assumed in this discussion'Chat the plasma current will be
created by a special startup coil, separate from the ohmic heating coil,
because the time constants and power levels of this coil are different:from
the OH --coil", -^preliminary-design^df this coil is discussed in Chapter IV, -:—•
At the end of the breakdown phase, however, the total resistive part ofthe
loop voltage, I pR, will have to be comparable to the driving voltage pro-
duced by the ohmic heating coil, which rises comparatively slowly from zero.
Calculations have shown that a discharge with T 'v* 130 eV, I = 115 kA,
a — 0.36 m can be maintained at constant current with a voltage V_ ~ 28 V.
Ohmic heating continues to raise the plasma temperature and lower the re-
sistance, so the voltage requirement drops with time. It is anticipated
that a sinusoidal ohmic heating pulse with a half period of two seconds
should produce 25-30 V after about 0,3 s, thus plasma initiation should
occur at this time. After the plasma—i-s—s tar ted—and—the nohmic-heating and
equilibrium fields provide the driving voltage, it will be possible to
increase the minor radius, density and temperature. The contribution to
the driving voltage, V. , due to the initiation, OH and F.F coils
is shewn in Figure 111-41. Starting the plasma at 0,3 sva^fes only
about A V-s of the OH inductive flux.
2, Alternatives
In the event that these conflicting constraints prove to be difficult to
satisfy, or if the construction of a breakdown coil proves difficult, it
111-96

oO
50
Figure 111-41. Voltages. During Startup
111-97

should be possible to use auxiliary heating to help with the startup process.
Experimentally, electron cyclotron resonance heating (ECRH) seems the most
convenient form of auxiliary power, since the total power required is not too
large, but it is also possible that heating at the lower hybrid frequency would
be useful. Neutral beams would be less desirable, because ions would be heated
rather than electrons. The net effect of these forms of auxiliary heating
is shown in Figure XIX-42. By raising the electron temperature, the con-
finement time will be improved and the resistive voltage ipR will be
decreased, enabling the plasma to develop with a much lower driving
voltage. By increasing the amount of auxiliary power, it is possible
to eliminate much of the resistive fraction of the driving voltage, VT (t),LiOOp
A continuous range of possibilities can be achieved hy applying different
levels of power at different times, with or without a reduction in applied
loop voltage, VLoop.
It might also be possible to eliminate that part of the voltage spike
needed for the initial electron avalanche if plasma can be introduced into
the cank by some other means, such as rf ionization or plasma guns. When
voltage is required only to induce plasma current, less is required; and if
the power losses due to poor confinement were replaced by auxiliary heating,
it may be possible to use the long time constant OH coil entirely, and dis-
pense with the breakdown coil. A low plasma density is preferable in this
mode of startup, because less power is required to maintain a plasma at lew
densities, and the confinement time against VB induced drifts is longer.
Esti iates have been made using the model of Appendix C, part 6, neg-
lecting impurity losses and assuming all plasma is injected in a fully
ionized state. The results show that in about 50 ms, a plasma comparable
to those in existing tokamaks could be produced. Because of limited ex-
perimental data on plasmas of this density, however, it is difficult to
calculate very accurately the rf power levels required to do this.
One of the principal objections to these alternative methods of start-
up is that the runaway electron problem could be very toublesome, but there
are two reasons why the runaways may be less serious than might be thought.
The first is that the parameters T and n can be controlled in a way that
runaway production can be minimized. Runaway production is a function of
111-98
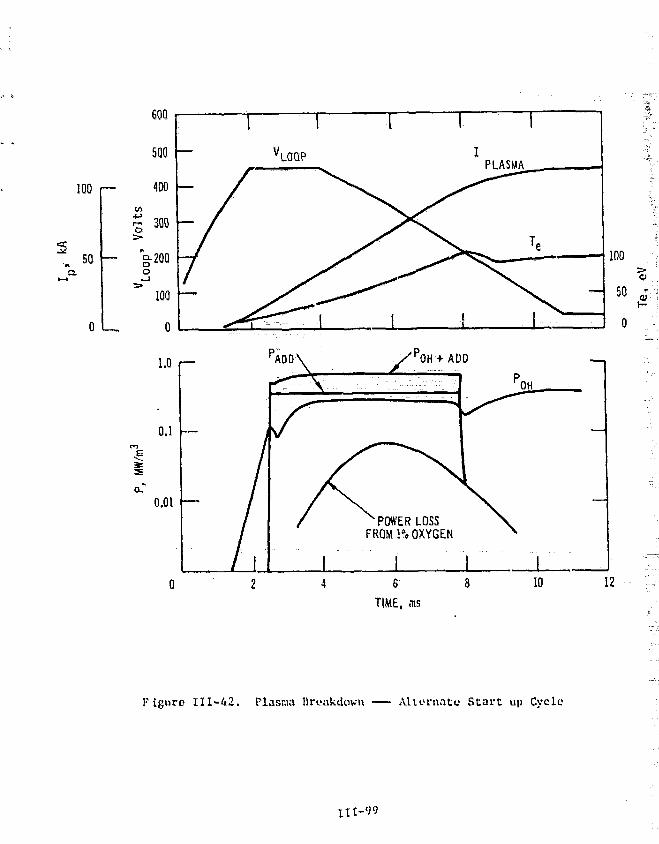
600
100 f— 400 —
S 300
§0 I— g-200o
IQO
0
1.0 r—
0.1
0.01
I~~ VL0QP
II
PLASMA
i1 > - -
'PWERLOSSFROM 1% OXYGEN
STIME, ms
10
100
50
0
a>
12
Figure 111-42. Plasma Breakdown Alternate Start up Cycle
111-99
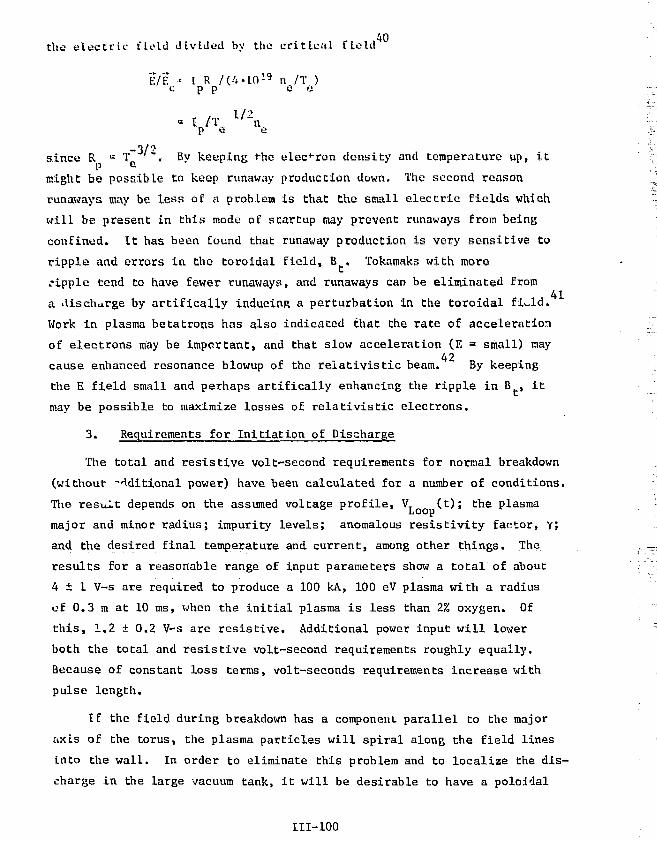
40the e l ec t r i c field divided by the c r i t i c a l field
E/E * I R /(-WO1 9 n /T )c p p e e
- t /T U " U
p e e-3/'
since R a T , By keeping t-ho electron density and temperature up, it
might be possible to keep runaway production down. The second reason
runaways may be leas of a problem is that the small electric fields which
will be present in this mode of startup may prevent runaways from being
confined. It has been found that runaway production, is very sensitive to
ripple and errors in the toroidal field, B . Tokamaks with more
nipple tend to have fewer runaways, and runaways can be eliminated from41
a discharge by artifically inducing a perturbation in the toroidal fi_ld.
Work in plasma betatrons has also indicated that Che rate of acceleration
of electrons may be important, and that slow acceleration (E = small) may42
cause enhanced resonance blowup of the relativistic beam. By keeping
the E field small and perhaps artifically enhancing the ripple in B , it
may be possible to maximize losses of relativistic electrons,
3. Requirements for Initiation of Discharge
The total and resistive volt-second requirements for normal breakdown
(without Mditional power) have been calculated for a number of conditions.
The result depends on the assumed voltage profile, V (t); the plasmaLiOOp
major and minor radius; impurity levels; anomalous resistivity factor, Y>
and the desired final temperature and current, among other things. The
results for a reasonable range of input parameters show a total of about
4 ± 1 V-s are required to produce a 100 kA, 100 eV plasma with a radius
of 0.3 m at 10 ms, when the initial plasma is less than 2% oxygen. Of
this, 1.2 ± 0.2 V-s are resistive. Additional power input will lower
both the total and resistive volt-second requirements roughly equally.
Because of constant loss terms, volt-seconds requirements increase with
pulse length.
If the field during breakdown has a component parallel to the major
axis of the torus, the plasma particles will spiral along the field lines
into the wall. In order to eliminate this problem and to localize the dis-
charge in the large vacuum tank, it will be desirable to have a poloidal
III-100

mulcipole null in the vacuum tank at the moment of breakdown. It will also
be necessary to have coils inside the blankat and shield which can provide
an equilibrium field to stabilize the plasma in the initial 10-50 ms.
Because of the rapid changes in plasma current, 4ensity, and position, it
would probably be best to have these coils fairLy near the first wall. The
time constant for penetration of the field from the EF coil will probably
not be fast enough to handle the breakdown stage. It may be possible to
have the same coils serve the combined purpose of breakdown, multipole null,
and equilibrium fields for startup. These coils could also be a trim con-
trol on plasma position for hot plasmas. The design of this system of coils
will be discussed in more detail in Chapter IV, Section B,
The pressure of neutral gas is somewhat critical, and in order to assure
that a discharge can be composed primarily of new gas, whose composition
can be controlled, it wo ild be best to keep the initial neutral pressure
at or below 10~5 Torr. Impurities are a critical part of this problem since
the residual gas could contain ^ 8% He and similar Be impurity concentrations
from sputtering. It will be important to remove as high a fraction of
these impurities as possible. The dependence of the volt-second require-
ments on the density of an oxygen impurity is shown in Figure 111-43. The
impurity loss is proportional to n n , so that impurity losses are re-
duced by reducing the plasma density.
In the initial stages of operation, and after every time that the vacuum
chamber is let up to air, it will probably be necessary to do considerable
discharge cleaning. Because of the higher current densities possible, it
may be most convenient to do this where the major radius R is as small as
possible. After a few hot (T > 5 keV) burns, however, one would expect
that the influx of impurities adsorbed to the walls would be negligible.
After thermonuclear burns, considerable helium will be present in
the vacuum tank. It is anticipated that the helium fraction will be as high
as 8-10% of the D-T mixture. Because cryosorption pumps will not pump He
as fast as deuterium and tritium, this fraction may rise to about 30% during
the 10-12 sec pumpdown time between pulses. The losses from this helium
fraction should be less than the impurity loss from 1% oxygen, and this
should not be serious. The principal impurity in a burn should be either
III-101

5 -
3o
o
RESISTIVE
INDUCTIVE
11 2 3 4
OXYGEN IMPURITY IN INITIAL DISCHARGE, %
Figure 111-43. Effect of Oxygen Impurity on Volt-Second Requirements(I p = 100 IcA, Te = 100 eV, R = 6.25 m and a = 0.36)
in-102
helium, beryllium or oxygen; losses from beryllium should be comparable
to those from helium, and both are less serious than 1% oxygen.
As shown in a previous section, the current, current density, ohraic
heating power lewis, and inductive volt-seconds required to produce a plasma
depend strongly on the major and minor radii of the desired plasma. The
reference case discussed in this section (R = 6.25 m, a = 0.36 m), and many
other possible modes would require some sort of movable limiter system
which could be inserted into the vacuum tank. If the outside edge of the
first wall could be used as a limiter, things would be simpler mechanically,
but a penalty would be paid in the available ohmic heating power density.
Preionization would also be required from some source. A number of
different methods would be acceptable, the only constraint seems to ba that
better preionication has led to decreases in runaway flux in some experi-43
ments. Fast acting valves will also be necessary for adding neutral gas
both to start the discharge and, during ohmic heating, to increase the
volume and density of the plasma.
D. Research Requirements
The E?R represents a significant extension of plasma operating conditions
beyond what has been achieved to date. The current generation of experiments
(PLT, T-10, D-III, PDX) will supplement the existing data from ATC, ORMAK,
TFR, etc., to provide, together with the results of a vigorous theoretical
program, the plasma physics design basis for an EPR which operated in the
mid-1980s. If operation of EPR is later, additional results from TFTR, JET,
JT-60, etc. will contribute to the design basis. Several specific questions
relevant to the EPR are discussed in this chapter within this context.
1. Confinement
The size of the EPR is set by power output requirements. Thus, the
principal consequence of the uncertainty in energy confinement is the un-
certainty that the reactor can operate at or near net electrical power
production (i.e. that the plasma will be at or near ignition). Since
supplementary neutral beam heating is to be provided against the eventuality
that subignition energy confinement obtains, operation at meaningful power
levels is not jeopardized by the uncertainty in confinement, providing that
niE 4 2 x 10¹⁹ s/m3. Assurance that this level of confinement can be
III-103

achieved should be provided by the current generation of experiments (PLT,
T-10, D-III, PDX). Information from the next generation of experiments
(JET, TFTR, JT-6O, TFTR-UG) should serve to further reduce the uncertainty
in confinement and ro establish more firmly the injection power require-
ments for the EPR.
Control of the reactor (e.g. during startup and shutdown and Co suppress
thermal instabilities) depends upon how the energy confinement scales with
temperature and density. The current generation of experiments should es-
tablish if the anomalous TEM and TIM scaling will obtain.
If recycling of D and T occurs in the EPR, as it appears to in
many current experiments, then the particle confinement is important for the
determination of the plasma particle flux to the wall but is relatively
unimportant otherwise,
2. MHD Equilibria and Stability
The power output of the EPR is very dependent upon the type of stable
equilibria which can be obtained. "Net power" EPR operation is predicated
upon equilibria characterized by B ^ 1.7 and q(a) ^ 3.0, although reasonable
levels of power output are possible for B < 1.7 or q(a) > 3. PLT, with
injection heating, should provide some further evidence of the attainability
of the EPR design values.
Noncircular configurations are of considerable interest because of the
promise they offer to operate at higher B, hence higher power output. The
EPR design carries along a noncircular option with plasma height-to-width
ratios up to 1.5, which seems to be about the upper limit that can be ob-
tained without placing field shaping coils in close to the plasira. Investi-
gation of noncircular plasma configurations in this range on PDX and D-III
should establish the stability of noncircular configurations and verify that
the improved B-performance obtains.
3. Impurity Control
Attainment of a burn pulse longer than a few seconds requires some means
of impurity control. Realization of "net power" conditions requires, in addi-
tion to ignition or near ignition confinement, burn pulses of at least ^ 1/2
min.
III-10A

The primary means of Impurity control envisioned for the EPR is a
•^ 100 pin iow-Z (probably beryllium) coating of the first wall. The
integrity cf the coating can be tested in the laboratory, in materials
test facil i t ies, under limited conditions in PLT, D-III, and PDX, and
in a more realistic environment in TFTR.
A hetter understanding of plasma-wail interaction phenomena is re-
quired. The offeet of the wall on Che plasma-edge region should be
investigated. Reflection, re-emission, sputtering, absorption, desorption,
blistering, and other surface properties of the coated first-wall are
essential to determine plasma contamination, wall erosion and recycling
for D, T, He, e, n, and photons. More precise data for the radiation power
loss from partially-stripped impurity ions are required. Experiments should
be performed in PLT, D-II1, and PDX to determine if impurities diffuse prefer-
entially towards the center of the plasma when (and if) the transport is
nonclassical, as has been observed recently on ATC and previously in the
USSR, when the transport was "neoclassical."
4. Heating
The primary supplementary plasma heating means currently envisioned for
the EPR is neutral beam injection. The feasibility of substantially raising
the ion temperature by neutral beam injection has recently been established
on ORMAK, ATC, and TFR, where the energy transfer seemed to obey "classical"
laws. Injection experiments on PLT, D-III, and PDX should further establish
the plasma physics feasibility of neutral beam heating of plasmas.
Experiments should be carried out in PLT, D-III, and PDX to determine
how much penetration of the plasma by the beam is required to heat the plasma
satisfactorily and to determine how the presence of impurities affects the
beam energy that is required to obtain the requisite penetration and heating.
It is important tliat such experiments be performed on plasmas which exhibit
the type of ei -Tgy transport phenomena expected in the EPR.
liF heating in the lower hybrid, ion cyclotron, or electron cyclotron
mode isi considered as a backup method for the F.PR. Experimental results
to date are inconclusive about plasma energy absorption and heating by rf
mea>s. Experiments should be performed in plasmas with the relevant char-
acieristic resonances and with launcher characteristics as similar as possible
tn thn.se for F.PR tn establish the plasma physics feasibility of rf heating.
111-105

5. Refueling
The requirement for refueling is linked to the question of recycling
of D and T. I£ substantial ( 100%) recycling obtains, as appears to be
Che case in some previous experiments, then only a relatively small amount
of refueling is required to compensate for burnup (fractional burnup 1-2%)
This amount could possibly just be released into the toroidal chamber and
would be pumped into the plasma in the same manner as are the recycled D
and T,
If the D and T do not recycle appreciably, then refueling is necessary
if the particle confinement time is less than a few minutes, as is likely
if TIM or TEH confinement scaling obtains. Pellet injection experiments are
currently in progress on ORMAK, and it should be possible to establish the
plasma physics feasibility and limitations of this method in the next few
years. Injection of plasma with a "clean" plasma gun is another possibility
which should be examined on PLT, D-III, and/or PDX.
6, Plasma Initiation
The voltage requirements for initial breakdown in an EPR-size torus
( 40 m around the magnetic axis) are quite large. A better understanding
of the phenomena (e.g. filling pressure, wall outgassing) affecting these
requirements is important. Alternate means of achieving the breakdown
(e.g. injection of high-purity plasma with guns, rf discharges, lasers)
should be investigated. Effects (e.g. skin current) which might hinder
the establishment of the proper current profile should be better under-
stood. Runaway electrons also require further study, as their production
and behavior is very sensitive to plasma parameters.
1. L. A. Artsimivoch, "Tokamak Devices," Nuol. Fusion, JL2, 215 (1972).
2. S. 0. Dean, et al., "Status and Objectives of Tokamak Systems for FusionResearch," WASH-1295 (1974).
3. H. P. Furth, "Tokamak Research," Nuol. Fusion, 12, 487 '1975).
III-106
4. J. D. Callen and R. A, Dory, "Magnetohydrodynamic Equilibria in SharplyCurved Axisyrometric Devices," Phya. Fluids, JL5, 1523 (1972).
5. . V. S, Mukhovatov and V, D. Shafranov, "Plasma Equilibrium in a Tokamak,"Nuol, Fusion, 11, 605 (1971),
6. V, S. Vlasenkov, et al., "Magnetic Field Perturbations During a TearingInstability in the Tokamak T-6 Device," Proc. Fifth Conf. on PlasmaPhysics and Controlled Nuclear Fusion Research, Tokyo, Paper A2-1 (1974).
7. W. M. Stacey, Jr., et al,, "Tokamak Experimental Power Reactor Studies,"ANL/CTR-75-2, Argonne National Laboratory, (August, 1975).
8. G, Eder acid H, Mota, "Contribution of High-Energy Particles to Thermo-nuclear Reaction Rates," Natives > 182, 1140 (1958).
9. G. F. Wandel, et al,, "A Complication of Some Rates and Cross Sectionsof Interest in Controlled Thermonuclear Research," «/. NUQI. Inst. andMeth. 4,, 249 (1959).
10. D. J. Rose, "On The Feasibility of Power by Nuclear Fusion," ORNL-TM-2204(1968).
11. L. G. Kuo-Petravic, et al,, "Alpha Particle Heating and :he EnergyBalance in a Mirror Reactor," Proc. British Nucl. Energy Soc, NuclearFusion Reactor Conf., p. 144 (1969).
12. D. G. McAlees, "Alpha Particle Energetics and Neutral Beam Heating inTokamak Plasmas," Oak Ridge National Laboratory Report ORNL-TM-4661(1974).
13. 0. A. Anderson and H. P. Furth, "Imperfect Axisymmetry in the TokamakConfiguration," Nuel. Fusion, ]JZ, 207 (1972).
14. T,. F. Yang and G. A. Emmert, "Energetic Particle Loss and Field Bumpi-ness Due to "D" Shaped Coils in a Tokamak Reactor," Proc. TopicalMeeting on the Technology of Controlled Thermonuclear Fusion, SanDiego, USAEC C0NF-740402P2, Vol. II (1974), p. 400.
15. G. H« Wiley, M. P. Roo, T. W. Petrie, L. M. Hively, "Fusion ProductTrajectory Studies," Bull. Am. Phys. Soo., jJO, 1259 (1975).
16. J. N. Davidson, "The Effect, of Toroidal Field Ripple on Particle andEnergy Transport in a Tokamak," ANL/CTR/TM-62, Argonne NationalLaboratory (1976).
17. L. A. Berry, "Neutral Beam Injection in Tokamaks," Bull. Ant. Phys. Soc.*,20(10), 1332 (1975).
18. H. P. Eubank, et al., "ATC Neutral Injection Results," Bull. Am. Phys,Soo., 20(10), 1346 (1975); also, R. A. Ellis, et al.r "High-Power Neu-tral Beam Heating in the Adiabatic Toroidal Compressor," MATT-1202,Princeton Plasma Physics Laboratory (1976).
Ht-107

19. R. Dei Cas, "F i r s t Results with Neutral In jec t ion in TFR," Bull. Am.Phjs. Soc, 20(10), 1332 (1975).
20. A. C. R iv ie re , "Penetrat ions of Fast Hydrogen Atoms into a FusionReactor Plasma," Ihial. Fusion* 1_1, 363 (1971).
21.. D._R,._Sweetman, " Igni t ion .Conditions in . tokamak _Experiments_and _the- Role of "Neutral" Inject ion Heat ing," ?ktjI. ~ Fusion, _L3, 157 (1973).
22. J . A. 'Some, J . I). Callen, and J . F. Clarke, "Neutral-Beam In jec t ion :."-""into a Tokamak: ? a r t I : Fast-Ion Spat ia l Di s t r ibu t ion for Tangential
- In j ec t ion , " NUJI. Fusion, _14, 141 (1974). - •••
23. W, M, Hooke, PPPL, p r iva te communication.
24. B» Richard' and R. R. Parker, "Ion Heating in ALcator Near LowerHybrid Resonance," Bull. Am. Pliys. Soc, 20(10), ~1313"(1975)".
25. J . C, Hosea, "Fast and Slow Waves Generation and Heating, til the SI Tokamak,11
- Symposium Repor t , - In t e rna t iona l School of Plasma Physics, Varenna (1974).
26. J . Adams,.et a l , , "Wave Generation and Heating in the ST Tokamak a'_the Fundamental Harmonic_Ion Cyclotron-Frequency," MATT-1094, PrincetonPlasma Physics Laboratory (1974).
27. H. R. Jory, E. L. Lien and S. R. Seymons, "Final Report, Mill imeterWave Study Program," Varian Associates (November 1975).
28. L. S p i t z e r . ' D . J . Grove, W. E. Johnson, L. Tonks, W. F. Westendorp,"Problems of_che S t e l l a r a t o r as a Useful Power Source.," USAF.C RepcrtNYO-6047 .(1954).
-29.- S. L.- Gralnick, "Solid Deuforiur.. Evaporation In a Fusion Plasma," Hual,Fusion, j ^ , p . 703 (1973).
30. D. J . Rose, "On the Fuel In jec t ion Problem," Culham Tech. Div. Memo 82,""_ Culham, England (1968).
"31. "Experimental Power Reactor Conceptual Design Study," General £ '.omicCompany Fusion Staff, General Atomic (July 1975).
32. C. A. Fos te r , _R.. J . Colchin, C . D . Hendricks", and R. J . Turnbull ,- "Solid Hydrogen Pe l l e t I n j ec t i on in to ORMAK,"~flwZZ. Am. Pkys. Soa,~,
20, 1300 (1975). ' -
33.. R . J . Turnbull , "Pe l le t s for Fusion Reactor Refueling," Annual Progress-" - R e p o r t , Universi ty of I l l i n o i s , COO-2234-9, (January 1976).
34. R. "F. Post and S. F. Post , "Flywheels," Scientific American, (December1973)\
35. J . E. Osher and G. D. Por t e r , "Laser Pe l l e t Heating Studies for PlasmaTarget Production," Lawrence Livermore Report UCID 16872, (1975).
IH-108

36. B. Lehnert, "Gas Blanket Concept," Proceedings of Third InternationalSymposium on Toroidal Flasma Confinement, Garching (1973).
37. D. A.. Baker and J. E. Hammel, "Experimental Studies of the Penetrationof a Plasma Stream into a Transverse Magnetic Field," Phya. Fluids, •£, p. 713 (1965).
35, R, Jf. Hawryiuk aad J, A. Schmidt, "Effect of Low Z Impurities Duringthe Startup Pftase of a Large Tokamak," PPPk Report MATT 1201, (January
39. "The EKperimental Thermonuclear Device 'Takamak-20V Kurchatov Institute,Moscow, ERDA-TR 58 (1973).
40. R, M. Kulsrud, Y-C Suu* N. K. Kinsor, and H. A, Fallon, "RunawayElectrons in a Plasma," Biya, Rev. Letters, 31, p. 690 (1973),
41. Vt S, Vlasenkov, V. M. Leonov, V« G. Merezhkin, and V. S. Mukhovatov,"The Runaway Electron Discharge Regime in the Tokamak-6 Device," Nuol.Fusion, 13, p. 5Q9 (1973).
42. J. G. Linhart, P. Gratreau, E. R. Harrison, C. Maisonnier, F, Schneider,and A, Schoch, "Plasma Betatrons," Int. Cortf. on High Energy Accelerators
:and Instrumentation, CERN (1939).
43. 3. Von Goeler, Et al., -"X-Ray Spectra in the ST l-kamak," Proc of 3rdConf. on Toroidal Plasma Confinement, Garching (1973).
III-109

CHAPTER-XV
MAGNET SYSTEMS
This chapter describes the conceptual design" ~o"f"the~EPR~~magnet systemj
consists of the toroidal-field (TF) coils and the poloidal-field coils.
The conceptual design of the EPR magnets was part of an integrated design
effort, with full interaction with che rest of the EPR system. The magnet
design was developed in sufficient detail to define a realistic concept. The
philosophy that guided the choice of a design con'.ept from the several can-
didates was to define a realistic design for a magnet system that could be
built, based upon the current state of technology and a feasible development
program. The TF coils are described in Section IV-A, The poloidal-field
coils, consisting of the initiation-trimming (IT) coils, the ohmie-heating
(OH) coils and the equilibrium-field (EF) coils, are described in Section IV-B.
The research and development program is described in Section" IV-C," The for-
malism of poloidal flux shielding by normal metal at low temperatures is pre-
sented in Appendix F. Eddy current effects on the subdivided blanket and
shield due to the pulsed poloidal field are also presented in Appendix F. The
magnet protection and safety analysis is presented in this chapter, and the
closely related problem of rcagnet instrumentation and control is described in
Section XI-E.
The TF coil uses NbTi as the superconductor because of its great ductility
and proven past experience in large magnets. There is an incentive to have the
toroidal field level as high as practical to enhance the plasma confinement and "
the power density. This leads us to pursue a 10 T peak field TF coil design.
It is found that it is more economical to operate the 10 T TF coil at 3°K tem-
perature rather than to operate at 4,2"K with a larger amount of superconductor,
because the additional refrigeration cost is much smaller than the cost of the
additional superconductor.: The problem of refrigeration at temperatur - lower
than 4.2CK for large systems is evaluated in Section IV-A-14.
_ iTheTF, coils will achieve 10 _T peak-field at 3°K arid-8 T peak field at
4.2°K, with about 0.5°K temperature allowance for each case. The 8 T is the
minimum goal and the 10 T is the optimal goal of the TF coil design.
IV-1

The superimposing field from poloidal coils on che TF coil is foand Co
be the single most troublesome factor in che TF coil design. The out-of-
plane load is large and creates challenging problems for the structural
design. The out-of-plane load also poses a serious threat to the coil
stability due to tha bending moment and shear stress in the coil structure,
targe amounts of ac losses will occur in the TF coll unless the conductor
is made of cable. The sponginess of cable conductor adds further Co che
problem of coil structure integrity. Finally, the most disturbing effect
of all, Is the pulsed parallel field coupling between twisting filaments at
different distances from the conductor axis. If the coupling effect Is not
countered, the ac losses are proportional to conductor length and the con-
ductor stability is very bad, and the ac losses are large. For this particu-
lar reason, it was decided that a field shield must be provided in order to
1 '
present a sound conceptual design at this time. The suggestion of
periodic twisting pitch reversal Co decouple the longitudinal changing
field has yet to be proven practical or feasible. For t'sese reasons, the
field shield was sCudied in great detail. An aluminum field shield at 18°K
temperature was designed. The ac losses and the electromagnetic forces are
evaluated. It is shown that the normal metal shield is a reliable and
feasible means to overcome the superimposing field. In addition, a super-
conducting shield design is described.
The requirements for the EF, OH and IT coils are discussed in Chapter
III, where the impact of different startup and b rn sequences on the required
volt-seconds, fields, field rise rates and power is studied. The principle
problems in the design of the poloidal coils are the high power andenergy
transfer requirements that force compromises to be made between voltage,
hence Insulation requirements, and current, hence transposition requirements
in the cable conductors.
Although it is generally recognized that the superconducting TF coils
and poloidal coils must be designed with cryostatic stability, cryostatic
stability is not well understood. In the past, a magnet was designed for
cryostatic stability simply by equating the IgR loss of a conductor in the
normal state to the maximum heat transfer obtainable with liquid helium in
the nucleate boiling state. Using heat transfer alone as the main stability
IV-2

paranccvr "can result is large errors in magnet design. This is discussed in
considerable detail.
A butter assqrar.ee os sryoscattc stability of a coil risquires good JBtehanr
ical stability In the conductor and the fteil* Four Important mcKhasiicni
instability problems for TF cotls arc identified. Conductor designs vich
good Rsjchavilcal integrity arc presented.
The problem, of EF penetration through ft blankcc ant! shtftld of ^ i n in
thickness is a serious one vhen ssoct of chc blanket and shield is nndc of
ntstftilic nacerials. This problen was studied in grene detail, ThQ effect
on the biankoc RPAI shield design is described in Chapter IK, Tiie eddy cur-
rent in the blanket and shield will distort the EF pattern and delay its
penetration if the blanket and shie'.d is not sufficiently scgiscnccd. This
is described in Section IV-B-9.
A. Toroldat-Field Coil System
1. Maxitsua Practical Fic'.d
The inproveiaent if. energy confineacne (* 8 6) and power performance
(« B u) at higher toroidal field levels lc^ us to pursue a 10 T TF coil design.
KbTi is the best superconductor to use because of its CKcellent ductility and
bi'catsse msch reliable experience exists in large-size superconducting niag-
necs. Although nany superconductors of A-15 compounds (e.g. Nb^Sn, V^Ga,
Nb At, !."b Ge or V Si) exhibit nuch higher critical fields, critical current
density and critical temperatures than does NbTi, the glass-like brittleness
of these materials severely limit their application in large-size magnets,
such as the TF coils for an EPR. The development of these materials, if they
can be successfully developed at all for large magnets, will take a long time.
An expensive project such as the TF coil system for an EPR should not depend
on so uncertain an extrapolation into future technology.
The 10 T peak field is as high as is practical for NbTi, A set of fairly
representative J-H curves for NbTi (guaranteed performance) at various tem-
peratures and magnetic fields is shown in Figure IV-1. It is seen that the
critical current density falls sharply as the magnetic field reaches beyond
8.5 T. However, it is also seen that at 10 T, a factor of 3 to 4 increase In
critical current density can be obtained by simply lowering the operating
IV-3
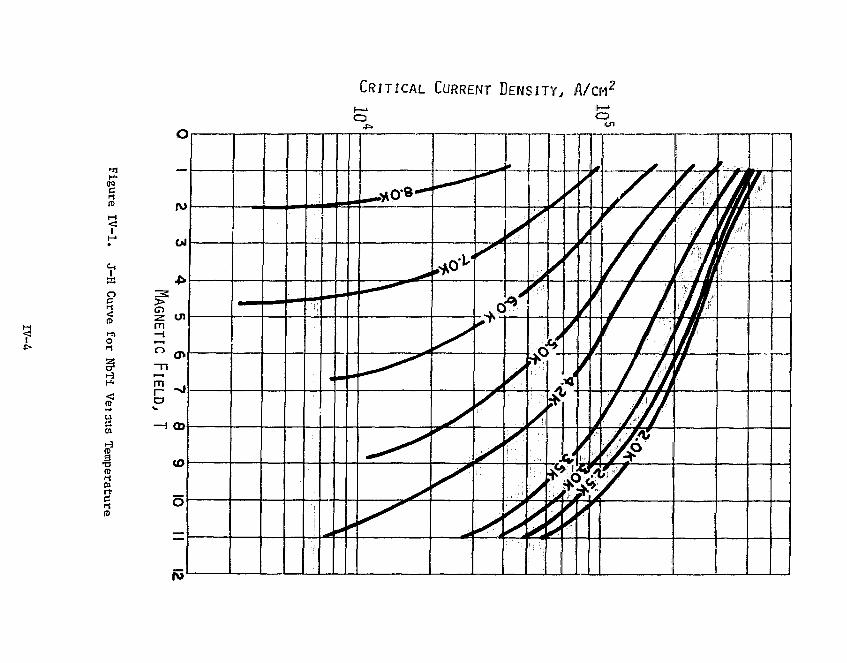
CRITICAL CURRENT DENSITY, A/CM2
t
"S1-1(5
o
(D
MiOi-l
u53
(D
•i
H
E 3
4 5
67
89
10
1M
AGNETIC FIELD,
T
— • • • •
• • • •
M B
J
•• a
« - • *
a M
< * *
CD
- —
—* * *
>
n
0
S
' - • •
< >
t•'A
/
/
J
f
<¥
*
/
i
Li
o
A*
/ /
//A
At A \ .
/ill
f \ m mi
V Nli
7
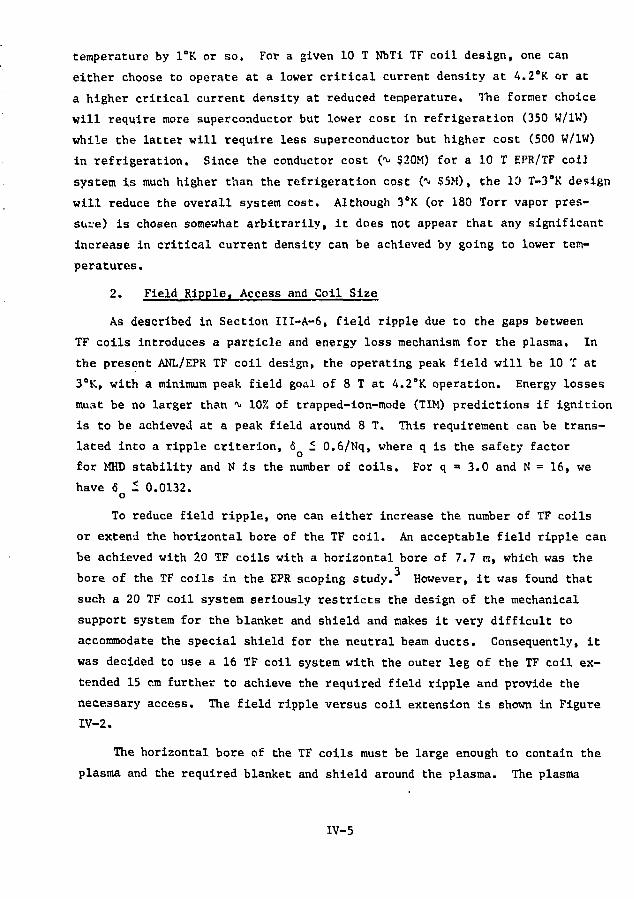
temperature by 1"K or so,, For a given 10 T NbTi TF coil design, one can
either choose to operate at a lower critical current density at A.20K or at
a higher critical current density at reduced temperature. The former choice
will require more superconductor but lower cost in refrigeration (350 W/1W)
while the latter will require less superconductor but higher cost (500 W/1W)
in refrigeration. Since the conductor cost (-v $20M) for a 10 T EPR/TF col]
system is much higher than the refrigeration cost ( ?5M), Che 10 T-3°K design
will reduce the overall system cost. Although 3°K (or 180 Torr vapor pres-
sure) is chosen somewhat arbitrarily, it does not appear that any significant
increase in critical current density can be achieved by going to lower tem-
peratures.
2. Field Ripple, Access and Coil Size
As described in Section III-A-6, field ripple due to the gaps between
TF coils introduces a particle and energy loss mechanism for the plasma. In
the present ANL/EPR TF coil design, the operating peak field will be 10 T at
3°K, with a minimum peak field goal of 8 T at 4.2"K operation. Energy losses
must be no larger than *v> 10% of trapped-ion-mode (TIM) predictions if ignition
is to be achieved at a peak field around 8 T. This requirement can be trans-
lated into a ripple criterion, 6 5 0.6/Nq, where q is the safety factor
for MHD stability and N is the number of coils. For q • 3.0 and N = 16, we
have 6 * 0.0132.o
To reduce field ripple, one can either increase the number of TF coils
or extend the horizontal bore of the TF coil. An acceptable field ripple can
be achieved with 20 TF coils with a horizontal bore of 7.7 m, which was the3
bore of the TF coils in the EPR scoping study. However, it was found that
such a 20 TF coil system seriously restricts the design of the mechanical
support system for the blanket and shield and makes it very difficult to
accommodate the special shield for the neutral beam ducts. Consequently, it
was decided to use a 16 TF coil system with the outer leg of the TF coil ex-
tended 15 cm further to achieve the required field ripple and provide the
necessary access. The field ripple versus coil extension is shown in Figure
IV-2.
The horizontal bore of the TF coils must be large enough to contain the
plasma and the required blanket and shield around the plasma. The plasma
IV-5

Field Ripple
1.
1 .
1 .
0.
0.
0.
0.
i%*
*:»
2:,
o:.
8?i
6,.
4%
2X
Q
\
Ny Maximum
- v--—-
1 1 1
Tolerable
1 1
N
Field
1
- 16 coils
Ripple
CO
O
CO
o00 00 CO
roCO CO
« * •
i n
Distance to the Coil Centerline of the Outer Leg(in meters)
Figure 1V-2. Field Ripple Versus Extension of Outer Coil Leg

diameter is A,2 m, with 0.3 m scrape-off region around it to reduce the nusnber
of fast alpha particles striking the wall. The inner blanket and shield thick-
ness was minimized (0.91 m) in order to maximize the toroidal field in the
plasma, thus to enhance the power output of the reactor. An "- 1.3 ro thickness
of outer blanket and shield provide the necessary space for both primary
energy conversion and radiation protection of the TF ceils and other reactor
components. These considerations led to a choice of 7,78 m TF coil horizontal
bore.
The radia.1 location of the coil centerline Cor the TF coil inner branch,
R, , was determined by the requirements that an OH central flux core of "v 1,7 m
and a thickness of 0,23 m for support cylinder was needed. With 1.7 m flux
core radius, the OH coil will supply 85 V-s for plasma driving with a double
swing from - 5 T to + 5 T, which is a reasonable central field. The 0.22 m
thick support cylinder made of stainless steel will result in a reasonable
circumferential stress. In addition, a space of about 0.1 m was provided for
the thickness of field shielding and coil form. With these requirements,
R was set nt 2.45 m.
With these requirements on R , the horizontal bore and number of coils
established, a pure-tension coil shape was determined. The TF coil system
has a maximum of 3 m access. This access is adequate for neutral beam ducts
and their side shields, vacuum pumping and operations of assembly and dis-
assembly of blanket and shield blocks.
The theory and the procedure to determine the pure-tension coil shape
was described in Reference 3. Figure IV-3 illustrates the TF coil design and
Table IV-1 lists the specifications and magnet characteristics of the ANL/F.PR
TF coil system.
3« Pure-Tension Toroidal-Field Coil Characteristics and In-Plane HoopStress
The hoop tension acting on a circular or oval toroidal coil system,
either a continuous toroid or a bumpy toroid, is nonuniform. Large bending
moments are exerted on the conductor. This produces high peak stresses;
consequently, a larger amount of structural material will be needed than in
the absence of bending moments. Although it is possible to contain the bending
moment by an external mechanical structure, to do so may not avoid conductor
IV-7

<A,
SUPPCRTCYLINDER
0 -4 5 6 1 7R(WETER)
(0 !l
Figure IV-3. EPR Magnet Schematics

Table IV-1. AKL-EPR Toroidal Field Coll Svstera
D
Superconductur/Stabilizer/Insulatur/SuppuriNumber of CoilsColl Shapefield Ripple
Kaximun ACCHSS
Peak Field
Vertical Bore
Horizontal Bore
Fieid in Plasna
Stored EnergyEnd ctanceAnpere-TurnsTurns/Coil
Mean Turn Length
Total Conductor Lenftth/Coll
Approximate Coll Weight/Cotl
Coll and Bobbin Cross SectionBobbin Material and Thickness
Winding Cross EecrionAverage Current Density
Smallest Radius of CurvatureAverage Hoop Force/Turn
Average Turn Cross Section
Cross Section Ratio of Stainless Steel tn Cn|>pi-r
Overall Average Stress In Stainless Stop]
Overall Average Stress in CopperLength of Straight Segment
Support CylinderCorapressive Pressure
Circumferential Stress
I »>
1'urc Trnsjun witij £ ; : • ,'.iS s *nd R, ; • 11.: a1.3S
1 a](? T .it Y\\u h ; a i - - - ' *»
]2.t» a
J.T6 a
•i. 3.' T f«T 10 1 ? iMi ! i* -U
hO ^A/Turn
l b , 7 H/TotaL. 1-Oi H - ' C H
I K MAT/Tojj l . « . ^7 KAT/Cfi]
70 * 2
V> O
l*}l.^. X !()*' A=?rT«—H«Irr«.
208 Titn«
O.M<# IB1
316 S t a inU-N% S i t - « 1 . l . J S *.-+ Tl.K k
n. ' .7. ' n-
1352 A/cm' AV*TJ^<- OV.T Jiubhjn and C-ii]
3660 A/f • ' Av«TAA^ ov< r tnjiper
1.98 •> J l ' II. T t l r l d Ki'Xlon
113,134 It
41).h i d '
• 1 . 5
26,000 f s l
]4,S0l) ps<
Ouler Sddlus 2.OI a . Innrr Kjadlut 1.R0 D
7660 | ' S |
< 74,(11)0 psi

slippage, and large shear stresses may exist from turn-to-turn and/or layer-to-
layer. When the radius of curvature is such that the product of transverse
force and radius of curvature is constant, the coil is in pure tension with no
bending moments; then, a minimum amount of structural material will be needed
and the in-plane hoop stress will be uniform with inner skin stress slightly
higher than outer skin stress. The mean hoop stress will be the average value
of the inner skin stress and the outer skin stress, as illustrated in Figure
IV-4, The toroidal coil system will behave exactly like a solenoid. The
solenoid Is known to the superconducting magnet engineer as the coil which is
most stable and has the least mechanical disturbance. Consequently, It is
expected ..-.at the coil stability of a pure-tension coil system will be better
than that of circular or oval coil systems.
To illustrate further the pure-tension coil characteristics, consider a
pure-t?nsion 16-coil system with a peak field of 10 T. The radius of cur-
vature, p, the transverse force, F , and the toroidal fields at the inner coil
skin and at the outer coll skin were computed and ara shown in Figure IV-5.
The pF was shown to be uniform at any angular location. A three-dimensionalt I
stress analysis code (the program SOLID SAP ) was used to compute the hoop
stress. The hoop stress obtained is very close to the product pF within the
numerical error of the program SOLID SAP. This indicates that once the radius
of curvature around the peak field region near the straight segment of TF coil
is known, the average hoop stress is equal to
°avg = 1 / 2
where A is the conductor or coil cross section and I Is the current per turn
or ampere-turn per coil.
The pure-tension coil profile strongly depends on the number of coils
as shown in Figure IV-6. Note that tha pure-tension coil shape will become
the Princeton D shape if the coil number is infinite. On the other hand,
it will become circular if the number of coils is unity. An implication of
this is that any coil of a IS pure-tension coil system cannot be charged or
discharged independently without exerting large bending moments. Consequently,
when one or more coils quench, not only is the unbalanced inter-coil force
very large, but also the bending moments act on the coils unless all coils
carry equal current.
IV-10

INNER SKIN STRESS OFARGONNE PURE TENSION COIL 0S=!24.5°
OUTER SKIN STRESS OFARGONNE PURE TENSION COIL 0S= 124.5°
AVERAGE SKIN STRESS OFARGONNE PURE TENSION COIL 8S =124.5°
0
- • •-INNER SKIN STRESS OF +5cm COIL SHAPE DISTORTION
OUTER SKIN STRESS OF + 5cm COIL SHAPfc DISTORTION
30 60° 90°ANGLE,9
Figure IV-4. Hoop Stresses Distribution of Argonne Pure Tension Coil

1 1 T
IV-12

I., i
I
r7
•6
UJ{ -txl
NI-PRINCETON D2-PURE TENSION 24
Figure IVT6. Pure Tension Coil Profile Versus Number of Coils
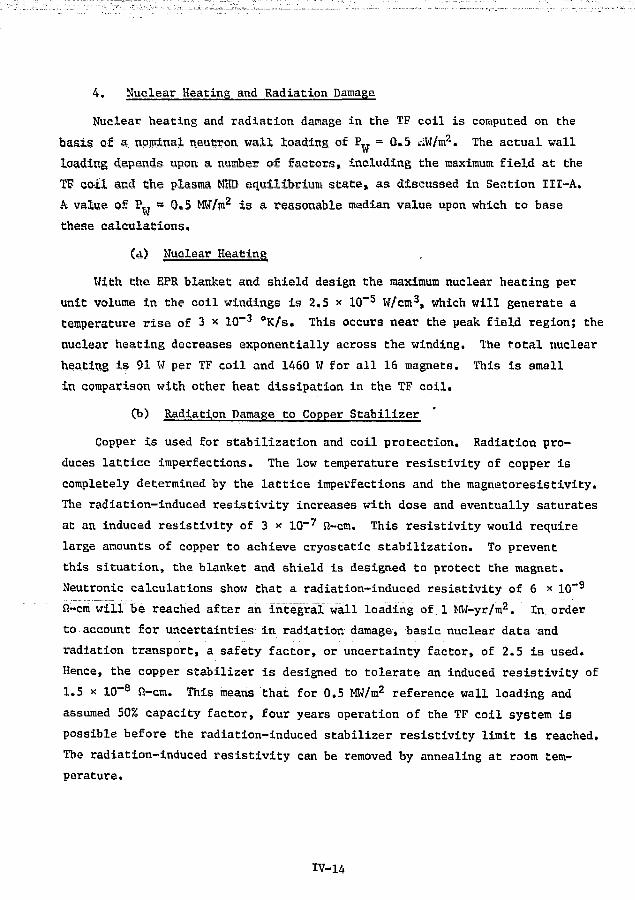
4. Nuclear Heating and Radiation Damage
Nuclear heating and radiation damage in the TF coil is computed on the
basis of a nominal neutron wall loading of P™ = Q.5 i-iK/m2, The actual wall
loading depends upon a number of factors, including the maximum field at the
TF soil and 6he plasma MSB equilibrium state, as discussed in Section III-A,
& value of. !?„ s 0,5 MW/m2 is a reasonable median value upon which to base
these calculations.
Cs) Nuclear Heating
With the EPR blanket and shield design the maximum nuclear heating per
unit volume in the coil windings is 2.5 x 10"5 W/em3, which will generate a
temperature rise of 3 x 1Q~3 °K/s. This occurs near the peak field region; the
nuclear heating decreases exponentially across the winding. The total nuclear
heating is 91 W per TF coil and 1460 W for all 16 magnets. This is small
in comparison with other heat dissipation in the TF coil.
(b) Radiation Damage to Copper Stabilizer
Copper is used for stabilization and coil protection. Radiation pro-
duces lattice imperfections. The low temperature resistivity of copper is
completely determined by the lattice imperfections and the magnetoresistivity.
The radiation-induced resistivity increases with dose and eventually saturates
at an Induced resistivity of 3 x 10~7 fi-cm. This resistivity would require
large amounts of copper to achieve cryostatic stabilization. To prevent
this situation, the blanket and shield is designed to protect the magnet.
Neutronic calculations show that a radiation-induced resistivity of 6 x 10"9
£2~cm will be reached after an integral wall loading of 1 MW-yr/m2. in order
to account for uncertainties in radiation damage, basic nuclear data and
radiation transport, a safety factor, or uncertainty factor, of 2.5 is used.
Hence, the copper stabilizer is designed to tolerate an induced resistivity of
1.5 x 10"8 Q-cm. This means that for 0.5 MW/m2 reference wall loading and
assumed 50% capacity factor, four years operation of the TF coil system is
possible before the radiation-induced stabilizer resistivity limit is reached.
The radiation-induced resistivity can be removed by annealing at room tem-
perature.
IV-14

(c) Radiation Damage to Insulat.ors
As discussed in Chapter IX, indications are that the aromatic type epoxy
resins are the best organic materials to resist radiation damage. The
reference magnet design uses fiberglass epaxy as the turn-to-turn and layer-
to-layer insulation. The damage to the insulator is mainly the damage of
mechanical strength rather than a change in dielectric properties. For the
resin, It is found that the mechanical properties are less affected by ir-
radiation near room temperature than other types of Insulators. Epoxy is
considered 10 to 20 times more resistive to radiation damage than mylar at
room temperature. No information exists on radiation damage to organic in-
sulators at 3 to 4°K. Radiation damage to the insulator is not recoverable.
The use of epoxy resin as insulator probably will sustain damage up to an
Integral wall loading greater than 10 MW-yr/m2. This is well in excess of the
nominal design lifetime of 10 years, or 2.5 MW-yr/m2.
(d) Radiation Damage to Superconductor
NbTi is the chosen superconductor. The current-carrying capacity
depends an the existence, of structure defects. For certain amounts of ir-
radiation, the critical current actually increases. For large doses (y 1018
n/crn ) of irradiation, it is found that critical current decreases as much
as 10 to 15% for most samples. There is insufficient information to guide a
magnet designer. To some extent, the damage to NbTi can be recovered by
warming up to room temperature. For a TF coil design, some extra NbTi must
be reserved to account for uncertainties.
5» i Superimposing Fields and, Out-of-Plane Load
With a TFLpeak field of 10 T, the plasma current will be 7.6 MA. The OH
coil of ± 6 7 MAturns will sying a central field of + 5 T. The EF coil of
37.15 MA turns will generate 0.46 T at the plasma center for plasma equilib-
rium. Without a field shield, these poloidal coils and plasma currents would
superimpose ac fields onto the TF coil windings, exerting an out-of-plane
load onto the TF coil, as well as producing large ac losses. The performance
and design of the TF coil in severely affected by the superimposing fields.
The ac loss is discussed in the next section.
IV-15
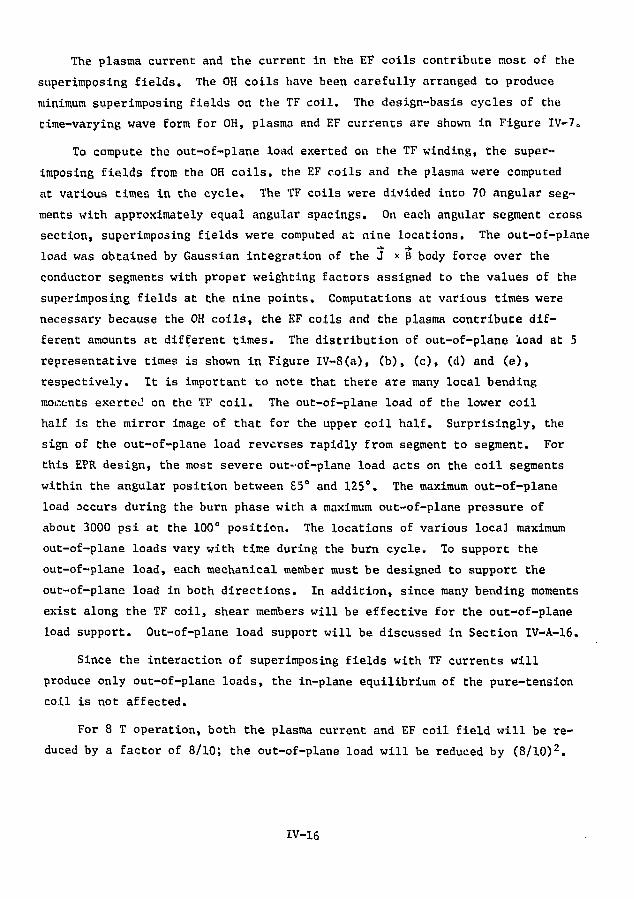
The plasma current and the current in the EF coils contribute most of the
superimposing fields. The OH coils have been carefully arranged to produce
minimum superimposing fields on the TF coil. The design-basis cycles of the
time-varying wave form for OH, plasma and EF currents are shown in Figure IV-7Q
To compute the out-of-plane load exerted on the TF winding, the super-
imposing fields from the OH coils, the EF coils and the plasma were computed
at various times in the cycle. The TF coils were divided into 70 angular seg-
ments with approximately equal angular spacings. On each angular segment cross
section, superimposing fields were computed at nine locations. The out-of-plane
load was obtained by Gaussian integration of the J x B body force over the
conductor segments with proper weighting factors assigned to the values of the
superimposing fields at the nine points. Computations at various times were
necessary because the OH coils, the EF coils and the plasma contribute dif-
ferent amounts at different times. The distribution of out-of-plane load at 5
representative times is shown in Figure IV-8(a), (b), (c), (d) and (e),
respectively. It is important to note that there are many local bending
moments exerted on the TF coil. The out-of-plane load of the lower coil
half is the mirror image of that for the upper coil half. Surprisingly, the
sign of the out-of-plane load reverses rapidly from segment to segment. For
this EPR design, the most severe out-of-plane load acts on the coil segments
within the angular position between 65° and 125°. The maximum out-of-plane
load occurs during the burn phase with a maximum out-of-plane pressure of
about 3000 psi at the 100° position. The locations of various local maximum
out-of-plane loads vary with time during the burn cycle. To support the
out-of-plane load, each mechanical member must be designed to support the
out-of-plane load in both directions. In addition, since many bending moments
exist along the TF coil, shear members will be effective for the out-of-plane
load support. Out-of-plane load support will be discussed in Section IV-A-16.
Since the interaction of superimposing fields with TF currents will
produce only out-of-plane loads, the in-plane equilibrium of the pure-tension
coil is not affected.
For 8 T operation, both the plasma current and EF coil field will be re-
duced by a factor of 8/10; the out-of-plane load will be reduced by (8/10)2.
IV-16

REFERENCE CYCLE "HME
t ~ I l s s i - l "•"" ! —] I T
2.5MA
ACTUAL CYCLEAPPROXIMATION
Figure 3V-7. Reference Cycles for OHC, Plasma and EFC
IV-17

ISO 170 160 150 140 i30 120 IIP 100 90 BO 70 60 50 40 50 20 10 0
2
0
-2_ Co) W.5S
(b) t«8.5S
180 170 160 150140 130 120 110 100 90 80 70 60 50 40 30 20 10 00 DEGREE
Figure W-8. Time Evolution of Out of Plane Load. (No Shield)
IV-18

6. Superimposing Field and AC Losses
The superimposing poloidal fields have both transverse and parallel
field components with respect to the TF conductor. To estimate the ac less
when Che TF coils are not shielded, the superimposing field was computed at 40
field points along the TF coil centerline at approximately equal angular
separation. The ac fields were then decomposed into parallel and perpen-
dicular field components with respect to the TF coil segment as shown in
Figure IV-9(a) and 9(b), respectively. Note that the OH roils produce little
superimposing field, while the plasma current generates large amounts of
parallel fields. The EF coil contributes large amounts of both parallel and
perpendicular fields.
If the TF coil is not shielded, the ac losses of a TF coil consist of
the ac dissipation in the coil form and the ac loss in the conductor due to
both parallel and perpendicular fields. The ac loss in the winding reinforced
structure is neglected in this calculation,
(a) AC Loss of Coil Form
The dimensions of the trapezoidal coil form cross section, as well as
the cryostat cross section, are shown in Figures IV-lO(a) and 10(b). To
simplify the calculation, it has been assumed that the superimposing field
across a given TF coil cross section is uniform and the ac losses due to the
parallel and perpendicular field penetration can be treated separately and
then added together.
Consider the parallel field dissipation in the stainless steel coil
form. The low conductivity limit applies, since the resistance of the coil
form duct per unit length is much greater than the per unit length reactance,
vL/i. = UQAw, where A is the cross-sectional area of coil form. From Appendix
F it is easy to show that the rms parallel field loss per coil is given by
where the t is the wall thickness of coil form, p is the perimeter of col1.
form, p is the resistivity of coil form and is equal to 5 x 10~7 JJ-m at
4.2°K, and A is the cross section of the coil form. The integration I B z dd
A °"
IV-19

3o
-12
EFPLASMA
8
45° (ANGLE 0)
10 8(METER)
6 4 2 0(LENGTH £)
Figure IV-<a. B to TF Coil Due to EF, OH and Plasma Currents

-8--
-12
180°i , i.
135
18 16 14J, 1 L,
90i . , 1 Lr
450 (ANGLE 0)_i u, i 1 , - . . „ . 1
12 10(METER)
8 4 2(LENGTH i)
--8
0°-A0
Figure IV-9b. B^ to TF Coil Due Co EF, OH and Plasma Currents

AL. ALLOY 300°KVAv_. WAi.Li3.5cM)VAC SPACING(-.^cv)LN 2 SHIELD WITHS U P E R I N S U L A T K M . ' X M )VAC S P A C N G ( 2 5 >
FLUX BREAKER -
O H COIL
5cu INSULATION-
SS. SUPPORT
I .25CM THICKCOIL FORM
.??cv THICK5.S. WALL
4c\- 'HICKA_'JMlNUM SHIELDAT 3°r\/4.2°K
_ 5 0 . 5 CM ^
(a) INNER LEG CRYOSTATAND COL FORM
3 . 5 C M
-2.5 CM
• .5 CM
2.5 CM
! 2 5 cv THICKCOIL FORM
I CM THICKS.5.
SUPERlNSUi-ATION
GASCOOLING TUBE
12 5"K-23.5"KALUMINUM SHIELD(5CM THICK)
— 3.5CMTHICK
AL. ALLOY
/ , 3.5CM VACUUM/ SPACING AND
SUPERINSULATION
T
(b)OUTER LEG CRYOSTATAND COIL FORM
Figure IV-10. Cross Section of Cryostat and Coil Form
IV-22

carried out numerically over the entire TF coil gives 0.147 T2 m/s? from EF
coil superimposing field and 0,692 T2 m/s2 from plasma current. Therefore,
for a 60 s burn pulse and a 15 s replenishment time, the ac pulsing lor.ses
averaged over a cycle is 30 W/coil from the EF coil and 40 W/coil from the
plasma current. Then, the cycle time-averaged parallel field loss is 70 W/coil.
The perpendicular field dissipation per unit length is given by:
(IV-3a>
Where R/£ = 4 p/Pt and III = 0.92 B . Hence, the rms perpendicular field
loss per coil is given by:
P x = 19467 JB Q J L2 dl (IV-3b)
The integration J"^ 2 dS, gives 0.139 T2 m/s2 from the EF coils and 0.09 T2 m/s2
from the plasma ring. The cycle time-averaged ac loss is 468 W from the EF coils
and 93 W from the plasma current. The cycle time-averaged perpendicular field
loss is a61 W/coil. The total ac loss in the coil form is 631 W/coil.
(b) Perpendicular Field Dissipation in Conductor
To estimate the transverse field dissipation in the conductor, it has
been assumed that the TF coil conductor is a cabled conductor consisting of
many strands of 1 mm diameter, transverse twisting pitch £ = 2 cm and
filament diameter of 10 \i embedded into a single-component copper stabilizer
with both transverse and longitudinal resistivity of 5 " 10~8 Q-cm. Based
on the 60 kA conductor specification shown in Table IV-2, the NbTi cross
section per turn is 0.53 cm2 and the copper cross section is 13.5 cm2. The
NbTi volume/coil is 0.2671 m 3 and the copper voluite/coil is 6.820 m3. By the
methods discussed in Reference 3, the filament loss over a field cycle of
0 •* 0.3 T ->• 0 is found to be equal to 2670 J, the matrix loss for a cycle
consisting of a 2 s linear rise and a 2 s linear fall with B ^ 0.3 T is
equal to 6762 J. The cycle time-averaged power dissipation due to the
perpendicular field is 132 W/coil.
(c) Parallel Field Dissipation in Conductor
Practical superconductors are divided into many filaments to reduce the
hysteresis loss when subjected to an ac pulsing field. These fine filaments
IV-2 3

Table IV-2. Typical Specifications of 60 kA TF Coil Conductor
Maximum Field (T)
NbTi Critical CurrentDensitya (kA/cm2)
NbTi Design CurrentDensity" (kA/cm2)
NbTi Cross-section (cm2)/Turn
Total Resistivity (10~8 fl-cm)
Approximate Turn Width (cm)
Copper Thickness (cm)/Turn
Stainless Steal Thickness(cm)/ Turn
Insulator Thickness (cm)/Turn
Total Cross-section (cm2)/Turn
Thickness/Layer (c:n)
Number of Layers
Number of Turns
Current Density InCopper (kA/cm2)
a. Based on 3°K J-H Curve (see
b. Based on 3.5°K J-H Curve.
10c
70
50
1.2
6
33
0.46
0.31
0.2
32
0.97
7
14
3.95
; Figure
9
100
70
0.86
5.6
34.7
0.43
0.34
0.2
34
0.97
7
14
4.02
IV-1)
8
130
93
0.
5
36.
0.
0.
0.
35.
0.
7
14
4.
65
5
39
38
2
5
97
21
7
155
110
0.55
4.5
38.2
0.35
0.42
0.2
37.1
0.97
7
14
4.49
6
180
140
0.43
4.0
40
0.31
0.46
0.2
38.9
0.97
7
14
4.84
5
195
155
0.39
3.5
41.7
0.27
0.50
0.2
40.5
0.97
7
14
5.33
/*
210
170
0.35
3.0
43.4
0.24
0.53
0.2
42
0.97
7
14
5.76
3
250
210
0
2
45.
0
0
0
44
0
21
42
5
d
.29
.5
2 to 50.4
.23
.54
.2
to 49
.97
.77
c. Innermost region
d. Outermost region

must.be twisted about the conductor axis in order to reduce the coupling
eddy current for a changing transverse field. For a parallel changing
field, these twisting filaments, at different distances from the conductor
axis, will induce different vo?l>tages; longitudinal coupling arise and the
associated ac loss is quite large. To reduce the longitudinal coupling,1 2
it was suggested ' that the transverse twisting be periodically reversed.
Based on this hypothetical conductor with twisting pitch reversal, severcl1 fi 7 ft
authors * * * have studied the parallel field losses.
The parallel field losses consist of the eddy current loss and the
hysteresis loss. The eddy current loss of a coil is given by:
p - —."e 6
Where p = 5 * 10~*" S2-m, L is the periodic length of twisting reversal
and X =• 2nr 1% - 0.157, where rQ is the strand diameter and I is the
transverse twisting pitch. The parameter A is the coil winding cross
section and is approximately equal to 0.6 m2. The integral J B..2 dH is
equal to 2,09 T2m/s2. With X = 0.157, one finds the eddy current loss to
be equal to 4121 W/coil. The time-averaged eddy current loss is 220 W/coil.
The hysteresis loss per coil is given by:
Pe
Where J is the average current density in conductor and is equal to
5.115 x 10⁷ A/m2. The integralJB . dl over the entire TF coil gives
2.373 T m/s. The hysteresis loss for !„ = In is 1422 W. The cycle time-
averaged hysteresis loss is 76 W/coil.
Therefore, neglecting the ac loss in the winding reinforced material;,
the ac losses per TF coil consist of 631 W loss in the coil form, 132 W
loss in the conductor due to the perpendicular field and 296 W loss in con-
ducts, due to the parallel field. The total loss per coil is 1059 W. These
losses are further summarized in Table IV-4.
IV-25

7. Normal Metal Fiald Shielding Design
The TT cotl reference design provides normal metal field shielding.
The overriding reasons for TF coil field shielding are as follows:
- -, (-!)_- The existing superconductor ""manufacturing industry" can not yet
produce".the superconductor composite with longitudinal twisting
_ _- - - -reversal,- as discussed in previous sections. Furthermore, it is
not wlear that twiscing reversal is a practical solution. Existing
TF coil conductors under a changing parallel poloidal field will
— experience a huge ac loss, not to mention the serious problem of "
conductor stability. The only alternative solution left is to_
arrange the filaments at equ>l distance from the conductor strand
- axis and thenxabla these strands with full transposition"." "A
plausible cable design is presented in Section IV-A-10.
!"_""_" (2)_"_~_With a,'fieTd shield, a monolithic conductor-can be-used-without -
. excessive ac losses," Without "the shield, ac losses can be reduced
— -- _to a reasonable level, by using cable conductor, provided that the
~ filaments.are fully transposed as mentioned in previous paragraphs.
----- " There" "is lit tie experience of using cable conductor in a large magnet.
- It -is~-fairJto say that the sponginess of cable conductor raises
questions about its .use in a large magnet system with large electro-
. magnetic forces. As far as mechanical integrity is concerned, meno-
• -- - . lithic conductors are far better than cable conductors. As c.iscussed
,-in -Section IV-A-5, the out-of-plane load on a TF coil is a serious
--•"-""_. threat to TF coil mechanical stability.
—•- ---Therefcrey-a-f-ieid "shield "fdr~TF"c6ils"7is" I:ccee"d'fngly Important!" ""in "" ~
this section,-^'detailed_analysis of a normal"metal shield is presented. The
. basic concepts and the ac loss estimation for the normal metal shield are
described in Append!:: F. Since the stability of a superconducting shield is
"in "doubt, the normal metal shield_is chosen as-the shield reference design.
However, as there-are many advantages to employing superconducting shields, a
.preliminary analysis of" superconducting shield feasibility is discussed in
the next section.
IV-26

(a) High-Purity Aluminum as Normal Metal Shield
To a good approximation, the resistivity of a metal can be written as
P = PQ + PthCT> + Pn(H) + Pe(E)
.Where p is a temperature-Independent "residual" resistivity that is due to
electron scattering front impurities, defects, etc.; p t h is a temperature-
dependenc resistivity due to the thermal vibrations of the crystal lattice;
p £H) is,•maga&earesistiviey and: R is the• strala^lmiueed resistivity.
Kigit-pUKity aluminum or- copper has a large residual resistivity ratio
(ERR 3 e2?3°R/lJ4.2(1K)* ° n th& ° r d e r °f W* tO RoMeVer* the UVm ™aS"netoresistivity of copper severely rectaees its conductivity gain at low
temperatures. As shown in Figure IV-H,9*10*13" the magnetc-resistivity of
high-purity copper at 4 T is more than 10 * 10""11 n-m, with little variation
with temperature between A.2°K and 20°K. Aluminum, on the other hand, has
a rather small magnetoresistivity that saturates at a_rather low field
( 0.5 T)* Figure IV-12 shows the resistivity of aluminum at various tem-
peratures9 »-2»13>ll!l>15»16 and magnet field levels versus the aluminum purity.
It is seen that the low magnetoresistivity of aluminum recommends it for use
as the normal metal shield* Note that the solid curves are experimental data
while the dotted curves were obtained by adding the term Pth(T) to the residual
resistivity curve at 4,2aK and zero fields. Pfch(T) at 4.2qK is negligibly
small 0u lO"11* Sl-m).
For strains less than 10%, the strain-induced resisitivity of aluminum
, 17is given, by
hp = 110 E 1* 1 9 x.lO"l! n-m (IV-6)
where E is the strain in the aluminum. To keep the strain-induced resistivity
small, the aluminum must be reinforced. For example, if aluminum is explo-
sively welded to stainless steel, then the stainless steel will be stressed to
60,000 psi while the aluminum suffers a strain of only 0.17%. The 0*17%
strain causes little increase in resistivity. For 5000 purity aluminum
reinforced by stainless steel, recent data indicate that there is little
increase in resistivity for up to 1000 loading cycles.
IV-27
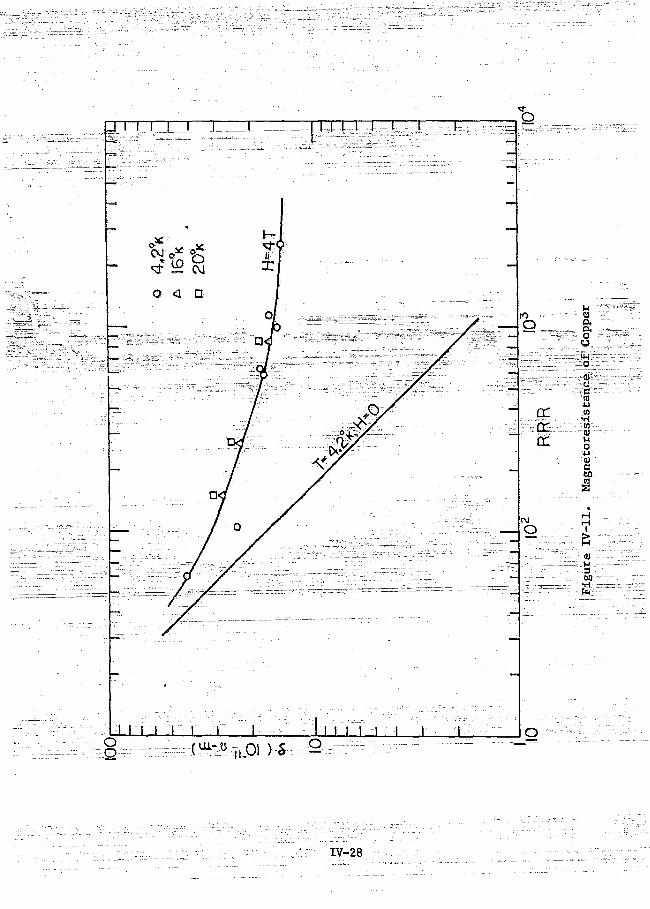
J I I I. I I 1 1 i r
oCM
ou<ua.o
0)o4J01
•piusqjM0atc60
CM
o
360
OO
I J I I o,,.01 )S
IV-28

lOr
b
1 j—TTTTTq
4T
S N,N^ifi-p
~o\
i i i ' ' i i i M J LJ ! II" I 0 2 I03
RRR
Figure IV-12. Resistivity of Aluminum as Function of Purity,Temperature and Magnetic Field

The main resistivity increments due to impurities in commercially avail-
able aluminum at 4,2°K are as follows:
Impurities Resistivity Increment (10"n fl-m/PPM)
copper 0.122
iron 0.140
silicon 0.102
zinc 0,050
For "zone-refined" aluminum of purity 99.9999%, the only detachable impurities
are 3 PPM of iron and 0.4 PPM of copper. Such aluminum, after annealing for
two hours at 500°C, will often achieve an RRR value of mora than 5000. The
price of 5000 purity aluminum is about: $20/kG in small quantities and is
$2.82/kG for very large quantities.
The 5000 purity aluminum with scainless steel backing is chosen for the
field shield panels. These panels are formed into rectangular ducts around
the TF coil as shown in Figure IV-3, For the present design, the shields
around the inner leg of the TF coil are seriously restricted by the available
space and are, therefore, wrapped directly on the TF coil form. The operating
temperature is 3°K or 4.2°K depending upon the 10 T or 8 T operation (see
Figure IV-10(a)). The remaining shields will be operated Vr-Lween 12,5°K and
23,5'K with a mean temperature of 18°K (see Figure IV-lO(b)). Shield panels
inside the TF coil will be subjected to a peak field ranging from 3 T to 10 T.
The side panels will have an averaged magnetic field ranging from 1.5 T to
5 T. The utside panels will be subjected to only the ac superimposing field
of <\i 0.5 T. The overall averaged magnetic field in the shield is about 4 T.
As shown in Figure IV-12, the resistivity of 5000 purity aluminum at 3°K or
4.2°K and 4 T field is about 2 x 1 0 ~ n fl-m. The resistivity at 18°K and
4 T field is about 5 x 10"11 R-m. These data are based on transverse mag-
netoresistivity measurements. The longitudinal magnetoresistivity, in
general, is slightly smaller than the transverse values for the same purity
of aluminum.
The fundamental frequency for a cycle time, T, is 1/T cps. So the pene-
tration depth is given by
IV-30

6 = /2p/wu = 503/pJi = 5 0 3 ^ (IV-7)
where u is the permeability, p is the resistivity, T is the period and f is
the frequency. At 18°K and 4 T field, the penetiation depth for the 5000
purity aluminum is 3,1 cm for T = 75 s. At 3 to 4,2QK and 4 T field, the
penetration depth is about 1»95 cm. To provide nearly complete shielding,
the 18"K shield should have a thickness of 5 cm. The 3 to 4°K shield should
have a, thickness of 4 cm.
(b) AC Losses In Aluminum Shield
The reference cycles for the EF coil, the OH coil and the plasma current
are shown in Figure IV-7^ The ac losses in the field shield can be separated
into those due to perpendicular fields and those due to parallel fields.
Since the three poloidal field wave forms are not aliVe, each individual
wave form is expanded into a Fourier cosine series with coefficients evalu-
ated separately. The Fourier series representing the resultant superimposing
field is equal to the sum of the three individual Fourier series. Let m = 1,
2, 3 represent the EF, OH and plasma, respectively, then following the dis-
cussion of Appendix F, the time-averaged perpendicular field dissipation is
given by; » , 3 \2
^ A m Bml) 2 < U (IV-8a)Nm=l m '
i nn=l " m=l
Similarly,
m=l
2dl is used to include both the upper and the lower TF coil halves.
IV-31

The total ac losses are given by
Since A « 1/ti2 and 1/6 « r. , i t follows that F « £ n~ ' . Consequently,_ n m n n=l
If P is computed by summing terms up to n = 5, the remaining terms will con-
tribute less than 3%,
The angular distribution along the TF coil le j,ch measured from 6 = 0
of both the parallel and the perpendicular fields is shown in Figure IV-9.
The ac loss distributions, expressed as the power dissipation per meter,
are shown In Figure IV-13 and are further tabulated in Table IV-3.
(c') Field Shield Design
Shields around the inner branch of the TF winding are seriously restricted
by the available space. Shields with angular locations falling between 122"
and 180° must be wrapped around the TF coil form as shown in Figure IV-lO(a).
Since the cantering force compressive pressure is around 7700 psi, while the
circumferential stress of the support cylinder Is around 60,000 psi, it was
decided no': to wrap the shield around the support cylinder. The yield
strength of aluminum at 4°K to 20°K is around 2000 psi. Therefore, a thin
stainless steel skin is needed to bond to aluminum with studs connecting the
stainless steel skin with the coil fu...;. in order to confine the aluminum and
to keep the strain at a low level. The shield must be operated at the same
temperature as the TF coil. The total ac losses for this shield are 298,6 W
per TF coil, with 147 W as the perpendicular field dissipation and 151.6 W
from the parallel field loss.
The remaining shields will be refrigerated between 12.5°K and 23.5°K with
a mean temperature of 18°K. The shields will be bonded to a stainless steel
backing 1 cm thick. The total ac losses of the 18°K shield is 8.531 kW per
coil with 3.295 kW from parallel field and 5.236 kW from perpendicular
field losses.
Consideration was given to reducing the ac IOSSPS by moving the EF coils
further away from the TF coils. If the poloidal coils number 3, 4 and 5 (see
Figure IV-3) were raised 1 m higher to reduce their effect on the TF coils,
then each of the EF coils excitation must be increased by a factor of 1,063
IV-32

<L/J
I.2--
1.0--
0B--
COC/J
oa:UJ
o
0.6--
0.4-
0.2+
0 J--
IBi: 135° 9 0
12 10(METER)
4,5° (ANGLE 6)1 ' 2 r
(LENGTH 1)
Figure IV-13. AC Losses Distribution Along TF Coil

Table 1V-3. AC Loss in Aluminum Shield
8a
(degree)
9
IS
27
36
45
53
65
77
84
90
100
106
US
(m) .
1,36
0.95
0.95
0,97
0.90
0.97
1,00
1.15
1.00
1.12
0.95
0.88
0.90
18°K Shield AC Loss
122
128
135
146
162
180
0.95
0.85
0.85
1.00
1.00
0.50
3°K Shield AC Loss
P It (PCW/m)
6.9
20.6
10.2
3.8
17.5
2.7
5,4
51.1
.160.1
460.0
1153.1
752.0
67.0
Summation
68.4
2.4
0.7
3.7
2.2
0.0
Summation
/Z)dl(W)
9,4
19.6
9.7
3.7
15.8
2.6
5.4
58.8
160.1
515.2
1095.4
661.8
60.3
P I<L(M/m)
41.2
70.4
133.4
144.1
83,2
71.3
121.3
142.6
150.1
121.3
18.1
280.1
308.8
2617.8/Half Coil
65.0
2.0
0.6
3.7
2.2
0.0
5.9
2.3
4.9
15.3
29.9
37.6
73.5/Half Coil
(P /H)dJi(W)
56.0
66.9
126.7
140.6
74.9
69.2
121.8
164.0
150.1
135.9
17.2
246.5
277.9
p/e(W/m)
48.1
91.0
143.6
148.7
100.7
74.0
127.2
193.7
310.2
581.3
1171.2
1032.1
375.8
1647.7/Half Coil
5.6
2.3
4.9
15.3
29.9
37.6
74.3
4.7
5.6
19.0
32.1
37.6
75.8/Half Coil
See Figure IV-L3.
IV-34

co generate a circular plasma. In that case, the total ac losses in the
18''K shield would be reduced to about 7.32 kW per coil, a very small reduction
considering the disadvantages of moving the coils.
The refrigeration of the shields is discussed in Section IV-A-14.
(d) DC Fluid Soaking
About 70% of the superimposing field is the dc field component, The
dc field will soak through the aluminum shield in a time constant jf
T U Att i ^ - 2 — 6 minutes. (IV-10)
R pp
where A ^ 1 m2, t 0.05 in, p ^ 4 m and p = 5 x 1 0 ~ u Q-m are used. The 6
minutes soaking time constant is considered rather long compared with the
current ramping time of about 6 s. Once soak through is complete, the dc
field will remain as a static field interacting with the TF coil current
producing 70% of the out-of-plane load previously calculated (see Figure
IV-8(e)). The out-of-plane load on the TF coil is static with the shield and
cyclic if the coil is not shielded. The dc field will soak out 6 minutes
after the external poloidal field is removed.
(e) Out-of-Plane Load in Shield
The aluminum shield is now subject to the cyclic out-of-plane loads.
For example, if the superimposing fields had a time dependence which was a
pure sine wave with no dc component, then the out-of-plane load on the
shield would be the same as it would be on the TF coil in the absence of the
shield. The loads on the shield are now due to the forces exerted by the
toroidal field on the eddy currents in the shield. The distribution of the
out-of-plane load on the shield is shown in Figure IV-14. The distribution
is very similar to that in Figure IV-8(e) (load on TF coil with no shield)
but at only 30% of the magnitude. There are, in addition, in-plane forces
and twisting moments. It is cumbersome to display these here but their
magnitudes are such that their support appears manageable. The support of
the out-of-plane loads is discussed in Section IV-A-16.
IV-35

<
162 141 121; 100 80! 9, DEGREES
60 39 18;
Figure IV-14. ', Out of Plane Load on Al Shield

(£) Conclusions
It appears feasible to build the TF coil with a low-temperature normal
metal shield. The shield removes the"problem of longitudinal ac field coupling,
It ig fair to say that the shield is the only presently known method that will
guarantee stable TF coil operation under a pulsed poloidal field. The refrig-
eration for the shield appears manageable. The stresses on the TF coil become
static with the shield and are reduced by 3051, while the cyclic stresses on the
shield are only 30% of the stresses an the unshielded TF coil.
8, Shield Option - Superconducting Field Shield
As an option to the low-temperature aluminum shields around the TF coils
described above, superconducting shields were examined. Two forms of super-
conducting shields have been considered; coils of superconducting wire that
would permit eddy currents in pre-specified directions or a superconducting
film that would allow current flow in more general directions.
The film could be deposited on copper plates to be assembled around
the TF coil or deposited on a wide copper ribbon to be wound around the TF
coil. Like the aluminum shield, the superconducting film would provide almost
complete shielding of the TF coil, but the energy losses in the shield itself
might be much less for the film than for the aluminum. On the other hand,
such a'"'film"requires "c«is~i3erabTe~:extrapoiation~frora present materials and
techniques. For that reason, shields of superconducting wire have received
more attention.
The changing magnetic flux through a shorted coil will induce a current,
which in turn will produce a flux opposing the applied flux. If the coil is
perfectly conducting, the current will exactly cancel the change in flux, A
coil wrapped around a section of a TF coil will cancel the change in parallel
field, and one:wrapped along a section of the TF coll will cancel the change
in perpendicular field. Thus, a sufficiently large number of coils might be
expected to completely shield the TF coil from any change of flux.
In the calculations, the condition that the flux be unchanged was
approximated by the computationally simpler one that the perpendicular
field magnitude at the center of each coil, squared and summed over all coils,
be a minimum.
IV-37
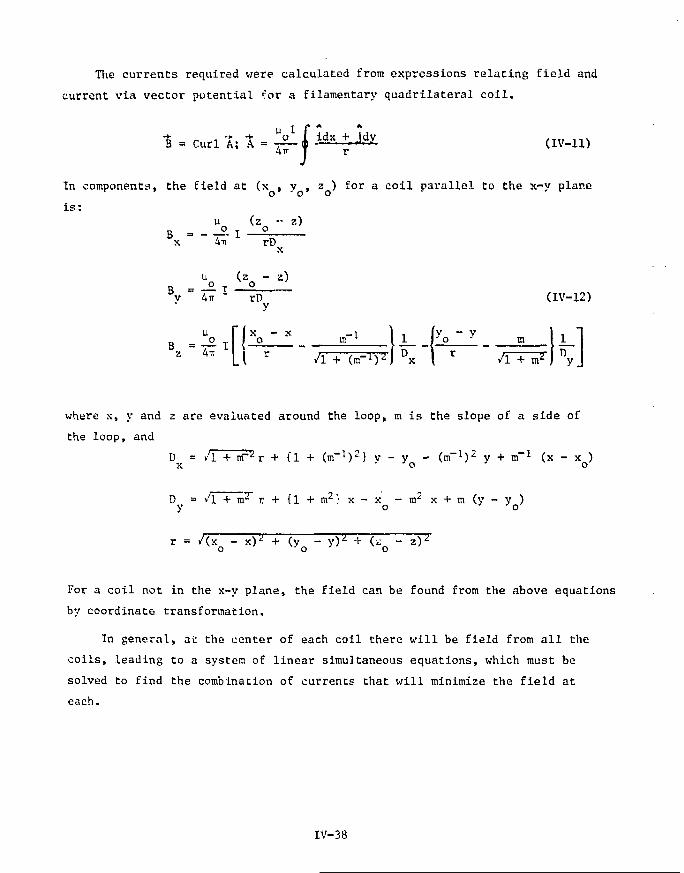
The currents required were calculated from expressions relating field and
current via vector potential <;or a filamentary quadrilateral coil.
B = Curl A; A = - ^ * - * 3<>y (IV-H)
In components, the field at (x , v , z ) for a coil parallel to the x-v planeO " O O
is:u (z^ " z)
Bx 4n rt>x
R Uo T
(2o -B = 7 — 1V " 4TT X rD (IV-12)
y
U IX - X
B - ^ 1 22 4* i r
*-* I j L J y Q- y • 111+ (m-1)^) °x \ r /I + m* ) % J
where x, y and z are evaluated around the loop, m is the slope of a side of
the loop, and
D = A + nf*r + {1 + (m"1)2} y - y - (m"1)2 y + m"1 (x - x )
D f = / I + iir~ r + { l + m 2 } x - x - m 2 x + m ( y - y )
r = / ( x - ^ ) ^ + (y - y ) ^ + ( z - z ) 2
o o o
For a coil not in the x-y plane, the field can be found from the above equations
by coordinate transformation.
In general, at the center of each coil there will be field from all the
coils, leading to a system of linear simultaneous equations, which must be
solved to find the combination of currents that will minimize the field at
each.
IV-38

Calculations showed that 3? shorted superconducting coils wrapped art-und
each TF coil, equally spaced in angle as measured from the center of the plasma,
would effectively lower the parallel component ot the pulsing field, but that
coils of that, size would be ineffective in lowering the perpendicular component.
Two additional superconducting colls, around the top and bottom of each TF coil,
would shield against the vertical component of field in these regions, These
coils, with axes vertical and dimensions of 6.0 m by 1.0 m, would have to be
driven,but the shorted coils would not. Currents in the shorted coil° would
be typically 200 kA-turns; in the driven coils, 3.000 kA-turns. The locations
of the shielding coils are shown in Figure IV-15.
At the center of the plasma, the fields from all the parallel-field shields
around one TF coil add up to 1.8 G; the shields around the other 15 TF coils
increase the field tc 10 G. However, the two vertical-field shields contribute
74 G and the other 30 vertical-field shields increase the number to 235 G, '
a value that may or may not be too high, depending on its variation across
the plasma.
Figure IV-16 shows how the field on the TF coils is decreased by the system
of shield coils described above. The shields do not entirely exclude pulsing
field from the TF coil, but they do reduce the quantity JB^ . dJ, which may
be used as a measure of the ac losses, by a factor of ten.
A superconducting field shield is expected to experience much smaller
eddy current ac losses than a normal metal shield. However, the normal metal
shield has been chosen for the design because the technological aspects of the
superconducting shield are too uncercain. Coils of superconducting wire wound
around the TF coils present serious and unresolved problems in their winding,
cooling and support. The other alternative, a superconducting film,, is not
sufficiently developed to depend upon, and may well experience stability prob-
lems due to flux jumping. Thus, with our present knowledge, the normal metal
shield seems the better bet.
9. Cryostatic Stability
The classic theory of full stabilization requires that I 2R g q p, where
p is the exposed cooling perimeter per unit length, and qh is the heat flux of
IV-39

liiiiif111
illttltei
i « »
ifai. ttlf:*:
is|Li!io;RSiiAS::!s|iiisiMWERi)!irt*fi"^
i ¥ -I .
Lgure IV-15.Figur E^ScpJ£pn8Js[ |Su|ie|ipTO^
« |
•«i:;s;;t;fiV|ii

WITH FIELDSHIELDS COILS
8 10 12COIL LOCATION
Figure IV-16. Field Screening by Superconducting Shield Coils
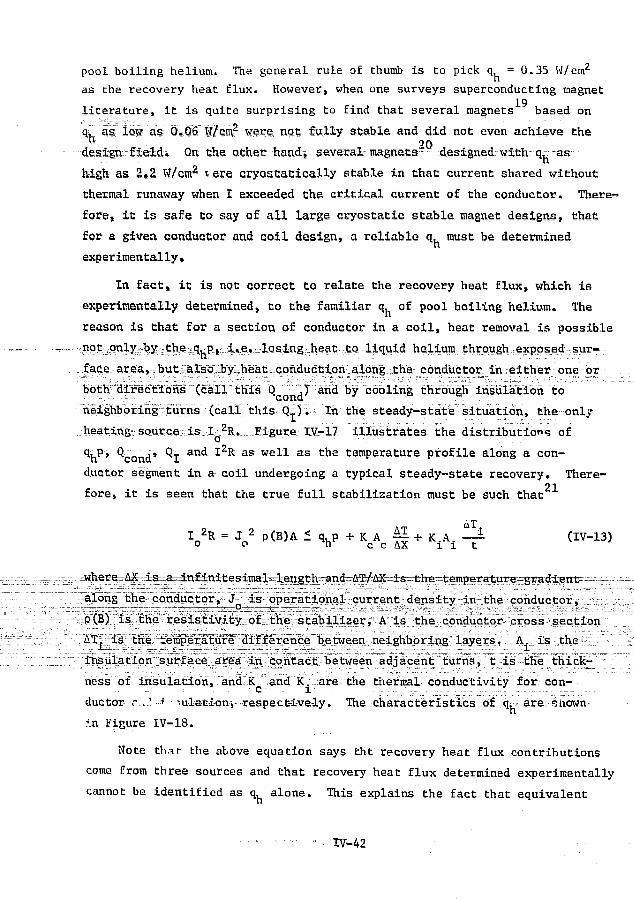
pool boiling helium. The general rule of thumb is to pick q = 0.35 W/cm2
as the recovery heat flux. However, when one surveys superconducting magnet19literature, it is quite surprising to find that several magnets based on
q as low as Qv06 W c m 2 were not fully stable and did not even achieve the9Q
desigftrfieldi On the ether hand-, several-magnets" designed-with: q,- as
high as 2.2 W/cm2 ^ere cryostatically stable in that current shared without
thermal runaway when I exceeded the critical current of the conductor. There-
fore, it is safe to say of all large cryostatic stable magnet designs, that
for a given conductor and coil design, a reliable q, must be determined
experimentally,
In fact, it is not correct to relate the recovery heat flux, which is
experimentally determined, to the familiar q. of pool boiling helium. The
reason is that for a section of conductor in a coil, heat removal is possible
not only by the q.p, i.e. losing heat to liquid.helium through =,exppsed .sur-
face area, but also by heat conduction along the conductor in either one or
both directions (call this Q ,) and by cooling through insulation to
neighboring turns (call this Q T ) . In the steady-state-:situation, the only
heating:; sources is,Xj2R. Figure IY-17 illustrates the distributions of
tuP* Qcond* ^1 an<* *2R as wel1- a s t*ia temperature profile along a con-
ductor segment in a coil undergoing a typical steady-state recovery. There-
fore, it is seen that the true full stabilization must be such that
I 2R = J 2 p(B)A < q. p + KA_ 41 + K.A.. l l (IV-13).A.
where_AX is. a infinitesimal length and AT/AX is the temperature-gradient -
along the conductor, J is operational current density in the conductor,
p(B) is the resistivity of the stabilizer, A is the conductor cross section
AT. is the temperature difference between neighboring layers, A. is the
insulation surface area in contact between adjacent turns, t is.the thick-
ness of insulation, and K and K. are the thermal conductivity for con-
ductor r.' -•* iu-lationY-Tespect-ive-ly-»-----Therxh-aracte-rlstic3-of;..qi-".:-are-J-!3hown
in Figure 1V-18.
Note that the above equation says tht recovery heat flux contributions
come from three sources and that recovery heat flux determined experimentally
cannot be identified as q alone. This explains the fact that equivalent
IV-42

COMPLETE CURRENT COMPLETE CURRENT COMPLETESUPERCONDUCTING SHARING NORMAL. SHARING SUPERCONOUCTING
A SECTION QF CONDUCTOR COMPOSITE
JUCLEAgl FILM JBQIUNC. ' ' 'BOILING
CON'O
TEMPERATUREBRGEE
rTrt F-T b
Figure IV-17. Distributions of Heat Sources and Heat Sinks
IV-43

2 3 ' 50(Tcu-Tb) °k
Figure ¥-18. Heat Transfer Characteristics of Boiling Helium

recovery heat flux as high as 2.2 W/cm2 is possible. If mechanical structure
and coil support are so well designed that tne only conductor motion is a
single turn slippage, then it is quite possible that the magnet could be
cryostatically stable at a large heat flux. If a coil has" less desirable coil
structure so that a whole layer slide may occur, then Qr must not be
included. If a coil has rather poor mechanical structure, or too many other.,-..-.••
heating sources such as flux jumps, strain energy release or eddy current
heating, etc., then this coil may not operate at full stabilization"atas ~ -
low a heat flux as 0,06 W/cra2, because the contribution from either pq.
or Q , cannot be fully depended on. Therefore, the nature;of coilc o n d '"'•"' :' ~ "
stability depends on many factors such as coil mechanical disturbance,
the size and the nature of cooling passage, other sources of heating, whether
there is vapor bonding or not, conductor insulation effect on heat transfer,
etc. These factors all affect the recovery flux In an Interdependent manner.
For a given coil, precise analysis of these factors is not possible. Ex-
perimental simulations are essential. It is important to recognize that
mechanical integrity of a coil design is an important factor to assure full
stabilization. Also note that, for a given sat of quantities for the. right
hand side of the above equation, the coil stability deteriorates as J 2.
Hence, lower current density will improve coll stability tremendously.
To illustrate further the complicated nature of coil stability, consider
the typical heat transfer flux characteristics curve as shown in Figure IV-I81
If a steady-state heat source with heat flux greater than q, = 0.7 W/cm2
is present, the copper temperature will be suddenly raised to 50°K or so alonj
AB, Reduction of heat flux will follow the recovery path BCD with recovery
flux equal to qf = 0,15 W/cm2. Both q and qf depend on the liquid channel
length and the channel cross section. If the liquid channel has a gap
< 0.3 mm, then q and q. will be proportional to the gap size.
Finally, steady-state considerations of coil stability will not neces-
sarily guarantee that the coil will be cryostatically stable in a transient
disturbance state. For instance, if the whole coil is undergoing a violent
disturbance so that the steady-state cooling is not available, the coil shall
completely quench without current sharing.
IV-45

10. Conductor Design, Coil Structure and Coil Winding
As discussed ±ri therTprecedlng section, the full stability of the con-
ductor will be assured if :the conductor has good mechanical stability in
a proposed coil structure. Careful investigation of all the forces exerted
on the TF coil conductor reveals that there are at least four significant
mechanical instabilities in a TF coil. These are as follows.
Out-of-Plane Load
The ou t-*>f-p lane load i as shown in Figure IV-8, produces many local
bending moments within each coil half and large over-turning moments between
the two coil; halves. Both the local moments and the over-turning moments
are quite capable of generating shear stress between turns or between layers.
If the TF coil is not shielded, these forces and shear stresses are cyclic
in nature. Consequently, damage to the superconducting filaments, the
copper stabilizer, insulator and coil structure must be carefully investi-
gated.
The Centering Force
Conductors, insulators and structural materials in the TF straight
segment at the inner leg will experience a large radial inward compression
of about 8000 psi. This will likely generate layer to layer shear unless
each layer is flat and firm enough to support its neighboring layer. The
packing of these straight conductor segments must be quite tight to ensure
force transfer. It is interesting to note that if these conductors are
not straight, there is a vertical force attempting to straighten them out,
thus, the relative generating motion and frictional heating.
Gravitational Load
The fact that the TF conductor in each coil weighs about 208 tons and
is standing in a vertical plane could cause a problem in mechanical in-
stability. The large static g-load and the large coil dimensions will
require that the conductor in each layer must be set firmly on its inner
neighboring layer and that the conductor must be tightly wound so that the
coil will not become loose after it is standing in the vertical plane.

Other Bending Moments
Bending moments of a pure-tension TF coil may still exist if the coil
shape is distorted because of imperfection in coil winding:and the deflection
of conductor and coil form due to g-load. Bending moments may also be de-
veloped if there is an in-plane coil displacement such as the vertical or
radial displacement due to the imperfection of coil fabrication and assembly,
It is clear that a good TF conductor and coil design to overcome these
mechanical instabilities is a challenging job. Since the bubble chamber mag-
nets do not have the same mechanical instabilities that the TF coil does, the
general wisdom is that the * .lbble chamber magnet type conductor and coil
structure is probably inadequate to handle the TF coil forces. In general,
pancake windings provide good support as far as the hoop force is concerned.
However, the conventional pancake winding, consisting of many layers, will
have poor mechanical integrity as far as the out-of-plane load is concerned.22
The solid pancake design, proposed by the University of Wisconsin group,
is an attempt to improve the mechanical integrity of pancake winding against
the out-of-plane load.
(a) Reference Conductor Design - Sheet Conductor
Based on the preceding design considerations, it is proposed that a wide
sheet conductor be used in the TF coils if a field shield is provided. If
each TF coil layer is made of a single sheet, the width of a sheet will be
^ 3 m. With reasonable sheet thickness (y 1 cm), the operational current will
exceed 100 kA. It is therefore proposed to divide each TF coil cross section
into two subdivisions with a central partition rib as shown in Figure IV-10.
This rib will serve several useful purposes! (1) it reinforces the strength
of the coil form under g-load so that 1,25 cm thick coil forms will be ade-
quate instead of 2,5 cm ones; and (2) the rib will also allow the jelly-roll
winding in each subdivision to be done separately. Then the two side panels
can be pressed against the winding and welded to enclose the coil form, thus
confining the conductor firmly against the out-of-plane load.
With two subdivisions in each TF coil and one turn per layer in each
subdivision, the conductor stabilizer width will vary from 0.5 m for the
innermost layer to 0.3 m for the outermost layer. This gradual reduction
in width will fit the trapezoidal cross section very well. The thickness
of copper stabilizer varies according to the magnetoresistance and the
IV-47

radiation induced resistivity. Reasonable thickness per layer is needed to
increase the out-of~plane rigidity and to avoid troubles in handling wide and
thin metal sheet, A current of 60 kA per turn was tentatively determined;
typical dimensions for copper sheet, stainless steel reinforced sheet and
the proper superconductor cross section in each field region were chosen.
The superconductor cross section was sized using a J-H curve with a temperature
0,5*K above the intended operating temperature. For example, at 10 T - 3°K
operation, the J-H curve used is the one with T = 3.5°K. It turns out that
this amount of superconductor will enable the TF coil to be operated at 8 T
peak field at 4,2°K with the same AT allowance.
As an illustration, a set of typical sheet conductor specifications is
listed in Table IV-2. The conductor is graded into nine field grades with
3 T as the lowest field grade and 10 T as the highest field grade. This is
because the outermost layer conductor in the outer TF leg will see a field of
3 T rather than zero. Substantial cost saving can be made if conductor is
graded in this manner.
The proposed sheet conductor, as shown in Figure IV-19, is made of a
copper sheet and many superconducting composite wires stranded around it.
This stranding is necessary to eliminate the self field instability which
will be significant if the operational current is large. The composite with
proper Cu/NbTi ratio (approximately 2) is pretinned first and then soft-
soldered with tin-lead alloy to the copper sheet to assure good bonding. A
rolling process is then applied to achieve good conductor dimensional toler-
ance. There are several important advantages of using stranded composite
conductor;
(1) Unlimited length conductor can be made easily;
(2) If the joints of each individual wire are properly spaced, there
is very little heat generation per unit length joint;
(3) Grading the conductor with the proper NbTi fraction can easily be
accomplished;
(A) The short sample test of high current conductor can be a tricky
job, whereas with stranded conductor, it is a simple matter to
determine the I-H curve of each strand.
IV-48

SS. STRUCTURALMEMBER ^
COPPER ASSTABILIZER
SUPERCONDUCTINGSTRAND SOFTSOLDERED TOCOPPER STABILIZER
-1 .25CM THICKS.S. COIL FORM
.--ICMTHICK INSULATORFOR COIL FORM
STAINLESS STEELREINFORCEMENT FORHOOP FORCE AND OUT OFPLANE LOAD \
LIQUID HELIUMCHANNEL L
' ISUPERCONDUCTING c.. .-^=v-^. -COMPOSITE : " 'H M M D I A . )
SOFT SOLDER
IMM
SPIRALLY-WRAPPEDEPOXY FIBERGLASS
—• COPPER STABILIZER
Figure IV-19. Reference Sheet Conductor {60 KA) forTFC and i t s Coil Cross Section (TellyRoll Winding)
IV-49

The electrical insulation and the liquid helium channel are provided by
about 1 mm thick by 1 cm wide fiberglass wetted with epoxy. The fiberglass
epoxy Is spiral wrapped around the sheet conductor covering 50% of the exposed
surface. This will provide an exposed surface area of about 50 cm2 per cm
conductor length. The equivalent recovery heat flux per cm2 is about 0.3 W,
The electrical insulation Cor 1 mm conductor spacing is about 200 V for the
turn-to-turn insulation, which is adequate. The coil form is stainless steel
and is insulated with a micarta or G-10 sheet of 1 cm thickness. These sheets
are grooved to provide vertical liquid helium channels for venting,
A stainless steel sheet of variable thickness is wrapped along the con-
ductor, AF far as hoop stress is concerned, the multilayer stainless steel
serves as a multishell stainless steel pressure vessel. For the out-of-plane
load, the stainless steel sheet increases the rigidity of the coil form
tremendously. Since the radius of curvature near a 10 T region is 1.98 m, the
overall average hoop stress in stainless steel is 26,000 psi and that in copper
stabilizer is 14,500 psi. These stress levels are fairly conservative at 4.2°K
temperature.
The sheet conductor design unavoidably leaves several questions unanswered:
(1) The stability of sheet conductor needs further study, especially the
current sharing characteristics and the heat transfer in such a long
and shallow channel;
(2) The stranding pitch is on the order of I m, it is not clear what the
level of self-field instability will be;
(3) Handling, especially the coil winding of such a wide and rather
thin conductor might have problems; and
(4) The mechanical strength and the stress level in the composite con-
ductor, especially the resistivity of copper after the stranding
and rolling process, may increase by some amount.
(b) Cable Conductor
If no field shield is provided, monolithic conductor or the sheet con-
ductor with stranded composite will have excessive ac losses, and a cable
conductor must be used. However, since the twisting reversal is not yet shown
IV-50

to be practical, che only alternative is to use a cable with many strands
fully transposed, Th? filaments of NbTi must be arranged in a circular ring at
.-qual distance from the strand conductor axis so that filaments are fully
transposed. Then there is no longitudinal coupling or transverse coupling.
Within each strand, a sufficient amount of stabilizing copper is incorporated
to fulfill the cryostatic stabilization criterion. Two stainless steel rein-
forced plates are used as the members supporting hoop stress within the con-
ductor. A typical cable is shown in Figure IV-20. A typical strand is also
shown in this figure. Note that the orientation of. the stainless steel and the
cable is such that eddy current loss is minimized. A stainless steel band is
used to bond braided cables and the stainless steel supports together. Wetted
G-10 fiberglass epoxy is used to further bond the cable together. Spiral-
wrapping the G-10 provides turn-to-turn insulation as well as nonvapor-locking
liquid helium channels for a TF coil in a standing configuration. Additional
cooling passages are also provided in the stainless steel support to permit
liquid helium penetration into the cable. Cable conductor operational current
per turn should not be too high, otherwise, the packing factor is reduced and
the cable will be quite "mushy".
(c) Coil Winding
Figure IV-21 depicts a coil winding line for a TF coil with the described
sheet conductor. The conductor, after passing through the tension device, a
cleaning bath and a sheet conductor roller, is wrapped with fiberglass epoxy.
The stainless steel wrapped along the conductor may have higher tension to
prestress the. copper in compression. A winding fixture with spring fingers
must be provided to press the conductor in place as the conductor passes the
corner of the smallest curvature into the straight segment. Additional
pressing devices, automatic or semiautomatic, must be provided along the
straight segment to ensure that the conductor is pressed tightly on the inner
layer conductor as the windlag progresses. As the outermost layer of the
upper subcoil is wound, the straight panel must be tightly pressed onto the
last layer of stainless steel sheet and welded in place. The side panel will
be pressed from the side and welded in place. The coil winding for the
second subdivision will then proceed. The two divided subcoils will be
connecbed in series through the partition rib at any angular location be-
tween 8 = 0 ° and 8 y 110° where there is ample space between the helium
vessel and the last layer of reinforced stainless steel.
IV-51
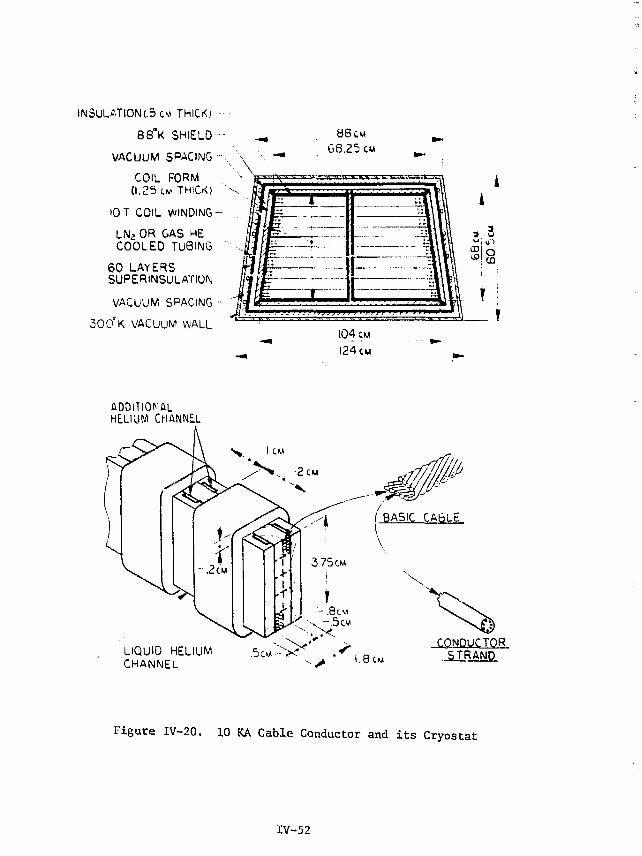
INSULAT!QN(.5cw THICK)
88°K S H I E L D -
VACUUM SPACING-.
COIL FORM( 1 . 2 5 CM THICK)
10 T COIL WINDING
LN3 OR GAS HECOOLED TUBING
6 0 LAYERSSUPERINSULATION
VACUUM SPACING-
300° K VACUUM WALL
8 8 C M
68,25 CM
ADDITIONALHELIUM CHANNEL
LIQUID HELIUMCHANNEL
Figure IV-20. 10 KA Cable Conductor and i t s Cryostat
IV-52

WINDING TURNTABLE
STAINLESS STEEL SPOOL
TENSION DEVICE
COIL FORMREINFORCEMENT
WETTEDEPOXY-FIBERGLASSAPPLICATOR
TENSION DEVICE
CONDUCTOR SPOOL
Figure IV-21. A Conceptual Winding Line for TFC
IV-53
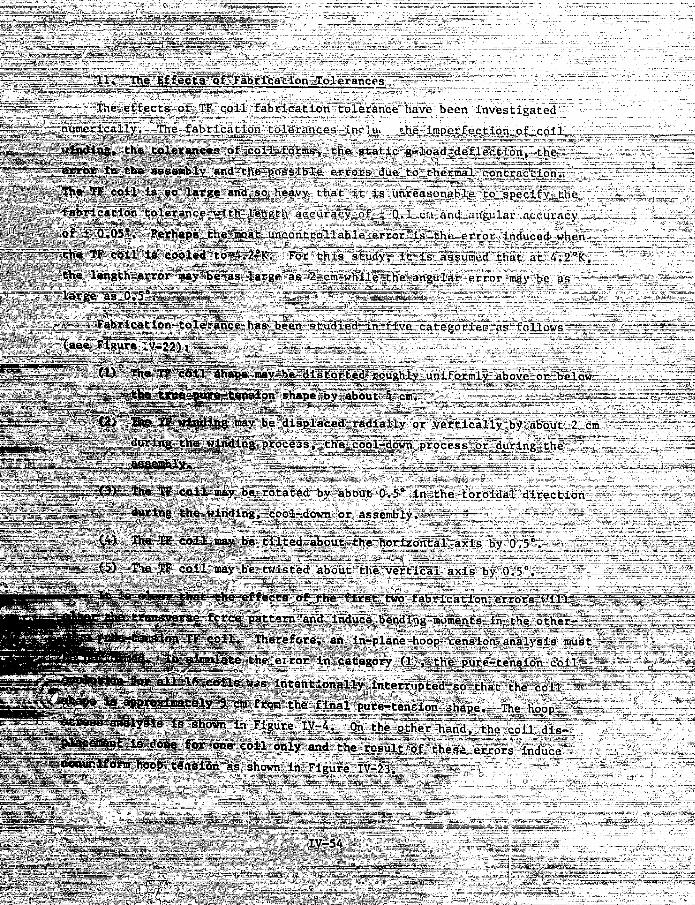
11. The Effects of Fabrication Tolerances
_~ ~ The eftects-of-TF coil fabrication tolerance have been investigated
-'_-_- -. - -numerically. The fabrication tqleraji_c_e_3_in:>'!u. .the _imperfec,tion_of_coil._
^ i ^ winding, the tolerances of coil, forms/ the static-g--load deflection, the
• ;. :jBrror_in tha assembly and-the-possible errors due to thermal7contraction^.
Th* TF ceil is so large and"/so heavy that it is unreasonable to" specify the
fabrication tolerance-vtth-length accuracy of r 0,1 ct.t and angular accuracy
1 of i" Q»Q5°» Perhaps _theJmost uncontrollable error is the error induced when
the TF coil is cooled to A.29K. For~this"study, It is assumed that at 4.2°K,
the length error may be as large as 2 cm while the angular error may be as
large as 0,5s. " " " „
Fabrication tolerance has been studied "in five categories as follows -
(see Figure 1V-22): - - - " -
(1) The TF coil shape may Ver "distoFted^roughly uniformly above "or below
. the fente pura-tansion shape by about 5 cm. ." _ .. '-
I2i "Baa ZB Winding may be displaced__radia.Uy or vertically by about 2...cm
during the winding process,"the cooi-ddwh process or during the
- - *fc
(3) The TF coi l may be rotated" by about-0.5° in" the "toroidal directionduring the winding, cool-dovm or assembly".
(4) The IE coi l may be tilted about the-hori2ontal;axis by 0;5°."
(5) Tie TF coil may be twisted about the vertical "axis by 0.5°.
t .O&KHF that the effects' of- rtteFflrst ttio -fabYicatTion: errbrsyVill-"1""traosverse-fcrce patternTjandJLnduce. bending moments in. the other-' .
FttHS-asaaion T> coi l . Therefore, an in-plane hoop tension-analysis mustto simulate the ei-ror in category (t;-, the pure-tension coil -
V> eoi ls VJS intentionally interrupted so-that the coil"i s appKHrfaately 3 c« from the final pure-teneion shape. -The hoop -'-"-analysis i s shown in Figure-lV-4^ On the other"hand, the coil dis r
i s done for one coil only and the. result of-these errors induce-ttonur.lform hoop tension as shown in Figure" IV-23. " -
IV-5A

m
UlO
_u
- i M -
oul
—(
03
04
I
CO- • H -
IV-5 5

ja
<oO
ENSI
OK
22
20
18
16
14
(2
10
8
4-
2-
0-
PRADIAL TRANSLATION BY 2 cm
|VER|ICAL TRANSLATION BY 2 cm
V ;.; ;;;|H6.|:blSPLAC£MENT
- l i | i i | i i | r i
30° 60° 90°ANGLE,6
'ixl
lo
%
i | r
150°120°
Figure !V-j23. Tension Distortion of Coil Displacement andCoil Shape Deflection
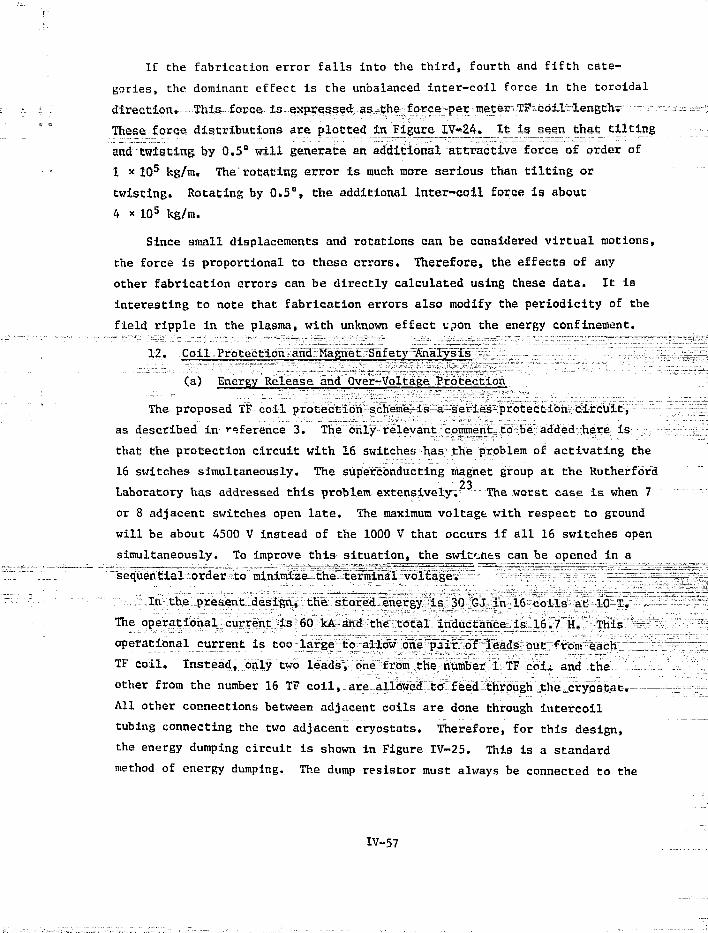
If the fabrication error falls into the third, fourth and fifth cate-
gories, the dominant effect is the unbalanced inter-coil force in the toroidal
•direction* Ibis force is-expr^sseA a;s-|h§? "•""• ':t'?"
These force distributions are plotted in Figure _IV«24»_ It is seen that tilting
and twisting by 0.5° will generate an additional attractive force of order of
1 * 10s kg/m. The rotating error is much more serious than tilting or
twisting. Rotating by 0.5°, the additional Inter-coil force is about
4 * 10s kg/m.
Since small displacements and rotations can be considered virtual motions,
the force is proportional to these errors. Therefore, the effects of any
other fabrication errors can be directly calculated using these data. It is
interesting to note that fabrication errors also modify the periodicity of the
field ripple in the plasma, with unknown effect upon the energy confinement.
12. Coil Protection and Magnet Safety Analysis
(a) Energy Release and Over-Voltage Protection
The proposed TF coil protection scheme is a series protection circuit,
as described in *"<=ference 3. The only relevant comment to be added here is
that the protection circuit with 16 switches has the problem of activating the
16 switches simultaneously. The superconducting- magnet group at the Rutherford23
Laboratory has addressed this problem extensively. The worst case is when 7
or 8 adjacent switches open late. The maximum voltage with respect to ground
will be about 4500 V instead of the 1000 V that occurs if all 16 switches open
simultaneously. To improve this situation, the swit'-nes can be opened in a
sequential order to minimise the terminal voltage.
In the present design, the stored energy is 30 GJ in 16 coils at 10 T.
The operational current is 60 kA and the total inductance is 16.7 H. This
operational current is too large to allow one pair of leads out from each
TF coil. Instead, only two leads, one from the number 1 TF coli and the
other from the number 16 TF coil, are allowed to feed through the,;Cryostat,
All other connections between adjacent coils are done through iutercoil
tubing connecting the two adjacent cryostats. Therefore, for this design,
the energy dumping circuit is shown in Figure IV-25. This is a standard
method of energy dumping. The dump resistor must always be connected to the
IV-57

-4
-6
-a
2
"i I
i °uugu
180
(O ROTATION
(ROTATION ANCLE = -0 .5°)
TWiST(T/;(JT!NG
162 141 121 IOC. 809 DEGREES
I69
rIB
Figure IV-24. Out of Plane Load Due to Errors of Rotation, Twis -nd Tilt
IV -58

CURRENTTRANSDUCER
POWERSUPPLY
•W-DUMP RESISTOR
. DUMPI7SWITC h
Figure IV-25. Dumping Circuit
IV-59
coil. Should a normal front develop in any coil, the magnet terminal voltage
of that coil will surge and the signal is used to disconnect the power supply.
The coil system energy will be discharged through the dump resistor. The
terminal voltage of the magnet will be no greater than the voltage across the
dump resistor. The discharge voltage will be 2000 V. The resistance of the
dump resistor will be 0.033 ft and the coil current will decay in a time
constant of 506 s, or 8-1/2 minutes. This is a reasonably fast discharge. A
faster discharge can be designed if the coil and current leads are designed
with higher insulation.
Arcing Is always a serious threat to a large superconducting magnet, a
large safety margin must be used in'designing the coll .sulation and the
current leads insulation. For example, the 4000 V coil insulation must be
provided in order to allow a 200Q V operating condition. In fact, the entire
system should be tested with a high voltage and extreme low current output
power supply to test the insulation strength of the coil with respect to
ground under the liquid helium environment.
As shown in Figure IV-25, a fuse with a small current capacity is con-
nected in the grounding loop to the discharge resistor to ensure that no large
grounding current shall flow if any point in the coil winding should accidently
be grounded. The discharge resistor must be tested at incrementally increasing
current levels during initial system checkout. Multiple parallel paths should
be provided in case interruption may occur in the discharge resistor.
(b) Over-Current Protection
Current control is provided by a circuit that compares the current read
by the transducer (Figure IV-25) to a reference voltage in the power supply.
(c) Coil Forces and Structure Stress
The most critical hazards are those in which the design forces in the
conductor and forces in supporting structures are exceeded. Therefore, strain
gauges are used to monitor these situations.
(d) Cryostat Protection
Each TF coil cryostat shall be equipped with pressure rupture discs to
guard against pressure buildup in the helium vessel. The pressure rupture disc
can also protect the magnet coil in the event that large resistive heating
TV-60

occurs with rapid pressure rise. Then, at a preset pressure, the rupture disc
breaks and the bulk of the liquid helium will be rapidly transferred from the
dewar to an emergency dump tank. This will remove liquid helium quickly and
the wnole coil will become normal and coil energy will be uniformly dissipated
throughout the winding.
(e) Short Checking
Shorting from turn to turn, from layer to layer or from coil to ground
is a very serious matter. The short will act as a discharge resistor. Should
the coil energy be discharged, large amounts of energy deposition will occur
at the short, and the conductor around the short will be melted into a copper
block. Techniques for testing the short must be developed. Potential taps
for checking shorts after the coil is wound must be incorporated.
(f) Current Leads Protection
If the discharge time constant is 8-1/2 minutes, then the current leads
must be designed to allow adiabatic heating in that time period without raising
the lead temperature dangerously high. The current leads are cooled by counter-
flow helium gas. In-line gas flowmeters must be installed to monitor the
amount of counter-flow helium gas. Alternatively, voltage taps across the
leads are provided to monitor the current lead temperature. Temperature sen-
sors may also be attached to the connector of the current leads.
Current leads are a weak link in magnet systems. The magnetic field and
forces on the lead must be carefully evaluated. The leads must be firmly
supported and must Mve sufficient insulation.
(g) Connectors and Conductor Joints
Connectors and conductor joints are another weak link in the magnet
system. The resistance of each joint and each connector must be carefully
tested and voltage taps must be provided across the joints and connectors to
monitor possible failures. All forces exerted o- the connectors and joints
must be carefully computed. The mechanica1 3t. . gth of joints and connectors
must be thoroughly tested. In some instances, a redundant path should be
provided.
IV-61
(h) Coil Temperature and Thermal Stress
Many temperature 'ensors such as thermocouples, semiconductors, carbon
resistors and/or platinum resistors are used to monitor the coil temperature
at various locations. The coil temperature i.ust be carefully monitored to
limit the thermal stress during cooldown. A liquid helium level indicator
and/or temperature sensor is installed at the uppermost position to ensure
that this part of the coil will stay below the liquid helium level.
(i) Power Supply Protection
The power supplies must be protected from overheating in such elements
as the power diode and transformer and from interruptions such as water
flow.
(j) Vacuum Vessel Protection
The vacuum vessel must be protected against over-pressure. An over-
pressure rupture disc must be provided. The vacuum vessel must also be pro-
tected against the transient forces between the eddy current and the decaying
magnetic field.
(k) Field Shield Protection
If the magnet is discharged in 8-1/2 minutes, large eddy currents will
be developed in each vacuum vessel and the field shield. The interaction
between the eddy currents and the decaying field may generate a large and
complex force and ruin the field shield or radiation shields or structural
members.
(1) Bending Moments
When twc neighboring coils ^arry different currents, the unbalanced
inter-coil force is large. Furthermore, pure-tension TF coils will remain
in pure tension only if all coils carry the same currents. Tf two coils carry
different currents, large bending moments and peak stresses will occur In
the coil ard subsequent structure failure may occur. Therefore, it is ex-
ceedingly important to make sure the currents are the same. This probably
can be guaranteed only through series operation under all circumstances.
IV-62
(m) Vapor Locking
For -ertain orientations and channel size of liquid helium channels,
gas locking may occur around the coil winding. This is another hazard that
could burn out a section of conductor and lead to a disastrous arcing.
(n) Other Safety Considerations
The TF coils are subjected to the interactions from other systems, such
as the plasma loop, the poloidal coils (OH and EF) and the neutral beams, etc.
These interactions will have to be borne in mind in safety analysis. For
example, the TF coil discharge rate should be reasonably slow so that no large
eddy currents are generated in the shield. The TF coil would normally be dis-
charged aft^r all ooloidal coils are shut down. This will avoid large inter-
action forces.
13. Summation of Dissipation Loss and the Refrigeration Requirements
Heat dissipation in the TF coil system is summarized in Table IV-4.
(a) Nuclear Heating
The nuclear heating is 91 W per coil or a total of 1.5 kW for 16 coils,
at the nominal neutron wall load of P = 0.5 MW/m2. This nominal wall loadw
is used to compute the nuclear heating for both the 8 T and 10 T operation
(b) AC Losses in Aluminum Shield
The ac losses in the 18°K shield are 8.53 kW per coil and 136.5 kW
for all 16 \7 coils. The 3°K shield has 298.6 W per TF coil and 4.78 kW for
all 16 TF coils.
(c) The Cryostat Loss
The radiation loss between the 18°K field shield and the 3°K helium
vessel is negligibly small. The radiation heat load from the 300°K vacuum
wall to the 18°K shield is 64.5 W per TF coil or 1032 W for all 16 coils
provided that multiple layer superinsulation is used. The heat conduction
loss through the support system is small and there is no loss for the inter-
coil structure. The 60 kA leads will dissipate a total of 120 W.
Therefore, the total loss in the 3°K he] i-jic vessel is 6,40 kW for all
16 coils. The total loss in the 18°K normal metal shield is 137.5 kW for
IV-63

all 16 coils. If the TF coil is operated at 8 T, then the coils will be at
4.2°K. The ac loss in the 4.2°K helium vessel will be reduced by a factor of
0.64 relative to the 3°K use. The ac loss in the 18°K aluminum shield will
also be reduced by a factor of 0.64. This is because the ac loss mainly is
produced by the EF coil and the plasma current. Therefore, at 8 T operation,
the total losses in the 4.2°K helium vessel are about 4.22 kW for all 16
coils. The total losses in the 18°K normal metal shield are 88 kW for all
16 coils. These losses, as well as the ac losses without field, are tabulated
in Table IV-4.
For the 3*K or 4.2°K refrigeration by boiling, the coefficient of per-
formance, CO.P., is given by
T -TC.O.P. = - y — x i (IV-14)
Where T\ is the efficiency of the actual machine relative to Carnot efficiency,
T is the ambient temperature and T is the refrigeration temperature. For
large machines, n is about 20%. So the C.O.P. for the 3°K refrigerator is
495 and the C.O.P. for the 4.2°K refrigerator is 350.
Refrigeration of the 18°K aluminum shield takes place over a temperature
range from low temperature TT (= 12.5°K) to high temperature T_. (= 23.5°K).
The C.O.P. is given by
T_ 1 ,(IV-15).O.P. - 7 = ° • . -1 * 7 =
[_(TH - TL)/(*n TH/TL) J n
Therefore, at 10 T operation the total input power for the 16 TF coil re-
frigeration is about 14.27 MW of which 11.1 MW is used in the field shield
refrigeration and 3.17 MW is used in the 3°K refrigeration. For 8 T operation,
the total input power for the field shield refrigeration is 7.1 MW and the
total input power for the 4.2°K refrigeration is 1.48 MW. Therefore, at 8 T
operation, the totPl input power required is 8.58 MW for all 16 TF coils.
14, Refrigeration System Evaluation
(a) Aluminum Shield
The alumir'im shield is refrigerated at an average temperature of I8°K.
The refrigerant inlet temperature is 12.5°K and the outlet temperature is 23.5°K.
IV-64

Table IV-4. TF Coll Heat Dissipation Summary
Heat Dissipation Iteas
Nuclear Heating,
/4.2°K Ai. Shield •c Losses
K At. Shield *c Los&et: '
Xhecmal Radiation Load on
13°K Shield
Thermal Radiation Load onHeliun Vessel From 77*Kshield
Cryostat Heat Conductor Losson Heliuta Vessel
Current Leads Lass
?.icallel Field ConductorLass**
Perpendicular Field Con-ductor Loss**
AC Loss In Coll Fora
Summation of L035 ac 3°K/4C>K
Sunsiation of Loss a t 18°K
Refrigeration Power <Cocj-preasor Input pover)
With Muminuo Field Shield(Sheet Conductor)
8 T
Per Coil 16 Coils(HJ (WO
Per Coll I t Ceils
91
219
B500
10
1.5
'..a
JJfi
1.04
ip.lo
ip.12
9J
191
55UO
65
1-5
3.06
66
1.04
0.16
0.12
—
—
400
8565
14.3
-
-
A
13;
KW
-
-
.5
—
—
300
5565
6.9 MH
4
89
--
8
no631
1168
—
9 J
10
IK
-
Htf*
.08
.1
.7
-
84
£04
KJ«i
--
U. 1
1.
6.
13.
-
MM*
Without Fluid Shield*(Calue Conductor with Twisting Reversal)
10 T O'K) 8 I
Per Coil 16 Colls(kU)
Per Coil(V)
10
10
296
O.J(,
217
16 CollsO.W)
AC Loss in Conductor reinforcing 's tructural (MtiTlal is not included,
** Because of complex nature of B in thr- plasna ranping and EF Coil raoplng, 2 a Tine time Is U3IMJ,i hypothetical conductor used In ' the ac losses icajcuiat ion.

This range was chosen on the basis of the graph shown in Figure IV-26. This
shows refrigeration input power (for a 11°K temperature rise), the resistivity
ratio of a typical aluminum, and the product of the two as a function of
temperature. This product is proportional to the power required to cool the
aluminum eddy current shield, assuming the current is independent of temper-
ature. To cool the TF coil shield, a temperature rise of 12.5°K to 23.5°K was
chosen, which leaves a 11°K margin before the power required starts to rise.
(b) 3°K Refrigeration System Comparison
The large refrigeration :. uirement at low pressure prompted the in-
vestigation of. the. possibility of refrigerating the TF coils by circulating
supercritical helium through condensers in the TF coil cryostat to maintain
the required saturation pressure (0.237/atm) as shown in Figure IV-27. It
waa hoped this might result in smaller piping and cold box size, and reduce
the total volume at subatmospheric pressure, / comparison was made between a
range of "dense gas," single expander, 3°K refrigeration cycles and a reference
cycle utilizing 3°K liquid. The results are shown in Figures IV-28, IV-29 and
IV-3G.
The 3°K liquid cycle was chosen to simulate ordinary 4°K liquifiers with
pumped bath added. The assumptions are: 2 expanders, high-side pressure at
15 aEm». expander discharge at l-afcm»~10Q« efficient expanders, and 100%
efficient heat exchangers. The refrigeration availablein the cold return
from the i"K liquid is recovered in *: e counterflow heat exchangers.
The "dense gas" cycles cover a range of low-side pressures. In each
case, the smallest pressure ratio possible to produce a 2,2"K expander .is-
charge with an expander inlet of 3°K or greater was used. Expander and ex-
changer efficiencies ace taken as 100%.
The power input- ratio is based on assumed 100% efficient isothermal
compression.
Table IV-5 shows that a reduction in first stage compressor displacement
is possible, but at a rather severe penalty in input power. Consequeatly,
the present TF coil refrigeration systen is based on operating with vacuum
pumps to maintain the desired operating pressure.
TV-6b
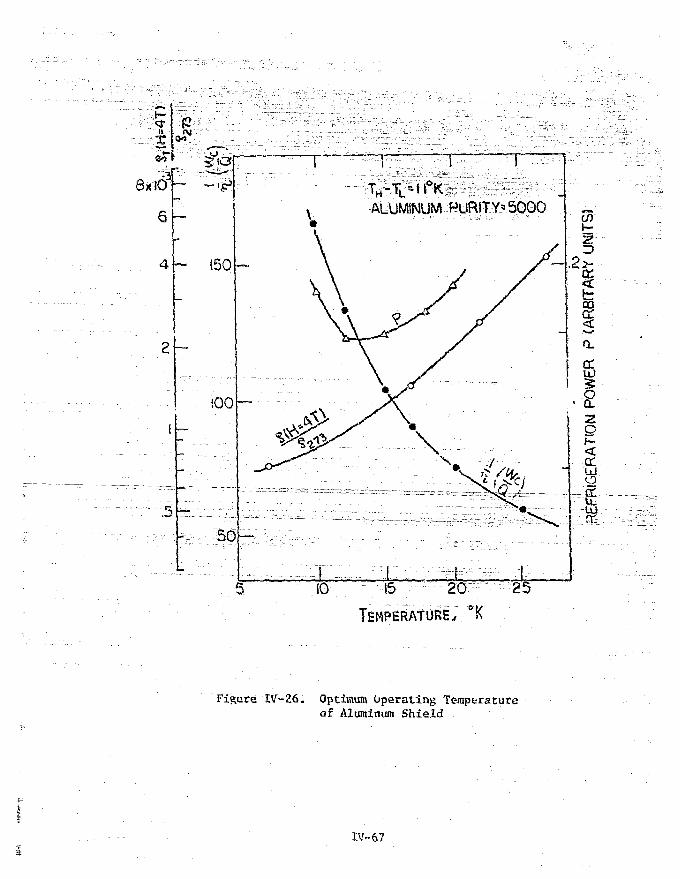
It
4 ~
.5
50
WtfKALUMINUM PURITY'5000
10 15 20 25
IV-26. Optimum Operating Temperacureof Aluminum Shield
IV-6?

IO.OOO A CURRENTLEADS
._ - 42°Ki*,ATM FORLEAD COOLING4°K-3°K INSULATION
-VENT LINE ORRUPTURE DISC
3°K 3 3 •> PSIACONDENSER
Pout
EXPANDER
HEATEXCHANGER
300°K
COMPRESSOR
• SUPPORT CYLINDER
Figure IV-27. 3°K Refrigeration Schematics
IV-68

30.0
20.0
-10.0
trcOcoLL)
LU
o
o
1.0
0.2
REFERENCE SYSTEM AT.2371 ATM ( 3 ^ LIQUID)
2 3 4 5RELATIVE COMPRESSOR POWER
Figure W-28. Relative Compressor Power for 3CKRefrigeration
rV-69

30.0
20.0
h:IO.OUJ
orf
ora.
i.O
0.2
REFERENCE SYSTEM AT.2371 ATM (3°K LIQUID)
O.I 0.5 1.0RELATIVE FIRST STAGE DISPLACEMENT
Figure IV-29. Relative First Stage Displacement for 3°KRefrigerator
IV-70
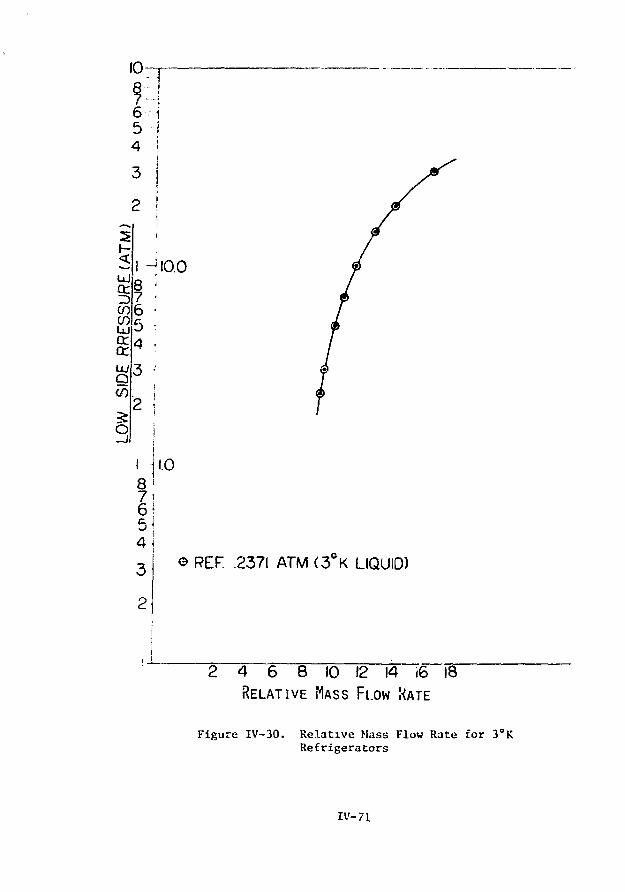
10-
654
2<
GOCOUJ
- 10.0
4 .
UJQCO
O
8f
1 !3
2
REF .2371 ATM (3 K LIQUID)
4 6 8 10 12 14 i6 18RELATIVE MASS FLOW KATE
Figure IV-30. Relative Mass Flow Rate for 3°KRefrigerators
IV- 71

Tab'.e TV-5. Pressure Range of Dense Cas Rcfri^.oracor
Condenser Pressure = I* (atrr.) Compressor Discharge Required « V (atr.)£llt 1 . . . ......; ill
2.3 30
3.0 35
5.0 -0
7.0 *5
10.0 50
15.0 60
20.0 65
30.0 70
(c) Refrigeration System
A central refrigeration facility is provided for the E?R rungr.et system.
This facility is schematically shown in Figure IV-31. The TF coil hcliun vessel
a: well as the 3°K or 4°K alumii urr, shield, shall be cooled by a helium liquSfior/
refrigerant v±tt. v • pumping system and heat exchangers. Three expanders
are provided to allow the refrigeration of the 12.5*K to 23.5*K shield as veil as
the A°K liquification. Also shown is the refrigeration loop for the pcloidnl
coii.
The 60 kA or 80 kA current leads are refrigerated by counter-flow high
prossuie cold gas. N"b.Sn tape with copper stabilizer is used to raise the
tenperature of the lower end of the current leads. This design arrangencnt
will reduce the heat leak of the current leads.
15. Cryostat Design
(a) Summary
The TF coil cryostat consists of a stainless steel coil case- t'.at also
conprisJS the liquid heliura container, an aluninun field shield, and an
aluminum outer shell. Cryostat insulation consists of a high vacuun between
the aluminum shield ar.d helium container and high vacuum with multilayer
insulation between the aluminum shield end the room tempt.aturc outer shell.
The general cryostat arrangement is illustrated in Figure IV-10.
TV-72

POLOlDALCOILS
TFC
Figure IV-31. Schematics of Central Refrigeration Facility<> 15 MW Refrigeration Plant)
IV- 7 3

(b) Inner Shell
The inner shsll of the cryostat will consist of stainless steel plate.
The arrangement shown, with a central divider between the two windings stiffens
the cryostat walls enough to allow the use of 1/2" plate. Shear panels be-
tween the individual cryostats will be used to resist the torque produced by
the out-of-plane loads on the TF coils (Figure IV-32).
(c) Aluminum Shield
The aluminum shield consists of two portions. The "ortion of the TF coil
adjacent to the central support cylinder will be shielded by aluminum attached
directly to the cryostat wall. The portion of the TF coil away from the
central support cylinder will be insulated from the cryostat inner shell and
will be loaded to an average temperature of 18°K. The shield must resist
large loads (Figure IV-14); therefore, the shield will be of aluminum-stain-
less steel composite construction to limit th°. amount of strain the aluminum
is subject to.
(d) Outer Shell
The cryostat outer shell will be constructed of aluminum alloy plate. A
saving in both weight and material cost, relative to stainless steel, can be
realized.
(e) Insulation
Heat transfer due to radiation between the 1S°K aluminum shield and
the 3°K crycstat inner shell will be negligible relative to other heat sources.
Therefore, no multilayer insulation will be used in this space.
The heat transfer due to radiation between the outer vacuum jacket and
the radiation shield can be estimated as:
(M X/ v V1 1 2 2
Where o is the Stefen Boltzman constant = 5.67 * 10"B W/tn2 "K^, Ax is the
inner area, A is the outer area, T is the cold wall temperature = 18°K,
T is the warm wall temperature = 300°K, Aj/A is 0.9, and E = E = Emis-
sivity - 0.02.
1V-74

•ALUMINUM F.'ELD SHIELD-FRP SHEAR WEB FOR INTERCOILFORM SUPPORT
r-TFC SHEAR PANEL FOR\ ALUMINUM SHIELD' TFCCOIL FORM
PENETRATIONPORTS -ORNEUTRAL BEAM &RF HEATING
PUMPING PORTS
ACCESS FOR SUPPORTOF BLANKET ANDSHIELD
Figure IV-32a. TF Magnet Structural Support
IV-75

T.F. COIL SUPPORTCONTINUOUS SHEAR PANEL
REACTORBASE —
- AL. SHIELD SUPPORT& STIFFENER
VAC JACKET
AL. SHE1LO
SLIDINGHINGE
G LOADSUPPORT
Figure IV-32b. TF Magnet Structural Support(Cross-section View)
IV-76

Then, Q/A = 5.67 * 10"8 [(1/0.02) + 0.9(1/0.02 - I)]'1 (3001* - 18**) - 4.9 W/a2.
For multilayer insulation, an apparant thermal conductivity of K = 5 " 10~7 W/cnioK
can be used between 300°K and 20°K for estimation purposes. The heat transfer
to the aluminum shield then becomes:
Q/A = 1/L K AT = 5.56 * 10~5 W/cm2 = 0.53G W/m2
The surface area for one TF coil is about 116 m*,, Thus, the heat transfer
can be reduced from 116 x 4.9 = 563 W to 116 * 0.556 = 6A.5 V by the use of
multilayer insulation.
Multilayer insulation must be applied with broken conductive paths so
that eddy current heating cannot occur. Even very small heating rates could
raise the insulation temperature, resulting in degradation of insulating
performance.
16. TF Coil Support
(a) Support Cylinder
The support cylinder holds up the TF coils at the inside of the assembly,
and resists the radial, inward forces generated during operation. The vertical
loads are transmitted through the assembly supporting the inner OH and EF
coils, as shown in Figure IV-32. The combined load is transmitted through a
low thermal conductivity member to the building foundation. The combined
load, assuming one-half of the If coil weight is borne by the support cylinder,
is 8.6 * io5 pounds.
A support ring with an allowable compressive strength of 10,000 psi would
require an area of 86 square inches. The calculated heat input between 300cK
and 3°K, for a i m length of glass reinforced epoxy would be 4.2 W. Thus, the
heat transfer due to support of the static load can easily be taade negligible,
compared to the other heat loads..
(b) TF Coil Outer Support
The TF coils will be supported at the inside, on the support cylinder and
at the outside by an individual compression support member. This support will
incorporate a hinge to allow for radial-thermal contraction.
IV*-7 7
(c) TF Coil Intercoil Support
During operation, out-of-plarie loads are produced on the TF coils that
produce a torque on the assembly. This torque will be resisted by a shear
panel between each coil and its neighbors. Access holes will be provided for
access to the interior of the TF coil asseuibly. The shear panel will operate
at the same temperature as the TF coil cryostat.
(d) Aluminum Shield Support
The aluminum shield will be supported as shown on Figure IV-32. Verti-
cal loads will be taken at the inside by attachment to the support cylinder
asoembly and at the outside by the outer TF coil support. The shield will
intersect the latter at the 18°K pcint so that no conduction heat transfer
takes place between the shield and the cryostat inner shell.
Torque produced by the out-of-plane loads on the shield assemblies will
be resisted by a shear panel between each TF coil shield. The shear panel
will be in two layers, one on each side of the coil cryostat shear panel to
provide thermal radiation shielding.
(e) Additional Magnet Structu ,e Design
A detailed analysis of the magnet support system was performed for a
preliminary magnet system design with a somewhat different set of forces than
were described in this chapter. This analysis, which is described in Chapter
XII and Appendix D, established the. feasibility of the shear panel concept
that was selected for the reference design, and also examined a more con-
ventional torque-frame concept.
B. Poloidal Coil System
The poloidal coil system consists of the initiation-trimming (IT) coils,
the ohmic-heating (OH) coils and the equilibrium-field (EF) coils. Both the
OH coils and the EF coils are located outside the TF coils and are supercon-
ducting in order to avoid large I2R losses. The IT coil is made of water-
cooled copper because it is a small coil system and also because it is located
near the first wall, where the radiation flux is high. The IT coil is designed
to provide about 4 V-s over a 10 ins time interval to initiate the plasma
discharge. The IT coil could also be connected to trim the plasma position.
Therefore, the IT coil plays a role in both the plasma breakdown and the
W-78

plasma equilibrium by providing higher values of B than the OH coil and the
KF coil can generate. Onl> a scoping study of the IT coil is given here,
while a preliminary conceptual design is carried cut for both the supercon-
ducting OH coil and the superconducting EF coil.
Although the OH coil functions as the primary transformer for producing
the plasma current and the EF coil provides the tokatsal plasma equilibrium,
both coil systems have nearly identical problems insofar as the magnet design
and magnet technology are concerned. Both magnet systems have large stored
energy of the sane order of magnitude and large operational current; both are
fast-pulsed magnets; and both mainly are of a ring coil configuration with the
exception of the long solenoid in the OH coil system. For th&se reasons, the
conceptual design of the E?R OH coil and EF coil is carried out together as if
they were one magiet system. The EF coils, consisting of eight pairs of ring
coils, are designated with ceil numbers fron one to eight while the OH coils,
consisting of five pairs of ring coils and a pair cf long solenoids, are
d signated vzith coil numbers from nine to fourteen as shewn in Figure IV-3.
The design requirements for the OH nnd EF coil systems were specified as
a result of a detailed trade-off study. Burn cycle dynamics simulations of
the plasma, the couplnd OH and EF systems and tb° plasma heating systems were
performed, as described in Chapter III. Free-boundary plasma MHD equilibrium
calculations were utilized in the design of an EF coil system.
The IT coils, perhaps with auxiliary heatingt provide voltage for the
plasms initiation. The OH coils will heat the plasma to 1 keV and induce
• 5 MA of plasma current; and the EF coils, besides providing the ooderate-6
^lnr plasma equilibrium, will induce the final "v 2.6 MA of plasna current.
Poloidal flux must penetrate the meter-thick blanket and shi«ld to es-
tablish the equilibrium field in the plasma. The blanket and shield are made
mostly of conductive metals. If the blanket and shield are iw;.; laminated,
flux penetration will have a large time delay and phase siiift. Large eddy
currents will arise, and large field distortion will be seen by the plasma.
Reduction of these effects to tolerable levels was examined, and a criterion
for blanket/shield segmentation was developed.
1. Superconducting OH Coil Design
The main function of the OH coil system is to induce and maintain the
plasma current. The plasma heating is accomplished by the combined effort of
IV-79

the OH coil system and the neutral beam injection system. The design re-
quirements for the OH coil system were established in trade-off studies in
which various current reversal times for the OH coils and turn-on times for
the neutral beam were studied. Results of these studies are described in
Chapter III. The poloidal coil design, calculations were based on a design-
basis burn cycle. The design-basis cycle is shown in Figure IV-7. This
cycle corresponds to the startup mode of case 3 ia Table III-ll. A complete
".ycle time of 75 s, of which 60 s is the burn time, was chosen for the
design-basis
The total volt-second requirement for the reference design is 135. The
OH coils are capable of reversing from - 5 I to + 5 T, supplying 85 V-s, with
an OH flux core radius of 1.7 m. The EF coil will supply the remaining 50 V-s.
The OH coils are located outside the TF coil system so that the winding
can be arranged to minimize the ac superimposing field on the TF coil. Since
the OH coil is at full negative value before the onset of plasma startup, the
OH coil windings must also be distributed so that the field produced by the
OH coils at the plasma is less than 10 G or so. This requirement must be
fulfilled in order to guarantee a stable startup. Another consideration for
the OH coil winding arrangement is that the OH coil winding location shall
not obstruct the access required for neutral beam injectors, vacuum ducts,
primary coolant pipes and remote r "ntenance equipment. With these con-
siderations in mind, the OH coils ~.re arranged as shown in Figure IV-3. The
winding dimensions are shown in Table IV-6 and some magnet characteristics
are listed in Table IV-7, where R , R , Z and Z represent the inner radius,
the outer radius, the initial axial coordinates and die final axial coordinates,
respectively.
At 5 T central field, the total ampere-turns are 67 x I05, the total con-
ductor length is 847.4 x 1GS A-m, and the average current density used is
2640 A/cm2. The maximum operational current is 80 kA at the end of the burn
cycle. The maximum power transfer is 1620 MW. The self-flux energy stored
in the OH coils with 5 T central field is 1534 MJ and the inductance is 0.48
H. The mutual inductance between the OH coil and the plasma ring is 0,57 mH.
The coupling coefficient is 0.2422. The energy stored in the coupling field
system of OH coils and plasma is 1621 MJ of which 347 MJ is the self-flux
inductive energy stored in the plasma loop.
IV-80
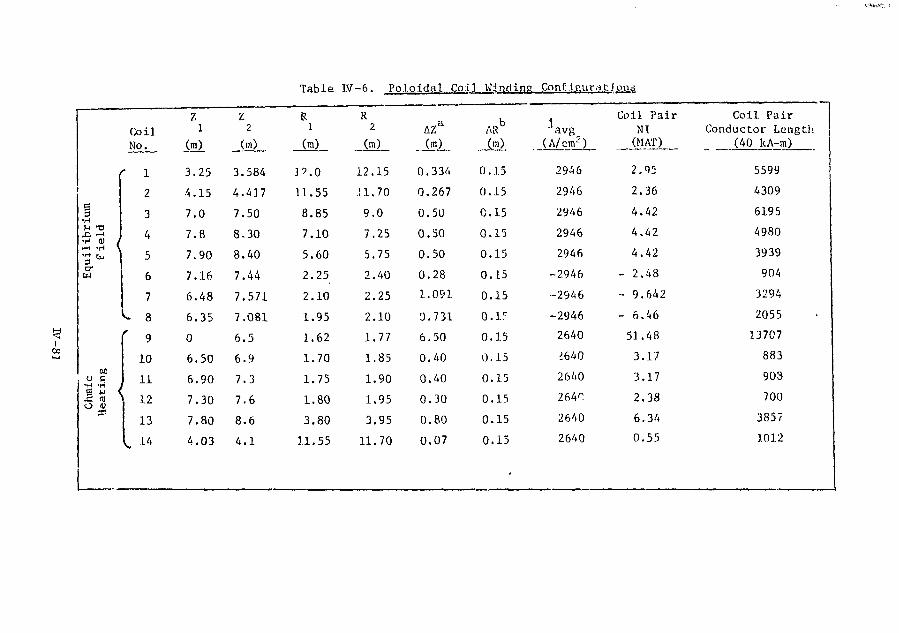
I00
Lura
ibr
•H
crEd
o•H
Dht
n
•Bi—4
•H \
M>
•H i
Coi lMo.
' 1
2
3
4
5
6
7
V- 3
f 9
10
11
1 ^I 14
Z1
(m)
3.25
4.15
7.0
7.8
7.90
7.16
6.48
6.35
0
6.50
6.90
7.30
7.80
4.03
Z
(
3 .
4.
7.
8 .
8.
7.
7.
7.
6.
6.
7
7
8
4
2
584
417
50
30
40
44
571
081
5
9
3
6
6
1
Table
R1
(n)
11.55
8.85
7.10
5.60
2.25
2.10
1.95
1.62
1.70
1.75
1.80
3.80
11.55
IV-6. Poloidal Coil
R2
(m)
12.15
11.70
9.0
7.25
5.75
2.40
2.25
2.10
1.77
1.85
1.90
1.95
3.95
11.70
(m)
0.334
0.267
0.50
0.50
0.50
0.28
1.091
0.731
6.50
0.40
0.40
0.30
0.80
0.07
Wii}d.ir|
i«o0.15
0.15
0.15
0.15
0.15
0.15
0.15
0.15
0.15
0.15
0.15
0.15
0.15
0.15
p Conf Laura
(A/cm2)
2946
2946
2946
2946
2946
-2946
-2946
-2946
2640
i640
2640
264^
2640
2640
Lisas
Coil PairNT
(MAT)
2.95
2.36
4.42
4.42
4.42
- 2.48
- 9.642
- 6.46
51.48
3.17
3.17
2.38
6.34
0.55
Coil PairConductor Length
(40 kA-m)
5599
4309
6195
4980
3939
904
3294
2055
13707
883
903
700
3857
1012

Table IV-7. OH/EF Coil Magnet Characteristics
Superconductor/stabilizer
Coil design
Conductor design
Stability
Cooling
Operating temperature (°K)
Average current density (A/cm2)
Magnetic field (T)
in flux core
at plasma center
Ampere-turns (MAT)
Total conductor length (MA-meters)
Maximum dB/dt in conductor (T/s)
Stored energy in OH/EF/plasma field
Maximum operational current (kA)
Number of turns
Self-inductance (H)
Mutual coupling
Power supply voltage (kV)
Voli—seconds to plasma (V—s)
Coupling coefficient to plasma ring
OH Coil
2640
•v 5
67
847
6.7
(MJ)
80
837
0.48
48
85
< = -0.OHP
Nb-Ti/Cu
Single layer
Fully trans-posed cable
Cryostatic
Pool boiling
4.2
2262
KOHEF = °-0158
2422 1
EF Coil
2946
^ 0.46
± 18.6
996
* 1
80
464
0.52
21
50
W = "0.2566
IV-82

It is a difficult task to design an 80 kA cable with full transposition
and good mechanical stability. The problem with high-current, fully-trans-
posed cable is the spcmginess of the cable. It is therefore proposed to
achieve 80 kA operational current by two parallel conducting paths, withieach
path carrying 40 kA with ^0 kA ful]y~transposed superconducting cable. The
two parallel paths shall have identical impedance in order to have equal
current sharing. The easiest way to do this is to make use of the obvious
symmetry of OH coil winding with rpspect to the median plane.
2. Superconducting E7 Coil Design
If the EF coils were placed inside the TF coils, there would be tre-
mendous difficulties in coil assembly, disassembly, support, repair and
maintenance, as well as in the assembly, disassembly and maintenance of the
blanket and shield and the first wall. To avoid these problems, the EF coils
are located outside the TF coils.
The OH coils would induce large voltages in the EF coils, if the EF
were not decoupled from the OH coils. The decoupling ampere-turns should be
positioned so that they produce small anti-vertical fields and small super-
imposing fields on the TF coils.
The EF coils were designed to produce 50 V-s to the plasma, thereby
reducing the volt-second requirements for the OH coils.
The placement of the EF coils and the currents in them were determined a:
f 'Hows. A first iteration on the vertical field in the plasma was obtained
from a fixed-boundary plasma MHD calculation in which a circular plasma cross
section was specified. Then, a set of coils and currents was picked that
would generate a vertical field pattern as close as possible to this vertical
field (see Figure III-5). With the EF coils relatively far from the plasma
and w?th the inclusion of the decoupling coils, which have currents in the
wrong direction to provide equilibrium, it was not possible to exactly re-
produce, the desired vertical field. The EF coil currents were then modified
slightly, with the coil positions fixed, to produce a more nearly circular
shape using the free boundary equilibrium calculations described in Appen&Lx C
The resulting coil configurations are shown in Table IV-6, the actual plasma
IV- 8 3
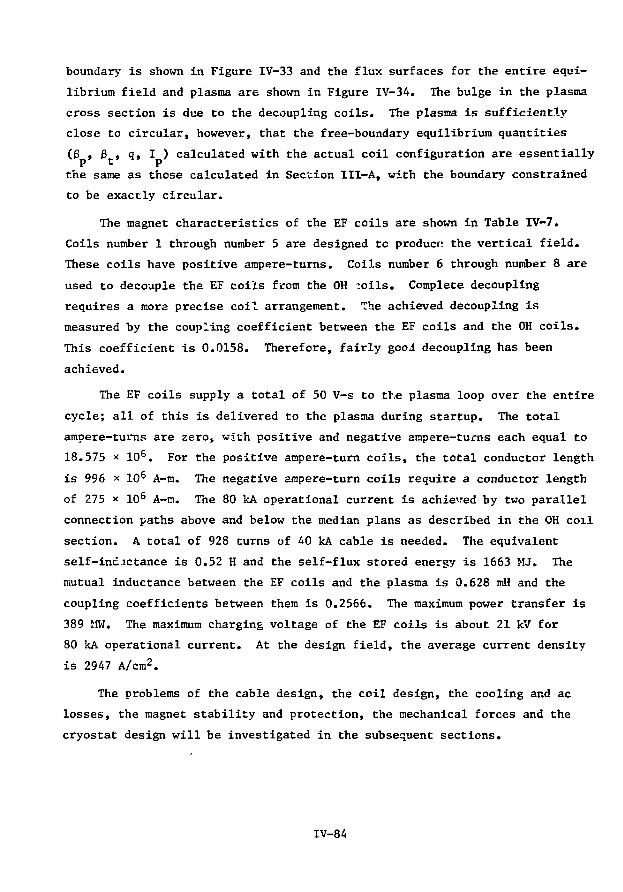
boundary is shown in Figure IV-33 and the flux surfaces for the entire equi-
librium field and plasma are shown in Figure IV-34. The bulge in the plasma
cross section is due to the decoupling coils. The plasma is sufficiently
close to circular, however, that the free-boundary equilibrium quantities
(P , 8 , q, I ) calculated with the actual coil configuration are essentially
the same as those calculated in Section III-A, with the boundary constrained
to be exactly circular.
The magnet characteristics of the EF coils are shown in Table IV-7.
Coils number 1 through number 5 are designed to product! the vertical field.
These coils have positive ampere-turns. Coils number 6 through number 8 are
used to decouple the EF coils from the OH ".oils. Complete decoupling
requires a mora precise coil arrangement. The achieved decoupling is
measured by the coupling coefficient between the EF coils and the OH coils.
This coefficient is 0.0158. Therefore, fairly good decoupling has been
achieved.
The EF coils supply a total of 50 V-s to tt,e plasma loop over the entire
cycle; all of this is delivered to the plasma during startup. The total
ampere-tums are zeros with positive and negative anpere-turns each equal to
18.575 x 10⁶. For the positive ampere-turn coils, the total conductor length
is 996 x 106 A-m. The negative ampere-turn coils require a conductor length
of 275 x 106 A-m. The 80 kA operational current is achieved by two parallel
connection paths above and below the median plans as described in the OH coxl
section. A total of 928 turns of 40 kA cable is needed. The equivalent
self-ind.ictance is 0.52 H and the self-flux stored energy is 1663 MJ. The
mutual inductance between the EF coils and the plasma is 0.628 mH and the
coupling coefficients between them is 0.2566. The maximum power transfer is
389 MW. The maximum charging voltage of the EF coils is about 21 kV for
80 kA operational current. At the design field, the average current density
is 2947 A/cm2.
The problems of the cable design, the coil design, the cooling and ac
losses, the magnet stability and protection, the mechanical forces and the
cryostat design will be investigated in the subsequent sections.
IV-84
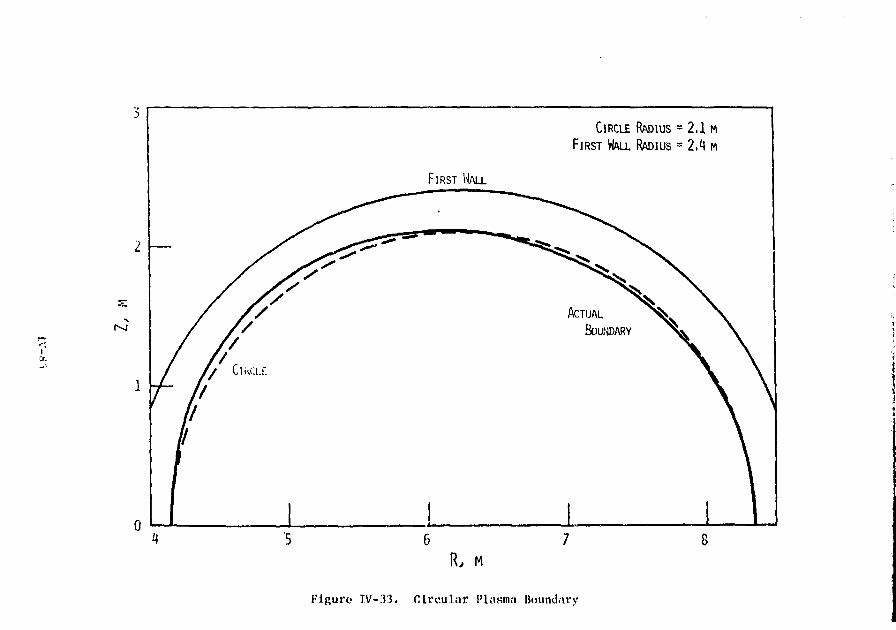
CIRCLE RADIUS = 2.1 MFIRST WALL RADIUS = 2,4 M
FIRST WALL
R, M
Kiguro IV-33. Circular Plasma Boundary
12
Figure W-34. Flux Contour
I/-86

3. Plasma Initiation-Trimming (IT) Coil
In order to initiate the plasma discharge, a large toroidal electric
field will be required over an interval of about 10 ms. As shown in Sec-
tion III-C, about 4 V-s will be required. It will also be necessary to have
a field-free region in the toroidal vacuum chamber so that the initial plasma
will not be deflected by stray fields. The special requirements of this
system are difficult to satisfy by means of the OH coil, so a separate system
has been designed. These coils, which should also be useful for controlling
the plasma position, are shown in Figure IV-35.
The IT coil system consists of four coils located near the first wall and
two coils located on the outside of the blanket and shield above and below the
neutral beam ports. All of these coils could be made of copper. The particulai
configuration shown uses currents of 400, 32 and 16 kA-turns to produce a total
of 4 V-s when the coil system is discharged into a resistor. A magnetic field
null is also produced by this coil system over a large area of the vacuum tank.
The region where the magnetic field is less than 10 G is roughly elliptical in
shape with a major axis (parallel to the major radius of the torus) of 3 m,
and a minor axis of 1 m. Using this coil system, the plasma could be started
at any position in the outside half of the vacuum chamber.
This system of coils should also be useful for control of plasma position.
By connecting the coils in opposite polarities, horizontal and vertical fialds
can be produced in the torus with about 2 G/kA-turn in the coils. The require-
ments for field homogeniety in the control system have not yet been studied.
It is possible that more coils may be needed if a more homogeneous field is
required.
The circuit that controls the IT coil is also sketched in Figure IV-35. The
coil is charged up by a power supply and discharged into a resistor to produce
the required electric field. Charging up would take 0.3 s and discharge would
take 10 ms. In order to vary the shape of the discharge wave form the discharge
resistor should be variable, probably by shorting out sections of a fixed
resistance. Since the IT coil will couple with the OH coil, it will be neces-
sary to decouple them by positioning decoupling coils above and below the long
solenoid of the OH coil. In Figure IV-35, bucking coils have been introduced
co do this.
1V-S7

"IT
"IT.OH
VLOOP
BUCKINGCOILS
PLASMAINITIATION
CIRCUIT
OHMICHEATINGCIRCUIT
TOTAL
— OH
"•••v,IT
Figure IV-35. ITC Magnet Characteristics
IV-88

After the IT coil has discharged, the plasma in the torus should be
stably maintained by the change in the OH and EF coil currents, which should
produce a driving voltage, V^ , of about 25 volts. At this time, the IT
coil could be reconnectid to the trimming power supply, which will enable it
to control plasma position.
U. Axial Forces, Hoop Stresses and Coil Interactions
The axial force o.: an infinitesimal circular current element, IdJl, arises
from its interaction with the radial field component, B . This force is
given by
dF, = (IdJOBB
Cylindrical coordinates are used so that R is the radial coordinate of the
element, Z is the axial position of the element and $ is the azimuthal coor-
dinate. Substitute Bn = -9A,(R,Z)/3Z into the above expression and the axialR $
pressure on the element is given by
dF 8Adpz = 155 = jB*dz = " jdZ i T * (IV"18)
Let Z be the axial coordinate of the coil starting Z-plane and A be the
axial coordinate of the coil final Z-plane. Then the axial pressure at a
point specified by (R,Z) is given by
PZ(R,Z)
The total axial force on any coil plane Z is given by
I2
'ZiFZ(Z) = I 27rRdRPz(R,Z)
I
J
(IV-20)
[AA(R,Z) - A.(R,Z )]RdR.V V 2
The axial pressure and the axial forces were computed by a computer code
"FORCE".U
In the EPR poloidal coil system, since all of che fourteen poloidal coil pai
and the plasma ring contribute to the vector potential A,(R,Z) at any poloidal
W-S9
coil winding, the axial force and pressure of each coil depends on excitation
of all coils. Therefore, it is difficult to predict either the magnitude or
the direction of the vertical forces. It is entirely possible that during
complete cycle the direction of vertical force at any coil reverses and that
the magnitude of the vertical force changes rapidly in disproportion to
self-excitation of that coil. Figure IV-36 shows the vertical force per
meter coil length during the burn cycle with 7.58 MA plasma current, 5 T
central field in OH coils and full excitation in EF coils. Note that some
coils are subjected to repulsive forces while other coils ara subjected to
attractive forces. Note that some adjacent ring coils are subjected to
vertical forces with opposite direction. The long solenoid is expected to
have the largest vertical force because it has the most ampere-turns of all.
Yet it is surprising to find that coil number 8 has rather large repulsive
forces.
To obtain full information on vertical forces, the vertical forces on
each coil were computed at different times during the entire reference cycle
(see Figure IV-7). The results are shown in Figure IV-37. Also investigated
are the vertical forces on each coil when the plasma current suddenly quenches,
a highly probable case for an EPR. It is interesting to note that, for all
cases investigated, the vertical forces for coil numbers 2, 3, 4, 5, 6, 7,
11 and 13 will reverse their directions and coil supports for these coils must
provide support in both directions.
The vertical force on the long solenoid is a body force and little struc-
tural support is needed. The vertical forces on coil numbers 6, 7, S, 10, 11
and 12 will be transferred to the TF coil support cylinder with restraining
rings for repulsive forces, as shown in Figure IV-32. Fortunately, the re-
maining poloidal coils (namely, coil numbers 1, 2, 3, 4, 5, 13 and 14) have
rather weak vertical forces (no greater than 83 * 103 kg/m). Support for
these coils and their cryostat conceptual design is discussed in Section IV-B.
Although the axial compressive stress for an ordinary solenoid is generally
small in comparison with hoop stress, the axial pressure on the poloidal coils
may be quite high because these axial forces result from many coil interactions.
Computations of axial compressive pressure distributions for all poloidal
coils are shown in Figure IV-38. It is seen that most poloidal coils have
small compressive pressures (less than ^ 100 kG/cm2 or 1420 psi) with the
IV-90

FORCE UNITS (10 KG/M)
0 3 4 5 6 7 8 9 10TOROIDAL RADIUS (METER)
II 12
Figure W-36. Vertical Force pur Unit Length During Burn Phase

i o
Coil
£a
3 ?
Coil >
a 0
c
6 0
3
Coil 1
i 5
oil
oo
o
* ia
7.5
1.5|
0.0041
1.2|
0.3|
0.7
7
5*1
6
6*1
3 . 6 J
• •
8.5
7.9
11
1.7
|
8
f
1
>2
>.5Time
23
t
I25
Y
i12
J9.4
I
24
|
216A
11.75
(s)
58
45
f
1
30
21
1
54
120
I
j
430
i
14
49
53
1
49
40
130
81
499
p
o
10. 10
0
| 13G6
0
\ ' \73 f
O
Coil No
, I:
ro
o .
Coll f
No. 14
s §7
110
0
149188
0
'27 1 4 9
3
13 0
18
• , |
| \5 8.5 9.5
Time
1
639
0.03
IT7
i
i28
•
11.75
910
2-26
SE
19
|
3.2
37
i
14
1090
214
14
J
T2f
35
I • 0p
Figure IV-37. Axial Force per Unit Coil Length (103 kg/m)
IV-92

3.59'
3.25
7.57
6.H8T
2.10
COIL !*mR 1
R (M)
r
354
12.0
¥225i
114
p
f19
'19
4
R (M)
CoiLfimtR
t210 .
294
?19
4
48
4
7
t190
1
26
16
314
12.]
210
170
564
F
|
2125
\
5070
I
F
m
1
f2.25
8.30
AXIAL PRESSIK, P(KTI/CH;), AMI VERTICAL FORCE, F(TQKS)
.« COIL U r n s t
7,80
36
30i
1
P
79f
864
20
794'
4
21
734
si
20
i
F
1
\
6180
4
1M70
7,10
7.0E-
6 . 5 -
1.95
R(N)
R(M)
7.25
36
4
63
285
COIL NMER
P37
67
4
305
g
32
78
4
330
4
22
93
4
360
F660
T
2,10
Figure IV-38a. Axial Pressure, P (kg/cmi!) and Vertical Force, F (tons).

6.5 -
5604
6154
590
4
p
5754
6304
605
4
5854
655
4610
4
5904
WO4
620
4
F10720
410960
_j
10650T
4
6.50T
394
874
1554
COIL NIMJ
0
4
81
MO
4
27
4
71
t
130
4
214
684
1254
F555
I
41'I25
I
2525
J1.62 1.77 1,70 R(M) 1.85
7.30'-
6.90
1.75
1.8
0,5•
134
COIL N I M J
P
6.3t
15
11
•
ER 11
17
4
33
38•
274
52*
651
F235
f
t490
j
R (M) 1.90 1.3)
.154
164
124
COIL NUM
PM4
U4
1.0
9ER 12
9.5
4
0,24
20
0,24
15•
42
FIKS
..I"50
j
1R (M) 1.95
Figure IV-38b. Axial Pressure, P (kg/cm2) and Vertical Force, F (tons).

exception of coil numbers 7, s and 9. The maximum compressive stress in coil
numbers 7, 8 and 9 are 240 kg/cm2, 301 kg/era2, and 592 kg/ca2, respectively.
These do not present mechanical problems.
The hoop force, >.r radial force on a current element, Idit, arises from
its interaction with the axial field component, B . This force is given by
dFR = (IdH)Bz = (jdRdZd£.)Bz . (IV-21)
The circumferential tension on the current element is g.iven by
dT = (dFD/dV.) • R = (jdRdZ)R B, , (IV-22)
where R is the radius of curvature of the current element. The tensile
stress, or hoop stress, is given by
(IV'23)
Computation of hoop stresses in a multilayer solenoid is a complicated
problem because the hoop forces on any given turn will depend not only on the
jRB of that turn but also on the interaction body forces resulting from the
other turns pushing on it. The exact solution is further complicated by the
inhomogeneous coil structure. For example, iz is difficult to know exactly
the behavior of insulators mixed among the copper and structural reinforced
material such as stainless steel.
It is proposed (see Section IV-B-6) that the poloidal coils in the EPR
shall have one layer to avoid the high voltage insulation problem. Therefore,
thr hoop stress in any turn is independent of all other turns. The average
hoop stress is given by
\ I Bz , (IV-24)
where R is the mean radius of the turn and B is the axial field component
averaged over the turn cross section.
IV-95

The averaged hoop pressure or magnetic pressure, assuming no body force
interaction from neighboring turns among successive layers, can easily be
shown to be
t \ , (IV-25)
where t is the radial thickness of the turn.
Maximum values of a and a occurs near the maximum B region. The com-
puted a , a , a and a for the poloidal coils are tabulated in Tablet r t max r max r
IV-8. It is interesting to see that coil numbers 6, 7, 10, 11 and 12 have
hoop compression rather than hoop tension. Also note that coil numbers 5,
6, 8, 13 and 14 have high-averaged hoop stress and must have a substantial
amount of reinforcement materials in the winding. The radial magnetic pressures
for all coils are not high and they present no problems at all.5. Coil Stability and Magnet Protection
The superconducting poloidal coils have a large stored energy; thus,
their design must be based on full stabilization. It is expected that the
magnet can be reliably designed and that the magnet can be charged beyond
short sample performance by undergoing current-sharing phenomena. However, it
is important to realize that since the superconducting poloidal coils will be.
charged and dischargel in 2 to 6 s, the problems associated with these coils1
quench are much smaller than those that vould arise if the TF coils quenched.
Therefore, one may argue that, for an EPR, the poloidal coils may be designed
with less stringent requirements on coil stability than the TF coils. For a
commercial reactor, however, the high reliability required of a generating
plant will demand that the poloidal coils shall not quench once in several
years.
The ac magnet cryostatic stability will be more complicated than the dc
magret cryostatic stability. In addition to those considerations discussed
in Section IV-A-9, achieving ac magnet cryostatic stability depends on accurate
knowledge of ac losses in superconductor, matrix, structural materials and in
the helium vessel. It also requires accurate knowledge of strain energy re-
leased if the stress in any material exceeds its elastic limit. The constant
venting of helium gas, the detailed motion of gas bubbling and the effect on
TV-96

Table IV-8. Hoop Stress and Radial Pressure of Poloidal Coils Purina Burn Phase
CoilNo.
1
2
3
4
5
6
7
8
9
10
11
12
13
14
j(A/cm2)
2946
2946
2946
2946
2946
-2946
-2946
-29^6
2640
2640
2640
2640
2640
2640
*Based on
t(m)
0.15
0.15
0.15
0.15
0.15
0.15
0.15
0.15
0.15
0.15
0.15
0.15
0.15
0.15
R(m)
12.07
11.63
8.93
7.18
5.68
2.33
2.18
2.03
1.70
1.78
1.83
1.88
3.88
11.63
Noncooperative single
\(T)
0.012
0.29
0.13
0.39
0.83
2.32
0.12
-2.83
1.41
-2.1.1
-1.20
-1.24
1.38
0.37
turn
t(kpsi)
0.62
14.3
4.9
12.0
19.8
-22.8
- 1.13
24.1
9.1
-14.2
- 8.2
- 8.8
20.3
16.7
model, so
ar
(kpsi)
0.007
0.19
0.08
0.25
0.53
-1.48
-0.08
1.81
0.8
-1.2
-0.68
-0.7.1
0.79
0.21
these values
h max(T)
2.1
2.3
2.4
2.66
3.1
4.14
-4.1
-5.6
4.8
-5.01
-4.32
-3.94
3.62
1 . 69
will have
0
t max(kpsi)
108
114
92
81
75
- 41
37
48
31
- 33.6
- 29.5
- 28
53
74.5
0
r max(kpsi)
1.3
1.5
1.5
1.7
2.0
-2.6
2.6
3.6
2.7
-2.7
-2.5
-2.2
2.1
1.0
large errors.

the heat transfer flux must also be fully understood. The c.ui'. iVr<-e°. ar.,:
stresses are of a dynamic nature. The mechanical disturbances will bo quite
different from that in a dc magnet. The problems of material f.uigut- .ir.d
fracture and their effect on the superconductor current density ar« all im-
portant .
The OH coils are proposed to oscillate with a hoir.opolar iu-n-.-r.itor, and
the EF coils are to be driver, by ?. bridge power supplv. Since both the OH
coils and the EF coils will be charged or discharged in 2 to 6 s, energy will
be returned to the power supply system. Coil protection with dur.pir.>: re-
sistors is not necessary. If r.he OH. coils and F.F coils art- designed wit:. t"i:l:
stabilization or nearly full stabilization, the veiocicv of norrr.ai front
propagation will be negative, zero, or in thf worst case, a tiny positive
value of °- 1 n/s at most. The energy dissipation vithin the coil, in .z tinie
interval of 2 to 6 s, will be negligibly small.
Perhaps the roost critical hazards for the pol' ldul coils ::rc the cuuplini;
effects between the poloidal coils and plasma, a;.d the coupling effects a-o-r.i.
themselves. In the event of a plasma quench, Irrce voltage, currents an^
forces will be induced. The voltage might cause insulation breakdown. The
currents night exceed the poloidal coil critical currents bv a KirRe amount
and the coil current night run avay with a large- velocity of propagation. The
nover supply nay not be capable of handling the l;.reo rover trwster. Those
complicated coupling effects should be fully anal;. t?d.
Other items of rcagnet protection and safety analvsis, as discussc-d i:i
Section IV-A-12, are equally applicable to the poloidal coils protection .me
safety precautions.
6. Cond'ictor Design and Coil Structure
The operational current for both the OH coils and EF coils is 80 kA,
supplied by two parallel &0 kA cables with fully tra"sposed strands. The
OH coils will have 837 turns in t.ich parallel path. The OH coils vill be
cycled by a homopolar generator with peak --oltage of 48 kV across the OH coil
terminals if the OH coils are charged from - 5 T to + 5 T in ? s. The EF
coils will have. 464 turns in each parallel path. The charging voltage will
be around 21 kV across the EF coil terminals. Hence, turn-to-turn voltage
will be about 60 V for the OK coll and about 50 V for the F.F coil. The
IV-' • . • < .

!' is :<•.-,: :\:.:\ :v: It : 2;sv<-:- • i 1-. v - l l r,-t;u;r.- l.ir»:i- ^ a p s Krtv.-t.-r. iks.;.'*"
ri. ~.iirr:.!'i -.u, :. .••> ' — I'1 : : her.: I.:-. :• ~;iv : «• u s c J t c s i ': I t h e i:.;p--
n 1:; l a y e r s , t h e :r.;wx.<-l •'. <v; : \.-,n<-:' v ! '. ". - t i l ' ! ;•.: e p r o b lev.s : cr;;;;s* it :'s
:::••<•:•.• t h a r pir.i.i. I.-:, o r jr.! H -..-IV e x i s t 1:: t h o s e r.::t <_-r ". -.I s •..'her. th-.-
•: ::. .•:.i-rh;i:«i. : h e n - : r<-, ::•.-.• ;.r,-:.. M - J '.•••: . i l s .ir.-.l :.:" . o i l s v : : ! :.-.•
: vit:. .1 sir.^Ic !.tyi-r or-r..i'j. ' •:'. "':.•• v:d':. o:' .:.u ; o:;..:uctor :s l~? c~.
"•;-.i- i : rci^s .in.i •'•:: ct>;!s v:21 rr c •-•'.od Vv ~ro'. bol!;nc at '.2CK .:"i
' ->.::-. prcis'.iri'. :'crl ••oiiinj; is s!r-.r'. >-, irexsc-sivo, ri-liabit- ^."d o.isv :o
. .'titrc'.. A: ove •!'.'., :' •»il: be :;'::.T.T. ir. ':.c- r.tr.t section rhat a raiht-rl Isr.a
•;<-.it trar.sf i-i" :"2 t:x is .sJt-quare t ri-r.cvt- the :'nci;ctor ac Irsses. '.'ndois th
. ir z::r.r,z :-.::c<.-, i':,v hvat transfer :"'. us ccisos to bo an ir-.portant factor ir.
dvZvrr:i::iv.i'. t::t -^-i": stability. V:.c roi; stability vili depend or. the -j.-r.-
,".•: li.ir ! ;:rriT.t di-r.sit> "c-".-:, tr.c a-ount of liquid heiiur. surrouMdine the
.oniiui:; .'r ar.ui the ex'f-r.t of coil disturbances. liovcvcr, it is ir.pcrt.in; ;,'
recognize th.il poc-1 boilir.t; will vork fc.r an ac ~at;net onlv if the heliur.
b'.ibbles, i.hic?; are j-i.T.oratcd at a constant rate, can bo properly ver.tt.-d to
avoid bubble sccunu1 at lor. within the winding. This requirement further
justifies the decision for a single—layer coil.
The iO kA cable can hi achieved by cabling a basic strand of 0.3 rsr.
diameter as shown in Figure IV-39. In the basic strand component, the .step?
to NbTi superconductor ratio is 2 to 1, with the N"bTi cross-sectional area
2.3 • 10" c:r>- , or 1171 filaments with r' •.. filanent diar.eter. For a polbida
coil with a 5 T peak field, the conservative value of NbTi critical current
density is about 117 kA/c^i-'. Therefore, the basic strand shall carry 27 A.
As shown in Figure IV-39, to assure current sharing with a higher Cu/XbTi
ratio, 20 pure copper wires if 0.3 ran diar.e^er were transposed along the 10
conposite strands. High resistivity soft solder is used to solder
IV- " '

BASIC CABLE5T)
LIQUID HELIUM CHANNEL
SPIRAL G 10TURN-TO-TURNINSULATION
oo
20 PURE COPPER WF£( .3MM)FOR CYROSTATIC STABLIZATION10 BASIC SUPERCONCXTINGCOMPOSITES <~3MM 01A 27A@5T)
STRUCTURAL ELEMENT(1.2MM DIA)(S S OR COLD WORKEDCOPPFR)
BASICCABLE
Figure IV-39. 40 KA Cable for Poloidai Coils

together around a central structural-reinforcing element. This raises the
overall Cu/NbTi ratio of the basic cable to 11 to 1. This design offers good
coil stability and good necnanical bonding for each strand with low ac losses
in mind. The composite with a single-conipor.ent stabilizer rather than a
cupronickel and Cu two-coir,i onent stabilizer was chosen because of the rather
poor conductor stability if cupronickel is incorporated. Therefore, as long
as the ac loss is not too great, a conductor with a single-component stabilizer
will be preferred. The basic cable shall carry 270 A at 5 T.
The central element, as illustrated, could be a stainless steel wire of
1.2 mm diameter if the hoop stress is large. For a small hoop stress, the
element may be made of cold-worked copper. The material and size of the
central element shall depend on the coil forces.
The 40 kA cable was finally achieved by transposing 150 basic cables into
a height of 2 basic cables (y 4 am) by a width of 75 basic cables ("•» 150. mm).
The basic cable must be insulated with noraex paper before transposition.
Otherwise, very large coupling eddy currents and ac losses will arise in the
w:'.de cable. Since the stability of the basic cable is built into the sta-
bility of the 40 kA cable, the fact that the basic cable is insulated probably
will have no great effect on the stability of the 40 kA cable.
Finally, the 150 basic cables are banded together with spiral wrapping
wetted fiberglass of 2 mm in thickness.
As shown in Figure IV-40, the poloidal coil is wound with a single layer
wide cable of 40 kA.
The spiral wrapping fiberglass of 2 mm in thickness will provide a
turn-to-turn separation of at least 4 mm for adequate insulation. The width
of the fiberglass is 2 cm and the wrapping pitch is 3 cm so that the liquid
helium channel of 1 cm wide by 0.2 cm deep by 15 cm long will be provided on
both faces of the cable. The bottom supporting plate is machined to have an
inclined surface in the radial direction so that gas venting will move radially
outward. An 0.1 mm nomex paper is used between turns to prevent the bubbles
from rising through the turns. These measures should provide good bubble
venting, separate the gas-liquid flow and allow each turn to see only the
bubbles generated by itself.
IV-101

H
I>-"O
LIQUID HELi 'JM TRANbMH PORT
CURRENT i f ADS POHT -• •
GAS AND LIQUIDMIXTURE OF HFLIUM ,'
I N COOLEL-
LIQUID HELIUM
P0LOI0ALWINDING
LIQUID HELIUMENTRANCEPASSAGE
t t'l AH
OUTER RING—
Figure IV-40. Poloidal Coil Stfuctui-e and its Cryostat Confi«ur,ition

The wrapped fiberglass is expected to be strong enough to transfer the
hoop tension to the external rings, which are sr.ade to assist the hoop tension
of the cable. The inner rings are nade to overcone the hoop compression as
well as to serve ris the bobbin for winding. Many 2 m wide slits are cut in
these rings to allow gas venting and liquid circulation.
The axial compress ive or repulsive forces of every 10 to 15 turns are
supported by a 2-cn thick G-10 or rsicarta plate. This arrangement shall
reduce the accumulation of axial conpressive or repulsive pressures exerting
onto the cable, which otherwise n* •jht short out the basic rabies and deteri-
orate the coil stability.
7. AC Loss Estimation and Refrigeration Requirements
In estimating the ac losses in the poloidal coils, the poloidal coil
numbers 1 through 5 will be classified as Group I because they have about the
same peak field of ? T and same dB/dt of about 0.5 T/s. The poloidal coils
numbered 6 through 8 will be classified as Group II because they have a peak
field of 5.5 T and dB/dt of about 1 T/s. The remaining poloidal coils
(coil numbered 9 through 14) are OH coils a:.d will be called Group III, with
peak field of about 5 T and dB/dt of 5 T/s.
The total conductor length of Group I is 996 >: 106 A-ra and the super-
conductor current density is 1.8 x 1(P A/cni2. Therefore, the amcunt of
superconductor volume is 0.565 tnd. The total conductor length of Group II
is 275 x 10G A-m and the J is 1.0 x 10⁵ A/cm2. The KbTi volume is 0.23 IT.3.c
The Group III conductor length is 847 x 10b A-m and J is about 1.2 x 10⁵
A/cm2. The NbTi volume is 0.87 m3. Assume the 3 group coils all have 5 u
filaments, and recall that Group III superconductor will be subjected to
a cycle of -5 T + + 5 I + -5 T while the Group I and Group II will have a
cycle of 0 •*• B •+ 0. The hystersis losses per cycle will be
Group I, Ef = 14,980 J
Group II, E = 7,870 J
Group III, Ef = 61,920 J
TV-103

For a cycle tine of 75 s, the time-averaged hystersis dissipation Is 1130 W
of which 826 K are lost to the OH coils. Therefore, the OH coils nay require
even smaller superconducting filaments than 5 v«
To estimate the eddy current losses in the matrix, it is easy to see that
the eddy current losses in the basic cable will dominate the eddy current losses
in the composite strand. Therefore, we replace the filanent twisting pitch by
the strand pitch, which is assumed to be 8 nni. The anount of matrix naterial
involved in eddy current losses r.ust include the volume of stabilizer copper
wires. The central stainless steel element will slightly affect the coupling
because its resistivity is 5 x 10"' ->n, probably a factor of 100 larper than
effective transverse resistivity. Let us assume that the high resistivity
solder will affect the transverse resistivitv, c , so that p = 5 * !Q~5 .".-rs;n m
if this is not so, other means such as a cupronickel barrier must be used to
reduce the transverse resistivity. Recall that the Group I and Group II con-
ductors wiM experience a linear fisld rise and fall, namely, 0 •* B -* 0 inmax
a complete cycle, while the Group III conductors will experience a cycle of
- 5 T - > + 5 I - * - 5 T with dB/dt = 5 T/s. The matrix losses per cycle are
given by
Group 1, E = 3,187 J
Sroup II, E = 4,361 Jm
Group III, E = 177,235 Jm
Clearly the matrix losses for the CM coils is large. The cable proposed in the
preceding section should be modified to reduce the matrix transverse resistivity
or changed to a smaller basic cable so that the stranding pitch length can be
reduced. Based on these ac loss estimations, the averaged power dissipation in
the matrix is 2464 W.
The total ac losses averaged over a cycle of 75 s are 3594 W at 4.2°K, re-
quring an input power of 1.17 MW for the liquid helium facility of the poloidal
coil system.
As discussed in the next section, the poloidal coil cryostats are of non-
metallic material with a thin metal barrier ( 5 mills) for preventing helium
permeation. The structural heat conduction loss for the axial force support
was computed to be 331 W for all poloidal coils. The radiation heat load is
IV-Z04
about 80 !•'. Therefore, the grand total refrigeration requirement is 4005 W at
4.2°K or 1.31 MW at I'ton cenperacure.
Finally, let us exasine briefly the cryostatic stability of the OH coils
under the severe ac losses. The total surface area of the OH coil basic cable
is 986 rr. Assume that only 52 of its surface is exposed to liquid helium;
then the surface area is 49.3 rt? or 493,000 en2. The total ac loss per cycle
is 239,155 J. Th^ amount of ac loss is evenly generated in a 4-s pulsing tine
so that the heat transfer per second is
59.789 — 2 " =0.12 W/cn2.493,000 c
It is also easy to show that each basic cable with 20 copper wires is cryo-
statically stable according to the classic full stabilization criterion.
8. Poloidal Coil Cryostat Design
(a) Inner Shell
Figure IV-40 illustrates a cryostat configuration for a poloidal coil. To
reduce eddy current losses to a minimum, an essentially non-conductive inner
shell is required. The illustrated design uses glass-reinforced epoxy, with
an 0.013 cm layer of stainless steel for a helium permeation barrier. The
construction technique consists of fabricating the shell by filament winding
or braiding around the coil as shown in Figure IV-41. The stainless steel
barrier is installed after enough layers are built up to support it. Then
fabrication continues until the required thickness is obtained.
(b) Outer Vacuum Jacket
The outer vacuum jacket is constructed of aluminum alloy.
(c) Insulation
The cryostat is insulated with high vacuum, plus a liquid-nitrogen-cooled
radiation shield of laminated construction to minimize eddy current heating
in the nitrogen shield. Multilayer insulation is used between the outer
vacuum jacket and the nitrogen shield. The multilayer insulation is installed
with the reflective coating in segments to avoid formation of eddy currents in
the insulation layers.
T7-105

o
Figure IV-41. Fiberglass braiding machine for nonmetallic poloidal coil cryostat(courtesy of McDonnell-Douglas Astronautics Company)

(d) Inner Supports
The individual coils are supported internally as illustrated in .Figure IV-40
with low thermal conductivity members. These supports are designed to take
loads in both directions. The high loads per unit length of coil are dis-
tributed between supports by a stiff cryostat inner shell.
(e) External Supports
Support for the magnetic loads on po?oidal coil numbers 1, 2, 3, 4, 5, 13 ,
and 14 are provided by a support "tree" at the top and support columns at the
bottom (see Figure XII-2). Sixteen radial beams are used between the inside
central column and the outermost or coil support column. •
(f) Refrigeration
Refrigeration of the poloidal coil system is by boiling liquid helium at
a nominal one atmosphere pressure as shown in Figure IV-31. The system will be
operated as a refrigerator to recover the refrigeration available in the
helium vapor return.
9. Equilibrium Field Flux Penetration on the Blanket and Shield
The magnetic field from the EF coils must penetrate the blanket and
shield to act on the plasma. The blanket and shield contain much electrically "
conductive material, particularly stainless steel. Eddy currents in this
material would distort the EF and delay its penetration if the blanket and
shield were not sufficiently segmented. As will be shewn below, the blanket
and shield design of 16 segments, each made of 43 blocks, imposes very little
field distortion and delay of penetratio".
Table IV-9 summarizes the results for calculations of the field induced
at the center of the plasma due to the eddy currents in the blanket and
shield. Resuli's are expressed as the ratio of the induced field to the
applied field and as a phase and time delay.
The equations are developed in Appendix F, and the assumptions of the cal-
culations are discussed there.
(a) Unsegmented Blanket and Shield
For the unsegmer.ted blanket and shield, the field can he found by Equation
(IV-26).
W-107

a)
Eddv
\\
\:\
ToroidalSegments
-- 1 •
8
16
3 2
1>\ 64
,{16b
- \
Table IV-9. Induced Field inCurrents in the Segmented or
Blocksper
Segment
, 1.
.. i - i
i
i
i
36 -
Maxiraum;>InducedFieldBin/Bo)
I67%a
42%a
9.3%
2.3%
1.0%
O.«
1.5%
the Plasma Reaion DueSubdivided Blanket and
Phase Delay
-
-
10.5°
2.6°
1.1°
0.7°
1.8*
toShield
Time Delay
-
-
117 n»s
29 ms
12 ms
8 ms
20 ms
Assumptions of model riot Valid for these cases.
v. \ • ^ / \ •- "/Thei 43 blocks per segment in the reference design are represented by 36blocks per segment in the computational model.
f'-v.
inB j/p , (IV-26)
where h - the blanket and shield thickness = 1.30 m
a •* the blanket and shield mean radius = 3.05 m
p
B « the time derivative of the applied field, and is taken to be 3 /2 s
the electrical resistivity; for stainless steel = 0.74 * 10~6 fi-m
Using these values yields
B. - 1.67 Bin o
This result, that the Induced field is l£ir?ei .han the applied field, is
clearly non-physical; in fact the induced fields i.ould induce additional currents
Shat-in turn would produce fields., *.- "iting the net inducad field to a value
. W-108

sufficient to cancel the applied field. However the result does show thatf eddj
current effects are too large, and the blanket and shield must be segmented.
(b) Blanket and Shield Segmented Toroidally
Equation (F-.18) of Appendix F gives the field on axis from a segment of thf
blanket and shield as:
2 - ?.2) T y - * - y.B -Bin ~in ~ 8
h a ry(a* + y 2 - I2) "1 °
K ° In (y + /a* + yz) , (IV-27)° L aVaz + y* I
- ft - yo
where 2£ is the length of the segment and y is the distance along the axis
from the center of the segment to the field point* With 2k equal to the cir-
cumference divided by the number of segments, Equation (IV-27) was used tol find
the field from each segment of a blanket and shield divided into S and into 16
segments. The results are shown in Table IV-9. With 8 segments, the induced
field is found to be large, so large in fact that the assumptions of the cal-
culation do not hold. Even with 16 segments, the resulting induced field
(9.3%) seems uncomfortably large. Such a change in vertical field would lead
to a change in the plasma major radius and would adversely affect other plasoa
'parameters such as current and temperature; it could increase both the major
and minor radii of the plasma enough to bring the plasma onto the first wall.
Although it is conceivable that these eddy currents in the blanket and
shield could actually be used to help stabilize the plasma or that they could
be compensated for by phase shifting the input current to the EF coils, it
seems safest to include adequate segmentation so that these currents are neg-
ligible. Since the blanket/shield region will have to be broken into modular
units for assembly purposes anyway, the concept of insulated segmentation is
compatible with a practical assembly scenario.
In each case in Table IV-9, the induced field is expressed as a percentage
of the applied field, along with the phase delay <$ and time delay, t fGr pene-
tration, calculated by the two following equations:
i> = tan"1 2 B. /£• (IV-28)
and
t = 4>T/TT , (IV-29)
where t is the applicable rise time of 2 s.
57-109

(c) Subdivided Blanket and Shield Represented by a Brick Model
One way of further subdividing is to increase the number of segments to
32, 48 or 64. The results of such segmentation is shown in Table IV-9. Another
way, and the one that has been chosen for the design, is to subdivide each seg-
ment radially and poloidally into blocks. The blanket and shield design, shown
in Figures IX-1 and IX-24, consists of 16 segments, each made up of 43 blocks.
For the purpose of calculating eddy current effects, these 43 blocks are repre-
sented by 36 rectangular bricks, aligned with coordinate axes. The model is
described in Appendix F; Eq. (IV-30) gives the field at a point (x , y , z ) due
t •> eddy current in a brick of dimensions 2a by 2b by 2c.
B. = - -— ~v—, , n B tan l — (1/2 w^ (x z - az + y z - bz) - wH/6j +in. H1T 3. *r D O I WV O O
+ tan"1 jvyo(a2 - X Q
2) + 1/2 v2 (a2 - X Q2 + yQ
2 - b2) + v3yQ + 1/2
+ tan"1 ! U XO ( D
2 " yo2> + 1/2 u2 (b2 - yo
2 + X Q2 - a2) + U 3X Q + 1/2
+ ln(r + u)| wv(bz - yQ2 - 2v2/3) - vyQ(a
2 - X Q2 + 3v2/2) - 1/2 w3y,
+ ln(r + v)| wu(a2 - xo2 - 2u2/3) - wxQ(b
2 - yo2 + 3u2/2) - 1/2 w3x
+ ln(- + w){ uy (u2 + x^2 - a2) + vx (v2 + y 2 - b2) + 2x y (u2 + v2)I O O O O O O I
+ r < uvw/6 + 1/2 x vw + 1/2 y uw + 2x y w J I , (IV-30)w)]-where a is the electrical conductivity, r = (u2 + v2 + w 2 ) 1 ' 2 ; u = x - x
ov = y - >' t w = z - ZQ; and u, v and w are evaluated at their upper and lower
limits + a - x , ± b - y , and ± c - z , respectively.
An array of 16 x 36 = 5?6 rectangular bricks modeled the blanket and shield,
and the field from them was calculated by Equation (IV~30) and summed. The in-
duceu field on the plasma axis varies between 1.46% and 1.59% of the applied
field; this variation is thought to be due. to the rectangular-birick model us-.ed
for the calculation rather than to the subdivided blanket and shield itself.
W-110

An estimate of how the field distortion affects the plasma equilibrium t:;:n25
be made based on the "type B" adiabatic compression algorithms. A 5% decrease
in vertical field would lead to a 2.5% increase in the major radius. A 10% change
in the vertical field would increase both the major and minor plasma radius suf-
ficiently to put the piastre on the outer wall of the vacuum chamber, in the
absence of a limiter.
The induced field level, phase delay and time delay for the subdivided blanket
and shield are felt to be safely small from plasma-physics considerations.
The problem of torques arising from the toroidal field acting on the eddy
currents is discussed in Chapter X.
C. Research and Development Requirements
Many elements of the extensive research and development program that will be
required to support the engineering effort or. EPR superconducting magnet systems
have been identified.
1, Toroidal-Field Coil System
(a) Magnet Stability Study arid Testing Program
In the EPR, there is sufficient winding space to build fully stabilized coils.
However, the stability of even fully stabilized coils is not completely under-
stood at this time. Cooling along the conductor and between th*» adiacent turns
has never been seriously considered in the analysis of stability. Data on normal
front propagistion velocity versus the conductor current density level, the magnet
field and tho associated cooling provisions are generally lacking or unreliable.
An analytical study and a good experimental testing program on conductor stabil-
ity and coil stability must be done before the multimillion dollar TF coil
system is builL.
(b) AC Loss and Pulsed-Field Shielding Study
No matter how one designs them, the vertical field and poloidal field will
interact with the TF coil. They will produce a large ac loss dissipation in
the TF coil system. A technique using normal metal shielding or superconducting
shielding must be developed to provide the basis for a credible shielding design.

(c) Conductor Development Program
If complete shielding cannot be achieved, the matrix loss and the filament
loss of fully stabilized conductors of conventional design are significant.
To reduce these losses, the conductor may have to be made of a cable consisting
of transposed multiple strands. Such a construction would require a development
effort. Aluminum-stabilized conductors must also be evaluated, as it may be
worthwhile to develop such a conductor.
(d) Coil-Forming Modeling
Using copper as the durimy conductor, the coil-forning technique and winding
facility must be developed in preparation for coil fabrication.
(e) Radiation-Panage Testing
Data on radiation-damage effects to the superconductor, stabilizer, insulation
material and structural material at low temperatures nust be available before an
EPR magnet systen is designed and built.
(f) High-Field Magnet Program
In order to obtain high (- 10 T) toroidal fields, two approaches need to be
explored. (1) NbTi can operato at fields of about 10 T with a useful current
density if it is cooled to "- 3°K. NbTi is a strong ductile material, easily
drawn into multifilamentary form tcgether with Cu or Cu + CuNi stabilizers. It
can operate at moderate strain levels (i> 2%). Practical refrigeration schemes
and an understanding of heat transfer must be developed for the temperature
region around 3°K. (2) Nb Sn can, in principle, operate with useful current
densities at higher fields (10 to 16 T) and higher temperatures. Nb Sn cannot
be drawn into multifilamentary form but recently has been put into this form
by drawing Nb filaments in Cu or bronze stabilizers, then diffusing Sn into the
Nb to form Nb Sn filaments. In this form, the matrix-averaged current density
is comparable to NbTi at 3°K. The problem of brittleness remains, and deter-
mination of suitable strain levels for useful conductors must still be made.
A modest level of effort to explore Mb Sn for post-1985 applications is approp-
riate.
2. Ohmic-Heating Coils and Equilibrium-Field Coils
An EPR will have a better chance to produce net electrical power if these
coils are superconducting. Development of both coil systems are vary similar.
IV-112

These coils store a large amount of energy and must be cycled rapidly. This
will require extending the present state-of-the-art of pulsed-superconducting
magnet technology by a considerable amount. This should be started as early
as possible. Modeling vrill be a useful approach. Large and fast charge and
discharge magnets, having stored energies of the order of 100 MJ, need to be
built to study the problems associated with large ac suptrconducting magnets
as soon as possible. A parallel development program on the energy storage and
power supply systems for these magnets nust be started as soon as possible.
The requirements upon the power supply and upon the pulsed superconducting
coils are so interrelated that the development program for the two nust be
closely integrated.
(a) AC Losses of Superconductor
Analytical calculations and experimental measurements of ac losses in super-
conductors must be started as soon as possible to gain the knowledge and collect
the data required for ac magnet design. These should include hysteresis losses,
eddy current losses and self-field losses.
(b) AC Conductor Development
A low-loss cryogenically stable conductor muse be developed because of
tha large stored energy in these coils. Industry must be involved in this
efrort.
(c) High-Curreit AC Cabling and Testing
Industry must be involved in this effort. It requires cable-making fa-
cilities and an experimental program to test ac cable stability and energy
dissipation. A cable must be achieved that has a low .self-field loss, good
heat transfer, good packing factor and adequate mechanical support.
(d) Low AC Loss Cryostats
Low ac loss cryostats must be developed. Preferably these will be non-
metallic with low He permeation.
(e) Heat Transfer Study
Heat transfer must be evaluated for the forced laminar flow and turbulent
flow regimes and for the pool boiling regimes.
1V-113

(f) AC Cryogenic Magnet Stability Study
The results for the previous five areas must be incorporated into an
overall design of the pulsed field coils.
(g) Engineering Model Coil
A model coil should be built on a sufficient scale (" 100 MJ) to test
and evaluate the design concepts evolved. It should be built so that it can
incorporate and test new coil concepts as they are developed.
3. Structural Material Development
There is a general lack of reliable cryogenic data on some of the materials
used in superconducting magnets. In particular, the measurements of mechanical
properties, such as stress and strain under cyclic loading, must be done. Data
on thermal, electrical and mechanical properties of all structural materials
must be available before we can design and build an EPR magnet system.
1. K. P. Jungst, "Rate Dependent Magnetization of Superconducting MagnetConductors in Transverse and Longitudinal Fields," Proceedings of FifthInternational Magnet Technology Conference, Italy (May 1975).
2. J. N. Luton, Jr., "Periodic Reversal of Twist Hardness for Reductionof Longitudinal Pulsed Field Effects," ORNL-TM-5019, Oak Ridge NationalLaboratory, (1975, pp 126-136.
3. W. M. Stacey, Jr., "Tokamak Experimental Power Reactor Studies,"ANL/CTR-75-2, Argonne National Laboratory (June 1975).
4. E. L. Wilson, "Solid Sap, a Static Analysis Program for Three-DimensionalSolid Elements," a report to Denver Mining Research Center, U.S. Dept.of the Interior Bureau of Mines (1971).
5. J. File, R. G. Mills and G. V. Sheffield, "Large Superconducting MagnetDesign for Fusion Reactors," IEEE Transaction on Nuclear Science NS-18,(1971), pp. 277-282.
6. S. S. Shen and J. R. Miller, "Transient Poloidal Field Effects in TwistedMultifilamentary Superconductor for Toroidal Field Windings of Tokamaks,"Proceedings of the Sixth Symposium c Engineering Problems of FusionResearch, (1975), pp. 145-151.
7. W. J. Carr, Jr.. "Parallel Field Losses in Twisted Multifilament Super-conductors," Proceedings ot the Sixth Symposium on Engineering Problemsof Fusion Research, (1975), pp. 152-155.
IV-114

8. M. S. Walker, G. R. Wagner and S. S. Shen, "Losses in Twisted Multi-filament Superconductors in Simulated Poloidal (Parallel) Fields,"Proceedings of the Sixth Symposium on Engineering Problems of FusionResearch, (1975), pp. 156-160.
9. F. R. Fickett, "Resistivity of Polycrystalline Aluminum and Copper inHigh Magnetic Fields: The Effect of Temperature and Purity," Apzl.Pkys. Lett. 1_7, (1975), p. 525.
10. M. G. Benz, "Magnetoresistance of Copper at 4.2CK in Transverse Fieldsup to 100 KG," Appl. Phys., W, (1969), p. 2003.
11. J. de Lounay, R. L. Dolecek and R. T. Webber, "Magnetoresistance ofCopper," J. Phys. Chen. Solids, J-J_, 3 7 (1959).
I? . F. R. Fickett, "Magnetoresistance of Very Pure Polycrystalline Aluminum,"Phys. Rev. B, 3 (1971), p. 1941.
13. J. i'.. Purcell and R. B. Jacobs, "Transverse Magnetoresistance of HighPurity Aluminum," Cryogenics, _3> (1963)., p. 109.
14. R. Stevenson, "Resistance of Transverse Magnetoresistance of High PurityAluminum," Canadian J. of Phys., _45_, (1967), p. 4115.
15. A. Malmoni, "Electrical Resistance of Aluminum of Low Temperatures,"Cryogenics, 3, (June 1962), p. 217.
16. F. Pawlek and D. Regalia, "The Electrical Resistivity of Silver, Copper,Aluminum, and Zinc as a Function of Purity in the Range 4-298°K,"Cryogenics, 6_, (1966), p. 14.
17. V. D. Arp, M. B. Kasen and R. P. Reed, "Magnetic Energy Storage andCryogenic Aluminum Magnets," NBS-Report AFAPL-TR-68-87 (1969).
18. R. W. Boom, private communication.
19. R. Bohn and G. Komarek, "Julich Argus II Race Track Magnets," JointU.S.-U.S.S.R. Status Report, Division 4: Superconducting Magnets,edited by D. Bruce Montgomery, December 1975, Section III-F. (Recoveryflux less than 0.06 W/cm2.)
20. Z. J. J. Stekly, "The Performance of a Large MHD-Type Stable Super-conducting Magnet," Presented at the International Conference on HighMagnetic Fields, Grenolbe, France, September 1966. (Recovery heatflux for singlo layer coil is 2.2 W/cm^ attempted heat recovery heatflux is 0.88 W/cm2 for full coils.)
21. B. J. Haddock, C. N. Carter and C. G. Lewis, "The Effect of InterburnHeat Flow on the Recovery Currents of a Superconducting Magnet: AComparison of Calculated and Measured Values," Cryogenics, J 3_, (1973),p. 337.
22. G. L. Kulcinski, et al., "Wisconsin Tokamak Reactor Design," UWFDM-68,1, Chapter VII, (1974).
IV-115

23. P. T. M. Clee and C. W. Trowbridge, "Design Study of a Tokamak FusionDevice with Superconducting B Coils," RL-73-067, (1973), p. 37.
24. Written by H. Desportes, France, Saclay.
25. H. D. Furth and S. Yoshikawa, "Adiabatic Compression of Tok.-imak Discharges,"Phys. Fluids, U_, (1970), p. 10.
IV-116

CHAPTER V
PLASMA HEATING SYSTEMS
Supplemental heating, in addition to the ohmic heating, will be required
to heat the EPR plasma to ignition temperatures. Current experience dictates
that neutral beam heating be the first choice for this supplement. Extrap-
olation of present D+ sources to higher currents and higher particle energies
needed to penetrate the EPR plasma poses many challenges, primarily because
the D + •+• D° cross section decreases rapidly with energy. Efficient energy
recovery is essential for utilization of these sources, and improvements in
ion composition and grid transparency would have profound impact on the per-
formance of the system and the EPR energy balance. The sizes and requirements
of components loom large in the overall view of the reactor. Development of
D~ sources of good gas efficiency will greatly ameliorate this situation and
lead the way to higher beam energies and greater efficiencies, with dramatically
reduced pumping requirements. Radio-frequency (rf) wave heating appears as an
attractive alternative from the technological point of view since efficient
power sources exist for several heating modes and blanket presentation problems
are reduced. On the other hand, wave heating experiments have not shown the
same success a<j neutral beam heating.
In this chapter, three neutral beam systems are designed. The first,
chosen as the reference design, is based on minor extrapolations beyond presently
achieved results with D + sources, the second is based on improved D + sources and
the third is based on direct-extraction D~ sources. All employ energy recovery,
and the D + injectors select only the D + •* D° component. Beam transport and
neutralizing systems are designed and pumping requirements are explored in
detail.
Radio-frequency source; and launching systems are designed for ion cyclotron
and lower hybrid resonance heating. Because of the lack of adequate power sources
and the uncertainties of high power transmission, electron cyclotron heating
systems have not been designed.
A. Neutral Beam Injector Design
A reference design for an EPR neutral beam injector system was prr-jented in
last year's scoping and project definition study. This design was based on a
V-l

power flow model containing two lumped, effective transport efficiencies
(T and T ) which can account, after the fact, for losses beyond the exit of
the accelerator without specifying the nature of the losses or where they2
occur. The reference designs considered here are based on a new power flow
model which accounts explicitly for all losses in terms of line densities of
gas (along paths traversed by ions and neutrals) and cross sections for
dissociation and charge-changing collisions. A somewhat simplified version
of this model was used in the TETF scoping study.
Three reference designs will be considered. Reference designs 1 and 2
are based on the use of positive deuterium ion sources and assume minor and
major extrapolations, respectively, beyond the present state of the CTR ion
source art. Reference Design 3 is based on the use of direct-extraction
D~ ion sources with dc currenc densities and gas efficiencies comparable to
those assumed for Reference Designs 1 and 2, Development of a D~ source
with these characteristics in time to be of use for KPR would represent
a major breakthrough. Reference Design 3 is presented here, somewhat pre-
maturely in view of the present state-of-the-art, merely to show the potential
advantages of direct extraction D~ sources.
Reference Designs 1 and 2 both call for twelve injectors, with two beam
lines per injector, to provide 60 Mlv of 180 keV D° beam. Each bean line will
have a positive ion source and accelerator, followed by a double-focusing
bending magnet, a neutralizer for the atomic ions and a second bending magnet
to remove atomic ions from the beam emerging from the neutralizer. Direct
energy convertors will be used to recover energy from the molecular and atomic
ions removed by the first and second separator magnets. Thermal energy
recovery will also be used to increase the overall injector efficiency. The
two neutral beams from each injector will converge toward a 0.75 m diameter
aperture in the first wall of the torus at angles of 10° above and 10° below
the horizontal median plane of the torus.
D~ ions can be injected directly into neuf —.21zers with 100% efficiency.
They can also be injected after going through L bending magnet to eliminate
line-of-sight neutron bombardment of the ion source; in this case, there
will be a loss of several per cent due to premature neutralization even with
pumping speeds several times higher than in the casa of straight-line injection.
V-2
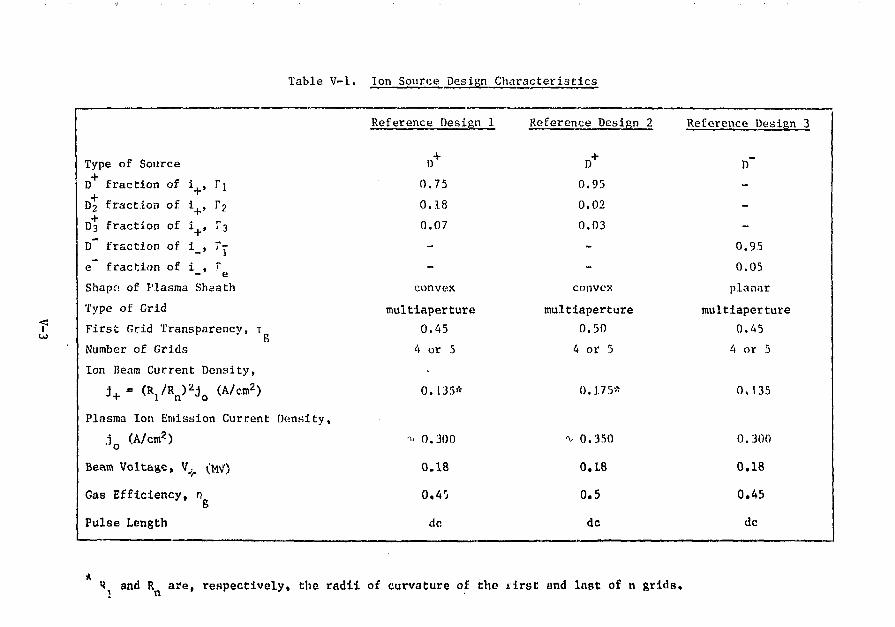
Table V-l. Ion Source Design Characteristics
Type of Source
D fraction of 1+, Tj
D2 fraction of i , T2
D3 fraction of i , T3
D~ fraction of i_, Vj
e fract-.ion of i_, r
Shapo of Plasma Sheath
Type of Grid
First Grid Transparency, t
Number of Grids
Ion Beam Current Density,
Plasma Ion Emission Current Density,
.io (A/cm2)
Beam Voltage, V_, (MV)
Gas Efficiency, n
Pulse Length
Reference Design 1
D+
0.75
0.18
0.07
-
-
convex
multiaperture
0.45
4 or 5
•
0.135*
->< 0.300
0.18
0.4rj
dc
Reference Design 2
D+
0.95
0.02
0.03
-
-
convex
multiaperture
0.50
4 or 5
0.175*
^ 0.350
0.18
0.5
dc
Reference Design 3
D~
-
-
-
0.95
0.05
planar
multiaperture
0.45
4 or 5
0.135
0.300
0.18
0.45
dc
and R are, respectively, the radii of curvature of the xirst and last of n grids.

We shall consider only straight-line injection at this time. A bending magnet
and a direct convertor will be used after the neutralizer.
1. Ion Sources
The design characteristics of the ion sources for the three reference
designs are given in Table V-i. The assumed positive ion beam composition
for Reference Design 1 is typical of present-day LBL ion sources. Water-
cooled multiaperture grids capable of dc operation will be of the type
developed at ORNL. For the positive ion sources, circular apertures will
be used in preference to slots so that the horizontal and vertical emittances
will be identical. This will simplify the design of the double focusing
magnet used to remove molecular ions from the beam entering the neutralizer
and to focus the atomic ion and neutral beams. As a matter of convenience^
circular apertures will also be assumed for the D sources.
For the D~" sources of Reference Design 3, only the simplest case of
a planar plasma sheath and axially aligned apertures will be considered
at this time. For the positive ion sources of Reference Designs 1 and 2,
curved grids will be used in the source and accelerator to produce a con-
vex plasma sheath and a diverging icn bsam. The first, double-focusing
bending magnet will convert the D+ component of this diverging beam into
a converging beam which goes through a waist before it reaches the first
wall of the torus. The location of the waist and the beam si2e at the
first wall are determined by the initial beam divergence.
To minimize the neutralizer gas load, the neutralizer will be tapered
to follow the converging positive and neutral beams. Some results of
a study of the effects of initial beam size and divergence on the beam
size at the neutralizer entrance and exit and at the firost wall of the
torus will be presented in the next section. The results apply to Reference
Design 1.
Neutral ard ion beam current requirements per source are given by
*o = V H s = V V + N s e < l u i v - A <v-x>
Wsx+ = I+/Ng = A (v-2)
V-4

VV-Nsi = I /N = A <V"3>
- s -it a -it a1O ° 0 1
where 1 , 1 , and I are total beam currents; N is the number of ion sources;
PD is the total neutral beam power; V, and V are ion beam voltages; e_ is
the reactor capture efficiency for neutral beam; T is the atomic fraction of
ij ; f and f- are the oower efficiencies for D •*• D° and D~ -»• D°, respec-+ 10 _ 10 +
tively; e + x0 is the fraction of the D beam that reaches the neutralizes
the remainder (1-e + 1 0) being lost due to premature neutralization along a
curved path while traversing a gas target of thickness IT atoms/cm2; e " *"
is the fraction of the D° beam that reaches the reactor plasma, the remainder
being lost due to reionization in a gas target of thickness IT atoms/cm2; olc
is the electron capture cross section (cm2/atom) and ci, is the electron loss
cross section (cm2/atom). The definitions for e ~ 1 0 and c-,, are analogousto those for e + a n d a . For the straight-line injection case of Reference
Design 3, e ~ 1 0 = 1.00. In terms of average pressure, p (torr), path length,
?.(m), and gas temperature, T(°K), the thickness of a gas target is given by
IT = 1.94 x 10²¹ "pJl/T atoms/cm2 ^V"4^
2. Atomic Ion and Neutral Beam Transport for Reference Designs 1 and 2
A preliminary beam line design* is shown in Figure V-l. M-l is a double
focusing magnet for D+, with field index n - (R/B)dB/dR = 1/2, bending radius
R = 1.5 m and bending angle 8 *~ 90°. For a 180 keV D + "Beam, the gap field
is B = 575 gr iss; field variation with R is given by B * B (R/R ) ~ .O o o
The diverging ion beam from the accelerator is assumed to be axially sym-
metric. Beam transport calculations for motions of atomic ions and neutrals in
the transverse phase space (x,x';y,y') have been made for several values of
eu^ttance e = e = e . e is determined by initial beam size 2 r and by thex y o max
* We are indebted to T. K. Khoe of the Accelerator Research Facilities Division,ANL, for the design of M-l and the formulation of the beam transport equations.
V-5

SOURCE PLUSACCELERATOR
Figure V-l. Preliminary Beam Line Resign. Ro is the Bending Radius, 9 is vhe BendingAngle in M-l. For 180 keV I)+, the Gap Field 3Q « 375 Gauss in tf-1.
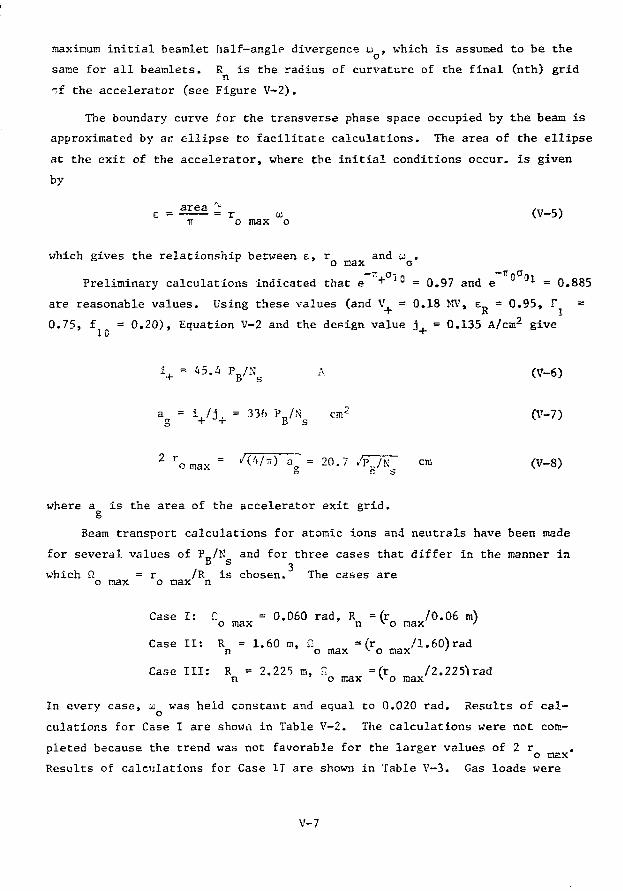
maximum initial beamlet half-angle divergence u , which is assumed to be the
same for all beamlets. R is the radius of curvature of the final (nth) gridn
->f the accelerator (see Figure V-2).
The boundary curve for the transverse phase space occupied by the beam is
approximated by ar ellipse to facilitate calculations. The area of the ellipse
at the exit of the accelerator, where tbe initial conditions occur, is given
by
area "" ,„ rsz = = r u (V-5)ir o max o
which gives the relationship between e, r and u .
Preliminary calculations indicated that e '+ l0 = 0.97 and e ° 3i = 0.885
are reasonable values. Using these values (and V = 0.18 MV, e = 0.95, T =
0.75, f = 0.20), Equation V-2 and the design value j = 0.135 A/cm2 give
i + = 45.A Pg/Ns A (V-6)
a^ = i +/j + = 336 PB/N's cm2 (Y-7)
o max = /(4/TT) a = 20.7 /P,./N cm (v-8)
where a is the area of the accelerator exit grid.
Beam transport calculations for atomic ions and neutrals have been made
for several values of P_/N and for three cases that differ in the manner inB s 3
which £2 = r /R is chosen. The cases areo max o max n
Case I: C = 0.060 rad, R = (r /0.06 m)o max n v o max '
Case II: R = 1.60 m, f. ={r /1.60)radn o max v o max '
Case III: R = 2.225 m, H =(r /2.225^radn o max *> o nax
In every case, io was held constant and equal to 0.020 rad. Results of cal-
culations for Case I are shown in Table V-2. The calculations were not coin-
Dieted because the trend was not favorable for the larger values of 2 ro max
Results of calculations for Case II are shown in 'fable V-3. Gas loads were
V-7
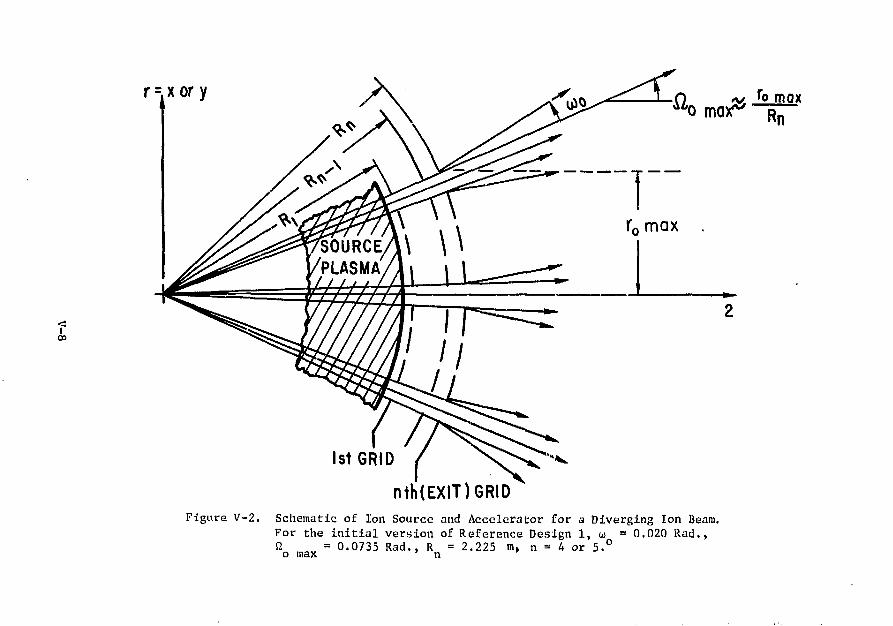
r = x or y
<00
1st GRID
nth(EXIT) GRIDFigure V-2. Schematic of Ion Source and Accelerator for a Diverging Ion Beam.
For the initial version of Reference Design 1, w = 0.020 Rad.,^o max = O i 0 7 3 5 R a d l' R = 2.225 m, n = A or 5.°
max

Table V-2. Results of Calculations for 1) and D° Ik-am Transport and Neutralizer Gas Loads.Cast- T. •., = 0.020 rail; . = 0.060 rnd; R Variable (Refe-rence Design 1)
(Mis')
40/48
40/32
40/24
60/24
80/24
(60/48)
(80/48)
(80/32)
(A)
37.
56.
75.
114
151
9
8
7
2romaxOn)
.189
.231
.267
.327
.378
'omax(met)
. 060
. 060
. 060
.060
.060
Rn
(m)
1.580
1.925
2.225
2.725
3.150
Sw(m)
6.10
4.91
4.24
3.52
3. 12
2rw
(m)
.182
.147
. 1 37
.127
. 122
2r0.3 2r4.3(m) (m)
Not Calculated
Because of Un-
favorable
Trend in
"r10.7
-r10.7On)
.268
.393
.521
.751
.951
qN(Torr-t/s)
Not
cause of
nqN (1-n)flN
(Torr-t/s) (Tori-e/s)
Calculated Be-
Unfavorable Trend in
-r10.7
N = ni imhi- r o f s o u r c
i , - i o n b e a m p e r s m n v e
2 r = I n i t i a l b e a m s i z e
om ix ~ i n i t i a l l / 2 - a n j ; l e b eam i l lvercence
.() = maximum initial 1/2-.iii);lc beamlctdlv
R " r . ' i i l i u s o f i i i r v . i l n i e n f n t h ( e x i t )Vri (I
S ( j = ( l i i . t a t H ' e , m a ; ; i n ' t e x i t t o b e a m w a i s t
2r = beam size at s = 0.3m (neutrali;'.erentrance
2r. ,, = beam size at s = 4.3 m (neutralizer^' exit)
2r.(. . = beam size at s = 10.7m (1st wall oftorus
c| = jvm load per neu t r a l i KIT
uq =» f r a c t i o n of qN to Oliamber 1
( l - . t ) ' | N = I r a c l l o n of <jN to Chamber 11
2r - beam HJZI- at w.ilstw
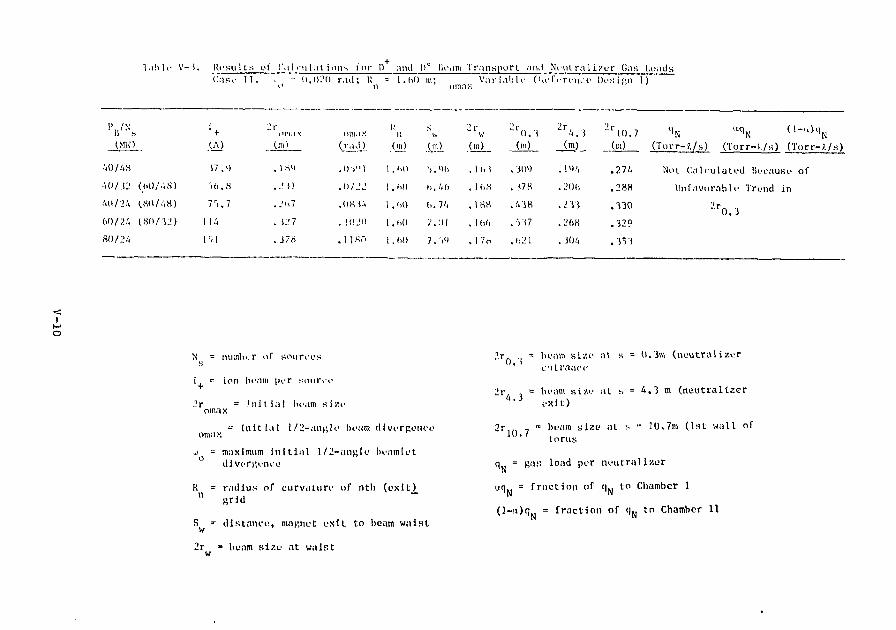
<:i
1 ah 11- V- i. Resu l t s of C.i 1 r-u lal inns fur 1) ami D° IKMIII Transpor t an»l N r u t r a l i y c r Gas LoadsCasi' 11. • - O.IK'O rail; K = 1. hO m; Var iab le (kr IV relief IH'sif," 1)
i> n ulllilX
OIK) _(A)
4O/4K }7.')
40/.i:1 (dO/.'.S) 5(,.H
4O/L>4 (.80/48) 7 r . .7
(.0/2-'. (80/3;!) I |.',
-~
Nw " ' w " ' ( ) . 1 " r / ( . ' » " r | 0 . 7 <!N a q N ( 1 " " ) c l N
I'i'I (J"I_ ('") (m) (m) _Cr_orr-l'./s) (Torr-t./s) (Turr-f./s)
.OKt'i l.i,() (,.7/. .1HK ,,VJ8 ,2'i'J
. ! ( ! . . ' ( ) [ , ( , ( | j r . ; i | . | M , _ < • , • ) 7 ^ j f t j j
-27-'. Not CnU-ulalod Ik-cnuso of
.288 Uiif.-worabn- TruMid in
.330 ; ' r
N = ninnbi r of sourci'ii,s
i - ion beam per scml'ee
2r = .'ni t ial beam sizeomax
- i n i t i a l 1/2-ani'K' beam <livercoiu'tomax f
j ~ maximum i n i t i a l l /2 -anj ; ie beamlut
hcam si;:o at s = 0.3m (nvutralizer
R = radius of curvnturi1 of nth (exit.),
S »•• diHtanci1, magnet uxit to beam waistw
0, t
i>r, , = beam sizi- at s = 4.3 m (neutrallzor•/,. 3 exit)
2r,,, , = bfam size at s = 10.7m (1st wall of10-7 torus
q = |>as load JKT neutrali?.er
aqN = fraction of qN to Chamber 1
(l-u)t|N = fraction of (|N to Chamber 11
2r a beam size at waistw

not calculated because the neutralizer sizes were too large to be of interest.
For Case 111 (Table V-4), neutralizer sizes and gas loads are reasonable but
not necessarily optimized.
To ' vessure distribution in the tapered neutralizer, the
length, L divided into ten equal segments of length AJl = 0.4 m
(see Figure v-j/. For each segment, an average conductance was calculated by
using the value of wall radius at the midsection of the segment in the ex-
pression for the conductance of a tube of radius, r (m), and length* SL (n)»
c = 2.609 x io6 j- l/s (V-9)
The pressures p were then calculated in terms of a and q (Figure V-3) by
using the expressions
1Ob J co.4n-o.2)], n * 5
* 5
For n = 5, the two expressions for p /q.T may be equated and solved for a.
n N
For 180 keV D+, the neutralizer target thickness at 293°K for a power
efficiency f = 0.95 F (F is the equilibrium neutral fraction) is ir =
4.3 x 10¹⁶ atoms/cm2. With this value of TT, Equation V-4 gives a neutralizer
line density of 6.5 * 10~3 Torr-m. Numerical integration using the values of
p /q given by Equations V-10 and V-ll, with a known value of a, gives
Lq f (- ) dl = q * const = 6.5 x 10~3 Torr-£
0 qN
or (V-12)
3
d l
Case III, Table V-4, with P = 60 tM and N = 24 ion sources (in twelve
injectors) was chosen as the initial Reference Design 1. The final design,
obtained by iteration, will be discussed in Section V-6.
V-ll

T a b l e V - 4 . R e s u l t s o f C a l c u l a t i o n s f o r I) a m i D° Beam T r a n s p o r t a n d N e u t r a l i z e r ( Ian L o a d s
C a s e T I T . . = 0 . 0 2 0 r a d ; K = 2 . 2 2 5 m; V a r i a b l e ( R e f e r e n c e D e s ij;i> T To n o m a x
P B / N . s
(MW)
40/48
40/32
40/24
60/24
80/24
(60/48)
(80/48)
(80/32)
j+
(A)
37.9
56.8
75.7
114
15'
2rouiax
(m)
. I8<J
. 2 3 1
. 2 6 7
. 3 2 7
. 3 78
'oma:-;(rad)
.0423
.0514
.0600
.0735
.0849
Rn
(m)
2. 225
2.225
2.225
2.225
2.225
SV
(m)
3.70
4.05
4.24
4.44
4.49
2rw
(m)
. 1 12
.13 5
. 137
. 1 34
. 152
' r 0 . 3(in)
.236
. 290
.337
,4 14
. 4 79
- r 4 . 3(m)
. 136
. 1 36
. 137
.140
.153
2 r 10 .7(m)
.423
.474
.501
.605
.691
Cl'orr-f/.s)
«. 34
10.7
14.7
2 3.3
34. 5
(Torr-J./s)
5.65
7.96
11.5
19.3
29.0
(Tor r -v / s )
2.69
2.76
3.20
4.00
5.50
I(-•
1-0
N = number of sources
i = ion beam per source
2r = initial beam sizeomnx
= initial 1/2-angle beam divergenceomax
a) = maximum initial 1/2-ani'Ie beamletdiver(;once
R = radius of curvature of nth (exit)
" grid
S = distance, magnet exit to beam waistw
2r = beam size at waistw
2r _ = beam s i ze .-it s = 0. im (ik'Utral j zer
entrance
2r, ^ = lieam s i ze a t s = 4.3 in (neutral i ze r4.3
i-xit)
2r.( - = beam size at s = 10.7m (1st wall of
torus
<i = gas load per neutralize'!'
uq = fraction of t] to Chamber 1
(l"^)qN = fraction of qN to Chamber 11
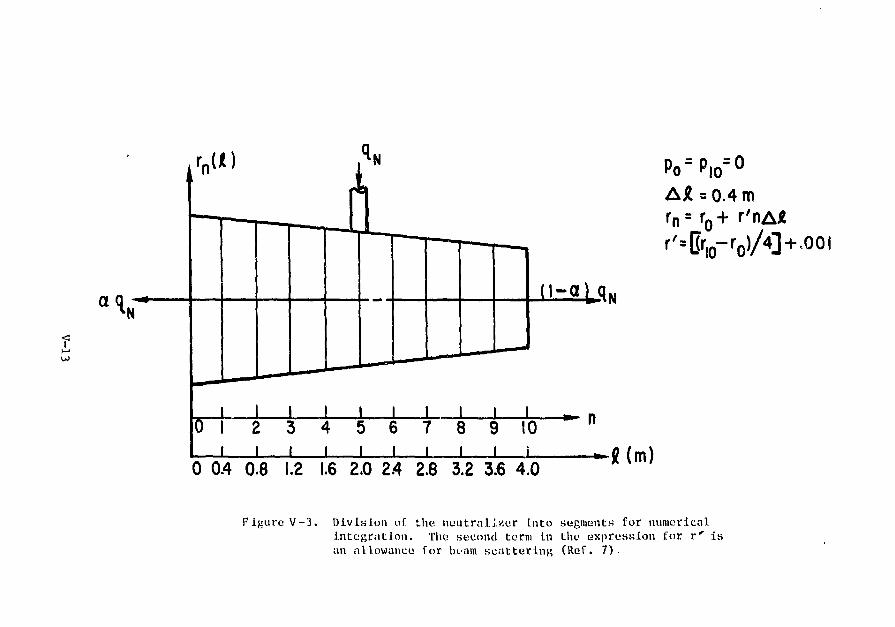
M
Po = P|0= °
rn= ro+
2 3 4 5 6 7 8 9 10
0 0.4 0.8 1.2 1.6 2.0 2.4 2.8 3.2 3.6 4.0—JMm)
Figure V-3. Division of the neutralizur into segments for numericalintegration. The second term In the expression for r' isan allowance for boam .scattering (Kef. 7).
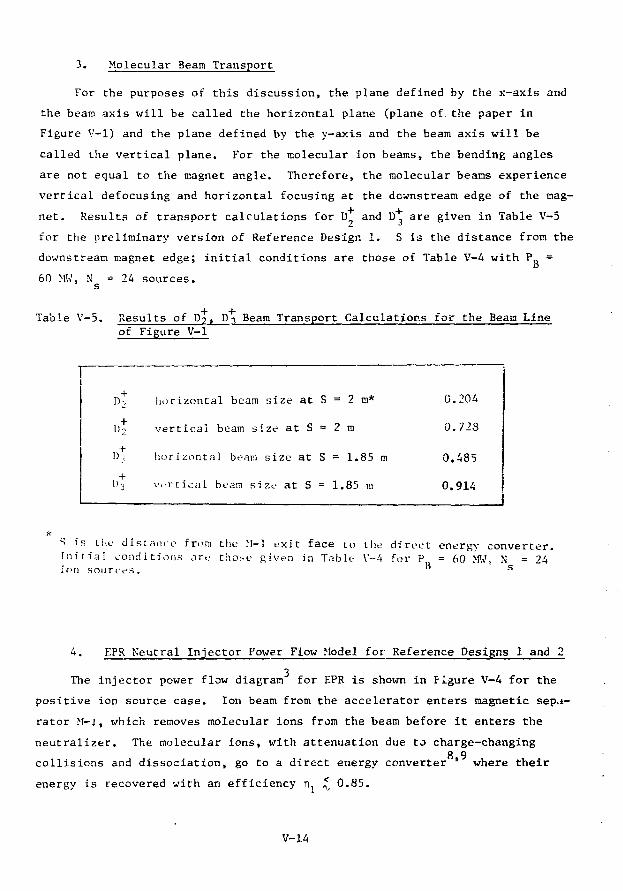
3. Molecular Beam Transport
For the purposes of this discussion, the plane defined by the x-axis and
the beam axis will be called the horizontal plane (plane of. the paper in
Figure V-l) and the plane defined by the y-axis and the beam axis will be
called the vertical plane. For the molecular ion beams, the bending angles
are not equal to the magnet angle. Therefore, the molecular beans experience
vertical defocusing and horizontal focusing at the downstream edge of the mag-
net. Results of transport calculations for D9 and D* are given in Table V-5
for the preliminary version of Reference Design 1. S is the distance from the
downstream magnet edge; initial conditions are those of Table V-4 with P =
60 MW, N = 24 sources.
Table V-5. Results of D?, D^ Beam Transport Calculations for the Beam Lineof Figure V-l
nt
»t»t»t
horizontal beam
vertical beam si
horizontal beam
size at
ze at S
size at
v.-rtical beam size at S
S
=
S
=
=
2
=
1.
2
in
1.
85
m*
85 m
m
0.204
0.723
0.485
0.914
S is the distance from the M-l exit face to the direct energy converter.Initial conditions are those Riven in Table V-4 for P = 60 MW. N = 24ion sources.
4. EPR Neutral Injector I'ower Flow Model for Reference Designs 1 and 2
The injector power flow diagram for EPR is shown in Figure V-4 for the
positive ion source case. Ion beam from the accelerator enters magnetic sepa-
rator M-j., which removes molecular ions from the beam before it enters the
neutralizer. The molecular ions, with attenuation due to charge-changingQ Q
collisions and dissociation, go to a direct energy converter ' where their
energy is recovered with an efficiency n. £ 0.85.
V-14

Electrical
Energy
Recovery
•>
14-
E l e c t r i c o
R e c o v e r
1 E n e r g y
i kk Pt "
P R
l~0 > 9 5 f rOoo" 'F"oo) r P *
1.2
Ion SourcePlus
AcceleratorM - I
-ir.
N c u t r a l i z e r M-2r P f e ° O l f ti + R io
r P F . eI + I"©
I k - I ) P L
(.rP.ln i t
THERMAL ENERGY RECOVERY, 7)3
V - 4 . I'-l'H i n j o r - t o r p o w e r f l o w d i.ij.',r.-im. ' i s ;i y,;\:i
ch. i r5 ' , t ' - ' ' l i . ' in i - , i >W, i u l I i s i n i i s o f d i s s o c I a t !<ui .
t l i i i - k n o s s (,i l o m s / c m ' ) f o r
<\ ] . i r o o I iM- i r it-;i 1 I M U ' C R V r e -
c o v e r y i11 f i <• i c n e U ' K C. 0 . 8 ' i ) . n •} i s i l i c L l u r m . i l c n . - r c v r e c o v e f v i - f f i r I I M I C V ( c . 0 . 3 0 ) ,1= <).l>'; = p n w i T i - f f i c i c n e v f o r D"1'

A number of cross sections for charge-changing collisions and dissocia-
tion appear in Figure V-4. The summations nay be written out for 90 keV
hydrog^-i particles and then used for the corresponding 180 keV deuterium
particles:
, = -„ + 1/2 (-,. + o,,+) (V-13)
(V-14)
Values for all of the cross sections, measured for 90 keV hydrogen par-
ticles, are given in Table V-6. The values of c^Q and aQ1 in the table are
averages of several values compiled by S. K. Allison and M. Garcia Munoz.
Table V-c. Cross Sections for Charge Changing Collisions and Dissociationfor QQ keV Hvdrogen and 180 keV Deuterium Particles
Par tic le
40 keV H or H or etmiva-lent (cm'/atom)
.90 keV H or equivalent(cm~/atom)
90 keV Up or equivalent(err /molecule)
<K) keV H or equivalent(cnr /molecule)
Cross
I ~ 1 0 =
'Cl =
ClD =22
1 \\
Sections
1.5 x 10⁻¹⁷
5.7 x 10"17
2.3 r. 10"le
1.6 x 10~17
4.1 x 10"16
6.0 x 10~17
2.15 x 10~le
7.3 x 10~ls
2.4 x 10"16
2.25 x 10"1&
1.0 x 10"16
iReference
10
10
11
12
13
13
13
13
13
13
13
i
V-16

5. Injector Gas Flow Diagram
The gas flow diagram for EPR is shown in Figure V-5. The various gas
loads are defined in Table V-7. Neutral injector gas loads per injector (2
beam lines) for the preliminary reference design of Table V-4 with Pn = 60 MW
and N = 24 ion sources are given in Table V-8. The fractional beam losses,
1 - e 1" and 1 - e "*, depend on the pressure distributions in Chambers
I and II of Figure V-5. The pumping speed in the region of M-l will be con-
ductance-limited to a value that will not permit arbitrary reduction in prsesu
and beam loss for a given gas load.
A crude estimate of the conductance of M-l can be obtained by noting that
all of the gas from the accelerator, q , and the neutralizer, aq,,, enters a
volume bounded by the exit plane of the accelerator and the neutralizer, the
surfaces defined by the polepieces, extended to meet t'/.e exit planes, and the
surface defined by the curved magnet edges, extended to meet the exit planes.
The gas leaves this volume through the unobscured fraction of the bounding- sur-
face, which is maximized by using an open "C" type magnet rather than a window-
frame type. The area of this fraction is estimated to be roughly 5.0 n 2 for
the M-l design of Figure V-l. For deuterium, the room temperature conductance
of this area considered as an aperture is C = 1.6 x 10⁶ l/s. For a Chamber I
pumping speed of S l/s, the effective, conductance-limited pumping speed, S,
in the M-l region is given by
T - h + k- <v-15)
Values for the effective speed, S, and the crynpanel area, AT, required
to give a pumping speed, S , are given in Table V-9 for several values of S .P P
Fractional losses of D+, D* and D* are also given. The pressures pT and p ,
the average Chamber I pressure and the average pressure in the M-l region, are
given byPI = qi/Sp = 1 0 1- 4 / S
p
PM - <qout + aqN)/S + Pj = 36.8/S
and
where the numerical values are from Table V-8.
V-17

• S i
1
'?:
Y ':~:L^,~1
r'
::_
Jj
L - j
-i
1
-
-
§
_
int
3
—
-
—
a
*
?
—
. .
i
- •
c.)•
()
II
=
• j ;
(,'•
-
_
>
j
r:
—
=
+ "• -— G
I.It
L
—
fOS
- -
1;"
>
—
II
I .1
—
•2
•z
E
—
\
T
w
=
-
X
-
—
_
i -
r
Ull
z.
•o
"1
'J1
• - '
X
-
1—
1
O
k
,ii •
f
T
.X
t
"E
a:
—
+
f)'()
o
C
t;
c
"7*
>
+
i
X
zX
'•£.
• -
• " '
2,
O
w
x;
w
5
Iw
l^
0
S
•s.
X
ki
0
—'
u*"*
•J:
"i
c
E
M1;
—
• ,
ar1-< •
ir
£ ?S '—'
• < X
5 sc
<
is
+—
-r
r z
it
3 x
V-18

Table V-8. Neutral Injector Gas Loads (per Injector) for the Design ofTable V-4 with P = 60 MIJ and Ng = 24 Ion Sources (in Twelve
Injectors
Chamber I Gas(Torr-*./s)
2qout
2qio
2q2
2q3
2 t t%
q (totalload)
Loads
63.5
34.9
0.487
17.3
10.1
38.6
101.4
Chamber II Gas(Torr-i/s)
zqio*
2q0l
2q_
2 (l-a)qK
q (totalload)
Loads
12.6
0.362
^ 0.0
8.0
21.1
2 q. is not part of the Chamber I gaa load but is included here becauseit is used to calculate 2 q. (see Table V-7).
V-19

>in
JL
f
Chamber I
.(1 - «) qN
Chamber II
Figure V--5. Gas flow diagram for EPR. The various gas loadsare defined in Table V-7.
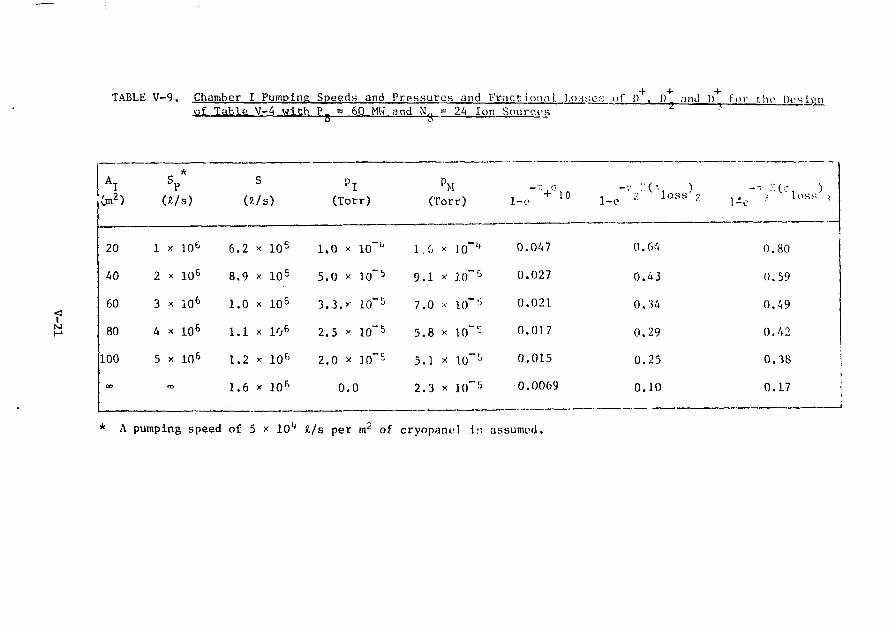
TABLE V-9. Chamber I Pumping Speeds and Pressures and Fractional. Losses of D . 1) and i) for ihp DesignTable V-4 with P. = 60 MW and N' = 24 Ion Sourc.t>s
a 6
fI-1
ATOn2)
20
40
60
80
100
00
1
2
3
4
5
SP
U/
X
X
X
X
X
m
*
106
106
1 0 f e
106
106
sU/s)
6.2 x
8.9 x
1.0 x
1.1 x
1.2 x
1.6 x
105
105
105
10 6
106
106
pICTorr)
1.0
5.0
3.3.
2.5
2.0
0
x 10~"
x 10" 5
>• 10-5
x 10" 5
x 10" S
.0
PM(Torr)
1.6
9.1
7.0
5.8
5.1
2.3
x 10~ '*
x j* o"
x 10"'
x If) J
x 10"-
x 10" r
l-e
0.047
0.027
0.021
0.017
0.015
0.0069
::(••>, )
> l o s s •
(1.64
0.4 3
0.34
0.29
0.25
0.10
l-eloss i
0.80
0.59
0.49
0.42
0.38
0.17
* A pumping speed of 5 * 101* £/s per m2 of cryopanul Is assumed.

The line densities used to calculate the fractional losses of Table V-9
are given by
J(p dl) + = * j MP M + ftjlPl, j = 1, 2, 3 (V-18)
where H is the path length for D. through the region where the average pres-
sure is p and X. is the path length through a region where the average
pressure is p_. For the design of Figure V-l, S. = 3.00 m, «._„ = 3.63 m,
«-M = 4.47 m, JJ.j = 0.0 3i, «„_ = 2.0 m and £ „ = 1.85 in.
Values of eryopanel area A ^ required to give a pumping speed S and a
pressure p in Chamber II are given in Table V-10. Approximate fractional
losses of D° due to reionization and of D + due to neutralization in M-2 or
in the region between M-2 and the direct converter are also given. For the
design of Figure V-6, the line density used to calculate the fractional loss
of D° is given by
J(p dl>no = 2.0 P l I + 4.4 (pM_2 + p D U C T) + 0.3
We approxiinate the average pressure over the path through M-2 and the duct by
( P H + 1'torus)
to obtain
/(p dl) Q * 4.2 P l I + 2.5 p t o r u s < 4.2 x 21/Sp + 5 x 10"6, (V-21Q l I t o r u s Sp
where use has been made of Table V-8 and the fact that p % 2 x 10~6 Torrtortfs
(sefc Section VII-A).
Beam transport calculations for D through M-2 to the direct converter
(Figure V-6) have not yet been done but the line density of the gas over this
path is not expected to exceed (or reach) 6 p .. Torr-m and this value has
be<jn used to calculate the values of 1 - e + 1 0 shown in Table V-10.
V-22

t
Figure V-6. Neutralizer—Plasma Portions of the Beam linos forReference Designs 1 and 2 and Preliminary Layouts ofthe Direct Convertors and Magnetic Separators in Chamber I I .

6. Final Reference Design 1
For reasonable values of AT (60 m2) and A (40 m 2 j , the calculated losses
1 - e V+°10 and 1 - e ° 01, of Tables V-9 and V-10, are less than the values
assumed to obtain the starting conditions of Equations V-6, V-7 and V-8. A—IT. a. _
new set of starting conditions was obtained by using the values e lu =
e *° 01 - 0.98, P_ - 60 MW and N - 24 ion sources in Equation V-2, with alla S
other factors as before. The final version of Reference Design 1 is summarized
in Table V-ll, which also summarizes two other designs to be described later*
TABLE V-10. Chamber IT Pumping Speeds and pressures and Fractional Losses ofD° and D + for the Design of Table V-4 with P = 60 MW and N =24 Ton Sources.
An(m2)
20
40
60
80
100
* A
*
P
1 x io«
2 x io s
3 x io£
4 x i o 6
5 x 10^
pumping speed of 5
2 .
1 .
7 .
5 .
4 .
x 104 '
(Torr)
1 x
05
0 x
2 x
A/s
10-5
x 10"5
10"6
10"6
io - 6
per m2 of
-ir a1-e ° 0 1
0.035
0.018
0.013
0.010
0.0087
cryopanel is
*- ir+ o
< 0.012
< 0.0062
< 0.0042
< 0.0032
< 0.0025
assumed.
7. Reference Design 2
Reference Design 1 is based on minor extrapolations beyond the present
state of the art for ion sources. It may be expected that significant advances
will have been made before the freeze date for the EPR neutral injector design.
Reference Design 2 is based on the assumption that major advances beyond the
present state of the art will result in a source with the design characteristics
listed in Table V-l. R & D efforts aimed at achieving characteristics similar
to those of Table V-l are currently under way at a number of CTR ion source
laboratories.
V-24
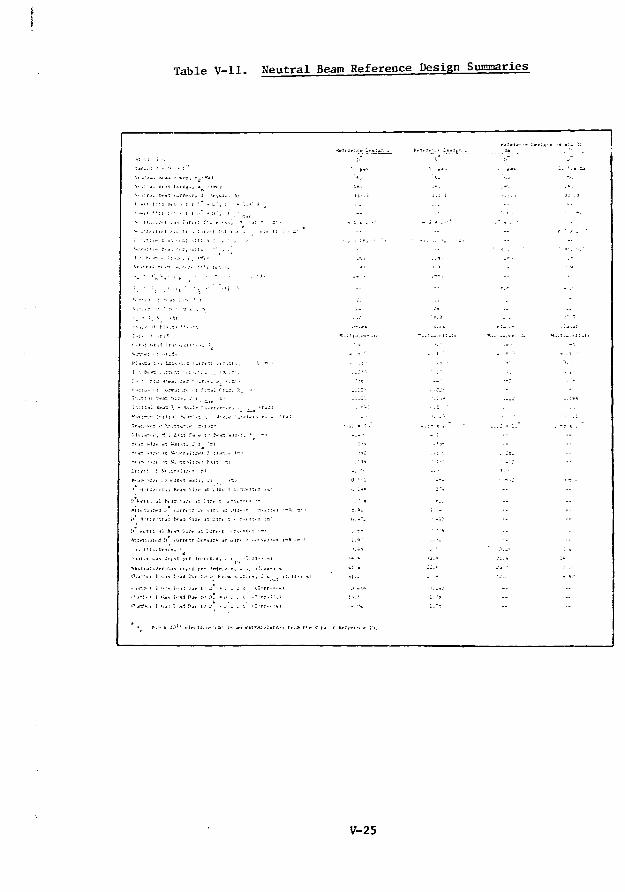
Table V-ll. Neutral Beam Reference Design Summaries
V-25

Table V- l l . Neutral Beam Reference Design Summaries (cont 'd)
V-26

or
Reference Design 2 is summarized in Tabie V-ll.
8. Overall Injector Efficiency
The overall neutral injector efficiency is given by
V ( k p+ - V (v-22)
PB / P+ENI - Ic - I IV < V 2 3 >
where P is power of the ion beam emerging from the accelerator, k P is the
power required to produce and accelerate the ion beam and P_ = P.. + P., + ?
is the total power recovered (electrical and thermal). Given the ion beam
voltage and composition (Table V-l), and the calculated values 0.95 F =)J3.2i
F- ^ 0.0, and the assumed values k = 1.1 and e,, = 0.95» and the fractionalIco K
losses of Tables V-9 and V-10 (or similar ones for other designs), P_/P, canR +
be read of£ of Figure V-4.
Values of the components of fractional recovered power are given in
Table V-12 for Reference Designs 1 and 2 as functions of TI -, n and n , the
energy recovery efficiencies. For EPR, reasonable values- for the efficienciei
are n, = r\. = 0.85 and n = 0.30. With these values, the results shown in
Table V-13 are obtained for the ion beam power recovery efficiencies, Pc/P,»
and the overall neutral injector efficiencies, eNj. A breakdown into power
recovered electrically and power recovered thermally is given in Table V-14.
Also given are k P+, P I p s and £jpS; PTp S
i s t n e external power furnished by
the injector power supply (IPS) and e is the efficiency with which P-rpS
is converted into neutral beam power.
9. Reference Design 3
The potential advantages of direct-extraction D ion sources were dis-
cussed in last year's scoping and project-definition study. As was noted in
Reference 1, a direct-extraction D ion source suitable for use in a neutral
beam injector does not presently exist. In view of the present state of the
art, Reference Design 3 is based on long-term optimism rather than short-term
expectations.
V-27

Table V-12. Values of the Components of Fractional Recovered Power in the Power Flow Diagram of i'igure V-Afor Reference Designs 1 and 2 with V, = 0.18 MV'
Component ofFractional Recovered Power
. e
- T T aP . , / P , = ( 0 . 8 r e 1 0 )
R + l
k - 1
i - E r,
-no - I T a+ +[0.8 r e
- T I a - n o[0.19 r (l-e ° 0 1)e + 1
P R / P+3
Value of Componc-tii:
Reference Design 1 Reference Design 1(Preliminary) (Final)
0.153 n
0.570 n
0.100 n
0.119 n
0.012 n
0.016 n
0.247 n
0.160 n1
0.585 n
0.100
0.104 n
0.0059 n
0.0025 n3
0.212 n
Reference Design 2
0.037
0.752 n
0.
0.
100 r
0221
3
n3
negligible
0
0
0018
124
n3
a. Use has been made of the calculated values 0.95 F « 0.20 and F- ^ 0.0. It is assumed that k =» 1.1Ofti lie
and e_ • 0.95. Z. in e'^j j is an abbreviation for Z(o. , ) . ; for j = 1, t, = o .K J J.OSH j J 10

Table V-13. Calculated Values of Ion Beam
Efficiency, P,_K
for Reference
n = 0-3 and k
Reference Design
1,
1,
2,
Preliminary
Final
Final
/P , and Overal
Designs 1 and 2
= 1.1.
P IVR' +
0.69
0.70
0.71
Power, P^
1 Neutral
with P_ =ii
P+ (MW
493
441
338
, Ion Beam Power Recovery
Injector
60 HW, r
)
Efficiency, £KT>
"VI
0.30
0.34
0-45
Table V-14. Values of P., k P., P__ . , .aDesigns 1 and 2
1,2, V and £Tr)C for Reference
Reference Design
1, Preliminary
1, Final
2, Final
p +
(MW)
493
441
338
k P+
(MW)
542
485
372
(MW)
3G3
279
227
"3
(MK)
36.50
28.05
12.60
IPS
(MK)
239
206
145
IPS
0.25
0.29
0.41
P,, is the total power recovered electrically; PTDO = k P - P is theRl,2 I P S + Rl,2external power furnished by the injector power supply (IPS); e
IPSP /P
IPSis the efficiency with which PTPS is converted Itit? v.evt-ral beam power; n.
n2 = 0.85; n = 0.30 and k =« 1.1.
V-29
The power flow diagram for Reference Design 3, shown in Figure V-7, is
an obvious extension of the flow diagram of Figure V-4. The required ion beam-7T_ar-n
per source is given by Equation V-3, with e iu = 1.00 for the straight-line
injection case of Reference Design 3; for this case,
VV-Nsi_ = — CV-24)
cD r- f- e" 0 01
The power efficiency f_ for D •*• D goes through a maximum as the target
thickness is varied through an optimum value. ' D'Yackhov gives an ex-
pression for (f_ ) :10 m a X o_ + 0_
10 11
K oi \ To—T—)10 11'
_ — O11 01
(V-25)
The maximum occurs for an optimum target thickness
TT = in (o_ + o_ )/c (V-26)opt a- + o_ - a 10 n oi
10 11 01
Values of a , a- and o_ are given in Table V-6. As noted earlier,
o was obtained by averaging tabular data compiled in Reference 10. The
value of a- is an extrapolation of graphical data compiled in Reference 11.1 0
The value of a is a graphical extrapolation by Tawara and Russek of data
they bv.ve compiled in Reference 12. With these values for the cross sections,
Equations V-25 and V-26, give (f_ ) ^ 0.60 and ir ^ 7.7 x 10 1 5 afr>ms/cm2.
This value of TT in Equation V-4 gives a neutralizer line density of 1.2 x
10~3 Torr-m at 293°K.
The value (f_ ) ^0.60 is for a gas target. For 100 to 400 keV H~1 0 ITLciX
(equivalent to 200 to 800 keV D~), the measured value of (f_ ) in a lithium2 o max
plasma target is *v 0.82; at lower energies (down to at least 100 keV for H~}
or 200 keV for D~) theoretical considerations suggest that the value should
be slightly higher.'
A brief study has been made of two versions of Reference Design 3. Both
versions (3a and 3b) start with a direct-extraction D ion source whose assumed
V-30

kP.-PR
Electricol EnergyRecovery, 77
kP. Ion Source
PlusAccelerator
(k-l)P_
P_Neutralizer
.*•(MIO)rTP..-*-°T.
P_ M-2= r TR T
(.-fT0)r.P_(..;
Heat Sink
REACT0R
1'igurc V- / . I'owur MOW uiagrani ror RUILTUHC.I; UCHIISH J .

Idesign characteriscics are given in Table V-l. In design 3a, carried through
in some detail, neutralization occurs in a gas target, with an efficiency of
^ 60%. In design 3b, neutralization occurs in a lithium plasma target with
an efficiency of "v 82%; the plasma target has not yet been considered in
detail but, obviously, it should be located at the waist of an initially con-
verging beam. To avoid straight-forward but tedious calculations for which
there will be ample time while direct-extraction D~ sources suitable for use
in neutral beam injectors are being developed, beam focusing has not been
considered for these preliminary designs, which may therefore be considered
as worst—case designs.
A preliminary D~ be=»tn line design is shown in Figurr. V-8. The accelerator
and the D gas neutralizer are separated by a 1.5 m pulping gap to reduce the
pressure in the accelerating gaps and thus to l Luiaize beam energy spread due
to premature neutralization and grid loading due to ionization of gas in the
accelerator. To minimize the neutralizer gas load, the neutralizer is tapered
to follow the beam, which is diverging, due to finite emittance, froia a waist
located at the exit of the accelerator. The neutralizer pressure distribution
and gas load were obtained by numerical integration as in the case of Reference
Design 1 but with specified, finite entrance and exit pressures of 1 x 10"**
and 1 x 10"5 Torr, respectively.
Reference Designs 3a and 3b are summarized in Table V-ll. The choice of
six injectors with two ion sources per ir.jector represents an attempt to mini- .
mize the number of injectors while holding the puinping requirements per in-
jector within reasonable bounds,
10. Overall Injector Efficiency as a Function of Beam Energy
Neutral beam injector designs for EFR call for beam energies of 180 keV.
Higher beam energies may be required to insure adequate penetration. For
optimum target thickness, the neutral fraction and, hence, the power effi-
ciency associated with the neutralization process D -*• D° in D gas decreases2 -j g
from ^ 20% at 200 keV to less than 1% at 600 keV {see Figure V-9). Over
the same energy range and for optimum target thickness, the efficiency associ-
ated with the stripping process D •+ D° is essentially constant with a value
of ^ 60% for a D gas target; for a lithium vapor target, the efficiency is#v< 65% and for a lithium plasma target it is > 80%. Thus, there is a strong
V-32

00
1
Ion SourcePlusAccelerate)
Figure V-8. Preliminary layout of D~ beam line forReference Design 3-a.

.2. 0.8 h
.'•sets
•'&
$3
I
Lithium Plasma Target
10 20 50 100 200
eW/j (keV/Oeuteron)
500 1000
Figure V-9. Maximum Power Efficiencies for the Neutralization ProcessesD~ •* D° and Dj •* D°, j •• 1, 2, .3 as Funccions of Energy perDeuteron. Solid Curves are froni Reference 18, The Dashed Curveis a Conservative Extrapolation from Data Measured at HigherEquivalent Deuteron Energies for H~-»- H° (Reference 17).
incentive for the development of direct-extraction D~ sources with dc current
densities and gas efficiencies comparable to those obtained with present-day
D sources.
Reference Designs 1, 2, 3a and 3b are summarized in Table V-ll. Theabeat
energy is limited to 180 keV in each case. For Reference Designs 1 and 2,
this choice was influenced by the rapid decrease in neutralization efficiency
and the consequent loss in overall injector efficiency with increasing beam
energy. For the preliminary designs 3" and 3b, the decision to use the same
energy as for the other designs was arbitrary. Given the virtual constancy
of the neutralization efficiency with energy for D~ •*• D°, a higher energy- (for
a given beam power) means a lower ion bean current, a smaller bean dianeter
and a smaller neutralizer bore; smaller gas loads, lower pressures, smaller
beam losses and a higher overall neutral injector efficiency followl
11. Injector Mechanical Design Description
Several layouts were prepared to utilize the limited space available for
coupling the neutral beam injector apparatus with the reactor. Limited space
between the TF coils as well as the requirement for sufficient shielding to
protect the colls from plasma neutrons severely limit the number of acceptable
arrangements for the neutral beam injectors (see Figure V-10). In addition,
the rather large volume of the injector apparatus and its associated vacuum
pumping systems was one of the prime factors influencing design of the reactor
facility as well as of the injector itself. Twelve neutral beam injectors
are shown in Figure V-10 in four groups of three injectors. Alternate groups
are aimed clockwise or counterclockwise to conserve overall system momentum.
Two additional neutral beam injectors may be added later in place of two radio
frequency units if desired.
The neutral beam injector is shown in Figure V-ll. Two beam lines mojintet
in the same vertical plane aim at a 0.75 m diameter first wall aperture. The
included angle between the beam linen is 20°. Each beam line consists of the
ion source, M-l magnet and neutralizer. There is a common M-2 magnet for both
lines. Each magnet has a collector converter for energy recovery.-. Both beam
line components are mounted in a single vacuum chamber 9 m L x 7 m H x 4 r a W .
The inner wall of the chamber is lined completely with cryosorption panels
( 250 m2 total cryosorption surface). These panels can. supply 125 m^ of con-
tinuous pumping while the remaining 125 m"- are being regenerated. The injector
chamber is joined to the reactor vaciium charnber by a i> 3.75 m long duct. The
•• » ' " f = " • ''°= •' ' < -V

f
Figure V-10. ANI. Experimental Power ReactorPlan V lew
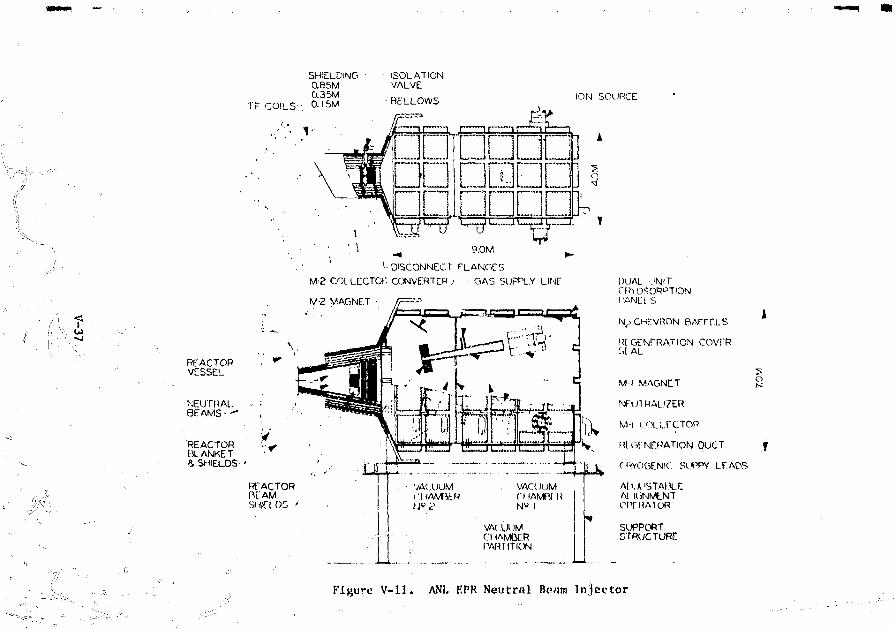
fCO
SHIELDING0.85M0.35M
TF COILS-. 0.15M
REACTORVESSEL
NEUTRAL.SEAMS - - *
REACTORBLANKET4 SHIELDS
ISOLATIONVALVE
• BELLOWS ION SOURCE
RFACTORnrAMS)CI OS '
• • l £ =
DEDDHIDDDt
l - o I L - — ' ^
] '
9.OM
'••DISCONNECT TLANGES
M-2 COL LECTOR CONVERTER / GAS SUPPLY LINF
M-2 MAGNET
VA(,UUMCl (AMREH
VACUUMf :i IAMBI HN« I
VA(.UUM
PARTITION
DUAL 'JNITfRYOSORPTIONPANELS
N> CHEVRON BAFFELS
REGENfRATION COVfRC.6AL
M l MAGNET
NFUTHAL.7ER
M-i COI.LXCTOR
F*( GrNCRATlON DUCT
rRYOGENIC Sl.iPPY LEADS
o
Al IGNMLNTOIYHA1OR
SUPPORTSTRUCTURE
Figure V-ll. ANL EPR Neutral Beam Injector

duct is fitted with a double ported isolation valve, a bellows section to
accommodate differential expansion and two remote disconnect flanges. The
inner surface of the duct is designed in a similar fashion as the first wall
and requires separately cooled low Z coated panels. Special shielding completely
surrounds the duct and extends over portions of the injector housing (de-
scribed in Chapter IX). Three specially formed pieces of shielding are located
within the injector to reduce some of the direct plasma radiation streaming.
Liquid nitrogen cooled chevron baffles are used as radiation shields to further
reduce the heat load on the liquid helium cooled cryosorption panels.
The neutral beam injector design features a series of remotely adjustable
alignment mechanisms for positioning the large chamber and aiming the beams.
Each of the twelve units weighs between 150 and 250 :onnes and is equipped
to be remotely handled.
B. Radio Frequency Heating of EPR
The plasma startup studies, Chapter I1I-B, have concluded that from 40
to 60 MW of supplementary heating power will be required to reach ignition
operating temperature in EPR. Presently, the most favored candidate to
supply the supplementary heating is high energy neutral beam injection, and
radio frequency (rf) wave heating is considered as a backup option. Neutral
beam injection theoretically and experimentally has been shown to be a very
effective supplementary heating method. However, a great deal of development
and extrapolation of existing sources is required to reach the level required
for efficient heating in EPR. In contrast, rf heating has been what may be
called moderately successful both theoretically and experimentally.
However very little development and extrapolation of existing or planned
source?, .s required to provide the rf power needed to reach ignition in EPR.
In addition, rf heating has the advantage that by varying the frequency or
mode, the radial heat deposition profile in the plasyna can be con-
trolled. RF heating may also be used to enhance neutral beam injection by
25tuning the rf to resonate with the injected neutral beam particles. =
The proper role of rf heating, and the optimum mixture of rf and neutral
beam heating in EPR awaits the results of experiments planned on present and
future large devices such as PLT, PDX, TFTR. JET 2nd T-20. EPR is being
planned to take ad-yantage of advances, as they occur, in the state of the •
V-38

art of rf plasma heating. The neutral beam Injection ports are designed with-
out conpromising their performance so as to function alternately as rf input
ports. In addition, four sectors (sections between TF coils) that are not
used for neutral beam pcrts are designed incorporating rf heating ports. They
allow the installation of 25 MW of rf heating power. The use of six additional
ports will provide the capability of delivering 60 MW to the plasma.
Currently, the most promising modes for rf heating are ion cyclotron
resonance heating (ICRH), first harmonic ICRH, lower-hybrid resonance heating
(LHRH) and electron cyclotron resonance heating (ECRH). Of the nodes des-
cribed above, ICRH and LHRH are most favored at this titae because the high
power tubes and modulators exist to build the rf power system required for
EPR at conversion efficiencies of from 50 to 157..
A program exists to develop a high power, 200 kW C.W. tube at 120 GHz26
for ECRH in EBT-II. However, the research and development program does
not promise to deliver a tube until about 1980. The overall dc to rf power
efficiency of the system will be about 25%.considering an estimated con-
version efficiency for the tube of 30% and 0.2 db/ro as the attenuation
coefficient of the oversized transmission waveguide. A more realistic value
is about 20%. \CRH is considered only briefly in this section of the reporti
because it requires breadkthfoughs in both tube technology and rf power trans-
mission systems to be competitive. It presently remains a future promising
mode of rf supplemental heating. Present estimates areLthat it will not be
as efficient as the others from the point of view of conversion efficiency.
If successful, however, it promises the capability of supplying the heating
power through a number of small openings in the first wall. A total aper^.
ture opening in the first wall of only a few square meters is required for27
60 MW of supplemental heating. The power can be beamed-in much the same
as in the neutral beam injection technique with the added advantage that it
can make sharp bends.
Of the three modes described above, LHRH is most favorable for EPR be-
cause it will be possible to launchi "the electromagnetic heating wave into
the plasma through the opening of a waveguide^ a "Grill" waveguide struc-28 ^
ture, or some yet t£>ls determined antenna system. The LHRH wave launcherwill simply be inserted iiuo the port from the outside. It will not be
V-39

necessary to make any electrical connection inside the first wall. This will
greatly facilitate the installation and maintenance of the launcher since
it will not be necessary to work inside the first wall with its high residual
radiation level. In contrast for the case of ICRH, a loop will probably be
required inside the first wall. The loop must make electrical and cooling
water connections to the first wall far removed from the injection port. Con-
sideration of the expected residual radiation levels requires that this be
accomplished remotely.
1. Lower Hybrid Resonance Heating
29 30A number of authors ' have shown that the lower-hybrid resonance
layer is accessible only for waves with a sufficiently large parallel refrac-
tive index, n)(, i.e. parallel to magnetic field, given by
n n - k B c / « > (1 + 0,^/^)1/2
where to and u are respectively the electron plasma and cyclotron frequencies.pe ce 31 32
More recently, Troyan and Perkins, and Bers have shown the existence of an
upper bound on n.( of about two for the EPR conditions. The above relationships
demonstrate that a rather narrow spectrum of waves must be generated by the
wave launcher to achieve penetration. A method of launching a slow wave is
required. A possible method for launching such a narrow spectrun is an array
of phased waveguides, the "Grill", first proposed by Braabilla.The "Grill" structure has been selected as the launcher for LHRH heating
28 33for the EPR reference design. It is the most advanced theoretically *• and
34experimentally. The launcher is shown in Figure V-12. It consists of 16
narrow-height WR1150 waveguides forming a reactangular array, 8 waveguides
wide by 2 waveguides high. The narrow dimension is in the direction of the
toroidal magnetic field. The array is 0.638 m high by 0.585 m wide,including
a water-cooling jacket. As it leaves the blanket and shield area it makes
a right angle bend downward. See Figure V-13 for details of the H-plane bend.
The "Grill" is made of stainless steel avid coated with beryllium to reduce
the waveguide attenuation and impurity level due to sputtering. In order to
reduce the probability of electrical breakdown in the waveguide feed section
and physically separate the high power klystron feed section from the "Grill",
a ceramic dielectric window is placed in the bend, as shown in Figure V-14,
between, the high-power klystron and the "Grill".
V-40

I
Uu
1
V-41

o
s-oa
S3•a£13
1
C
~n~".'i
— —
y
_-_ ,.*
a)
CO• H
V-42

H-PLANiE BEND
WAVEGUiDE VACUUMPUMP-OUT CHAMBER
BLANKET & SHIELD
VACUUM FLANGE
VACUUM PUIVP PORT— HIGH VOLTAGE MODULATOR
WAVEGUIDE TUNING SECTION
WAVEGUIDE / "GRILL"CERAMIC WINDOW SECTION
HIGH POWER KLYSTRON500 KW C.W.

Ceramic windows (Al 0 , BeO or some "other" radiation-hardened dielectric
material) are placed in the shadow of the reactor shielding to prevent as much
as possible the large fluxes of neutrons, gamma rays and ions expected in EPR
from reaching the window. The limited data available indicates that radiation
seriously degrades the electrical insulating properties of ceramics (see
Appendix E). The experiments performed to date are for low radiation fluences
and do not indicate what permanent changes in the electrical properties may
occur at high damage levels. The thermophysical properties of ceramics, such
as thermal conductivity and specific heat, can be significantly degraded by
radiation (see Appendix E). Thermal gradients and the associated stresses
are likely to increase as these properties change with irradiation. Indeed,
the limited data available indicates that further research is required in
this area. Insulators that will be able to withstand the particle fluxes in
EPR and larger devices will likely be developed in the future.
In addition, in order to further reduce the probability of breakdown in
the "Grill", a large vacuum box is built around the waveguides in the vertical
leg of the bend, Figure V-13. In this area, the waveguides are physically
separated to allow efficient vacuum pumping and routing of the waveguides to
individual power sources located below the reactor floor, see Figure V-14.
With 30 half-inch diameter holes along the narrow dimension of each of the
waveguides, a pressure of 10~6 Torr is achieved at the window with one
10,000 l/s pump at "turn-on" of the rf, for details refet to Chapter VII-C.
2. LHRH RF Power Source
A high-power C.W. klystron has been selected as the source for LHRH.
The tube will be similar in design to the X3070 and the X3075 klystrons
produced by Varian Associates. The above tubes are 500 kW C.W. tubes at 2.4
and 2.1 GHz respectively with conversion efficiency of about 50% and gain of
about 58 db. High power C.W. tubes with conversion efficiencies as high as
60% have been developed. Because the LHRH frequency of EPR is different from
the above tubes, a program is envisioned for developed of a klystron for EPR.
Furthermore, in order to avoid a resonance inside the plasma and achieve opti-
mum coupling, a pump frequency, f , 1.4 times the lower-hybrid frequency,
° 35has been selected for the reference design. The tube would be 500 kW C.W.
with a conversion efficiency of 60% and gain of 58 db at either 1120 MHz
at 8 T maximum TF coil field and 1190 MHz at 10 T.
V-44

Each waveguide of the array is fed by a separate 500 kW C.W. klystron
located below the reactor floor. Figure V-15 contains a block diagram of
the high power source and low power drive train for a "Grill". Because it
is necessary to adjust the phase of the waveguides relative to each other,
each klystron has a separate drive train amplifier and phase shifter. Each
of the klystrons and individual drive trains is excited from a coranon low
power signal generator or source. The design of the drive train and signal
source is completely conventional and will present no problem in EP?..
The system will be fully integrated so that in case of the detection oi
high VSWR or arc in the waveguide the rf drive and the high voltage dc modu-
lator will be disabled within a few us to protect the klystrons and wave-
guide/"Grill" windows. In this connection, the drive train contains direc-
tional couplers for monitoring VSWR, photo-type arc detectors looking at the
high power klystron window and rf pin-diode modulators to turn off the rf
within a few JJS in case of a fault.
The high voltage dc power supply for the klystrcrs is of conventional
design. It will be located far removed from the klystrons, A design has
been selected in which a set of four adjacent klystrons are fed from a com-
mon 64.5 kV, 51 amp, 3.3 MW dc power supply. The power supply is described
in Chapter VI-E. The primary power feed is from the superconducting energy
storage inductor system as is the case with neutral beams. The power supplj
voltage will be adjustable from 8 kV to 64.5 kV. The power supply will be
fully protected for safety of operating personnel. A crowbar circuit is
also included it: the design to protect the klystron in case of an electrical
fault. A total of four power supply units (13 MW) is required for each I'SChi
In the event of failure of one of the units, the system will operate at 75%
of capacity. This will allow operation of the reactor while or until the
unit is repaired.
The dc voltage will be fed to the klystron through either a switch tube
modulator or floating deck type modulator. The modulator will allow control
of the rf duty cycle of the kylstrons. The "on" time of the klystron and rf
heating depends, of course, on the energy required for ignition and the in-
stalled rf heating power. The EPR design could require as much as 324 MJ.
Assuming that a minimum of four "Grills" (25 MW) are installed in EPR, the
V-45

I4--
SIGNALSOURCE
ATTENUATOR
LOW LEVEL*" -r l Amp J rsi
PiNSWITCH
OIREC1IONCOUPLER
ATTENUATOR [ /v,' 'PHASE
SHIFTER
HIGH POUERKLYSTRON
Amp >* m
OIRECTIONCOUPLER
HIGHPOKERTUNER
- * - T O "GRILL"
HIGH VOLTAGEMODULATOR
DC PO*ERSUPPLY6*5 kV
51 A
1
DC POWERSUPPLYC4S kV
M A
CHANNELS 2 THRU IG SAME AS CHANNEL 1
Figure V-15. A block diagram of the high power source and low power drive train;•• for a "Grill"
DC PO*ERSUPPLY64 5 kV
j l A
i
DC POWERSUPPLY(4,5 kV
51 A

heating pulse duration will be 12.9 s. If ten units were installed, 60 MW,
the pulse duration would be about 5.4 s. The rf heating duty cycle is 3.7.2!
for 25 MW and 7.2% for 60 MW using 75 s as the reference cycle.
The overall dc to rf power efficiency of LHRH is 48%, without thermal
recovery, assuming a transmission efficiency of the "Grill" of 90% (957. has24
been achieved in a four-across waveguide "Grill" by Bernabei )» 60% as the
conversion efficiency of the klysitron and 0.5 db as the insertion loss v£ tl
waveguide transmission system. The use of four "Grills" will allow thedHrai
mission of 25 K.J to the plasma. If all ports were used for LHRH, 100 KW of
rf heating could be supplied to the plasma. The. system is designed to ££, C.
so that, if required, power could be supplied continuously to the plasmainfej:
the burn, :
3. Ion Cyclotron Resonance Heating (ICRH)
ICRH is considered ;o be an option to LHRH in EFR. The high-powens^ab<
modulators and transmission system exist to supply the supplemental heating
requirements of EPR- However, the rf heating wave launcher; is not veryr«£ti
tivc since it will probably require a loop, a section of; a loop or a eocfcf, ii
side the first wall surrounding the plasma. As such, it will function as a
limiter and must be designed to take the first wall loading of EPR. In
addition, it may adversely effect confinement because of impurity^puttjstinj
The-loop will probably need to be surrounded by a Faraday cage to reducs:-el<
trostatic field levels. It may also require an insulator between it and tht
first wall and plasma to prevent electrical breakdown. However, if a sixihit
to the materials problem exists, then fast-wave ICRH, at twice ICR freqiu/snc;
promit.es to be an efficient heating t&ithod of EPR. An overall efficieiffcy o:
about 64% is expected, i.e., rf power into the plasma from the loop divided
the total dc power input tp the final amplifier. Ifjj the materials problem
can be solved, it may be ppg.sible to launch the ICRH from a dielectric ^adi
waveguide array.
Two quarter section loops (1/4 turn) have been selected as the launches
for ICRH for the 3PR reference design. Similar designs have been success-
fully used on the ST tokamak and have been proposed for PLT. figure V-16
,-47

QUARTER TURN LOOP(TOP)
QUARTER TURN LOOP(BOTTOM)
I00
VACUUM PUMP-OUTCHAMBER
VACUUM PUMP-OUT PORT
CERAMIC WINDOW
COAXIAL FLANGES (TYRCAL)
— -fj \- 30.5 CM DIA COAXIAL CABLE, 50 J\
COAXIAL TUNING STUBS
; ^ — DIRECTIONAL COUPLERS(PORTS)
Figure V-16. Details of the loops and power feed system of ICRHfor a port

shows details of the loops and power feed system. The loops are watmtoob
and make both electrical and cooling water connection to the first wail a
the top and bottom of :he torus. The loop is located midway between iijhe;t
wall and minor radius of the plasma. In this design the loops are mafle o
stainless steel and coated with beryllium to reduce high-Z sputteringiey T
are fed from below through an rf dielectric window and bend arrangement b
two 30.5 cm diameter watsr-cooled coaxial cables each carrying 3.1 MW:S>f
power. If four ports are implemented with ICRH, it will be possible tiansS-
mit 25 MW to the plasma.
The final amplifiers for each port cf ICRH in EPR are convention^EUo
Eimax X2170 ceramic/metal, water cooled, power tetrode with 650 kW anode
dissipation ratings are used in a push-pull common grid arrangement. Two
amplifiers are required per port. Using this design a conversion effifejie
of 75% is achieved with a band width of 10%. The band width is requiired
case it is necessary to track changes in the toroidal-plasma cavity lasson
modes with time for optimum coupling. A fast feedback system is incor-
porated in the design to track and lock-on to the resonant mode.
The remainder of the system is also conventional. Each of the final
amplifiers is fed from a regulated 18 kV, 271 amp, 4.8 MW dc power supply
Chapter VI-E. The power supply is fully protected. The low level and in
termediate power amplifier is conventional and will present no problamsthfe
EPR design. The monitor and control system, i.e., VSWR, arcs, is simii&r
the design discussed for LHRH.
In summary, systems can be built using current technology to deliver
the supplemental heating power to EPR. A summary of the relevant rf fo^t
system parameters is presented in Table V-15. The systems promise tortdai
the required power at high conversion efficiency ranging from 48% foiH LHRi
to 64% for ICRH. The systems are "small" in size compared to neutrainbea
heating and moderate in cost. They will be comparatively easy to operate
and maintain in the EPR environment. However, plasma heating must beonienu
strated in large size devices in order for rf to be completely acceptable
as the primary source of supplemental heating.
V-49

IO
Table V-15.
Fump frequency (MHz)
(fast compressional mode)
Output power (MW)
DC to rf power efficiency fromsource to port (%)*
Heating Pulse duration,(seconds)
Duty cycle (%)
Launcher
Transmission Scheme
High Power Source
RF Heating Parameters
ICRH (fast wave)
54 at 8 T maxTF coll field6*.6 at 10 T maxTF coil field
25 using 4 ports60 using 10 ports
64
12.9 for -25 MW5.4 for 60 MW
17.2 for 25 MW7.2 for 60 MW
h turn loops
Coaxial cables
tetrode amplifier
LHRH
1120 at 8 T
1190 at 10 T
25 using 4 ports60 using 10 ports
48
12.9 for 25 MW5.4 for 60 MW
17.2 for 25 MW7.2 for 60 MW
"Grill" waveguide8 across by 2 high
Waveguides
Klystron
Takes into consideration conversion efficiency of final amplifier, transmission lineloss and reflection loss from launcher.
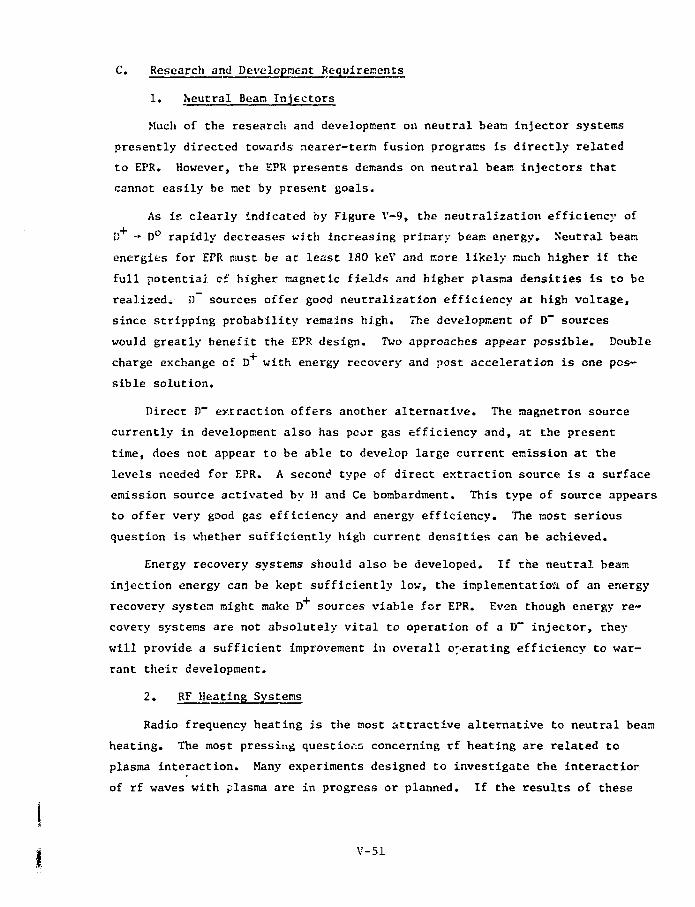
C. Research and Development Requirements
1. Neutral Beam Injectors
Much of the research and development on neutral bean injector systems
presently directed towards nearer-tern fusion programs is directly related
to EPR. However, the EPR presents demands on neutral bean injectors that
cannot easily be net by present goals.
As if. clearly indicated by Figure V-9, the neutralization efficiency of
D -» D° rapidly decreases with increasing primary bears energy. Neutral bean
energies for EPR must be ac least 180 keV and core likely jnuch higher if the
full potential of higher magnetic fields and higher plasma densities is to be
realized* D sources offer good neutralization efficiency at high voltage,
since stripping probability remains high. The development of D~ sources
would greatly benefit the EPR design. Two approaches appear possible. Double
charge exchange of if with energy recovery and post acceleration is one pos-
sible solution.
Direct D~ extraction offers another alternative. The magnetron source
currently in development also has poor gas efficiency and, at the present
time, does not appear to be able to develop large current emission at the
levels needed for EPR. A second type of direct extraction source is a surface
emission source activated by H and Ce bombardment. This type of source appears
to offer very good gas efficiency and energy efficiency. The most serious
question is whether sufficiently high current densities can be achieved.
Energy recovery systems should also be developed. If the neutral beam
injection energy can be kept sufficiently low, the implementation of an energy
recovery system might make D sources viable for EPR. Even though energy re-
covery systems are not absolutely vital to operation of a D~ injector, they
will provide a sufficient improvement in overall operating efficiency to war-
rant their development.
2. RF Heating Systems
Radio frequency heating is the most attractive alternative to neutral beam
heating. The most pressing questions concerning rf heating are related to
plasma interaction. Many experiments designed to investigate the interaction
of rf waves with plasma are in progress or planned. If the results of these
V-51

experiments prove c-Cvuiaging, then implementation of wave heati:.g on EVR
would bo possible with a minimum amount of technology development; at least
in the ICR and LHR modes, since adequate power sources are commercially
available.
The pritsary technology concern of implementing ICR heating is the
coupling device. Aperture coupling is not feasible because of the low fre-
quency, ar.d so some form of lo<5p or antenna is required. The loop must
survive in the same hostile climate as the first wall of the reactor and, in
the process, must not contaminate the
At LHR frequencies, aperture coupling is possible. However, the actual
of the coupling array, the power handling capability of the array, and
waveguide vacuum windows are not fully possible without further development.
At ECR heating frequencies, the technology of generating sufficiently
high powers and efficiently transporting the high frequency power does not
exist. Substantial research and development is necessary on all phases of
ECR equipment before a design can be implemented.
1. W. M. Stacey, Jr., et al., "Tokamak Experimental Power Reactor Studies,"ANL/CTR-75-2, Argonne National Laboratory (June, 1975).
2. J. A. Fasolo, Argonr.e National Laboratory (1975) (unpublished).
3. J. A. Fasolo, Argonr.e National Laboratory (.1976) (unpublished).
4. W. M. Stacey, Jr., et al., "Tokamak Engineering Technology Facility ScopingStudy," ANL/CTR-76-1, Argonne National Laboratory (March, 1976).
5. K. W. Ehlers, et al., "Design and Operation of an Intense Neutral BeamSource," J. of Vac. Sai. ar.d Teak. K), 922 (1973).
6. K. H. Kaselton, et al., "Extraction Systems for Neutral Beam Heating ofPLT and Doublet-Ill Tokamaks," Presented at the Sixth IEEE Symposium onEngineering Problems of Fusion Research, San Diego, California (November,1975">
7. A. 15. Wittkower, et al., "Snail-Angle Scattering Observed in Che Forma-tion of Neutral Atoms from 1.0- to 55-keV Positive Ion Beams," Ph-tn. :-:<>v.1.36, A .1.254 (1964).
8. R. '•.'. Hoir, "A Review cif Direct Energy Conversion of Ion Beams: Experi-mental Results and Reactor Applications," Proc. of First Topical Meetingon.the Technology of Control led Nuclear Fusion, San Diego, California,1, -'.32 (April, 19 74).
V-32

9. I). J. Bender, V.'. L. Barr and R. W. Motr, "Performance Analysis of In-line Direct Converters for Neutral Bean Sources," Presented at theSixth IEEE Symposium on Engineering Problems of Fusion Research, SanDiego, California (N'over-.ber, 1975).
10. S. K. Allison and >!. Garcia-Munoz, Atomic and Nuclear Processes,Edited by 1). R. Bates, Academic Press (1962).
1J. C. I". Barnete, J. A. Ray and J. C. Thosipson, "Atonic ?nd MolecularCollision Cross Sections of Interest in Controlled Thermonuclear Re-search," OKNL-3U3, Revised, Oak Ridge National Laboratory, p. 60U96i).
12. K. Tawara and A. Russek, "Charge Changing Processes in Hydrogen Beans,"P.cv. V.e-.l. rh<o. £5_, 173 (1973).
13. C. W. McCSuro, "Charge K:-cdianj$i- and Dissociation of H , H;. and H-. Ionshu-ulom on H, Gas," •-:..-. /•<-., 130, 1852 (1963)
16. S. Dushnan, Scientific :o»ndations of Vacuuni Techniques, Edited byJ. M. Laffercy, John Kiley & Sons, Inc. (1962).
15. S. K. Allison, "Experimental Results on Charge-Changing Collisions byHydrogen and Helium Atorr.s and Ions at Kinetic Energies Above 0.2 keV,"~'ev. y.c-i. i-^c. _3_0, 1137 (1958).
16. B. A. D'Yachkov, "Production of High-Energy Neutral Atoms by Conversionof H~, H* and H* Tons in a Supersonic Lithium-Vapor Jet," Sov. Ph'S. -Tech. F'^is. J2/1036 (1969).
17. C. 1. Diraov and G. V. Hoslvakov, "Conversion of a Bean of Negative HydrogenIons to Atonic Hydrogen in a Plasr-i Target at Energies Between 0.5 and1 >fcV," liMol. Fusic>:'iy, 551 (1975).
iS. K. H. Berkner, R. V. Pyle and J. V. Stearns, "Mixed Species in IntenseNeutral Beans," Proc of First Topical Meeting on the Technology of Con-trolled Nuclear Fusion, April 16-18, 1974, San Diego, California, 1,392 (1975). ~
29. Synposiun on Plasma Heating in Toroidal Devices, International School ofPlasna Physics, September 4-17, 1974, Varenna, Italy.
20. A. M. Messian and P. E. Vancienplos, "Conprehensive Theory of rf EnergyAbsorption by a Hot Ion-Electron Plasma Cylinder Excited by an ArbitraryElectromagnetic Field," Plasra Phws. JL5, 505-533 (1973).
21. J. Adam, et ,-jl., "Wave Generation and Heating in the ST Tokamak at theFundamental and Harnonic Ion Cyclotron Frequencies," Fifth InternationalConference on Plasma Physics and Controlled Fusion Research. IAEA-CN-33/A3-2, Tokyo, Japan (1974).
V-53

22. J. Hosea, Princeton Plasma Physics Laboratory, private communicationof the latest results of ICRH in the ATC (June, 1976).
23. S. Bernabei, Princeton Plasma Physics Laboratory, private communicationof the latest results of LHRH in the ATC (June, 1976).
24. T. H. Stix, "Fast-Wave Heating of a Two-Component Plssma," Symposiumon Plasma Heating in Toroidal Devices, September 4-17, 1974, Varenna,Italy, p. 105.
25. R. A. Dandl, "Research Program for Plasma Confinement and Heating inElmo Bumpy Torus Devices," ORNL-TM-4941, Oak Ridge National Laboratory(June, 1975).
26. "The Experimental Thermonuclear Device, Tokamak-20," ERDA-TR-58, Vols. 1and 2, Moscow (1975)
27. M. Brambilla, "Slow-Wave Launching of the Lower Hybrid Frequency UsingA Phased Waveguide Array," Nual. Fusion lo_, 47 (1976).
28. T. H. Stix, The Theory of Plasma Waves, McGraw-Hill Publ. Co. New York,p. 65 (1962).
2 9 - V. E. Golant, "Plasma Penetration Near the Lower Hybrid Frequency," Soi\Phys, - Teak. Phys. ,16(12) (June, 1972).
30. F". Troyan and F-. W. Perkins, "Lower-Hybrid Heating in A Large Tokamak,"Proc. of Second Topical Conference of RF Plasma Heating, B-4, Lubbock,Texas (1974).
31. A. Bers, "Ion Heating in Tokamaks by Wave Penetration and Parametric Down-conversion of RF Power," Proc. of the US-Australian Workshop on PlasmaWaves, paper 5, Ed., R. L. Cross (1975).
32. P. Lallia, ''A LHR Slow Wave Launching Structure Suited for Large ToroidalFxperiments," Proc. of the Second Topical Conference on RF Plasma Heating,C-3, Lubbock, Texas (1974).
33. S. Bernabei, et al., "Penetration of Slow Waves into a Dense Plasma Usinga Phased-Guide Array," Phys. Rev. Lett. j>4_(14), 866 (April 7, 1975).
34. A. Rogister and G. Hasselberg, "Theory of Parametric Heating of thePlasma in the Lower Hybrid Frequency Range," The Physios of Fluids,19, No. 1, 108 (January 1976).
V-54
CHATTER VI
ENERGY STORAGE AND TRANSFER
Because "the EPR design employs superconducting poloidal field magnets,
the design of the matching power supplies must include the ability to store,
transfer and recover gigajoules of energy efficiently at repetition rates of
about once per minute. Conventional power supplies are not well suited to
meeting the EPR design goals because they tend to be too costly and ineffitcien
in this mode of operation. Therefore, the designs of the poloidal field power
supplies do not incorporate existent and proven technologies.
The OH coil power supply is based upon energy storage in the coil itself.
This energy is transferred in and out of the coil through an inertial energy
storage device in ti.e form of radially stacked, drum type homopolar generators
to obtain a half-sina-. .-id voltage wane form. The length of the half sinusoid
is controlled by adjusting the effective capacitance of the homopolar gener-
ators to match the inductance of the OH coil. The start and stop action is
controlled by operation of a. switch across the OH coil. Energy losses,
including power supply losses and plasma heating are resupplied by an
auxiliary rectifier inverter operating out of the central energy storage
inductor. This rectifier/inverter also provides voltage to maintain plasma
urrent during the burn phase.
The EF coil power supply is designed to have an actively-controlled
rate of energy change using a three-phase inductor-converter (I-C) SCR bridge
between the EF coil and a central superconducting energy storage inductor.
The central energy storage inductor is also used to smooth the power
demand from the electrical grid for the neutral beam and rf heating systems.
Energy is added to the central storage inductor at almost constant rate
throughout the whole fusion reactor cycle. Energy is extracted from the
central storage inductor at much higher rates than the average input rate
during the heating periods. The power grid only sees the relatively low,
average power.
The power supplies for the neutral beam and rf heating systems also employ
technology which is beyond the current state-of-the-art, in order to avoid
excessive power bumps on the electrical grid and, in the case of the neutral
VI-1
beam injector supply, to also take advantage of the superior qualities of
a new technology. The design of the energy transfer network for the neutral
beam injector uses an I-C to drive a high frequency polyphase rectifier. The
injector is protected against spark damage by using a saturated time-delay
transformer (STDT) to limit surge currents at the outset and to phase back
on the high frequency polyphase rectifiers within the first 100 us for longer
surge periods. The design of the rf heating power supply uses a five-phase
I-C so that voltage ripple on the power anolifier can be minimized.
A. Toroidal-Field Coil System
The inductance of the TF coil is 16.7 H, and the operating current is
60,000 A. A 6 V, 60,000 A dc power supply charges the TV coils to full
current in 48 h. A conventional dc power supply is used in this design.
Special design effort is required to protect against voltage surges on the
supply during unexpected plasma dumps.
B. Ohmic-Heating Coil System
The OK coil current is reversed at the start and end of the burn cycle.
This is accomplished by matching the capacitive value of a homopolar
generator to the inductance of the OH coil so that a free oscillation will
take place at <"ue required frequency.
Tne reversal period is planned to be two seconds or longer. The maximum
energy transfer called for in the power supply reference case is 1060 MJ,
but for design purposes, 1200 MJ is chosen in order to handle the more de-
manding conditions of high plasma resistivity or high plasma irpurity which
might be expected during some operations of an experimental device (see
Table III-ll).
The OH coil inductance is 0.4794 H, which means that 67,745 A must be
switched by the homopolar generators to meet the 1200 MJ energy tr- afer
requirements. A sinusoidal reversal in 2 s requires 51.1 kV (48 kV for PS
reference case), a value which is substantially higher than is typical in
ordinary homopolar generators. In order to match the high voltage and rela-
tively low current, by homopolar generator standards, a radially stacked
drum-type homopolar generator, referred to as the counter cyclonic generator1 2
(CCG), ' has been designed.
VI-2
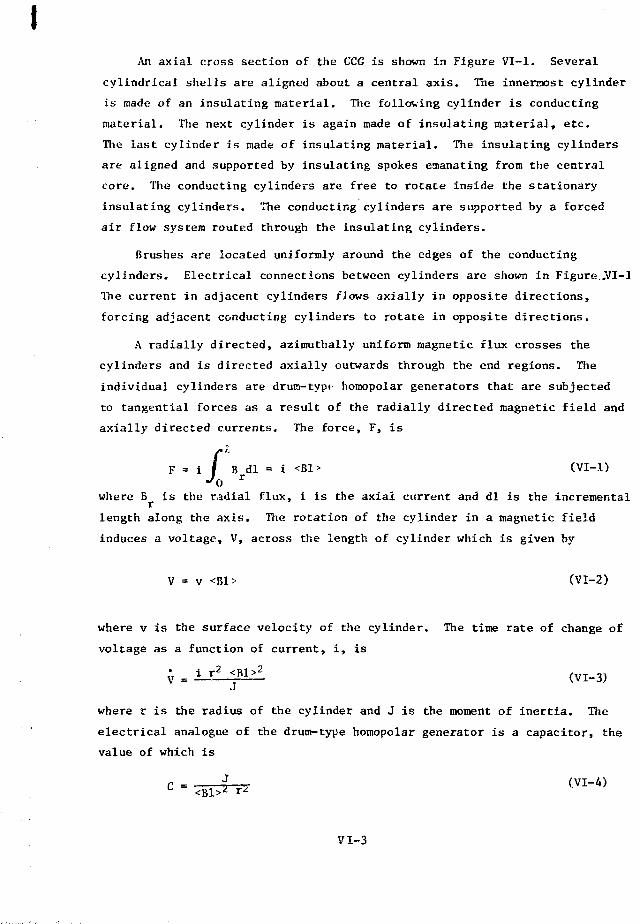
An axial cross section of the CCG is shown in Figure VI-1. Several
cylindrical shells are aligned about a central axis. The innermost cylinder
is made of an insulating material. The following cylinder is conducting
material. The next cylinder is again made of insulating material, etc.
Hie last cylinder is made of insulating material. The insulating cylinders
are aligned and supported by insulating spokes emanating from the central
core. The conducting cylinders are free to rotate inside the stationary
insulating cylinders. The conducting cylinders are supported by a forced
air flow system routed through the insulating cylinders.
Brushes are located uniformly around the edges of the conducting
cylinders. Electrical connections between cylinders are shown in Figure..VI-1
The current in adjacent cylinders flows axially in opposite directions,
forcing adjacent conducting cylinders to rotate in opposite directions.
A radially directed, azimuthally uniform magnetic flux crosses the
cylinders and is directed axially outwards through the end regions. The
individual cylinders are drum-typt homopolar generators that are subjected
to tangential forces as a result of the radially directed magnetic field and
axially directed currents. The force, F, is
i / B dF = i I B_dl = i <B1> (VI-.l)
'owhere B is the radial flux, i is the axial current and dl is the incremental
length along the axis. The rotation of the cylinder in a magnetic field
induces a voltage, V, across the length of cylinder which is given by
V = v <B1> (VI-2)
where v is the surface velocity of the cylinder. The time rate of change of
voltage as a function of current, i, is
V = LI2 <B1>2 (VI-3)
where r is the radius of the cylinder and J is the moment of inertia. The
electrical analogue of the drum-type homopolar generator is a capacitor, the
value of which is
,. (VI-4)
VI-3

<I
ROTATING CONDUCTING-CYLINDER fTYR)
ELECTRICALCONNECTIONS TOEDGES OF CYLINDERSTHROUGH BRUSHES
MAGNETIC FLUXRETURN PATH
RADIALLY DIRECTEDMAGNETIC FIELD
ZZZZ23
RIGIDLY FIXEDINSULATINGCYLINDERS
(TYR)
INPUT AND OUTPUT LLAD5
AIR SEARING LINE(TYP)
MAGNETIC FLUXRETURN PATH
OF GENERATOR
Figure VI-IL Cross section of the region of insulating cylindersand conducting drums for a typical CCG.

Tiie moment of inertia of a thin shell cylinder is approximately
J _ 2- K -• r ? -'-r (VI-5) ,
where ;. is the density of the drum material, i. is the drum length and tv is
the radial thickness of the shell.
The drums are electrically connected in series to operate at the highest
possible voltage per unit length. Each cylinder is designed to operate at
the highest possLle. surface velocity consistent with the structural strength
of the cylinder. In the case of thin shell cylinders, the stress is propor-
tional to the square of the surface velocity. Therefore, the optimum design
i:i one for which the effective capacitance of each shell is chosen to give
a voltage- distribution in the generator which forces each shell to rotate
at the same surface velocity. For a given sinusoidal current, I cos u>'t,
the resulting voltage is
V - -^r sin ~t (VI-6)
'Ihe drum thickness that produces the required capacitance is
1 <B1-Ar = — ; (VI- 7) •-:
2-7.- ;• f. r v
The basic energy storage unit, for the OH coil is envisioned to be several
series-connected, CCG-type homopolar machines. A sketch showing the coils,
rotating drums and iron core and shield layout is presented in Figure VI-2.
A flux map is shown in Figure VI-3. The free space available for conducting
and insulating drums extends from a radius of 0.55 m to about 0.85 m. The
dimensional and operational parameters for the CCG module based on the yoke
design shown in Figure VI-3 are presented in Table VI-1. The design uses
17-4 stainless steel drums which are 0.55 m long and fiberglass insulating
cylinders which have a radial thickness of 0.01905 m. The values of induced
voltage and stored energy are based on the stainless steel drums reaching
surface speeds of 236 m/s. At these speeds, the stress levels reach nlk MN/mz
and the drums expand radially by as much as 0.0016 m. An air gap of 0.003 m
per drum is provided in the CCG design to allow for this expansion.
The stainless steel drums are capable of withstanding this stress and
expansion without having a serious fatigue problem. The line on the endurance
VI-5

ELECTRICALLEADS
SUPERCONDUCTING COILS
CONDUCTING DRUMS
IRONYOKE
y/7/7.
Figure V1-2. Sketch of CCG .Geometry

l.On
O.5m 1.0m 1.5 m
Figure VI-3. Magnetic Field Plot For CCG

TABLE VI-1.- Parameters for a Single CCG Module
i
Cylinder Number
Inner Insulator
1
2
3
4
5
6
Outer Insulator
Total Unit
InnerRadiusm
0.55
0.569
0.6196
0,6689
0.7174
0.7651
0.8125
0.8408
-
<bl>
T-m
-
2.4
2.49
2.60
2.72
2.86
3.03
-
-
RadialThickness
m
0.019
0.0286
0.0272
0.0264
0.0257
0.0253
0.0253
0.009
-
InducedVoltage
V
-
566
588
614
642
675
715
-
3800
EffectiveCapacitance
£
-
72.96
70.33
67.35
64.38
61.23
57.79
-
10.88
StoredEnergyHJ
-
11.7
32.1
12.7
13.3
13.9
14.8
-
78.5

chart shown in Figure VI-4 represents a safe limit for fatigue. The point
shown on the chart indicates the design value for the 17-4 stainless steel
cylinders. This design point is a safe operating value and should lead to
a virtually infinite fatigue life.
The forced air flow system is designed to support the conducting cylinders
in the presence of the radial expansion of the drums. The axes of the CCG
generators are oriented in the vertical direction to make use of the gravi-
tational force. The bottom edges of the conducting cylinders are tapered
and the forced air flow outlets axe on matching tapers in the insulating
drums. As the drums expand, the conducting cylinder slides downward on the
tapered surface, maintaining the same air gap as defined by the air pressure
and flow. The upper ends of the cylinders are supported by teflon buttons
which have several air holes connecting an air chamber in the insulating
drum and the button face in contact with the rotating cylinders. Air pressure
from the rear side .if the button pushes the button towards the cylinder,
but the air flow released through the holes in the button develops a back
pressure that restrains the buttons from making direct contact with the
rotating cylinders.
Brushes for the CCG module are based on the type used by R. A. Marshall.
Each cylinder requires 60 brushes, 0.01 m2 on each side. The distance be-
tween brush centers is 0.06 m. Each brush handles 1130 A. The voltage drop
on a Marshall brush operated under these conditions is about 0.4 V per half
cylinder, or 4.8 V per CCG module. The energy loss due to brushes per CCG
module per fusion reactor cycle is
U = 4v
f—I 2u) V I Icos utldtI b ml '
J0
4 V, Ib m
(VI-8)
w
where U is the energy loss per fusion reactor cycle due to voltage drop on
brushes, and V, is the voltage drop per CCG module. About 1.05% of the energy
transferred is dissipated due to voltage drops across the brushes.
The Marshall brushes are operated with a contact pressure of 110 kN/m2
(16 lb/in.2). The coefficient of friction for these brushes is 0.18.
VI-9

700
II—•o
• k
UJCD
QC
COCOLJCCh-coCM
COCOUJCC
CO
UJ
00
£T
600
500
400
300
200
100
CO
CCG OPERATING POINT
100 200 300 400 500 600 700
Sm-MEAN STRESS, MN/m2
800
Figure VI-4. Goodman Endurance Chart for CCG 17-4stainless steel cylinders.

Therefore, the energy loss per CCG module per fusion reactor cycle due to brush
friction is given by
U F = d p a a (VI-9)
where U is the energy loss due to brush friction loss per CCG nodule in ar
fusion reactor cycle, d is the distance travelled by brush surfaces in a total
fusion reactor cycle, p is the pressure on the brushes, a is the total contact
area of brushes per CCG module, and a is the coefficient of friction. Approxiffi-
mately 1.09% of the energy transferred is lost per fusion reactor cycle due to
brush friction. The resistance of each drum is about 3.6 yfi. I~R losses
in the 96 drums are 0.36% of the energy transferred per fusion reactor cycle.
The series connection of 16 CCG modules described in Table VI-1 will
more than s;atisfy the demands of the OH coil. The series-connected modules
can store 1256 MJ at a voltage of 60,794 V. The minimum value of capacitance
is 0.68 F.
The mininum field reversal time in the OH coil circuit, neglecting lead
inductance and other strays, is 1.8 s. Any reversal time longer than 1.8
second can be achieved by simply reducing the B field on the CCG modules.
For instance, suppose the desired reversal time is T, where T > 1.8 s,
then
T = r/co (VI-10)
where
or
- Z / T 2 = 1/LC
and
C = T^/^'L . (VI-11)
The value of capacitance, C, is also given by Mquatioi. IV-4. Since J divided
by r;j is simply the mass of the cyli>-'-r, ro, the value of magnetic field for
an arbitrary period, 15,, is
Kquat: ion VI-I.2 results from sotting the value of C from Equation VI-1.1 equal
to that of Equation VI-4. The peak voltage that can be generated with field,
i! , Is
VI-11

v = (B i V) e )i m T
where B is the maximum CCG field corresponding to the shortest value ofm
x, T . . The voltage required to force field reversal in a time T i s ,
T 0 >
= V ()O T
In conclusion, any oscillating period equal to or longer than the period
corresponding to the maximum CCG field can be matched by simply reducing
the magnetic field.
The OH coil circuit diagram Is shown in Figure VI-5 and the OH coil
operation cycle is shown in figures 111-21 and 111-23. As can be seen in
Figure 111-21, the OH coil current is reversed at the start of the burn
cycle and again at the end of the burn cycle. During the burn cycle, a small
voltage and di/dt is reoaired to maintain the flow of plasma current. Roughly,
5 V-s is needed during the burn phase for a 1 minute burn. Towards the end of
the cycle, the current in the OH coil is returned to the same value as at
the start of the burn when the OH coil current went through its first reversal.
A controllable power supply is required to satisfy the burn cycle
demands The design of this power supply is a smaller version of the energy
storage and transfer system described in the EF coil section. The system
consists of a central superconducting energy storage coil which stores the
energy needed for adding and subtracting 5 V-s to the OH coil and an in-
ductor-converter (I-C) SCR~capacitor bridge for transferring the energy. The
central energy storage inductor used for this supply is also used for the EF
coil power supply, the neutral beam power supply, and the rf heating power
supply. The inductor-converter bridge is described in detail in the following
section on the EF coil. The I-C must be able to transfer a peak pcwer of 66
MW at a peak voltage of 800 V in order to remove the burn Volt-seconds from
the OH coil at the end of the burn cycle. Since the energy removal sets the
requirement for the rectifier, the system will handle longer burn periods as
well, until the OH coil reaches its maximum magnetic field. Losses in this
system are about 20 MJ per fusion reactor cycle.
VI-12

HOMOPOLARGENERATORS0.63 farad{MIN. CAPACITANCE)
1I
OHC0.4794 H
INDUCTOR-CONVERTER800 V max
• \
CENTRALSUPERCONDUCTINGENERGY STORAGEINDUCTOR
Figure V1-5. Circuit Representation for Ohmic Heating Coil Svstem

The shorting switch, which is connected across the OH coil and in series
with the I-C circuit, must be capable of carrying the full OH coil current
of 80,000 A and must be capable of interrupting this current under "no voltage"
conditions. The switch must be able to isolate the peak OH coil voltage of
61,000 V. These requirements are satisfied by rapid-acting mechanical
switches in parallel with vacuum interrupters.
C. Equilibrium-Field Coil System
The EF coil power and energy cycle is shown in Figure 111-24. The power
supply for the EF coil must be an actively controlled supply because the
demand on field level varies with plasma current and temperature. The design
of the power supply is based on a superconducting magnetic energy storage
(MES) and inductor-converter (I-C) energy transfer scheme suggested by4
Pece:rson, et al.
A basic circuit diagram in shown in Figure VI-6. The superconducting
magnetic energy storage unit is shown on the left-hand side of the circuit
diagram and denoted by L . The EF coil is shown on the right-hand side of
the circuit diagram and denoted by L . The energy flow in the network is
reversible; and if L is equal to !•„, nearly 100% of tht mergy can be
transferred into and out of each coil. However, in the present design, L
is a central energy storage inductor used for the EF coil, OH coil, neutral
beams ani rf heating system. The capacitors in the circuit are able to store
only a small fraction of the magnetic energy at any instant of time without
suffering damage.
The I-C network can be actively controlled in two ways; either by con-
trolling the frequency at which the two SCR bridge circuits operate, or the
relative phasing between the LH and RH bridges. The network behaves dif-
ferently as the relative balance between I_ and L changes. In order to
describe the network behavior, L and L are assumed to be equal. The basicJ tit
SCR cyclic switching sequence followed is SX1 SX5 -> SX1 SX6 •> SX2 SX6 •+
SX2 SX4 •+ SX3 SX4 -* SX3 SX5 -> SX1 SX5, etc., where X is eitiier L or R. The
time increment between switching events is constant for relatively long
intervals, if there are no short-term changes required during the interval.
VI-K

•mm
40
CJ
<0a:
V)
a.V)
(Saa.mo mz x4 £X —I-oS
•i\IO
•I 1°
COi - l
O•H
oCO3
"HJUULT
(9O
u.UJ
o4Jo•a
I
au3SO
VI-15

Relat ive phase between the LH and RH bridges i s measured r e l a t i v e to the time
of cycle when i d e n t i c a l switching events take place in the two b r idges .
When.Io » ! „ , or I_, -i 0, the vol tage waveform of V , V , V , V.,S E E Cj C2 C3 A
V_ and V., are completely dominated by ! „ . The vol tage waveforms for V ,B O b CjV , V , V , and VT_ are shown in Figure: VI-7. The voltage waveform forC2 C3 J-b Lfc*
V-E corresponds to a phase angle between LLB and RHB which provides the
maximum integrated average value across L over a switching cycle. L£J iL
and L act as a constant current —nerator relative to the behavior of the
capacitors, since they are designed to remove only small amounts of energy
from the inductors in a switching sequence. Therefore, the voltage,
V , on any capacitor, C , is given byGX X
I AtV = c x + V (VI-15)ex C IN
xwhere I is the value of current entering C on the dotted side, At is the
ex ° x
length of time increment between switch intervals, and V is the voltage
on C at the start of switch interval.For the case where I_ 0, the values of I are only + Ic, - Ic and
L cx •> 30. The value V shown in Figure VI-7 is controlled by I , At and C. Thus,
U b
for a given circuit design where I and C are chosen, V is varied by
varying the frequency of the switching sequence. The integrated average value
of V. „ can also be altered by changing the relative phase between LHB andLit,
RHB; in which case, the wave shape of V. „ is altered so that the size of
ripple in the voltage is substantially increased.
The voltage across L varies back and forth between V and - V .
This iri a natural result of having all the current in one inductor. The
capacitor can be rapidly charged from L , but takes an extremely long time
to discharge into L . The switching scheme alternately discharges the
capacitors into L and then recharges them from L •
Vigure VI-8 shows the voltage waveforms when I = lp and the relative
pha^e angle is adjusted to give a symmetrical voltage waveform. The wave
shape of Lhe capacitor voltage is affected by the current I , as would be
VI-16

w
(VIM
0)
<u50a
<uVJ Aai A> a:
§ W
u a
>111
to
VI-17

HiI
oo
1111- 2 V Q L
2V,,
Figure VI-8. Inductor-Converter Voltage Waveforms when I = I_.

the case for any condition where I is not infinitely larger than I_.
Figure VI-9 shows voltage waveforms when Io « !„.
The timing chart for switching the two bridges under symmetrical wave-
form operation is shown in Figure VI-10.
Actual EF coil power supply design is based on typical SCR parameters
for currently available power devices. The SCR design parameters are listed
in Table VI-2. The lower limit on the size of capacitance is determined, as
indicated by Equation VI-13, from the SCR turn-off time, the value of storage
inductor current, and the lowest voltage required in the EF coil. The lowest
EF coil voltage is about 900 V recorded at about 0.1 s after startup. The
energy storage inductor is almost at peak current, and the EF coil current
is almost at zero. Allowing an SCR conduction time of approximately twice
the turnoff time, or about 250 us between SCR switching steps, the highest
switching frequency is 1330 Hz. The design value of the capacitors is 35 mF,
which allows operating in the mode depicted in Figure VI—7 with a value of V
equal to 570 V. Allowance is made for a 100 V SCR voltage drop. The highest
voltage demand of 20,280 V occurs at 1.25 s into startup. At this point in
the cycle, the average integrated coil voltage is approximately 1.875 times the
capacitor voltage. A switching frequency of 120 cps will lead to the correct
average coil voltage. A design value of 15 kV provides adequate safety mar-
gin, in the event shorter heating periods become necessary. The stored energy
per capacitor bank is 3.95 HJ. Commercial capacitors are available in this
voltage range but not in this capacitance value. This presents no problem
since single units can be easily paralleled using a relatively simple fuse
arrangement to protect against excessive energy dump in the event of a capaci-
tor failure.
The design of each SCR switch shown in Figure VI-6 consists of an array
of 21 SCR units in series and 76 SCR units in parallel. Each SCR unit is
operated with a current of only 75% of the continuous current handling limit
and reverse bias voltage of 2/3 the peak inverse rating. Saturable inductors
of 33.3 uH value are in series with each of the 76 parallel branches, so that
the di/dt is kept within the limits specified in Table VI-2. One turn on a
Deltamax core with an 0.15 m square cross section provides the necessary
protection against excessive current rise time.
The energy loss with this design is about 60 MJ per fusion reactor
cycle.
VI-19

2V.
V
MI
-v. r-
'A/
AV
AV AVFigure V1-9. Inductor-Converter Voltage Wave
forms when I « I _s E.
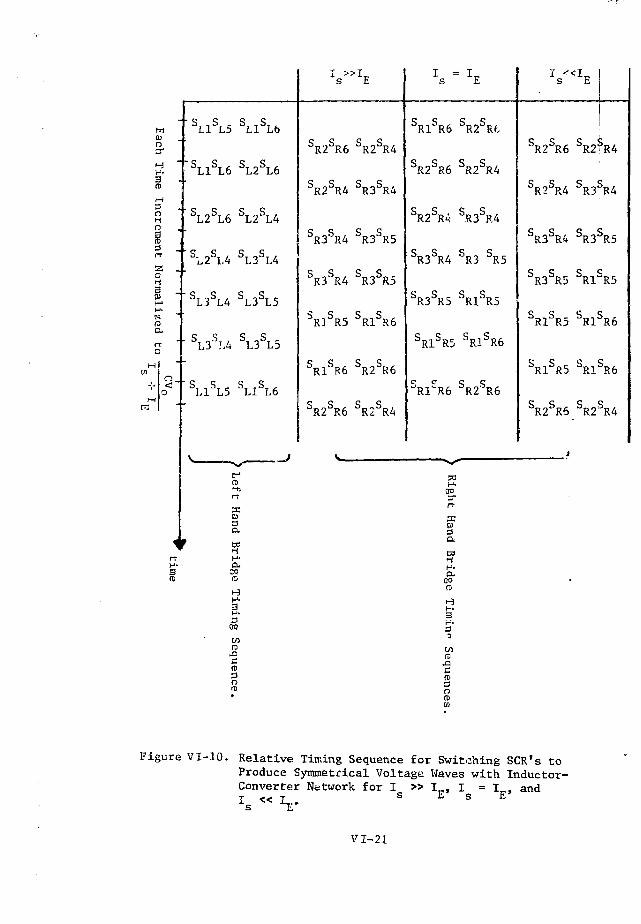
wach
Jf "IT)
incr
p.mei
s> _rr
aD
3 .- •
M*N
roILrtO
3-o
1rrH -3fC
' S L1 S L5 S Ll S Lb
"SL1SL6 SL2SL6
SL2SL6 SL2SL4
s. o s T sT , s T .i 2 1,4 L3 L4
• C O C CbL3bL4 bL3bL5
SL3ST.4 SL3SL5
SL1SL5 SL1SL6
tr1
nH)
rr
and
ts>-iH-O.OOrt>H
H-3
OT
CO
roc(H3oID•
I »I_s
SR2SR6
SR2SR4
SR3SR4
SR3SR4
SR3SR5
SR1SR6
SR2SR6
SR2SR4
SR3SR4
SR3SR5
SR3SR5
SR1SR6
SR2SR6
S SR2 R4
I =s
c cRl R6
SR2SR6
SR2SR4
SR3SR4
SR3SR5
SR1SR5
S £
paj-u
OS3 "rt
Han
aCO
p .O-
0 0
3 '
CO(5
SIC
3
(D
E
SR2SRt
SR2SR4
SR3SR4
SR3 SR5
SR1SR5
SR1SR6
SR2SR6
SR2
SR2
SR3
SR3
SR1
SR1
SR2
I «I_s
SR6
SR4
SR4
SR5
SR5
SR5
SR6
i
•
E
SR2
SR3
c
S R 1 -
SR1
SR1
SR2
3R4
3R4
3R5
3R5
3R6
3R6
3R4
Figure VI-10. Relative Timing Sequence for Switching SCR's toProduce Symmetrical Voltage Waves with Inductor-Converter Network for I » I , I = 1 andT <* T s E s E
VI-21

TAM'i! VI-2. SCR Design Parameters for EF Coil Inverter-Converter Network Design
RMS Peak Current
Current Handling Limit at 120° Conduction Angle
Design Current per SCR
Peak Inverse Voltage (Repetitive)
Design Inverse Voltage
Turn-Off Time
di/dt Rating
dv/dt Rating
Voltage Drop at Maximum Current Conduction
1600 A
1400 A
1050 A
1500 V
1000 V
100 to 120 us
800 A/us
200 V/us
1.75 V
D. Neutral Beam Power Supplies
A total of 12 beam injection ports are used for 24 neutral beam lines.
Each beam line power supply unit is rated 180 kV 113 A, for a total peak
power requirement of 485 MW. The injectors operate for approximately
5 s every 70 s,
The design cf the neutral beam system includes energy recovery, both
direct electrically and thermally from the beam dumps as well. The thermally
recovered energy enters the steam system and is returned over the whole
fusion cycle. The electrical energy recovered comes back essentially simul-
taneously and must be included in the power supply design. Although a de-
tailed design of the energy recovery system has not been made, it is assumed
that the system will have similar characteristics to those of the Novosibirsk
electron cooling system, which successfully demonstrates high efficiency
electrical er-.ergy recovery. In this case the recovery ion current flows
back into the power supply at a reducftd (collecting) voltage, thus reducing
the requirement for the power supply. In this case the reduction in power
supply is dramatic because of the low neutralization efficiency of the 180 keV
beam. Of the 485 MW flowing to the injector system, 278 MW is recovered
VI-22

electrically, reducing the power supply requirement to 207 MW. Alternately
one might build a separate energy recovery power supply system which returned
the recovered energy to the energy storage inductor, but in this case the
total power supply system would be required to handle 763 MW, and would be
almost four times as expensive.
The voltages to the electrodes of an injector must be applied within a
short time to limit heating of the electrode grids. In case of an arc within
an injector, the HV must be removed before damage occurs. These switching
functions are presently performed by ignitrons and hard tube modulators
(switchtubes) for voltages _< 60 kV, as illustrated in Figure VI-11. At the
injector power level required for the EPR, large numbers of ignitrons must
be connected in series and parallel to switch-on, or crowbar. Vacuum
switchtubes to interrupt at these voltage and power levels do not exist;
and when developed, may themselves be subject to damage from arcing.
One major disadvantage of the circuit of Figure VI-11 is that the signal
required to operate the crowbar results from the application of excessive
arc current to the injector. Another is that the switching and control
functions are done at the high voltage (HV) level.
The 207 MW power pulses required for the injectors would cause intolerable
voltage fluctuations, "flicker," for the electric power system. Therefore,
pulsing power is accumulated and stored between pulses in the central super-
conductive inductor. The induccor buffers the injector load fluctuation from
the power system to such an extent that voltage flicker will be negligible. It
also will eliminate "peak demand charges" by the electric utility company.
Arc currents can be limited with a saturated time delay transformer
(STDT) connected in series with the injector. The STDT detects overcurrent
and limits it until the arc has been extinguished or the HV power source re-
moved. It appears possible to eliminate the need for vacuum switchtubes and
ignitrons by developing high power HV supplies that can react fast enough
to be compatible with the requirements of a neutral beam injector and STDT.
A simplified conceptual design of such an HV power supply system is
shown in Figure VI-12. Pulsing power for the system is stored in the super-
conductive inductor L . It is charged from the three-phase power system by
VI-23

HV POWER SUPPLY FOR ENTRANCE 8RID NEUTRAL K A MINJECTOR
I NEUTRALIZE*
Figure VI-11. Conventional NBI Power Supply System
SUPERCONDUCTIVEINDUCTOR L-
AC/OCCONVERTER
NEUTRALSEAM
INJECTOR
DC/KC/OCCONVERTER8) FILTER
HIGHFREQUENCYPOLY PHASfINVERTERS
RECTIFIERTRANSFORMERS
ANDHVRECTIFIERS
-H 50/lSr—
Figure VI-12. HV Power Supply for NBI Block Diagram
VI-24
;:;i-;ti;.s ui ;»a ac/<i<: o m v e r t «•*!'. i'.iitr T y,y <"ast Iff tir.ivn I rur; the povuf systur/. ;ind
s t o r e d in the i nduc to r i>r a l l e r u u l H y rel isrneii U:> I.ho juiver sv.sl.ca ;JS iit:si JVC
by a p p r o p r i a t e }iha:»e omi t ' iO t>! the n m v s - r i t T .
Thi- c:«?-r?;y ?;tur«*(t in ftuJm'lor '-.t ;irov5ej«:s .» jsn-t ».-*«; ly r e g u l a t e d dc
v o l t a g e sou rce by rti-;»:t:« «>f ».,';•<• -<Sf:/.'t-.-/df if.iS«i.-i<>r-c«?nvt*r!.lrr u n i t t k - . s r r ihc !
isv the prvviuti.-: ;:c<-t ii;n iui l!=*- KK m i ! r:ys't«.-r:. T?;<.- i i t i jus tab ie ti;- VUJE.'S£<-
i.-; :;tr.oc>t'2H-<,! by ;i lov-pas?: f i l l e r ;»n<5 .-HL-rKisii-s p<siyp;*.;isi- i n v e r t e r s .i:u-r;sLi :iy,
a t r e l a t i v e l y 'high f rc ' j t j c i i r l es , * • . } ; - , 50 ki:K. V-.>r itir;!..s:*,ct-, four 10 V:Hx
ph.ssi—dis;>J;i<-t:<i 3—;ii;asc !>rli5}*«' i:jv<-rf.<-r;; rontil l\-,*-d :t SU~^".IJIK tr;insii?rr.i-r
lo g e n e r a t e -t 'j~ph»se ou tpu t v.-ivcl'iTK hav ing 21< sit-j».":. The lowest harrusnii.-
of i-i)ithi-i]iii'tifi' j ifesi-nl iti thi- i>i;x::n;t w,iv«- J'orn ai such ;s 2i-;.)hase i j ivvrt t -r
in the- twe i i cy - th i r t i . With ;• Iu!u3;js;i-ntal frv<;«ec»i:y of 10 kiix, t h i s ::;ir~t):iii-
The l i t t e r e d 10 kis?. 3-{>3t;»jSi- v i ' l tar .e i s ap^ 2 i <-d thn»u};h SC:-1 ;je s v i l r : u - s
Ln tiu- prim-try of .t» HV r e i - t i f i e r i r . - ins fo r sc r . T;;v HV Ht-conuarv t r a n s f o r m e r
vinciii]};.'; fci-ti c i tuic r e r i « S i i - r i - i r c t i i t s t h a t .i!"c- ^unncctt-tS its st-rii-.s in nht - t in
a v o l t a g e wi l l : 2b-phurir r i 'ppiv ( j 2'»0 kHz). Ssr.te 24-phasi ' r i p p l e causes
a volcajje f Juul t ia t ion nf only - i).'*j'.'., no dc f i l t e r i s r e q u i r e d . The HV
ouljMjt i s I 'onni-cttd to the i s i j e c to r vhrov.K'n an STUT which has a t ' ine de lay ,ri.'
jwtUjiu with the invt-rter ! re<nie«i;y {say, ;.t . 125 -,,s).
Wiicn an arc fan It ocrurs, the STOT ini t ia tes blocking of all ac switcho
This wiH do- i-ncr?,is.v thv r c . t i f i e r trans formers within appro?: inaiciy one-
half I'jvh' ( 50 ;.s) . After an arc has been est inguished .:»nti .1 suitable
time has elapsed to prevent arc restr ikos, the ;»r switches will be ro-
entTrf;i;!(.>d to resuree injuctor ojieration.
hi case the arc fault persists for more than a cycle, due to a fault in
the SCK ;JC switches, a crowbar time delay circuit (CTD) will energize the
crowi>ar before the time delay of the S'i'DT has elapsed. Energizing of
the crowbar will i n i t i a t e operation of mechanical circuit breakers to d is-
connect the sutninin;; transformers. An alternate location for the crowbar
would be on the left hand side, as shown by dashed lines in Figure Vl-12.
Core losses are Che predominant factors in determining transformer s ize ,
because th.2 core materials saturate at necirlv the same induction whether
VI-25

the frequency is 60 Hz or 10 kHz. At 10 kHz, the core loss is so high that
tin? material can only be used at a fraction of its saturation density.
However, this low induction is of advantage when switching ac voltage to the
rectifier transformer primary in order to apply HV to the injector. When a
transformer is first energized, a transient excising current flows to bridge
the gap between the conditions existing before the transformer is energized
ami the conditions dictated by steady-state requirements. For any given
transformer, this transient current depends upon the magnitude of the supply
voltage at the instant the transformer is energized, the residual flux in the
core, and the impedance of the supply circuit. Under the worst conditions,
with a residual flux of 0.9 times the normal flux and switching at zero
voltage, the transient total flux would have a peak that is 2.9 times the
steady-state peak flux. For grain-oriented steel, the B-H curve is approx-
imately linear to 14 kG. Therefore, restricting the steady-state flux
density to < 14 kC/2.9 *= 4.3 kG will restrict transient transformer inrush
currents to 2.9 times the steady-state magnetizing current, which is neg-
ligible. In practical applications, the 10 kHz losses will restrict flux
densities to less chan 4 kG; for an economical transformer design, core
laminations of 0.01 cm should be used.
If advantage is taken of both the core material and high temperature
insulation, 10 kHz transformers can be reduced to approximately 8% of the
size of 60 H<! transformers of the same rating. With the transformer coils
designed for minimum leakage inductances, the relatively small 10 kHz rec-
tifier transformers have a fast response to a step change.
Figure VI-13 is a simplified equivalent of the proposed 3-phase switching
circuit. The ac switches, Sj, are turned on when HV is to be applied to the
entrance grid of the neutral beam injector. The transformer leakage in-STDT
ductances are small compared to the inductance L of the saturated STDT.STDT "
For an STOT rated 180 kV, 120 A, we have L < 5 mH. The circuit capaci-
tance to ground connected to the injector grid is estimated as Cj < 200 pF
(i 50 pF from the STDT). This results in a resonant frequency of rv 160 kHz,
or a rise time of T/4 ^ 1.6 us. The injector load of 1.6 kfi damps the circuit.
VI-26
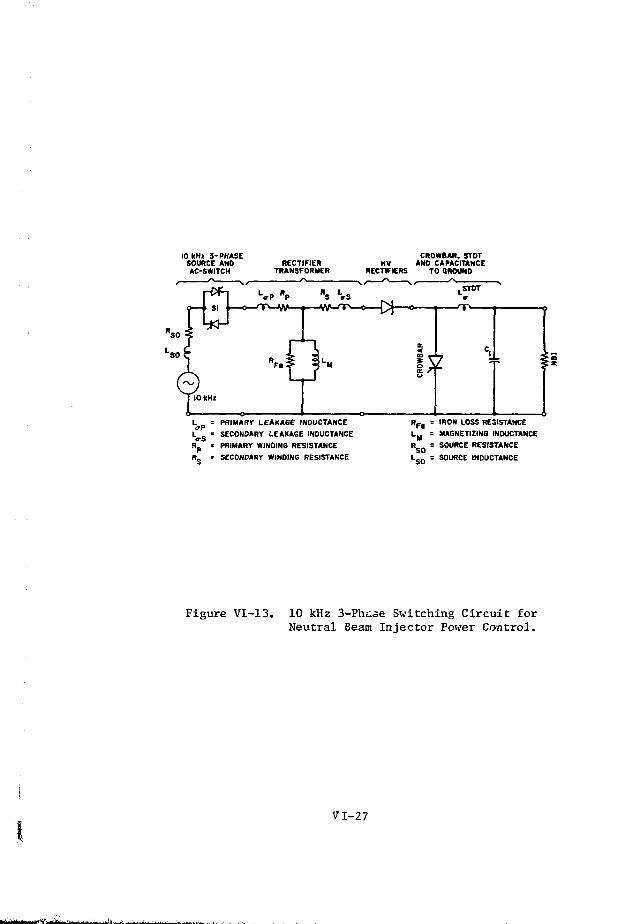
10 Ml 3-PHASESOURCE ANDAC-SWITCH
RECTIFIERTRANSFORMER
CROWBAR, STDTHV AND CAPACITANCE
RECTIFIERS TO GROUND
= PRIMARY LEAKAGE INDUCTANCE
' SECONDARY LEAKAGE INDUCTANCE
• PRIMARY WINDING RESISTANCE
= SECONDARY WINDING RESISTANCESO
= IRON LOSS RESISTANCE
= MAGNETIZING INDUCTANCE
= SOURCE RESISTANCE
Figure VI-13. 10 kHz 3-Phase Switching Circuit forNeutral Beam Injector Power Control.
VI-2 7

In case of an arc in tiro neutral beam injector, tin.* STWT will limit
the current and will initiate blocking of tiu< gate drives of switches St.
This removes the ac voltages from th>: rectifier transfurir.crs when the line
currents go through ZITH. With an operating frequency of !6 kHz, the urinary
voltages and the energy stored in ihe transformer will be removed in approxi-
mately u 50 i.s, with the last 25 us being a decaying quarter aim- wave. The
energy stored in the STDT discharges into its secondary bias circuit. The only
energy flowing intn the injector is the energy stored hi Cj and in the lead
inductance. With C: - 200 pF at 180 kV, Lh.e energy in Cj is "3.2 M.I.
The advantages of tiie proposed system are:
1. Conmiercially available components are used throughout, eliminating
the need for developing switch tubes for i 200 kV.
2. The injector is never exposed to cvercurrent.
3. All switching and regulating is done at a lower voltage level.
A superconductive inductor-converter system rated •- 23 MW could be pro-
vided for each of the 24 neutral beam injectors, as shown in Figure VI-12. If
one inductor-converter would fail, only 4.22 of the total neutral beam energy
would be lost. The central superconducting magnetic energy storage unit is
described in detail in section VI-F.
E. RF Heating System Power Supply
The power supplies for the ion cyclotron resonance and lower hybrid
resonance rf heating systems are also designed using the I-C concept described
in section VI-C, cperatirg with the energy storage inductor described in
section VI-F. The loads presented by the rf systems are resistive and require
a virtually constant voltage, to within ± 1%. The charging-recharging fluc-
tuations that appear'on the load shown in Figure VI-7 are unacceptable for
the rf conversion devices. Therefore, the I-C design is based on a five-phase
bridge. Voltage variations are maintained to within ± 1% without a filter
by selecting time constant between the capacitors and the resistive load to
be at least 50 times the charging time of the capacitor.
The ICR heating system requires 18,000 V and 271 A. The effective
resistance is 66.4 ft per unit. Two ICR heating units are operated in
parallel. Each capacitor in the bridge is 2220 \i¥ and is charged to
VI-28

9000 V. TIK- 1-C is operated from the central energy storage inductor
described in Section VI-I*. SCR switching intervals vary from 250 ,;s
when the storage current is 80,000 A to 500 -us when the- energy storage
inductor current drops to 40,000 A. The voltage variation goes from ' 0.17/'
when the storage inductor is at 80,000 A to .' 0.34?' when the storage inductor
is at 53,400 A. The .SCR parameters are the same as those described in
Table VI-2. Each SCR switch indicated in Figure VI-6 consists
of 19 SCR units in parallel and 9 in series.
The I.HR heating system requires 64.5 kV and 51 A per klystron. The
effective resistance is 316 •: for a unit consisting of four klystrons in
parallel. Each capacitor in the bridge has a value of 615 \ii and is charged
to 32,250 V. 'Die SCR switching steps vary from 250 to 500 us as the central
energy storage inductor current varies from 80,000 to 40,000 A. Each SCR
switch arm consists of 10 SCR units in parallel and 33 units in series.
F. Energy Storage Inductor
In in order to operate the poloidal .nil and neutral bean systems it
will be necessary to store energy on site so that the large power pulses
required to initiate and terminate the tokamak discharge do not perturb
the electrical power network. Superconductive energy storage offers an
efficient and economic means to provide these pulsed energy requirements.
The development of ac cryogenically stable cables, required for the
equilibrium-field and ohmic-heating coils, also provides a solution for
pulsed superconductive energy storage inductors. In fact, the conductor
requirements for the energy storage inductor are considerably less severe
than for the ohmic heating coil and are comparable in B , B , currentmax max
and voltage to those for the equilibrium field coils. These in turn are not
far from present day technology except in their massive scale.
The size of the energy storage unit is determined by the energy
balance in these systems. These are shown in Chapter III, Figure 111-23
and Figure 111-24 for the reference design case. The power supply design
case, (Case 3 in Table III-ll) however, is more demanding. The beams, in
this case, are turned on at the end of the OH current reversal, causing a
greater requirement U „ i 1100 MJ for the homopolar generators than for the
reference case. The EF coil ramps up in seven seconds, with most of the
power coming after one second. The neutral beams come on at two seconds for
VI-29

a period of 4.8 seconds. In this case, as in the reference case, the EF coil
does not drive th_- resistance of the plasma ritrongly because of its slow turn
on rate. Then essentially all (124 MJ) of the 130 N.J of I2R energy is pro-P P
vided by the OH system. The poloidal coil power supply losses were previously
estimated to be about 110 MJ, but for conservatism an energy loss of 5Z of the
energy transferred is assumed, corresponding to 370 N.J. Of this, slightly over
half will he in the EF rectifier inverter, and half of this, or 100 Ml
will have been 'ost by the end of beam heating.
In the neutral beam system it is necessary to deal with the problem of
energy recovery, as it affects the design of these power systems. Electrical
energy recovery can be accomplished either by a separate inverter system
connected to the storage unit, or preferably, incorporated in the design of
the neutral beam power supply. This latter choice will reduce the power
supply requirements, as was done in the main demonstration of electricalQ
energy recovery, the electron beam proton cooling system at Novosibirsk.
So far as the energy storage unit is concerned, the power requirement is
the net electric power taken for the beams, excluding thermally recovered
electric energy, which comes on a different time scale. It is shown in
Chapter V that the electrical efficiency of the beam system is 0.29; that
is, for 60 MW of beam power to the plasma, 207 MW of power must be withdrawn
from the energy storage unit, with a total energy withdrawal of 924 MJ.
The OH rectifier, which provides volt-seconds to adjust the plasma current
during burn, provides an average of about 10 MW for the 45 s period, or a
total power supply output of 460 MJ. Shutdown is accomplished by putting
reverse power ('• 66 MW) into the OH coil for about 5 s and then ringing
back the OH coil through the homopolars to reverse the OH current. The
EF coil power is reversed during this period to maintain plasma equilibrium,
with most of the energy coming out in 6 s. The EF power supply must provide
a maximum of 400 MW, but for energy balance, can be taken to be an average
power of 250 MW for 6 s.
The power cycle and energy demand are shown in Figure VI-14. At the
end of the burn cycle 1.50 GJ has been withdrawn, including power supply
losses, leading to an average power of 21.4 MW. This will be put in at a
constant rate, leading to a net zero balance at the end of the burn cycle.
The peak net withdrawal of 2.4 GJ occurs at the end of the beam heating, which
is also the time of peak power (400 rftJ EF, 207 MW Beams, 21.4 MW grid).
VI-30

ENERGY
ENERGY
0.5 6W
POWER
0
50 55 60 701-0.5
Figure V1-14. Power and Energy Balance in Pulsed Systems
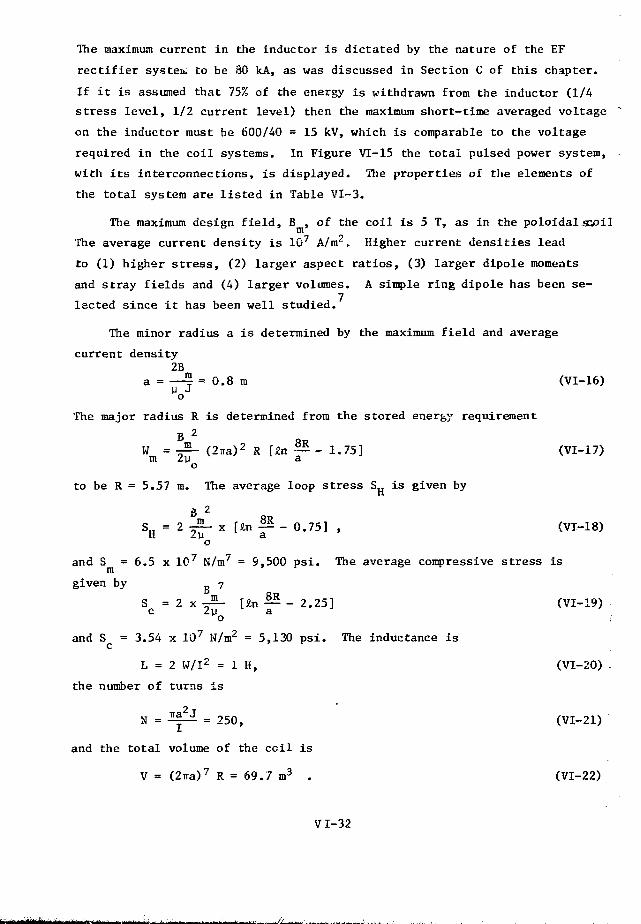
The maximum current in the inductor is dictated by the nature of the EF
rectifier systeiu to be 80 kA, as was discussed in Section C of this chapter.
If it is assumed that 75% of the energy is withdrawn from the inductor (1/4
stress level, 1/2 current level) then the maximum short-time averaged voltage
on the inductor must be 600/40 = 15 kV, which is comparable to the voltage
required in the coil systems. In Figure VI-15 the total pulsed power system,
with its interconnections, is displayed. The properties of the elements of
the total system are listed in Table VI-3.
The maximum design field, B , of the coil is 5 T, as in the poloidal sspil
The average current density is 107 A/m2, Higher current densities lead
to (1) higher stress, (2) larger aspect ratios, (3) larger dipole moments
and stray fields and (4) larger volumes. A simple ring dipole has been se-
lected since it has been well studied.
The minor radius a is determined by the maximum field and average
current density2B
a = — j = 0.8 m (VI-16)
The major radius R is determined from the stored energy requirement
R 2
W = TT2- (2tra)2 R [In — - 1.75] (VI-17)m 2p ao
to be R = 5.57 m. The average loop stress SH is given by.,
SH = 2 J - X [to ^ - 0.75] , (VT-18)o
and S = 6.5 x 10⁷ N/m7 = 9,500 psi. The average compressive stress ism
given by fi 7
S = 2 x f - [Jin — - 2.25] (VI-19)c 2y a
o
and S = 3.54 x 10⁷ N/m2 = 5,130 psi . The inductance is
L = 2 W/I2 = 1 H, (VI-20)
the number of turns is
N = ^^Y^ = 250, (VI-21)
and the total volume of the ceil is
V = (2ira)7 R = 69.7 m3 . (VI-22)
VI-32

EnergyStorageInductor
3.2 GJStored
©
©o
OH Rectifier
Inverter
EF Rectifer
Inverter
N3 dc/ac
Converter
OH System
\
I Homopolar °*I Generator
T o\
L OH"\
i\Plasma
EF System
tl
-EFo
/5'
*>LP
Neutral Beam (or RF) System
. |
Auxin iaries
Make-up Rectifier
—O-> — S Power GridSubstation
Figure VI-15. Energy Storage, and Transfer System
VI-33

Table VI-3, Energy Transfer and Storage Systems —• Maximum Ratings
Ohmic Heating Systems
Drum homopolar generatorsNo. of generators in seriesNo. of drums/generatorTotal energy transfer (MJ)Peak power (MW)Peak voltage (kV)Peak current (kA)Equivalent capacitance (F)
. Rectifier systemTypeEnergy transfer (MJ)Peak power (MW) aPeak current (kA)Peak voltage (kV)
Equilibrium Field System '\
TypeEnergy transfer (MJ)Peak power (MW)Peak current (kA)Peak voltage (kV)Peak: switching frequency (Hz)
Neutral Beam Systemaji (60 MW)
TypeEnergy transfer (GJ) (
Voltage (kV) ,Power (MW)
1661200190051680.897
Inductor-converter bridge60066800.8
Inductor-converter bridge15004i680211330 ,;
SCR, DC/AC/DC at 10 kHz1180207
RF System (60 MU)b
TypeVf^tage (kV)
% ICRLHR
Power (MW)ICX ,,LHR
Central Energy Storage Inductor-TypeEnergy stored (GJ)Energy transfer (GJ)Peak current (kA)Peak power (MW)Average power from 60 Hz line (MW)
5 phase inductor-converter bridge
5 1864.5
94125
>-'•'• Superconductive ring dipole inductor3.22.48062021
^Assumes electrical energy recovery in power supply.?j • • ;.•
Neutral beam and rf are alternative options.
VI- 34

There are 7 x 10⁸ ampraeters of cable, leading to 0.58 m3 of NbTi.
The coil will be constructed of pancakes separated by micarta or fiberg.lass-
epoxy boards 1.25 cm thick-, with 50% coverage. Alternate pancakes are wound
clockwise and counterclockwise to facilitate layer to layer connections.
Conductor transposition is achieved by winding top and bottom halves with
40 kA conductor and operating the coil halves in parallel, although other
schemes can work equally well. There are a total of 12 layers of coils,
wound to approximate a circular coil cross section. Voids on the periphery
are filled with blocks and the coil is banded to give the coil structural
integrity. Special care must be taken in the design to accomplish the
correct friction coefficient to achieve proper stress distribution. The
cryostat is of the low-loss type discussed in Chapter IV.
The basic conductor unit includes the structural support, as shown
in Figure IV-16. A fiberglass epoxy board 3 cm x 12 cm with a 0.5 cm xtiO c
slot and cooling holes comprises the support. The conductor is composed of
200 strands of 1 nun diameter wire wound around a 0.3 cm x 9.7 cm fiberglass
epoxy board. This winding achieves transposition as is current prac-
tice in ac cables. Each 1 mm strand can be the same wire as for the poljpida
coil cables without the last factor of two reduction in area (see Chaptejr. IV
Means must be provided for venting helium gas bubbles to the outside
so that upper coil layers will not become vaporlocked by gas from the lower
layers. Insulation presents a problem, particularly at the cross connection
between layers. There, the voltage between layers is a maximum and presents
a potential arcing problem. The actual current distribution, as compared
to the idealized constant current density, causes the maximum field at
the outside conductors to be 10% higher than the idealized design field.
This is also true in the poloidal conductors, and the conductor design
accounts for the higher field.
G. Research and Development Requirements
With the exception of the TF coil power supply system, the design of
EPR. power supplies makes use of technology that has not yet been demonstjratet
in a technical sense. The primary reasons for not utilizing present tech-
nology are cost and efficiency. The EF coil, OH coil, neutral beam and rf
heating power supplies inevitably require lar,_c energy storage and transfer
VI-35

Cooling Holes
Fiberglass Epoxy
1.25 cm Micarta
CABLE
5 mm3 mm Fiberglass
10 cm
200 - 1 mm Wires
COIL
U.8 n
Figure VI 16. 40 kA Energy Storage Conductor
VI-36

devices because either the systems must charge and discharge superconducting
coils that store gigajoules of energy or they present enormously large power
demands for short periods of the cycle. Conventional devices such as catjracsL
or motor-generator flywheel sets are likely to be prohibitively expensive.
Or, at least, if not prohibitively expensive, the cost of implementing ptttesei
technology is likely to be sufficiently expensive to warrant the development
of the less expensive alternatives suggested in the previous text and
discussed below.
In the present EPR design, and most likely in future tokamak fusion
power systems, the OH coil power supply is a passive device; that is, in
the OH coil circuit the energy storage and transfer is accomplished by
switching the coil current through a passive circuit element. A multidrum
type homopolar generator forms the basis of the present design. However,
the device has never been demonstrated to work reliably, although clearly
some homopolar generators in some form or another have worked. The basic
problem with more "conventional" type homopolar generators is the poor
impedance match they present to the superconducting coils. As discussed
in Chapter IV, many obstacles exist before the present EPR coil design
of 80 kA can be reliably built. The problems with going to the higher
currents and lower voltages, which would match "conventional" homopolar
generators, are technically far more difficult and likely to increase the
coil costs enormously, even if the technical problems arc overcome. The
homopolar generator presented in section VI-B offers a solution to the coil
matching, which should save a considerable sum of EPR construction money,
even xf development costs are included.
A shorting switch capable of interrupting the full coil current also
neeas to be developed. The technical problems associated with the switch
do not rep/esent either as severe a technical extrapolation or as major a
development cost as do the homopolar generators.
Other devices such as superconductive magnetic energy storage with
mechanical energy transfer migh~ also prnvide a cogent alternative to present
technology. More study in this area is needed before a development program
can be recommended.
VI-37
The r'F coiL will require an actively controlled power supply. Super-
conductive magnetic energy storage with electronic energy transfer appears
to offer the most attractive solution to this problem. The major problems
which must be overcome before implementing this technology ;""t' associated
with the development of pulsed superconductive energy storage units, selection
ol the cheapest and most reliable SCR bridge network, analysis of the dynamic
characteris tics, analysis of the bridge i:.-der fault conditions, and development
of fault protection techniques. Undoubtedly, d- monsLration of the technical
ability and reliability of a fairly large-sizet' model will be needed before
the technology can be implemented witli full confidence on something as costly
as the EPR.
The design of the neutral beam power supply also applies technology
which currently is not in use and has not been demonstrated. The voltage
levels at which the EPR device must operate are in the regime where high
power vacuum tube devices do not exist. Although a development program
on switch tubes might lead to higher voltage devices, ultimately a high-
power vacuum tube in the hundreds of kilovolt range becomes as vulnerable
to spark damage as does the neutral beam accelerating column. The design
suggested in section VI-D offers an entirely new approach which, if developed,
can extrapolate to considerably higher voltage with minimum development
effort.
The Saturated-Time-Delay-Transformer can perform the initial spark
suppression, and the high frequency power supply can react quickly enough
to prevent damage currents from flowing in the circuit. Development efforts
are needed to design the least expensive, most flexible, and reliable
power supply. And here, too, demonstration of the technique with a fairly
representative-sized mode] is advisable.
1. R. L. Kustom, R. B. Wehrle and J. H. Norem, "The Counter CyclonicGenerator: Conceptual Design for a Rotating Capacitor System for theTokamak Experimental Power Reactor," ANL/CTR/TM-49, Argonne NationalLaboratory (July 22, 1975).
2. R. L. Kustom, J. H. Norem and R. B. Wehrle, "A Rotating Capacitor Systemfor the Tokamak Experimental Power Reactor," Proc. of the Sixth IEEESymposium on Engineering Problems of Fusion Research, San Diego, Ca.,November 18-21, 1975, pp. 322-325.
VI-38

3. R. A. Marshall, "Design of Brush Gear for High Current Pulses and HighRubbing Ve loc i t i e s , " IEEE Transactions on Power Apparatus and Systems,PAS-85, November, 1966, pp. 1177-1188.
4. H. A. Peterson, N. Monam, W. C. Young and R. W. Boom, "SuperconductiveInductor-Converter Units for Pulsed Power Loads," Proc. of In terna t ionalConference on Energy Storage, Compression and Switching, Ast i-Torino,I t a l y , November 5-7, 1974, plcnum Press , N.Y., 1976, pp. 309-317.
5. W. F. Praeg, "A Saturated Time-Delay Transformer for Overcurrent Pro-tect ion of dc Acce le ra tors , " ANL/CTR/TM-59, Argonne National Laboratory(December, 1975).
6. C. W. F l a i r t y , "A 50 kW Adjus table-Frequency 24-Phase Controlled Rec-t i f i e r I nve r t e r , " IRE Transactions on Indus t r ia l Electronics (May,1962).
7. F. E. Mi l l s , et a l . , "Cryogenic Energy Storage System Design Report ,"FN-264, Fermi National Accelerator Laboratory (October, 1974).
8. C. I . Budker, "An Effective Method of Damping P a r t i c l e Osc i l l a t ions inProton and Antiproton Storage Rings," Soviet Atomis Enerqy, _22_, 4 38(1967). ' "
VI-39

CHAPTER VII
VACUUM SYSTEMS
The toroidal vacuum system of the EPR provides the vacuum conditions
necessary to initiate and maintain a thermonuclear plasma within the 711 m3
volume of the torus. Pumping by the 32 cryosorption pumps, following a burn
cycle, is sufficient to reduce the pressure within the toirus to 1 x 10" 5
Torr in less than 15 s. The cryosorption pumps will be regenerated every
four hours to remove the deuterium and tritium that has been pumped and
stored upon the liquid helium-cooled panels, for reasons of safety and to
reduce tritium inventory. Two sets of cryosorption pumps are provided to
allow for continued operation during the regenerating period.
Neutral beam vacuum system requirements are rather severe. Each of
twelve beam injectors requires "v 5 x 10⁶ l/s of pumping. One hundred square
meters of cryosorption panel are required for each injector. To allow
continued operation during regeneration, the pumping area will have to be
twice this amount, and means must be provided for isolating that portion of
cryosorption panel to be regenerated.
The high impedance characteristics of the waveguide used for lower hybrid
mode rf heating will necessitate a separate pumping system to assure adequate
reduction of pressure along its length. The pump, either a mercury diffusion
or turbomolecular pump, must have an effective speed at 10,000 l/s to main-
tain the desired pressure of ^ 1 x 10~6 Torr at the waveguide window.
A. Toroidal Vacuum System
The EPR toroidal vacuum system must: (1) evacuate the residual gas from
the toroidal chamber after a burn pulse in a time that is short compared to
the burn pulse, in order that a reasonable duty cycle can be achieved; and
(2) achieve a base pressure less than 10~8 Torr at the beginning of an
operational period.
The residual gas load after a burn is shown in Table VII-1. This gas
load is based upon the reference case burn cycle described in Chapter III.
It is assumed that the gas in the chamber at the end of the burn pulse is in
thermal equilibrium with the first-wall, for the purposes of computing
the chemical composition and the pressure of the residual gas.
VII-1

Table VII-1. EPR Gas Load After Burn
<MH
.-.,11Ti>n;>.(°C)
1000
1 pll_
10
8
!<)
8
10
8
10
8
JO
8
10
8
10
8
10
8
10
8
10
8
10
8
10
8
T
T
1
T
T
I
T
T
T
T
T
T
T
•'
T
T
T
T
T
T
T
T
T
T
3178.
2027
29 32
18 7(1
2685
1712
24 16
1553
9 6
0 6
84
11
6 5
61
54
89
2186.36
1394
19 35
1234
1685
10 74
1435
9 1 5
11.14
755
934
595
808
515
738
468
18*
9 5
6 8
51
9 6
06
23
b\
50
17
78
94
92
8 1
00
t>
5
4
3
1
9
9
7
I
8
3
2
1
1
5
4
on*
7
1
9
6
3 1
62
62
S2
1.27
2
0
0
9
5
3
.5
.2
. 6
.3
. 8
. 1
. 7
. 3
. 6
.7
. 3
.2
. 2
49
62
4 l
X
x
X
X
X
X
X
X
X
X
X
X
X
X
X
X
10" ;
10"-'
10"'
lo->
10~*
lo-'
10"'
io-'
io- 'i
10-io
!(,-!•.
10" l"
i o - "io- >7
10":a
io-1 0
3
I
2 .
1 .
1 .
1 .
0 .
(I.
0 .
5
1-4
1
2
2
1
1
7
7
2
2
4
4
-
. 2
.2
. 1
. 1
. 8
. 8
. 9
. 9
. 8
. 8
6S
89
6 0
2(>
4 0
36
0 1
X
X
x
X
x
X
X
X
X
X
X
X
X
—
1
111-
10"
10"
10"
111"
10"
10"
10"
10"
10"
!()-
1 0 -
<
7
11
; i
i '
1',
9
a
7
l
b
1
0 .
0 .
0 .
n
0 .
0
0 .
0
2
. 0
0
5 . 0
8
4
7
4
5
3
J
-
3
1
2
1
. 7
. 0
. 1
. 0
. 4
. 0
. 8
. 0
. 0
.5
.5
. 3
11'
02
01
018
x
01
X
0 !
X
X
X
,_
X
X
X
X
X
X
X
X
X
X
X
X
X
10"
)
10"
'•
10"
10"
10"
l i r
1 0 -
i ; r
1 0 "
1 0 "
io-
10"
10"
10"
10"
10"
1 0 -
10"
10"
••
J
.'
;
i
'
i
3
J
}
j
l.n.icl
IIL
9 .
K i .
9 .
1)
(T
i i
18
9 3
55
40
80
92
2 3.68
14
21
9 8
79
D.8B
19
12
16
10
14
9
11
7
9
5
8
5
7
4
16
34
86
7 ' ,
35
17'
85
55
9 6
. 0 9
15
33
. 6 8
r r-
1
1
2
1
2
1
2
8
1
7
1
6
1
5
1
4
8
3
6
2
5
2
4
1
)
0
• ' •
9
2
5
0
0
8
9
5
6
4
3
1
I
3
3
.2
.5
.1
. 2
. 8
.9
H
X
*
X
X
X
X
X
X
«
X
X
X
X
X
X
X
X
X
X
X
x
X
X
in"'-
l d -
10-''
l o - '
10" '
11)-''
10"' '
Id- '1
ur'1(1-''
lo-'-io-1
10-''
10"''
lo-'-
ur'IO-1-
lO"1'
10"''
10-''
10-''
l O " 1 '
nr6
10-'
Ik
529.
137.
• . « / .
311.
446.
284
404
25?
362
2 11
3 2 !
204
279
1 7 8
21
54
.,4
02
07
51
51)
99
9 3
4 8
15
%
78
4 5
2 1H.21
151
196
125
155
98
134
85
121
77
9 3
1)4
42
06
9 0
. 2 8
. 6 4
. 8 1
. 6 9
A
1 5 . 94
10.1/
1 4 .
9 .
1 1 .
8 .
1 2 .
7
10
6
9
6
8
5
7
5
3
4
2
4
2
3
69
17
VI
57
18
77
93
9 7
68
17
4 3
18
18
58
92
78
67
9 8
.04
58
07
34
Ik
520.
3 32
4 7 1 .
10!.
4 2 3
2 70
01
• ill
0 7
61
25
58
180.HI
24 I
14 1
217
301
192
262
167
223
142
184
117
145
9 2
12(.
80
114
7 1
01
12
59
99
61
92
69
85
78
. 7 9
. 8 6
. 7 2
. 94
. 1 9
. 4 8
. 4 7
. u :
1
1
1
6
5
1
9
7
5
;
5
3
3
1
1
1 .
0
0 .
0
0
6
5
2
0
1
2
0
6
. 2
. 6
. 9
. 2
. 2
12
89
18
14
0 2
X
X
X
X
X
X
X
X
X
X
X
X
X
X
—
. . .
—
—
] [ > - •
10" ;
io- •
10"'•
10- ' -
! ( ) * • ' •
1 0 " '
l o - '•>
ur 'io-1-1
10-12
i o-i*
l (r''-
Kr-•"
5 . 8
i . 2
L \ 0
2.0
1.0
;\o
3 . 0
i . O
b.U
h.h
7 .7
1.1
7 .7
7 .7
-
x
X
X
X
K
X
X
X
X
X
X
X
X
X
X
X
X
X
-
—
-
—
-
1 0 "
io-
1 0 "
10"
1 0 "
1 0 -
10"
lo -
10"
1 0 "
1 0 "
nr
• •
' .
;
1.
1.:
lo-".10"
urio -
io-
10"
-
-
-
-
-
! ' •
• • ;
. i
. «
Includes tritium and deuterium.

Reduction of the residual gas density by two orders of magnitude is the
design requirement for the toroidal vacuum system. Because impurities (He,
Be) are on the order of 10% in the residual gas, a 102 reduction in the
residual gas density should suffice to limit the impurity concentration
in the new gas charge to on the order of 0.1%, which is acceptable from
a plasma contamination viewpoint. The design objective of a 75% duty cycle
can be satisfied if the chamber evacuation takes place in 10-20 s.
The required pumping speed is determined from
EL2.303 V Log10 pj (VII.-l)
S = ^
where V is the chamber volume, pi and P2 are the initial and final pressures,
and At is the pumpdown time.
The pressure P2 is the pressure existing at the start of a new cycle
and is assumed to be 1 x 10~5 Torr. Pressure P], based on 10 T operation,
500°C first wall temperature, and a gas load of 2588 Torr-2, is ^ 2.2 x 10~3
Torr. The effective speed,S ,,,is a function of the conductance of the
pumping ducts and the speed of the pumps, and is derived from the formula,
+ ^eff pump duct
Under the conditions given above, At is less than 15 s. The principal char-
acteristics of the toroidal vacuum system for the EPR are given in Table
VII-2.
The toroidal vacuum chamber is preconditioned to a base pressure less
than 10~8 Torr at the beginning of each operational period. Preconditioning
consists of decontamination of the first-wall surfaces either by a bakeout
at temperatures at least 100°C above the operating temperature or by dis-
charge cleaning.
The feasibility of using the toroidal vacuum system to remove the gas
diffusing out of the plasma by continuous pumping during the burn cycle was
examined. A representative gas load can be computed from the particle flux
to the wall shown in Table VII-3.
VII-3
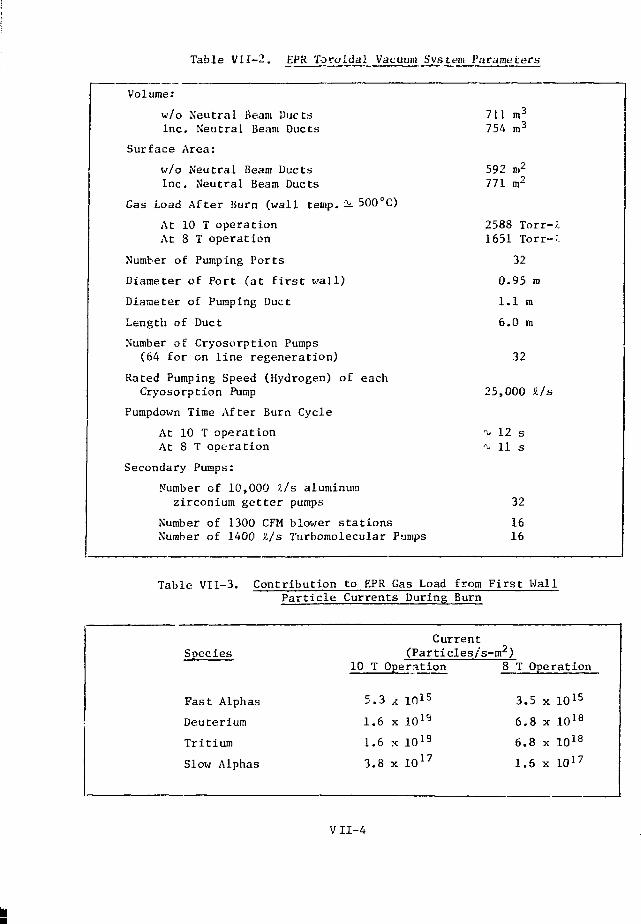
Table VI1-2. EPK Toroidal Vacuum System Parameters
Volume:
w/o Neutral Beam DuctsInc. Neutral Beam Ducts
Surface Area:
w/o Neutral Beam DuctsInc. Neutral Beam Ducts
Gas Load After Burn (wall temp, i 500°C)
At 10 T operationAt 8 T operation
Number of Pumping Ports
Diameter of Port (at first wall)
Diameter of Pumping Duct
Length of Duct
Number of Cryosorption Pumps(64 for on line regeneration)
Rated Pumping Speed (Hydrogen) of eachCryosorption Pump
Pumpdown Time After Burn Cycle
At 10 T operationAt 8 T operation
Secondary Pumps:
Number of 10,000 2,/s aluminumzirconium getter pumps
Number of 1300 CFM blower stationsNumber of 1400 Z/s Turbomolecular Pumps
711 m3
754 m3
592 n.2
771 m2
2588 Torr-^1651 Torr-l
32
0.95 m
1.1 m
6.0 m
32
25,000 Z/s
^ 12 s-v 11 s
32
1616
Table VII-3. Contribution to EPR Gas Load from First WallParticle Currents During Burn
Species
Fast Alphas
Deuterium
Tritium
Slow Alphas
Current(Particles/s-m2)
10 T Operation 8 T Operation
5.3 x 10¹⁵
1.6 x 10¹⁹
1.6 x 10¹⁹
3.8 x 10 1 7
3.5 x 10 1 5
6.8 x 10 1 8
6.8 x 10 1 8
1.6 x 10 1 7
VII-4

In terms of individual molecules, the ideal gas law can be written
r = NkT where N is the number of molecules per unit volume and k is the
gas constant per molecule or the Boltzman constant. From this it can be
shown that the number of molecules per cin , N, is given by
pN = 9.6 x 10 1 8 —• (VII-3)
where p is the pressure in Torr and T is the absolute temperature = 773°K.
By substitution (using 10 T operating values),
(5.3 x 10¹⁵ + x.o x xu- + i ^ + 3 < 8 x 1Q17. ( A ) p
^ = 9.6 x 10 1 8 —•
where A = surface area of torus = 592 mz
V = volume of torus and neutral beam ducts (754 m ) minus volume
of plasma (544 m3) = 210 m3 or 2.1 x 10s cm3
then
p = 3.72 x 10~3 Torr, the pressure rise per second
The gas load p V = Q = 781 Torr-£/s. With thirty-two 1.1 meter diameter
ducts and thirty-two 25,(
tained during a burn is,
ducts and thirty-two 25,000 i/s pumps, the b33e pressure p that can be main-is
P, = -T^rk 7 (VII-4)b W ( ef r
where Q = Gas load = 781 Torr-£/s
N = Number of pumps = 32
S f f = Effective speed of each pump = 13,357 l/s.
Then p,, = 1.83 x 10~3 Torr
Assuming no pumping b' the plasma itself, the toroidal vacuum system can
maintain a pressure of 1.83 x 10~3 Torr during the burn cycle. It is likely,
however, that the plasma will pump D--T and He back into the plasma quite
effectively. Since the cryosorption pumping ports represent only ^ 4% of
the first wall area, the plasma would be the dominant purap, and the concern
is that the D-T may collect in the outer edge region and not diffuse to the
middle. This result would require additional refueling and lead to a pressure
VII-5

buildup of relatively cool gas in the outer regions.• This could have un-
favorable; consequences for a plasma burn wnich is longer than a particle
confinement time (T 'V 5-10 s). It appears that the toroidal vacuum system
would be ineffective in eliminating these potential unfavorable conditions.
Because of its ineffectiveness during the burn cycle, it is intended to
isolate the toroidal pumping system from the plasma region during the burn
cycle.
Isolation of the toroidal pumping system from the plasma region will
be done with plug /alves (Figure VII-1). With this valve there are some added
advantages, relative to a butterfly valve previously envisioned for this
function. Whether open or closed, it will act as a baffle against radia-
tion, and since no moving parts exist at the plug end it should provide
more, reliable operation under the extreme conditions for which it raust
perform. Although the plug valve adds some impedance, the increase in
diameter at the duct results in a pumpdown time, after the burn cycle, of
^ 12 s.
Some thought has been given to the possible advantage of pumping the
^ 127i helium gas load by means other than cryosorption. Figures ViI-2
and VII-3 show the adsorption of hydrogen and helium on cryosorption
panels at low temperatures and pressures. In the intended operating
pressure range of the EPR, 1-5 x 10~3 Torr to 1-5 x 10~5 Torr, it appears
that hydrogen can be pumped effectively even at temperatures of 20°K, while
pumping helium at this temperature becomes impractical. In Table VII-4 it
can be seen that the pumping speed of helium is barely measurable even at
17°K and does not increase very rapidly until below 10°K. The pumping speed
is also very dependent on the temperature of the baffles shielding
the cryosorption panel. Table VII-4 shows very little pumping at 10°K
with a shielding temperature of 77°K. The shielding temperature for the
adsorption curves shewn on Figure VII-3, however, is 15°K and good ad-
sorptive capacity is shown with the cryosorption panel even at 12°K. This
difference in panel and shielding temperature requirements between the
two gases suggests the possibility of pumping the helium with mercury
diffusion or turbomolecular pumps and running the cryosorption panels
at ^ 15°K with somewhat higher shielding temperatures, for pumping the
hydrogen only.
VII-6
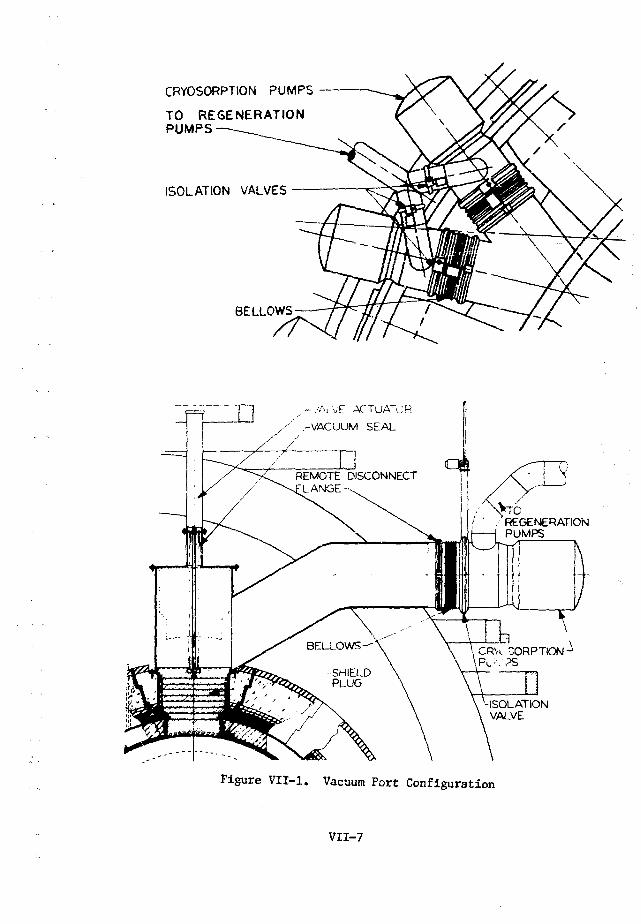
CRYOSORPTION PUMPS
TO REGENERATIONPUMPS
ISOLATION VALVES
BELLOWS
I ^.-.••AiVE ACTUAL"/ ' -VACUUM SEAL
REMOTE DISCONNECTLANGE-
' , REGENERATIONPUMPS
-SHIELDPLUG
-ISOLATIONVALVE
Figure VII-1. Vacuum Port Configuration
VII-7

CO
IO2o
moa
iro
o11100acoCOQ
CO< • • : . '
10'
10°
8°K
o-EXPERIMENTALPOINTS, 20°K.
* CORRECTED FORTHERMONUCLEAR EFFECT
10~9EriH| | i
10~9ii||| rrmj—r
. i o-*11 irn|—|-
IO~5nTiT
10- 4
PRESSURE^tORR *
Figure V H - 2 . Adsorption of hydrogen on Molecular Sieve 5A at low temperaturesand pressures. Experimental points obtained at 20cK. Below '•'••10""^ Tprr experimental points are affected by residual pressure
,, of the apparatus.^
m3Eo
QUJ00
tcOV>a<
-EXPERIMENTALPOINTS, 4.2*K.
* CORRECTED FORTHERMONUCLEAR EFFECT
I0"9 10"6 10"
PRESSURE, TORR *
Figure VII-3. Adsorption of helium on Molecular Sieve 5A at low temperaturesand pressures. Experimental data obtained at 4.2°K Below10~^ Torr experimental points are affected by residual pressureof the apparatus.2
VII-8

Table VII-4.
CryosorptionTemperature (
17.0
13.6
10.0
4.2
Cryosorption Fumping of(on Kolecular Sieve 5A
Panel Gas Temperature°K) (°K)
77
77
77
4.2
flelium as a Function oiCryosorption Panels).-*
Maximum Pumping Speed(liter/sec-ft2)
Barely measurable
55
720
27000
Temperature
StickingCoefficient a
—
3.7 x 10"3
4.8 x 10~2
0.9
Ihe decision as to which way to pump the helium is a matter of eco-
nomics and availability of space. Table VII-5 shows the cryogenic re-
quirements to cool down and maintain thirty two 25,000 IIs (hydrogen)
cryosorption pumps for pumping both hydrogen and helium. These figures
are extrapolated from requirements for an twisting pump with a speed of
12,000 l/s for hydrogen. These figures do not Include line losses, cool
down after regeneration, and thermal loads from the neutron flux. Assuming
an 8CK operating temperature and a 30°K regenerating temperature, then the
quantity of heat, Q,required to cool the ^ 6.00 pound aluminum cryosorption
panel having a constant specific heat, c, and causing the temperature to
change from Tj to T2 is,
Q = Mkc (T2 - Tx) (VII-5)
Table VII-5*
A.
B)
Cryogenic Requirements for Thirty-Two 25,000 £/sCryosorption Pumps
Liquid Nitrogen
1) Cool down to 80°K and Fill
2) Usage Rate (after cool down)
Liquid Helium
1) Cool down from 80°K and fill
2) Usage Rate
(Hydrogen)
3660 liters
36 liters/hr
4990 liters
22 liters/hr
VU-9

where Q = B
M = pounds
T2-Ti = °C
k = 1.8
c (aluminum) = 0.226
then Q = 53.7 B
Since the heat of vaporization of helium is 10.26 Btu/lb and one pound of
helium is equal to 3.631 SL of liquid, 19 I of liquid helium would be re-
quired to cool the 6 lbs of aluminum cryosorption panel from 3 0 ^ to 8°K.
Repeating the above exercise but assuming an operating temperature of 15°K
for just pumping hydrogen, the usage rate for cool down after each regeneration
reduces to 13 I of liquid helium. The difference of 6 I of liquid helium per
pump or a total of 192 £ represents the savings in liquid helium used during
each regeneration if the 32 cryosorption pumps are used to pump hydrogen only.
This amount appears insignificant when regeneration of the pumps is only due
to saturation, which would occur after 1100 burn cycles or about every 18.5
hours. Due to the desire to minimize tritium inventory and to the safety
precautions regarding large volume storage of explosive gases, however, re-
generation will be every 4 hours. With a four-hour regeneration cycle the
differences in cryogenetic requirements becomes significant and would effect
cryogenic storage and equipment costs.
Another aspect to consider in the decision on how to pump the helium
is the partial pressure of the helium itself. At an 8°K operating tempera-
ture the effective pumping speed for helium is ^ 4500 Z/s with the pro-
posed cryosorption pump. With 32 pumps a pumpdown time of ^ 20 s would
be required to reduce the partial pressure of the helium to 1 x 10~^
Torr after a burn cycle. The gas load TII the torus at this point would
be essentially all helium. If this partial pressure of helium is too high,
the effective speed for helium can be raised to ^ 8000 i/s per pump by
reducing the operating temperature of the cryosorption pump to 4.2°K.
At the end of 12 s of pumping the partial pressure of helium will be
^ 7 x 10~6 Torr and the partial pressure of hydrogen will be ^3 x 10~6
Torr. Lowering the operating temperature will raise the total extra liquid
helium required to cool down after regeneration from 192 £ to about 300 £.
V11-10

I To realize an effective speed of 8000 Z/s for helium, a mercury
diffusion pump must have an unbaffled speed of at least 20,000 A/s.
A pump of this speed will be about 76 cm in diameter and, by the time it
is baffled and mounted, will have a height of about 3 m. If used, it
would be mounted to a pipe connecting each pair of cryosorption pumps (one of
which is pumping while the other is being regenerated). Valves on either
side of the mercury diffusion pump would permit isolation from the cryo-
sorption pump being regenerated.
Instead of the mercury diffusion pump, a large turbomolecular pump could
be used. Large turbomolecular pumps with pumping speeds in excess of
10,000 l/s for both hydrogen and helium have been in use for at least
3 or 4 years and have a good history of reliability. The pumps have a
maximum diameter of about 1 m and would require a vertical height of
about 1.5 m mounted. The mounting of the large turbomolecular pumps
would be identical to that prescribed for the mercury diffusion pumps above.
After consideration of all the above points, it was decided to pump
both hydrogen and helium with the cryosorption pumps. The additional
cryogenic requirement to pump helium becomes insignificant in comparison
to the large quantities required for the superconducting magnets. The
added space requirement for separate helium pumps, especially with the
additional need for large regenerating pumps in the same area, also makes
the dual pumping role for the cryosorption pump look more attractive.
Regeneration of the cryosorption pumps on the EPR requires special
attention. After each burn cycle, each cryosorption pump will store ^ 81
Torr-Jt of gas. Assuming one burn cycle every minute, each pump will store
•v 19,440 Torr-il liters of gat. in four hours of operation. To regenerate
the pumps after four hours, it is intended to raise the temperature of
the cryosorption panels to 30°K to release the hydrogen and helium and
then cool the panels back down to operating temperature. Raising the
temperature to 30°K must be a gradual process so that the regenerating pump
can maintain a pressure of 1 x 10~3 Torr or less. If the pressure is per-
mitted to go much higher than this, due to too rapid a release of gas, heat
conduction will cause a sharp increase in cryogen required to maintain
the proper temperature on the shielding baffles and to return to operating
temperature.
VII-11
To help simplify processing in the tritium recovery circuit, getter
pumps, such as zirconium/aluminum, are planned for regenerating the cryo-
sorption pumps. Upon activation of the zirconium/aluminum getter, the
tritium and deuterium are released but other gases such as nitrogen and
oxygen are held. When the getter elements become saturated with the retained
species of gas, they must be replaced. Effective pumping is maintained
with the elements at ^ 300°C. Activation temperature is approximately
700 to 800°C. The 19,440 Torr-ii released at each cryosorption pump
will result in a volume of ^ 30 x 106 I of gas, at 1 x 10~3 Torr and
300°C, going to the zirconium/aluminum pump. Of this volume ^ 4 x 10⁶ H
is helium and is pumped by another pump on the opposite end of the
zirconium/aluminum pump. With an effective speed of 10,000 £/s the
zirconium/aluminum pump will take about 45 minutes to getter the remaining
gas. Once isolated from the cryosorption pump, the hydrogen isotopes can
be released for circulation through the fuel recovery circuit.
One zirconium/aluminum getter pump will serve each pair of cryosorption
pumps. Mounting of the zirconium/aluminum pumps will be similar to that
prescribed for the mercury diffusion pumps above. The physical size of
these pumps will be approximately 1-m in diameter and about 1-m long.
Each pump will contain about 3 m2 of zirconium/aluminum getter surface
and sufficient heaters to raise and control the temperature of these
surfaces up to -v 800°C.
B. Neutral Beam Vacuum Syt-tem
Pumping requirements for each neutral beam injector is divided between
two chambers (see Figure V-l). Chamber 1 is on the inlet side of the neu-
tralizer and Chamber 2 is on the exit side of the neutralizer.
The gas load in chamber 1 is calculated to be 90 Torr-£/s. Assuming
an average pressure of 3 x 10~5 Torr as adequate in Chamber 1, the required
pumping speed will be "••• 3 x 10J l/s. This rate of pumping speed requires
•' 60 m2 of cryosorption panel. In Chamber 2, the gas-load wiln be 20 Torr-
?./s. With an average pressure of 1 x 10 Torr, the pumping speed required
will be •''-' 2 x 10⁶ J./s. Approximately 40 m of cryosorption panels are
required to provide this rate of pumping speed. The gas loads given above
are for Reference Design I (Table V-8).
V11-12

Impeiance of the gas flow must be avoided, and this is accomplished by
placing the panels within the neutral beam enclosure itself. Utilizing the
vertical side walls of this enclosure appears most appropriate. Dividing
the pumping surface equally between both sides of the enclosure will insure
more uniform pumping.
In the practical application, the cryosorption panels will have to be
shielded from contamination by condensable gases by means of an array of
baffles refrigerated to temperatures between 4.2° and 20°K. The array
has the function of cryopumping the condensable gases, and its actual
temperature depends on the nature of these gases and the vacuum level
desired. This array of baffles will have to be shielded, in turn, from
thermal radiation and energetic particle bombardment by a second array
of baffles refrigerated to ^ 77°K. The above panel area requirements
are based on the pumping speed of shielded panel. Estimated cryogen re-
quirements are given in Table VII-7. These figures do not include line
losses, cool down after regeneration, and thermal loads from the neutron
flux.
Periodic regeneration of the cryosorption panels will be necessary.
To avoid interruption of reactor operation at this time, cryosorption panel
area can be doubled and the means provided for isolating half of the area
for regeneration while the other half is pumping. One way cf accomplishing
this would be to put half the pumping panels on moveable walls and the
other half on the neutral beam enclosure top and side walls. When the
moveable walls are down, they isolate the enclosure walls, thus permitting
them to be regenerated. When the moveable walls require regeneration, they
are pulled upward into pockets where they are regenerated. Cryogen re-
quirements in Table VII-7 will double if the panel area is doubled.
If warming up the huge cryosorption panels in the neutral beam in-
jectors above 30DK during regeneration is to be avoided, large volumes of
gas will have to be handled. Should regeneration be accomplished every four
hours, as for the cryosorption pumps in the toroidal vacuum system, a
gas load of % 1.9 x 10e Torr-£ of gas at 1 x 10~3 Torr or 1.9 x 10⁹ I
will have to be pumped from each injector. A pump with an effective speed
of 250,000 S./s would be required to degass the cryosorption panels of each
injector in two hours. This would leave two hours to cool the panel down
vil-13

Table VII-6. Neutral Beam Vacuum
No. of Injectors
Volume/Inj ector
Surface Area/Injector
Gas Load/Injector
Cryosorption Pumping/Injector
Effective Pumping Speed/Injector
Secondary Pumps:
Aluminum/ZirconiumGetter Pumps
No. of 1300 CFM BlowerStations
No. of 1400 il/s Turbo-molecular Pumps
System Parameters
12
250 m3
254 m2
110 Torr SL/s
100 m2 of panel
5 x 10⁶ SL/s
12-25,000 SL/s
Same 16 as on Torus
Same 16 as on Torus
Table
A.
B.
VII-7. Cryogenic Requirements forInjectors
Liquid Nitrogen
1) Cool down to 80°K
2) Usage Rate (after cool dov,n)
Liquid Helium
1) Cool down from 80°K
2) Usage Rate
12 Neutral Beam
274,500 I
2,700 Jl/hr
374,250 SL
1,650 2/hr
V 1 1 - 1 4

to operating temperature. It probably would be more economical to remove the
gas at 1 x 10"^ Torr. This would require one tenth the pumping capacity to
remove the gas in the same period of time. The saving in space and pump
costs would offset the cost of extra cryogen required due to conduction
losses at 1 x 10~2 Torr. The regenerating pomps for the neutral beam
injectors could be zirconium/aluminum getter pumps as used on the toroidal
system. Once gettered, the gas can be released when convenient for processing
in the recovery circuit.
C. Waveguide Vacuum System
Some form of supplementary heating power would be required to reach
ignition in the EPR. One of the suggested means of supplying this supple-
mentary heat is by radio frequency in the lower hybrid mode. Launching of
the electromagnetic heating wave into the plasma is through the opening of
a irGrill" waveguide structure.
The waveguide structure, Figure V-10, when viewed from the plasma
region looks like a grill. Each opening in the grill structure, however, is
the entrance to a duct, "v 4.5 m long, between the plasma region and a
ceramic window. The ceramic window isolates the plasma region from the
klystron region. Sixteen such ducts form the "Grill" waveguide structure.
At the start of an EPR cycle, ionization will very quickly reduce the
neutral atom density in the torus to a pressure equivalent of ^ 2 x 10~6
Torr. Although the pressure within the waveguide will also be reduced by
this source, a separate pumping system is being considered for the waveguide
to assure adequate reduction of pressure along its length.
A requirement of 1 x 10~6 Torr at the waveguide window and 2 x 10~5 Torr
at the torus is assumed. Then
Q = 2C (p2 - Pi) (VII-6)
where
Q = Gas load in Torr i/s
C = Conductance per sector of waveguide = 63 H/s
p2 = 2 x 1CT6 Torr
P! = 1 x 10"6 Torr
V U-15

and Qi for one sector is 2.78 x 10"1* Torr £/s. For the 16 sectors the gas
load is 4.45 x 10~3 Torr i/s.
To assure proper operation of the waveguide, pumping must be done through
holes in the waveguide sectors no larger in diameter than 1/2 inch. Fifteen
1/2 inch holes, grouped together on each narrow side of every sector and
close to the window, will assure adequate pumping conductance. A manifold
will be built around the section of waveguide containing the 1/2 inch holes.
The pump, either a mercury diffusion or tubomolecular pump, must have an
effective speed of i< 10,000 Z/s to provide the required pumping.
1. W. M. Stacey, Jr., "Tokamak Experimental Power Reactors Studies,"Argonne National Laboratory Report ANL/CTR-75-2 (1975).
2. P. J. Gareis and S. A. Stern, "Cryosorption Pumping of Helium andHydrogen," Cryogenic Engineering News (October 1967), Systems Engi-neering and Research Laboratory, Linde Division, Cheswick, Pennsylvania.
3. G. E. Grenier and S. A. Stern, "Cryosorption Pumping of Helium at 4.2°K,"J. of Vac. 3ai and Teeth. , Vol. 3(6) (1966).
4. Ralph G. Hudson, The Engineers Manual, John Wiley & Sons, Inc., UnitedScates, 2nd Edition, page 156.
5. Industrial Gas Data, Air Reduction Company, Inc., ADE-890B, Printedin U.S.A.
6. Information received from AIRCO Temescal, a division of Airco» Inc.
V11-16

CHAPTER VIII
THE FIRST-WALL SYSTEM
A major problem relating to the achievement of the EFR objectives is
the satisfactory design of the first-wall syst«n. The primary function of the
.first-wall system is to provide a low pressure region of controlled impurity
level and appropriate geometry in which satisfactory plasma burn can occurar Fc
purposes ol this discussion, the first-wall system includes the vacuum vessel
that surrounds the plasma region and other associated components such as a
coolant panel liner, a flux breaker, and the vacuum wall penetrations. In
the present study a conceptual design for the first-wall system has been
developed and subjected to sufficient analysis to indicate that it meets
requirements imposed by plasma impurity control, materials integrity, fabri-
cation and assembly, and thermal-hydraulic performance. Table VIII-1 con-
tains a summary of design and operating parameters for the present EPL
first-wall system.
The current first-wall reference design consists of a 16-segment
self-supporting vacuum wall of stainless steel plate with external rib
and spar support. A three-point suspension system is used to support each
of the sixteen cylindrical segments that form the irregular toroidal wall.
Detachable water-cooled panels shield the more permanent vacuum wall from
the high heat fluxes deposited on the plasma-exposed surface. The operating
conditions and allowable lifetimes of the vacuum wall are limited primarily
by: (1) loss of ductility caused by displacement damage and helium generation
at the high neutron fluxes; and (2) dimensional instabilities that result
from radiation creep, radiation-induced swelling and thermal creep. Pres-
surized water is considered to be the most effective means of removing the
large quantities of heat deposited in the coolant panels. In addition to
extensive radiation damage, the coolant panel will ce. subjected to severe
thermal fatigue produced by the cyclic heat deposition (equivalent to ^ 20%
of the neutron wall loading) that results from the cyclic nature of the
plasma burn. Excessive thermal cycling poses a major limitation to the
the expected lifetime of the coolant panel. A low-Z liner in the form of a
thin plasma-sprayed beryllium coating on the plasma-exposed surface of the
coolant panel is used for control of the high-Z impurities in the plasma.
VIIi-i

Table VITI-1. First Wall Design and uperating Parameters
DES1CN DESCRIPTION
DESIGN PARAMETERS
Vacuum Chamber
MaterialDesign stress (ksi)Major Radius (21)^inor radius (m)Volume (m3)Wall Area (m2)Wall Thickness (tin)Ring and Spar
width (en)depth (cm)
Vacuum ports
numberdiameter (m)total port area (ni2)
Auxiliary Heating ports
numbertotal port area (i?*-)
Experimental ports
numberdianpter (n)
Current Br*:dker
oa'^ria'fortpreparation
Coolant panel
MaterialNumberArea per panel (m2)Length (m)Width (m)Total panel thickness (ca>Thickness front wall (cm)Low-Z coating
materialthickness (urn)preparation
Free-standing, stainless steelvacuum wall with rib and sparreinforc'ng
Detachable, vafr-cooled stain-less steel panels to shield vacuumwall from plasma
Low-Z coating on plasma-exposedface of coolant panel for hlgh-Zimpurity control
316 SS106.252.'.Til5922
511
320.9522.7
Cr2O3
coatingchemical bond
316 SS3521-21-2•>• 1
•b 1
0.5
Be100-200
plasma spray
PLASMA PERFORMANCE - NCMiKAL
Capacity factor (5!)
Operating Cycle
Burn (s)
Exhaust and replenishment (s)
Average power loading during burn
Neutron (MW/n2)Radiation, conduction, convection (MW/m2)
4515
0.50.1
VIII-2

Table VIII-1. First Wall Design and Operating Parameters (cont'd)
OPERATING PARAMETERS
Stainless steel vacuum wall
Maximum temperature (°C) < 500Minimum yield stress at 50D°C (ksi) 17Maximum annual fluence (n/m2) 6 x 10?s
Neutron Danage (dpa/y) 2.8Heliura generation (appm/y) 54Hydrogen generation (appm/y) 133
Stainless steel coolant panel
Maximum temperature (C°) 380Minimum yield stress at 500°C (ksi) 17Maximum annual fluence (n/m2) 6 x 1 0 "Neutron Daraage (dpa/y) 2.8Helium generation (appm/y) 54Hydrogen generation (appm/y) 133Maximum heat deposition (W/cm3) 5.8Maximum AT across panel surface (°C) 20Maximum AT through panel facewith Argon shutdown (°C) 100without Argon shutdown (°C) 75
Maximum AT during burn cycle ("C) 100Maximum thermal strain range
operating cycle (%) 0.14burn cycle (%) 0.0?
Beryllium coating
Maximum surface temperature (°C) 407Helium generation (appm/y) 780Hydrogen generation (appm/y) 12Maximum erosion rate (pm/y) 30
Water coolant
Maximum pressure (psi) 2000Velocity (m/s) 1.6Inlet temperature - first panel (°C) 40Exit temperature - eighth panel (°C) 310Pumping power (MW) < 1
DESIGN LIMITS
Vacuum wall
Design life (y) 10Integrated neutron wall loading (MW-y/m2) 2.5Yieid strength - 10 y (ksi) 75Uniform elongation - 10 y (£) > 1Radiation swelling - 10 y (%) < 4Limiting criterion ductility
Coolant panel
D.^ign life (y) 5Total burn cycles - 5 y 106
Fatigue lifetime (y) 5Radiation lifetime (y) 8Limiting criterion , thermal fatigue
Low-Z coating
Design life (y) 3-5Limiting criterion D*-T sputtering
VIII-3

IPhysical sputtering of the beryllium coating will be the major source of
pJasma contamination since blistering can be minimized by proper selection
of coating preparation.
An electric insulator in the form of a ceramic coating on two of the
vacuum-wall flanges serves as a current breaker for the first wall. In
addition to the insulator requirement, the flux breaker joints must also be
vacuum tight.
The design description, materials considerations, thermal and stress
analyses, and the research and development requirements for the first-wall
EPR reference design are discussed in the following sections of this chapter.
Additional background information pertaining to plasma impurity control,
materials considerations, and structural analysis of the first wall is pre-
sented in Appendices B, E, and H, respectively.
A. Design Description of the EPR First-Wall System
The principal requirements of the EPR first-wall are: (1) to protect the
plasma region from excessive atmospheric contamination, (2) to prevent ex-
cessive plasma contamination by products of plasma-wall interactions, and (3)
to maintain its structural integrity for sufficient times under the severe
radiation, thermal, and stress conditions imposed by an operating fusion
reactor. The firsc two criteria are essential for the attainment of satis-
factory plasma performance while the latter criterion is necessary to achieve
acceptable reactor lifetimes. Based largely on the materials and stress
considerations, the toroidal plasma chamber design consists of a structurally
self-supporting, stainless steel vacuum vessel. The vacuum vessel is equipped
with two electrically insulative rings that serve as breakers for the currents
induced in this vacuum wall. A number of ports in the vacuum vessel are pro-
vided for evacuation, neutral beam injection, instrumentation, experimentation,
and repair and maintenance. Replaceable water-cooled panels shield the more
permanent vacuum wall from the high surface heat loads produced by plasma
radiation and particle losses. These coolant panels are designed to with-
stand the high cyclic thermal stresses caused by the cyclic nature of the
plasma burn. The low-Z coating concept is used for control of high-Z im-
purities in the plasma. As indicated in Appendix B, satisfactory plasma
performance can be achieved with the beryllium coating. For the 0.5 MW/m2
V1II-4
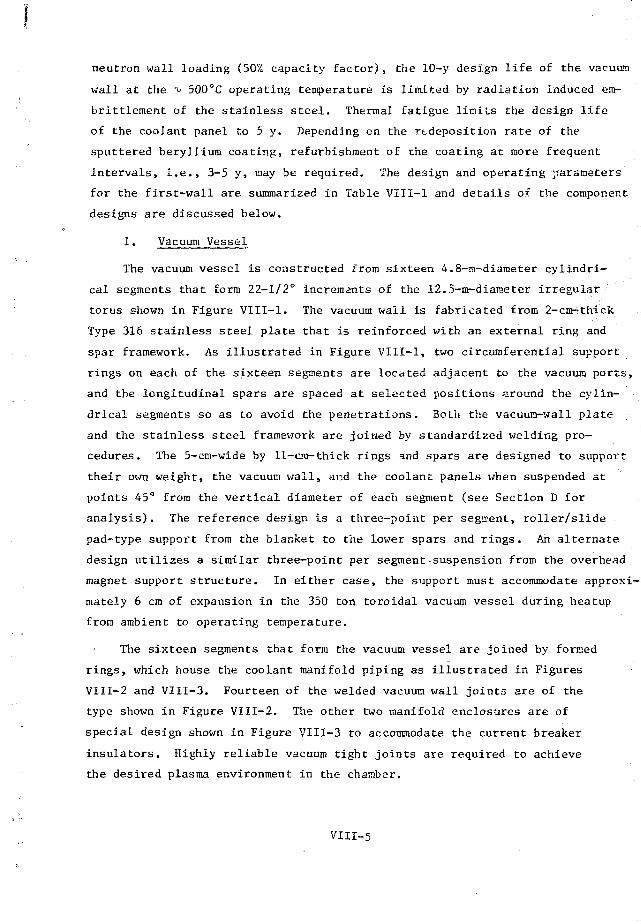
neutron wall loading (50% capacity factor), the 10-y design life of the vacuum
wall at the t> 500°C operating temperature is limited by radiation induced em-
brittlement of the stainless steel. Thermal fatigue limits the design life
of the coolant panel to 5 y. Depending on the rtdeposition rate of the
sputtered beryllium coating, refurbishment of the coating at more frequent
intervals, i.e., 3-5 y, may be required. The design and operating parameters
for the first-wall are summarized in Table VIII-1 and details of the component
designs are discussed below.
1. Vacuum Vessel
The vacuum vessel is constructed from sixteen 4.8-m-diameter cylindri-
cal segments that form 22-1/2° increments of the 12.5-m-diameter irregular
torus shown in Figure VIII-1. The vacuum wall is fabricated from 2-cm-thick
Type 316 stainless steel plate that is reinforced with an external ring and
spar framework. As illustrated in Figure VIII-1, two circumferential support
rings on each of the sixteen segments are located adjacent to the vacuum ports,
and the longitudinal spars are spaced at selected positions around the cylin-
drical segments so as to avoid the penetrations. Both the vacuum-wall plate
and the stainless steel framework are joined by standardized welding pro-
cedures. The 5-cm-wide by 11-cm-thick rings and spars are designed to suppox't
their own weight, the vacuum wall, ar.d the coolant panels when suspended at
points 45° from the vertical diameter of each segment (see Section D for
analysis). The reference design is a three-point per segment, roller/slide
pad-type support from the blanket to the lower spars and rings. An alternate
design utilizes a similar three-point per segment suspension from the overhead
magnet support structure. In either case, the support must accommodate approxi-
mately 6 cm of expansion in the 350 ton toroidal vacuum vessel during heatup
from ambient to operating temperature.
The sixteen segments that form the vacuum vessel are joined by formed
rings, which house the coolant manifold piping as illustrated in Figures
VIII-2 and VIII-3. Fourteen of the welded vacuum wall joints are of the
type shown in Figure VIII-2. The other two manifold enclosures are of
special design shown in Figure VIII-3 to accommodate the current breaker
insulators. Highly reliable vacuum tight joints are required to achieve
the desired plasma environment in the chamber.
VIII-5

VACUUM PORTS(16 PLACES-32 PORTS)
RF HEATINGPORTS (4)
EXPERIMENTAL-;PORTS (4) /
INJECTIONPORTS
\
NJECTION
22? P 0"T
(6 SEGMENTS)
(a)
RF HEATINGP0RTS,f4)
EXPERIMENTALPORTS (4>::
INJECTIONPORT
(b)
Figure VIII-1. Vacuum Vessel Torus, a. PartialPlan View. b. Partial Elevation
VIII-6
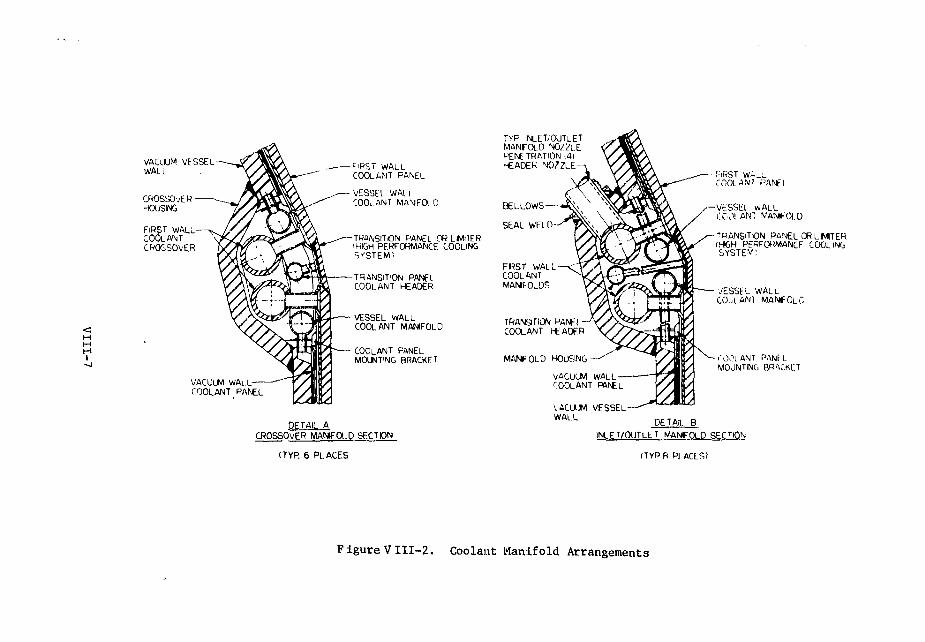
I
VACUUM VESSELWAL L
CROSSOVER-CK./3ING
FIRST WALLCOOL A MCROSSOVER
VACUUM WAL L —COOLANT PANEL
FIRST WALLCOOLANT PANEL
VESSei WAl ICOOLANT MANIFOLD
TRANSITION PANEL OR LMI7ER(HIGH PERFORMANCE COOLINGS ySTEM'.
TRANSITION PANELCOOLANT HEADER
VESSEL WALLCOOLANT MANIFOLD
COOLANT PANELMOUNTING BRACKET
DETAIL ACROSSOVER MANIFOLD SECTION
(TVR 6 PLACES
TVP INLET/OUTLETMANfOLD NOZZLEPENE TRAT1ON ,4)HEADER NOZZLE
B E L L O W S -
SEAL WEI 0-
FRST WALLCOOL ANTMANIFOLDS
TRANSITION PANELCOOLANT HEADER
MANFOLO HOUSING
VACUUM WALLCOOLANT PANEL
VACUUM VESSELWALL
• F I R S T W A _fOOLANI PANFl
—VESSEL WALLCCO! ANT MANIFOLD
TRANSITION PANEXORLMTER{HGH PEP.FOHMANCF COOLINGSYSTEM)
VESSEL WALLC O X A M MANFOLC
I ' O O L A N T PANFL
MOUNTING BRACKET
DETAIL B
INLET/OUTLET MANfOLD SECTIQN
(TYPft P| ACES/
Figure VIII-2. Coolant Manifold Axrangements
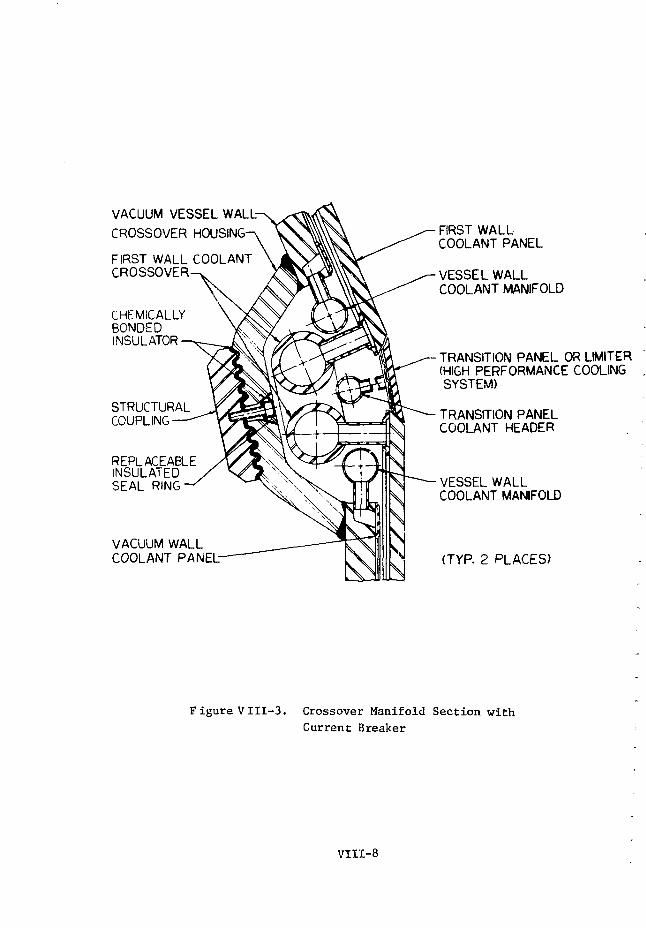
VACUUM VESSEL WALL-
CROSSOVER HOUSING
FIRST WALL COOLANTCROSSOVER
CHEMICALLYBONDEDINSULATOR
STRUCTURALCOUPLING
REPLACEABLEINSULATEDSEAL RING
VACUUM WALLCOOLANT PANEL-
FIRST WALLCOOLANT PANEL
VESSEL WALLCOOLANT MANIFOLD
TRANSITION PANEL OR LIMITER(HIGH PERFORMANCE COOLINGSYSTEM)
TRANSITION PANELCOOLANT HEADER
VESSEL WALLCOOLANT MANIFOLD
(TYP. 2 PLACES)
Figure VIII-3. Crossover Manifold Section with
Current Breaker
VIII-8

Cooling of the vacuum vessel is accomplished by circulating pressurized
water in a network of channels that line the plasma side of the vacuum wall
as shown in Figure VIII-4. The channels are formed by roll bonding pre-formed
stainless steel sheet to the vacuum wall by the Panelcoil* process. The
coolant section consists of O.i-cm-high by 0.75-cm-wide parallel channels
that extend across the vacuum wall segments as shown in Figures VIII-4 and
VIIL-5. Each section covers from 1 to 2 m2, depending on the position in
the vessel. These coolant sections have their own header systems that
supply high pressure coolant from the manifold piping. The header systems
are designed to permit coolant from one vessel segment to flow through
successive segments or to return headers as required. Sufficient coolant
is provided to maintain the vaci-um wall at temperatures below 500°C. Struc-
tural components, such as the reinforcement rings and spars and the manifold
rings, are cooled by a separate smaller network of coolant channels.
Fifty-two major ports, which are provided in the vacuum wall to accommo-
date various equipment and apparatus, are described below. The positions of
these ports in the first wall are indicated in Figure VIII-1.
(a) Vacuum Ports
Thirty-two vacuum ports are provided in the vacuum wall; one located
near the top and bottom centerline of each segment (see Figure VIII-1).
These ports are 0.95 m in diameter and also serve as auxiliary maintenance/in-
spection po^-ts.
(b) Neutral Beam and rf Heating Ports
Sixteen ports, one per segment, are provided in the outer horizontal
midplane of the first wall. These ports, which are eliptical in shape, will
accommodate a pair of intersecting neutral beams up to 0.75 m in diameter.
Twelve of the ports, located in groupings of three, are for the neutral beams.
The other four, which are evenly spaced around the torus, are intended for
rf heating, but can also accommodate additional neutral beams if required.
*Panelcoil is a tradename of Dean Products, Inc., Brooklyn, New York.
VIII-9

F.SST WALLCOOLANT MANIFOLDS-
CROSSOVER MANIFOLDSECTION
FIRST WALLCOOLANT CROSSOVER
VACUUM VESSEL-COOLANTCROSSOVER
INLET/OUTLETMANIFOLD SECTION
•COOLANT PANELMOUNTING BRACKET
TvPICAL COOLING PANELS
EXPANSION BELLOWS(TfP. ALL NLET/OUTLETMANIFOLDS)
VACUUM VESSELCOOLANT MANIFOLD
VACUUM VESSELCOOLANT PANFL
RESISTANCE WELDS
FIRST WA! LCOOLANT PANEL
HRST WALL COATING
MATERIAL: TYPE 316 STAINLESS STEELDETAIL D
COOLANT PANEL
Figure VIII-4. Coolant Channel Arrangement forCoolant Panels and First Wall
VI11-10

Figure VIII-5. Photograph of Panel coil section manufactured by-Dean Products, Inc., Brooklyn, N.Y.
viii-n

(c) Experimental Ports
Four experimental ports, 1.5 m in diameter, are provided in the same
segments as the rf heating ports. The experimental ports are located in the
central upper region just above the rf ports. These ports will accommodate
experiments and materials test samples as well as provide access to the inside
of the vessel for inspection, repair* maintenance, and modification. These
ports can also be used for diagnostic equipment if needed. Similar ports
of smaller size, 0.5 m in diameter or less, will be provided as the detailed
design warrants.
All vacuum-vessel ports will have adequate reinforcement at the nozzle
penetrations and will be provided with cooling and plasma shielding as re-
quired. Final assembly of the vacuum-wall segments will be done on site. In
general, three segment subassemblies will be made up and rigged for in-
stallation. Final assembly of the vacuum wall will conclude with the
installation of a single segment. A set of special remotely operated tools
will be developed to support the maintenance and repair of the internals of
the vacuum wall. Further details relating to fabrication, assembly, mainte-
nance and repair of the first wall are discussed in Chapter XII.
2. Coolant Panel
The entire inner surface of the vacuum vessel is shielded from the plasma
by convection-cooled, stainless steel coolant panels. These detachable panels
protect the more permanent vacuum wall from the high surface heat fluxes
emanating from the plasma during normal operation and the potential plasma
dumps that may occur. The plasma-exposed surface of the coolant panel is
covered with a low-Z coating for purposes of high-Z impurity control in the
plasma.
The coolant panel design given in Figure VIII-4 utilizes the Panelcoil
concept shown in Figure VIII-5. Depending on the position in the torus, each
of the 352 panels cover from 1 to 2 n of the vacuum wall between the manifold
rings of the vessel segments. Parallel channels, 0.1-cm-high by 0.75-cm-wide,
are formed by roll bonding a 0.2-cm-thick corregated sheet to the 0.5-cm-thick
front plate. A similarly formed distribution main at both ends of each panel
distributes and collects water to the individual coolant channels. The mains
are supplied from 1-1/2 inch pipes located in the formed manifold rings that
connect each of the sixteen vacuum vessel segments (see Figures VIII-2 and
VIII-12

VIII-3). The coolant manifolds are joined between vessel segments as indi-
cated in Figures VIII-4 and VHI-6* Eight panel sections are connected in
series around the torus in order to obtain the desired temperature rise and
yet minimize differential thermal stresses in the wall. The 1-1/2 inch stain-
less steel supply and return manifolds are located in a circular array and
fitted with bellows expansion joints as needed to allow for thermal expansion
and alignment variations. Each of these manifolds has four or more supply
nozzles that penetrate the vacuum-vessel manifold ring through a bellows
seal and exit the reactor blanket and shield in specially designed access
ports.
The panels are slide-mounted to brackets welded to the vessel in the
coolant manifold ring area and are accessible for attachment along the
manifold edges. A water-cooled filler section covers the area between coolant
panels. These strip sections have coolant channels running in the poloidal
direction and are capable of handling very high heat loads. They are the
last components to be installed and the first to be removed for inspection or
repair.
The coolant panels are designed for 2000 psi coolant at a maximum tem-
perature of 310°C. Under normal operation, i.e., 0.5 MW/m2 and 50% capacity
factor, the panel life expectancy is limited to five years by thermal fatigue
considerations.
3. Current Breaker
The current breaker is shown in Figure VIII-3. It consists of four major
components; an outer ring, two manifold ring segments, and an internal com-
pression ring seal unit. The breaker joint is formed by an insulative coating
that is chemically bonded to the surface of adjoining components. The outer
ring provides the structural support through the two ring segments. The
coating and serrated surfaces form a labrinth seal to the vacuum in the inner
vessel. A U-shaped seal ring gasket made of stainless steel and coated with
insulative material is clamped into position and forms an inner insulative
seal. The volume between seals is pumped by a separate vacuum system that
both monitors the seals for leaks and compensates for small to modest leakage
into the system. Two such current breaker units are used in the vessel
wall. The concept described is repairable from inside the vacuum vessel;
VIH-13

INJECTIONPORT
COOLING PANELS
r-ANGULAR REFERENCE
VACUUM PORT
FIRST WALLCOOLANT MANIFOLD
EXPANSION BELLOWS45°
0°
DEVELOPED VIEW C~C( 2 2 ^ SEGMENT OF TORUS VIEWIMG INSIDE WALL)
SCALE-r-1 METER
Figure VIII-6. Vacuum Wall Segment
(For angular reference s;ee FigureVHI-lb)
VIII-14
however, its reliability is highly dependent on the insulator material per-
formance and bonding/fabrication technique. Alternative designs and the
absolute resistance values required are subjects for further investigations.
Since the coolant panel liners are metallic and in contact with the
vessel wall, the interconnecting piping contains electrically insulative
joints to preserve the current breaking integrity of the first-wall sys-
tem, The various insulative pipe connections are shown in conceptual form
in Figure VIII-7. The reliability of these components depends heavily on
the material radiation resistance and the chemical bonding/fabrication
process. Alternate high resistance pipe connections are being investigated.
4. Limiter
Provisions have been made for placement and cooling of a lnjiiter; how-
ever, no distinct limiter design has been established. The areas provided
are the inserts located circumferentially between the coolant panel liners.
These paneled areas extend closest to the plasma on the inner portion of the
torus. They are readily accessible for replacement, and a water coolant
capability sufficient to remove up to 10 MW/m2 can be provided.
B. First-Wall Materials
Tne proper selection of materials for the first-wall system will have a
major influence on the attainment of the design objectives of the EPR. As
stated previously, the primary objectives of the EPR are the production of
suitable amounts of thermonuclear power and the conversion of this power to
sensible heat, which may then be used to produce electricity. The elevated
temperatures implicit in these objectives pose a number of serious materials
problems that have not been encountered in previous fusion devices. Also, the
absence of a tritium-breeding blanket alters the priorities in materials
selection for EPR relative to a demonstration or commercial-scale reactor.
The strong incentive to utilize available materials technology in order to
meet the near-term design objectives places further restraints on the materials
selection. In some cases it will be necessary to utilize materials in EPR
that are probably not optimal for commercial-power reactor applications,
since time and economic restrictions prohibit the development of an advanced
materials technology for the EPR.
VIII-15

VESSEL COOLANTCROSSOVER(3/4' ID TUBING)
CURRENT BREAKER
VESSEL COOLANTCROSSOVER
R UPPER PIPINGCONNECTIONS
1ST WALL COOLANTCROSSOVER
CURRENT BREAKER
LOWER PIPINGCONNECTIONS
1ST WALL COOLANTCROSSOVER(I11-80s PiPE)
Figure VIII-7. Typical Manifold Section Piping
VIII-16

The materials assessment for the first-wall system is discussed accogrdinj
to the application, viz., structural, liner, insulator and coolant, as des-
cribed in Section A. Structural materials are used for the vacuum wall,
coolant panels cusd coolant headers. The iow-Z liner materials, which shield
the plasma from the high-Z structural materials, are needed primarily fox-
impurity control. Electrical insulators are required for current breakers,
rf coils and diagnostics, and the primary purpose of the coolant is to maiiintai
the first-wall components at acceptable operating temperatures. The material;
selected for the first-wall reference design and alternate materials are
listed in Table VII1-2. The requirements, proposed materials and lifetime
limitations relating to the various applications in the proposed first-wall
design are discussed in the following sections, and the design and operating
parameters are summarized in Table V1II-1. Available property data for can-
didate materials are reviewed in more detail in Appendices B and E.
Table VIII-2. First-Wall Materials Selection
ApplicationReferenceDesign
AlternateMaterials
Structure
Low-Z Coating
Current Breaker
Coolant
Type 316Stainless Steel
Beryllium
Cr2O3
PressurizedWater
Low-swellingStainless Steel
B^C, BeO, BN, B,Be2C, SiC
Y2O3, MgO, A12O3
Helium
1. Structural Materials
The structural materials in the EPR first wall must maintain their
mechanical integrity and dimensional stability for extended periods under the
severe radiation, thermal, chemical and stress conditions imposed by a fusion
reactor environment. The important property requirements for tl.e structural
VIII-17

material and a qualitative evaluation of candidate materials were given in
Appendix C of reference 1. Primarily on the basis of established fabrication
technology and available materials property data, austenitic stainless steel
was selected as the prime candidate for the first-wall structural material.
Reliable fabrication procedures have been developed for stainless steel and a
substantial data base on the behavior of Types 304 and 316 stainless steel
under neutron radiation at elevated temperatures has been obtained from fission
reactor programs. Although stainless steel may not be the optimum structural
material for demonstration- or coranercial-type fusion reactors, it is con-
sidered to be the best choice for the limited objectives of a near-term EPR.
The relevant properties of Types 304 and 316 stainless steel have been re-2
viewed and are summarized in Appendix E. Type 316 stainless steel is pre-
i-erred for the present application because of slightly better ductility,
lower swelling and higher strength. Although it is known that cold-working
improves the swelling resistance of Type 316 stainless steel, annealed material
was selected because of its greater ductility, which is more critical than
swelling for EPR conditions.
Loss of ductility of the stainless steel as a result of radiation
damage and helium generation is considered to be the primary factor that
establishes the operating limitations and design life of the vacuum wall.
For a ten-year life at a 0>5 MW/m2 neutron wall loading and 50% capacity
factor, the vacuum wall will receive a neutron fluence of 6 x 10 n/m
that will produce an accumulated radiation damage of 28 dpa and ^ 540 appm
helium. At this radiation damage level, a sharp decrease in the ductility
of stainless steel occurs under fission reactor irradiation, particularly
at elevated temperatures. This loss in c'.uctility is more pronounced at
temperatures above 500°C; decreasing to less than 0.1% uniform elongation
after irradiation at 650°C. Therefore, the maximum operating temperature
for the first wall has been set at 500°C. The estimated uniform elongation
for annealed Type 316 stainless steel at end of life (10 years) as a result
of displacement damage at 500°C is ^ 2% (see Figure E-l). However, further
reductions in ductility are expected because of the helium (."•> 540 appm)
produced in the stainless steel by the high energy neutrons. Although
no data exist on the combined effects of displacement damage and helium
production for the EPR conditions, available data obtained under a variety
of conditions suggest that a uniform elongation of ^ 1% will be retained
VIII-18

in annealed Type 316 stainless steel at operating temperatures < 500°C.
The ductility requirements are obviously dependent on the component design
and the stress levels; however, a 1% uniform elongation is probably adequate
for the vacuum wall. The hydrogen generated in the steel is not expected
to contribute significantly to the embrittlement, since it should diffuse5
out at the proposed operating temperatures.
The tensile and creep properties of stainless steal are adequate for
operating temperature <_ 500°C. As indicated by the tensile and creep data
in Appendix E and reference 2, the allowable stresses decrease substantially
with increases in temperature above ' 500°C. The estimated 1% radiation
creep for EPR conditions greatly exceeds the 500°C-10 ksi thermal creep
contribution. However, thermal creep would become important at operating
temperatures much above 500°C. The predicted void swelling of i> h% in
the vacuum wall at end of life (10 years) is considered acceptable.
In addition to radiation effects similar to those sustained by the
vacuum vail, the coolant panel is also subjected to extensive thermal fatigue
because of the cyclic nature of the high heat deposition on the panel surface.
Figure VIII-8 shows available 600°C fatigue data for Type 316 stainless steel
in air and the design curve (ASME code case 1331-8) for temperatures of 538
to 650°C. ~ A factor of two reduction in fatigue life for design allowables
such as radiation damage, heli-jm content, mean stress, surface coating and
environmental effects is considered reasonable. The fatigue lifetimes for
the coolant panels are discussed in Section 1> tor various operating condi-
tions.
Other areas in which a degree of uncertainty exists with respect to
first wall performance include effects on x^eldments, coolant compatibility,
and magnetic field considerations. Extensive weldments, which are required
ir the first-wall fabrication, will be exposed to the same severe radiation,
u.a_rmal and stress conditions as the base metal. Only limited data are
available upon which to assess the behavior and reliability of the large
amount of weldirietal and heat affected zones in the first wall. Under cer-
tain conditions, the austenitic stainless steels are susceptible to inter-9
granular stress corrosion cracking. This problem may be particularly cril
because of limitations on coolant chemistry control imposed by the tritium
VIII-19

inO
X |
—
roO
LU£EZD
I
Lu
o1-
COLJ_JO
o(31
14-1
•H
0
ODtH•H >UtS
U-l
0)Ll-J
dc.B01
T3CJ4J10>
i-H
Ed
CO
III-
0)M
60
0)
CO
0!toCJ
i-H
"S4-JCO
o•HJ J
*
CO310
COO
(%) 39NVd NlVdlS
VIII-20

handling lequirements. The interactions of the magnetic field v?ith the first-
wall structural material have not been analyzed in detaf.l. The major concern
in this area relates to the presence of ferrite in welds (typically ^ 10%)
and additional ferrite formation in the base metal enhanced by cne radiation
environment and elevated temperature aging processes. '
Although considerable extrapolation and interpolation of available
data are required to attain an assessment of the structural materials behavior
in a fusion reactor environment, it appears that with proper design, annealed
Type 316 stainless steel is adequate for the EPR first-wall design objectives.
2. Liner Materials
(a) Low-Z Coating Concept
Results of plasma physics calculations (see Appendix B) indicate that
control of high-Z impurities in the plasma, is extremely critical. Of the
various impurity control concepts, viz., a divertor, a low-Z coating on
the first wall, a monolithic low-Z stand-off curtain or liner, and a low-
sputtering liner, a low-Z coating on the stainless steel coolant panel pro-
vides the most attractive near-term solution to excessive contamination of-
the plasma by high-Z elements that result from plasma-wall interactions.
The low-Z coating concept circumvervts several disadvantages of the separated
liners. Since the stainless steejl substrate provides the structural support,
the coating material can-be selected primarily on the basis of desirable sur-
face properties. As a result, a Wider variety of low-Z liner materials are
feasible. The technology exists ilor a variety of coating techniques that
can be used to tailor the surface micros trueture for purposes of mininiizijng
the extent of blistering and the Severity of radiation damage effects. „ Since|
only thin coatings are necessary, the cost effectiveness of the more exotile ~\
low-Z materials is substantially better for;, the coating concept than for il i
thicker monolithic liners. Microcracking will not substantially degrade tiie
performance.of the coating; however^ excessive flaking anM exposure of the!
substrate are not tolerable. The failure mode of the coating is-^expected /to "
be less^critical than that for the separate* liners and the feasibility of '
in situ repair of the coating may be advantageous. In addition to more '
favorable outgassing and vacuum requirements^ the coating may also serve as
an effective tritium permeation barrier for the first wall; / .. ° .
Q = "VIII-21

(b) Low-Z Coating Material
Several low-Z materials are regarded as feasible for the first-wall
coating. Primarily on the basis of effective "Z", desirable physical properties,
and available coating technology, beryllium is presently considered to be the
best choice for near-term applications and has been selected for the EPR
reference design. The compound Bi,C is considered to be the primary backup
coating material; however, several other candidate materials, including
BeO, BN, Be2C, B, SiC, and C, are still being considered. The properties
of the candidate coating materials are summarized in Appendix E.
Beryllium has the lowest atomic number of the feasible wall materials
and, as indicated in Appendix B, would have the minimal effect on plasma
performance for a constant impurity fraction. The high thermal conductivity
and heat capacity of beryllium are desirable for minimizing temperature and
temperature gradients in the coating. Although beryllium has a fairly high
coefficient of thermal expansion, it matches well with that of stainless
steel and makes beryllium particularly suited for this substrate material.
The relatively low melting temperature^of 1277°C and the relatively high vapor
pressure at the higher temperatures limit its usefulness to temperatures
below *v 800°C; however, this temperature is more than adequate for- EPR
applications. High helium production rates, which are common to all the
low-Z materials, require special attention. As discussed in the following
section, the small grain size and substantial porosity that facilitate
helium release can be obtained by selected coating procedures. Although"
beryllium is a neutron multiplier, there is no significant effect on the
neutronics because of the small quantity of material in the thin jcoa'ting. /'
Activation products and decay heat from beryllium are unimportant; however, ^
slight activation will occur from impurities such as iron that are present
at the part-per-million level. The major inpurity in beryllium is oxygen
i.n the form of beryllium oxide. Since BeO is very stable, oxygen'contami-
nation during preparation^, of the coating and operation of- the first wall
at elevated temperatures must be considered. Since the actual beryllium ;
coating will probably contain significant concentrations of oxide |on the
surface, the consequences of this, which may be beneficial, should bji,
.considered in the analysis. For this reason, a graded beryllium-beryllium
oxide coating may prove to be an attractive liner. The,,substantial

technology base that has been developed on beryllium coating for the space
programs is an important consideration for near-term applications.
Boron carbide possesses several properties that make it suitable for a
first-wall coating. Because of its stoichiometry, the effective Z of B^C
is not much different than that of boron. The more refractory properties of
this material would permit higher temperature operation than for beryllium.
The extensive data base developed in the fission reactor program on boron
carbide in a nuclear environment is of value. A major concern in the use
of B^C is the high helium production rate of over 101* appra/year. Since the
major portion of helium is produced by the (n, a) reaction of 1 0B, the problem
can be substantially reduced by use of boron that is depleted of 1 0B. The
technology base for this enrichment has been developed for fission reactorX'>
programs. " Since the quantity of material required for the thin coating is
relatively small, this enrichment appears to be a desirable solution,
(c) Fabrication Methods
Plasma spraying appears to be the most suitable method for applying the
low-Z coating to the first wall. Deposition rates obtainable by this method13 14
are appropriate for the desired coating thicknesses, ' viz., of the order
of a hundred micrometers. The powder size and grade can easily be adjusted
to obtain variations in grain size and porosity that will facilitate helium
release and minimize blistering. The elongated grain structure typically
obtained by plasma spray processes is well suited for accommodating thermal
expansion of the substrate. This process can also be used to prepare graded
coatings, which can be utilized, if necessary, to improve the adherency of
certain coating materials. A substantial technology base for the coating of14 15beryllium by the plasma spray process was developed for space applications. '
This is particularly important for near-term applications. Some development
world probably be required for in situ coating preparation if this approach is
recommended. The detonation-gun process, which is a modification of the
plasma spray process, can be used to obtain more adherent coatings of14 °
certain materials. Various types of chemical vapor deposition processes1
13
are more suitable for application of some materials, e.g., silicon carbide.
An excellent review of various coating processes and the state of coating tech-
nology is given in reference 13. jj ^ ^v?
VIII-23

(d) Surface Effects
The surface effects related to impurity control in the plasma are dis-
jussed in detail in Appendix B. Therefore, the emphasis here will be placed
on surface effects as they relate to materials problems and the integrity of
the first wall. Physical sputtering of the first wall by high-energy plasma
particles, viz., n, D, T, He and impurity ions, will cause erosion of the
coating. Results given in Appendix B indicate that the major contributions
to the physical sputtering are from deuterium and tritium for the EPR
conditions. These calculations are based on energy dependent physical
sputtering curves of the type shown in Figure V11T-9 for deuterium incident
on beryllium and iron for both monoenergetic and Maxwellian energy distri-
butions. The sputter yields of the first wall are strongly energy dependent
and the maximum erosion rates vary with both incident particle and wall
material. For light ions with energies of a few hundred electron volts,
the erosion rates of the low-Z materials are typically higher than those of
the higher-Z elements (see Figures B-2 through B-5). However, because
the radiation losses are strongly dependent on atomic number, viz., a power
function, the low-Z materials are preferrable on the basis of plasma con-
tamination. The advantages of the low-Z materials become even more prominent
as the incident particle energies increase. Maximum predicted erosion rates
from physical sputtering of the beryllium coating are about 30 ym per year,
which would result in a maximum coating lifetime of three to five years.
However, high sticking probabilities of sputtered self-ions that subsequently
impinge on the wall will tend to reduce the net erosion rate. Evidence also
indicates that a significant portion of material sputtered from fusion reactor
walls will redeposit on the wall after the burn cycle. If this affect
is substantial, much longer coating lifetimes would be allowable. Also,
thicker coatings might be used to extend coating lifetime.
Erosion rates of the coating by blistering or exfoliation can be main-
tained at acceptable levels by judicious selection of microstrsucturei? and
porosity of the coating material. Exfoliation of sintered material by
100 keV helium, for both beryllium and aluminum, is several orders of
magnitude lower than that for the respective vacuum cast materials* On
the basis of this type of data, blistering erosion rates of < 2 ym per year
VIII-24

Ihi
10"1
10 -2 h
B
D"
M0NOENF.RGETIC
101 ID3
PARTICLE ENERGY (EV)_gure - 9. E n e r g y dependent physical sputtering yields of iron and beryllium irradiated with D ions
that have monoenergetic and Maxwellian energy distributions.

Iare expected for plasma sprayed beryllium with a microstructure and porosity
similar to sintered material. Chemical sputtering of beryllium should not
be significant since beryllium does not readily react with hydrogen at
low partial pressures. However, reaction of beryllium with oxygen impurity
will occur at elevated wall temperatures. The effects of some beryllium
oxide on the surface must be evaluated in terms of other surface phenomena.
(e) Vacuum Properties
Vacuum properties of the coated first-wall concept should be very good,
since the amount of coating material is small and additional surfaces, such
as in the honeycomb and separated liner concepts, are not required. Helium
generated in the coating and subsequently released to the chamber will nor.
contribute significantly to the gas load. Coating of vacuum and beam ports,
which undoubtedly will be required to limit plasma contamination, should not
affect the pumping requirements. Vacuum requirements for the coated first-wall
concept should be much less than those for the separated monolithic- or
cloth-liner concepts.
(f) Failure Analysis
A major consideration in the selection of the coating concept over the
other low-Z liner concepts relates to the potential failure modes and the
resultant effects on reactor operation. If the coating can be made to resist
extensive flaking, satisfactory plasma performance appears feasible. As
discussed above, erosion rates from ion bombardment are acceptable for
reasonable lifetimes. Microstructures with small grain size and adequate
porosity should accommodate sufficient swelling and provide satisfactory
gas release to resist excessive bulk radiation damage for acceptable life-
times. Chemical interaction of beryllium with either the plasma or the
substrate at the projected temperatures (< 500°C) should not be excessive.
The primary reason for the thin ('v 100 ym) coating is to minimize stress
effects on the substrate. Since the thermal expansion coefficient of
beryllium watches that of stainless steel fairly well, differential expansion
effects are minimized. Some microcracking of the coating is anticipated
daring heat up s; ace the expansion coefficient of stainless steel is slightly
greater than that of beryllium. However, the microcracking should not
expose significant areas of the high-Z substrate to the plasma. The greater
VIII-26

thermal expansion of the steel may be advantageous since the coating will
normally operate at a higher temperature than the substrate. Also, enhanced
ductility of the platelet-type grain structure of plasma-sprayed material in
the direction parallel to the surface will be beneficial. Diffusion of the
high-Z structural material elements through the coating is not expected to
be significant at the proposed operating temperatures. The potential failure
modes of the other liner concepts, which conceivably can cause accelerated
degradation, are discussed in Appendix B.
3. Insulator Materials
Electrical insulators are required in the first-wall design for current
breakers, and may be needed for the rf coils as well as for plasma diagnostic
and control instrumentation Only low voltages (< 100 V per breaker) are
expected for the current breaker applications, while high voltages (> 1000 V)
insulators are required for the rf coils. Both low- and high-voltage insula-
tors will probably be required for plasma diagnostic and control applications.
Surface radiation effects are not critical for the current breaker since it
can be shielded from the plasma. Although the rf coils will be directly
exposed to the plasma, it may be possible to shield the insulators. In
the following discussion emphasis is placed on the assessment of the current
breaker materials since the operating requirements and the relevant property
data for the other applications are less well established.
a. Current Breakers
The first-wall design utilizes current breakers in the form of insulator
coatings on the vacuum wall joints (see Section A and Figure VIII-3). Be-
cause of geometrical considerations the coating concept ap-pears to be the
most suitable means of satisfying both the physical and materials requirements
for the currant breakers. Fabrication and installation of thin insulator
rings or gaskets of the size necessary to fit the 5-m-diameter wall was not
considered feasible. Since the current breaker is an integral part of the
vacuum wall, it must also form a reliable, leak-tight vacuum seal. Ceramic-
type insulators appear to be the most suitable for the present application
since these materials have good electrical and high temperature properties.
The properties of selected ceramic insulator materials are summarized in
Appendix E. On the basis of the limited available property data,
VJII-27

Y2O3, AI2O3, and MgO are presently considered to be the prime candidates for
the current breaker. The most suitable method of coating has not been es-
tablished; however, the chemical bonded coatings of the K-RAMIC-type possess1 ft
a number of favorable characteristics. The coating material is easily
applied by painting or dipping and bonded at relatively low temperatures
( 500°C). Coatings of type and thickness suitable for the present appli-
cation have been prepared by this technique on stainless steel substrates
with complex geometries. Compositional variations of oxide coatings have
been developed to match the thermal expansion of the substrate to improve
the crazing and flaking resistance. Highly thermal shock resistant coatings
have been prepared by this method and smooth surfaces, which may be required
for vacuum purposes, are obtainable.
The major limitations to the design lifetime of the current breakers
are caused by the severe radiation and thermal environments. Most reramic
insulators are susceptible to dimensional instabilities and loss of mechanical13
integrity as a result of displacement damage, swelling, and gas production.
The variation of properties with irradiation temperature and damage level has
not been systematically evaluated for most insulator materials. Since the
porosity, grain size, purity, surface condition, and fabrication method all
have a substantial influence on the properties of ceramics, correlation of
available data is difficult. However, AI2O3, which has been the most ex-
tensively investigated, shows severe degradation at neutron fluences corres-
ponding to one year of EPR operation, i.e., " 6 x 10 n/m . Loss of
integrity of the insulator material caused by thermal effects such as thermal
fatigue, thermal gradients, and differential thermal expansion with respect
to the substrate is also critical. These effects are particularly important
for the ceramic materials because of their inherent brittlen.ess. Since only
low voltages are encountered in the present application, loss of mechanical
and vacuum integrity is probably more crucial than breakdown of dielectrical
properties. Both detailed thermomechanicai analysis and experimental data
are required in the near-term to reliably assess the operating limitations
of the current breaker materials in the first-wall thermal and radiation
environment.
Trade name of product of Kaman Sciences Corporation, Colorado Springs,Colorado.
VIII-28
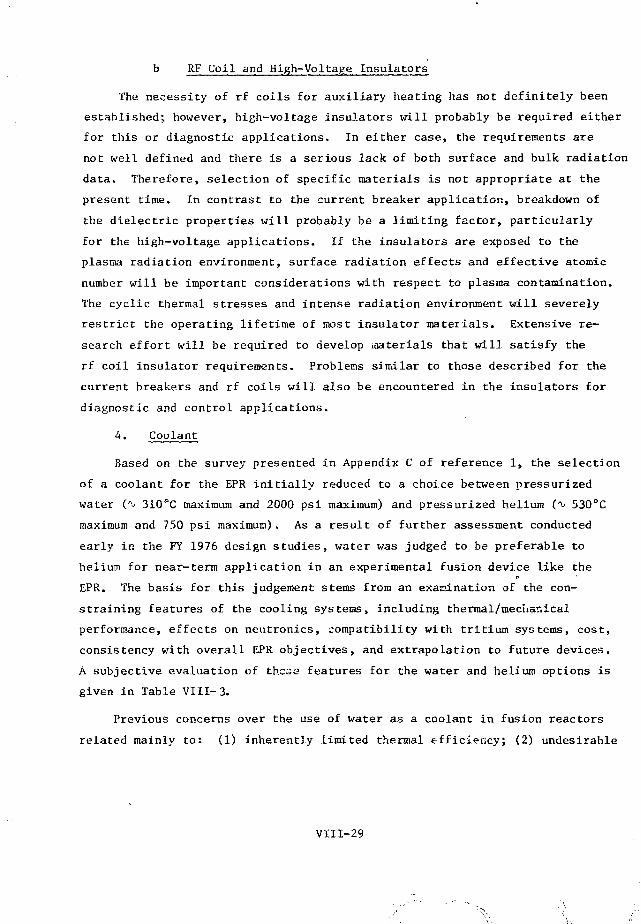
b RF Coil and High-Voltage Insulators
The necessity of rf coils for auxiliary heating has not definitely been
established; however, high-voltage insulators will probably be required either
for this or diagnostic applications. In either case, the requirements are
not well defined and there is a serious lack of both surface and bulk radiation
data. Therefore, selection of specific materials is not appropriate at the
present time. In contrast to the current breaker application, breakdown of
the dielectric properties will probably be a limiting factor, particularly
for the high-voltage applications. If the insulators are exposed to the
plasma radiation environment, surface radiation effects and effective atomic
number will be important considerations with respect to plasma contamination.
The cyclic thermal stresses and intense radiation environment will severely
restrict the operating lifetime of njost insulator materials. Extensive re-
search effort will be required to develop iaaterials that will satisfy the
rf coil insulator requirements. Problems similar to those described for the
current breakers and rf coils will also be encountered in the insulators for
diagnostic and control applications.
•4. Coolant
Based on the survey presented in Appendix C of reference 1, the selection
of a coolant for the EPR initially reduced to a choice between pressurized
water ( 310°C maximum and 2000 psi maximum) and pressurized helium ( 530°C
maximum and 750 psi maximum). As a result of further assessment conducted
early in the FY 1976 design studies, water was judged to be preferable to
helium for near-term application in an experimental fusion device like the
EPR. The basis for this judgement stems from an examination of the con-
straining features of the cooling systems, including thermal/mechar.ical
performance, effects on neutronics, compatibility with tritium systems, cost,
consistency with overall EPR objectives, and extrapolation to future devices.
A subjective evaluation of these features for the water and helium options is
given in Table VIII-3.
Previous concerns over the use of water as a coolant in fusion reactors
related mainly to: (1) inherently limited thermal efficiency; (2) undesirable
V1II-29

Table VIII-3. Assessment of Water and Helium as Primary Coolants fo- an EPR
Constraint
Extrapolation to netpower reactors
Materials limit efficiency
Difficult interface withbreeder blanket
Extrapolation, is marginal
A.; .-anced power cycles are;ossible
He test rjodules could be
used in Stage II
Effects on neutronics Excellent moderator; could re-
place most of the B4C
Small coolant channels mini-
mize shielding difficulty
No moderating power; acts
like a void
Large void fraction increases
shielding difficulty
Thermal/mechanicalperformance
Superior heat transfer char-acteristics
Well established technology
Requires negligible pumping
power
Larger AT's with HO
Large void fraction complicatesdesign
Large pressure drops comparedto H20
Less well established technologythan H2O
Compatibility withtritium svstems
A virtual sink for tritiumCould If ad to large volumes
of t r- t ia ted effluents
Primary circuit would provideexcellent barrier for mi-gration to secondarycircuit
Tritium entering H20 isessentially lost from fuelcycle
Ideally suited for use intritium environment
Tritium renoval is straightforward
No large effluent problemCompatible with high level
enrichment scenarios forfuel cycle
SS-H2O design could lead to arelatively low cost device
Higher fabrication costs forcomparable design base
Consistency withperformance objectives
Best prospects for reliablelong-term performance of EPR
Incompatibilities with t r i t iunsystems are main drawbacks
More difficult to implementin a small tokamak
EPR can't take full advantageof He usage
VIIl-30
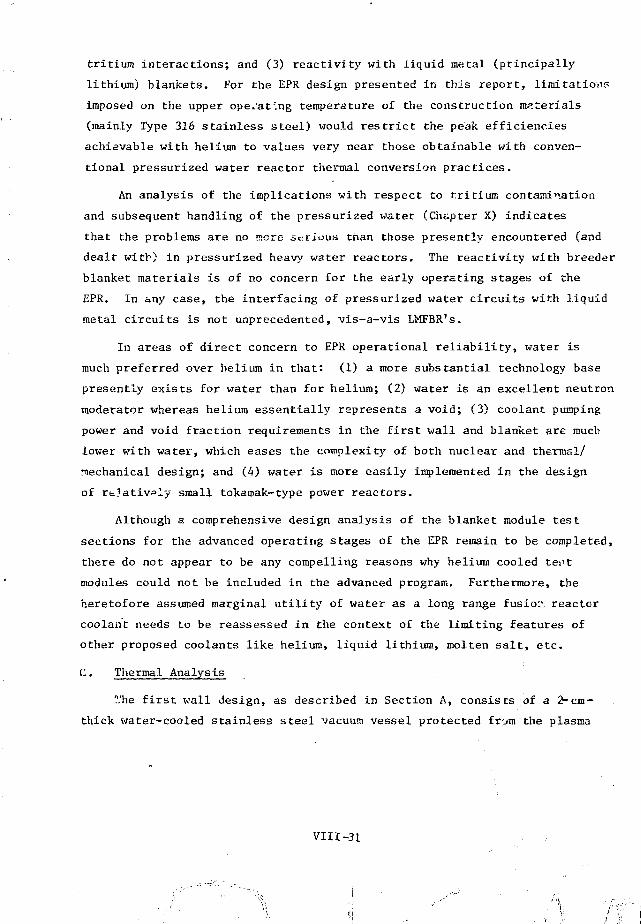
tritium interactions; and (3) reactivity with iiquid metal (principally
lithium) blankets. For the EPR design presented in this report, limitations
imposed on the upper ope^at'.ng temperature of the construction materials
(mainly Type 316 stainless steel) would restrict the peak efficiencies
achievable with helium to values very near those obtainable with conven-
tional pressurized water reactor thermal conversion practices.
An analysis of the implications with respect to tritium contamination
and subsequent handling of the pressurized water (Chapter X) indicates
that the problems are no more serious than those presently encountered (and
dealt with) in pressurized heavy water reactors. The reactivity with breeder
blanket materials is of no concern for the early operating stages of the
EPR. In any case, the interfacing of pressurized water circuits with liquid
metal circuits is not unprecedented, vis-a-vis LMFBR's.
In areas of direct concern to EPR operational reliability, water is
much preferred over helium in that: (1) a more substantial technology base
presently exists for water than for helium; (2) water is an excellent neutron
moderator whereas helium essentially represents a void; (3) coolant pumping
power and void fraction requirements in the first wall and blanket are much
lower with water, which eases the complexity of both nuclear and thermal/
mechanical design; and (4) water is more easily implemented in the design
of relatively small tokaraak-type power reactors.
Although a comprehensive design analysis of the blanket module test
sections for the advanced operating stages of the EPR remain to be completed,
there do not appear to be any compelling reasons why helium cooled tes't
modules could not be included in the advanced program. Furthermore, the
heretofore assumed marginal utility of water as a long range fusion, reactor
coolant needs to be reassessed in the context of the limiting features of
other proposed coolants like helium, liquid lithium, molten salt, etc.
C. Thermal Analysis
?.'he first wall design, as described in Section A, consists of a 2-cm-
thick water-cooled stainless steel vacuum vessel protected from the plasma
VIII-31

by beryllium-coated stainless steel coolant panels, Ihe design point for the
analysis presented bore is for a neutron wall load of O.i MW/m2, with the
1.0 MW/m2 condition also investigated. A transient heat transfer analysis
based on this design has been carried out for a representative 45-s-burn
pulse followed by a 15~s exhaust and replenishment phase (buns pulses in the
range ^ 25 to 60- s seem feasible for EPR). The coolant panels serve as a
shield to protect the more permanent vacuuu; wall from the high cyclic heat
loads that occur during normal operation and possib1.*: uncontrolled plasma-
energy dumps. During normal operation tht coolant panels receive a sub-
stantial portion of the fusion energy (equivalent to 20% of the neutron wall
load) in the form of surface heating from plasma radiation and energetic ions.
The vacuum wall, blanket and shield regions receive only the neutron heat
loads. The results reported in this section were oDtained from one-dimensional
calculations carried out using a finite-difference, time-dependent heat trans-
fer code. Three-dimensional analyses have also been performed; but, with the
exception of regions near the cooling channels, the three-dimensional results
are similar to the one-dimensional results presented here.
In keeping with the concept of using a low-Z liner material to reduce
plasma contamination problems, the coolant panel surface was assumed to be
coated with a 100-ym-thick layar of beryllium. A value of 8500 W/m2«K. (1500
Btu/hr'ft2'"F; was developed for the resistance to heat transfer at the coating-
substrate boundary. This resistance is likely to be a function of the age
of the first wall, but was assumed to be constant in the present analyses.
The heat transfer coefficient between the steel and the pressurized water
coolant has been approximated at 2800 W/m2«K (500 Btu/hr«ft2'°F). The
present coolant panel design (see Figure VIII-4) allows 75 to 80% of the
0.5-cm-thick panel face to be in intimate contact with the coolant.
The analysis summarized below was carried out for a case where the
pressurized water was allowed to flo'v through a series of coolant panels
until it was heated to a temperature suitable for electric power production
by conventional methods, viz., existing ?WR technology. The pressurized
water was assumed to enter the first panel at 38°C and to exit the last
panel (eighth in the series) at 310°C or less. A parametric analysis
was completed on the present design for two neutron wall loads,
VIII-32 '.
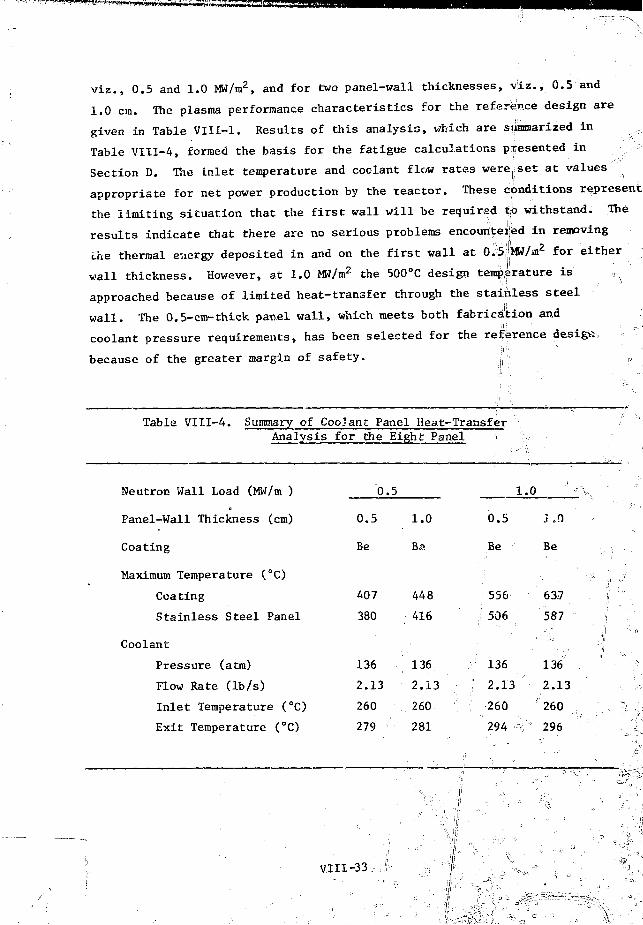
viz., 0.5 and 1.0 MW/m2, and for two panel-wall thicknesses, viz., 0.5 and
1.0 cm. The plasma performance characteristics for the reference design are
given in Table VIII-1. Results of this analysis, which are summarized in ;
Table VIII-4, formed the basis for the fatigue calculations presented in
Section D. The inlet temperature and coolant flow rates were.set at values
appropriate for net power production by the reactor. These conditions represent
the limiting situation that the first wall will be required tjb withstand. The
results indicate that there are no serious problems encountered in removing
the thermal euergy deposited in and on the first wall at O.£|MW/ai2 for either
wall thickness. However, at 1.0 MW/m2 the 500°C design teraperature is
approached because of limited heat-transfer through the stainless steel
wall. The 0.5-cm-thick panel wall, which meets both fabrication-and
coolant pressure requirements, has been selected for the reference desigii
because of the greater margin of safety. ," |;,
Table VIII-4. Summary of Coolant Panel Heat-TransferAnalysis for the Eight Panel I
Neutron Wall Load (MW/m )
Panel-Wall Thickness (cm)
Coating
Maximum Temperature (°C)
Coating
Stainless Steel Panel
Coolant
Pressure (atm)
Flow Rate (lb/s)
Inlet Temperature (°C)
Exit Temperature (CC)
0.5
0.5
Be
407
380
136
2.13
260
279
1.0
Ba
448
416
136
2.13
260
281
1
0.5
Be
556
/ 506
j 136
; 2.13
260
294 v
.0 -^
Be
637
587
136
2.13
260
296
VIII-3

Since the most severe conditions with respect to materials response occur
in the last panel, the calculational results for that panel are presented.
Figure VIII-10 shows the radial temperature distribution through the
0.5-cra-thick beryllium-coated stainless steel plate after the first burn
pulse. The upper and lower curves represent locations on the coolant exit
and inlet planes, respectively. Figure VIII-11 shows the same type of data
for the end of the sixth burn pulse, i.e., after 345 s. Figures V1I1-12
and VIII-13 show the transient temperature histories for locations in the
coolant inlet plane and exit plane, respectively. The upper, middle and
lower curves in each figure represent, respectively, locations at the surface
of the coating facing the plasma, at the surface t>f the stainless steel
touching the coating, and at the stainless steel/coolant interface. The
sharp spike in the coating temperature is caused by the introduction of
argon into the plasma during shutdown. This increases the thermal radiatici
to the coating surface for a brief period near the end of the burn cycle,
and is the most thermally limiting controlled shutdown option A striking
point brought out by these histories is that thermal equilibrium conditions
are reached after only a few burn pulses.
Figures VIII-14 and V1II-15 represent the temperature distributions in the
0.5-cm wall operating with a 1.0 MM/m2 neutron wall loading. The maximum
temperature in the stainless steel is higher than the previous case but still
within the design limit of 500°C maximum. The temperature at the interface
between the coolant and the channel wall is close to the boiling limit; how-
ever, since the coolant is subcooled, no boiling is expected. The present
analysis indicates that a 1.0 MW/m2 neutron wall loading is near the limit
for sust-ained power producing operation of this design. This limitation is
due primarily to the restively poor thermal conductivity of the stainless
steel.
D. Stress Analysis
The stress analysis performed in conjunction with the structural design
r the first wall has two basic goals: (1) to contribute to the development
of a first-wall configuration with as small a miss as practical for the
applied mechanical and thermal loads and other design constraints in order
to minimize coolant system requirements and conserve space within the TF
Mil -34

01
E
800
700
600 -
5Q0
426
4000.000 0.045 0.090
X(Inches)
0.135204
X(mm)
Figure VIII-10. Temperature distribution through theberyllium-coated stainless steel panelafter the first burn pulse (45 s) forlocations on the coolant inlet plane(lower curve) and exit plane (uppercurve).
VIII-35

0)
S-4
4JOUv
800
700
600 '
500
426
371
400
c,
0.000 0.045 0.090 0.135
X(Inches)
0 1 2 3 4X(iran)
Figure VIII-11 . Temperature distribution through theberyllium-coated stainless steel panelafter the sixth burn pulse (345 s) forlocations on the coolant inlet plane(lower curve) and exit plane (uppercurve).
VIII-36

ttC-0 JOC-CIS-XOKQS)
K inure VLll-lJ. rran-sietit temperature histories (0.5 MW/nr ) locations
on t!ie coolant inlet plant' at the surface of the berylliumcoat in:.1, (upper curve), at the surface of the stainless;steel in contact with the coatim; (nucidle curve), andat ihe stainless steel surface in contact with the coolant(lower curve) .
0-D 113-0 BO-0 160-0 ICC-0 510-0TIME [SECONDS)
320-0 36O-0
I" ir.ur.- VI t l - l i . T r a n s i e n t t e m p e r a t u r e h i s t o r i e s (().*) MW/nr ) l o c a t i o n s onthe -oolant e x i t p lane a t [he s u r f a c e of the ln-ry 1 1 iiraci>atln>* (upper c u r v e ) , a t t he s u r f a c e o( the s t a i n l e s ss t e e l In c o n t a c t with the c o a t i n i : (mnkllc c u r v e ) , ami atthe s t a i n l e s s s t e e l s u r f a c e in c o n t a c t wi th the coo l an t(lower c u r v e ) .
VI.II-37

t
A* Jr Cf\
f
f r ••• • r
\f W4
• I LI - 1 •'•. T r . i n s u - n t t i r r a t ' i - r . m i t v l i i s t . > r i i - s ( 1 . 0 M W / n ' ) l m : i i i i u c ;VIM t h e c o o l . - m i i n l i - t p l a n e - i t t h e s u r f a c e , at t h e h e r y l l i u sC t M t i t l K ( u p p e r 1 ' U P . v ) , . i t I h e r i u r f .U: i - o f l ' i e s l a i t t l e s sr i C e e l i n c o n t . l o t w i t h t h e c o . K i i v , ( r a i i t t l i t - . t t r v i - ) , a t u l• i t i h e s t a i i k l c s s s i e e l s u r f a c e i l l c i M i t a c l w l t l i t h e c i m j a n l( l o w e r c u r v e ) .
V L 1 1 - 1 8

A Aif * if * i
i . ;ur t - V i l i - ! i. T r . - i t t s i r n t U - n j H T . u u r<- h i s t o r i e s ( ! . O MU'/m") t ' H \ i t i o n st>n t in- ci>i>l. i»t o > ; i t ;>in:n ' . i t l i i e s u r f ace o j t h e h o r y I l i u ml o a t i i i K ( u p p e r , - u r v f ) . a t ciu- s u r i ' a c i - o f cho s i a i n K - s ss i o i - 1 i n c o n t a c t w i t h t in- c o a t i n g ( m i d d l e c u r v e ) . ••»»d a tt i n ' s t a i n l e s s s t e e l s u r f a c e i n c o n t a c t w i t h t h e c o o l a n ti l o w e r c u r v e ) .
VH1-39

colls; and (2) Co maximize first-walI lifetime for prescribed operating; con-
ditions, A number at" parameter studies were conducted to evaluate the
feasibility of various first-wall design concepts from the stress .-inlays is
standpoint and to establish reasonable dimensions for those concepts that
appeared most promising. These parameter studies are described In detail
in Appendix tl,
A design decision was made to divide the functions uf the first wall
between a vacuum vessel and detachable coolant panels. The implications of
this decision ' r the structural analysis are that the vacuum vessel supports
die atmospheric pressure load and the weight of the first wall, while the
coolant panels absorb the most severe thermal loading but perform no struc-
tural function. Conservative limits arc placed on allowable stresses and
maximum te.i^orature of the vacuum vessel to assure an adequate lifetime,
designing within these limits avoids stress failure, low-cyclu fa-igue, and
thermal creep of the vacuum vessel and its supports; high-cycle fatigue of
the vacuum vessel does not limit reactor life because its thermal cycling
is loss severe than that of the coolant panels. The design of the coolant
panel support is such that no structural loads are transferred to the panels
from the vacuum vessel, so that stress failure is avoided and the possibility
of thermal ratcheting failure of the panels is eliminated. Fatigue resulting
from thermal cycling is, therefore, the limi'.ing factor on coolant panel
lifetime. Stress analysis of the vacuum vessel and coolant panel." is
suinmar ized bo low, with details given in Appendix 11.
1. Vacuum Vessel
Several design concepts for the vacuum vessel and its supports were
evaluated from stress analysis considerations. Supporting the vacuum vessel
from the blanket was rejected because of the possibility of inducing excessive
stresses in the vessel as a result: of differential thermal expansion between
the blanket and vessel. Use of a uniform solid wall for the vessel was re-
jected because of the large wall thickness required to prevent excessive
bending stresses caused by distortion of the vessel under its own weight. A
thick wall would be difficult to cool evenly, and relatively more heat would
be deposited in the first wall rather than the blanket where it can be more
efficiently used in the plant power cycle. Sandwich-wall construction offers
a significant reduction in vacuum vessel mass as compared to a solid wall;

however, it was rejected because of the fabrication difficulty and expense
in providing a bond with the required structural strength between the
sandwich core and cover plates.
A vacuum vessel composed of a thin-walled shell with reinforcing rings
Una less than half the mass of a uniform solid-wall shell for a design stress
uf 10,000 psi. Iku-kling strength rather chan stress considerations determines
the wall thickness of the shell. The rings are sized to support the weight
of a one-meter portion of the shell, their own weight, and the pressure dif-
ferential across the vacuum wall. The roller/slide pads and the suspension
hangers eliminate stresses irrnn differentU'l thermal expansion between
supports und vessel.
Figure VUl-16 shows the effect of varying the support location on the
required ring depth for 5-cm-wide rings and a 2-cm-thick shell. For a design
scress of 10,000 psi, the original ring depth can be reduced from 19 cm to
8 cm if the supports are moved from the top to the 45° location. The vessel
mas', in the lartvr cast- is about two-thirds that of the former. The mass of
riie ring is iht'iiUy decreased to about 10" of the mass of the portion of the-
shell which it supports. Any further decrease in vessel mass would have to
be achieved through a reduction in wail thickness.
The effect on rin^ size of supporting the wight of the coolant panels
was not included in the above analysis. The panels plus the coolant tubes
attached to the vessel are equivalent to about an additional 2-ctn thickness
of stainless steel attached to the vacuum vessel. The 5-cm-wide ring hung
at 45° locations should have a depth of 11 cm to support the weight of the
shell, coolant panels, coolant tubes, its own weight and the atmospheric
pressure load on the vessel. A 10-cm-widu by 8-cm-deep ring would also
support the same load at the 10,000 psi design stress.
lioometric-discontinuity stresses occur at the intersection of the shell
and reinforcing rings. The circumferential membrane stress and axial bending
stress in the shell at this location arc less than 2000 psi. The maximum
discontinuity stress resulting from a difference in average temperature be-
tween the .ell and rings is about 100 psi/°C, so reasonably uniform temper-
ature distributions must be provided by the structural coolant system to
avoid large localized thermal stresses.
VIII-U

-30 I—
-25
psi
O
RE
SS
,
- 20
-15
-10 —
-5 I—
0 10 15 20
RING DEPTH b, cm25
Figure VIII-16. Maximum Stress in Reinforcing Ring Supportadat Various Locations.
VIII,42

A complete buckling analysis of the complex first-wall structure is
buvond the scope of the current design effort. Analysis of some simpler
approximating configurations gives a buckling pressure of 90 psi for the
2-cm-thick shell with supporting rings and spars. This corresponds to a
safety factor of six on the applied atmospheric pressure; therefore, a de-
crease in the shell thickness to reduce the mass of the first wail may be
justifiable. However, a reduction in thickness was not considered prudent
without further study for three reasons: (1) the buckling pressure varies
approximately as the cube of the wall thickness and so is quite sensitive
to changes in this dimension; (2) simplified buckling analyses are usually
non-consc-rvative when compared with more detailed treatments of a complex
structural configuration; and (3) analytical predictions of buckling loads
for ideal shell structures usually overestimate the buckling loads of actual
structures.
2. Coolant Panels
Tlit* supporting structure that connects the coolant panels to the vacuum
vui-svl is such that the panels are kept flat but are Eree to expand laterally
(see figure VI11-4). There are two important advantages of these sliding
supports over a fixed support arrangement.
(1) Since no net force is transmitted to the panels from the vacuum
vessel through the sliding supports, structural loads from the
weight of the first wall and the pressure difference across the
vacuum wall are noc transferred Co the coolant panels. For fixed
supports, the panels and vacuum wall are structurally in parallel;
therefore, design specifications and fabrication and assembly
tolerances would have to be very accurate to avoid overloading of
the weaker panels. The sliding support configuration prevents
direct stress failure of the coolant panels from transferred struc-
tural loads as well as thermal ratcheting, where the combination
of mechanical loads and thermal stresses results in plastic strain
accumulation in one direction.
(2) The overall thermal expansion of the coolant panels is not con-
strained by the sliding supports. Consequently, their mechanical
VIII-43

strain variation during thermal cycling is loss than that of panels
with fixed supports, and their predicted fatigue lifetime is con-
siderably longer. The coolant panels atv connected tn series such
Ehat their average temperature varies from panel to panel, b'.'t the
variation about the average temperature during the burn cycle is
essentially the same for each panel. With sl iding supports, oatii
panel then has about Che same expected number of burn cycles ti>
fatigue failure since the pertinent strain range depends on the
teriiierature variation during the cvcle. However, with t i.\ed supports
maLnuitned at the temperature oi tlie average panel, the hotter and
colder panels would be more severely strained than the average and
so have shorter expected lifetimes.
The coolant panels nre subjected to two types of thermal cycles; the burn
cycle of about one minute duration and the reactor warm-up/cool-down cycle of
widely variable duration. For a time-dependent temperature variation .M(t)
across the panel thickness (see Section Vlll-C), the s t rain range for tb.e burn
cycle depends on the difference between the maximum and minimum values of .". T
during the cycle. The strain range for the plant wurm-up/eool-down cycle is
a function of the average value of JT during the burn cycle. Assuming the
duration of the warm-up/cool-down cycle is long enough that stress relief
occurs, the strain range for the coolant panels with s l iding supports is
0.085% for the burn cycle and 0.14% for the warm-up/cool-down cycle. These
values correspond tc fatigue design lifetimes of 5 * 106 burn cycles and 10?1
warm-up/cool-down cycles, respectively (see Figure VII1-8). For fixed
supports, these s t ra in ranges would be 0.21Z and 0.64%, respectively, which
correspond to design lifetimes of only 10" burn cycles and 3 < 102 warm-up/cool-
down cycles. These estimates are based on tht assumption that the lifetimes
for the two types of cycles can be computed independently, i . e . , that the
expected lifetime from one type of cycling is reached much sooner than that
from the ot.ier. If the operating history of the reactor is such that both
lifetimes correspond to about the same passage of calendar time, a more
detailed analysis using hypothesized histograms will be required to assess
the cumulative fatigue damage.
VIII-44

K, Research arid IKiy taprnc-nt Requirements
Tim rusenrcti iinct acv.lopmcnt requirements fai Liu.- ILPR first-wall system
are siimKiarixod in this section. More detailed descriptions of these R & D
requlcvnienl.s an- ^Ivvn In referuncti 19. Tito major areas include materials
ii-c-luuiU'Ky, coulant technology, and structural mechanics. Kffort required
in thfse c'hi'ee areas is discussed below.
I. Maie ri a I a
Substantial i-ffurt will bt- mquirod on the development of low-Z coatings
tor impurity control, electrical Insulators tor tlu>: breaker applications
and mechanical property data f»r irradiated structural materials. Technolegy
i>i coating proci'sst'B and parameters must be investigated to develop optimized
coatings r.hat wiLl withstand the fusion reactar environment. This effort
includes determination of the thermomechanieal and chemical stability of
candidate coated compositus* under simulated reactor conditions. Surface
radiation effects, e.}1,., physical sputtering, blistering, electron and photon
bombardment, and various syner^istic effects, on candidate coating materials
must be investigated for appropriate particle energies and fluxes and for
various coating mtcrostructural characteristics. Bulk radiation effects
at elevated temperatures must be evaluated for the composites under high
helium generation rates.
Considerable effort is necessiry to establish the operating limitations
of electrical insulators in the s"v<>re radiation environment. This will in-
clude determination of both the mechanical integrity and dimensional stability
of the insulators in addition to radiation effects on the dielectric properties.
Development work associated with fabrication technology' for current breaker
applications is essential.
Further effort is also required to establish the operating limitations
of the structural components under the anticipated radiation and thermal
environments. In particular, mechanical property data for stainless steel
under simultaneous displacement damage and high helium generation are needed
for both bulk and weld material. Fatigue data for stainless steel coated
composites under appropriate environmental conditions are important. Com
patibility effects related to the tri t iated water require further investiga-
tion,
VIII -45

2. Coolant Technology ^ - i
Important early needs include development of computational methods and
experimental assemblies to quantify the thermal-fluid behavior of the
coolant, e .g. , heat transfer coefficients ind effective thermal conductivities
for the first-wall designs. Of special importance ttn advanced operation with
" test module3""J:s~exper1racntal confirmation that circulating liquid lithium
in tokamak-type magnetic field configurations will not compromise either the
plasma stabil i ty (by perturbing "the" magnetic flux) or Lhe coolaut performance
of tho lithium.-
3* SLructural Mechanics
Computational methods "including code dey^opineint arid engineering support
- should be constantly upgraded to guarantee a firmtechnology base for the EPR.
Analytical formalisms fc>r modeling thermal* mechanical and kinetic behavior
in_toroidal geometry must be developed and tested. The response of the f i rs t -
wall system to the mechanical and thermal stresses produced by the EPR burn
cycle must be evaluated experimentally.
1. W. M. Stacey, J r . , et a l . , "Tokamak. Experimental Power Reactor Studies,"ANI./CTR-75-2, Argonne National Laboratory (July 1975).
2. R. F. Mattas, "Austenitic Stainless Steel Property Considerations forFusion Reactor Applications," (to be published as ANL/CTR/TH).
3. See for example Effects of Rotation on Substructure and Mechanical .Properties of Metals and Alloys, ASTM SIT 529, American Society forTesting and Materials, (1973).
t\. E. E. Bloom and F. W. Wiffen, "The Effects of Large Consideratxons ofHelium on the Mechanical Properties of Neutron-Irradiated StainlessSteel," J. Nits. Mav. 58_, 171 (1975).
- 5 . - --T. -E. Scott, "Hydrogen-Embrittlementand-.Other-Effects" in "ThermonuclearReactor Materials," TS-3634, Iowa State University, (1975).
6. J. B. Conway, R. IL Stentz, and J. T. Berling, "Fatigue, Tensile, anc1
Relaxation Behavior of Stainless Steel," U3AEC TID-26135, Technical"information Center, Office of Information Services, (1975).
7. C. R, Erinkman, G. E, Korth, and R. R. Hobbins, "Estimates of Creep-- Fatigue Interaction in Irradiated and unirradiated Stainless Steel,"
<7z,v?. Tech. 15, 297 (1972).
VIII-46

8. D. L. Smith, K, Natesan, T. F» Kassner, and G, J. Zeman, "Effects ofbadlum on Che Low Cycl« Fatigue Behavior of Austenitic StainlessSteel," ASME Symp. OR Structural Materials for Service at ElevatedTemperatures in Nuclear Power Generation, MPC-1, 290 (1975).
9. S. H, Bush, "Structural Materials for Nuclear Power Plants," ASTMJ-4 Qf Tasting and Evaluation* 2_, 435 (1974)^
10T Jqj,ning of Stainlass Steels, American Society for Metals, Metals Park,
11, J. T. Stanley and K. R. Garr, "Ferrite Formation in Neutron IrradiatedType 316 Stainless Steel," Met. Tvans. 6A> 531 (1975).
I?. "A Compilation of Boron Carbide Design Support Data for I.MFBR ControlElements," HEDL-TME-75-19, Hanford Engineering Development Laboratory(1975).
13. A. A. Bauer and J. L. Bates, "t\n Evaluation of Electrical Insulatorsfor Fusion Reactors," BMI-1930, Battelle Columbus Laboratory (197A)
14. J. F. Resek and R. Tucker, Uiiion Carbide Corp., personal communication.
15. D, Eossen, Oak Rxdge National Laboratory,-persunal communication.
16. R« J. Colchin, "Impurities from Plasma-Wall Interactions in ORMAK,"Proc. Inter. Conf, Surface Effects in Controlled Fusion Devices,San Francisco (1976) to be published J. Nucl. Mater. •:
17. S. K. Das and M. Kaminsky» "Reduction of Surface Erosion Caused byHelium Blisteringtih;Sintered Beryllium and Sintered Aluminum Powder,"Proc.Inter. Conf. Surface Effects in Controlled Fusion Devices. SanFransicso. (1976) to be published >7, Nual. 'later.
18. S. L. Dean and S. P. Smith, Kaman Sciences Corp., Colorado Springs,ColoradOj personal communication.
19. F. E. Mills, "Research and Development Required for the Tokamak Ex-perimental Power Reactor," ANL/CTR/TM-65, Argonne National Laboratory(1916).
VIII -41

CHAPTER IX
BLANKET/SHIELD SYSTEM
The EPR primary energy conversion system (PECS) studies have sought
to identify the major design criteria and constrains for the first wall,
blanket, and radiation shield of a tokamak experimental power reactor.
The criteria for the first wall assembly and the design point that has
been reached in an effort to accommodate them are described in the pre-
ceeding chapter (Chapter VIII). In this chapter, the results of a sys-
tematic analysis of the important operational features of EPR-type blanket
and shield systems are presented in the context of a consistent reference
design description for these systems. The blanket/shield design featurt;s
that have appeared to be Che most important relate to: (1) nuclear perfor-
mance; (2) segmentation to allow field penetration and reduce magnetically
induced torques; (3) materials property limitations; (4) accessibility for
fabrication, assembly, and maintenance; and (5) thermal-hydraulic per-
formance. This design is summarized in Table IX-1.
The nuclear design is based on optimised configurations of radiation
attenuating materials that permit the retrieval of the neutron and secondary
gamma ray energies as sensible heat in a form suitable for conversion to
electricity using conventional power cycle technology. An important objec-
tive of the blanket and shield nuclear design is to provide the degree of
radiation attenuation necessary to protect the superconducting magnet
systems from excessive radiation damage and nuclear energy deposition.
With the PECS design, > 92% of the thermonuclear power is deposited in
the i/ 4-cm-thick first wall assembly and the 28-cm-thick stainless steel
blanket assembly immediately surrounding the first wpi1. The remaining
radiation shielding is provided by the near-ambient .ti Id system that
circumscribes the blanket. A significant finding of the nuclear analyses
has been the need for appreciable thicknesses of highly efficient radiation
shields around the major penetrations. The important nuclear performance
related parameters for the EPR are listed in Table IX-1, and the details
of the nuclear analyses are given in Section A of this chapter and in
Appendix C.
IX-1

Table IX-1, Summary of Blanket/Shield Design Parameters for the ANL-KPR
BLANKET SYSTEM
Design Basis Operating Life (years) iO = -
Nominal Power During Burn (MW) ^ __"•_•• -:_L^_- _/*0^ __
Design Basis Neutron Wall Loading, (MW/m2) 0.5
Plant Capacity Factor (%) 50
Blanket Structure
Thickness, (m) 0.28
Type Metal/Volume Fraction 316-SS/G.9
Type Coolant/Volume Fraction H 0/< 0.052 ~
Penetration/Volume Fraction
Inner Blanket ^0.02
Outer Blanket \ 0.05
Maximum Temperatures, °C
In Support Structures 500
In Bulk Materials 550
Nuclear Parameters
Maximum Heat Generation (W/cm3) 3.5
Maximum Fluence at 2.5 MW-yr/m2 (n/m2) 5 x 1026
Maximum dpa at 2.5 MW-yr/m2 (dpa) 17
Maximum helium production at 2 i MW-yr/m2 (appm) 230
Maximum hydrogen production 2.5 MW-yr/m2 (appm) 600
Mechanical Parameters
Design Stress in Support Structure, ksi <_ 10
Minimum Material Yield Stress, ksi 20
Ductility at 2.5 MW-yr/m2 (Z uniform elongation) _> 3
Swelling at 2.5 MW-yr/m2 (% of initial volume) i 2
Maximum torque from pulsed fields (ft.-lb) 125,000
Coolant Parameters
H 02
Maximum Pressure (psig) 2000
Fractional Pressure Drop (%) < l
Maximum Velocity (m/s) 2.4
Pumping Power (MW} < i
Coolant Inlet Temperature (°C) 40
Maximum Coolant E:cit Temperature (°C) 309
IX-2
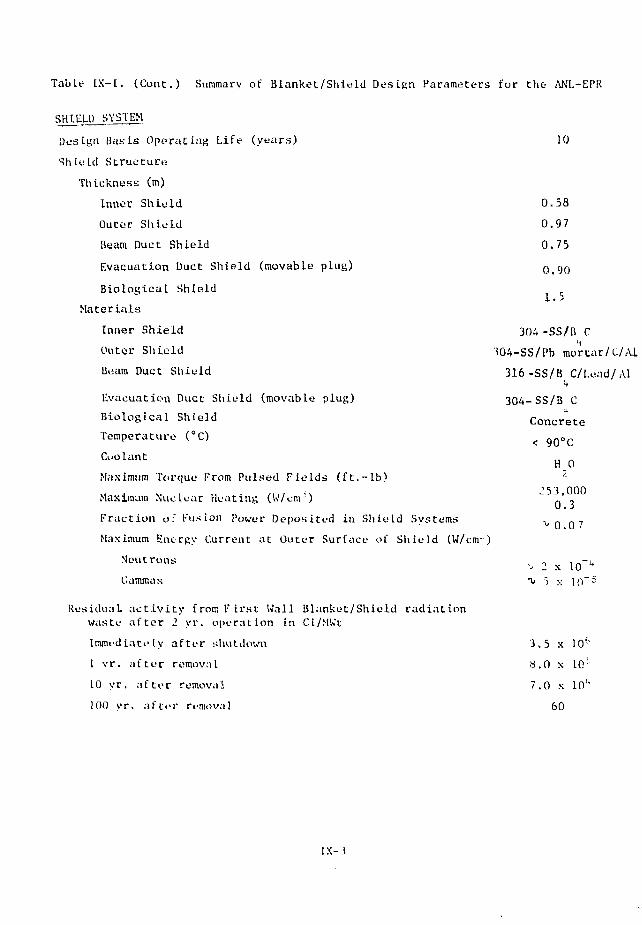
Table [X-l. (Cont.) Summary of Blanket/Shield Design Parameters for the ANL-EPK
Design Basis Operating Life (years) 10
Shield Structure
Thickness (m)
Inner Shield 0.58
Outer Shield 0.9 7
Beam Duct Shield 0.75
Evacuation Duct Shield (movable plug) 0.90
Biological Shield
Materials
Inner Shield 304 -SS/B C
Outer Shield 304-SS/Pb morcar/C/.U
Beam Duct Shield 316-SS/B C/Lead/Al
Evacuation Duct Shield (movable plug) 304- SS/B C
Biological Shield Concrete
Temperature C O < 9 0 o c
Cuolant H 0
Maximum Torque From Pulsed Fields (ft.-lb)
Maximum Nuclear Heating (W/cm-) ' ~
Fraction of Fusion Power Deposited in Shield Systems
Maximum Energy Current at Outer Surface of Shield (W/cm')
Neutrons <„ x lo"1-
C.ammas "\* 5 :•: 10~5
Residual activity from First Kail Blanket/Shield radiationwaste after 2 yr. operation in Ci/MU't
Immediately after shutdown 3.5 x l0f'
1 yr. after removal 8.0 x 10:
10 yr. after rumovai 7.0 s 10"
100 vr. aftt'i" removal 60
IX- 1

The si.-left ton of materials for the KPR has boon predicated largely
on s tate-o C-tliL— arc and reasonab 1 v ext rapolated technology. A i/onij. rehentii ve
assessment of existing information regarding (!) irradiation effects on
materials properties, (2) present day fabrication capabilities and limi-
tations,, ami (3) the costs associated with various materials alternatives
has led to the selection of various grades of stainless steels as Che major
construction materials for the PECS. A similar basis has been developed for
the selection of Bi,C, graphite, lead mortar, and a variety of insulating
materials fur specific functions as indicated throughout this chapter. More
detailed discussions of the factors that have impacted on or otherwise in-
fluenced Che selection of materials for the PECS are given in Section B
of this chapter and in Appendix E.
One of the more significant findings of the PECS design studies has
resulted from analyses of the interactions of the time varying magnetic
fields with the blanket and shield assembly. Eddy currents generated in
the blanket and shield region by the pulsed fields produce opposing magnetic
fields that tend to interfere with the plasma equilibrium and at the same
time create large forces and torques within the blanket/shield assembly.
The solution developed for this problem was to subdivide the blanket and
shield into sufficiently small electrically insulated sections (blocks)
such that the field perturbations at the plasma and the torques were reduced
to tolerable levels. The methods developed to analyze this problem, the
nature of the solution, and the overall impact on the blanket/shield design
are described in Sections C and D of this chapter and in Appendix F.
The mechanical design for the EPR has evolved on the basis of
nuclear functional requirements, energy recovery considerations, field
penetration criteria, materials constraints, fabricability, maintainability,
and economics. Two types of blanket/shield arrangements have been con-
sidered: (1) a contoured close-fitting circular assembly and (2) a rec-
tangular slab-type assembly. Although the circular assembly is taken as
the reference design, both assemblies have been subjected to design analysis.
Tlie circular design consists of 16 segments, each composed of 17 blanket
blocks and 26 shield blocks, which cover the first wall assembly with a
total of 688 separate blanket and shield blocks. Each block is electrically
insulated from its neighboring blocks and is independently cooled.
IX-4

Ik-tailed descriptions of the blanket/shield mechanical design are given in
Section f) of this chapter.
Thermal performance analyses of the blanket blocks show that these
blocks can be adequately cooled with pressurized water under conditions
where: (1) the coolant volume fraction and pumping power requirements are
quite reasonable; (2) the coolant inlet and exit temperatures, pressures,
velocity, etc, are suitable for use with a conventional pressurized water
reactor-type steam generator; and (3) there is sufficient adjustment po-
tential in the coolant parameters to accommodate a wide range of cooling
requirements. Cooling of the shield blocks with a low pressure water cir-
cuit was also found to present no serious problems. A discussion of the
thermal performance analyses is given in Section E.
The last section of this chapter (section F) contains a summary of
the major research and development items that have been identified during
the course of the blanket/stiield design activities of the past two years.
A. Nuclear Design of the Blanket/Shield System
The neutronics and photonics analyses play a major role in defining a
technically sound design for the blanket/shield system. This section is
devoted to the nuclear analysis of the EPR reference design. The dis-
cussion is limited to only the major design cr i ter ia and the prominent neu-
"unics and photonics effects in the reactor. Additional detailed calculations
and sensitivity studios are presented in Appendix G. The analyses of
radioactivity, afterheat, and biological dose in the reference design are
given in Chapter XIV.
1. Primary Design Criteria and Constraints
The primary function of the blanket is to convert, and possibly multi-
ply, the kinetic energy of fusion neutrons and secondary gamma-rays into heat
at sufficiently high power density so that thermal energy retrieval ind
conversion to electricity with a reasonably high efficiency Is feasible.
This requirement of high power density implies the use of efficient atten-
uating materials which in turn leads to a relatively sma.' overall blanket
thickness.
The blanket/shield system is required to reduce the radiation level
in all reactor components to a permissible level. The most cri t ical of
IX-5

these components are the superconducting toroidal field (TF) coils. Pro-
tection of these coils is also the most difficult in view of (1) space re-
strictions in the high magnetic field region between the plasma and the
interior portion of the [>-shaped magnet; (2) the presence of many large-size
penetrations on the top, bottom, and outer side of the plasma which greatly
enhance radiation streaming to the TF coils; and (3) the stringent magnet
protection criteria which result from low operating temperature, low threshold
for radiation damage, and the intolerable consequences of virtually all major
failure modes in the TF coils. A study of the radiation effects on co;;.uoaents
of superconducting magnets as well as a trade-off study of the conflicting
requirements for an EPR has resulted in the definition of the following
primary magnet protection criteria:
(1) Maximum radiation-induced resistivity increase in the copper
stabilizer of the superconducting toroidal field coils should
be < 3 x 10~ 3 sl-cm for a maximum magnetic field of 8 T and
< 1.5 x 10~8 il-cm for a maximum field of 10 T during the longest
time period between scheduled magnet anneals.
(2) Maximum tolerable decrease (due to irradiation) in the critical
current density of the NbTi superconductor during the longest
time period between scheduled magnet anneals is < 5% of the
pre-irradiation value.
(3) Maximum local energy deposition in the conductor matrix by
nuclear radiation must not exceed 1O~3 W/cm3 at full reactor
power.
(4) The total nuclear heating in all the toroidal field coils should
be small compared to other heat sources that contributes to the
refrigeration power requirements.
(5) The total radiation dose to all cryogenic coil-insulators must
Uc kept at a level that permits all these Insulators to function
properly for the magnet lifetime (' lO9 rads for the aromatic
hasi' opoxlus).
IX -h

The foundations i'or these design criteria are discussed in detail
elsewhere. *~ However, a brief clarifying discussion is in order. Radia-
tion damage studies on normal and super conductors at 4°K indicate that
the increase in the resistivity of the normal conductor (used as the stabi-
lizer) and Che decrease in the critical current density of the superconductor
can be recovered by near room temperature annealing. Therefore, criteria
1 and 2 above are set for only the time span between magnet anneals.
Since inorganic insulators that are resistant to radiation damage are too
brittle to be useful in the toroidal field coils, organic insulators have
to be used. As will be discussed subsequently in this section, radiation
damage to organic insulators is irreversible. In addition, any replacement
of the coil insulation is almost impossible, and exchange of the coils
themselves is very expensive. Therefore, criterion 5 requires that the
maximum radiation dose tolerated in the coil insulation be based on the
magnet lifetime. Data on radiation damage to organic insulators at 4°K
do not exist. In view of this situation and until more experimental re-
sults are available, extrapolation of available data at higher temperatures
has led to the tentative choice of an epoxy coil insulation set with an
aromatic type curing agent, reinforced with fiberglass and filled with
granular alumina. A total integrated radiation dose of 109 to 10 *" rad
may be tolerable for these epoxy composites.
One of the major constraints on the blanket/shield system in EPR is
a severe restriction on space in the high magnetic field region on the in-
side of the torus between the plasma and the vertical segment of the D-shaped
toroidal field coils. To conserve on space in this critical region without
violating the magnet protection criteria discussed above, a combination
of materials that is very effective in attenuating neutrons and secondary
gamma-rays must be used on the inner side of the torus. Unfortunately,
such materials are generally more expensive and they result in significantly
more neutron-induced activation than the less efficient attenuators. How-
ever, because of the relatively small volume of the inner shield (5 to 10%
of the total), the increase in material cost - if kept moderate - can be
more than offset by a net reduction in the overall reactor cost resulting
from a substantial reduction in reactor size and/or a more than compensating
increase in the reactor power output.
IX-7

Since Che vertical and horizontal bores of the D-shaped TF coils can
be increased without large coat penalty, there can be more space on the top,
bottom, and outer side of the plasma than is available on the inside.
Thus, the shield in these regions can, in principle, be constructed with
materials that meet many other desirable criteria (such as reduced cost and
induced-activation) but s t i l l provide adequate protection of the TF coils and
auxiliary equipment. However, the EPR, as well as future tokamaks, requires
that the blanket/shield system accommodates major penetrations, including those
for vacuum pumping, neutral beam and/or radio frequency (rf) heating,
diagnostics, and maintenance access. Many of these penetrations represent
large open regions (some ^ 0,6 - 1 m2 in cross-sectional area) which extend
from the first wall (directly visible to the plasma neutrons) radially out-
ward through the blanket/shield and between the toroidal-Field coils. Since
these penetrations are numerous and large they can be accommodated only
on the top, bottom, and outer regions of the shield. As will be shown
later in this section, the bulk magnet shield can do very l i t t l e to atten-
uate radiation streaming through these penetrations, and a special pene-
tration shield has to be provided. The penetrations and their special shield
create a space problem inside and between the toroidal field coils. This
again calls for efficient attenuating materials for the penetration shir1-'.
Since the bulk shield is not efficient in protecting the TF coils
from neutrons and gamma-ray streaming through penetrations, the following
design criteria were adopted:
(1) For a g fen material composition, the dimensions of the bulk
shield should be kept to the minimum that is sufficient to pro-
tect the TF coils in regions far away from the penetrations ( i .e . in
complete absence of any penetration effects).
(2) The penetration shield must completely offset the penetration
effects at the TK coils; i . e . , the penetration shield must reduce
the maximum radiation level at the TF coil to that in Che absence
of penetrations.
(3) The penetration shield mus1" also extend far enough to protect
auxiliary systems external, to the TF coils that are affected
by penetration-assisted streaming.
TX-fl

In the presence of an abundance of high energy neutrons, activation
of many of the reactor components is unavoidable and the consequences must
be factored into the design, Construction of all components of an EPR from
low-activity materials, such that contact maintenance is feasible every-
where in the system in a short time after shutdown, is not possible at
present. For example, employing aluminum as the supporting structure and
stabilizer in superconducting magnets requires resolving a considerable
number of technological and economic problems. The use of a graphite blanket
and Al-BitC shield on the inner side of the torus resu^.s in a large size
reactor with an added cost that outweighs the benefits of contact maintenance.
Thus, remote maintenance has to be planned for in the EPR design.
There are two goals, however, concerning induced-activation which
are achievable for EPR and which have been included as design criteria for
the present EPR design. These are:
(1) The total inventory of radioactive materials should be kept to
a minimum in cases where there are no serious conflicts with
other critical design criteria. This aims toward reducing the
inventory of materials that will require provision for long-
term storage at disposal time.
(2) The biological dose in the space inside the reactor building
and external to the torus and the magnets should be reduced
to a level which permits controlled personnel access to this
region within a reasonably short time ( 24 hours) after shut-
down. Since Lhe walls of the reactor bailding, which also serve
as the biological shield during operation, are thick ( 1.5 m ) ,
there is a substantial saving on remote maintenance equipment
Oijst and repair time if personnel access to the reactor building
is feasible.
2• Description of the Nuclear Systems for the EPR; ReferenceDesign and Calcuiational Models
For the purposes of the nuclear analysis, the blanket/shield system
c:£.T5 be classified into the following subsystems: (1) first wall assembly,
(2) blanket, (3) bulk shield and (4) penetration shield. Figure IX-1 shows
a schematic cross section of the reactor. Many of the engineering details
IX-9

M i OHMIC HEAflNG COLSc a CSUIUBAUU FiEl U CCHLS• B "iTAINLCS?. !iTf.Eu• • rjiAPHlTE li-'. BOWOIIi i nonciN t«(H)it£iB4C>P' l L tAD MCWTAHBDJ STMH! FS5 STF.i ' . OR
Figure IX-1. EPR Blanket/Shield Layout
IX-10

are omitted from this figure. The bulk shield circumscribes the blanket and
consists of the inner, top, bottom, and outer shield. Since the bulk shield
is essentially the same in the last three regions, these regions will be
referred to collectively as the outer shield unless a need for distinction
arises. Tables IX-2 and IX-3 show the dimensions and material compositions
of the first wall, blanket, and bulk shield for the inner and outer regions,
respectively, at the midplane.
The stainless steel assembly which forms the first wall, with internal
coolant passages (described in Chapter VIII), is idealized as a uniform
4-cm-thick stainless steel region that has an inner minor radius of 240 cm
and the coolant passages homogenized. The blanket is symmetric and consists
of a 28 cm-thick region of stainless steel with space provided for coolant.
The inner shield consists of a 58-cm-thick region containing alternating
layers of stainless steel and boron carbide in an optimized configuration
to produce maximum attenuation of neutrons and secondary gamma-rays. The
two sides of the inner/outer shield interface form a 50° angle at the
plasma center. The outer bulk shield is 97 cm Chick and consists of 15 cm
of graphite with IX natural boron, 65 cm of lead mortar, 8 cm of stainless
steel, and 9 cm of aluminum. The composition and atom densities of lead
mot tar are shown in. Table IX-4. The major constituents of lead mortar are
H, 0, B, C, and Pb, all of which have no significant long term activation.
Lead mortar can withstand heat conditions up to 150*C. While the
graphite is not as effective in neutron and gamma-ray attenuation as lead
mortar, graphite is employed at the outer perimeter of the blanket to
ensure a sufficiently low power density in the lead mortar. Zones 19
through 27 in Table IX-2 and Zones 26 through A0 in Table IX-3 represent a
reasonable idealization of the toroidal-field coil assembly. The aluminum
structure in the exterior regions of the outer shield and the TF coils
has been purposefully included in the design for reasons which will be
discussed subsequently. Because of the complexity of the geometric
details required to describe the penetration shield, its description is
deferred to part 7 of this section, which is devoted to the penetration
analysis.
Neutron and photon transport calculations for the nuclear analyses
were carried out in one-, two-, and three-dimensional geometries. One-
IX-11

Table IX-2, Dimensipns and Material Compositions of the TygR
Blanket/Shield at Mldplane
-
- --,
—
^ _- -
-
_
-*• -; —
i
- -
- 4 t,-
i. -V1
*-3E?' _-----8" -
i 9-
1 01 112-
- -HT4
~~ I S161713
!•>
21
—\ 23
2425 —
~ 26
~ ?
- 28
.'9-
Outer Mljar
625 - - •* —
4X5 L-x, -
3 8 5 . , "„_ sc-'-t ~=384 ~
~~3S1
sai=--, „. . 371
—361
353
U52341344
-334 -32E318310JOCI295 -
2943.<!O.5
288 _2S3
—280,5
"" 279.3J>74,3 - —
259.3- 264,3
208,8 -
18»
- _
Ourer Minor
I . " " 241-242
244
254
272
273
5752812 3 129730?315325330331 — -
334.5-337
342 1344.5
_ _345.7.
350.7- 355.7 - —
360.74lft,2-
440.0 -
465.0
-
Thtf km--,,
.- AW-&
tI
2
to10
s
1
ih
10b
108
1051 -
J~.52.5
5" - 2.5
-1.2"
5.0- - 5.0
5.055.5
l'3.d
25
Plasma
Stainless SteelStainless Steel
(•¥ coolant)Stainless Steel
J SsainleaE Steel
1Vacuum
Stainless StoolBoron CarbideStainless SteelBoron CarbideStdlntcaa Steeltiorcm CarbideStainless SteelBaron CarbideStaintes-i btrel
~ rFC'itiwIr (MlVacuum, l iquid n i t r o - -
j*en tubinK» >>fid
Thermal hlu'etd (Al)Vacuum (*• super-
ausulator)TFC"bobbin'CSS)
{TFCi (44 -SS +• '.12 Cu1 + i ; Kirf T UZ Ita)
1Support Cylinder (SS)
O1IC( 4 0 » SS + 2 8 r Cu +2T NbTi + WS He)
Ui'iibltv
1.00,4
1.0
0.9
0.9
0.0
0,d5
0,900.95o.go0.95o.so0.95O.TO
- o.^-—-i.o -
0 . 0
00 , 0
1.0
1.0l .Q1.01.0
1.0
1.0
li 2.
all
T*tH
U
*K
-
£
uH
"l Mtnlmunt dtstaae-t- ir, ""id
the
£rora the center of che torus Co the outer boundary of the zone,along. t"h«? ninor radius fron Chi: cancer of the plasma Co the outer boundary of
IX-12
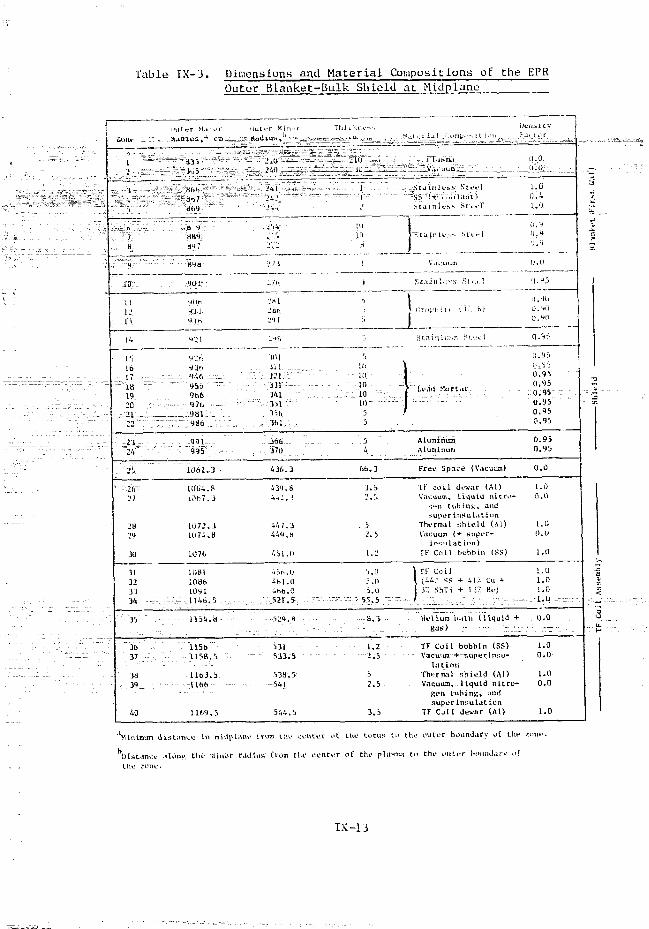
Table IX-3. Dimensions and Material Compositions of the EPROuter Blanket-Bulk Shield at Mldplano
i4
7tl
4
,-l.u. -
11{/'
.1').
I-'.
r,. 7
~18~I "20
- 2 122
2124
. 2b.
' • ; 1 b T -
27
23»u
30
31323334
35
3b37
3339
.'.0
nut* r M i n iKadius,-* cm
dJ5
Bobb i 7dh'J
tl 9B84
n<>:
H 4 3
901.,
4 0 b4 11fib.
4-41.
4 >r'.
'iio9tj6•i?t>9 8 19 8 b
9 9 1995
lOolv-J
UflvA.810^7.3
•li)72.31074.H
107 b
108110861091U46.5 _
1154.H
11561158.5
1163.51166
1169.5
nut r Miiur
-10 -
-
2-11 ^ >
, t
_ J
' ' i
•:rtt
:'H 1
101JI IJ21131341351Jit.i b l
3 6 6i 7 0
43o.3
439.8
447.3449.8
•'.51.0
456.04bl.O4bb.OS31.5
.24.8
531533.5
ri3S.5541
544.5
T l i i . t i n - .
21U1U
11
-
inin
n
•
;•
5
',i '
1010
1010
s>
54
in . . 3
3.52. J
. i
1.2
5 . 05 . 03 . 0
- 5S.5
S.3
1.2- 2.5
52 .5
3.5
n isnui
aea i i iK- ,> >>t.c]S« (+ i i l m t lS t d ' n l e S S ^ l u l
^ l a HI 11 -.s S t i .;1
t i in U •-;>•,- .•U.i;t:I
j "'»\/ Usiit Hort.irII/
AtunlntmAlumlnuni
Free. Space (Vacuiun)
TF col l dtfwar (Al!Vacuum, liquid n i t ro-
>:«n tubing, and
ThiTimil sh i e ld (Al)Vacuum (* yupt'i'-
in-i-i lation)IF Coil bobbin (SS)
\ TF CoilI ( H ' I SS + 4U Cu +1 !' SbT 1 + 12' Hi-1/
Hi;Uum ii.ilh ( l iqu id +
TK Coll bobbin (SS)Vacuum + superinnu-
l.itionThurral shield (Al)Vacuum, liquid nitro-
gen tubing, .miisuporinsulation
TF C.il deuar (Al)
v i r
( l .Uu (1
1.0U . -l . ' J
i'i.H
o.»Q , 'i
U.O
ll.'KIU . W0.9(1
0.9S
11.93
U =. 'i 'i0.-.9S-0.950.950.950.950.95
0.950.95
0 . 0
1.00 . 0
1.00 .0
1.0
1.0
1.01.0
- i.o -
0 . 0
1.00 . 0
1.00 . 0
1.0
'Sunlmum dlstancu in mhlplanu I rum thu centM uE Hie torus tt> th.; outer boundary of the *<>n«.
ht>Lstuni:.' IIOUK the ntnol- raJiusr from the centur of the planmn to ttw mitfr bimmKiry ofttn: •.-.uui.-.
IX-13

ft
Tible IX-4 Composition and Atom Densities of Lead Mortar
E emenc
H
0
B
C
f'h
Others
Compos it ionw/o
2.4
3.3
5.0
15.2
73.6
0.5
Atom Oentity _(lO22 atoms/cm3)
3.6
0.3
0.7
1.9
0.5
-
*Composition selected heru corresponds to Chemtree product CT-1-6-82-5with a physical density of 2.5 gm/cm3
and two-dimensional geometries were calculated by the S method with
ANISN, DOT, and TWOTRAN. The continuous energy Monte Carlo code VIM
was employed to treat the three-dimensional geometries. The S calcula-
ntions were carried out with 100 energy groups for the neutrons and 43energy groups for the gamma-rays with cross sections generated from ENDF/B.
7 8Response functions were generated with MACK from ENDF/B.
Nuclear analysis for the EfR blanket/shield requires multi-di-
mensional calculations to treat the following effects: (1) the presence
of major penetrations, (2) the toroidal geometry, and (3) the non-symmetry
of the shield that can be seen in a vertical cross section of the ANL-EPR
design (Figure IX-1). The penetrations re>. ire 3-D calculations, but the
other too effects can be analyzed by adaptation of a 2-D model to hand.!.,
toroidal geometry as well as any non-symmetry in the vertical cross sec.ion.
A solution accurate everywhere in the system requires full 3-D geometric
modeling, as i t is not possible to completely isolate the major individual
effects listed above. At present, prediction of neutron and photon transport
in 3-D is feasible only with the Monta Carlo method. Eecause of the
stat is t ical nature of the method, obtaining a reasonably accurate solution
everywhere in a complicated large-size geometry with deep radiation
penetration is too expensive at present.
IX-14
Since the ANL-EPR blanket/shield is toroidally axisymmetric, all
the effects except those for penetrations can be reasonably accounted for
in a 2-D model. The approach used for the nuclear analysis here is (1)
application of 2-D calculations to predict the gross behavior of the neu-
tronics and photonics effects away from the penetrations and (2) application
of 3-D calculations with geometric modeling which includes the penetrations
and the penetration shield to analyze the effects in penetration regions and
to superimpose the penetration effects on the gross behavior predicted by
the 2~D calculations.
The rest of this section is organized as follows. Subsection 3 is
devoted to the toroidal geometry effects. Subsections 4 and 5 present
the gross behavior of the neutronics and photonics effects in the blanket
and bulk shield away from the penetration regions. Since the criterion
for the- local penetration shield has been to reduce the radiation level
ac the TF coils to that in the absence of penetrations, the neutronics
effects in the TF coils given in subsection 6 are essentially the same
(except for small variations) in the absence of penetrations as in the
presence of fully-shielded penetrations. Subsection 7 is devoted to an
analysis of penetrations, penetration shield, and penetration effects on
the nuclear performance of the blanket and bulk shield.
3. Toroidal Geometry Effects in the Reference Design
The neutron transport equation can be solved in an axisymmetric
toroidal system (see rigure IX-2) using two approaches: (1) a 2-D geo-
metrical model in (R,Z) cylindrical representation with the poloidal axis
as the axis of the cylinder and R as the major radius; and (2) a 2-D
geometrical model in (r,x) representation with r as the minor radius and
X the poloidal angle, provided that the toroidal curvature is properly
accounted for in the transport operator. The first method has at least
one drawback, particularly for circular tokamaks. Current S codes employn
a rectangular spatial mesh which cannot yield a sufficiently adequate
representation of the geometry, particularly the first wall, with a
reasonable number of mesh points. The second (r,x) approach is very
useful in overcoming this difficulty. Therefore, the TWOTRAN program
was modified according to the formulation presented in reference 9 to
solve the transport equation in axisytnmetric toroidal geometry with the
cross section of the torus represented in the (r,x) coordinates. The
IX-15

R
TOROIDAL AXIS
Figure IX-2. A Schuitm h: ReUTcnce of :Toroidal Ccorat-irv.

!»••« •1!i'^,:t'.n'- v ; t > t h e n a s r j tt> . - . i h u K i d ' i !u- m u t r u i i i ' ; . o f ! i> . ; t s ; i n t h e
r r ! «• r t - n ; c ir-•• i t ' i i .
i t «;js f o u r d i n t h e n m r s i - of t h i s work t h a i Che l o c a l n c u i r o n i c : ; e f f e c t s :,
its i!u- f i r s t w a l l -Mil b l a n k e t .tev inx Esorcr s e n s i t i v e t o t h e ? ; p ; t l i a l d i s t r i - ;
Inn i.iti o ! t h e ;>-T tu'iit run s o u r c e s t r e n g t h a s a f f e c t e d by thc» t o r o i d a l Keutse t ry i
.uui tin- Mil) i - ' j u i l i b r USE d i s t r i b u t i o n uf t h e j>! aKteut t h a n t h e y a r e t o t h v
It., .il t o r . ' i t i a ! • • u r v . i t u r r 1" t h e f i r s l wo 11 .wd b l a n k e t , B i t - r t - fu r i - , •» tu-u-
tr.»n .uvtr. ••• 4 i s t r i h u t ion w,t-« -.U-rtvi-d f ruia tin- !'2iD r<\\ii I i h r i u s p l a s c M d j . s -
t r ii>:i£ inn >>! ih«- r<- f cfi-n. r t .t-st- p K i s s a , AH di-st v i b c i i i n C o u p l e r H I . Hii. '.
•.our. f i S i » i r i ! > u t inn i s sh. i . 'n !M Fif iurp IS - ' i a s a f u n c t l u n uf t h e t s a j o r
ra tSni i i , K. f>»r M ' V I T . I ! v.iliu--. .•( 7 - n i n s t a t u " 7. , w h e r e •'• r e p r e s e n t * t h e
<• !<-v.iS !.>:i i r i T i tin- a i tip I.tin- . i l . in j ; t h e p n l u i i l a l t i s l ;> . An i s u n e r i c v i e w nf
t h i s iiourv'4' J1--1T i!'iit i.'Ti t •• .s2.-it> ilu>wti in KJjjvire ! » > ' . . P ie n e u t r o n s o u r , c
MrwrtKih p e r u n i t v o l u s v , S ( K , K . ) , p e a k s i n s i i i u tht- p l a s r u i res' .iott a n d dc—
r r t ' i t s c s s t c i i d i l v u r . t i l it. f e a c h e i i a e r o a t H •» R • 2 / t a n > (no t t ? t h a t t h eO f '
r-'.ic'J" ra iHns a t the t o r u s c e n t e r ! itu- K_ , i.s <>.'3 f a .sni! tin- pl;;sf-s r a d i u s is
210 i-n) , Tiie ;»eak >'J S(R,H)» i . e . .it. a i d p l a n e , n c f u r s a t R " 6S6 = R + to o
with » cicfinud as the plastrui s h i f t . Hie peak of S(R,7. ) occu r s a t a .<:nallcro c :
shift as 7. is increased,
n-.is reference neutron source distribution was used in (r,i) toroidal
Ucotnetry calculations. The neutron wall loading as a function of the poloidal i
angle . is she,,-n as curve a in Figure IX-"i. The neutron wall loading is used
here in its normal definition ,ss the product of the IJ-T neutron current in
the direction of the normal to the first wall t«mcs the energy (Ji,Of> MeV) of
a 0-T neutron. Curve b in Figure IS-S ruprcsents the neutron wall loading when-:--
the toroidal geometry calculations are made with a volumetric neutron source
distribution wh'ch I.•; uniform (constant) throughout the plasma region. The
third lino, c, in this figure Is for a nominal case widely used in the
literature, a one-dimensional, infinite cylinder approximation with the
cylinder axis representing the toroidal magnetic axis and the volumetric neu-
tron source constant in the plasma region. The three cases are normalized
such that the total number of !)-T neutrons emitted from the plasma per unit time;
is the same. In other words, a fixed thermonuclear power for the reactor
is taken as the basis for normalization. Thus, the neutron wall loadinp,
IX-17
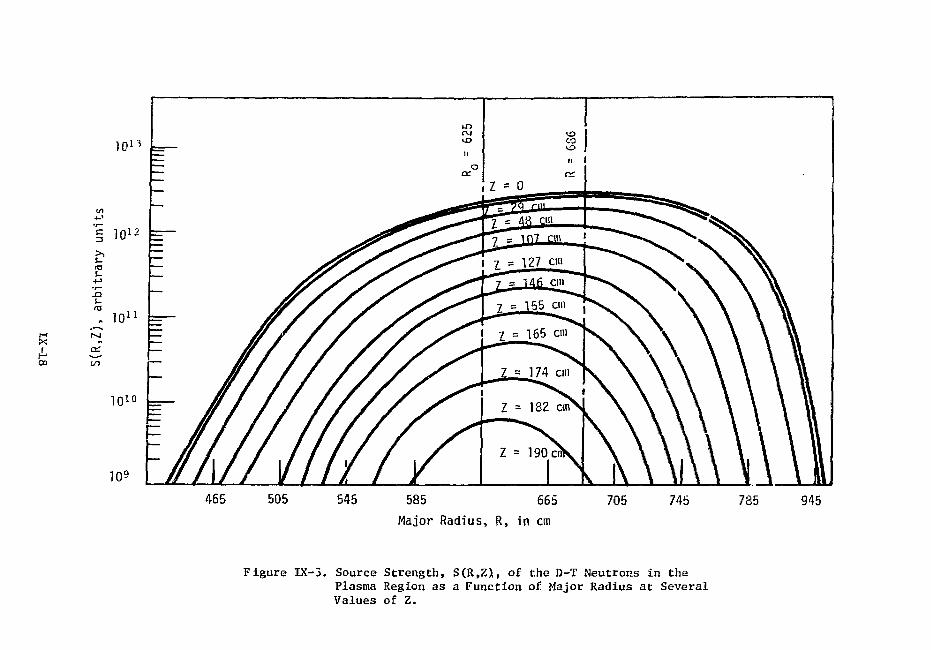
1013 =
V)
i io12 = -
rOS_
„ 1011 =
a:
TO?
505 545 585 665Major Radius, R, in cm
705 745 785 945
Figure IX-3. Source Strength, S(R,Z), of the D-T Neutrons in thePlasma Region as a Function of Major Radius at SeveralValues of Z.
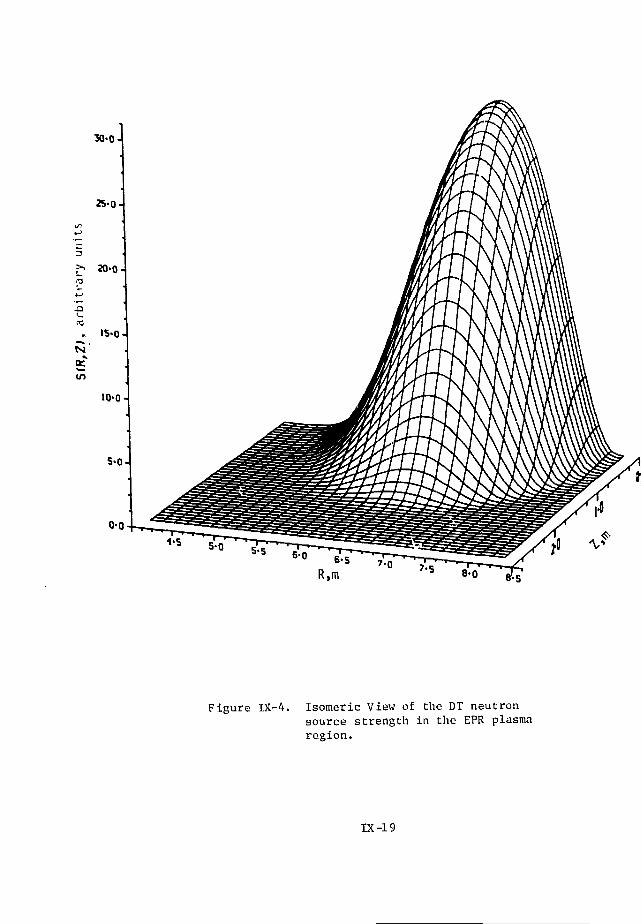
30-0 4
0-0
4-S 5-0
R.m
Figure IX-4. Isomeric View of the DT neutronsource strength in the EPR plasmaregion.
IX-19

0.6
I
g> 0.5
O3O
Co
0.4
0.33
Reference Source
Nominal
180
Uniform Source
150 120 90 60
•:, Degree
30
Figure IX-5. Variation of the Neutron Wail Loading witli thi.- J'oloid.il Ar.^K . i«
a-neutron source distribution as derived from the MIJIJ t-tjiii 1 ihri.i
plasma calculations, b-uniform neutron sourct.- distribution, <-::.,•
a uniform source distribution in an infinite L-viimii-r a;>;m>vi::ui ii

<).'> MW/nr , in Liu; nominal r a s e r i r p n s f i u s a l s o list- mean n t u t r n n wai l l o a d i n g
in a l l c a s e s , inclirpirntlfnt uf any as.sLcnpt: ion about the v o l u m e t r i c neu t ron
souri'i- d i s t r i b u t i o n . This mean n c u t r u n wal l load ing i s the average of t h e
n e u t r o n wall l o a d i n g over the Inner s u r f a c e a rea of tht- f i r s t w a l l , or i t
i s simply equal to tlu- thentwniu1 U-.tr i if i i tron power i iv idi-d by the f i r s t w a l l
. i r i - a .
Some important observations can bf made from tin- r e s u l t s in Figure IX-5.
Tor thu reference case the neutron wali loading, !' , va r ies from '* 0,56 KU'/m-w
at the outermost point (. = 0°) to 0.4 MU'/tir at the innermost point (. = 180')
The maximum neutron wall loading is 12 above the mean and 'i0*' above the
minimum. The uniform source d i s t r i b u t i o n , however, r e s u l t s in only •• 8*ivar ia t ion in !' around the moan. Thus, the neutrunU-.s ef fec ts are strongly
w
dependent on the form of the volumetric neutron source d i s t r i b u t i o n . This
implies a strong cor re la t ion between the nuclear performance of the f i r s t
vn l I /b l anke t / sh ie ld and the plasma s p a t i a l c h a r a c t e r i s t i c s . These ca l cu la t ions
of the neutron wall luading are cons is ten t with the work of Chapin and Pr ice
which examined the behavior of the uncoilided fli1 :es and currents in to ro ida l
systems.
Figures IX-6 and IX-7 show the variation of the rates of helium pro-
duction and atomic displacements within the first l-cm of the first wall
with the poloidal aigle v for the same three cases, of Figure IX-5. For
case a,where the neutron source distribution is derived from the plasma
spatial distribution, the helium production is maximum at v = 0° (outermost),
and decreases montonicallv as \ is increased until it reaches a minimum at
X = 180° (innermost) The maximum to minimum ratio is ^ 1.3. The uniform
source distribution, on the other hand, shows a helium production which is
maximum near the top of the torus and is higher in the inner region than
on the outside. The helium production for the nominal case of the infinite
cylinder approximation is also shown in Figure IX-6. An important con-
clusion to be drawn from the results in Figures IX-6 and IX-7 and from
comparing the results for other response rates is that the infinite cylinder
approximation with a uniform volumetric source overestimates the reaction9 12
rates at all points of the first wall. Thus, earlier results"' published
in the literature, based on this 1-D model, represent conservative estimates
of the radiation damage indicators in the first wall, as far as the maximum
rates of gas production and atomic displacements are concerned.
IX-21

200
I
140
130
fJominal
180 150 120 90 60
>, Degree
30
Figure IX-6. Variat ion of tliu Helium Production Rate within theF i r s t 1-cm of the F i r s t Wall with the I'oloida! \w\\\x

11.0
Nominal
10.0
Oa.•a9.0
«
8.0
AReference Source
180 150 120 90 60
x, Degree30
Figure IX-7. Variation of Atomic Displacements within the Firs t 1-cmof the First Wall with the Poloidal Angle x-
IX-23

The results in Figures IX-5 through IX-7 can be explained by a detailed
analysis of the angular fluxes and the collision probabilities at all
points in the first wall for all cases considered. However, the fact
that the reaction rates at the first wall calculated in the toroidal
geometry representation are lower than those predicted by the Infinite
cylinder approximation with a constant volumetric neutron source can be
explained qualitatively as follows. The collision probability of a neutron
incident on the first wall generally increases as r.he angle o[ incidence,
d (see Figure T.X-2), to the first wall is increased; i .e . neutrons incident
at a direction close to the tangent (0 = 90") to the wall have n greater
probability for inducing a react ion in the wall than neutrons incident
near the normal (9 = 0°) to the wall. In the infinite cylinder approxi-
mation with a volumetric neutron source,the angular flux is peaked (actually
singular) at the tangent direction parallel to the cylinder axis. In the
toroidal geometry representation, the angular flux is zero for 8 > 0 , where
9 depends on the poloidal angl^ Xi the neutron source distribution and themax
characteristics of the torus. The maximum angle of incidence, 0 , is < 80°' max
at x = 0>° and i t increases slowly but is < 90° at all points on the outer
part of the torus. At the inner side of the torus where 9 can reach 90",.. max
the angular flux is still higher m. small 6 since the flux near 8 i> 90° does
not cover the entire range of the angle <f> (See Figure IX-2) while it covers
all values of $ for small 9. This explains qualitatively two effects; (1)
the reaction rates on the outer side of the torus with the uniform and
reference source distributions are lower than the reaction rrtes predicted
in the infinite cylinder approximation although the neutron current to the
wall is lower in the latter case, and (2) the reaction rates in the toroidal
geometry-uniform source case have maxima near x = 105°.
The volumetric neutron source distribution derived from the reference
plasma case has two important characteristics compr.rtiO with the uniform
source distribution. The referetce source is peaked inside the plasma
and drops rather rapidly to zero at the plasma boundary. Moreover, the
peak occurs at the horizontal midplane and is shifted toward the outer part
of the torus. Tl-e "peaking" effect alone causes a reduction in the number
of neutrons incident close to the tangent of the first wall and hence a
reduction in the reaction rates in the first wall compared with the uniform
source. The geometric shift of the source peak causes the total number of
IX-24

neutrons crossing a unit area of the first wall to increase at the outer
part of the torus and decrease on the inner side of the torus.
The turn*, .cs calculations in toroidal geometry show several important
considerations that need to be accounted for in a tokamak reactor design.
Among these are the variation of the angular flux with position around the
first wall surface. Figures IX-6 and IX-7 shuw that the rate of gas production
and atomic displacement in the first wall vary with the poloidal angle x. Varia-
tion of radiation damage effects with position in a structural member is un-
desirable. Differential swelling, for example, may create large stresses.
It should be noted, however, that the largest rate of the poloidal variation
in the neutronics effects is < 0.1% per centimeter along the minor cir-
cunference of the first wall, compared with a typical variation due to
attenuation of > 10% per centimeter radially outward. Thus, although the
poloidal variations are significant enough that they should be considered
in the radiation damage and stress analyses, they do not appear to introduce
any new major difficulties into the first wall design.
Figures IX-8 and IX-9 show, respectively, for the reference design the
rates of atomic displacements and helium- and hydrog- -production as functions
of depth in the blanket for two directions defined by x = 4 and 176 degrees.
These results show that the radial attenuation varies slightly with x^
Since the length of a minor circumference increases with depth in the blanket,
the rate of change of poloidal variations of the reaction rates along a minor
circumference decreases radially outward in the blanket. Thus, the toroidal
geometry effects are more pronounced at the first wall than in the deeper
regions of the blanket.
Thp resolts presented in this subsection show that the toroidal geometry
effects are significant and should be accounted for .. the detailed EPR design
in all relevant technical areas such as the thermal-, tydraulic, stress and
radiation damage. Ac this stage of the EPR design, however, it is desirable
to use a representative average over each minor circumference in order to
reduce the large effort involved in design analyses of the full toroidal
geometry. Or. the other hand, the use of averaged parameters is not acceptable
as a design-basis in many critical areas (e.g. radiation damage effects in
the first wall) which are more affected by the maximum than by the average.
The neutronics and photonics effects derived from the infinite cylinder
IX-2 5
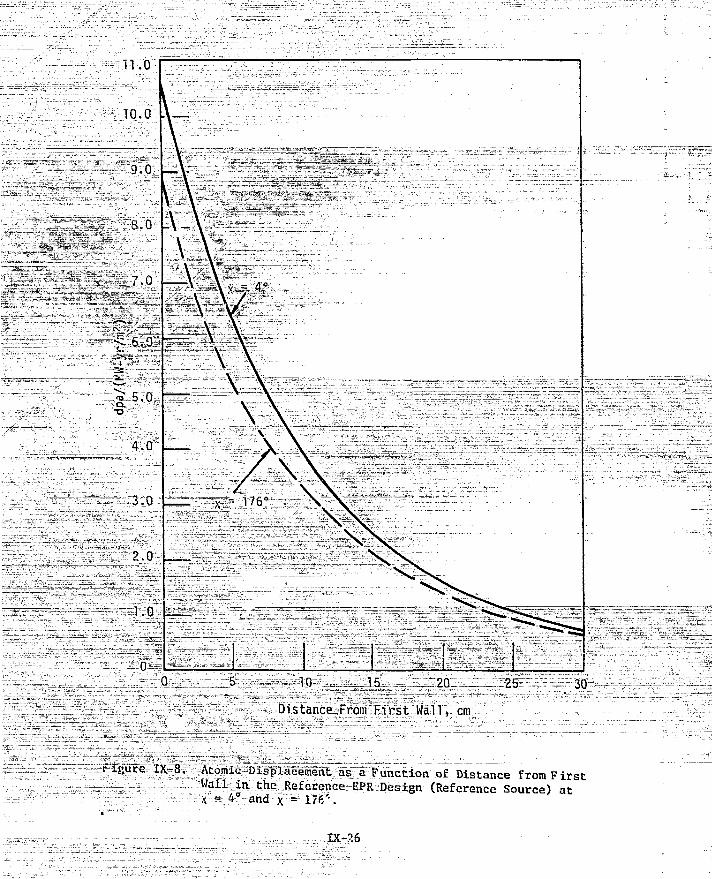
n.o
10 15 _ .. 20
Distance From First. Wall, cm
25 30
figure ix-S. Atomic Displacement as a Function of Distance from FirstWall in the Reference EPR Design (Reference Source) at\ = 4° and x = 17P/'.

10 15 20Distance From First Wall,"cm
25 30
Figure IX-9. Helium and Hydrogen Production as Functions of Distance fromFirst Wall in the Reference EPR Design (Reference Source) atX = 4° and x = 176°.
IX-27

approximation with a uniform volumetric neutron source distribution is more
conservative in this regard. Therefore, this latt -r case is taken as the
reference design base for the remainder of the nuclear design analysis as
well as other analyses in this report.
4, Neutronics Effects in the First Hall and Blanket
As discussed in the previous chapter, the first wall will be coated
on Che inside--wiCh a very Chin layer of low-Z material. The coating will
not affect the neutron -ind gamma-ray fluxes to any appreciable degree, but
it is of incerest to compare the nuclear performance f- c the various coating
candidates. Table IX-~5 compares two critical parameters (helium and
hydrogen production rates) in several low 2 materials applied as a
coaling-on; tke- inside of the first wail of EPR reference design. It is
noted; from this table that the hydrogen production rate is < 2% of the
haiiunv production rate. The helium production is highest in boron ?nd
Bi,C, with > 99% of the helium produced by l 0B. (At this high rate
of (n,a) reaction, the 10B will be burned up at the rate of 30% per
MW-yr/m2, with a corresponding reduction in the helium production rate
Table 1X-5. Rates of Helium and Hydrogen Production in Several Low-ZCoating Materials
Beryllium
Borona
Carbon
BeO
Be2C
B4Ca
appm/(MW-yr/m2)
Helium^
" 3110
70130
2241
2018
2820
56550
Hydrogen
" : si -
534
—
72
427
Boron with natural isotoplc enrichment (19.8% 10B and 80,2% n B ) ,
IX-28

In boron and boron carbide.) The high rate of helium production in a
boron coating can be significantly reduced by using boron that is largely
depleted in 10B. It should be noted that the helium production rate in
a boron-containing coating can be reduced by more than an order of magni-
tude by placing a strong low-energy neutron absorber, e.g. 5Li, behind
the first wall.
Figure IX-1Q shows the spatial (radial) distribution of nuclear heating
in the first wall and blanket of the reference design for a neutron wall
loading of 0.5 MM/m*. The maximum nuclear heating is 5.8 W/em3 in the
first wall and 3.5 W/cm3 in the blanket and it drops to Q.3 W/cm3 at the
outer boundary of the blanket. The total recoverable energy per fusion
reaction, including the 3.5 MeV a, is 18.3 MeV of which ^ 40% is deposited
in the first wall assembly, in the absence of penetrations.
Figure IX~11 shows the atomic displacement in stainless steel as n
function of position in the first wall and blanket. A displacement
energy of 4Q eV was assumed for stainless steel. The spatial distribution
of the helium- and hydrogen-production rates in the stainless steel are
shown in Figure IX-12. The maximum values in the first wall are 11
dpa/fMW-yr/m2) for Che atomic displacement, and 530 and 215 appro/(MW-yr/m2)
for the hydrogen- and helium-production> respectively. The helium and
hydrogen production rates decrease about an order of magnitude in 13 cm
whi^e the atomic displacements decrease at a much slower rate. The ratio
of the rates of helium-production tc atomic displacements is also shown
in Figure IX-12 with some small variations omitted for clarity of the
graph. It is worth noting that across the 4-cm thick first wall
assembly the helium production decreases by a factor of "v> 2.5 and the
atomic displacements decrease only by a factor of ^ 1.5, causing the
helium-to-dpa ratio to vary by i< 60% across the wall. Thus, in addition
to being relatively high, all the significant radiation damage indicators
exhibit a significant spatial dependence.
IX-2 9

10.0
TOTALNUCLEAR HEATING
<LiJX
i.0
GAMMAHEATING
0.15 10 15 20 25DISTANCE FROM FIRST WALL, cm
30
Figure IX-10. Spatial Distribution of NuclearHeating in the EPR First Walland Blanket for a Neutron WallLoading of 0.5 MW/mz.
IX-30

10 15 L'O
Distance From First Wall, cm
30
Figure IX-11. Spatial Distribution of Atomic Displai-omont in theEPR First Wall and Blanket.

I
eQ.
O
10 —
: I *
\
: A, HELIUM
: /He/dpa
-
-
I I
1 1
HYDROGEN
1 1
I
\
1
I :
—
-
—
s>—-
15 10 15 20 25 30
DISTANCE FrOM FIRST WALL, cm,
[X-L2. Spatial Distribution of Helium and Hydrogen ProductionRates In the KPR First Wall and Blanket. Also shown isthe spatial dependence of He-to-dpa ratio.
IX-32

5, Neutronics Analysis of the Bulk Shield
Figure TX-13 shows the spatial distribution of nuclear heating rates
in the outer shield for a neutron wall loading of 0.5 MW/m2. The maxi-
mum heating rate at the inner structural steel ring is ^ 0.3 W/cm3. This
value drops across 23 cm of SS and C (1% B) to % 0.04 w/cm3. As expected,
the neutron heating is dominant in graphite while the absorption of secon-
dary gamma-rays contributes the greatest part of the nuclear heating in SS.
The nuclear heating in lead mortar exhibits a rather interesting behavior.
Beci.use of the presence of a significant amount of boron in lead mortar
most of the low energy neutrons transmitteu from neighboring regions are
absorbed in the first few centimeters of lead mortar with an exothermic10B (n,a) reaction. This causes a maximum heating rate in lead mortar
of % 0.2 W/cm3 which drops to ^ 0,02 within 8 cm and to ^ 8 x 10~5 W/cm3
in an additional 55 cm of lead mortar. In the midregion of lead mortar,
where the number of low energy neutrons is small, the gamma heating
(mostly from absorption in lead) is comparable with the neutron heating.
The rate of nuclear heating in the midplane in the inner bulk shield
is shown in Figure IX-14. The nuclear heating in the SS-innermost region
is "u 0.2 W/cm3 but it rises to 1.4 W/cm3 in Bi,C. The minimum nuclear
heating in the inner shield is 10""1* W/cm3. The nuclear heating rate per
unit volume in boron carbide is about a factor of 6 higher than •>" • the
neighboring stainless steel regions. The thermal conductivity is lower
for Bi,.C than for SS; however, no severe difficulties arise in the design
of the heat transfer systems because B^C can be operated at much higher
temperatures than stainless steel. In the absence of penetrations, ^ 7%
of the reactor (nominal) thermal power is generated in the shield. The
penetrations cause this fraction to be increased by an additional few
percent.
The helium and tritium production in boron carbide is of concern.
Table IX-6 presents the rates of helium and tritium production in boron
carbide in the reference design. The maximum tritium production in boron
carbide is 0.36 appm/(MW-yr/m2). This level of tritium production does
IX-3 3

10 -
ro
COUJ
oro
UJ
fo4
i65
ssK
\
-
-c—|ss
\
\ <
V \\
• - —
1
1
\
|
1 1 ' 1 l 1i «- A n ynoTAr? •>.LLAU MUIUAK • • A/
. Wn^ 0.5 MW/m2v\\
IUIAL nLAIIINU V "•—XNEUTRON HEATING \ \GAMMA HEATING ^ 1
I . I .
40 60 80 100 120DISTANCE FROM FIRST WALL,cm
Figure IX-13. Spa t i a l Dis t r ibut ion of Heating Rates in the EPROuter Shield for a Neutron Wall Loading of 0.5 MW/m2.
IX-34

10
10.0
10
-2
toE
co
O
| i 6 3
-410
10"
Hsskci—ss-HB-c H-SS-H B. c I—SS-HB4C
. v V
TOTAL HEATINGNEUTRON HEATINGGAMMA HEATING
I
\ -!
30 40 50 60 70 80 90DISTANCE FROM FIRST WALL,cm
Figure IX-14. Spat ia l Dis t r ibu t ion of Heating Rates in the EPRInner Shield for a Neutron Wall Loading of 0.5 MW/nr.
IX-35

Table IX-6. Helium and T r i t i u m P roduc t i on UaU'S in lloron C a r b i d e I n theANrl.-L-:i'K t imer Sh ie ld
Distance FromFirst Wall, cm
3b
38
40
51
53
55
67
69
71
73
85
S7
89
appm/(MW-yr/m")
Helium
I 390
50S
368
121
55
35
10
4.2
2.4
1.6
0.5
p .
0.1
Tritium
3.ha(~l)
3.0 (-1)
2.4 (-1)
4.8 (-2)
4,0 (-2)
3.2 (-2)
5.7 (-3)
4.8 (-3)
3.9 (-3)
3.1 (-3)
5.3 (-4)
4.5 (-4)
3.6 (-4)
3 . 6 ( . - I ) s h o u l d r e a d a s i.h x 10" \ e t c .

not present any serious problems. Moreover, tritium diffusion in boron
carbide is expected Co be very slow, particularly at the low operating
temperature of the shield. The spatial dependence of the helium- and hydro-
gon-production rates in both the SS and Bi,C in the inner shield is pre-
sented in Fig. 1X-15. The maximum helium- and hydrogen-production rates
in SS are 1 and 4 appm/(MW-yr/mz), respectively, and are more than two
orders oi magnitude less than those in the first wall. About 70% of the
hydrogen produced in the Bi,C is tritium. The helium product!on-rate in
the innermost layer of Bi,C is 1390 appm/(MW-yr/m2) a significantly high
value. Thus the u^e of boron carbide with ^ 92% theoretical density is
planned in order to accommodate the anticipated .swelling and to accelerate
helium diffusion. The helium production in B4C decreases rapidly inside
the shield as tne low energy neutrons are captured in the preceeding layers
of Bi(C.
The outer shield material composition is less efficient in attenuating
nuclear radiation than the SS-Bi,C composition employed in the inner shield.
However, the total attenuation provided by the outer shield is significantly
better than that provided by the inner shield because of a much larger
shield thickness on the outside. From the viewpoint of magnet protection,
the outer shield can be replaced with the same material composition (SS-Bi+C)
and dimensions used for the inner shield. This would have the advantage
of providing more access space out board of the shield if such space were
needed for other purposes. However, there are two strong reasons that led to
the selection of the reference design. First, the graphite/lead mortar/alumi-
num combination has no significant long-term activation, in sharp contrast with
stainless steel. Since the volume of the outer shield is more than 90% of
the total shield volume, this leads to a significant reduction in the
total inventory of radloisotopes that require special provision for long-
term storage at disposal time. Moreover, it is possible in the current de-
sign to permit controlled personnel access into the reactor building within
24 hours after shutdown for repair and inspection. The second reason
is based on economic considerations. At present, boron carbide with 95%
density costs more than 120 $/kg. A demand for large quantities ("\» 0.5
million kg) could possibly reduce the BtjC price by a factor of 2. Othfer
IX-3 7
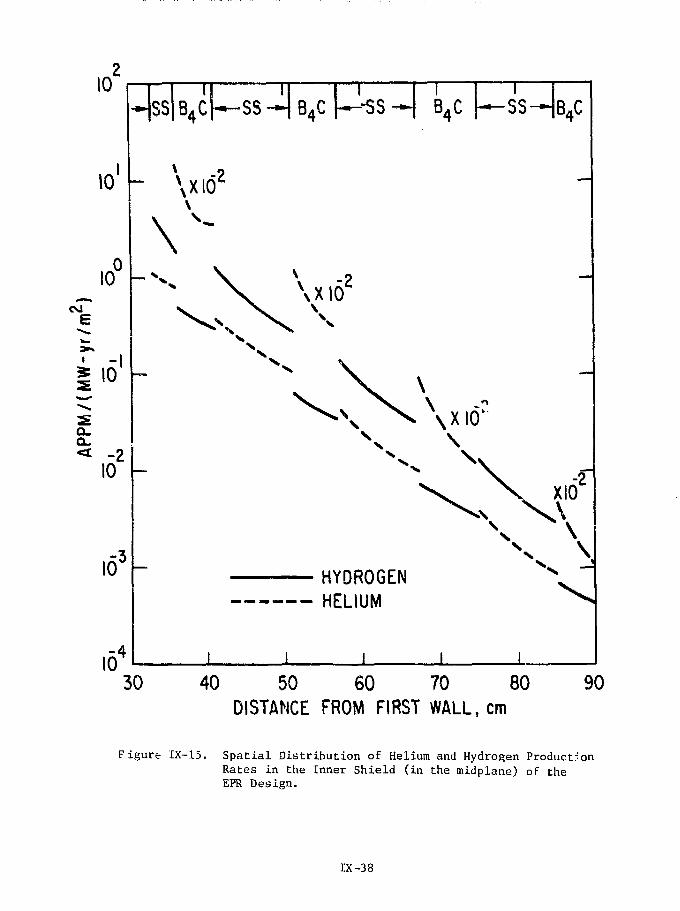
30 40 50 60 70 80 90DISTANCE FROM FIRST WALL, cm
Figure IX-15. Spatial Distribution of Helium and Hydrogen ProductionRates in the Inner Shield (in the midplane) of theEPR Design.
IX-3 8

material costs are typically 2.7, 3, and 3,5 $/kg for SS, C (1% fi), and
lead mortar, respectively. Thus, for the reference design, the inner
shield costs ^ 4 million dollars and the outer shield costs ^ 6 million
dollars with a total material cost of ^ 10 million dollars. If the
reference design were changed to include a symmetric shield of SS-B^C,
the material cost would be "* 30 million dollars.
6. Neutronies Effects _itii the_ Toroi.dal-Fi.ald (TF) Coils
The maximum radiation effects in the TF coils of the reference
design occur in the inner (vertical) segment at midplane. The neutronics
effects in this segment are presented in this subsection.
Figura IX-16 shows the nuclear heating as a function of position within
the homogenized composition of the magnet. The maximum nuclear heating
is ->- 2.5 x 1Q~5 W/cm3 which is much less than the Joule losses the conductor
is designed for. The heating rate decreases with an exponential attenua-
tion coefficient of ^ 0.13 cm"1. The total nuclear energy deposition in
the bobbin and winding of the 16 magnets is 1.5 KW. The refrigeration
power requirements will depend greatly on whether this thermal load would
be removed at 3 or 4°K, with the lower temperature requiring ^ 1% of the
plant electrical power output. The magnitude of nuclear heating, however,
is much less than the eddy current heating due to pulsed fields.
One of the most important effects of radiation in the superconducting
magnet is t-he increase in the resistivity of the normal conductor used as1 °
the stabilizing material. In previous work, >i- available experimental re-
sults from 4°K irradiation were used to derive a correlation between the
radiation induced resistivity, p , and the number of atomic displacements.
For copper, this correlation isor = 3 x 1CT
7 [1 - exp (-563d)] fi-cm
where d is the number or displacements with an assumed displacement energy
for copper of 40 eV. The value of p calculated from this correlation
IX-3 9

en
UJ
"-7O
Id8
0 9I0
TOTAL HEATINGNEUTRON HEATING"GAMMA HEATING
I I I I I0 10 20 30 40 50
DEPTH IN TFC, cm60 70
Figure IX-16. Spatial Distribution of Nuclear Heating in the Inner Segment ofthe EPR Toroidal Field Coil (in the mid plane) for a Neutron WallLoading of 0.5 MW/m2.
IX -40

may have a 10 to 20% uncertainty due to the scatter in experimental data,
a comparable uncertainty due to the harder neutron spectrum in EPR than
in experiments and Che uncertainties in the energy dependence of the dis-
glgcefflSRfe areas sections* The level of atomic displacement is also affected
by uiweFtainties in the neutron cross sections of materials in the shield.
Til© eajuttlative effects oS these uncertainties have not been evaluated yet.
However* a 5% change to the "effective" mean free path of neutrons in the
blanket/shield can easily lead to more than a factor of 2 change in the
radiation level at the magnet.
Figure 1X-17 shows the variations of dps and p with depth within the
windings of the toroidal-field coils. The maximum p is 6 x 10"^ ft-cm
after irradiation for an integral neutron wall loading of 1 MW-yr/nr,
Thus, the reactor can be operated up to 2.5 >iW-yr/m2 before the design
value of 1.5 x 10~B n-cm allowed in the TF coil conductor is reached,
fhe reactor could be operated continuously at 0.5 MW/m2 for 5 years
hefore magnet warm-up would be needed. This period can be doubled if
operation is only at 50% capacity factor. However, it should be strongly
emphasized that the uncertainties in calculating p are great at present,
and a more frequent annealing schedule should be planned in the conceptual
design* It can be noticed from Figure IX-17 that p decreases by an order of
magnitude in 25 cm. Beyond that the change in the conductor width to
accommodate the radiation-induced resistivity is very small.
The toroidal-field coils employ a variety of organic thermal and
electrical insulators. In the temperature range from 3°K to 4.2°K there is
a paucity of irradiation data on the properties of these materials.
Extrapolation of data accumulated"athigher temperatures led to a
"choice of aromatic base epoxies for the magnet insulators. The radiaiion
dose at which their mechanical, and perhaps dielectric, properties are
seriously degraded is not known at low temperatures, but it may be in the
range 109 to 1010 rads. Figure IX-18 shows the absorbed dose in the aromatic
base epoxy (C10H13O2) as a function of position inside the conductor windings
of the TF coil. The maximum dose to the epoxy inside the conductor is
IX-41

20 30 40 50DEPTH IN TFC.cm
70
Figure IX-17. Atomic Displacements and Radiation-induced Resistivity (p ) in Copper (Stabilizer) as aFunction of; De^th within the Inner Segment of the IF Coils after Reactor Operation for anIntegral Wall Loading of 1 MW-yr/m2.

10'
to8
10 I
TOTAL DOSENEUTRON DOSEGAMMA DOSE ^
0 10 20 30 40 50DEPTH IN TFC, cm
60 70
Figure IK-18. Dose Absorbed in Mylar and Epoxy (with aromatic type curing agent)Insulators as Function of Depth within the Inner Segment of theToroidal Field Coil.
IX -43

1.4 x lQa rad/(MW-yr/m2). Thus, Che aromatic-based epoxy could probably
be operated up to more th^n 10 MW-yr/m2. Although an integral wall loading of
10 MW-yr/m2 is greater than a reasonably optimistic estimate of the lifetime
for EPR, irradiation experiments at 3° to 4,2°K on organic insulators
nevertheless needed to provide a more reliable estimate of the tolerable
radiation dose in insulators.
Shown also in Figure IX-18 is the radiation dose to mylar
another possible candidate for insulators. The maximum absorbed dose
in mylar is ^ 9 x 10⁷ rad/(MM-yr/m2) which is ^ 50% lower than that in
aromatic-based epoxy. However, irradiation experiments on mylar at 77°K
showed severe effects on its mechanical properties at 108 rad. Thus
Che mylar could only be used up to 1 MW-yr/m*1 in the EPR design.
7. Nuclear Design of Penetrations Shield
EPRs, as well as future tokamak fusion reactors, will require provision
for several types of access regions into the plasma chamber through the
blanket/shield. Penetrations such as those for vacuum pumping and neutral
beam and/or radio frequency heating represent large void regions which
greatly enhance neutron and gamma-ray streaming into regions external to
the blanket/shield. The effects of these penetrations have not been treated
in any previous conceptual design studies; however, the sizes and locations of
these penetrations indicate that their impact on the reactor design would be
significantly large. This was confirmed by a detailed study of the pene-
trations in EPR, which also indicated that these penetrations and their
special shield must be treated as an integral part of the design.
During the course of this study, the penetrations and their shield
were considered in trade-off studies for the EPR conceptual design.
Detailed neutronics analyses of various penetrations sizes and geometric
orientations, as well as various approaches for shielding against major
penetration effects, are presented in Appendix G. In this subsection,
only a summary of the gross penetration effects is given and the prominent
features of the penetration shield adopted for the reference design are
described.
The study focused mainly on the large vacuum ducts required for vacuum
pumping and neutral beam injection. These ducts are ^ 0.6 to 1 m2 in
IX-4 4
cross sectional area and they extend from the first wall (directly visible
to Che plasma neutrons), radially through the blanket/shield, and outward to
the exterior of the TF coils (see Figures II-3, and II-4), Two vacuum pumping
ducts are located between each pair of the 16 TF coils, one at the top and
one at the bottom of the torus. A neutral beam duct is located between each
pair of TF coils, centered about the mtdplane with its axis almost tangential
to the major magnetic axis. The vacuum pumping and neutral beam injection
•ducts are comparable in size and they share many common features as to
radiation streaming from the unshielded ducts. However, the approach for
shielding adopted for the reference design is different for the two systems
because of the substantial difference in the functional requirements of
the evacuation and plasma-heating systems. The two systems are discussed
separately below, (In the rest of this subsection, the blanket and bulk
shield will be referred to collectively as the bulk shield except In those
instances where a distinction needs to be made.)
a. Shielding of the Neutral Beam Ducts
The ueutronics analysis was carried out using a three-dimensional
geometric model with the Monte Carlo code VIM. These calculations
are inherently machine- and man-time consuming, making a thorough 3-D
analysis of the full reactor geometry very costly. Therefore, a somewhat
simplified 3-D geometric model which is less costly but incorporates the
basic features of the reactor geometry and accounts for all first-order
effects of penetrations was developed as follows (see Figure IX-19):
(1) Since the torus consists of 16 segments that are essentially
identical, only one segment needs to be analyzed. The segment
is defined as the entire reactor region bounded by two planes
which intersect at the poloidal axis (see Figure IX-2) and each
plane divides a TF magnet into two symmetric halves. A periodic
boundary condition is applied at both planes.
(2) In order to avoid explicit toroidal calculations on penetration
analysis the toroidal curvature was ignored, but the dimensions
of the segment were adjusted to produce correct volumes and
spacing of regions in the neighborhood of the beam ducts. The
effect of toroidal curvature on local fluxes is small as shown
1X^45

t !
ASMA
(0 BEAMINJECTOR
BOl*JDARY
Figure IX-19. Schematic of Geometry Representation forAnalysis of Neutral Beam Penetrations andtheir Shield.
IX-46
previously in this section. However, Che toroidal geometry
causes the spacing between the TF magnets to vary from almost
aero at the inside to a few meters on. the outside. In order to
account for the correct relative positions of the penetrations,
penetration shield, and magnets, the spacing between the IF magnets
ac midplane (where the beam ducts are located) was employed. Note
that the outward shifting of the magnetic flux surfaces which
causes an outward shift of the plasma neutron source strength
will Increase radiation streaming through the neutral beam
ducts compared with the uniform source case.
(3) Since the exact position of the beam axis relative to the
toroidal axis cannot be reproduced in the geometric model dis-
cussed above, an inclination angle 6 (see Figure IX-19) of 35°
was employed. Studies presented in Appendix G show that uhe
results presented in this section are not overly sensitive to
• nis assumption because of many counteracting and compensating
effects when 9, is varied.
Figure IX-19 shows the geometric representation in the neighborhood of
the beam ducts in the reference design. An orthogonal coordinate system
(x, y, z) is shown also in the figure. The z axis is taken along the
toroidal magnetic axis, x is the minor parameter in the midplane, and y
represents the elevation from the midplane. The bulk shield is essentially
the same as that of the outer blanket/shield system described in Table IX-3.
The beam duct is represented as a cylindrical void region with 85 cm diameter.
The parameter z shown in the figure is 45 cm and represents a half-width
of a TF magnet. (A cross-section of a TF magnet in the x-y plane has a
D-shape.)
Table IX-7 shows the neutron fluxes normalized to a neutron wall loading
of 1 MW/m2 at several key locations for three cases. Case 1 represents
a design similar to that in Figure IX-19 but in the complete absence
of beam ducts, i.e. the bulk shield is solid and continuous everywhere.
Case 2 is for the design in the presence of the beam ducts but without any
provision for penetration shielding. Case 3 is to be described shortly.
The neutron fluxes, <j)'s, given in Table IX-7 represent averages over geometric
IX -hi
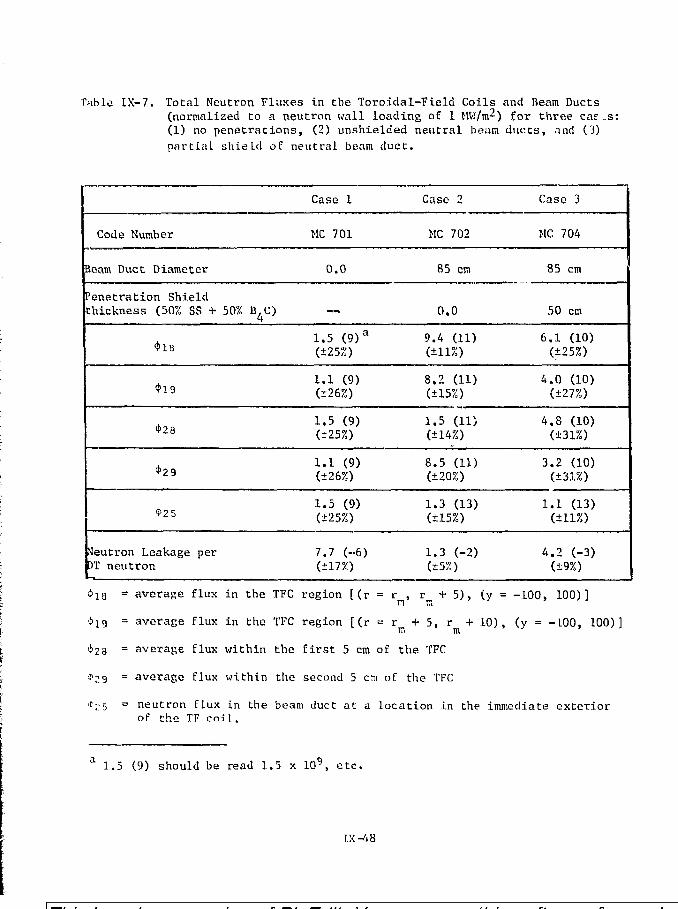
Table IX-7. Total Neutron Fluxes in the Toroidal^Field Coils and Beam Ducts(normalised to a neutron wall loading of 1 KW/m^) for three caf .s:(1) no penetrations, (2) unshielded neutral beam ducts, and (3)partial shield of neutral beam duct.
Code Number
Beam Duct Diameter
Penetration Shieldthickness (50% S3 + 50% B^C)
<t>18
4>28
*29
• 25
Neutron Leakage per3T neutron
Case 1
MC 701
0.0
--,
1.5 ( 9 ) a
(±25%)
1.1 (9)(±26%)
1.5 (9)(±25%)
1.1 (9)(±26%)
1.5 (9)(±25%)
7.7 (-6)(±17%)
Case 2
MC 702
85 cm
0.0
9.4 (11)(±11%)
8.2 (11)(±15%)
1.5 (11)(±14%)
8.5 (11)(±20%)
1.3 (13)(±15%)
1.3 (-2)(±5%)
Case 3
MC 704
85 cm
50 cm
6.1 (10)(±25%)
4.0 (10)(±27%)
4.8 (10)(±31%)
3.2 (10)(±31%)
1.1 (13)(±11%)
4.2 (-3)(±9%)
4>is = average flux in the TFC region [(r = r , r + 5), (y = -100, 100)]
'*»!9 = average flux in the TFC region [(r = r + 5, r + 10), (y = -100, 100)fit m
<i>2 8 = average flux within the f i r s t 5 cm of the TFC
?29 = average flux within the second 5 cm of the TFC
*25 = neutron flux in the beam duct at a locat ion in the immediate ex ter iorof the TF c o i l .
a 1.5 (9) should be read 1.5 x 10⁹ , e t c .
IX-48

regions whose numbers are used as subscripts for the <t>'s. Regions 18, 19,
28 and 29 are inside the IT coils. Regions 18 and 28 constitute the first
5-cm thick zone in the TF coils with region 18 extending from y = -100 to
+100 cm and region 28 spanning the rest of the y values. Thus, region 18
is closer to the beam duct and is more affected by radiation streaming
tnan region 28. Kegions 19 and 29 correspond, respectively, to regions 18
and 28 except that they represent the second 5-cm depth in the TF magnets,
i.e. r = r + 5 to r + 1 0 cm where r is the innermost radius of the magnetm m m
(r = /J:2 + y2) , The percentage value in parentheses below each flux or
leakage value in Table IX-7 is the statistical error as estimated by VIM.
Region 25 represents a disc whose radius is equal to that of the beam duct
and is 5 cm thick with the center of the disc located at the intersection
of the beam axis with the outermost toroidal surface which touches the
outer corners of the TF magnet as shown in Figure IX-19.
The values of the neutron fluxes for Case 1 represent a maximum radia-
tion level at the TF coils that meets the magnet protection criteria defined
earlier in this section. The presence of the unshielded beam duct causes the
radiation level at the TF coils to increase by a factor > 600. It should
be pointed out that this factor is a strong function of the design, as
shown for several cases in Appendix G. For example, if the graphite
and lead mortar in the bulk, shield are replaced with a much better atten-
uating composition, the radiation levels at the TF coils will drop sub-
stantially for Case 1 but only slightly in the presence of the unshield?d
void ducts. Note also that the void penetrations cause a significant frac-
tion of the high energy neutrons to reach the TF coils and the exterior
regions. In any event an efficient shielding scheme is always required
to protect against radiation streaming from void penetrations.
There are several shielding schemes to protect reactor components
external to the bulk shield from enhanced radiation streaming caused by
large-size penetrations. These are:
(1) Movable Shield Plug: If the functional requirements of a pene-
tration permit that the penetration be clcsed during the plasma
burn, then a shield plug can be moved (mechanically) at the be-
ginning of each pulse to close completely the penetration region
embedded in the bulk shield.
IX -49

(2) Local Component Shield; Reactor components affected by radiation
streaming can be surrounded by a shield capable oE reducing the
radiation level in the component to a tolerable level.
(3) Bulk Shield Extension: The bulk shield can be extended into and
in between the TF coils, and on to the outside as necessary.
(4) Local Penetration Shield: Each penetration is surrounded as
it emerges from the bulk shield by an appropriate shield
sufficient to reduce the radiation level at the TF coils and
all other equipment located in the rt-actor building to a per-
missible level.
The shield plug is the easiest to define in terms of nuclear require-
ments, since it needs to have the same dimensions as the penetration itself
and it can be of a composition similar to that of the bulk shield. The roist
important advantage of the movable shield plug in contrast to all other
approaches is that it completely eliminates the penetration effects and
restores the effectiveness of the bulk shield. It altso requires the
smallest inventory of shielding materials of the four options. The
movable shield plug approach is not practical, however, for the neutral
beam ducts for several reasons.
(1) The tokarcak EPR may have to be operated in a beam-driven mode,
either to offset subignition confinement or to prolong burn
pulses. In this case, the beam duct cannot be closed at the
time of plasma burn.
(2) During the plasma heating phase, the ;;eutra] beam is injected
for a finite period of time (r^ 5 sec in the reference design) and
the fusion power increases steadily. The total energy of the
neutrons omitted during the beam injection phase depends on the
characteristics of the design but it is generally significant
and represents ^ 5% of the total fusion energy during the burn
phase in the EPR reference design. Thus radiation streaming
during the plasma heating phase when the shield plug cannot be
used is high and cannot be tolerated. The same problem arises
when the beam is used to extend the burn pulse.
IX-50
(3) The neutral beam ducts have to provide a straight-through path
from the neutralizer to the plasma chamber. Thus, the mechanical
movements oE the shield plug to close the neutral beam duct will
involve rotational as well as displacement movements. This will
involve time delay in closing the beam duct with the plasma al-
ready in the ignition phase. Moreover, complicated patterns of
movements for placing the shield plug inside the beam duct will
magnify the risk of failure that will always be associated with
mechanical movements of massive weights on a short time scale.
The local component shield approach can be rejected as the primary
approach on the grounds of the large volumes of reactor components that
have to be shielded. This approach, however, is a useful supplement for
some small-size equipment that are overly sensitive to nuclear radiation.
The simple extension of the bulk shield is not efficient, as demon-
strated in Appendix G. It requires much larger inventory of materials than
that needed for the local penetration shield for the same efficiency of
radiation attenuation.
The local penetration shield is adopted as the principal approach for
shielding against the radiation streaming effects of the neutral beam
ducts in the reference design. As shown in Figure IX-19, each neucral
beam duct is completely surrounded as it emerges from the bulk shield by
an effective combination of shielding materials. The dimensions and material
composition for this local penetration shield are examined next.
Case 3 in Table IX-7 is the same as Case 2 discussed previously, but a
partial penetration shield is provided. This; penetration shield consists of
! 50% SS + 50% B^C. It is a cylindrical region that completely surrounds the
cylindrical beam duct and excludes the bulk shield and the TF coils wherever
| an interface occurs. The outer diameter of the penetration shield in Case 3
is 187 cm., providing a net shield thickness of 50 cm. in Case 3 particles
. crossing the outer toroidal surface touching the outermost corners of the
' TF coils were counted in the leakage term shown in Table IX-7. Comparing
cases 3 and 1 in Table IX-7 shows that the 50-cm thick penetration shield
I is not sufficient, but it brings the maximum neutron fluxes in the TF coils
IX-51

down to within a factor of 40 from the maximum permissible flux at the TF
coils, in addition to reducing the average energy of Che neutrons, A
characteristic of the Monte Carlo method is that as the shield thickness
irf increased, i.e. the shield attenuation is Improved, the cost of deter-
mining the radiation level external to the shield increases dramatically if
the same statistical accuracy is to be maintained. As shown in Appendix <J,
reasonable results can be obtained if the radiation field at the outer
surface of the partial penetration shield is used as input to deturministic
S calculations to define the additional shielding requiremenLs. This
approach shows that the penetration shield thickness has to be increased
to '- 75 cm in order to reduce the maximum neutron flux in the TF coils to
the tolerable level.
Thus, the penetration shield for the neutral beam duct is specified as
75 cm~thick, the first 65 en is a 502 SS + 50"' Bi,C composition, followed
by 5 cm lead and an additional 5 cm aluminum alloy. This shield surrounds
the beam duct and extends from the outer surface of the bulk shield to the
outer surface that touches the outermost corners of the TF coils. This
shield is sufficient to protect the TF coils but not the reactor components
and auxiliary systems located in the reactor building external to the TF coils,
as will be discussed shortly. The SS-B1.C mixture is relatively expensive
and has the disadvantage of strong neutron-induced activation in the stain-
less steel. This composition is used here, however, because of its high
attenuation efficiency in order to conserve space and keep the necessary
extension of the U-shaped TF coils to a moderate level. The outer regions
of lead and aluminum are used tn keep the biological dose in the reactor
building afl-?r shutdown to a specified level, as discussed in Chapter XIV.
Future work on these penetration problems should invlve, among other things,
an -additional effort to optimize the geometric shape of the penetration
shield.
Two important parameters in Table tX-7 are the neutron flux in region
25, t'25, and the neutron leakage per D-T neutron, L , for the three caseso
described e a r l i e r (see a l so Figure LX-19). The presence of the neutral
beam duct causes the neutron flux i t the beam axis as i t leaves the outer-
most surface enclosing the TF magnets to incit--..;:1 from 1.5 x io" to
1.3 x 10 1 3 n/cm' sec for a neutron wall loading of 1 MW/nr . The presence
LX-52

of the beam duct shield dues not significantly reduce the magnitude of the
neutron flux along the beam duct, although the average neutron energy is
somewhat reduced. It should be noted that although neutrons traveling
in the beam duct can strike the shield on the sides of the duct, many
neutrons also scatter into the duct where they can travel for a long
path before they rcake another collision on the side shield further down the
duct. Thus, the population of the neutrons in the duet remains significantly
high, which implies the following: (I) The penetration shield has to be
extended for long distances to protect components and equipment located
on the sides of the beam duct. The thickness can be reduced, however, as
one moves radially out parallel to the axis of the beam duct because of the
geometric attenuation and the softening of the neutron spectrum; (2) A signifi-
cant fraction of the neutrons will travel down the beam duct and strike
the objects at the outer end of this duct. In this case, the objects
are the components located inside the chamber of the beam injector. The
chamber of a beam injector (see Figure V-20) is large in size and is typically
1000 m3 in volume and 600 m2 in surface area, f1 sides possible initiation of
hot spots ui\ the structural walls of this chamber, the components located
inside the chamber can be affected by nuclear radiation, e.g. the crysorpti>n
panels and the bending magnets. The analyses of neutrons and photons inside
the large-size neutral injector chamber were not carried out in detail because
of the high computational cost involved. However, it is believed that the
potential problems involved here must bs investigated. Approximate
calculations based on the total neutron leakage to the neutral injector
chambers show that the nuclear heating at the crvosorption panel can possibly
exceed 0.01 W/cm3 and that the absorbed dose in the epoxy inpul(tor located
in the bending magnet may be > 10*1 rad/(MW-yr/m2) unless additional pre-
cautions are taken.
The neutronics effects in the beam duct wall and in the blanket and
shield regions adjacent to the beam ducts have also been considered. Figure
1X-20 shows the total neutron flux as a function of depth within the blanket
and bulk shield for two cases. The first case is in the absence of penetration
effects, i.e. iri regions far away from the penetration near the lower boundary
of Figure IX-19. The second case is for the flux at a surface surrounding
the beam duct and is located 5 cm away. In this later case, the horizontal
IX-5 3

1015 =
108
20 40 60 80
Distance From First Wall, cmTOO 120
FLgure IX-20. Total Neutron Flux (normalized to a neutron wall" loading of1 MW/m2) as n Function of Depth within the Blanket and BulkShield at Two Locations; a-a radial line far removed from pene-tration effects, and b-a surface" parallel to the walls of the"neutral beam duct and 5 cm away.
IX-54

axis represents the distance x-xw in Figure IX-19 with xw = 240 cm. From
this figure it can be seen that the beam duct serves the role of a secondary
neutron source which redistributes the neutrons and increases their population
significantly in the deeper regions of the blanket and bulk shield. At an
Sff:ea iepth into the blanket/shield the total neutron flux in Che vicinity
of the peaefcraeians is about three orders of magnitude higher than at points
oxt Cite same toroidal surface but **• 100 cm away from the beam walls.
Thus* even lot an axisyimnetric blanket/shield the presence of pene-
trations causes spatial variations in the toroidal direction that are
stronger near the penetrations and which inerease radially outward. These
effects muse be accounted for in the thermal-hydraulic, stress, and
radiation damaga analyses. Figure 1X-21 shows the neutron heating in the
water coolant as a function of distance from the first wall at throe
concentric cylindrical surfaces. The first surface, a, is the wall of
the beam duct; the second surface, b, is located 10 cm outward from the
beam duct wall} and the third surface, c, is 30 cm away front the beam
wall. The neutron heating In the water coolant at the inner edge (at
.ihe' iflrSitwWali).' of the beam duct wall ± 5 ^ 5 W/cm3 for a neutron
wall loading: of 0.5 MM/m2. This value drops by less than a factor of
10along the entire length of the beam wall inside the blanket-bulk
shield. For comparison, the neutron heating in the water coolant in
regions far removed from the beam ducts varies from 5 W/enr at the
.' st wall to 0.4 W/cm3 at the outer perimeter of the blanket to lO"1*
W/cm3 near the outer surface of the bulk shield. Figure IX-21 shows that
the heating rates in regions surrounding the penetration are significantly
increased by penetration-assisted streaming of nuclear radiation. Thus, the
•v 20 eta thiek region in the bulk shielding surrounding the beam duct will
rSIfuIte:"anreffiMe the blanket. r
Furthermore^ the material composition of this region caimot be a low-tempera-
ture material such as lead mortar and has to be constructed of m?terials that
can withstand high heating conditions surh as those employed in the
blanket. It should be noted that the neutron population is increased
near the outer region of the bulk shield (in the absence of the penetration
shield) by those neutrons streaming out of the beam duct and backscattered
into the bulk shield by external components. This effect is also shown
IX-55

with penetration shield
enc
310 with penetration shield-^*
without penetrationshield--*y"
1Q"
with penetration shield
20 40 60 80 100
Distance From First Wall, cm
120 130
Figure IX- n Neutron Heating in the Water Coolant as a Function ofDepth in the Blanket/Shield for Three Locations withRespect to the Neutral Beam Duct: a) at the wall ofthe beam duct, b) at 10 cm from the wall of the beamduct, and c) at 30 cm from the wall of the beam duct.(Results normalized to 0.5 MW/m2 neutron wall loading.)
IX-56

in Figure IX-21. We should note here that results in Figure IX-22, as well
as those in Figure IX-22 were derived from a combination of 3-D Monte
Carlo and 2-D S calculations in order to obtain detailed spatialn
distributions.
Figure IX-22 is similar to Figure IX-21 except that the atomic displace-
ments, dpa, in stainless steel is the response rate of interest here. The
spatial variation of the dpa exhibits essentially the same general behavior
discussed above for the water heating. Of particular concern here, how-
ever, is the radiation damage to the walls of the neutral beam duct as
well as the walls of any vacuum duct that cannot be completely closed
during the plasma burn. These walls must satisfy the same requirements
as those on the first wall, i.e. they must guarantee structural integrity
and maintain the vacuum integrity of f^i plasma chamber. The radiation
damage indicators, dpa and gas production rates, near the inner end of
the duct walls are essentially the same as in the first wall. Moreover,
they drop along the duct wall by ^ 1% per centimeter. In addition to
the considerable radiation damage at the inner part of the duct walls,
the variations in the dpa and gas production rate, as well as the fluc-
tuations in the temperature along the wall, will aggravate the radiation
damage and can create relatively large stresses in this structural mem-
ber. The inner surfaces of these walls may also have to be coated with a
low-Z material to minimize plasma contamination, as described in the
previous chapter.
b. Shielding of the Evacuation Ducts
In the reference EPR design, there are 32 evacuation (vacuum pumping)
ducts that are approximately cylindrical, each with an aperture at the first
wall 95 cm in diameter. They are located at the top and bottom of the torus,
each is equally spaced between a pair of TF coils.
These evacuation ducts are larger in size and number than the neutral
beam ducts. Radiation streaming through these evacuation ducts was studied
and, as shown in Appendix G, it is similar in many respects to the case of the
neutral beams, except for some differences due to size and orientation of
the ducts. Although the spacing between the TF coils at the top and
bottom of the torus is tight, the functional requirements of the evacuation
IX-5 7

101
10°
aa.
TO" 2
with" penetration shield
with penetration shield""^
without penetration shield*/
with penetration shield
20 40 60 80 100
Distance From First Wall, cm
120 130
Figure IX-22. Atomic Dispiacoment in Stainless Steel as a Function ofDepth in the Blanket/Shield for Three Locations withRespect to the Neutral Beam Duct: a-at the wall of thebeam duct, b-at 10 cm from the wall of the beam duct,and c-at 30 cm from the wall of the beam duct.
TX-58

ducts permit moderate bends in the duct, which would -ake the design of an
n'lonuate exterior penetration shield feasible. This shield, however, would
cost ^ 10 million dollars for the reference design and would occupy most of
the space on the top and bottom of the torus as well as the space in between
the TF coils. The exterior duct shield would introduce many other dis-
advantages similar to those discussed for the neutral beam penetration
shield.
Since the evacuation ducts can be completely closed during the plasma
burn, the concept of a movable shield plug was adopted as the principal
design option. The movable shield plug can, in principle, be constructed
with materials and with dimensions such that when it is moved to close an
evacuation duct the blanket and bulk shield become continuous. However,
there must be a finite clearance between the shield plug and the evacuation
duct which can provide possible streaming paths for radiations. Therefore,
the shielding plug cross section should be varied in steps with corresponding
change in the evacuation duct as shown in Figure IX-23. The engineering
aspects of this shield plug are discussed later in Section D of this chapter.
B. Blanket and Shield Materials
The 28 cm blanket region receives most of the remaining neutron and
gamma energy not absorbed by the first wall. For the most part, the
properties and requirements of the blanket material are the same as those
of the first wall discussed in Chapter VIII. Therefore, the same material,
annealed 316 stainless steel, was chosen for the blanket. The radiation
damage level in the blanket adjacent to the first wall is ^ 1.7 dpa/year
(at a 0.5 MW/m2 wall loading and a 50% duty factor) and drops by a factor
of two every ^ 7 cm going through the blanket. Operating temperatures in
the load bearing portions of the blanket are, like the first wall tempera-
tures, restricted to <_ 500°C, but may be allowed to rise above this level
in non-structural components. In general, the less severe radiation environ-
ment of the blanket will mean that property changes will be less than in
the first wall. After 10 years at a wall loading of 0.5 MW/m2 and a 50%
capacity factor, the swelling in the blanket adjacent to the first wall is
expected to remain below 2% (see Figure E-9, Appendix E) , the uniform
elongation will drop to ^ 3% (see Figure E-l, Appendix E), and the yield
IX-59

I .1
D
- f*it"MA, • ** . 'k
t.\ AN-M ' -.Mij . .L W l ANTl ' ( ^ TUITION !
&i APsirtt T-'SMtti P f -
. 'NL* H 1
ft Ah*\t T 'VdE"i J:OOl.AST^ h t T H A T O N S 1 ^ i
:on n.. I \ -v
V-V i » W \> .\L! £PH Vf,HTICAL
.1 i V\ I
HEMWHAIiON
''I
//
• ;UTFHc.MtF i D
iHiTFHHI arg^F'
>w • ^ i . \
• 1'iNVJl.lN»11 nvts
£_ZPnir
' . 1 i i
n
1 iL] i-;rn;;ii!'- ji_J TAlfil ( ' , . ' , ' • • .r i LOW1N f .M/Hif* >KC--J , \ >\ • \ * i t . ' . \U• H ' . ' - \ i rn r ' : '<t M '
Figure IX-23. A Vertical Cross Section for the Blanket/Shield Showing Sche-matically the Movable Shield Plug for the Evacuation Ducts
IX-60

strength will increase to ^ 75 ksi (see Figure E-3, Appendix E). As the
neutron radiation is attenuated through the blanket, the swelling will be
reduced to zero after a few era, and the tensile properties will approach
those of unlrradiated material ( 25% uniform elongation and ^ 17 ksi yield
strength at 500°C). The effect of creep and fatigue will be less than that
in the first wail since the blanket is not exposed to the surface radiation
from the plasma and will not undergo the large thermal cycling of the first
wall. Although helium production rates will still be high in the first few
centimeters, helium etnbrittlenient should not be excessive ac temperatures be-
low 500°C. There may be problems associated with coolant corrosion, ferrite
formation and weld integrity as discussed in Section VIII-B, and Appendix E,
but further analysis will be required before the severity of these problems
can be determined.
The materials to be used in the EFR shield are shown in Tables IX-2
and IX-3. The shield will receive ^ TL of the total fusion energy pro-
duced in EPR. The inner shield is composed of alternating layers of stain-
less steel and boron carbide as shown in Tablt I*-2. and the outer shield
is composed of layers of steel, graphite, lead ir.ortar and aluminum as
shown in Table IX-3. In these two regions, no degradation of the bulk
properties of stainless steel is expected. Type 30A stainless steel was
chosen for use in the inner and outer shield based on economic considerations.
The boron carbide located in the inner shield is a brittle material with
moderate tensile strength and high compressive strength (see Appendix E).
The major effect of radiation on boron carbide is the buildup of helium
frnm (n,a) reactions, which can induce swelling and cracking if
present in high concentrations. Neutron irradiation can also sub-
stantially reduce the thermal and electrical conductivity. The degree
to which radiation affects the bulk properties depends ro a large extent
on the amount of porosity present in the unirradiated material. The
first layer of boron carbide in the inner shield will be the most
seriously affected by the neutron irradiation. The first few cm ol
boron carbide will produce ^ 3500 appm of helium during a 10 year life-
time, but helium production will fall off rapidly past this point, as
shown in Table IX-6. This amount of helium is not expected to induce
excessive swelling or cracking if a sufficient porosity exists to
accommodate the gas. Helium escaping from the bnron carbide should be
vented to prevent buildup of gas pressure within the shield. The change
IX-61

in thermal conductivity with radiation will have to be factored into the
shield cooling design. The properties of graphite, like boron carbide,
depend Co a large extent on the porosity which exists in the material. In
general, graphite is a brittle material; but, depending on the manufacturing
processt its mechanical properties and its response to radiation can vary
over a wide range. Irradiation of graphite causes an initial densification
followed by a turnaround and rapid expansion. For the conditions expected
in EPRt the graphite will density rather than swell. It is ejected that
the volume change of graphite due to irradiation can be minimized by a
suitable choice of macerial and should not present a problem. Helium
production in the first few cm of the graphite-1% B will reach ' 770 appm
after a 10 year lifetime. As with boron carbide, porosity and venting con-
siderations should be factored into the shield design to accommodate the
helium. The ' -.terials lying past the first layer o£ boron carbide in
the inner shield and graphite in the outer shield will receive a relatively
small neutron fluence, and the bulk properties should not be adversely affected.
The lead mortar and aluminum in the outer shield must be operated
at temperatures below 100°C, since the lead mortar will begin to break
down at tempei cures above 150°C.
An insulating material is required tt, prevent electrical conduction
between the blocks that make up the blanket and shield (see Section C of
this chapter). Ceramic insulation in the form of a thin coating appears
to be a suirable choice to meet the high temperature and radiation require-
ments. These requirements are similar to those of the first wall current
breakers discussed in Chapter VIII. The material should have adequate elec-
trical insulating properties and must adher to the stainless steel
substrate under all operating conditions. Many materials can meet the
electrical requirements since only low voltage insulation is required.
However, the candidate material should ideally match the thermophysical
and radiation swelling properties of the stainless steel in order to
minimize stresses at the coated interfaces. High stresses could lead to
cracking and spalling of the coating. The ceramic oxides such as AI2O3,
Cr2O3, Y2O3, and MgO are believed to be suitable candidate materials. Further
effort is required to determine the optimum material and coating appli-
cation process.
IX-62

C, Pulsed Magnetic Field Requirements and Torque Effects on Blanket/ShieldDesign
The time varying magnetic fields from the equilibrium coils and from
tftt? plasma currents cause eddy currents in the stainless steel and other
electrically conductive materials that: make up the blanket and shield. These
eddy currents in turn produce magnetic fields which interfere with the plasma
equilibrium «nd which can interact with the toroidal field to create large
forces and torques within the blanket and shield. Results of the studies of
these eddy current effects, reported In Chapter IV and in Appendix F,
show that in the case of a continuous (unsegmented) blanket and shield
system having the materials disposition currently considered for the
ANL-EPR, the fields induced in the blanket/shield regions by the applied
equilibrium field are significant (comparable to the applied field itself).
In fact, the induced fields tend to introduce additional currents within
the blanket/shield regions which in turn produce secondary fields of
sufficient strength to cancel a substantial fraction of the applied field.
Further study (Appendix F) showed that by segmenting the blanket and shield
into blocks that were electrically insulated from one another, these eddy
current effects can be reduced to tolerable levels. The general finding of
the studies described in Appendix F was that the limiting criteria which
determine the number, size, and, shape of the segments are set by the
requirements for establishing the equilibrium field in the plasma with
acceptably small time and phase delays; i.e. the number of blanket/shield
pieces is determined from field penetration considerations, not torque effects.
In any case, it was considered important to evaluate the torque effects to
demonstrate that the restraint requirements could be met.
The torques arising from the induced fields tend to rotate each block
about the axis perpendicular to the toroidal and equilibrium field axis.
These torques exist while the equilibrium field is changing, and reverse
direction (by 180°) in going from ramp-up to ramp-down conditions. The
peak torque, N , on a block due to the interact-icm between the toroidal
field B and the eddy currents from a time-varying vertical field, B , is
shown (in Appendix F) to be
N r = 16 B Q oB a3b3c/9 (a2 + b2) , (IX-1)
IX-6 3

where a is the electrical conductivity, iQ designates the time derivative
of B , and 2a, 2b, and 2c are the dimensions of the block in the radial,
toroidal, and vertical directions, respectively. Similarly, if the field
B is in the radial direction, the torque N is given byo *•
N = 16 B JB, a3b3c/9 (a3 + b 2 ) . (IX-2)L o t
Results of the application of Eqs. IX-1 and IX-2 to some typicaJ EPR
blanket and shield blocks are given in Table IX-8. The calculations were
made by treating the block as a solid chunk of stainless sceel with a
= 0.74 x 10~D fi-m and the peak value of B Q = Bo/2 sec. The letter desig-
nations for the blocks indicate tueir position with respect to the cir-
cumference of the torus and correspond to the lettering system in Figure
IX-24.
Since most of the shield blocks are in fact composed mostly of lead
mortar and other materials less conductive than stainless steel, the actual
shield block torques would be less than those indicated in Table IX-8.
Similarly, the use of large volume fractions of ceramic or molten salt type
breeding materials in blanket tes.L modules would tend to reduce the indi-
cated blanket Mock torques as well. In any case, support against the
torques listed in Table IX-8 appears to be achievable with reasonably sized
restraining hardware.
Table IX-8. Torques on Typical Blanket and Shield Blocks
a(m)
blm)
c(m)
B (T)
B (T)oz
Nr (103N2 (103
ft lb)
ft 1b)
G
0.5
0.5
0.5
2.7
0.57
0.09
2.1
3.1
Shield Blocksa
H
0.5
0.75
1.25
8.5
0.42
0.12
253.1
176.1
N
0.5
1.0
0.5
4.1
0.28
0.49
50.1
89.1
Blanket
W
0.14
0-75
1.25
6.8
0.42
0.12
6.
40.1
Blocksa
X
1.2
1.00
0.14
5.1
0.03
0.40
14.1
125.1
Y
1,
0.
0.
3.
0.
0.
77
34
2
75
14
4
50
40
.
.1
See Figure IX-24 for location.
IX -64

L_ V
SHIELD SEGMENT ASSEMBLY
-SUPPORTSTRUCTURE
TF COILS —
Figure IX-24. EPR Blanket/Shield Arrangement Circular Option
IX-65

Since the blanket/shield region will have to be broken into modular ;i
units for assembly purposes anyway, the concept of insulated segmentation
is not incompatible with a practical assembly scenario. As a result of
these calculations, a segmented blanket/shield design vv'as developed along
the lines described in the following section.
D< Mechanical Design Besegipj:ion, of the Blanket/Shield System
The mechanical design of the blanket and shield regions of the EPR
is baaed largely on the technical cons ;raints that arise from results in the
preceding sections o£ this chapter. The selection and disposition of
materials derivas from, the nuclear performance requirements and the
materials property limitations imposed by the high radiation and elevtited
t-imperature environment. Both the blanket and the shield are divided into
several hundred modular block-like units in order to satisfy magnetic field
penetration requirements. The structural support for these block-like units
provides restraint against displacement forces associated with (1) the
weights of the blocks and (2) the torques on the blocks imposed by the tuldy
current interactions with the toroidal field .
In addition to satisfying these requirements, every effort was made
to develop design concepts that permitted (1) assembly with reasonable
tolerances, (2) a reasonable approach to handling and repair without
major reactor disassembly, (3) thermal energy removal, under conditions
adaptable to a conventional power cycle, (4) ease of modification to in-
corporate experimental test modules, and (5) economic manufacturing processes.
The selection of pressurized water as the blanket coolant afforded many
advantages not attainable with pressurized helium; namely, low void
fractions, small supply and return lines and manifolds, negligible pumping
power, and sufficient adjustability to accommodate a range of operating
conditions. Also considered in the mechanical design were the general
features of the special shielding shrouds required around the major pene-
trations to compensate for nuclear radiation streaming emanating from tha
open ducts.
Two types of blanket/shield arrangements have evolved for the EPR:
(1) a close-fitting contoured assembly as shown in Figure IX-23, and (2) a
slab-type assembly as shown in Figure IX-25. Although the contoured assembly
is taken as the reference design for the blanket and shield, both concepts
have been explored and analyze'.' in parallel.

F-L.4H '"iff ftWOi'?
Figure IX-25. EPR Alternate Slab-T'/pa Blanket/Shield Arrangement
IX-67

1. Description of the Reference Blanket D-Jsigr.
The hlankit structure for the reference I'.C n is made up of 28-cm-
thick stainless steel blocks which cover regions of the first wall periphery
ranging from 1 to 2.5 nr (see Figures IX-23 and IX-24). Each block is fabri-
cated with a~multi.pl icity "of seeps on all side races to minimise- llne-of-sipj.
radiation, streaming between blocks and to augment tho keying of ocijoinlng
. Although the thermally Induced dimensional rhangMS iu these blocks
!u\it up Ui re.ici.or operating tomperaLufLi remain to he tixa mined, i t is
d that cht- step conf igurat Lonn and shapes cm bo tailored to the.
nt! of each bluek in such a way th«iL Uu* inttTf.ii.vs botwtvn hi ticks
are tightly sealed at operating condiLions.
In a l l , 1,7 blanket Mocks circumscrlht1 the f i rs t wall in oach of tho
.16 vessel segments, giving n coc.il of 272 blanket blocks. Support of the
blanket blocks is nusdu through the; shield blocks in the louur vertical
inidplnne of the reactor and by a bolted arch suppoLL above Lho upper bian-
k-Ji; assembly as shown In Figure IX-24. Tim wulght of the blanket Is trans-
mitted through roller pads to the shield blocks to condensate for tho
differential thermal expansion anticipated during blanket heat-up to
operating temperature.
The size of the blanket blocks i s determined nainly by the require-
ments for equilibrium field penotralion and assembly maneuvering space.
The amount of subdivision needed to permit satisra> tory equilibrium field
penetration was obtained from the analyses presented in section C of this
chapter. Thereafter, a tractable (from a mechanical viewpoint) segmented
design was developed and the torques produced by the eddy currents were
evaluated for each block. The_design-was-considered to be acceptabie-vlien
no toraues exceeded 3 x 10⁵ l't. lbs . The restraint required to handle
torques of this magn; tude is provided by the stepped keyways, support
bolting, and sets of shear pins as needed. (None of the required shear
pins exceeds 15 cm in diameter.) Prior to assembly, the outer surfaces of
each blanket block are covered with a non-conductive coating to maximize the
interblock electrical resi,tancc, (This coating procedure is paramount to
the entire segmented blanket concept described herein, in that the i ield
penetration nnd torque Uniting features cannot be realized without i t . ) A
IX-68

preparat ion involving e i t h e r alumina, s i l i c o n carbide, or a r e l a t ed refractory
insu la to r w i l l be used in t h i s applicat ion, as described in Appendix E.
The blanket blocks are cooled with a pressur ized water c i r c u i t oper-
a t e - L u . m r n a ^ - - "? " j r ) l "» J ' - " ^ " P " " 1 1 ^ P l u b S U r j °E :>00°
" p s i K c J l c d l , S I f , n i i ^ i t pressur . U-2A00.p3 ig) . The «• te r i s car r ied by a
.uLu.irk or d r i l l ed . KHnneLs within each "blocks -The channels a re arranged in
"l i% u r id rowf--Pdrall«Lin? the magnetic axis as ahoun in Figure I.X-26. The
rows a r , eroupeJ in to four r ad ia l ZOOM. Channels within each zone are
d in se r ies ' to- a- common i n l e t and o u t l e t . Moving in a. d i rec t ion
oucwaetf Erom the ££*st wsU* the f i r s t and second zones a re cooled
p e f e r e y * ^ . B « * £ E h i j r d a n d f Q u i : t l t s a n e s a r e c o n n c c C e d i n s e r i e s - T h e
S within each black share common i n l e t and out le t manifolds chat are
tMtiXt i n t o the hlaek, Two lead l ines {-v 2 cm ins ide diameter) form the
supply and return ducts that eon&eet with the corresponding maniEolds on
each block. The s ize and numbc-r of char.noIn in each zone of a pa r t i cu l a r
blanket block are deturmiiwd by tin. ;h*rn\a]-hydraulic rosponse of the
block. Calculatluns for a typical blanket block are given in sec t ion
E of t h i s chapter.
Fabricat ion of the blanket blocks described in this sec t ion appears
to present no major technical problem; hywe-ver, there i s a c lea r nead to
analyze in much Rreater d e t a i l the economic factors associated with pro-
duction of several hundred such blocks. Tn simplest terms, the fabr i -
cat ion of .1 single block would involve cas t ing and shaping the a t a in l e s s
s t e e l b i l l e t ; gun boring or possibly cas t ing the cooling channels; welding
tlit interchannel connectors into p lace ; preparing the manifold connections;
-- i"nstairing""ilTs"t"ramentat.ion probes ; -bol t h o l e s , e tc . ; -and-apply ing _th«s ——
coat ings .
There are also four experimental ports, each 1.5 m in diameter, in-
cluded in the reference design. These ports are intended to accommodate
(1) essential early verifications o.C nuclear performance, (2) as yet un- -
specified blanket diagnostic probes, and (3) experimentation. They also
serve as access penetrations for remote inspection and maintenance of
the vacuum vessel, interior,- Furthermore, because of the independent nature
of the standard blanket blocks it is quite conceivable that in later
IX -6 9
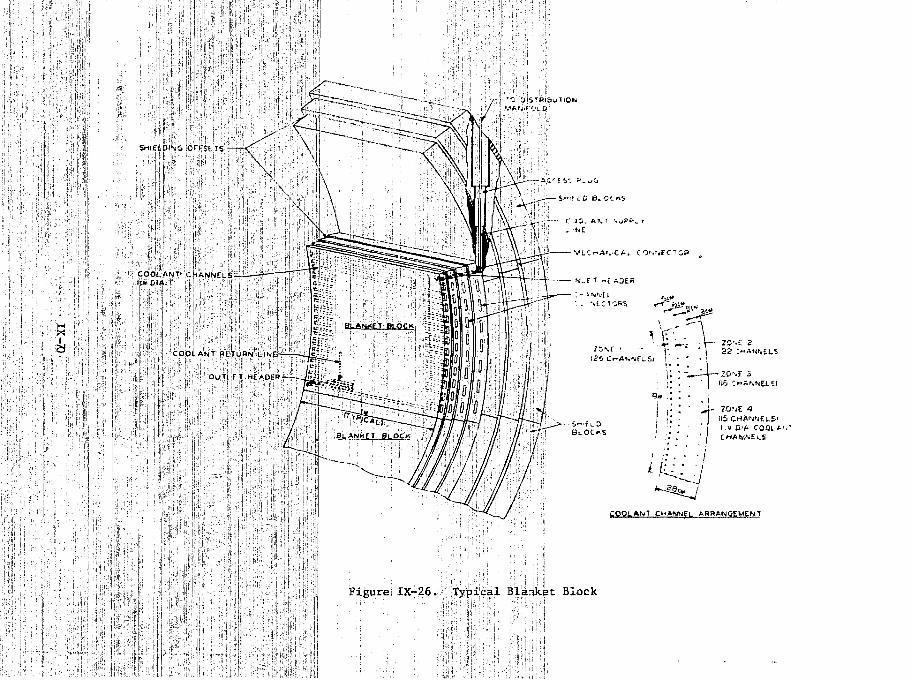
f '•
5rllELPI%e OFFSETS
COOLANT CHAMNELS
,M
,1 iFigure1 IX-26. Typical Blanket Block
COOlAhIT HETUBN LINE
OUTLET HEADER
C O O L A N T CHANNEL feHBAWOEMENT

stages of operation, one or more of these blocks could be replaced with
a variety of experimental blanket assemblies to test, for example,
tritium breeding, helium cooling, or liquid metal interfacing.
2. Description of the Slab-type Blanket Design
The alternate blanket/shield design shown In Figure IX--25 depicts a
slab-type conCiguration having 10 blanket pieces per vessel segment or
160 pteees in a l l . This concept has the advantages of less costly fabri-
cation, a simplified support structure, improved access fox coolant mani-
folding, and reduced complexity associated with assembly and replacement.
It does however make less efficient use of the space available within the
toroidal field coils and as a result requires a larger materials inventory
than the reference design. Considerations related to equilibrium field
penetrationt torque restraint, coolant system features, experimental
modules, and access have boon evaluated for the slab and are found to
be much the same as those described for the reference design,
3. _ Description of the Reference Design Shield System
The EPR magnet shield system consists of the bulk shield blocks
doicted in Figure IX-23 and the specially contoured shielding shrouds for
the penetrations. The bulk shield surrounds the blanket and consists
of two distinct regions, an inner shield and an outer shield. (The
materials compositions of the inner and outer shield regions are given
in Table 1X-2 andIX-3, respectively.) The shield region surrounding one
of the 16 vacuum vessel segments consists of a single inner shield block
and 25 outer shield blocks, assembled as shown in Figure IX-24. There
are 416 shield blocks in a l l , their degree of subdivision again being
determined by equilibrium field penetration, iissembly and torque limiting con-
siderations. Each block has i ts own independent water cooling system
with a single supply and a single discharge line. The performance fea-
tures of the shield cooling system are described in section E of this
chapter.
Each shield block is a self-contained (canned) unit. Moving in a
direction radially out.vard from the blanket, a typical outer shield block
consists of a 3 cm layer of stainless steel, a 15 cm region of graphite
containing ^ 1% boron, 5 cm of stainless steel, 60 cm of lead mortar,
and 9 cm of aluminum. Like the blanket blocks, all shield blocks are
IX-71

stepped and keyed on Che four sides that adjoin other shield blocks
to minimize radiation streaming and to augment alignment and support.
Stainless steel coolant lines are located along the surfaces of the
stainless steel layers and are interspersed wieMn the bulk of the
graphite and lead mortar slabs. Cooling requirements generally depend
on the location of a given block and are determined by considerations
of thermal expansion effects, dehydration limitations on the lead raort-ar,
and the degree of insulation required to reduce heat input Lo the mignet
cryostats. An analysis of the thermal performance of a typical shield
block is presented in section E of this chapter. With the exception of
regions in the vicinity of penetrations (like the neutral beam ducis), there
is l i t t l e incentive for trying to recover sensible heat from the shield.
The inner shield block (ofwhich there is one per reactor segment or
16 in all) covers an ace of !v 5Q° along Che inside edge of the toroidal
field coil as shown inS'tgure IX-23, This block is designed as a single
piece, a relatively permanent part of. the blanket/shield system, in order
to facil i tate assembly, coolsnt manifolding; in a limited access region,
and subsequent handling at end of l ife. I t is composed of alternating
layers of stainless steel and Bl(C as shown in Figure IX-l and Table IX-2.
These materials are enclosed in a stainless steel can with water-carrying
coolant tubes placed along the R^C/stainless steel interfaces and within
the Bt,C where needed.
Support of the shield blocks is achieved tnrough the strutted frame
shown-in -Figure -IX-24, Blocks A and B.iti" Figure-IX-24-rest-on the base
of the support frame and ..e fastened together with blocks C, E, and F to
form a structural arch which in turn provides the major support foundation
for the blanket blocks and the first wall assembly. Blocks C and F have
five additional column supports to the base of the frame whLch carry most
of the weight of the upper shield blocks. The entire shield block system
isjoined and keyed together to form arrigid doad bearing and torque re-
straining structure. As in the; case of the blanket blocks, the shield blocks
are electrically insulated from brie another by usi ••P thin, nonconductivf;
interface coatings, in order to limit impedances b quilibrium field pene-
tration and to eddy current torquas.
IX-72

All outer shield blocks are outfitted with access ports which accommodate
coolant and instrumentation lead lines to the blanket blocks and first wall
asseisbly. • ' • ' •• - • : - =• -••• , . . • . . . - : • • - •
A. Penetration Shield System
In addition to the bulk shield blocks described above, several ;>ecial
radiation shielding geometrical arrangements for the major penetrations
have been analyzed. These major penetrations include the ducts for
vacuum pun.ping, neutral beam Injection, and radio frequency heating.
A movable jhield plug is used fo- each vacuum port as shown in Figure
LX-23. The entire plug is pneumatically operated, opening durirtg the pump
down phase, and closing during the piasma burn cycle. The shield plug has
a diameter at the first wall of 95 cm and is keyed sidewards in steps with
a diaraeter at the uui.ee periphery * the shield of 110 cm. The shield plug
Is constructed from two blocks. The lower block is 32 cm high and Is made
of stainless steel. This block is fabricated and cooled in much the same
way as a blanket block. I'he second outer portion of the shield serves
Che same function as a regular buH-.-shield block. This block can be con-
structed of graphite and lead mortar to be 97 cm high with the same material
arrangement as the outer shield. However, because the shield plug has to
be moved completely out of the vacuum duct during the pump down phase i t
is important to reduce the total height of the shield plug. Therefore, the
outer shield block in the shield plug is 58-cm high with a material con-
figuration similar to that of the inner shield.(SS/B^C).
For eacfPof^the neuErait beam ducts surrounds the-
duct as it emerges from Li. ' bulk shield and extends to the beam injector
chamber. This shield is also divided inCo blocks (four along the circum-
ference and three in the direction of the beam axis). Cooling (pressurized
water) is provided for each block as required.
5. Maintenance and Rep.nr nario
Most maintenance operations involving inspection ot repair of the shield
systems will require removal of one or more shield blocks and/or special
shielding assemblies. In most cases faulty blocks will be replaced with
a stand-by unit and either repaired in the shielded hot cell facilities or
partially decontaminated and interned for disposal. Removal and replace-
ment of blanket blocks will also require the removal of several shield
IX -73

blocks and perhaps one or in some cases several adjacent blanket blocks.
It is estimated thatthe replacement of a relatively accessible blanket
block (L, M. N, K-, or J in Figure IX-24} might be accomplished in 2 days,
whereas replacement of the less accessible lower blanket blocks (A, Ii,
C, or D in Figure IX-24) could take as long as 11 days. A replacement
plan and schedule is given in Section C-3 of Chapter XII.
E. Thermal Analyses
1. Blanket,
As described in section D of this chapter, the bl ,<et configuration
for the EPR consists of an interlocking array of modules that form a
28-cm-thick shell iimiediately surrounding the first wall assembly.
For the purposes of Che EPR thermal analysis studies, ;-i modular unit
1 m x 1 m x 28 cm was taken as being representative of the nominal, blan-
ket building block. This unit consists of a monolithic piece of stainless
steel into which cooling channels have been drilled (see Figure IX-26).
Because each unit is cooled independently (all units in parallel), analysis
of the thermal performance of a single unit is assumed to provide a
reasonable approximation to the overall thermal performance of the entire
blanket.
The present design is based on the use of pressurized water reactor
technology for the primary: (blanket) coolant circuit and the steam con-
version system. The blanket is divided into four radial zones of inter-
radial zones are cooled independently while the third and fourth are
connected in series. The"cdalant "eSitlng" the first, secondV and fourth
zones is directed sequentially to the secondary heat exchanger (steam
generator), to a dump heat exchanger, and then back to the entrance mani-
folds for the first, second, and third radial zones. Rather than varying
flow rates to match prescribed outputs from each of the independent modular
blanket units, the flow rates are held constant with tejassjpiptipn that- ~
mixing in the exit headers would result in the nominal/conditions of :
309° C and 2000 psi for the pressurized-water entering the steam generator.
The cooling concept described above and diagrammed in Figure IX-26W d s a n a l y z e d w i t h a o n e dimensional heat transfer code using the energy
deposition parameters given in Figure IX-10. The flow rate in each radial
::.-.". :7:n...;:l. . :. : :•:!__ ix-74

zone or series of zones was adjusted to conform to an inlet temperature of
40 °C and an exit temperature of 309°C. Values for the coolant channel
dimensions and the thermal fluid parameters determined in the calculations
are listed in Table IX-9, with the zones number radially outward from the
first-wall. The nominal conditions presented in Table IX-9 are repre-
sentative of a unit that is intermediate in performance between an inner
Viankot module and an outer blanket module, the inner modules requiring
slightly more cooling and the outer modules requiring slightly less cooling.
Local hot spots near penetrations have not been treated explicitly in the
analysis.
Table IX-9, Thermal Fluid Analysis'for a Fressurizied Water CooledEPR Blanket Module'"1
Zone
Zone Thickness, cm
Average Heating Rate, W/cm
Water Inlet Temperature, °C
Water Outlet Temperature, °C
Coolant Channel Diameter, cm
._ Coolant, Velocity,•..tn/_seu
Coolant Inlet Pressure, atm
Coolant Pressure Drop, atm
Number of Coolant Chanels
Total Length, cm
Flow Rate, gm/aec
Coolant volume, %
1
5
2.93
40
309
1
2.4
136
1
26
2600
162
' - - . - • ' " & } • ' •-'• •-" :::
'"•
2
6
1.48
''0
309
1
. 1.4
'36
0.62
22
2200
101
•_. ::2,7,::.-:-; ;
3
8
0.79
40
198
1
1.7
136
0.74
1600
120......::. ...1.5;,, V V
4
9
0,47
198
309
1
1.7
136
0.72
,.:„.,. . 15
1500
120
Maximum Blanket T jmp^ature D 500?C
Section Dimension = 1 m x 1 m x 28
Mean Wall Loading = 0 . 5 MW/m2
TX-75-
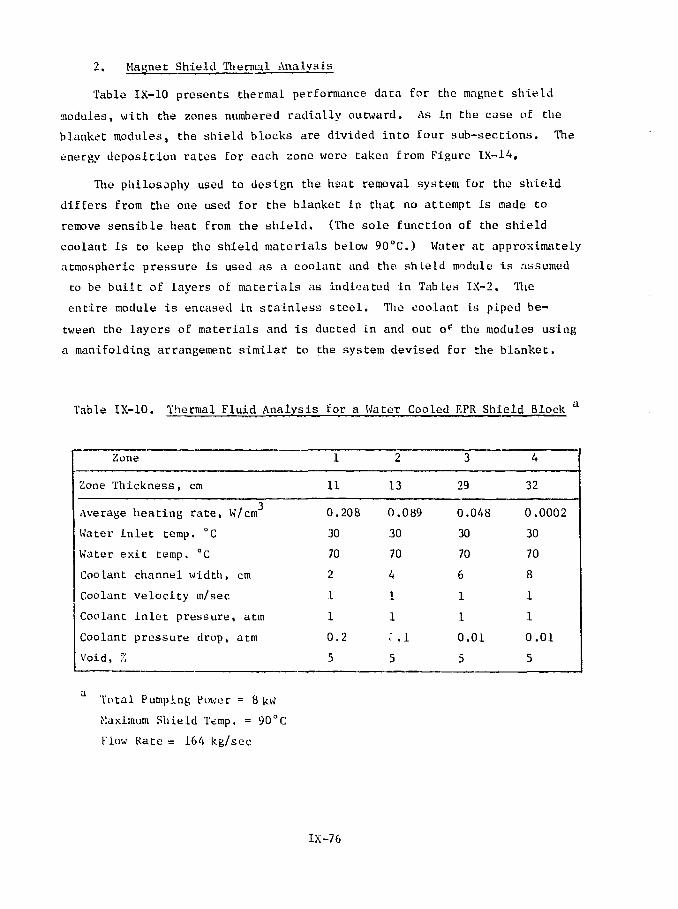
2, Magnet Shield Thermal Analysis
Table IX-10 presents thermal performance data for the magnet shield
modules, with the zones numbered radially outward. As in the case of the
blanket modules, the shield blocks are divided into four sub-sections. The
energy deposition rates for each zone were taken from Figure IX-14,
The philosophy used to design the heat removal system for the shield
differs from the one used for the blanket in that no attempt is made to
remove sensible heat from the shield. (The sole function of the shield
coolant is to keep the shield materials below 90°C.) Water at approximately
atmospheric pressure is used as a coolant and the shield module is assumed
to be built of layers of materials as indicated in Tables IX-2, The
entire module is encased in stainless steel. The coolant is piped be-
tween the layers of materials and is ducted in and out oF the modules using
a manifolding arrangement similar to the system devised for the blanket,
Table IX-10. Thermal Fluid Analysis for a Water Cooled EPR Shield Block a
Zone
Zone Thickness, cm
3Average heating rate, W/cm
Water inlet temp. °C
Water exit temp, °C
Coolant channel width, cm
Coolant velocity m/sec
Coolant inlet pressure, atm
Coolant pressure drop, atm
Void, Z
1
11
0.208
30
70
2
1
1
0.2
5
2
13
0.089
30
70
4
I
1
; . i
5
3
29
0.048
30
70
6
1
1
0.01
5
4
32
0.0002
30
70
8
1
1
0.01
5
Total Pumping Power = 8 kW
Maximum Shield Temp. = 90°C
Flow Rate = 164 kg/sec
IX -76

F. Research and Development Requirements
A substantial, properly-focused, technology-development program will
be required to support the design of a credible primary energy-conversion
system for the EPR. The Stage I EPR is based, as much as possible, on
available technology, with a minimum extrapolation of existing data
and a minimum of additional development. R & I) needs tor the Stage 1
KPR are further reduced by the omission of a tritium-breeding blanket.
However, a sizeable effort will still be required to verify critical
design decisions for the Stage I EPR. The advanced blanket concepts
to be tested in Stage II will require a substantial development program.
This effort will include development of alternate structural materials
and design concepts and will interface with the longer range blanket
and shield technology research and development program for demonstration
and commercial reactors. Descriptions of program content and direction
for the major R & D items in support of the EPR are summarized below.
A more comprehensive description of this program plan, with man-power18
and cost estimates included, has recently been published.
1. Neutronics
Concentrated efforts are required in three principal areas: (1)
basic nuclear data, (2) methods and code development, and (3) integral
experiments. A comprehensive nuclear data base for materials applicable
to the construction of an EPR should be established through measurements
and evaluations. This nuclear data base should Include the data parameters
necessary for calculation of nuclear heating, gas production, atomic dis-
placements, tritium breeding, neutron and gamma-ray transmission proba-
bilities, and induced-activation. The methodology' and computational tools
needed to perform accurate aeutronic/photonic analyses should be de-
veloped. Multidimensional neutron and photon transport prediction capa-
bilities should be upgraded to treat deep radiation penetration problems
Ln realistic EPR engineer ing configurations having irregular toroidal
i geometries and large access openings. Other capabilities for calculating
nusleotiic response functions (e.g. for nuclear heating and induced acti-
,. vation) must be extended and improved. The nuclear data and computational
•: methods used in the EPR design should be supported and verified in bench-
mark and mockup integral experiments.
IX-77

2. Coolant Technology
Pressurized water (primary option) appears to be a suitable primary
coolant for Stage I operation of an KPR, while liquid lithium and pressur-
ized helium are prime candidates for the Stage II modular inserts. Important
early needs include development of computational methods and experimental
assemblies to quantify the thermal-Fluid behavior of each coolant (e.g.
heat transfer coefficients, effective thermal conductivities). OE special
importance to Stage II operation is experimental confirmation that circu-
lating liquid lithium in tokamak-type magnetic field configurations will
not compromise either plasma stability (by perturbing the magnetic tield)
or the coolant performance of the lithium. It will be es.-ential to es-
tablish an understanding of the interactions between each candidate coolant
and likely containment materials. Included in tne compatibility program
are (1) effects due to impurities, temperature gradients, thermal and
mechanical stresses, short-cycle fatigue phenomena, and magnetic fields;
(2) development of the reciuired itnouritv monir.orins? and rpmohR-spiisinE
techniques and instrumentation, and (3) establishment of an extensive
physical-, chemical-, and mechanical-property data base. Ultimately the
coolant technology program will require a number of major facilities to
investigate promising coolant geometries, test coolant compatibility in
realistic environments, support the development of key components, and
verify overall coolant-system performance.
3. Mechanics
Unique fabrication and remote maintenance procedures are very likely
to be essential ro.the sustained operation of EPR. A program is needed
to develop and test methodology for remote assembly and disassembly of
the PECS and other major reactor-support systems (e.g. vacuum pumps,
neutral beams). The impact of fabrication and maintenance requirements
on the reactor and overall plant designs should be established at the
earliest possible time to permit reliable design descriptions for all
major components. Computational methods (including code development)
and other categories of engineering support (e.g. mechanical-property
testing, major system layout, component assembly) should be constantly
upgraded to guarantee a firm technology base in advance of the final
IX-78

stages of che EP.R design. In particular, the response of Eirst wall
ami blanket materials to the stress, strain, and fatigue phenomena that
result from the nature of the EPR burn cycle must be evaluated
both computationally and experimentally. The analytical formalisms for
modeling thermal, mechanical, and kinematic behavior in toroidal geometry
must be developed and tested.
4. Shield Technology
Aspects of the shield design (other than its radiation-attenuation
properties) chat relate to thermal energy removal, performance monitoring,
assembly, processing, coupling wirh penetrations, etc. must come under
study. Verification of shield design methods for the very complicated
geometry of the EPR will require n series of carefully conceived radiation
shielding experiments. Methods of interfacing the shield with the blanket
must be developed and tested.
5. Electromagnetics
Detailed analyses and supporting test programs must be initiated to
fully evaluate the electromechanical interactions of the pulsed and steady
state magnetic fields with the blanket an-1 shield blocks. Blanket/shield
design solutions that (1) permit pulsed field penetration, (2) minimize
eddy current perturbations on plasma equilibrium, and (3) lead to
tolerable mechanical and thermal reactions on materials within the
blanket/shield region must be sought. This work will involve (among
other things) materials-selection optimization, electromagnetic decoupling
technology, insulator development, and simulation tests on a scale of
sufficient size to permit verification of blanket/shield compatibility
with confinement systems.
1. W. M. Stacey, Jr., et al., "Tokamak Experimental Power Reactor Studies,"ANL/CTR-75-2 (June 1975).
2. Mohamed A. Abdou, "Nuclear Design of the Blanket/Shield System for aTokamak Experimental Power Reactor," Nualeal' Tecihnology, 29, 7-36(April 1976), ""
3. W. Engle, Jr., "A Users Manual for ANISN," K-1693, Oak Ridge GaseousDiffusion Plant (1967).
4. W. A. Rhoad-;s and F. R. Mynatt, "The DOT III Two Dimensional DiscreteOrdinates Transport Code," ORNL-TM-4280 (1973).
IX -7 9

5. K, Q, Lathrop and F. W. Brinkley, "TWOTRAN SPHERE: A FORTRAN ProgramCo Solve the Milltigroup Transport Equation in Two-Dimensional SphericalGeometry," Los Alamos S c i e n t i f i c Laboratory, LA-4567 (1970).
6. E, M, Gelbard an:l R, E. P r ae l , "Monte Carlo Work at Argons^ NationalLaboratory," Proceedings of the NEACRP Meeting of a Monte Carlo StudyCroupt. ANL-75-2 (1974); a l s o R. E. Prael and L. J . Milton, "A User ' sManual for the Monte Carlo Code VIM", an ANL in terna l memorandum FRA-TM-84(1976).
7. M. A. Abdou, C. W, Maynard, and R, Q. Wright, "MACK: A Computer Programto Calculate Neutron Energy Release Parameters and Multigroup NeutronReaction Cross Sections from Nuclear Data in ENDF For.no t»" UWFDM-37and ORNL-TK-3994 (1973).
S. D. Garber, C, Dunford, and S. Pear l s t e in , "Data Formats and Proceduresfor the Evaluated Nuclear Data F i l e . ENDF," Brookhaven National Laboratory,BNL-NCS-50496 (ENDF 102), a l so TID-4500 (October 1975).
9. J , Jung, "Fin i te Difference Equations for Transport Equation in ToroidalGeometry," Nital. Sat. Eng.s 6Q_, 74 (1976).
10. M, A. Abdou, "Calculat ional Methods for Nuclear Heating and Neutronlcsarti Photonics ^ s i g n for CTR Blankets and S h i e l d s , " PhD Thesis , UniversityMicrofilms I n c . , 74-8981; also issued as repor t s UWFDM-66 and VWFDM-67*Universi ty of Wisconsin, Nuclear Engineering Department (1973).
11 . D. L. Chapin and W. G. P r i c e , J r . , "A Comparison of the D-T Neutron WallLoad Dis t r ibu t ions in Several Tokamak Fusion Reactor Designs," PlasmaPhysics Laboratory, Princeton U" : -ers i ty , tIATT-1186 (December 1975).
12. M. A. Abdou and R. W. Conn, "A Comparative Study of Several Fusion ReactorBlanket Designs," Mai. Sat. Eng., 5£, 256-266 (1974).
13. M. A. Abdou and C. W. Maynard, "Neutron Source Geometry Effects an FusionReactor Blankets ," Trans. Am. Nual. Foa., L5, 34 (June 1972).
14. Neil N. Ault , Norton Company - Private communication (1975).
15. William Connelius Hall , Chemtree Corporation - pr ivate communication (1976).
16. C. A. M. van der Klein, "The Organic Insu la t ion in Tusion Reactoi: MagnetSystems,' ' Reactor Centrum Nederlar.d, RCN-240 (December 1975).
17. H. Brechna, "Effect of Nuclear Radiation on Organic Mater ia ls ; Specif ical lyMagnet Insu la t ion in Hig.h-Energy Accelera tors , " Stanford Linear AcceleratorCenter, SLAC-40 (March 1965).
18. F. Mi l l s , e t a l . , "Research and Development Required for the TokamakExperimental Power Reactor ," ANL/CTR/TM-65 (May 1976).

CHAPTER X
TRITIUM HANDLING FACILITY
A. Introduction
Chapter VII of reference 1 describes the results of initial scoping
studies of the tritium handling requirements for a tokamak Experimental
Power Reactor (EPR), Although many features of the AKt/EF'R design have
been modified during the FY-1976 conceptual design activity, the general
conclusions reached in reference 1 regarding che nature of the tritium
facility have remained ..e.ladvely unchanged* Efforts during FY-1976 have
focused on more detailed anal>cp« «F those tritium facility systems and
requirements for which ueed of a. greater understanding wat> indicated during
the FY~1975 scoping studies. Major EPR tritium facility operating parametsrs
(including tritium inventories, hurnup rates, etc.) were redetermine - ior
the FY-1976 design and are listed in Table X~l. An analysis of existing
technology relative to tritium transfer operations in the EPR gave evidence
that the required fuel circulation and control hardware (valves, pumps,
compressors, etc.) was close to state-of-the-art achievements and that only
modest development and proof testing were necessary. Aa in-depth study
of hydrogen isotope enrichment requirements for the EPR and other near
tenn fusion devices led to the development of a multi-column isotope separa-
tions and analysis code which in turn was used to evolve, analyze, and re-
fine a conceptual design for the EPR cryogenic distillation cascade. Analy-
sis of reactor hall atmospheric clean-up requirements following massive
accidental tritiu'.n releases of various magnitudes highlighted a number of
problem areas* that will require modest development beyond present state-
of-tht— art in order to limit equipment si; J4 cleanup times, and coat. The
selection of water as a coolant for the first wall, blarket, and shield raises
questions regarding (1) tritium entry and buildup in the water circuits, (2)
methods of handling the water, and (3) likelihood of large tritium releases
to the environment. Practices currently employed in handling the primary
coolant of pressurised heavy water reactors appear to be more than adequate
to meet the projected needs of an EPR.
X-l

Table X~l. Summary of TriM'tim Hand! ing F aci.1 i ry Parnmatsrs
General
Power During Burn (Mis)
Burn Cycle Duty Factor (%)
Plant Availability Factor (%)
Tritium Burnup (gm/day)
Throughput/Burnup Ratio
Tritium Delivery Rate (gin/hour)
Fuel Cycle Turnaround Time (hours)
Plant Inventory (kg)
Annual Tritium Consumption at 50%Duty Factor (kg)
Tritium Inventory Disposition
Cryosorption Pumps (gtn)
Getter Beds (gin)
Disti l lat ion Columns (gtn)
Fuel Cycle Hardware (gtn)
Storage (gm)
Anticipated Mean Inventory (gtn)
Fuel Cycle
Nature of Fuel Processing
and Recycle Systems
BTFC
8 T
200
75
67
26
50
60
4
0.6
6.4
240*
240*
10*
10*
-\-500*
600
[ Nonmeta l l i c Element
1 Debr i s Removal
< I s o t o p i c Enrichment
Fuel Storage
[ Fuel Delivery
10 T
500
64
150
1.5
16
600*
600*
25*
25*
M.300*
1500
Removal
Maximum value at any single time.aThe power during burn depends upon a number of factors involved in the
details of the burn pulse. These values are representative of the rangeof burn cycles studied.
X-2

Table X-l. Summary of Tr it fain Handling Fa.-ilitv Parameters (Cont.)
maxIsotopic Enrichment 8 T 10
Type of Mainstream Enrichment Cryogenic Dis t i l l a t ion
Number of Columns 6
Number of Equilibrators 1
Operating Pressures (Torr)
Column 1 500
Columns 2,3,4,5,6 1000
Reflux Ratio
Column 1 20
Columns 2,3,4,5,6 15
Feed to Column 1 (gm/hr) vLQO ^250
Height Equivalent Theoretical Plate (inch) 1
Liquid Holdup (cc/cc of packing) 0.18
Superficial Vapor Velocity ( f t / s ) 0.2 - 1.0
Number of Theoretical Stages per column 30
Maximum Column Diameter (inches) < 2,0
Atmospheric Clean up System
Reactor Hall Volume (m3) -\-2.8 x 10⁵
Baseline Tritium Level (u Ci/m3) 5
Clean-up Time,(days) < 2
Maximum Decontamination Factor 10s
Air Circulation Rate at Emergency (cfm) > 105
Volume of Catalyst (m3) 20
Catalyst Operating Temperature (°C) 27
Miscellaneous
Tritium Level in Fi rs t 'wall
Cooling Water (Ci/5.) < 2
Tritium Release Rate to Environment
(Ci/day) 100
Volume of F i r s t Wall Cooling Water (£) i*105
X-3

In addition Co the more definitive studios mentioned above, tritium
handling aspects of the small scale experimental breeding teat experiments
and full scale breeder blanket mock-up modules planned for later stages of
EPR operation were reassessed in the light of the present understanding of
po*?er reactor blanket design criteria and constraints.
B, Tritium Inventory and Reactor Fueling (Logistics)
Tritium fueling, burnup, and inventory parameters for tho 8 and 10 T
EPR designs are listed in Table X-l, The principal assumptions applied in
determining these parameters are (I) that the throughput/burnup ratio will
not be greater than 50, (2) that the fuel cycle turnaround time (fuel hold-
up time) will be 4 hours or less, and (3) that the initial tritium inventory
will be supplemented as required to meet fuel ing requirements during periods
of continuous operation at the projected overall duty factor of 50Z. The fuel
cycle turnaround time is determined mainly by the regeneration cycle on
Che cryosorption pumping system for the toroidal ,ilasma chamber. (As indi-
cated in Chapter VII-A, this regeneration cycle is carried out on a four huur
basis.)
An alternative to the continuous delivery approach is to stock the
plant with a considerably larger initial inventory — perhaps a one year supply.
Although most of this additional inventory would be reposited in the storage-
vault, the overall hazard potential of the plant must be considered to in-
crease in proportion to the total tritium inventory. Furthermore, even a
600 gm initial inventory would more than likely be delivered in partial
shipments not exceeding 200 gm per shipment; hence, there is no apparent
reason to consider stocking any more tritium than is needed for a few weeks
of continuous operation. Subsequent planning exercises to determine (I)
operating schedules for various hypothetical burn sequence tests and (2)
the length of down time between test programs are expected to shed more
ligh,t on the inventory question. Ultimately, the safest way to gauge the
inventory requirements mav bo to determine the quantity of tritium needed
for the duration of an individual test program (to be conducted without sub-
stantial intermediate down times) and make provision for the delivery of
that inventory prior to initiation of the test orogram.
X-4
(',. l-'utrL Circulation and Process iiiu
Chapter Vtl of reference 1 contained a description of the scope of fuel
circulation and p rue ess ing requirements fur the i'l'K. Although only a
cursory reassessment of these re«;ui rements •»•»« made .during FY-i976, no
compelling findings wore uncovered to give cause for signi f ic.itvt revision
af the fuel cycle scenario outlined in reference" 1. The major processing
requirement:-; for che Ki'K fuel cycle that have con*; to light thus far arc
(i) separation of solid (potentially radioactive) debris from the.' plasma
chamber, (2) removal of nonmetallie impurities (e.g., He, 0, N, C) from
the fuel stream leaving the torus, (3) reduction of protium levels in the
D-T mixture prior Co recycle, and (A) adjustment of feed composit.ions for
the cold fuel supply and the neutral beam injector supply. The remainder
of th'.s section and Section X-D summarise the status of des'^n and analysis
work on the fuel circulation and prut-ess tn>', systems for the KPR.
* " ••liii -'I'-'ratton w\d HJUHUJUJ;
Thy bars!-, radiation environment anticipated for the first wall of
the El'K is likely to lead to a dislodf;in}:; of sizeable quantities of fine
paniculate; metal and metal compounds. Althouj-h most of this ^obris IK
expected to either settle out or reattach itself to the first wall, plans
must be made to accommodate the migration of some participate material
into the vacuum pumps and beyond them. Because the first wall will become
highly radioactive after only a few days of operation at modest wall
loadings (0.2 to 1,0 MW/m1'), the debris will also be highly radioactive
and maintenance of the vacuum pumps and the equipment immediately down-
stream of them will be subject to increased complexity. l.arRe quantities
of debris in the torus exhaust gases will undoubtedly have an adverse effect
on pump lilfiimv and performance, but any attempt to microfiiter the debris
in advance of die vacuum pumps (between the plasma chamber and the pinups)
will more than likely lead u. unacceptable' large conductance losses.
During clearing (regeneration) of Che cryopanels, the (.-scaf/ing gases
will probably fluidiae some of the debris that entered the cryopanels in
the torus pumping cycle. (Hopefully, most of the debris will be carried

o u t of the cryopitnpsi In t h i s way, so th ; t l pump l i f e l i n e s can In.- e x t e n d e d . )
Removal of t h i s d e b r i s I'row the fuel r e c y c l e s t r eam ran probably be done w i t h
some combinat ion ot cyc lone s e p a r a t o r s , e l o c t r o s t a t ic p r e c i p i t a t o r s , or m i l l L—
port- l i l i u r s . I t p o s s i b l e , t he d e b r i s s e p a r a t ton sys t em should be l o c a t e d
irxurtl l a t e l y downstream ot' the cryopuwps ( to the e x t e n t t ha t t h i s l o c a t i o n
tlcu'S not a d v e r s e l y csci-tJii rou imor .u ton l i n e s ) , i t Is til ft i e i t l t to niaki-
aocu ra t t ' p r e d i c t i o n s of the p a r t i d t* ^i:*-c, siy.*.- l i i s t r Unit i on , atul quant i ly
o i d e b r i s K^nuracod by a p r o t o t y p a l r.I'K; Siciicc, r.umt: i-Kpi-r imcntal ion w i l l
u l t i c n c o l y i>e rcquirv 'd in o rde r to ti::;i dchri.s ruiT>)val method:* In f lowing
b.ydroyvHi strcupis chat sLrattlau- tlu* c a t use roam of liu- YVll ttsi-1 ,-y»-Ic.
-• *_™Lclf-.'I~y}S. tnspur i ty H
The n e r p e t n a l pr«?sgncc of hi- l ium, osv>;i-n, c a rbon , ni troj;i-n» and o t h e r
nonrcctallAc i m p u r i t i e s in titf t o r u s eshattHi ot a:» oputMtiiiK i'J"; « ! ! ' for
a l l p r a c t i c a l p t t rposes be u n a v o i d a b l e . In kuepiun w i t h the IUP>I pt <>t t u c l
r e c y c l e and in ordi.-r to reduce I rapur i ty l e v e l s in tin- prel ' t t ro tm-1 RSKtiii'i-
a s far as is p o s s i b l e , i t w i l l be n e c e s s a r y to p rov ide for cont inuous r e -
irwval ot" n o n m o t a i l i c e l e n o n t s in t h e crynpimp eshausL. This siiould %'trrtainly
be done in aciv^u :e of the i s o t o p i c enr ichment s t « p and perhaps done a^. i in
in advance: of fue l s t o r a g e so t h a t t h e c a p a c i t y of the sii>raj*,i.' m a t e r i a l i s
not reduced by r e a c t i o n wi th i m p u r i t i e s .
Inpu f i t y removal can p robab ly be c a r r i e d out in .1 r e l a t i v e l y s i r a i j - . h t -
f o r v a . ' manner usin>; an a p p r o p r i a t e l v s e l e c t e d c a t a l y t i c and /o r g e t t e r - t y p e
bed des igned to (1) crack w a t e r , hydrocarbon: ; , and o t h e r hyc!;-oj;eiious co~-
pounds and ( J ) a c t i v e l y remove the i n p n r i t i e s i>v r e a c t i o n to forts s t a b l e ,
n o n v o l a t i l e , noniiydroj'.enmis compounds. Tite j ;etct-r bed should be des igned
to sorb and r e l e a s e hydrogen over a r e l a t i v e l y s tsal l t e n p e r a t u f e ranj;e,
should bo r e a s o n a b l y compact, and shou ld be r e a d i l y d i s p o s a b l e . I t i s e:>;-
(liicted Chat t h e s e j ;u t t t s r bt?ds w i l l reduce 0 , M, C and r e l a t e d ttonnc l a l 1 t <:
i m p u r i t i e s in t h e fuel scream t>> t h e sub pptn ranjje. T'ne h c l i t m p r e s e n t in
the cryopurop e x h a u s t could be a l lowed to ca r ry over i n t o the c ryogenic
d i s t i l l a t i o n columns ;:nd be removed therefrom as a n o n c o n d e n s i b l e , p r o -
v i d i n g t i i i s c a r r y o v e r does not comptotnise column o p e r a t i o n . In a d d i t i o n

to tin- need tn identity and test getter bed materials (or combinations of
materials) for broad spectrum nonrsetall ic Impurity removal, the relative
r.u-rits tif continuous versus various d<.-g>ees of batch processing of the cryu-
;>iiei(> exhaust remain to be evaluated,
i. ts»topic Knrlchment
I.iotupic enrichment of (1) the- main fuel strennt (to remove procium)
and (2) various levels ui" tritiate<! effluent from jacketed and whole room
junyes (to recover ami recycle tritium) in currently being carried along
as a major goal for the Kt'K tritium handling facility. Some nod it'i cations
have been made to the enrichment scenario presented in Chapter VII of
reference i. The scenario currently under study is described in Section X-D
and a Bare detailed discussion is given in Appendix I. The major functions
nt the i-nr Uhrceut system (insofar as the fuel cycle Ls concerned) are (1)
!,u provide a tritium rich stream ('!/!) '.: 1.1) of sufficient isotopic purity
ior cold tuel inject ion, (2) to generate a j. 9B atonic '.'. deuterium stream
[or the neutral injection syst as, ('3) to perform a max I cam separation of
protiun from tritium so that as little tritiinn as possible is carried over
with the j>r<>tium discharge, and (*'*) to provide enough levels of enrichment
to allow maximum recycle i>f tritiuis that is scavenged by the atoisospht-ric
and purge cleanup systoiw during normal operation and in cases of accidental
release. The location of the enrichment system in the fuel cycle is de-
scribed in p a n •'• of this section.
•'* • fr'ue 1 Cy c 1 e ties ign and iiardware
With several ninor exceptions, the fuel circulation and processing sys-
tem design has renuiitn-d much the same as was described in Chapter VII of
reference I. A schematic drawing of the currently conceived system is shown
in i'igure X-l. Although the roughing system is not used during burn cycle
pimping operations, it is designed to handle modest tritium levels In the
exhaust gases that leave the torus during roughdovn and bake out to the pre-
burn operating pressure range. The remainder of the system (from the cryo-
lucups on) is designed for high level tritium operations.
Thu operational features of the cryosorption pumping stations are de-
scribed in Chapter VII-A. The two pumps at each statiots are alternately
X-7

CRYOSORPTION PUMPSWITH THERMAL ECONOMIZER
;*:i
oo
MULTISTAGE—iWABBLE PUMPS I
MERCURY IEJECTOR PUMP
COLDT R A f DIAPHRAGM
° COMPRESSOR
FUEL INTEGRITYMOfuiPR ^_r £ -;
A m | \ CRYOGENIC* { p,£ ,™ H^T^-i \DISTILLATIONI v - 3 J
TRiTIUMSCRUBBER
COLD FUELCONDITIONE
LOCAL TCONTAINMENT-(
TRITIUM iSTORAGE I
(RESERVOIR1
! JL-COLD FUELSUPPLY STREAM
TRITIUM SUPPLY
-+4—CD-
He-H?
STREAM
FUELBLENDER NEUTRAL INJECTOR
SUPPLY STREAM198% D2)
D° NEUTRAL INJECTORQ } = PALLADIUM OiFFUSER
Figure X-l. Fuel Cycle Scenario for x\

regenerated on a 4 hour basis. During regeneration the pressure inside the
pump being regenerated is not allowed to rise above a few microns in order
to limit refrigeration requirements. As presently planned, the gases exiting
the regenerating pump are first passed through a fine debris separator. In-
stead of using the mechanical clearing pump included in the previous design,
the cryopump exhaust gases are pumped with a hydrogen getter bed as suggested3
by Wats.cn et. al. The bed should be prepared so that (1) it has a high
effective pumping speed for hydrogen at modest temperatures (a few hundred
degrees centigrade), (2) it is regenerable with only a modest temperature
increase in order to conserve on regeneration power requirements (l.t. the
getter material must have a relatively large heat of solution for hydrogen
isotopes), (J) it getters and retains the major anticipated nonmetallic ele-
ments (e.g., i), N, C), and (4) its active materials are easily replaced and
disposed of.
During both pumping and regeneration cycles the getter pump is cleared
by a mercury ejector pump followed by a multistage arrangement of wabble
pumps of the type described by Folkers and Cede. The mercury ejector pump
is capable of pumping at inlet pressures of •; I micron against a substantially
higher backing pressure. A wabble pun-.; is a completely sealed unit, in which
compression is achieved by the wabble motion <if a metal bellows assembly that
operates much 1ikt' a nutating piston. These pumps perform effectively at
in.'et pressures as low as 10 microns and can be staged in series to achieve
pressures approaching 1 atmosphere. They are generally regarded as being
suitable for service in a high level gaseous tritium environment.
The hydrogen isotope stream leaving the wabble pumps (mostly D 2, D-T,
and T;i) is forced through a high capacity, low pressure drop, packed liquid
nitrogen trap to remove any condensible impurity vapors in advance of the
cryogenic distillation cascade. This trap would be designed to accommodate
regeneration and maintenance access and would he equipped with a thermal
economizer to limit nitrogen boil-off.
The function of the cryogenic distillation cascade is described in
Section \) of this cha,,ler and, therefore, will not bo discussed further here.
The return streams from the distillation cascade consist of (1) a tritium
X-9

enriched cold fuel supply (T/D 1.1) and (2) an >• 98 atomic "I deuterium
supply to feed the neutral injectors. Essentially all of the tritium ad-
mitted to the fuel cycle remains in the cold fuel supply where it is either
recycled to the reactor or returned to the storage reservoir. Tho deuterium
supply for Che neutral injectors is delivered as needed with any excesses
being returned to an appropriate stage of the* distillation cascade, Details
of the fuel circulation requirements downstream from ch<? distillation cascade
remain to be evaluated. The general concupt of tin- storage reservoir for
the tritium rich streams has not changed from that described In Chapter VII
of reference 1.
A H piping and the majority of die hardware (pumps, valves, etc.) will
be constructed from 18-8 stainless steels as recommended In references 6
and 7. M l joints will be welded except where integrated sections of the
fuel circulation system join together. In order to facilitate maintenance
operations, these integrated sections will be coupled through a safety box
system as shown in Figure X-2. The safety box is designed to provide jacketed
containment around the mechanical section-to-section seal and to permit iso-
lation, removal, and replacement of a failed section with minimum escape of
tritium. The boundary pipe (between isolation valves in Figure X-2) is
bakeable and evacuable to verify valve seating ar.d to allow for detritiatian
prior to any decoupling operations.
All valves will be the welded bellows seal type and will be outfitted
for air actuation as well as emergency manual operation. Valves that are
not located in a safety box and all other high risk components (e.g. pumps,
compressors) will be located in a secondary container * which is connected
to a purge cleanup system of the type described in reference 2.
D. Design Description of the Cryogenic DistiUatiun Cascade
Isotopic enrichment of (1) the main fuel stream (to remove: protium) and
(2) various levels of tritiatcd effluent from jacketed and whol-j room purges
(to recover and recycle tritium) is still considered to be a major goal for
the EPR tritium handling facility. Some modifications have been made to
the enrichment scenario presented in Chapter VII of reference 1.
X-10
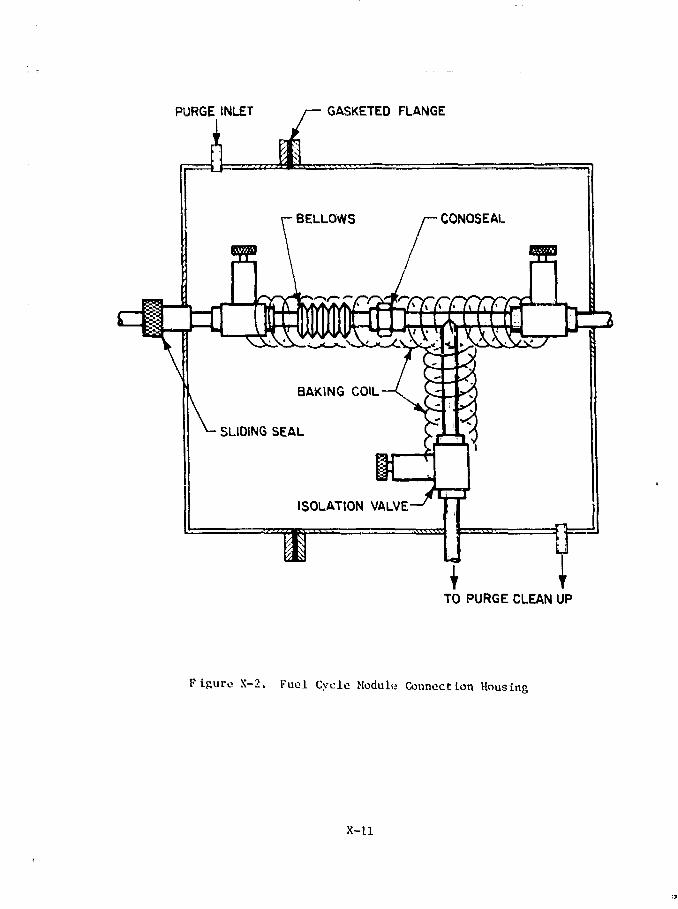
PURGE INLET GASKETED FLANGE
TO PURGE CLEAN UP
Figure X-2. Fuel Cycle Module Connection Housing
X-l l
1, Summary Design Description
'.he scenario currently under consideration is illustrated in Figure X-S.
The cascade of columns in Level A is designed to handle various molecular
hydrogen streams (tram the purge cleanup systuns) with T.'ii n.sios ,r>v;u-r
Chan 10"1', The appropriate teed placu location in the i.evet A ra.-u-.-tdu will
be. determined by the 17 H ratio ot" the incoming stream. Because the major
source of tritium entering the purge circuits is t roni tlu- mainstream ot the
fuel cycle, the D/T ratio in all Level A feeds (except for the teed trow
Level ft) is expected to be near unity. The '.e.vel B cascade handles tin- top
fractions from the mainstream enrichment cascade (Level f ) , These iractiotis
are predominantly deuterium but wit! contain essenc i;t! lv all nt the ;>(\>tiuti
that oncers the mainstream and :i small but non-nej'J l^lb le quantity ui iriiittni.
The purpose of the Level B cascade is to affect a maximum separation of
protium from tritium. The protium fraction is directed to the Level A
cascade and the tritium fraction is returned to thv Level (.' cascade. in
order to maximize the H/T separation in the Level U cascadet eijui1ibration
with excess! D is included as shown. The Level V. cascade receives the flow
from the mainstream of the fuel cycle. This flow is expected to consist
of a roughly equi-molar mixture of 1) and T containing at most 1 to 2 a tin .".
H. The first column (column I) of this cascade is designed to give a lar>;e
H/T separation lactor. The stream from the top of the. first column (containing
mostly D together with > 99Z of the H tliat entered the column and some T)
is sent to a second column which further separates the ii and T. Appro:-:!-
mately 80% of the mainstream fuel flow leaves the Level C cascade through
the bottom of the first column. The bottoms from the second column are
subjected to additional enrichment to produce i) of sufiicient purity for
neutral beam injection.
2. Analysis of the Ui-st illation Cascade
A computer code (MISRA) has been written to model six component (II,.,
HD, HT, U^> DT, T;,) distillation in cascades of single columns. Appendix I
contains a description of the analytical algorithm used in building the code
and a comprehensive summary of all modeling results that are generally perti-
nent to fusion devices. A summary of key operating parameters for the first
six columns in Figure X-3 is given in Table X-2. The bottom product from
X-12

io"4< ^
D+T>98H<
FROMTORUS
VACUUM"SYSTEMS
D+T>98
D+H = IOOr<3
JDD+T=IOO
TO- WASTEDISPOSAL
5) ;
B
D>98
T/D« II!C
TO COLD FUELRETURN OR
STORAGE
TO NEUTRAL- INJECTOR
SUPPLY
CRYOGENICs DISTILLATION
COLUMN
s~\ -ISOTOPOMERiC^—'"EOUILSBRATOR
F.Lj»uro X- ' J . C r y o j ' u n i c K n v i c h m e n t S c e n a r i o l»>r t!:<? ASL El'K

Colinnrij.
Number'
2
3
4
5
6
TabJe
Location
ofFeed
Plates
101520
,1520
!15:20
•15
•15
15
1 i
X-2. ' Summary
iii '
TotalFeed
(moles)1
100.0
23.0
23.0
8.0
IS'.O
10.01
of Operating
Nominal GrossFeed
4
18
38
50
32
1.
Composition
i
. 1
2
9
9
5
3
D
49.7
69.4
29.6
18.9
35.8
96.9
Parameters for
-
(aL %)T
•
46.2
32.4 '
33.5
31,1
31.7
1.8
rTotal
Moles
18
13
8
3
5
5
tlv-.
Top''
EPR Cryogenic
?roduct
Atomic
H
33
51
9S
48
2
.5
.2
.0
.8
2
.5
-
•1)5
Percentages• D
62
48
17
X6.
95.
3
2
9
2
0
3
T
3 5.•
20.i
31.
% 0
45.
2,
2
6
1
a'4
i i
scillaLion Cascade*
i
Bottom Product
t
TotalMoles
82
io:1 '
15
' 5 ,
1 0 •
•5, ..
Atomic
. , H
•
'0.07
3.3
i
32.51
23.1
24.7
y 0
Percentages
D
46.8
96.9
3^.3
28.5
50.7
98.8
T
53.
...
31.
50.
24.
1.
1
8
7
4
6
2
30 theoretical stages per column; column pressure = 500 torr for Coluim No, 1 and 1000 torr forColumns 2 through 6. ' ' • '
+ ! ..| . .• i ,
See Fig. X-3 for location in cascade.
•: i
column 1 (the cola fuel supply) i s enriched in trit ium (T/D is 1,1) and con-
tains less than 0.1 atomic % protrium, The bottom product from column 6 i s
sufficiently r ich in deuterium l> 98 atomic % D) to provide an adequate
supply for the neutral injection system, Because the probability that
tritium will enter the neutral injection system via the torus/beam line
interface i s considered to be very high, the residual tritium in the neu-
tral injection supply should present no serious problems. (In the presently
conceived neutral beam injection concept for the EPR, the entire injection
system will be designed on the basis that tritium levels will indeed be on
the order of a few percent of the deuterium content.)
A single stage of isotopic equilibration i s provide in advance of
column 4 Co reduce tritium carryover with the protium rich top product
of column 4. In this equilibrator excess deuterium i s added to the stream
that emerges from column 3 in order Co separate the HT present into HD
and DT (V>2 + HT •* DT + HD), The less volat i le DT .3 then concen-
trated in the bottom product of column A and i s returned to a lower level
of the B cascade. With this equilibrator in line the tritium in the top
product of column A is reduced by a factor of ' 50 (see Appendix I ) .
3. Column Dimensions and Inventories
Some of the important parameters involved in the design of the d i s -
t i l l a t ion columns are (1) the number of theoretical plates or stages; (2)-
plate spacing or height equivalent to a theoretical stage, HETR, for packed
columns; and (3) the superficial vapor velocity. For very small diameter
columns (approximately 0.5 to 2 inches), only packed columns need be con-
sidered (plate-type columns are impractical in such small s izes) . While param-
eters (1) and (2) are easily determined, che estimation of superficial velocity,
which determines the column diameter, presents a more formidable task. For
conventional fluids (hydrocarbon mixtures and aqueous solutions) the e s t i -
mation of superficial velocity i s based on laboratory data and empirical
correlations. However, such data and/or correlations for the isotopes of
hydrogen are largely non-existent. Estimation of the liquid holdup r a t e ,
which is a function of the superficial velocity, in addition to other factors,
presents similar d i f f icul t ies ; hence, there i s some inherent uncertainty
involved in the calculations that follow.
X-15

The following calculations of column size and liquid holdup are based
on limited experimental data "* " for the ternary system H2/HD/D2. Reference
12 mentions the use of a liquid velocity of 2.6 inch/second where as flooding
conditions were observed in Reference 13 in the superficial velocity range
of 1.4 to 1,7 inch/second. Reference 12 uses an HETP of 5/8 inch while* in
contrast, reference 13 suggests HETP values of 1 to 4 inches. The column
oize and the liquid holdup are based on the following assumptions for the
6-column cascade in Figure X-3:
Operating Pressure
Column 1
Columns 2, 3, 4, 5, 6
Reflux Ratio
Column 1
Columns ?, 3, 4, 5, 6
Feed to Column No, I
HETP
Liquid Holdup
Superficial Vapor Velocity
Number of Theoretical Stages
The summary of data presented in Table X-3 is intended to show the
approximate size of the columns and the quantities of liquid holdup in them.
Since the calculations are based on limited published data, these values
should be considered preliminary. Also, the results in Table X-3 are based
on the use of a single cascade to process all of the mainstream flow. In
actual operation the enrichment would probably be done with from 2 to 4
independent cascades in parallel, making the column sizes even smaller than
those indicated in Table X-3. Whether the mainstream enrichment is carried
out with a single cascade or with several cascades in parallel, sufficient
redundancy would be provided to accommodate maintenance and repair operations.
4. Comments on the Level A Cascade
No detailed modelling was carried out during FY-ls 'f on the level A
cascade in Figure X-3. The design of this cascade requires a better under-
standing of the quantity and isotopic distribution of the hydrogen isotopes
present in purge streams. Up to now the assumption has been made that the
hydrogen isotopes present in these, streams can be isolated from other impurities
X-16
500
1000
20
15
100
Torr
Torr
gms/hr
1 inch (all
0.18
0,2,
30
cc/cc
columns)
packing
0.5, and 1.0 ft/sec

Table X-3. Column Diameters and Liquid Holdup for Selected Superficial Vapor Velocities
SuperficialVapor Velocity
ft/sec
Column Number*
1
2
3
4
5,6
0.2
Diameter,ijn.
1.53
0.84
0.71
0.40
0.55
LiquidHoldup, cct
163
50
35
11
21
0,5
Diameter,in.:
0.97
0.53
0.45
0.25
0.35 '
LiquidHoldup, cc+
6fi j
19
14
5
8
1.0
Diameter,,in.
0,86
0.38
0,32
O.I'
0.23
LiquidHoldup, cct
32
10
6
3
5
Referred to Figure X-3.
f Tritium concentration 0.036 gm/cc.

and reconstituted in the molecular form so that they can be fed to a cryogenic
distillation system. The presently conceived plan is to equilibrate the molecu-
lar hydrogen effluents from the clean-up systems with a large excess of
deuterium and to feed the resulting HT, DT, Dg mixture to the appropriate level
A. column (see Figure X-3) depending on the required separation factor. The
extension of work, on the enrichment systems, planned for FY-1977, will in-
clude a more comprehensive study o£ the low level tritium recycle scenario,
together with the development of analytical models for predicting the volume
and the composition of clean-up system effluents,
s• AtmospheriG Detritiation Sys terns
Preliminary assessments showed that the requirements imposed by the need
to pro/ide for large scale atmospheric dotritiation of the EPR reactor
building are a major concern from the standpoint of (1) maintenance access
during reactor down periods, (2) compactness of tritium handling equipment,
(3) limitations to the spread of tritium contamination, and (4) overall tritium
facility costs. During FY-1976 an effort was made to consider the scope of
these requirements with respect to gas handling rates, exigencies of the
cleanup schedule, and the dominant features of the cost/benefit algorithm.4 5
These studies were aided by a number of recent reports * on the subject
and by helpful discussions with members of other ERDA laboratories * ' and18
industry who are directly involved in development work on detritiation
systems.
1. Estimates of Gas Handling Requirements
Consider a large reactor hall of volume V_o_, having a baseline tritium
level, N°. Assume that the room air is processed at a volumetric flow rate• . . . . . - - - - -
V and that the processor efficiency is e. The rate of tritium removal is
given by
dN e«V-N . .= U l )
The amount of time, t, it takes to reduce a massive tritium release from
the maximum value following the incident, N*, back to N° is obtained by
integrating Equation (1) to produce
(X-2)
X-18

Values of V tor selected values of S'/S°, i., and t are given in Table X-4
for a room with V ^ 10 cu. ft. ('- EI\. tiize).
According to Engelhard industries, the largest unit they have evaluated
to date called for 6 x 10³ cfm at a cost of '- $ 106 for the equipment alone.
Because the tritium released to the hall will rapidly soak into the surfaces
of the reactor hardware and the building itself, it is advantageous to have
the capability for cleaning up spills within hours after a release. if,
tor uxample, the limit is set at <_ 5 hours, then the V requirements would
be r^ 10 times those for the two-day case in Table X-4 and would be IQO times
greater thaw the maximum size unit upon which Engelhard has made a quote.
A second approach to the massive release problem might he rapid cyclic
flushing of Che reactor hall by alternately compressing its contents (re-
ducing room pressure by a factor n) and back filling with clean air or an
alternative cover gas. If the compressed gas could be stored at 14,000
psi in tanks whoso total volume is 10^ cu. ft., the tanks would then hold
10 room volumes of gas which could be cleaned vip over an extended time period
(several weeks) by a state-of-the-art sized scrubbing system. The cleaned
up gas could then be stored for subsequent flushing operations. For the
case where tile room is evacuated to 1/n of its normal operating pressure
and back-filled every t° hours, one obtains Equation (3).
!?•?•» <«>Integrating F.ciuation O) for the cases chat were considered in Table X—'t
gives
In ~ = ^ t (X-i)
The results for this* typo ot atmospheric cleanup are summarized in Table
X-5. (The <.• Jector/cumirossnr velocities, V', are based on pump-out times
that arc equal to t°/2.) In order to keep compressor requirements within
reasonable limits, it is necessary that I not lu« much in excess of a few
hours. A value of t = .'• hour:; was si-lucti-d for the study shown in Tablo
X-5. This is cunstilorvd to be- reasonabli- based on rsisting I'xp19
at si-voral NASA space testing installations.
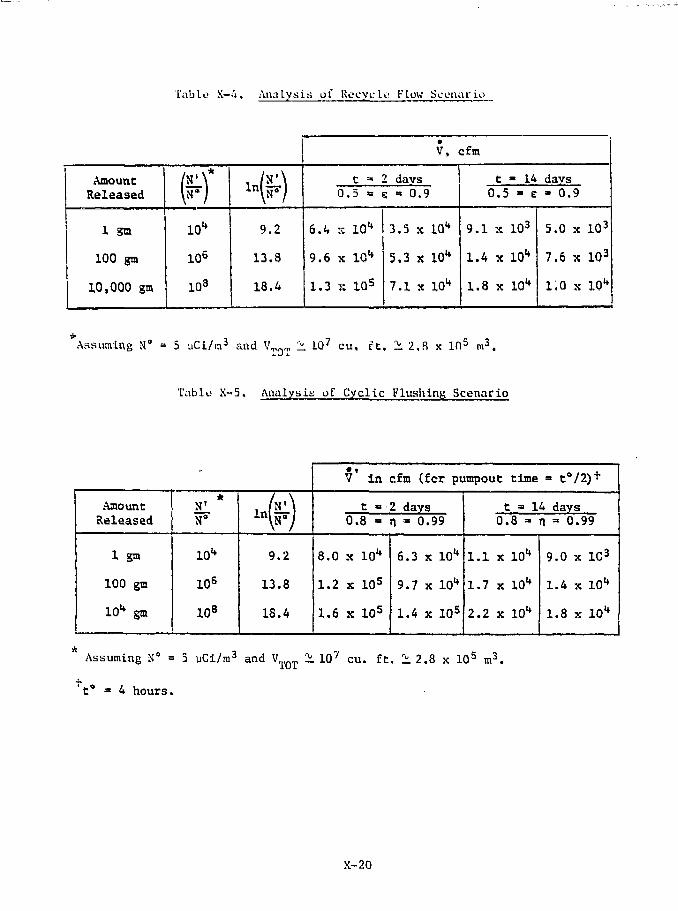
Table X-4. Analysis of Reeyelt: I*Low Seonario
AmountReleased
1 gm
100 gm
10,000 gm
[w)10"
105
103
/N
9.
13.
18.
• \
")
2
8
4
6
9
1
.<,
.6
.3
0.
X
X
c =•5 •
10"
10"
10s
I davs
3.
5.
7.
0.9
5 x
3 x
1 X
v , <
10"
10"
10"
9.
1.
1.
0
1
4
8
t.5
X
X
X
- 14- e
103
10"
10"
days3
5
7
1
0.
.0
.6
.0
9
X
X
X
103
103
10-
Assuming N° = 5 uCi/m3 and V ^ 107 cu, ft. 12.8 x in5 m3.
Table X-5. Analysis of Cyclic FlushlnR Scenario
AmountReleased
1 gm
100 gm
10" go
*N'N°
10"
10s
108
ln\N°j
9.2
13.8
18.4
V* In cfra (fcr pumpout time = to/2)+
t « 2 davs0.8 » n =• 0.99
8.0 x 10"
1.2 x 10s
1.6 x 10⁵
6.3 x 10"
9.7 x 10"
1.4 x 10s
t = 14 days0.8 = n » 0.99
1.1 x 10"
1.7 x 10"
2.2 x 10"
9.0 x 1C3
1.4 x 10"
1.8 x 10"
Assuming N° = 5 uCi/m3 and VTQT 1 107 cu. ft. 1 2.8 x 10⁵ m3.
t° = 4 hours.
X-20

Comparison of the results in Tables X-A and X-5 shows that there
is no practical advantage in terms of gas circulation requirements to the
evacuation approach .is compared to the more conventional continuous scrubbing
approach. The major concern with respect to these massive tritium releases,
i.e., sorting of tritium into the reactor hardware and building surfaces,
will have tu be investigated in considerable detail to determine what cleanup
durations are acceptable. Clearly, the requirements of cleanup in two days
or less imposes large gas circulation requirements and the associated equip-
ment can be expected to scale accordingly.
2. Cat a1yat Requ irements
A reasonably comprehensive analysis of large-scale atmospheric detritia-4
tion for fusion power plants has been presented by Galloway et al. In
their study, they consider the question of large-scale cleanup from the
standpoint of catalyst performance and cost. Instead of counting pro-
cessing requirements with removal efficiency, K, as was done above, they
use first-order kinetic, plug flow reactor design equations to represent
catalytic bed performance. This approach permits the evaluation of both
performance and cost simultaneously. The equation developed by Galloway
et al. is giver by
Vc V^7 - BJHJ ^- ii - exp(-k •$-)] Tt t \ (X-3)
where
N° = the tritium activity at any time t after cleanup has beenstarted.
N' = the tritium activity at t = 0 (immediately after the re-lease incident)
V = volume of catalyst in m3
V = gas circulation rate in mVsec
k = the first-order kinetic rate constant in sec"1 [see Equation (X-6)
V, „, = the room volume in m3
t = time after start of cleanup in sec
The rate constant k is taken from data developed at Mound Laboratory
and is given by
ktsec""1) = 2.27 x 10⁵ exp(-7100/RT) (X-6)
X-21

where T is the Kelvin temperature and R = 1.987 cal/mole*°K.
For purposes of comparison with results in Tables X-4 and X-5, Equation
X-5 was rearranged tc solve for V , as given by Equation X-7.
(X-7)
Results of a study using the cases in Tables X-4 and X-5, i . e . , 2 days
and 2 weeks, V - 105 cfm for the, 2-day case and lO*1 cfm for the 2-week
case, and VTQT = 107 cu. f t . (283,000 m3), are shown in Table X-6 for se-
lected catalyst temperatures.
3. Atmospheric Clean-up Scenario and Associated Costs
The cost algorithm used in Table X-6 is based on information from a18
number of sources. Golankiewicz has recommended a catalyst cost of
$0.06 M/m3 where large quantities are involved. Galloway suggests that the
'equipment cost he obtained by taking a Factor of ten times the catalyst cost.
In house studies have indicated that the building needed to house the clean-
up equipment should not cost more than 50% of the equipment outlay. The
costs indicated in Table X-6 were computed on this basis and were found to
be in reasonable accord with the previously mentioned estimate of 106 $ for a1 ft
6 x 10³ cfm Engelhard system (which scales to ^ $ 17M for a 105 cfm unit
•or $ 1.7M for a 101* cfm unit) . Costs for the elevated tetnperat ire catalyst
cases in Table X-6 were not computed with this algorithm because (1) the
algorithm ignores the gas heating and recooling requirements and (2) i t is
not clear that the small quantities of: catalyst indicated by the calculations
could actually service the large gas flow rates involved and retain their
efficiency for the duration of the cleanup operation.
In light of the results in Table X-6 the following atmospheric clean-up
scenario is tentatively proposed for the ANL/EPR. Provision is made to handle
the IQFJ release case (N'/N° = 106) on the basis that the escape of 100 gm
of tritium represents the largest credible event that could occur In the
reactor building without a .simultaneous breach of the building containment
boundaries. It is further postulated that the cleanup must be completed
within 2 days using room temperature catalyst . This leads to a catalyst
requirement of 20 m3 and a resulting cleanup facility cost (with associated
building) of '- 20 million dollais. The facility will be designed to accommodate

Table X-6. Scrubber Plant Catalyst Cost Versus Clean-up RequirementsCatalyst Operating Temperature and Flow Rate
Catalyst OperatingTesperature
Reactor HallVolume (cu. ft.)
Minimum FlowRate (cfo)
Required Clean-upTine (days)
K'/H*for K* • 5yCl/m3
Volume of CatalystRequired (m3)
Catalyst CostSO.Oh H/n' (S:<>
Equipment Cost(SM>
Building Cost<u)
(SM)
Total Coat(SM)
10"
12
0.7
7
i.b
12
10s
2
106
20
1.2
12
„
20
1.525
27*C(3OO°K)
107
108
32
1.9
19
li
1*
1.9
0.12
1.2
0.0
I
10"
14
10*
3.6
0.22
2.2
l.l
3.S
108
7.2
0.43
4.3
2.2
7
80.82
177"C(45O°K)
107
10*
2
10* 106 10B
0.22 0.38 0.S9
—
—
—
10"
14
10" 106 10®
3.6 6.7 1.4E-2 E-2 E-1
—
—
—
to
58B.4
327"C(600*K)
107
105
2
10* 106 108
3.1 5.2 8.2E-2 E-2 E-2
—
—
—
(0
10*
4.9E-3
10"
1.4
106 108
9.3 2.0E-3 E-2
—
—
—
(a)
(b)
(c)
Assuming Equipment Cost • 10 x Catalyat Cost.
Assuming Building Coat "u 0.5 x Equipment Coat.
Costing Algorithm 1B asaiimed to be Inaccurate for this cade (see text).

the hardware neeesssry for elevated temperature operation in the event that
subsequent analysis or early operating experiences give evidence of the need
for increased catalyst efficiency, A block diagram of the proposed detritiation
system Including some of the more important operating parameters is shown in
Figure X-4. The locations of the additional equipment required for catalyst
operation at elevated temperature are also shown in this figure. The estimates
of the fan requirements (2 fans, each 84 inch diameter, 650 rpm, 200 HP)
were based on a 50 ft2 (cross-section) duct system, a linear air velocity of
2000 ft/min., and a pressure drop of less Chan 0.05 atmospheres. The indicated
fans are within the reach of existing technology; however, a more restricted
duct system, a higher linear velocity, or a larger pressure drop would create
a need for additional and/or larger fans. The combined power requirements
for the heating and cooling phases of elevated temperature catalyst operation
are conservatively estimated to be ^ 10 MW for 177°C air inlut and ^ 20 MW
for 327CIC air inlet. No credit was taken in these estimates for the exo-
thermicity of the catalyst bed.
It has been suggested that the initial rate of tritium reduction in
the reactor hall can be increased by designing the air flow patterns within
the hal1 so that the mixing of clean return air with the residual air is
minimized. This would lead to a higher mean tritium level in the air initially
leaving the hall and would increase the gross tritium scavenging rate in
the early stages of a clean-up operation.
F. Pressurized Water Handling Practices
The selection of water as a coolant for the first wall blanket and shield
of the EPR raises concern regarding the consequences of tritium migration
into and thro >gh the cooling circuits. The problem of tritium permeation
through austenitic construction materials has long been recognized as a
major area of concern for fusion power plants. Although the principal focus
of attention to this problem has been on migration of blanket tritium through
heat transfer circuits and eventually to the environment, the tritium in the
plasma chamber is also subject to migration; hence, the absence of a breeder
blanket would not necessarily obviate concern in the case of the EPR de-
scribed in this report. In this section, an attempt is made to quantify the
tritium permeation losses to the first wall coolant and to examine these
losses in the context of existi-ng experience with the primary (D20) cooling
circuit of heavy water reactors.
X-24

•THERMAL ECONOMIZER
CEILING EXIT DUCT}
IO5CFM AIR AT27°C ,2OOOFT/MIN. VELOCITY
CATALYST BED
84" DIA. CIRCULATIONFANS {E A. 200 HP, 650RPM)
ABSORBER BED
COOLER I I
I 0 5 CFM AIR AT27*C,2000FT/MIN. VELOCITY
FLOOR LEVEL INLET DUCT
Figure X-4. Block Diagram of the DetrItiation System
X-2 5
The preliminary analysis ot" tritium permeation into the first wall
coolant was based on the cooling panel design and related operating param-
eters described in Chapter VIH of this report, Permeation was assumed to
occur through the front surface of the panel only (the surface facing the
plasma). Because the back surface is at a significantly lower temperature
and mav either be differentially pumped to Keep tritium pressures lower than
in the plasma chamber or completely sealed off from the plasma chamber by
welding of the entire panel perimeter, permeation through it was neglected.
The front surface of the panel was taken to be 0.5-cm-thick, 316-SS and Che
area available for permeation (see Appendix A) was taken to be 6 x 106 em*1.
For purposes of conservatism, (1) two temperatures that were believed to
bracket the upper limit value for the average peak temperature reached in
the 316-SS panel during the burn cycle (i.e., 450 and 350°C) were used in
the calculations, (2) the average value of the tritium partial pressure seen
by the panel was assumed to be 10"1* Torr, and (3) a zero tritium back pressure
was assumed to exist in the coolant circuit. Permeation rates were determined
using the formula:
* = (f) (* ~) (*° exp(-Qp/RT))where
$ = permeation rate in cc(STP)/hr
A = surface area (6 x 105 cm2)
X = panel thickness (5 mm)
P_ = tritium driving pressure (lO"4 Torr)wo
$° = permeation constant (664 cc(STP)•mm/cm'hr'atm )
Q = activation energy (15,600 cal/mole)
T = Kelvin temperature (723 K in Case A and 623 K in Case B)
(The values of * and Q for 316-SS were derived from data in reference 11 forO 7~
hydrogen. The value of <t> from reference 11 was divided by /3 as a correction
for H/T isotope effects.)
Results of the permeation calculations are summarized in Figure X-5.
The concentrations of tritium in the first wall cooling water circuit
(capacity = 105 liters) for the EPR are found to be in the range of those
reached in the primary (D20) circuit of typical experimental heavy water
reactors, after a period of about two years. It is, therefore, reasonable
to assume that the inventory of tritium in the EPR cooling water could
be managed using practices employed in existing heavy water reactors.
X-26

10'
X
8:2Ixl QC
Z U4 | 0 5
5 z
iso -J< -I
Isa: E
I03
GRENOBLE
I WEEK
10" 10*
MATER1AL= 316 SSWALL AREA = 6 x JO6 cm2
WALL THICKNESS =5mmCOOLANT VOLUME = 105 litersPT =10"* Torr
OPERATING TIME. HOURS
Figure X-5. Tritium Accumulation in the EPR First Wall Cooling Water Circuit

The drainage, consolidation, and disposal of the entire first wall cooling
water inventory (10b l i ters) every two to Liree years should pose no in-
surmountable problems, ar.d is probably preferable (from an economic view-o
point) to installing a tritium extraction plant Cor the first wall coolant.
G, Comments on Blanket Processing Test Modules for Sta^e II
-•-_—• Only limited consideration-was-given_to_the trjtiun handling requirements
for brooder blanket test modules d^/ing FY-1976; hencer little or no detail
is available on the design features-of the module'processing'systems*
•fhe report of the tritium systems subcommittee of <± recent workshop"
on blanket technology contains some substantive discussions ol the role
of breeding modules in EPR and of extraction technology in general.
The question of the meaningfulness o£ experiments performed under thfi
lower wall loading and duty cycle conditions anticipated £or EPRs has been
"considered as has the extent to which blanket processing technology could be
-"developed outside the scope of EPR operations. The general conclusions
reached-on these questions are that while most of the design criteria and
systems development for demonstration plant and commercial reactor blanket
applications could be obtained in separate facilities, some breeding module
" experiments in EPRs would be prudent to assure that"no important interactions
had been overlooked.
With regard co tritium extraction technology for breeder blanket con-
cepts, the status of work on a variety of materials, i.e., liquid lithium,
lithium-containing alloys (Li-Pb, Li-A.1, Li-Si), ceramics (Li-Al-0, Li-»e-n.
Li-Si-Q), and molten salts (Li-Be-F), was reviewed. Design options that
employ liquid lithium with (1) stainless steel at temperatures S, 500°C and
(2) niobium- or vanadium-base alloys at. S. 1000°C were considers-I as were
the ceramic_and_'illqy__o_ption_s_used with (1) minimum activation structures
(graphite and aluminum), (2) stainless steel structures, and (3) refractory
metal (niobium alloy and tungsten alloy) structures. Although molten salts
have not received specific attention in any EPR design studies, they were
- found to have attractive-characteristics, and the-technological implications
of their ultimate use in commercial reactor blankets is deserving of further
X-28

study. Comparison;* of the tritium inventory in the blanket, the state of
blanket critium recovery- techniques, and the ease of containing tritium
within the blanket structure indicate that molten salts and ceramic
materials offer prospects for meeting anticipated blanket requirements
with less development than will be required for liquid-lithium blankets.
Few facts are available on solid-alloy blankets, but these materials
appear to approach the ceramics in terms of inventory and recovery
characteristics. Although some encouraging progress has been made in
recent years, the development of practical steady-state tritium-recovery
techniques for low concentrations remains a major technical uncertainty for -
liquid-lithium blankets. The specifics of recent progress in bench scale i
studies of tritium extraction from promising blanket materials are more
thoroughly described in reference 20 ,
Insofar as the ANL/EPR breeder blanket test program is concerned, the
deliberations contained in the report of the tritium subcommittee at the
BNL Workshop are expected to provide a useful point of departure for the
more detailed design analysis of the KPR blanket modules planned for FY-1977.
H. Research and Development Requirements
Chapter VII of reference 1 and the previous sections of this chapter pre-
sented a preliminary design description for the EPR tritium-handling facility.
It is expected that this conceptual-design activity will continue through
FY-1977 and will culminate in the achievement of a detailed conceptual de-
sign for a fully integrated network of systems to contain and control tritium
in a EPR. However, it is very likely that even after too to three years of
rigorous parameter analysis and design study there will still remain a signifi-
cant leval of uncertainty concerning the actual operating characteristics of
many oi the tritium-handling systems and components. In order to minimize this
uncertainty in the coming years and to insure that the final EPR design de-
scription has a sound technological basis, it is essential that an intensive
technology-development program, amply funded and properly focused, be initiated
immediately in parallel with the conceptual-design effort. Some consideration
has been given to a balanced and properly-escalated program plan for tririuru-
handling technology to be executed over the next five years. This program
X-29
plan, which is directed primarily at R & D in support of the EPR, was
described in a previous report. A summary of program content and direction
for the major tritium related R & D items presented in reference 21 is
given below.
1. Fueling Technology
The technology for fueling tokainaks prior Co and during the burn cycle
is important to operation of an EPR with good power-performance char-
acteristics. Development of gas-injection methods to provide uniform and
timely delivery of D-T mixtures in a gas-blanket fueling mode should bo
undertaken. In the event that gas-blanket fueling is not workable for
an EPR, the technology required to form, accelerate, steer, and deliver
frozen D-T pellets should be developed in parallel with the gas-blanket
fueling mode. Alternative fuel schemes for small tokamaks should be identi-
fied "and investigated. It seems imperative that fueling of tokamak plasmas
during burn cycles be demonstrated in advance of the final fuoling-system
design for an EPR, ,.•.." " :-.-.-- j-
2. Tritium Storage and Transportation
There is obvious need, from the standpoint of fuel-cycle economy and
overall plant safety, to develop fail-safe shipping and storage procedures
for tritium. Included in this development program should be some emphasis
on concentration, immobilization, and long-term storage of tritiattd waste
from an EPR. Implications with respect to long-term safeguards limitations
must be evaluated,
3. Fuel Conditioning and Purification
Development of technology to remove all non-hydrogenous impurities
from the fuel stream under closed-cycle conditions is needed. (Minimum
tritium inventory in the impurity-removal system would be desirable.)
Isotopic enrichment technology capable of upgrading fuel quality (in-
creasing T/H ratios) by four to five orders cf magnitude appears desi 'tie
from the standpoint of fuel cycle economy and maximized triHum recycle.
Accomplishing this magnitude of enrichment will probably require develop-
ment of rapid isotopomeric equilibration methods coupled with advances
X-30

in state-of-the-art cryogenic distillation technology. Methods to minimize
prottum insertion into the fuel stream and all levels of purge operation
should be identified and developed.
4. Tritium Circulation Technology
Detailed assessments of state-of-the-art tritium-handling and trans-
fer technology should be completed. Experimental evaluations of equip-
ment and construction materials that are unique to fusion reactors should
be Initiated. The technology for complete closed-cycle operation of high-
level tritium systems should be firmly established. Leak-tight pumps for
tritium transfer operations over a range of pressures must be developed.
Reliable compressor, valve, structural containment, and maintenance methods
should be verified. Programs to supplement the existing data base for
tritium-related phenomena should be expanded and upgraded.
5. Tritium Control Technology
State-of-the-art assessments in this area should be completed at the
earliest possible time. Efforts currently aimed at the development of
barriers to tritium migration (by permeation, leakage, etc.) should be
continued and should increase as the tritium containment requirements of
an EPR are more clearly established. The pertinent data base, which in-
cludes measurements of hydrogen isotope permeation rates, solubilities,
effects on structural and mechanical properties, and chemical interactions,
should continue to be expanded. Optimization of the kinetics of tritium
trapping reactions should be carried out at an early stage so that costs
associated witu large scale atmospheric cleanup operations can be mini-
mized. The technology needed to operate and process whole-room purge streams
should be established, and methods for efficient recycle of tritium re-
covered from these streams should be identified. Computational models to
predict the migratory behavior of tritium for a range of normal and acci-
dent conditions must be developed and tested at an early stage to provide
guidance in establishing effective maintenance practices.
6. Blanket Processing Technology
Optimum methods for tritium recovery from liquid and solid breeder
blanket materials must be identified, developed, and verified. This program
should include considerations related to (1) minimum tritium-inventory
X-31

blankets, (2) minimum protium insertion into the blanket system, (1) impurity
effects on tritium recovery, (4) monitoring of recovery process operation.
(5) minimum impact on reactor neutronlcs, and (b) minimum Impact on therm.il
performance. In parallel with tho development programs, there should In-
an extensive effort to provide needed physical™ and chemical-property data
related to tritium recovery and Co overall breeder-blanket performance.
7. Instrumentation; and Control Techno logy
Instrumentation must be developed Co monitor thy high concentrations
of tritium anticipated in the process screams and the considerably lower
concentrations in purge streams, in many cases, tritium monitoring
equipment will have Co operate reliably in the presence of a hlf;h ueut.'on
or gamma radiation background. Design criteria and control logics fur the
tritium facility control center roust be formulated and evaluated.
1, W. M. Staeey, Jr., et al,, "Tokamak i.:<perii!Rnr;al P-wer Reactor Studtot;",ANL/CTR-75-2, Argonne National Laboratory (Hi?!>).
2. L. J. Wittenberg, et al., "Evaluation Study of the Tritium-HandlingRequirements of a Tokamak Experimental Power Reactor," MLM-2259,Mound Laboratory (1975).
3. J. S, Watson, et al., "Scoping Studies of Tritium Ewmdlinj; in aTokamak Experimental Power Reactor," ORNL-TM-5080, Oak Ridge NationalLaboratory (1976).
4, T. R. Galloway, et al., "Mirror Reactor Blankets," UCID-17O83, LawTenceLivermore Laboratory (1976).
3. J. C. Bixel and C. J. Kershner, "A Study of Catalytic Oxidatior andOxide Adsorption for the Removal of Tritium From Air," Proceedingsof the Second AEC Environmental Pro tec tlcm Conference, April lfj-19,1974, Albuquerque, New Mexico; WASH-1332 (1974), p. 261.
6. S. L. liavial, "Quality Assurance Guidelines for High Pressure Gas Sys-tems," UCRL-77864, Lawrence Livermore Laboratory (1976).
7. C. L. Folkers and V. P. Cede, "Transfer Operations with Tritium —A Review," UCRL-76729, Lawrence Livermore Laboratory (1975).
8. M. Damiani, R. Getraud, and A. Senn, "Tritium and Hydrogen ExtractionPlants for Atomic Power Reactors," Reprint from Sulaer Technical Re-view Number, Nuclex 72, Sulzer Brothers Limited, wmtersthru,Switzerland.
9. W. R. Bush, "Assessing and Controlling the Hazard from Tritiated Water,"AECL-4150, Chalk River Nuclear Laboratories (1972).

1 0 . f. J . H . i r i i K . ArK 1 1 "" ' - :»-U l'"ft-*t l- .»i" 'f-i t . '>ry ( ; u - r s o t w i i r t j e s s u n i r . - i t i - m ) .
1 1 . V . A . m r u n i , <-t , » , ! . , "s- .S7'fr i i i<-tH.4 ! . s u n U i - ? , u i T f i t i u - S i . i r r s . - r C o n c t - p i *, " ' i f !•'!;.•• t u n K i - : i v l i ' C ' i , " : ' p ! r s ' c < H n ^ % u t 1 h < - U i l t - i t i . t i . i t - j i . i l ' l u t t i < i t - m o o n
Kit?jiac t%*n sjj Bct»L ai'.'i .l.r.4 tJj^L.l.g,';'J*i|^ib^X~AiiiL-lJitiiiiLJi&^l^LKi;* "*•*^"*H; •1-Tt IV?S, KatUtibtsrr,. Tcasiensfc.
U . I , JJ. i'iyjtn, »'t . i t . , "Siiv.ttti.-cs in t:fy.»scnjc r,nj-:iHe»-rin};"i }• 'j8!!%0f;
i $ . a , S . J u h s s u t t .ustS t . H u n t , " l - . i - u T » ' t 5 5 M - r < i t n r « - r > ! i l ! l . - r S r j ' . t r a t U r n i j tS i y r f r n K e t t I - . i ' t ' . > i ' f . , " S . » Y . t n n « * h S t i v e r J ' l a s u K r ; > > T t , i J i ' / ' i 2 , H c i o b t - v , 1 9 & 2 .
I - 1 . . / \ . A . K » K h i - * * s - i m i H . ' « , c . » c i » - i - , {'.-.!».., ' J ' j j j . ' « = . , H t - i . . i t . n ( ; c r < : r . » j i ' : i i i : - - . ,
I ' h o c n i % , A ? i g . > n . » ( 1 9 ' '>) .
\'t. S . W . ( . o l c ' M c r t . i tstS ) . S . - i i l . t , " A i r h . - r i u - 3 r i t i u r . M u n i t . i r i u j 1 . S « - . i r iH i ' . i v v K . i E t - r *;••:. K - . j r K i - . i . t r , " i n K i l c r c n . i : !•'•, ; ' ; • . S 7 V - 5 3 S .
! ' i . .* . K . ' . a l U ' W a v , i . . i w f c ! i c c ; . i v i - r n . . f i ' ; . . i i n r . i t - - < ; u - r %.• : • . . ! I . . ' ~ - ~ u i s i i • . t t : i ' ! ' . t .
'. ? . I . , J , Ki t ; . i c t ' . b i - s ' r . , Mouaij L«i!»>r.n<>rv t ; H ' r ^ a r . . » ! .-. '--/ar.ii-.-iE. t s t n ) .
19, Sec for es , rapU' , tlcscrij>t; Ions of the Space- S'owt-r K n c i l i t y , IIASA LovisResearch C e n t e r , S'ttta Ufook St . s t io t i , S.'tndusky, Ohio
20, -I. P o w e l l , e l a l . , "Procei-iUnKs of ihc Workshop on Blanket /Power Systeissi'or Fusion Ref l c i a r s , " Brtiokhavoti Nat ional t .ahi>ratory, March 29 to Apr i l2, 19 76 ( i n p r e s s ) .
2 1 , !•'. E. M i l l s , e t ; t l . , "Kcsearch atui Uovt'lopment Rcqulrud for t h e T >kamakKxpcr itnetital J'uwt-r R e . t c t o r , " AM./CTK/T>S-fir», Arsonne Na t iona l L a b o r a t o r y(May, 19 7 6 ) .
X-33

CHAPTER XI
INSTRUMENTATION AND CONTROL
The Instrumentation and Control System for the EPR is divided into
tour major subsystems which are:
1, Data Acquisition System - to acquire, record, time correlate,
analyst* and display pertinent data.
2. lector Control System - to control the processes required for
startup, heating, normal burn, and shutdown,
1. Reactor Protection System - to protect the public and the EPR plant
by shutting the reactor down and initiating those processes which
will limit the consequences of an abnormal event.
•'*, Instrument Integration System - to connect the data acquisition,
control and protection systems with one another.
Instrumentation and control for specific processes may belong to all
four subsystems, e.g., a blanket temperature sensor output will be sent via
the instrument integration system to the data acquisition system and the
reactor control (blanket coolant) system and if it passes a maximum limit
will activate the reactor safety system. Before these systems can be de-
signed, specific instrumentation and control requirements for each process
system must be specified.
A scoping study was undertaken to identify the requirements for instru-
mentation and contLol. These requirements are discussed below for some
selected process £?> -items.
A. Tokamak EPR PI sma Diagnostics
Plasma diagnostics will pose many problems for EPR because of the high
accuracy required for plasma measurements and the many constraints imposed.
Some of these constraints are: (1) high radiation levels will interfere
with the operation of ionization-sensing devices such as scintillators and
solid state detectors, (2) high radiation levels will activate diagnostic
equipment and make adjustment, calibration, and repair difficult, (3) high
magnetic fields will necessitate shielding, and (4) the dimensions of the
toroidal magnets require most equipment to be physically far from the plasma. In
XI-1

a d d i t i o n in these I M I J S tder.u i o n s , .ill d i a g n o s t i c s s h o u l d :>«• tullv uper.i-
l i u n a l w h e n the 1'i'R is sirs t turned m i , S J that v.t I u.t';> 11: Lira*- is :mt w a s t e d
lici'.i«Si' of these (.'orr.p.ir.tt i v e l v ) iiu-xpi-n-; i vi- .• lenient .*:.
A l t h o u g h iho o s p e r iesu V >>,ui:ii?<l In i T T K e K!>e r i m e n : s w i l l h e usseiiti.il in
d e v e l o p i n g d i a g n o s t i c s for Ki'H, liite|;r.tied radial inn levels w i l l be c o n s i d e r -
a b l y h i g h e r in KI'R, a n d t h i s will i m p o s e a d d i t i o n a l pn>M«.-ras, !iii- wo'it
s e r i o u s seenus u> be chat x-r.iv,-< fruns s » s tatnutl runttiti).' >" •''!'." li'inpei'.tt m'es
(I • r> k e V , tXise • ID — — ) will v a u s c Ivr-iwnln^ ••! K1 .i--i.-;« whi^-h nuili!L' iff 1
make the Thomson scattering optics useless. Thus, although nwaMurementM
I'.IH be made during startitp, this svstem must be careful ly shii-hied i roni hot
plasma during tlie burn.
A preliminary survey of clu' basic plasma measurements shows thai il
will be difficult to obtain much information from the interior of the plasma
during a thermonuclear burn, other than that given by neutron and x-ray
fluxes, and x-ray measurements will be difficult" due to the high neutron
flux. This will make, study of plasma stability, temperature profiles, etc.,
very difficult, 1'lasmn diagnostic requirements are shown in Table XI-1,
The plasma position could be sensed and controlled by moans of a system
simila, to that used in the CLKO tokamak. The position of the plasma can be
sensed both by magnetic loops and x-ray measurements, and this information
can be processed by a computer which controls trimming coils, which are able to
provide a small vertical or horizontal magnetic field in the plasma. All
these coils should be close to the first wall so that the magnetic field can
penetrate quickly from tt.e plasma to the sensing coils and from the control
coils back to the plasma.
Eddy currents in the blanket/shield (which has a magnetic time constant
of *v< 50 ms) will also cause some problems with magnetic probes; and the
first wall and blanket near these probes may have to be designed to minimize
eddy current effects.
Data collection and handling from all diagnostics and control circuits
will also be a major problem, as all data reduction will have to be done on
line. Recent experience in high data rate experiments in high energy physics
XI-2

Table X I - 1 , Plasma D i a n n u s t i c Rt.-uuiremi.Tits
Plasma Parameters
Plasma Current (Total)
Current Density Disc.
Electron Drill VelocityPtiloiital Field
Plasma Pus it iuiiPlasma Loop Voltage
Plasma Pressure
Plasma Density (Average)
Lui al Electron Density
Density Fluctiiat ions
Average T. (core)Local T. l
Fluctuations in T
Average TeLocal ToFluctuations in Te
Impuritv Concentrationt(r,t)'
Impurity Identity
Space Potent ial
Neutral Density (core)Neutral Density (edge)Neutral Cas Pressure
Neutral Energy Spectrum
(normal burn and in-
jection)
Integrated Burn IntensityBurn IntensityFluctuationsNeutron Energy S trum
Runaway Properties
Start-up
it
o
1)
It
o
u
oo
I.,
o
o
o
o
o
o
o
o
ooo
o
0
Burn
oo
o
o
u
N
N
N
N
OC
X
o
o
o
oo
o
o0
o
o
o
Diagnostic Techniques
Rogiwski Coil
Charged Particle Probes
TMagnetic- Probes
Cosine and Saddle Coils, XLoop
Dianuignet ic Loop
X, S, T, I, Injected Neutr..'..s
and Ions
T, 1, Injected "eutrals and Ions
Injected Neutr »s and Ions
M, C, P
M
M .1'
T, XTX
X
X
Injected Ions
Charge Exchange
Charge Exchange
Fast Ion Gauge
Neutral Analyzer
Neutron MonitorsNeutron MonitorsNeutron MonitorsNeutron Monitors
Hard x-ray detectors, pulse
height
o = All listed diagnostics give someinformation
N = Neutron production will be primarysource of information
X = X-ray measurements
S = Synchrotron Radiation
T = Thomson Scattering
M = Microwave Scattering
I = Interferometers
C = Charge exchange
P = Production of neutrons from T + T
XI-3

has ri!u>wi» that thf most el If I d u n t fontrul .mil monitoring systems ,,e rural ly
require many small spec ia l i zed mini-computers and hard-wired rounuir-
c u i t r y . These .systems are generally super ior to a few la rger , general
purpose computers because cnmput.it ion can proceed it1, p a r a l l e l , and the
individual systems can be designed to optimize specitii- typrs >f data
co l l ec t i on and computation, CAMAC systems seem to provide the required
f l e x i b i l i t y for handling a variety of monitoring, cont ro l , and data mins -
ter problems. If the majority of control c i r c u i t r y yan He done with stan-
dardised CAMAC systems and with modest extensions ot C.AMAC, using micro-
processors in control l og i c , then designs wi l l he s i tn;> l i t i«-vl.
In the next few y e a r s , i t may he poss ib le to Incorporate large , fast-
buffer memories in d e t e c t o r s . This might simplify prol-lems such as re-
ducing TV-type scans of op t ica l Information to a more manageable and use-
ful d i g i t a l form.
Considerable research and development i s already underway towards de-
veloping diagnostics and data systems for TFTR, and the r e s u l t s of this pro-
gram wi l l apply d i r ec t l y Co the Et'R.
^• i ' i r s t Wall, Blanket and Shield Systems
The instrumentation and control components for the blanket and shield
cooling system are comparable to re la ted conventional pressurized l ight water
reactor {LWR* components. The environment in which these components must
operate is similar to that in LWRs, except that in some locat ions the EPR
neutron flux may be severa l times greater than in an LWR. The presence
of t r i t i um wi l l s q u i r e equal or be t t e r s e a l i n g , and the v ibra t ion and
mechanical shock may be many times that experienced in LWRs,
Thermocouples (room temperatures to 1200°C) are used to measure the
temperatures of the f i r s t wa l l , blanket and shield wal ls , as well as the
coolant water in lu t and ou t l e t temperatures at the individual block mani-
fo lds . Since there are over 500 f i r s t -w a l l coolant panels , 272 blanket blocks
and 416 shield blocks, there wil l be a minimum of 5000 thermocouples for
the d i r e c t control funct ions . Since access to the reactor i s d i f f i c u l t ,
redundancy in a l l key instrument sensors i s required. Additional thermo-
couples are needed for d iagnost ic data to help in locat ing fa i l ed components.
Temperatures are measured a t the la rge , 15 cm diameter coolant pipes
XI-4

i-..tcrii»i', and leaving cii<- rcic-or, and at heat exchangers, tanks and other
primary and secondary coolant system components. The total number of
tliirrEwoiinles associated with the cooling system may well exceed 15,000,
All thf thermocouple output woes to the Data Acquisition System, while
only key data will no to the Reactor Control System and the Reactor Pro-
tection System.
The major problems expected will be in the temperature sensing system.
Die principal uncertainty with respect to thermocouple response relates to
effects on signal output of very large magnetic fields and ot" radiation
damage. Induced currents in thf wires may give unreliable temperatures
and calibration could change as a result of neutron damage to the alloy at
the hoc junction.
To measure flow rate of coolant, vonturi or turbine flow meters are
used. it is desirable to measure flaw at the inlet manifold and outlet
manifold of each block in the first wall, blanket and shield to diagnose
leaks and to provide a redundant control element in addition to tempera-
ture monitoring. A minimum of 1200 flow sensors is required. The output
from all sensors goes to the Data Acquisition System. Outlet flow data
Roes to the Protection System and inlet manifold flow data goes to the
Control System. Loss of flow as measured by the outlet manifold may require
protective action, while low inlet flow may require just flow control adjust-
ment.
Coolant pressure measurements on both the primary and secondary coolant
systems are required. Because the systems must be pressurized to prevent
boiling during operation, the absolute pressure must be monitored con-
tinuously. Since pressure drop measurements are important as diagnostic
data as well as in the control function, reliable pressure sensors must be
used. Many types have been used successfully, including eddy current devr.ces
and piezo-electric devices. If these devices can be placed in regions of
moderate magnetic field and low neutron flux, as expected, then no major
problem should be encountered.
Conventional nuclear reactor sensors are required to measure neutron
and gamma radiation at various locations in the reactor. Radiation flux
mapping is used to evaluate actual vs calculated dose for component life-
time and induced activation. These data are used also to meet experimental
XI-5
and diagnostic needs. Radiation measurements in the blanket and shield of
the EPR, uallke fission r.actors, are not as critical for control, but they
could be used as a backup (or diverse) signal for the Reactor Protection
System,
Conventional radiation sensors face the same problems as those presented
for the diagnostics, viz. high radiation fields, high magnetic fields and
difficult access, particularly at the inside of the torus.
Other instruments required are those for the measurement oi }iquid level,
pH, mechanical displacement and radioactivity, as well as those to ''.etect
Leaks and to measure the effects of vibration and mechanical shock.
The total number of sensors required for the first-wall, blanket and
shield cooling system may exceed 25,000,
C. Tritium Facility
Reliable operation of the tritium handling facility for the EPR will
require a wide variety of monitoring and diagnostic equipment. Atmospheric
and purge jacket tritium detection systems with fast response characteristics
will be used to effect fully-automated emergency shutdown procedures in the
event of any significant unscheduled tritium releases. Btn-^use of their
proximity to the reactor itself, many of these monitoring systems will have
to operate with high sensitivity in a fairly intense nonuniform radiation
background (mostly gamma). Other types of diagnostic equipment will be in
continuous use to monitor fuel cycle processor performance. The fuel cycle
instrumentation must be capable of quantitative discrimination to determine
fuel stream composition, isotope ratios (H/D, H/T, T/D), non-metallic element
concentrations, temperature, pressure, flow rate, etc. Because of the need
for rapid fuel turnaround (to avoid a large tritium inventory), the fuel cycle
control system will be a fully-automated programmable unit equipped with
a high-speed feed-back logic network. Included in this network are all
pressure, temperature and flow control hardware (valves, pumps compressors).
The cryogenic distillation columns, which comprise the isotope enrich-
ment casacade, will be equipped with individual temperature and total pressure
controls. Temperature control requirements are roughly ± 0.01°K for tem-
peratures in the range from 20 to 30°K. The adjustability of column
XI-6

temperature profiles, total pressures and reflux ratios will permit retro-
fitting of column performance to accommodate variations in i:tput stream
compositions.
The nature of the failure response systems remains to be clearly defined,
but undoubtedly these systems must be capable of detecting and mitigating
all plausible fuel cycle malfunctions. This includes; (1) isolation and/or
complete shutdown of the affected systems to minimize tritium releases to
the purge circuits, the reactor hall and, ultimately, the environment; (2)
start-up of or acceleration of appropriate clean-up systems; and (3) incident
surveillance and analysis to evaluate the nature and extent of the malfunction
and to p.-ovide guidance in selection of the requisite corrective actions.
D* Plasma Support Systems
For the plasma support systems the reactor control system performs two
basic functions: (1) process control in vihieh electrical and mechanical
transducers are used to monitor temperatures, liquid levels, etc., for the
purpose of making automatic or manual adjustments to maintain proper support
for operation of equipment, and (2) functional command in which timing pulses,
voltage and power levels, etc., are instantaneously controlled as part of
the total fusion operating sequence. The reactor safety system is designed
such that some form of fault protection triggers an immediate chain of
events to bring equipment to a safe quiescent state in the shortest practical
time.
The process control system would use standard measuring instruments
such as pressure transducers, voltmeters, current shunts, thermistors,
liquid level indicators, etc. Information would be collected with a
sample-and-hold computer system updated at a rate consistent with suitable
performance of operating equipment. Process-type crr.trol is needed on
most plasma support systems. Some systems, such as gas pressure and arc
current in the neutral beam source, need functional response from the
monitoring system to improve operating conditions. Other systems, such
as cryogenic liquid le>/el in the vacuum pumps, require start-stop control
based on threshold indications.
XI-7

Timing and active feedback are two basic types of functional con-
trols. Timing control for proper phasing of various functions during the
fusion reactor cycle come from a master controller, usually in the form
of logic level signals which can be manipulated wichin the controlled de-
vice. Active feedback control is needed on many systems. For inscanc3,
the switching"frequency and relative phasing between-bridges on the EFC
inductor-converter art: a, function of the instantaneous plasma current
and temperature. Ttiis type of control must be accomplished with in-
stantaneous error, correct ion between reference requirements anc1 fast-
scting transducers.
The emergency safety controls use the same typo of measuring equip-
ment., voltmeters-, -current shunts, etc., that: are used for process control.
. Emergency safety controls respond immediately upon activation, rather than
.waiting for-a computer update- Signals such as voltage transient in the
EF-inductor-converter or vibxaticm detection on the homopolar generators
isust produce an immediate chain of events Co avoid or minimize damage to
equipment anc personnel•
E. Magnet System ._
An EPS, magnet system consists of the TF coil, OH coil and EF coil,
Lhe cryostats for these coils, the helium refrigeration/liquification and
its associated cryogenic liquid/gas storage and handling system, the
vacuum system, the power supply, and instrumentation and control systems.
The instrumentation and control system will adjust process conditions in
both transient and steady state operation, detect system malfunctions,
trigger alarms, and interlock with the protection systems. The instru-
mentation and control system will serve to monitor and control the magnet
and cryostat cool-down, the checkout of each subsystem, the normal opera-
- tion of rhese systems, and th^ failure protection and the safety pre-
cautions for these svstems.
The monitoring parameters for a superconducting coil- are the
temperatures of coils, the terminal voituge and current, the magnetic
field, the sti'ain in the conductor and reinforcing structural material,
XI.-8
the current lead pocential, temperature and gas flow. The monitoring
parameters for a magnet cryostat are the insulation vacuum, the pressure
and temperature in the liquid nitrogea vessel and in the liquid helium
vessel, the liquid level of nitrogen and helium, and the strain in the
cryostai. structure. The monitoring parameters for the refrigerator
liquifier facility are the pressure and the temperature of the expansion
engLn? and the Joule-Thompson expansion valve, the pressure and. tem-
perature indicators for compressor operation, t-he pressure in the high
pressure gas tank* the pressure and liquid level in the liquid helium
storage dewar. The monitoring parameters for the magnet energy dumping
system are the voltage across the discharge resistor and the water-level of
Che dumping, resistor. Table XI-2 lists the system component, the parameter
monitored, the type of sensor and the sensor location,
For the magnet and cryostat cool=down, the monitored parameters re-
quired include the temperature at various locations within the coils, the
pressure and temperature in the radiation shield vessel and the helium vessel,
the insulation vacuum, the coolant transfer rate, the key normal parameters
for operation of the cryogenic facility and liquid level of the liquid
nitrogen and liquid helium in the cryostat and storage dewar.
In the magnet, cryostat and power supply protection system, some of the
necessary alatii^d'interlocks in the control room are listed in Table XI-3.
It is important to point out that the most dangerous hazards for both TF
coils and peloidal- coils are the open circuit, arcing and the coupling
effect of the poloidal coil system. The latter requires additional study
in order to offer reasonable protection and precautionary measures. The
effect of poloidal fields on the TF coil must be thoroughly investigated
before a meaningful instrumentation'and-control system can ba designed.
1. J. F. Kircher and R. E. Bowman, Effects of Radiation on Materials andComponents, Reitthold Publishing Corp., New YMik (1964), p. 372.
Z. K. Young, PPPL, private communication, 1976.
3. J, Hugill and A. Gibson, "Servo-Control of Plasma Position in Cleo-Tokamak," Niv. Fusion, 14_s 611 (1974).
XI-9

Table XI- 2. Instrument Requirements for the Magnet System
System Components
Magnet Colls
Magnet Cotls
Magnet Colls
Magnet Colls
,. Magnet- Coils
Current. Leads
Current Leads
Current Leads
Magnet I'ryo-u it
Magnet Ccyostat
Magnet Crvostat
Magnet Cryostat
Magnet Cryostat
' Magnet Crvoht.it
Mar.net Crwiral
1 Magnet Cryostat
( Cryogenic Facility
Cryogenic Facility
Cryogenic Facility
Cryogenic Facility
Cryogenic Facility
Cryogenic Facility
Cryogenic Facility
Cryogenic Facility
Cryogenic- Facility
Knergy Hump ing
System
Energy Dumping
System
MoniLC>rint',
Parameters
Temperature
TerminalVoltage
Hague t
Current
Magnet Field
Conductor
Strain '
Temperature
VoJ cage
Cas Flow
V.i' uum
Pressure
rompt-r.it urt
Liquid Level
Pressure
1 Icju Id I.eve 1
St rain
Pressure
Temperature
Pressure
Temperature
Pressure
Temperature
Pressure
Liquid Level
Pressure
Voltage
Water-Levc1
Sensors
Carbon Rosistor/l1
Rests tor/Tliormocoiipl e
Potential Taps
Magnet Current
Transducer/Slmnt
tldll Probe
Foil Strain dauge'
riiermocouple
Potential Tap
Mass Flowmeter
V.icuum Cauye^i
Bourdon Gauge
Thermocouple
Oxvgen C.is in
Bellow F.nclosurc
Bourdon Gauge
S'hl'i wire
Foil Strain Range
llrldge Transducer/
Boughton Gauge
Silicon Diode
Bridge Transducer/
Bouju'hton Gauge
Silicon Diode
Bouglitun G.iuge
Thermocouple
BoughtonGauge
Nb-Ti Wires
Hough ton (inugt;
Digital Voltmeter
Any Floating Substnnce
Sunsor t.ucndon
Several Places inWinding
Magnet Terminal
Current Lead
Anv convenient
location
Htgli Strain Lo-
cations"
Top and-Bottom Ends
Top and Bottom F.ndH
Gas M-inlfold
Crvostat (Hiter
Shell
l.N> Rsbit-rvulr
K.idiitlon .itilelds
LN2 Reservoir
LUe vessel
I r 11 \ IV Ai C? O A 1 1LiilL vt SJJL I
Lite vessel
Magnet Structure
Support
Expansion Engine
Expansion Engine
J-T Valves
J-T Valves
Compressor Highand Low Pressureside
Compressor
Gas Storage Tank
Stnrage Pewar
Storage Dewar
Dumping Resistor
Dumping Water
Tank
XI-10

Table XI-3. Toroidal Magnet Alarm and Interlock Actions
I. Abnormal Function Alarm
1. Pressure of insulating vacuum exceeds 10 ' Torr.
2. Abnormal helium supply dewar pressure.
3. Liquid helium at cryostat "Emergency" low level.
4. Helium level below the coil end,
5. LN-, shield temperature high - select the sensor at the hottest shieldtemperature region.
6. Low dump resistor water level.
7. Power supply series diode temperature exceeds a certain limit.
8. He gas mass flow rate for magnet leads below a certain amount aftermagnet is fully charged.
9. Voltage across magnet leads exceeds a certain limit.
10. Magnet lead temperature at room temperature end exceeds a certaintemperature value, e.g. 30"C,
11. Resistance ir. uppermost conductors exceeds a certain value corres-ponding to conductor temperature of 15°K,
12. Magnet energy discharges through discharge resistor Rg.
II. Conditions Which Warrant Magnet Energy Discharge
1. Pressure of insulating vacuum exceeds 1 x 10 Torr.
2. Magnet lead temperature at upper end exceeds 40"C,
3. Temperature in uppermost conductors exceeds a hot temperature limite.g. 273°K.
4. Normal region developed in such a degree that V exceeds 1 V.K
I I I . Conditions Which Require Power Supply Shutoff
1. Over operational current by 0.5%.
2. Power supply series diode temperature too hot.
3. Charging voltage exceeds certain maximum which will be establishedduring magnet testing.
XI-11
CHAPTER XII
REACTOR ENGINEERING SYSTEMS
Three major engineering aspects of Che EBR are herein described;
Chose associated with reactor component support and torque reactions:
Che assembly of the reactor, its requirements, sequence and schedule;
and the remote maintenance systems, The development requirements for
Chese systems are also described briefly. With exception of the magnet
support and torque frame which was studied at some length, the systems
descriptions are brief, mostly addressing a design approach that offers
potential solutions to all major systems requirements.
A. Structural Support 5ya terns
Two areas of structural support are described; those associated with
the blanket, shield, vacuum vessel components; and those structures
supporting the various magnet coils,
1. Blanket/Shield System Support
Support of the blanket/shield system is made through sixteen welded
beam trapezoidal shaped structures mounted horizontally on adjustable
columns (32 total) to a sub—basement area (see Figure XII-1). Each struc-
tural unit supports 1/16 of the weight of the reactor and can be indepen-
dently lowered and raised approximately 2 meters to facilitate assembly and
replacement of blanket and shield blocks. The upper portions of the support
frame within the influence of the magnets are made of stainless steel.
Each support frame has five support struts which contact the lower shield
blocks. The shield blocks are attached to the frame through electrically
insulated fasteners. The lower portions of the blanket nests as a lining
in the lower shield and, through insulated roller pads, supports the reactor
vacuum vessel (Figure IX-24). Remaining blanket and shield blocks are joined
in an arch-like support encasing the upper portion of the vacuum vessel.
The total support of the blanket, shield and first wall system, (a total
weight of ^ 8000 tonnes, is carried through these supports to the building
foundation pad.
XII-1

I
ADJUSTABLE COLUMNS —
Figure XII-1. Shield Support Framework

I
I Attached reactor ancillary components such as the crysorption pumps
of the vacuum system and the neutral beam injectors are supported inde-
| pendently of the shield. The upper vacuum pumps rest on supports attached
to the magnet support frame. A bellows provides the flexure required for
operating thermal expansion.
The neutral beam injectors are structurally separated from the reactor
through an accordian shaped bellows mounted in the interconnecting duct
with the injector weight being supported by the reactor floor. If necessary
the injection apparatus may be programmed to follow the first wall vessel
thermal expansion to minimize beam alignment problems.
2. Magnet Coil Structural Support
Two structural support concepts, a torque shell design and a torque
frame design, were developed and analyzed. Both provide support for the
poloidal and toroidal field coil magnets. These concepts differ primarily
in their method of restraining the large lateral forces induced on the
toroidal field (TF) coil. Detailed definitions of these designs, compo-
nent weight, induced loads, materials considered and the analvses conducted
in developing these concepts are provided in Appendix D and in Reference 1.
a. The Torque Shell
The torque shell concept shown in Figure XII-2 uses 16 shear webs to
provide continuous support for the TF coil and to accommodate the large
torques induced on the TF coils. Other major features include an overhead
tree for support of the upper poloidal coils, an outer support system for
the large poloidal coils, a lower poloidal coil support frame with a build-in
rewinding facility and four lateral stabilization fittings which attach to
I the shear panels to provide stability for any unsymmetric loads. The upper
and lower outer poloidal coils can be raised or lowered respectively to
j permit the removal of a TF coil.
*Work performed by McDonnell Douglas Astronautics Company - East.
XII-3

OVERHEAD POLOIDAL COIL SUPPORT TREE
MI
OUTER POLOIDAL COILSUPPORT COLUMN
(16 REQ'D.)
POLOIDAL COILS
TF COIL
LOWER POLOIDAL COILSUPPORT
BLANKET/SHIELD SUPPORTCOLUMNS
(32 REQ'D.)
REWINDING PLATFORMS
UPPER ACCESS PANEL
OUTER POLOIDAL COILSUPPORT FITTING
VACUUM PORT FITTING
CENTRAL ACCESS PANEL(TORQUE SHELL)
NEUTRAL BEAM FITTING
STABILIZATION FITTING(4 REQ'D.)
TF COIL VERTICAL SUDPORT COLUMNS
REWINDING SPOOL
Figure XII-2. Torque Shell Structural Support

shear web consists of an upper, lower and central access panel.
The panels have single curvature and attach to the center of the TF coil
through a flange that is butt welded to the coil cryostat. These panels
are bolted in place through match drilled holes. Normal maintenance will
be accomplished by removing the central access panel. This removal is esti-
mated to take n- 4 hours. To minimize the impact on overall maintenance
time, panel installation/removal will be performed in parallel with other
maintenance operations. The level of radiation at the external surface of
the shear panels is expected to be low enough to allow removal of the
fasteners with a minimal amount of radiation protection if the blanket and
shield are left intact. Support is provided for the vertical loads of the
blanket/shield and TF coil using the same concepts as described for the
torque frame. The outer poloidal coil support is also similar to the torque
frame with supports provided on the columns for the vacuum pumps.
b. Torque Frame Concept
This concept was analyzed as a design option. It uses a frame and
shear panel combination to accommodate both the large torque induced at
the top of the TF coil and .Tie large vertical forces induced in the upper
poloidal coils. A similar frame and shear panel structure is used to support
the lower poloidal coils and to accommodate the torques induced at the bottom
of the TF coil. These frames are shown in Figure XT.1-3.
The upper torque frame consists of a shear plate to which concentric
rings are attached that provide continuous support for the upper poloidal
coils and support the TF coil lateral forcp.s at 8 points on each TF coil.
Support for the vertical loads of the poloidal coils is accomplished by
radial beams which rest on the center concrete core and are supported around
the periphery of the reactor by the outer support columns located at each
TF coil. These outer support columns also provide support for the outer
poloidal coils.
The blanket/shield and first wall are supported by a frame which is
provided as part of the Primary Energy Conversion System (PECS). This frame
is supported by 32 columns mounted in the floor of the lower access pit.
The 4 lower poloidal coils are supported by a frame assembly that attaches
to the blanket/shield support columns. This frame transfers the upwaru
XII-5

CENTER CORE-
SHEAR WEB
BLANKET/SHIELD SUPPORT FRAME
TF COIL LOWER LATERAL RESTRAINT
LOWER COIL TORQUE FRAME
BLANKET/SHIELDSUPPORT COLUMNS
REWINDING PLATFORM
JID TORQUE FRAME
TENSION TIE{4 REQ'D)
OUTER POLOIDALCOIL
SUPPORT COLUMN
COIL UPPER LATERALRESTRAINT PAD
TF COIL
TF COIL VERTICALSUPPORT
REWINDING SPOOL
Figure XII-3. EPR Torque Frame Structural Support

acting induced coil forces to the support columns during reactor operation
and supports *iie dead weight loads of the coils. Since the coils are
captured by the support columns, jacks are incorporated to allow lowering
of the support beams and coils for eepair. A separate support is provided
for the four upper poloidal coils which consists of sixteen beams that span
between the center core column and the outer poloidal coil support columns.
Cross members provide continuous support for the poloidal coils. The two
sets of outer poloidal coils are supported by fittings attached to the outer
poloidal support columns. Each column incorporates a set of janks (elevators)
which allow raising and lowering the outer coil support fittings for addition-
al access. The fittings also serve as a handling fixture, in that the over-
head crane can be attached to pick up the assembly if coil removal is re-
quired for repair.
The 16 TB coils assemble into a common cryostat around the center column
of the reactor. Support for the cryostat is provided by the use of 8 columns
located around the center core and 16 additional vertical supports, one lo-
cated under the outer portion of each coil.
Lateral TF coil forces are transferred into the torque frame by the
lateral restraint fittings and are in turn transferred by the torque frame
to four primary tension members. These four members are located in a hori-
zontal plane approximately 15 m above the floor and extend 38 m to
the outer wall of the reactor building. These tension members are pinned
to the upper torque frame and can ba readily disconnected and placed in
storage positions against the building wall. Normal maintenance operations
(those requiring less than 15 m overall height) can be performed without
removing these members.
The lower torque frame is similar to the upper frame except it is lo-
cated between the TF coil and the lower poloidal coils. This frame location
allows lowering of individual coils to the rewinding turntable without dis-
assembly of the structural frame. The shear plate for this frame is offsot
slightly to allow clearance of the TF and lower poloidal coils. This frame
is supported in the vertical direction by the blanket/shinld support columns
and ties to the access pit wall. By releasing of '.hese supports, the
frame assembly and magnets can be lowered to allow magnet repair. Both
the vacuum pump and brackets must be removed prior to lowering the magnets
for repair.
XII-7
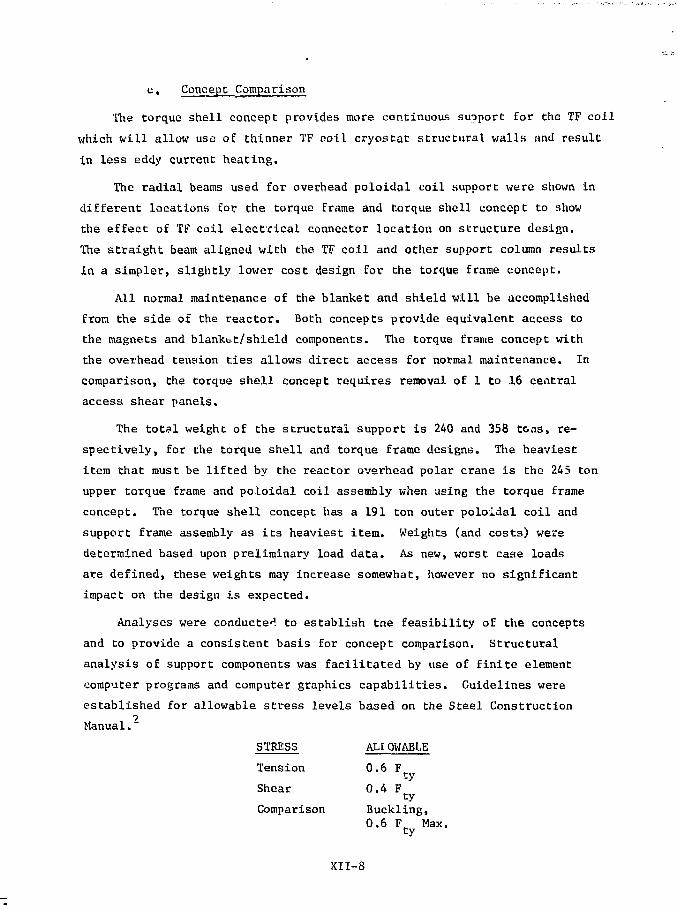
c, Concept Comparison
The torque shell concept provides more continuous support for the TF coil
which will allow use of thinner TF coil cryostat structural walls and result
in less eddy current heating.
The radial beams used for overhead poloidal coil support were shown in
different locations for the torque frame and torque shell concept to show
the effect of TF coil electrical connector location on structure design.
The straight beam aligned with the TF coil and other support column results
in a simpler, slightly lower cost design for the torque frame concept.
All normal maintenance of the blanket and shield will be accomplished
from the side of the reactor. Both concepts provide equivalent access to
the magnets and blanktt/shield components. The torque frame concept with
the overhead tension ties allows direct access for normal maintenance. In
comparison, the torque shell concept requires removal of 1 to 16 central
access shear panels.
The tot#l weight of the structural support is 240 and 358 tons, re-
spectively, for the torque shell and torque frame designs. The heaviest
item that must be lifted by the reactor overhead polar crane is the 245 ton
upper torque frame and poloidal coil assembly when using the torque frame
concept. The torque shell concept has a 191 ton outer poloidal coil and
support frame assembly as its heaviest item. Weights (and costs) were
determined based upon preliminary load data. As new, worst case loads
are defined, these weights may increase somewhat, however no significant
impact on the design is expected.
Analyses were conducted to establish the feasibility of the concepts
and to provide a consistent basis for concept comparison. Structural
analysis of support components was facilitated by use of finite element
computer programs and computer graphics capabilities. Guidelines were
established for allowable stress levels based on the Steel Construction
Manual."
STRESS ALIOWABLE
Tension 0.6 F^
Shear 0.4 Fty
Comparison Buckling,0.6 Ffc Max.
XII-8

These stress levels were applied in conjunction with maLerial yield
stresses with the induced magnet loads and dead weight loads without addi-
tional factors of safety. The effect of fatigue for 1 million cycles did
not require additional reduction in the allowable stress level. The stress
levels used are compatible with the structural design criteria per ASME3
Codes III, Subsection NF - Component Supports, for both design concepts.
The torque shell concept has been tentatively selected as the reference de-
sign option.
B, Reactor Assembly
A stepwise plan for assembly of the reactor was developed and the initial
requirements and preassembly status were defined to aid in generating the
assembly schedule. This was a valuable planning exercise for it provides
insight in defining requirements and specifications tor various types of
remote handling equipment, maintenance operator skills, ancillary mockup
apparatus, storage and assembly space allotments etc. as well as portinent
initial component design input.
1, Prerequisites - Pre-assembly Status
The reactor building is under roof with reactor pedestal installed, and
300 ton capacity overhead crane and sub-reactor assembly equipment leadied.
The remote maintenance building is under roof with a mock-up of the reactor
( 1/5 segment of torus) available for demonstrating actual procedures for
installation and assembly of all reactor components. Three toroidal-field
coil production lines capable of supplying one coil each, complete with
cryostat, every 40-50 days are provided on site, with 225-ton crane access
to the entrance to the reactor building. Inside the reactor building
a coil winding apparatus is being set up for the 80 foot diaiuotsr equilibrium
and ohmic-heating coils (weight to 150 tons).
On hand are the reactor center-core support, the inner and lower
ohmic-heating and equilibrium coils, at least one of the finished toroidal-
field coils and the prefabricated pieces of the center toroidal-field coil
system, vacuum wall and various magnet restraint and support structures.
XII-9

2. Assembly
a. Initial Assembly
The inner core support structure is positioned and secured (Step 1,
-Figuii-Xtl-4), and the-lower-inner EF coils and OH coils ate-lowered into
a lower holding position below the support structure' (Step 2, Figure Xll-4a),
There id no way to install these pieces" after-the T^ coils are 'mounted
without winding them in place.
The first TF coil is brought into position and mounted permanently "
against the inner support column {Step 3, Figure XII--4). Thin procedure
is followed by the second, third and fourth TF coils installed at the rate
of one every 40 days, wh'I?h includes frequent interim tests and integrity
- cheeks-to-guarantee quality of every step of fabrication. The central core
OH. solenoid is installed and the central vicuum jacket is attached, and the
TF coils are positioned as they are delivered (Step 4, Figure XII-4).
Delivery of the prefabricated sect tons of Hie first wall (1/4 seg-
ments;) is made with accompaning pieces of the blanket and shielding blocks.
The shield support structural frames and columns, along with the lower
magnet support/torque frame are also on hand. -
Procedures will be established for removal and reassembly of each
component and assembly process (e.g., welding, fitting, adjustment, etc)
in preparation for any repairs or modifieations necessary once the reactor
has been operated and becomes inaccessible to direct personnel contact be-
cause of long life material activation.
b. Intermediate Assembly
After four of the TF coils have been installed, a 1/4 section of the
first wall is threaded through the assembled TF coils and supported in
place (Step 5, Figure XII-5). Assembly of the TF coils continues as rapidly
as possible in parallel with the first-wall installation. With the.first-wall
section held in position, the support structures and lower portions of
the blanket and shield are installed using procedures and apparatus de-
veloped from the tnocl'Up. The lower sections are followed by upper section
-installation. All pieces are tested as they are installed.
XT.I-10

»
w
n)
IDM0
KII-11

SUPPORT FRAME-
XMMI-"
LOWER BLANKET iSHIELD BLOCKS
VACUUM VESSEL ~<~~
VACUUM VESSELSUBASSEMBLY
-LOWER EF 4 OHCOILS
STEP 5
OUTER EF 4 CHC O I S
[ UPPER OH & EF' COILS
SLPPORTCOLUMNS-.
VACUUM PORTEXTENSIONS
BLANKET
"HiELD
-LOWER COILSUPPORTSTRUCTURE
COMPLETED UPPERBLANKET & SHIELL!SEOWENTr
VACUUM PORTS -
VACUUM VESSEL
-LOWER BLANKET
SUPPORT FRAME
/ ~ T F CCHL
VACUUM VESSEL- -SUPPORT FRAME
STEP 6
UPPER
NEUTRAL BEAMINJECTOR -v
SUPPORT
VACUUM PORTPLUG MECHANISM
y VACUUM• ASSEM&L
STER7 STEP 6
Figure XII-5. Reactor Assembly Sequence

With a 1/16 portion of the torus covered with blanket and shield, the
vacuum port extensions with their associated valving are installed
The assembly continues by installing three to four TF coils, then a
1/4 section of the first wall, adding blanket and shield sections, and
installing vacuum ports until only two TF coils and a final 1/4 section of
the first wall remain. Each quarter section of the reactor will take
approximately 8 months to assemble, Ttie last sections are installed
by placing the TF coils close together, threading the first wall section
and repositioning the TF coils (Step 6, Figure XII-5).
Adding inner wall liners and connecting the first wall, blanket and shield
coolant manifolding proceeds concurrent with the reactor assembly.
c. Final Assembly
With the last TF coil in place and all testing satisfactorily com-
pleted, the outer 80-foot diameter EF and OH circumferential coils, which
have been fabricated within the reactor building, are positioned over
the completed basic reactor. The final coils are placed in the upper
positions and the entire magnet restraint/support system locked into
position (Step 7, Figure XII-5).
Addition of the neutral-beam duct extensions, RF neating systems and
the fuel-injector port extensions complete the basic reactor (Step 8,
Figure XII-5).
Completion of the coolant, electrical supply leads, cryogenic connections
and instrumentation and controls and diagnostic sensors prepares the reactor
for the final installation of cryosorption pumps, neutral-beam injectors,
RF heating waveguides and refueling systems; Weights of major reactor
components are listed in Table XII-1.
3. Schedule Sequence
An elipsed period of 32 months is estimated for assembling the reactor,
performance system checkout and preparations for initial operation. This
.chedule assumes too shift operation during the entire assembly period, leaving
the third shift possible for repairs and problem resolution.
XII-13
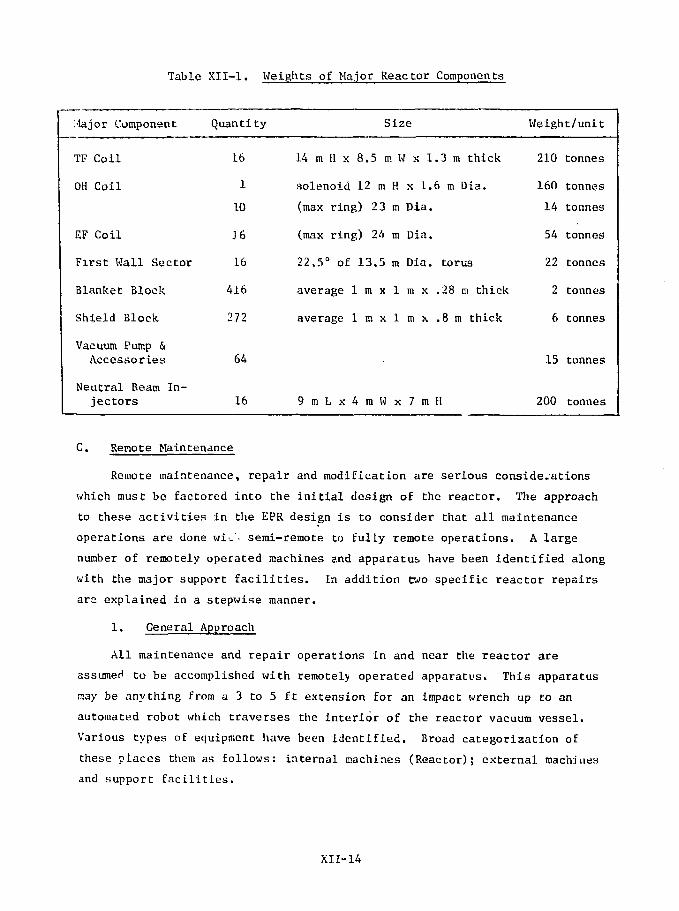
Table XII-1. Weights of Major Reactor Components
Major Component
TF Coil
OH Coil
EF Coil
First Wall Sector
Blanket Block
Shield Block
Vacuum Pump &Accessories
Neutral Beam In-jectors
Quantity
16
1
10
16
16
416
272
64
16
Size
14 m H x 8.5 m W x 1
solenoid 12 m H x 1.
(max ring) 23 m Dia.
(max ring) 24 m Dia.
22,5° of 13.5 m Dia.
average 1 m x 1 m x
average 1 m x 1 m x
9 m L x 4 m W x 7 m
.3 m thick
6 m Dia.
torus
.28 tn thick
.8 m thick
H
Weight/unit
210
160
14
54
22
2
6
15
200
tonnes
tonnes
tonnes
tonnes
tonnes
tonnes
tonnes
tonnes
tonnes
C. Renote Maintenance
Remote maintenance, repair and modification are serious considerations
which must be factored into the initial design of the reactor. The approach
to these activities in the EPR design is to consider that all maintenance
operations are done wi-'. semi-remote to fully remote operations. A large
number of remotely operated machines and apparatus have been identified along
with the major support facilities. In addition two specific reactor repairs
are explained in a stepwise manner.
1. General Approach
All maintenance and repair operations in and near the reactor are
assumed to be accomplished with remotely operated apparatus. This apparatus
may be anything from a 3 to 5 ft extension for an impact wrench up to an
automated robot which traverses the interior of the reactor vacuum vessel.
Various types of equipment have been identified. Broad categorization of
these places them as follows: internal machines (Reactor); external machines
and support facilities.
XII-14

a. Support Facilities
The major support facility..is the. full, size 1/5 to 1/4 segment mockup
of the reactor. This facility is the focal point of all assembly, disassembly
and repair work on the reactor, beginning with the start of reactor assembly.
All procedures, assemblies, machines and techniques will be established on
this mockup prior to any final reactor installation or assembly. The tnockup
is kept available at all times, and maintenance tools and procedures are
practiced prior to reactor activities.
Two l -•*• cells and a neutral beats test stand are provided for maintenance,
examination and repair of radioactive reactor components, Basic coil
winding facilities are provided beneath the reactor to rewind OH and EF
coils that cannot readily be removed. The polar craite has a special,
shielded, manned carriage fitted with apparatus for manipulating reactor
components safely in high radiation background.
b. Internal Machines
Several pieces of apparatus are specially designed to handle maintenance
and repair of the reactor vacuum vessel. Since the vessel is permanently
mounted all major maintenance operations will be performed with remote oper-
ating machines working inside the vessel. Four experimental/maintenance
ports of 1.5 m diameter, with quick opening features, are provided for entry
of the maintenance repair equipment. Mechanical access to the reactor is
attainable in less than five hours. The vacuum and neutral beam ports
can axso be used for maintenance access.
Basic conceptual design of internal apparatus is depicted in Figure
XII-6. This consists of accordian structures positioned through the
vacuum ports to form a central rail support from which polar type manipu-
lators that reach all areas of the inner torus can be mounted. This
apparatus is supplemented with mobile cart type vehicles which are placed
into the toroidal chamber and travel on the vessel wall. The machines are
capable of inspections, removing and replacing wall panels and manifolds,
repairing the vessel wall by cutting and welding fittings, recoating the
inner surface, and other operations. All equipment is tested on the mockup
and programmed to the degree practical. All operations are observed on video
equipment while being guided by duplicate master manipulators from the mockup
XII-15

VACUUM PORTS
SECTION A-A
-TELESCOPIC MOLDING UHn
ROTATING SUPPORT COLUMN
SCANNING. INSPECTION •)
a SERVICE MACHINE
Figure XII-6. Basic conceptual design of internal remote repair machine

itself. Retrieval equipment is designed to retrieve any inserted equipment,
as a backup,
c. External Machines
Reactor maintenance is performed with three types of equipment
operating overhead, horizontal (floor mounted) and beneath the reactor,
The polar crane, bridge and special remote maintenance cab comprise the
overhead equipment. Up to 6 crane hoists and four manipulators are pro-
vided. Maintenance operations using this equipment include capability
to manipulate the reactor torque shell or frame, access panels, upper
vacuum port apparatus, neutral beam injectors, magnet power supply leads,
reactor blanket and shield blocks, coolant piping, etc.
Floor mounted equipment includes vehicle mounted snorkle type
units with both shielded and unshielded platforms for manned and remote
operation in various sizes. These vehicles will be programmable and when
trained to perform an operation on a mockup, will repeat that operation
on the reactor. Special heads are provided to manipulate, inspect, re-
pair, remove, and replace power lead connections, cryogenic lines, blanket
and shield blocks, coolant lines, and other components of reactor. Portable
shield walls are available to set up in areas where hands-on repairs are
determined reasonable.
Sub-reactor equipment is designed to facilitate operations required
beneath the reactor. Both snorkel and raised platform type equipment
are utilized. Major sub-reactor operations anticipated are: vacuum
system maintenance and repair and vacuum chamber inspection; coolant
piping removal and repair; magnet coil lead connections; and magnet coil
repairs including in situ rewinding. An access tunnel is provided to carry
radioactive components to the hot cells for repair or to storage facilities.
The presence of tritium in the reactor room is assumed, and properly
suited personnel are outfitted to operate with breathing apparatus.
(All maintenance and repair activities are performed by properly protected
personnel.)
XII-17

2. Specific Repairs
Two specific repairs have been considered: (1) repair of a section of
Che first wall which has been damaged; and (2) replacement of a lower
(difficult access) blanket block. The first wall, if i t should sustain a
rupture, would be repaired frora within the vessel in what is believed to
be a relatively simple and quick manner in contrast to disassembly of
large sections using remote operated apparatus.
Without disassembling the reactor, the following activities are required
for repair of a hypothetical 0.1 m x 0,5 m failed portion of the first wall
coolant panel and the vacuum vessel immediately behind it:
(1) Remove shield plug in one of the four 1.5 m diameter ports any time
from 3 to 6 hours after reactor shutdown and tritium decon-
tamination.
(2) Damage (leak detection) location detection activities can
begin, utilizing the external coolant circuitry. Employing both
internal and externals methods, any crit ically damaged first wall
position should be located in a matter of a few hours.
(3) Remove first wall coolant panels that are damaged or those
required to provide working access to the vacuum vessel wall
in need of repair. Special apparatus would be inserted
through the access ports to perform this task, after f i rs t
having performed all operations in the facility reactor mockup.
(4) Having uncovered the vacuum vessel wall, the damage is assessed
and a portion of the vessel wall prepared for replacement.
A pattern taken from the damaged area is reconstructed in
the reactor mockup and an entire operation of remote repair and
inspection established therein.
(5) With an established procedure from the mockup, repair of the
reactor vessel is accomplished, followed by inspections and
testing. Critical analyses is made during the interim period
to establish the limitations of the repair on future operation
of the reactor, if any.
XII-18

(6) Replacement of the first wall coolant panels and the attendant
fittings is accomplished. Testing of the panel coolant
systems would follow.
(7) Repair apparatus would be withdrawn and initial vessel testing
begins.
The overall operation described could take place within a 9 to 11 day
period without disturbing any of the other reactor systems. This relatively
short repair period is attributed to the experience of personnel gained
during the erection of the reactor and to the availability of the mockup.
The EPR system design precludes the need for the following: movement of
massive reactor segments weighing up Co 500 tons, most of which are in
operating condition and need not be disconnected; storage of Che (same)
large reactor segment; repair or replacement of the removed segments (which
would probably take considerably more reactor down time than 5 days); re-
moval or cutting and repair of EF shaping coils, OH coils and possible TF
coils and; removal of reactor accessories e.g. neutral beam injectors,
vacuum components, reactor torque frame, etc.
3. Blanket and Shield Block Removal and Replacement Procedure
Under the same general conditions prescribed for repair of the first
wall, the following procedures are required for blanket repairs. The re-
moval and replacement of a difficult to reach blanket block designated
either R or S in Figure IX-25 is designed to span a period of 7 to 9
days using the available equipment, trained personnel and spare parts.
No major disassembly of the reactor is required and the first wall
is undisturbed. Steps for removing blanket block R or S:
(1) Remove upper and lower vacuum port "Y" extension ducts and move
cryosorption pumps out of the area
(2) Disassemble upper shield blocks N, K-l, K-Z, J-l, J-2, J-3, etc.
one at a time from their coolant lines and structural supports.
Remove them through the spaces between the TF coils with equip-
ment provided.
(3) K'ith the uppjr shield removed, disconnect and remove the inner
shield block H and the blanket blocks V, W, X, Y in the same
order as the shield was handled.
XII-19

(4) Lower the shield segment assembly support structure containing
the lower blanket and shield. Disconnect and remove blanket
pieces R and S.
(5) Repair and replace blanket pieces R and S, raise lower blanket and
shield into position, connect coolant systenu and tes t .
(6) After testing replace stored upper blanket and shield blocks in
sequence testing Che coolant c i rcui ts for each. Thirty-six hours
i s the required time estimate for Steps 1-6,
(7) Replace vacuum port plug and pump assemblies and recheck vacuum.
1. C. A. Trachsel, "Development and Analysis of Support Structure Concepts,"SAN-76-51, McDonnell Douglas Astronautics Conpany - East, June, 1976.
2. Manual of Steel Construction, American Inst i tu te of Steel Construction,Seventh Edition,
3. Rules for Construction of Nuclear Power Plant Components, ASME Boilerand Pressure Vessel Code, Section I I I , Division 1, Subsection NF,1974 Edition,
XII-20

CHAPTER XIII
REACTOR AND FACILITIES
The design and layout of the reactor components into an integrated
functionable system required a substantial effort in adjusting the inter-
faces among various components and systems. Acute space limitations for
required component volume and for accessibility limited the design options
and in many cases assembly and disassembly requirements dictated the con-
figuration. Reactor design and layout problems included allowance for
placement and maneuvering (1) components between the fixed TK coil, and
vacuum vessel (e.g. the blanket and shield blocks), (2) Che twelve, large
neutral beam injectors, (3) the vacuum system components and extension
ducts. Once the reactor and adjacent equipment were arranged, the reactor
building layout was prepared. Support equipment sizing established the
need for seven other buildings for the EPR facility (Figure XIII-1).
A. Reactor Building
The reactor building is cylindrical, 73.2 m in diameter by 51.5 m high
made of reinforced concrete with a flat pad and elliptical head. The reactor
and its array of neutral beam injectors are housed in the main hall. A
250 m2 (floor space) neutral beam test facility is located within the reactor
building, complete with power supply, beam dump, shielding and remote hookup
capability. A 8 meter deep basement is used for equipment and services
supplied from externally located equipment. The wall;? of the building are
1.5 m thick and provide the biological shielding as well as structural
sup-iort (Figure KIII-2). The building features a 300 Tonne polar crane.
A shielded cab mounted on the overhead circular crane bridge is provided
for remote maintenance and inspection purposes. This unit is equipped with
a small crane, a single heavy-capacity and two standard-duty extended reach
manipulator arms. It will carry two persons in its shielded cab to a vantage
viewing area anywhere above the reactor. Both cab and manipulators will be
programmable for routine operations.
A 1 cm thick steel membrane liner provides a continuous vapor barrier
primarily for secondary tritium containment. Three cargo-sized sealed doors
and two personnel air lock doors are used for access. The reactor support
consists of a central pedestal surrounded by an annular ring abounded by
XIII-1

' •V,)B
7QW• • rAQ'..lT
Figure XIII-1. Overall Site View
XIII-2

TON CRANE - ;
GENERAL MAINTENANCEHOT CELL-, : 225 TQN CRANE /
EQUIPMENT -STORAGE
NEUTRAL BEAMTEST Af?EA =.
NEUTRAL 3EAMiHO"" CELL
REMOTE MAINTENANCE-•"ROLLEY
-STEEL UNER
SHiELDED CAB
CONTAINMENTSEAL DOOR
BASEMENTEQUIPMENT
- AIR LOCKEQUIP(v~MTPASSAGE -
MAGNET COIL-SUPPORT STRUCTURE
•-TF COIL
NEUTRAL BEAM-INJECTOR
-PLASMA
REACTOR SUPPORT-COLUMN
REACTOR I REACTOR SUPPORTEQUIPMENT L p E c e s T A LA R E A C METERS
£ C A L £
ANL EPR REACTOR FACILITYELEVATION
Figure XIII-2. Reactor Facility Elevation

XIII-4

die reactor service floor. Both pedestal and ring structure extend downward
9.1 m to a sub-building, foundation pad. The sub-reactor basement area
houses the rt" system power supplies, the TF coil energy dump resistors,
rwucral beam high vult.ige power source, vacuum pumps and blowers, the first
wall, blanket and shield primary coolant and-coolnnt storage system and
"mjRti C power.supply cjihlts. "-Thu biilldinp, is de^iuned to withstand"pressure
."ranging from minus one hall" atmosphere co pias one atmosphere.
B. >!ockup Maintenance Building
Four ancillary Facilities in direct support or the reactor are provided.
Those arc located in the mocKup maintenance building and are shown in Figure
Xlll-3. Two hot cells are used Lo repair and examine activated reactor
components and experiments. The larger cell is used primarily for neutral
beam injector reconditioning aad has aii atmospheric control system Co
accommodate tritium release from the components. A mockup area outfitted
with a full .scale one-quarter section of the reactor is maintained in an
adjacent building. This facility is required to support the remote mainte-
nance/repair and to aid in the future upgrading o£ the reactor.. All
apparatus and operations may be practiced.and perfected at this facility prior
to live operations on the highly radioactive reactor internals.
The thirJ facility is a decontamination area formed in the large cargo
door entrance foyer. Special apparatus may be set up to dfceon.tamir.ate
reactor p^rts prior to hot cell disassembly or off-site shipment. A fourth
facility for winding and assembling the TF coils is provided near the mock-
up area. The equipment needed initially Ecc reactor assembly can be moved
__into__the_reactor_building to rewind_damaged_coils.
The Mockup Maintenance Building dimensions are 102 m by 47 m by 38 m
high. A 225 tonne and a 35 tonne crane ride a full coverage bridge ovar the
entire" main floor area of the building. The 225 tonne crane is used pri-
marily for winding.and initial handling of the TF coils. The cranes cover
the mockup area, both hot cells (through cell roof ports) and the basement
area through floor slabs.
IheilSrgv hofcicell:.is.-29-:ni by 18.5: m-by^lO.7.m high. 11 will handle two
neutral beam injectors simultaneously. Equipment consists of overhead
bridge mounted hoists and manipulators, seven shielded windows with manipu-
lators, atmospheric control, and access to both the reactor lower equipment
XIII-5

passage and basement storage. One air lock links the cell with the reactor
containment, permiting passage of a neutral beam injector. The smaller hot
cell is 19,8 m by 13.7 m by 9,1 m high and will be used mainly far examination1=
of samples, experimenCal appacatus arid repair of blanket and shield blocks
extension ducts, etc. : :r;: : -
Promsions for a sub-basement level in, the mockup area are required to
duplicate the remote handling activities under the reactor. Other basement
areas will be used to score renote handling equipment and many other spare
parts.
The lab-shop-maintenance area is 47 m by 20 m and is three stories high.
It will house electronics shops, electrical repair shops, a machine shop,
experimental laboratory and a set-up area.
C. Tritium Facility
A cylindrical containment building 26 tn in diameter and 27.4 m high will
house the fuel reprocessing apparatus and the reactor building tritium
cleanup equipment (Figure XI1I-3). The normal reactor building air circu-
lating system will function in parallel with the tritium removal system.
Appropriate controls will seal off the ventilating system and allow the
cleanup system to be activated. A high pressure tritiated air storage
system will be included as an interim backup safeguard system.
The containment building will be. compartmentalized and personnel will
occupy limited areas. Services to the building will include liquid nitrogen
and liquid helium supplies in addition to the normal process and power
supplies. Storage facilities for all the fuel will also be" provided. There
are 730 m2 of laboratory and office space adjacent to the containment building
used to monitor, maintain and experiment with the tritium/fuel handling
system. Two air locks allow personnel entry into the containment area
while maintaining seal integrity.
D. Power Supply Facilities
Y!-e power supply facilities for the OH, EF, TF, RF and neutral beam
injection systems are housed in two areas (Figure XIII-1). A large building
located adjacent to the reactor containment and in close proximity to the
reactor proper (to reduce the power lead length) houses the power supplies.
XIII-6

The building is ^ 80 m by 40 m by 24 m high providing three levels for SCR
banks, capacitors, resistors, lead lines, switchgear, homopolar generators,
etc. The equipment will be strategically located to minimize problems
and costs. Cranes and other handling equipment will be installed as needed.
A superconducting energy storage unit was selected to optimize the
pulsed power requirements for the OH, EF, rf and neutral beam systems.
This results in a much lower utility grid requirement. The facility con-
sists of an underground circular building 18 m in diameter by 3 m high.
Cryogenics are supplied from the main magnet supply- The unit is located
in an isolated area 70 m from the power supply building.
E. Cryogenic Facil i t ies
A large building located between the power supply building and the
control center houses the liquid helium and nitrogen cryogenic apparatus
(figure Xill-4>r The building has I860 m2 (20>QQQ ft2) of floor space.
The compressors are located ^ 40 m from the reactor while the liquid helium
cold box equipment is near to the reactor. The TF coil system requires the
largest supply of cryogent, however the equipment for the cryosorption puraps,
tritium faci l i ty , energy storage ring and remaining magnet systems has been
centralized, Additional major components include a liquid helium storage
vessel, a constant pressure gas expansion tank, high pressure gaseous helium
storage and liquid nitrogen storage.
F. Haat Transport and Cooling Tower Faci l i t ies
Faci l i t ies to transport up to 550 MW of reactor and % 50 MW of compo-
~"nen'trwaWtB^fieat are"" iro^ffleia^CFiigTire XIII-1). Reactor coolant water,
pressurized up to 2000 psig i s circulated in a closed system to contain
the tritium buildup produced in the reactor. The system has four secondary
coolant loops with one steam generator per loop rated at 150MW thermal.
Coolant is pumped through the reactor to a~he;^t-exchattge-:building-30"'.m"by
25 m x 14 m high complete with containment against inadvertent release of
t r i t i a ted water. The heat exchange building contains the steam generators,
canned rotor pumps and heat exchangers capable of handling up to 550 MM of
heat. The heated steam is fed to a PWR type turbine generator set (150 MWe
gross) or dumped to atmosphere through a cooling tower system. The water
for cooling plant and components is in a separate non-tr i t ia te c i rcui t .
XIII-7

Cooling towers and associated pumping and piping systems are provided
as follows: 550 MW peak load of high temperature water, steam, or turbine
condenser coolant from the reactor using four multipurpose towers; 50 MW
of plant component low grade heac in a dimineraliaed system from magnet,
electrical leads, compressors, etc. using 2 towers, a pump house and
demineralizing equipment.
G. Control Center
A50' m by 62 m building will be used as a control center, office and
laboratory facility (Figure XIII-1). The building is four stories tall with
a control room 9.2 m by 18.3 m by 5.2 m high. Other features include a
briefing room/auditorium, computer center and administrative offices.
H. Turbine Generator Facility
A turbine generator building 75 m by A8 m houses the 150 MWc gross peak
output power conversion unit (Figure XIII-1). The building is located adjacent
to the heat exchanger facility. Since this is an experimental reactor thes i 2 e o f t h e system at 150 MWe represents the highest reactor electrical-
power conversion practical. The EPR could operate with a smaller power
plant or without one. This question has not been resolved.
I. Power Substation
A 150 MW substation with 132 kv incoming power is provided (Figure XIII-1).
This is an initial estimate believed to be conservative, and the power meets the
needs ot the facility at this scagp of design^J^is power ^
there is no power plant provided, and the reactor operates from grid power
alonu. The major electrical base loads will be from; the cryogenic facilities
which will necessarily draw power for a relatively long period prior to
reactor; operation;-the building services, cranes, air conditioning,-lighting,
etc.; and the cooling towers.
I n i t i a l e s t i m a t e s i n d i c a t e ^;2 MM of emergency power will be needed
to maintainsafe standby conditions in the event of a site power outage.
It is too early inthe design phase to adequately assess the emergency
power needs beyond this point.
XIII-8
CHAPTER XIV
ENVIRONMENTAL AND ENGINEERING SAFEGUARDS
Environmental and safety considerations have been introduced into the
EPR design at an early stage in order that subsequent engineering safeguards
could be designed. Potential hazard sources and accident initiation mechanisms
have been identified and are discussed qualitatively in this chapter. Quanti-
tative estimates of off-site tritium exposure and of the radioactivity, after-
heat and biological dose due to activated materials have been made.
A. Preliminary Hazard Analysis
A preliminary hazard analysis has been performed for the EPR to identify
potential hazard sources inherent in the system and to identify potential
accident initiation mechanisms. At this preliminary scage, no attempt has
been made to quantify the probability of malfunctions occurring or to
classify the potential hazards according to their consequences for equipment
damage or personnel hazard.
Several potential hazard sources are identified in Table XIV-1. The
EPR plasma is a source of high energy neutrons, which implies the activa-
tion of reactor and ex-reactor materials and of the primary coolant.
Materials activation is discussed in Section XIV-C. The tritium in the
fuel cycle system and the tritium in the first-wall coolant constitute addi-
tional radioactivity sources (see Chapter X).
Large quantities of energy are stored and transferred within the EPR
system. An inductive energy of 30 GJ, or 1.9 Gj/coil, is associated with
the steady-state toroidal field. Gigajoule quantities of energy are drawn
from the energy storage unit and transferred to inductive energy associated
with the OH coil, EF coil and plasma current at the beginning of each burn
pulse, then returned at the end of the burn pulse. Similar quantities are with-
drawn from the energy storage unit for plasma heating on each burn pulse.
The primary coolant has a large thermal energy content. In addition,
chemical energy could be released if hydrogen mixtures reached an explosive
limit, and thermal energy could be released if molten metal were formed and
subsequently interacted with stagnant coolant.
XIV-1

Table XIV*-1 Potential Hazard Sources
Radiation Sources
1. Inadequate or malfunctioning radiation shielding.
2. Activated first-wall, blanket, shield and structural materials —1 x 10⁹ Ci after too years operation.
3. Activated ex-reactor components.
4. Activated primary coolant (H20).
5. Tritium in fuel cycle — 1.5 x 10⁷ Ci for 1,5 kg inventory.
6. Tritium in first-wall coolant (H2O) — 105 CI after i year operation.
Energy Sources
1. Inductive energy in magnet systems
TF coil — 30 GJOH coil — 0.9 GJEF coil — 1.7 GJ
2. Inductive energy in plasma current — 331 MJ.
3. Inductive energy in energy storage unit — 3.2 GJ.
4. Energy transfer in the neutral beam and/or rF heating system — 1 GJ.
5. Thermal energy content of plasma — 270 MJ.
6. Thermal energy content of pressurized water primary coolant — 15.8 GJ
7. Chemical energy potential in hydrogen (D,T) mixtures.
8. Chemical energy potential in molten metal-water reaction.
9. Inertial energy homopolar generators — 0.8 GJ
XIV-2

A number of hypothetical accident initiation mechanisms can be identi-
fied. Tritium and activated material could be released to the environment
as a result of an earthquake, an airplane crash, missiles ejected from the
reactor system, etc.
Loss of coolant flow resulting from loss of pressurization, pipe break
or blockage of a coolant passage could occur. A sudden loss of pressure
would cause the coolant to flash into vapor which, if it escapes into the
primary containment, will raise the pressure on the primary containment
system. If loss of coolant occurs without plasma shutdown, coolant boiling
and burnout could result in melting of some segments in the first-wall and
blanket, which could lead to a vapor explosion if the molten structural
material came in contact with stagnant coolant.
An uncontrolled plasma dump on the first wall could deposit the
plasma thermal energy in a localized region at a very rapid rate. This
could cause ablation and vaporizatior. of the coolant panel. In addition,
a sudc'en loss of the plasma current could produce rariid transients In the
Inductxve energy in the OH coil and EF coil systems.
Small pockets could be formed in which an explosive mixture ( 4%)
of D2 or T2 was confined. A D2 or T2 leak could lead to this situation.
The liquid helium in the cryogenics system could be released, as the
result of a rupture of the cryogenics system. Upon release of liquid
helium to the containment, it will flash into a two-phase vapor-liquid
mixture. The helium would extract the heat from the reactor structure,
producing thermal stresses in the structure and pressurized water coolant
system.
The most critical condition for both superconducting toroidal and
poloidal coils is an open circuit. The dump resistor coil protection
system with a 8 1/2 Minute time constant (described in Chapter IV) could
protect the TF coil system if local normalization occurs, but arcing
from an open circuit could cause extensive coil damage. Melting might occur
in the conductor, cryostat and coolant lines. The most difficult problem
for coil protection is with the poloidal coil system because of the coupling
effect related to plasma stability, poloidal coil stability and power
supply. If any of these systens become unstable and quench, the energy
stored in the system could dump to one of the other systems.
XIV-3
Malfunction o£ tne power supply and superconducting energy storage
ting may cause problems, similar to those caused by magnet failures par-
ticularly for the components associated with the poloidal field generation.
In addition to the electrical/magnetic problems, a significant problem
in the power supply is associated with the mechanical failure of the
homopolar generator drums. Additional analysis is required to determine
if missiles thereby produced will have enough energy Co penetrate the
housing and initiate a propagating type failure in adjacent generators or
in the superconducting coil. Another potential problem is associated with
the indue tor-convertor circuits which contain capacitors storing megajoules
of energy. Ail overload or internal fault could cause an explosion in spite
of the blowout plugs designed into these capacitors. The size of the energy
overload and the results of the chemical/mechanical reaction require further
analysis.
This preliminary survey of hazard sources and accident initiation
mechanisms is certainly not complete. These factors are considered
qualitatively in the development of the conceptual design.
B. Potential Off-site Tritium Exposures'
Preliminary studies aimed at establishing siting requirements and
environmental impact of the EPR have been carried out. Two events
leading to off-site exposure due to the release of tritium from a fusion
reactor facility have been considered. The first event considers 2% of
a total inventory of 2 kg of tritium released as water vapor in an acci-
dent. The dose commitment for an individual at the site boundary is then
calculated for a certain set of assumptions. The result is compared to
Che guideline level as contained in 10CRF100. The other situation considered
treats a daily release of 100 Ci of tritium under normal conditions and
compares the results to the concentration guide listed in ERDAM 0524.
A number of assumptions are necessary for any computation as preliminary
as this, and the following have been used in this exercise: (1) the Gaussian
plume model for atmospheric diffusion applies for the case of tritium re-
leased as HTO or T20; (2) at the time of release, the F stability condition
(Pasquill Categories) in regard to dispersion prevails; (3) the average wind
This work was performed by H. Moe, ANL.
XIV-4

speed of interest u = 1 m/s; (4) the distance to the site boundary is
500 ra in one case and 1000 m in a second casej (5) the total inventory is
2 kg of tritium* with 2% of that lost in an accidental ground level release;
and (6) no modification occurs as a result of decay or scavenging due to
precipitation following release.
For the case of a ground level accident release, the concentration,
*, is given by
x = q/va u u (XIV-1)
where * is in Ci/m3, Q is in n /sec, u = 1 m/sec, and o and a are in .
meters. (Both o and a are obtained from reference 1 ,) Letting the
exposure, IJJ, represent the integrated concentration gives
iji = Q°/ira aju. (XIV-2)
where 4> is in Ci«sec/m3 and Q is the total number of Curies released
over the duration of the incident. Using the assumed distances of 500 m
(o = 17.7 m and a = 8.5 m) and 1000 m (a = 34 m and o = 14 in) results iny z y z
*/Q° = 2.1 x 10~3 sec/m3 for 500 mand
= 6.7 x lO-4 sec/m3 for 1000 m.
The total intake, I (in Curies), for an individual at the site boundary
is given by
I = *»f »B (XIV-3)3.
where f is the fraction entering the individual's body water by inhalation"
(taken to be 1 in this case), and B is the individual's breathing rate"
(taken to be 2.3 x 10~'v m3/sec). For the above cases, I = 2.3 x 10"%, or,
using the appropriate IJJ/Q° values, I = 4.9 x 10"7 Q° for 500 m and 1.6 x
10-7 Q° for 1000 tn.
Making use of expressions and data from ICRP #2 (reference ?.), the
body burden, q (in mCi), can be calculated as follows:
q = 2.8 x 10⁻³ mR/f2 SEA (XIV-4)
XIV-5

where (from reference 2) m = "w3 s 1Q1' g» R = O.I rem/wk, £2 = 1, and
SEA = Q.QQ6 MeV/dis, (A as used here is the relative biological effective-
ness.) The resulting value for q is 2 mCi. This value is roughly twice
the body burden listed in reference 2 because the value of A currently
«sed is 1, nt»t 1.7 as is used in reference 2,
For a burden of 2 mCi then, the whole body dose is 0.1 rem/wk, or
the initial dose equivalent rate from a I Ci burden is 50 rem/wk. In
accord with reference 2, the calculated dose commitment, D, per Curie
is 124 rem/Ci intake. For the case of the ground level lotss of 2% of the
2 kg inventory, the corresponding release is i- 4 x U)5 Ci and the resulting
dose commitments are 23.5 rem (whole body) at 500 m and 7.4 rem (whole body)
at 1000 m. From 10CFR100, the guideline for total body dose equivalent
in an accident situation is 25 rem. In each case, the accident would
result in exposures within the limits although clearly it is desirable to
utilize the greatest source to boundary distance.
Considering a continuous release during operation of 100 Ci/d, it
becomes necessary to use a ^ng-term dilution factor based upon the mete-4
(.rological aspects of the g.'ven site. Such a long term average is given
by the expression
1 - E z 2 f (e,s,tQ = s N ,-STo u
zS n n
This average takes into account the frequency [f (9,S,N)] with which the
wind blows with respect to the stability class (S), wind speed range (N),
and direction of interest (8). Values of —were derived from data used
to arrive at current ANL effluent criteria for stack monitoring. Using
data for two typical locations at ANL, the values become:
* / •) i n~6 s e c
- = 4.2 x 10 —'500m m
. c lrv-6 sec= 1.5 x 10 -y-nOOOm m
XIV-6

Ic should be noted chat the values are specific for a given direction
since they are based upon wind direction frequencies. The relevant; values
i above are Che maximum for the locations considered in the im™
portant. direction. Based on these assumed — values, the values of x calcu-
lated for a 100 Ci/d release rate are ^ 5 x 10"9 Ci/m3 at 500 m arid
••v 2 x 10 * Ci/m3 at 1Q0O m. ERDAM 0524 (reference 6) gives the uncontrolled
concentrations guide as 2 x 10 Ci/m , So, the concentration in each case
would be below that allowed off site by ERDA. Again the preference tor lo-
cating farther away from the boundary wou^d result in almost a three-fold
reduction in concentration. Mthough the ahove values would satisfy the
ERDA requirements, the ANL criteria for effluent monitoring (which is
being reviewed by ERPA) would require effluent monitoring if the concen--9 3
tration off site exceeded 2 x 10 Ci/m , To meet this criteria at a
location similar tc ANL would require siting at 1000 m from the site
boundary or supplying stsick moritoring.
C. Radioactivity, Afterheat, and Biological Dose
Calculations of radioactive inventories, afterheat, and biological
hazard potential provide Important information for the safety analysis
and environmental impact questions. The biological dose at many key
locations during operation and after shutdown is important for planning
of maintenance and repair services. This section presents such infor-
mation for the reference design.
These calculations are based on the neutron radiation field as char-
acterized in Chapter IX, The concentrations of the radionuclides from Che
transmutation chains were calculated with the TK3 program. The transport
of decay gamma-rays was determined with a series of one-dimensional geo-
metric models serving as idealisation of the nuclear systems described
in Chapter IX. The average energies of the S-partides were calculated
according to the method described in Reference 8.
Figure XIV-1 shows the radioactivity in units of curies per MW't
as a function of time after shutdown following two years of operation.
The level of neutron-induced activation at shutdown is 3.5 MCi/MWt and
decreases by only a factor of 4 during a cool-down period of 1 yr, then
XIV-7
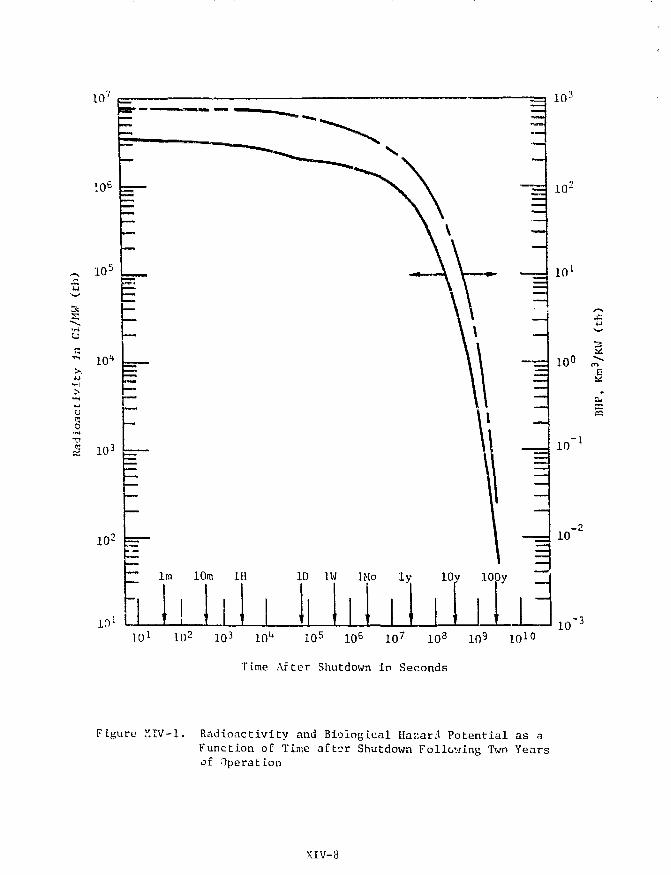
10
s
10"
£ 103 =•
10 l
lm 10m 1H
10J
10''
10°
10-1
10-2
ID IW IMo ly lOv lOOy
101 102 103 1OU 105 10s 107 108 109 1010
Time After Shutdown in Seconds
10 -3
Figure XIV-1. Radioactivi ty and Biological Ha::arcl Potent ia l as aFunction of Time af ter Shutdown Following Two Yearsof Operation
XIV-8

drops much more rapidly at later times. More than 99% of tlis activity
cornea from the first wall and blanket which constitute a 32-cm thick region
of stainless steel surrounding the plasma. The level of radioactivity
bui-lds-up fast during operation and reaches a significant level in a few
hours and a near steady-state level in a few days. It is worth noting
that the level of radioactivity here expressed in Ci/MWt is about a
factor of 3 higher than in reactors employing lithium blanket^ with only9
5 to 10% stainless steel structure such as UWMAK-II. It .•>*? cilso found
that the curies per MWt are fairly independent of the neutron wall loading
when the latter is in the range of 0.1 to 5 MW/m2.
The maximum radioactivity occurs in the stainless steel first wall.
Table XIV-2 shows the specific radioactivity in the innermost region of
the first wall in units of disintegration per sec per cm3 after 2-yr opera-
tion with a neutron wall loading of 0.5 MW/m2. In the first few minutes
after shutdown, the radioactivity is dominated by 55Fe (T. ,0 = 2.6 yr),56Mn (T1/2 = 2.58 hr),
51Cr (T^, = 27.8 d), and 58Co (T1/2 = 71.3 d).
Except for 5^Mn, the radioactivity from these isotopes remains dominant
during the first few weeks after shutdown. At long times, the main iso-
topes are 63Ni ( T ^ = 92 yr), 59Ni (Tj,9 = 8 x 101* yr), and ll3Mn (T », =
2 x 10⁶ yr).
A crude, but useful, indication of the biological effects of Che
various radionuclides is provided by the Biological Hazard Potential
(BHP). The BHP is defined as the amount of air required per kilowatt
of thermal power to dilute the radioactive isotope to its maximum per-
missible concentration. The BHP is obtained simply by dividing the
activity In Ci/KW(th) by tl.o maxitiium permissible concentration (MPC)
in Ci/Km3 of air for aach isotope and summing over all isotopes. Ine
BHP for the reference design is shown in Figure XIV-1 as a function of
time after shutdown following two years of operation. The MPC values
in the TK3 program library used in these calculations are taken from irha
US Atomic Energy Commission rules, Title 10, Part 20. At shutdown, the
BHP is 800 Km3/KWt with about, one-third of this value coming from the
4-cm-thick first wall. The greatest contribution to EHP comes from5uMn (252), 57Ni (25%), 58Co (17%), eoCo (10%), 5SMn (5%), and 56Fe (4%).
XIV-9

ri ' 1! ! ' •< . ri I h I, frii r ; i'J
;iiif
' - ^''tiliHiiH1'!
• !j i i r i i j
1 y 1 - 1 '
4 i . I» , • , i
1 i1 i ' , r "i+'i * i i 11 ' ' i pi ' • ' - - I ' /1 » i i te i T «* I i ' I i i i I 11' i J- i i * !
i Table XIV-2;. - SpeciflcwRadloactivity In the Fitrgti Wall! (In dislntegrai-ioa'per s per cma ;! , ' {'!' t after i2-'yr operation with a] neutron waTl loading \o£ 0i5 MW/az) |i
t" i1;! ii,
3
Co
,5 8Ce
" K n i,
Hall-lite
2?.8 day
103
Z7Q day
s.2$ yr10.5 mln
71.3 day
1.58 h'r
3.3 fllo
2.3 aln
93
8 x 50* yr
2 x l y A yr
4 . 5
2.1 (11)
9.1 (10)1
,4.2 (10)
l.O'fip) '
, 2.8 (10) i
-3.6
5.9
J-.8 (10)
7.3 C7J
8.1 (4)
1.2 (4)
,1.A (1ST)
' " .TIKE AFTER SHUIDDtO
.1 i |
1 1 aln
TJ.I (11)'
f|-2 »0^ '
2J.6 (10)
9 (JO)
3 (i05
?J3 (7)
t l
jshould be retd AJSA '-ClJ, etc.
r I"
Ii.
'< \\L | " . I ".! i f _,
I t " ! ' i, J
\r ! I ' 1
., i i ! i '
'I W2 ») ,
10 min
•s'.s t i n ;
4.Z (10)
1.0 (I0J|
1.4 (10J
3.3 (II)
3.4 CU5
! 9.2 <9>
i rP?
7,3 (7)
1.2
.3 ill)'
1 hr
4.5 (11)
1, [ i l l Cli)
• 'i .l 'Uo)
4.2} (3.0)
i.'o
> 4 - 3 1 1 1 )
2.7 (21)
f.O (5)
7.3.(7)1
i .2 <*')
l.Z'O2)'1 '
1 i.'<- I ' •
6.5 Ul)
2.0 OX)
1,1 4,10)
4 .a
1.0 <|10)
i,3 soy
J .3 (11)
5.5i ('8) '
7 . J (jWS.I (A|
1.1
9.3 f !U
. i vet-k
4J5
8 3 <J0)
1.0
1^, OJ)
7.3 <-?}
8,J
8.9UUS
I . J jir
i 3,9
1.? <M
6 . 1 i l
1.2 (i)
1.1 <U)
i 3,0 Os ,
2,} Ml
-A tVs
OU
.2 !0)
1)
3.'. (lt»
T
3J - (7)
8 ^ (4}
3 , J 14)
J , - (7)
1
I
1 1 | I , H

figure XIV-2 shows the afterheat as a fuiVction of time after shutdown
following two years of operation. The afterheat expressed as a percentage
of the reactor thermal operating power is also fairly independent of the
neutron wall loading in 'the range 0.1"to 5 KW/m2: AT shutdown;-the decay - ;
,hoat is -v 2.5% of the operating thermal power. This Value drops only by . .
". 20% during the first few minutes" that are crucial to the emergency cooling.
However, the .percentage afterheat here is about one-third of that in a
• fission reBCLor. Moreover, the maximum power Jenuity in the EPR reference
' .loslgn-waa-shown-ln section A^of-Chapter-IX to be * 6 W/cm3 which is about
a_factor"of 10 lower Chan"the power density in. a-light water-rosetor and
a factor "of 100 lower than that in a fast breeder reactor.
-The biological dose that would be- received by a human being at many key
"locations in "the reactor is extremely important for the design and planning of
maintenance and repair operations as well as classifying the various areas
for control of human access. During operation, the biological dose in regions
external to the TF coils Xs <\- 106 mrem/hr, which is Loo high to permit access
to the inside of the reactor building for any reasonable length of time. The
primary containment, serving also as the wall of the reactor building and
as tha biological shield, is 1.5 m thick ordinary concrete, which re-
duces the biological dose outside the reactor building to 1 mrem/hr.
Table XIV-3 shows the biological dose at two locations as a function
of time after shutdown following two years of operation at a neutron wall
loading of 0.5 MW/m2. 'rile- first location is in the vacuum chamber inside
the first wall. The biological dose at shutdown is 6 x 10⁸ mrem/hr and
-- decreases to 1--X-109 mrem/hr in one-year of cool-down. _ Thus, it is_ __
obvious that remote maintenance will always be required for operations
in regions near the first wall. The second location is at the inner side
of the torus at a point on the poloidal axis that is in the same horizontal
plane as the topmost houndnry of the TF coils. Tne biological dose at
this location after one day of shutdown is 600 mrem/hr. Tha exposure
limits10 of Title 10, Part 20 for a "restricted area" arc 2 m'rem in any
one hour and 100 mrem in any seven consecutive days. Thus, personnel
access without additional radiation shield to the upper regions of the
reactor near the central core may be possible orly for short periods. It
should be noted, however3 that at all sites in the reactor, most of _ _
XIV-11

101 =
10 0
ID 1W IMo ly lOy ILOOy
102 103 .10!* 105 10s 10 7 108 -109 10 1 0
Time After Shutdown in Seconds
Figure XIV-2," Afterheat as a Function of Time after ShutdownFollowing Two Years of Operation.
XIV-12

Table XIV-3, Biological Dose, in mrem/hr, After Shutdown Following TwoYears of Operation
,j Time Mter Shutdown:••.'; —
Inside the Iii theVacuum Chamber Gore Region.
0 6 x 10s 3 x XQ3
1 hour 5xlO 9 2 K 1G3
1 day 2 x 10$ 6 x ID2
1 week 2 x 10* 5 x 102
I year 1 x 10⁵ 2 x 10²
the decay gamma-rays have energies in the range 0.1 to 2 MeV, with none
above 3 MeV, The mean free path for absorption of a 2-MeV gamma-ray in
lead is ^ 2 cm. Thus, about 10 cm thick lead shield is sufficient to re-
dude the biological dose by two orders of magnitude.
The biological dose in the reactor building at the exterior of the
outer shield is of particular concern. As indicated earlier, remote mainte-
nance will be required for all service operations on components inside uhe
first wall and tht blanket. However, substantial savings on time and cost
of these operations can be made if they are directed from a central plat-
form inside the reactor building rather than from the outside. The bio-
logical dose exterior to the TF coils is the most difficult to calculate
because of the presence of many major penetrations and the large-size
neutral beam injectors which represent potentially large sources of in-
duced activation. In the complete absence of the penetrations and beam
injectors, the biological dose, is 2 mrem/hr at 24 hours after shutdown.
To keep the biological dose to this value in the presence of the pene>-
trattons and injectors, full^shielding of the penetrations as specified
in Chapter IX is required. Moreover, a shield has to surround all the
walls of the neutral beam injectors.
XIV-13

1. D. H. Slside, Editor, -Meteorology and-Atomic-Energy 1963, US/.EC ReportTID-24190 (1968).
2. IGRJ', Report of Committee II on. Permissible Dose for Internal RadiationPerfjamon Press, London (1969),
3. ICK?, Progress Report from ICRPt Health Physics JJ, 389 (1969).
.'u D* B, Turner,, Workbook of Atmospheric j)isj &rsion Estimates„ U.S.O H B f * ~ " " " "~ "'
5, H. Moses and M« A. Bogn,ec(. •Eif_ceett»Yeay ClimaEQlsgical Suimnar t ArgonneNational Laboratory, ANI^»?Q8C (196?).
6. ERT>A Manual Chapter, Standards for Radiation Protection, ERDAM 0524
7. T. Y. Sung and W. F. Vogelsang, "TK3: A Program to Calculate Radio-activity and-Afterheat in Fusion Reactors," to-be published as aUniversity of Wisconsin FDM report.
3. M. A, Abdou, C W. Maynard, and R. Q. Wright, "MACK: A Program toCalculate Neutron Energy Release Parameters (Fluence-to-Kerma Factors)and Multigroup Neutron Reaction Cross Sections from Nuclear Data inENDF Format," UWFDM-37 and ORNL-TM-3994.
9. I, Badger, et al., "UWMAK-II, A Conceptual Tokamak Power Reactor De-sign," University of Wisconsin Report, UWFDM-112 (October 1975),
10. Code of Federal Regulations, Title 10, Part 20.
XIV-14
CHAPTER XV
RESOURCE REQUIREMENTS
A. M a t e r i a l s Inventory
The mater ia ls requirements, a v a i l a b i l i t y of metals and economics of
a tokamak power reactor have been evaluated. For the EPR, m;i >:fial r e -
quirements were developed to aid in f a c i l i t y design, e .g . crane capaci ty ,
helium storage capaci ty, bui ld ing arrangement and to help in developing
a cost es t imate . The EPR material requirements are l i s t e d in Table XV-1.
Excluding concrete and lead mortar, there are over 45,000 metric tonnes
(Mg) of mecal and non-metal materials requi red . Sta in less s t e e l , copper
and Bi,C are expensive mate r ia l s and cont r ibu te a major cost increment.
Mater ia ls such as niobium, titanium and helium are not only very expensive
but are considered s t r a t e g i c mater ia l s , and supplies are l imi t ed .
8. Cost Estimate
A preliminn-v cost es t imate has been developed for the EPR. The
Plant Capital Inv, '..merit Cost Estimate (Table XV-2) i s based on 1976 costs
and i s organizod oasen t i a l i ' is outl ined in reference 2. These costs
include not only base mater ia l costs but a l so fabr i : a t ion and i n s t a l l a t i o n
cos t s . The cost of tin 150 MWe turbine generator f ac i l i t y was ident i f ied
but was not included in L.IC; base cost s ince th i s i s an option which may or
may not be required. A 25% factor on system d i r ec t costs was added for engi-
neer ing , and another 25% factor was added for contingency. Development and
management operating Funds .ire not included in Table XV-2.
The to t a l ca : rnl cost lor the EPR faciLi ty i s $868,300,000 of which
11.6% i s for buildi; -; and s i ; e f a c i l i t i e s , 43.0% i s for the r eac to r , 42.3%
for reac tor plant f a c i l i t i e s and 3.1% i s for turbine and other a u x i l i a r i e s .
As can be seen from Table XV-2, magnets and power supplies are the two
most cos t ly systems, and together they amount to 36.3% of the d i rec t c o s t s .
C. Manpower and Fund i:i)', Lle3
A possible organizatLunal s t ruc ture for the EPR Project has been de-
veloped for the purpose of making manpower es t imates . The postulated s t ruc -
ture i s a modified pro jec t organization that wi l l have overa l l technical and
XV-1
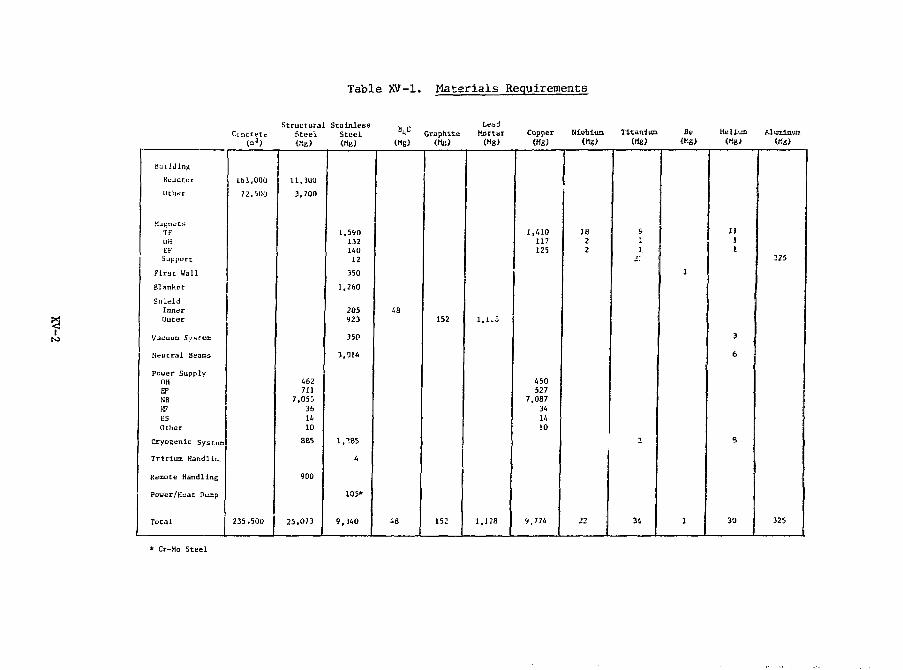
Table XV-1. Materials Requirements
?
Structural Stainless „ - LeadCcnclete Steel Steel " Graphite Mortar Copper
(.n3) (Hg) (Mg) (Mg) (Kg) (Mg) (Me)Hiobiun Titanioo Helium
(Mg)
Building
Reactac
Ucher
MagnetsTFUHEFSupport
Firs t Wall
Blnnkcc
SliielJInnerOuter
VacuuD System
Neutral Bciaffls
Pauer SupplyOHEF•JBRFESOther
Cryogenic Systen
TrirliET. Handlin.
Remote Handling
Power/Heat Dump
Total
16i,000
72.5UO
235.500
11.3U0
3,700
462711
7.O5S361410
BB5
900
25,073
1,59013214012
350
1,260
205923
350
3,014
105*
9,540
48
48
152
152
1,1-3
1,128
1,410117125
450527
7,0873414ID
9,774
1822
22 I
91i
2'
34
1
a
l iji
3
6 ;
s
30
325
325
* Cr-Ho Steel
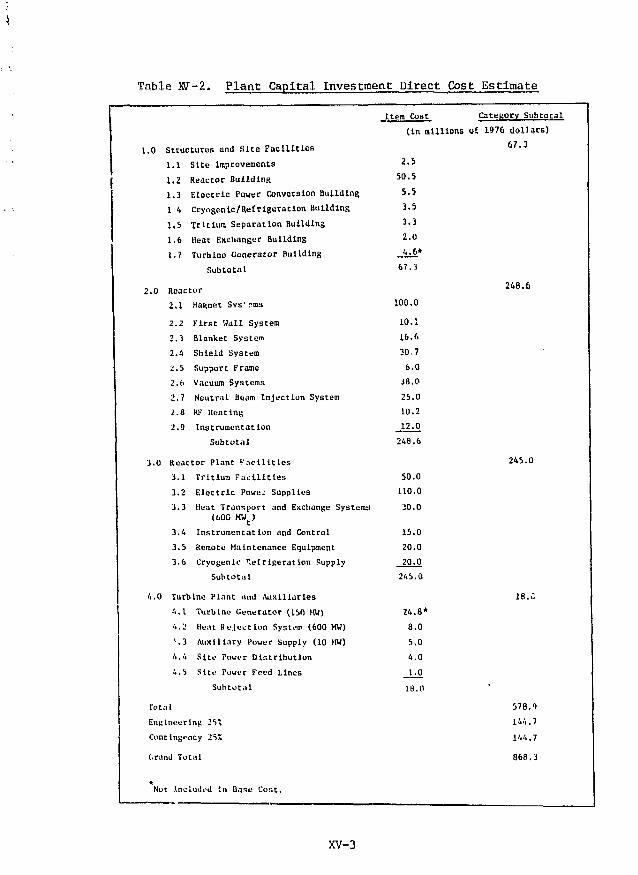
Table W-Z. Plant Capital Investment Direct Cost Estimate
1.0 Structures and Site Facilities
1.1 Site Improvements
1.2 Reactor Building
1.3 Electric Power Conversion Building
1 4 Cryogenic/Refrigeration Butldlng
1.5 Tritium Separation Building
1.6 Heat Exchanger Building
1.7 Turbine Generator Building
Subtotal
2.0 Reactor
2.1 MaRnet Svs1 tims
2.2 First Wall System
2.3 Blanket System
2.4 Shield System
2.5 Support Frame
2.6 Vacuum Systems
2.7 Neutral Beam Injectlun System
2.8 RF Heating
2.9 Instrumentation
Subtotal
3.0 Reactor Plant Facilities
3.1 Tritium Facilities
3.2 Electric Power Supplies
3.3 Heat Transport and Exchange Systems
(60C HW {)
3.4 Instrumentation and Control3.5 Remote Maintenance Equipment3.6 Cryogenic p,efrlReration Supply
Subtotal
4.0 Turbine Plant and Auxiliaries
4.1 Turbine Generator (150 MW)
4.2 Heat Re lection System (600 MW)
'.3 Auxiliary Power Supply (10 MW)
4.4 Site Power Distribution
4.5 Site Power Feed Lines
Subtotal
Total
Engineering 25*
Contingency 25%
(.rand Total
Item Cost Category Subtotal(in millions o£ 1976 dollars)
67.3
2.5
50.5
5.
3.
3.
2.
-A:67.
100,
10,
16,
30,
6
38
25
10
5
5
3
0
1*3
,0
• L
.6
,7
.0
.0
.0
.2
246.6
50
110
30
15
20
20
.0
.0
.0
.0
.0
.0
245.0
24.8*
8.0
5.0
4.0
1.0
18.0
248.6
245.0
18.0
578.9
144.7
144.7
868.3
Not Xnehulod In Base Cost.
XV-3

management responsibility and wil l carry out the design analysis in sufficient
detail to provide technical guidance. The majority of the detailed design and
al l of the fabrication and instal lat ion of equipment and construction will be
done by industrial subcontractors.
Table XV-3 l i s t s project manpower needs in man-years to manage, to de-
velop the design concept, Co provide technical direction, to administer and
support major procurement and to provide operations support for ins ta l la t ion
and test ac t iv i t i e s , A project organization of about 260 qualified staff
plus major subcontractors will be required. Less than 15 million a year will
be required to support this organization. This technical/management project
group will supervise contracts spending up to 200 million per year. In i t i a l
funding for this organization could come from operating funds, but final
engineering, procurement, fabrication, construction, instal lat ion and checkout
will require construction funds. The combined costs per year are shown in
Table XV-3,
D. Schedule
Table XV-3 showed a six year period from the start of Title II engi-
neering to initial operation of the EPR. Figure XV-1 provides a detailed
schedule showing major activities and their time frames. This schedule
was made on the assumption that work is accomplished in two shifts, 5 days
a week and the third shift and weekends would be available to work out
unanticipated problems and still maintain key dates on the overall schedule.
Controlling items are included on the schedule.
1. "UWMAK-II, A Conceptual Tokamak Power Reactor Design, UWFDM-112,The University of Wisconsin Fusion Feasibility Study Group, Madison,Wisconsin (October 1975).
2* Guide for Economic Evaluation of Nuclear Reactor Plant Designs, NUSCorporation, Rockville, Maryland (January 1969).
XV- 4

Table XV-3. Project Manpower and Cost Profiles
Project Manpower
Management and Administration (MY)
Design Engineering/Analysis (MY)
Operations Support (MY)
Funding Schedule tMlllions of Dollars)Project Costs-Opr"atxng Fund
Management and Administration
Design Engineering/Analysis
Operations Support
Total
Capital Investment-Construction Costs
Title 11 and III Engineering
Procurement
Fabrication/Construction
Assembly/Checkout
Total
Grand Total
*Year 1 starts with iaitiation of Title
41
40
200
—
2
10
_ —
12
50
10
—
60
72
2
60
200
—
3
10
13
50
50
80
__
ISO
193
II engineering
YEAR
3
60
200
—
3
10
13
30
50
80
20
180
193
4
60
160
A0
3
8
2
13
10
50
80
30
170
183
and release
5
60
140
60
3
7
3
13
-»
30
80
30
158
6
60
120
80
6
A
13
A
10
80
40
134
148
of construction
Total
17
51
9
77
Li 8
200
400
120
86B
945
funds.

TftcfMfr (MlWM-iT
Y IMfjl ' l ami» y ? qy» >ii..t oil— WICIW
PRELIMINARY EPR DESIGN
ft CONSTRUCTION SCHEDULE
T
itfi'lltl WU
V wZtwC^PiT WKIMiw'• COMWMHHT l i t T I M
V PflfLIHfMfn O€i.4i)"ft otrncE
V PVLHNMT CtiiOHWWOTE HAMLiNO S « S ' T C W
mm. MUMI K I W U M »*C«,ITTA » . »
FACILITIES »EOUIHMHT
Sl J a
i!5a i 3
5 !
Q | S C3OLM3 TONER
1 :
Ifl'UT B flMtcATICtt tr COIL TOWIW
vnuiArut rjttfticATft)
Figure XV-1. EPR Design and Cc
XV-7

r
SfSCTOS
ntmt
5'
«™m •««
L"W -S2HS5* K""" 1 ^
EPR Design and Construction Schedule (1 of 2)
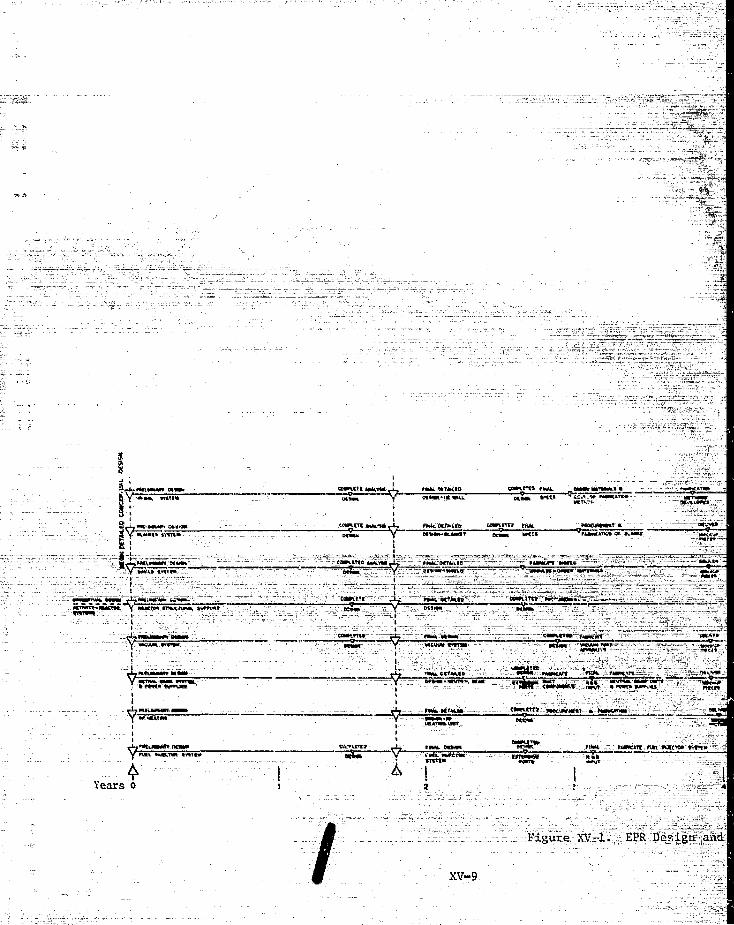
"35K Y ~ ot«B-«
m
•J»iT» T- T ~ H ^ ffc» - c.
• TQVPt R*Tv*M
v fiears o
Figure XV-1. EPR Design aad
XV-9

-KiC»T>0* TOJVW aSLMTt CKLWfm
• MT13PlttiMMTt
CHUVVO
•wrwjtntrmmcrwni
A
Design and Construction Schedule (2 of 2) 2