Effect of Metformin on Bone Marrow Progenitor Cell Differentiation: In Vivo and In Vitro Studies
11
Effect of Metformin on Bone Marrow Progenitor Cell Differentiation: In Vivo and In Vitro Studies M Silvina Molinuevo, Leon Schurman, Antonio D McCarthy, Ana M Cortizo, Marı ´a J Tolosa, M Virginia Gangoiti, Veronica Arnol, and Claudia Sedlinsky Grupo de Investigacio ´ n en Osteopatı ´as y Metabolismo Mineral (GIOMM), Department of Biological Sciences, School of Exact Sciences, National University of La Plata, La Plata, Argentina ABSTRACT Diabetes mellitus is associated with bone loss. Patients with type 2 diabetes are frequently treated with oral antidiabetic drugs such as sulfonylureas, biguanides, and thiazolidinediones. Rosiglitazone treatment has been shown to increase adipogenesis in bone marrow and to induce bone loss. In this study we evaluated the effect of in vivo and in vitro treatment with metformin on bone marrow progenitor cells (BMPCs), as well as the involvement of AMPK pathway in its effects. The in vitro effect of coincubation with metformin and rosiglitazone on the adipogenic differentiation of BMPCs also was studied. In addition, we evaluated the effect of in vivo metformin treatment on bone regeneration in a model of parietal lesions in nondiabetic and streptozotocin-induced diabetic rats. We found that metformin administration both in vivo and in vitro caused an increase in alkaline phosphatase activity, type I collagen synthesis, osteocalcin expression, and extracellular calcium deposition of BMPCs. Moreover, metformin significantly activated AMPK in undiffer- entiated BMPCs. In vivo, metformin administration enhanced the expression of osteoblast-specific transcription factor Runx2/Cbfa1 and activation of AMPK in a time-dependent manner. Metformin treatment also stimulated bone lesion regeneration in control and diabetic rats. In vitro, metformin partially inhibited the adipogenic actions of rosiglitazone on BMPCs. In conclusion, our results indicate that metformin causes an osteogenic effect both in vivo and in vitro, possibly mediated by Runx2/Cbfa1 and AMPK activation, suggesting a possible action of metformin in a shift toward the osteoblastic differentiation of BMPCs. ß 2010 American Society for Bone and Mineral Research. KEY WORDS: BONE MARROW PROGENITOR CELLS; METFORMIN; ROSIGLITAZONE; OSTEOBLASTOGENESIS; ADIPOGENESIS; DIABETES MELLITUS Introduction L ong-standing diabetes mellitus has been associated with bone loss that can cause an increase in fracture risk. (1–3) It has been suggested that these diabetes-associated bone alterations could be, at least in part, due to a pathologic accumulation of advanced glycation end products (AGEs) on bone extracellular matrix proteins. (4,5) Different insulin sensitizers such as metfor- min and thiazolidinediones (used as monotherapy or in combination) have proved to be efficient for the treatment of type 2 diabetes mellitus. (6) It has been demonstrated previously that thiazolidinediones (e.g., rosiglitazone and netoglitazone) not only activate peroxisome proliferator-activated receptor gamma (PPARg) but also suppress the expression and action of the osteoblast-specific transcription factor Cbfa1. (7) Moreover, there is evidence that thiazolidinediones promote bone marrow stromal cell adipogenesis and inhibit osteogenesis. (8–10) Mice treated in vivo with thiazolidinediones decreased their bone mineral content, bone formation, and trabecular bone volume and increased adipogenesis. (8,9,11) On the other hand, in patients with type 2 diabetes mellitus, metformin and sulfonylureas have been associated with a decreased risk of fracture. (1) However, there is little information regarding the effect of these antidiabetic drugs on bone metabolism. Our group has recently demonstrated that metformin causes a direct osteogenic action in a model of osteoblasts in culture. (12) These actions include a dose-dependent increase in cell proliferation, type I collagen production, alkaline phosphatase (ALP) activity, and mineral deposition. These osteogenic actions of metformin appear to be mediated by an increase in the expression of nitric oxide synthases and in the activity of extracellular regulated kinases. Recently, Kanazawa and collea- gues (13) have confirmed these results and suggested that metformin can induce the differentiation and mineralization of osteoblasts via activation of AMPK pathway and induction of endothelial nitric oxide synthase (eNOS) and bone morphoge- netic protein-2 (BMP-2) expression. ORIGINAL ARTICLE J JBMR Received in original form January 28, 2009; revised form June 20, 2009; accepted July 8, 2009. Published online July 13, 2009. Address correspondence to: Claudia Sedlinsky, MD, GIOMM, Facultad de Ciencias Exactas, 47 y 115, 1900, La Plata, Provincia, De Buenos Aires, Argentina. E-mail: [email protected] Journal of Bone and Mineral Research, Vol. 25, No. 2, February 2010, pp 211–221 DOI: 10.1359/jbmr.090732 ß 2010 American Society for Bone and Mineral Research 211
Transcript of Effect of Metformin on Bone Marrow Progenitor Cell Differentiation: In Vivo and In Vitro Studies

ORIGINAL ARTICLE JJBMR
Effect of Metformin on Bone Marrow Progenitor CellDifferentiation: In Vivo and In Vitro StudiesM Silvina Molinuevo, Leon Schurman, Antonio D McCarthy, Ana M Cortizo, Marıa J Tolosa,M Virginia Gangoiti, Veronica Arnol, and Claudia Sedlinsky
Grupo de Investigacion en Osteopatıas y Metabolismo Mineral (GIOMM), Department of Biological Sciences, School of Exact Sciences,National University of La Plata, La Plata, Argentina
ABSTRACTDiabetes mellitus is associated with bone loss. Patients with type 2 diabetes are frequently treated with oral antidiabetic drugs such as
sulfonylureas, biguanides, and thiazolidinediones. Rosiglitazone treatment has been shown to increase adipogenesis in bone marrow
and to induce bone loss. In this study we evaluated the effect of in vivo and in vitro treatment with metformin on bone marrow
progenitor cells (BMPCs), as well as the involvement of AMPK pathway in its effects. The in vitro effect of coincubation with metformin
and rosiglitazone on the adipogenic differentiation of BMPCs also was studied. In addition, we evaluated the effect of in vivo metformin
treatment on bone regeneration in a model of parietal lesions in nondiabetic and streptozotocin-induced diabetic rats. We found that
metformin administration both in vivo and in vitro caused an increase in alkaline phosphatase activity, type I collagen synthesis,
osteocalcin expression, and extracellular calcium deposition of BMPCs. Moreover, metformin significantly activated AMPK in undiffer-
entiated BMPCs. In vivo, metformin administration enhanced the expression of osteoblast-specific transcription factor Runx2/Cbfa1 and
activation of AMPK in a time-dependent manner. Metformin treatment also stimulated bone lesion regeneration in control and diabetic
rats. In vitro, metformin partially inhibited the adipogenic actions of rosiglitazone on BMPCs. In conclusion, our results indicate that
metformin causes an osteogenic effect both in vivo and in vitro, possibly mediated by Runx2/Cbfa1 and AMPK activation, suggesting a
possible action of metformin in a shift toward the osteoblastic differentiation of BMPCs.� 2010 American Society for Bone and Mineral
Research.
KEY WORDS: BONE MARROW PROGENITOR CELLS; METFORMIN; ROSIGLITAZONE; OSTEOBLASTOGENESIS; ADIPOGENESIS; DIABETES MELLITUS
Introduction
Long-standing diabetes mellitus has been associated with
bone loss that can cause an increase in fracture risk.(1–3) It has
been suggested that these diabetes-associated bone alterations
could be, at least in part, due to a pathologic accumulation of
advanced glycation end products (AGEs) on bone extracellular
matrix proteins.(4,5) Different insulin sensitizers such as metfor-
min and thiazolidinediones (used as monotherapy or in
combination) have proved to be efficient for the treatment of
type 2 diabetes mellitus.(6) It has been demonstrated previously
that thiazolidinediones (e.g., rosiglitazone and netoglitazone)
not only activate peroxisome proliferator-activated receptor
gamma (PPARg) but also suppress the expression and action of
the osteoblast-specific transcription factor Cbfa1.(7) Moreover,
there is evidence that thiazolidinediones promote bone marrow
stromal cell adipogenesis and inhibit osteogenesis.(8–10)
Mice treated in vivo with thiazolidinediones decreased
their bone mineral content, bone formation, and trabecular
Received in original form January 28, 2009; revised form June 20, 2009; accepted
Address correspondence to: Claudia Sedlinsky, MD, GIOMM, Facultad de Ciencias E
E-mail: [email protected]
Journal of Bone and Mineral Research, Vol. 25, No. 2, February 2010, pp 211–221
DOI: 10.1359/jbmr.090732
� 2010 American Society for Bone and Mineral Research
bone volume and increased adipogenesis.(8,9,11) On the
other hand, in patients with type 2 diabetes mellitus, metformin
and sulfonylureas have been associated with a decreased
risk of fracture.(1) However, there is little information
regarding the effect of these antidiabetic drugs on bone
metabolism.
Our group has recently demonstrated that metformin causes a
direct osteogenic action in a model of osteoblasts in culture.(12)
These actions include a dose-dependent increase in cell
proliferation, type I collagen production, alkaline phosphatase
(ALP) activity, and mineral deposition. These osteogenic actions
of metformin appear to be mediated by an increase in the
expression of nitric oxide synthases and in the activity of
extracellular regulated kinases. Recently, Kanazawa and collea-
gues(13) have confirmed these results and suggested that
metformin can induce the differentiation and mineralization of
osteoblasts via activation of AMPK pathway and induction of
endothelial nitric oxide synthase (eNOS) and bone morphoge-
netic protein-2 (BMP-2) expression.
July 8, 2009. Published online July 13, 2009.
xactas, 47 y 115, 1900, La Plata, Provincia, De Buenos Aires, Argentina.
211
Bone is a highly dynamic tissue.(14) Cells of the bone marrow
microenvironment appear to share common mesenchymal
progenitor cells, which present the ability to differentiate into
various cell types such as osteoblasts, adipocytes, and
chondrocytes.(15–17) In this context, bone marrow metabolic
conditions are determinants of the biologic balance between
osteoblast-mediated bone formation and marrow adipogen-
esis.(15) Diverse factors such as endogenous hormones and drug
treatment can affect this delicate balance, modifying the
osteoblast-adipocyte ratio in the bone marrow.(15) In this
context, a recent study has underlined the importance of PPARg
in controlling the adipocyte-osteoblast relationship within the
bone marrow cavity.(18)
In the present work, we have evaluated the in vivo and in vitro
actions, as well as the possible mechanism of action, of
metformin on bone marrow mesenchymal progenitor cells
(BMPCs) and the effect of in vitro cotreatment with metformin
and rosiglitazone on BMPCs. We also have investigated the
effect of in vivo metformin administration on bone tissue
regeneration in control nondiabetic and streptozotocin-induced
diabetic rats.
Materials and Methods
Animal treatment
Adult male Sprague-Dawley rats (190 to 210 g) were used.
Animals were maintained in a temperature-controlled room at
238C with a fixed 12 hour light:12 hour darkness cycle, and fed
standard rat laboratory chow and water ad libitum. All
experiments on animals were done in conformity with the
Guidelines on Handling and Training of Laboratory Animals
published by the Universities Federation for Animals Welfare
(1992).(19) In half the animals, diabetes was induced by a single
intraperitoneal injection of streptozotocin at a dose of 55mg/kg
freshly dissolved in citrate buffer (0.05M, pH 4.5).(20) Four days
later, blood glucose was assayed, and diabetes was verified in all
streptozotocin-treated animals.
Animals then were divided into four groups of 10 animals per
group. Control nondiabetic rats (C) and diabetic rats (D) received
water ad libitum; metformin-treated nondiabetic rats (M) and
metformin-treated diabetic rats (DM) received 100mg/kg per
day of metformin (Quimica Montpellier, Buenos Aires, Argentina)
in drinking water for 2 weeks.
Serum glucose was measured by the glucose oxidase method;
serum triglyceride and cholesterol were measured by a
commercial kit (Wiener Laboratories, Rosario, Argentina).
Bone reossification model
The effect of metformin on the process of bone repair was
assessed by a reossification model, as described previously.(21)
Animals were divided into four groups as described earlier.
Briefly, all the animals were anesthetized by intraperitoneal/
intramuscular injection of 0.12mL/100 g of body weight with
62.5mg/mL ketamine hydrochloride and 6.25mg/mL xylazine
(Laboratorios Richmond, Buenos Aires, Argentina). Circular
craniotomy defects of 1.0mm diameter were made in parietal
bones of animals with a cylindrical low-speed carbide bur.
212 Journal of Bone and Mineral Research
Animals were maintained in a thermostatized atmosphere with
12 hour light-dark cycles and fed with commercial rat chow for
15 days.
Histologic examination of bone reossification
After 15 days of metformin treatment, rats were sacrificed under
anesthesia by neck dislocation, and the parietal bones were
processed for histologic and quantitative histomorphometric
analysis. Parietal bones were fixed in 10% formalin and
decalcified in 10% EDTA. The bones were embedded in paraffin,
and 5 mm sections were obtained with an SM 2000R Leica (Leica
Microsystems, Wetzlar, Germany) microtome. The sections were
stained with hematoxylin and eosin (H&E) or tartrate-resistant
acid phosphatase (TRAP) (Sigma, St. Louis, MO, USA) histo-
chemistry to specifically identify osteoclasts.(22) Photographs
were taken with a Nikon Coolpix 4500 digital camera on an
Eclipse E400 Nikon microscope (Nikon, Tokyo, Japan). Images
were analyzed using the Image J program (www.macbiophoto-
nics.ca/imagej) with a microscope scale plugin. Reossification
was calculated as the ratio between either the newly reossified
area or thickness and the average bone thickness (H&E). In
addition, osteoblastic density was evaluated by counting the
number of osteoblasts per unit of reossification surface,
osteocyte density was assessed by counting the number of
osteocytes per area of newly reossificated bone, and osteoclastic
density was calculated as the positive TRAP area per square
millimeter of newly reossificated bone tissue (Oc/mm2).(22)
Bone marrow progenitor cell (BMPC) isolation andincubation
BMPCs were obtained from control nondiabetic and metformin-
treated rats as described previously.(16) Briefly, animals were
sacrificed under anesthesia by rapid neck dislocation. Bone
marrow cells were collected by flushing the femurs and tibiae of
the animals with Dulbecco’s modified essential medium (DMEM)
(Invitrogen, Buenos Aires, Argentina) under sterile conditions.
The resulting suspension was seeded in a 25 cm2 tissue culture
flask and incubated in DMEM supplemented with penicillin
(100UI/mL), streptomycin (100mg/mL), and 10% fetal bovine
serum (FBS) (Natocor, Cordoba, Argentina) at 378C in a
humidified atmosphere with 5% CO2 and 95% air. Nonadherent
cells were removed by changing the medium after 24 hours. The
culture medium was changed twice a week. When cells reached
confluence (after 10 to 15 days), the cell monolayer was
detached using 0.12% trypsin and 1mM EDTA and subcultured
in tissue culture plates. After 5 days, the basal level of alkaline
phosphatase activity (i.e., prior to osteogenic differentiation) was
evaluated as described below.
In order to investigate the role of AMPK as a signal-
transduction pathway for metformin in BMPCs, cells were
plated onto six-well plates and cultured until 70% confluence.
They were then serum-starved for 2 hours and incubated
with the doses of metformin indicated in the figure legends for
60 mintes. At the end of this incubation period, the cells
were processed by immunofluorescence and Western blotting
to evaluate expression and activation of AMPK, as described
below.
MOLINUEVO ET AL.

Osteogenic differentiation of rat BMPCs
BMPCs were plated at a density of 5� 104 cells/well in 24-well
plates containing 10% FBS–DMEM medium and incubated at
378C. After cells reached confluence, they were induced to
differentiate into osteoblasts using an osteogenic medium
(DMEM–10% FBS containing 25mg/mL ascorbic acid and 5mM
sodium b–glycerol-phosphate) for a further 15 or 21 days.(12) The
medium was changed twice a week. Osteoblastic differentiation
was evaluated by measuring alkaline phosphatase activity, type I
collagen production, osteocalcin expression, and extracellular
calcium deposition, as described below.
After 15 days of osteogenic differentiation, cell monolayers
were washed with phosphate-buffered saline (PBS) and lysed
with 200mL 0.1% Triton-X100. An aliquot of 100mL of the lysate
was used to evaluate alkaline phosphatase activity by the
hydrolysis of p-nitrophenylphosphate (p-NPP) into p-nitrophenol
(p-NP) at 378C for 1 hour. The absorbance of p-NP was recorded
at 405 nm.(23) Aliquots of the same extract were used for protein
determination by Bradford’s technique.(24) Type I collagen
production was evaluated as reported previously.(25) Briefly,
after 21 days of osteogenic differentiation, cell monolayers were
fixed with Bouin’s solution and stained with Sirius red dye for
1 hour. The stained material was dissolved in 1mL 0.1 N sodium
hydroxide, and the absorbance of the solution was recorded at
550 nm. Osteocalcin expression was evaluated after 21 days of
culture by Western blotting. Extracellular calcium deposits
(mineralization nodules) also were evaluated after 21 days of
culture using alizarin S red staining.(26) Stained calcium deposits
were extracted with 1mL 0.1 N sodium hydroxide, recording the
optical density at 548 nm. Alternatively, stained cultures were
observed using a Nikon microscope and photographed.
Adipogenic differentiation of rat BMPCs
To initiate adipocyte differentiation, BMPCs were grown to
confluence in 24-well plates in DMEM–10% FBS. Differentiation
to adipocytes was induced by further culturing the cells for
10 days with DMEM–10% FBS supplemented with 0.5mM
rosiglitazone (Quimica, Montpellier, Argentina), 1mM dexa-
methasone (Decadron, Sidus, Argentina), and 200 nM insulin
(Lilly, Buenos Aires, Argentina). In certain experiments, rosigli-
tazone was substituted by 3-isobutyl-1-methylxanthine (IBMX)
0.5mM as inducer of adipogenesis. To evaluate the effect of
metformin on rosiglitazone-induced adipogenesis, in some cases
cells were simultaneously incubated withmetformin (1 or 10mM)
and 0.5mM rosiglitazone for 10 days. After these culture periods,
intracellular triacylglyceride deposits were analyzed with an
enzymatic commercial kit (Wiener, Rosario, Argentina). Briefly,
100mL 0.1% Triton-X100 cell monolayer lysates were incubated
for 1 hour with reaction buffer according to the manufacturer’s
instructions, and absorbance was measured at 505 nm. Aliquots
of the same extract were used for protein determination by
Bradford’s technique.(24) In some cases, after 10 days of
differentiation, the medium was aspirated, and nonlysed cells
were stained with oil red O to detect accumulation of
intracellular lipid deposits. The cell monolayers were observed
using an Eclipse E400 Nikon microscope and photographed with
a Nikon Coolpix 4500 digital camera.
METFORMIN ACTIONS ON BONE MARROW PROGENITOR CELLS
Western blot analysis
BMPCs were grown to confluence in 6-well plates in DMEM–10%
FBS and then differentiated into either osteoblasts or adipocytes
as described earlier. At the end of different culture periods, cells
were lysed in Laemmlis buffer.(27) These lysates were heated to
1008C for 3 minutes, and 30mg of protein was subjected to 12%
SDS-PAGE. The separated proteins then were transferred to PVDF
membranes. After washing and blocking, the membranes were
incubated overnight at 48C with an antibody directed against
Cbfa1/Runx2 or osteocalcin (Santa Cruz Biotechnology, Santa
Cruz, CA, USA) for evaluation of osteoblastogenesis or against
PPARg (Santa Cruz Biotechnology, Santa Cruz, CA, USA) for
evaluation of adipogenesis. In order to normalize results, all blots
were stripped and reprobed with an anti-b-actin antibody
(Sigma, St. Louis, MO, USA). In experiments designed to
investigate AMPK, blots were probed with either an anti-total
AMPK or anti-P-AMPK antibody (Santa Cruz Biotechnology, Santa
Cruz, CA, USA) to assess the in vitro mechanism of action of
metformin.(13) Blots were developed by an enhanced chemilu-
minescence method. The intensity of the specific bands was
quantified by densitometry after scanning of the photographic
film. Images were analyzed using the Scion beta 2 program
(Scion Corporation, Frederick, MD, USA).
Immunofluorescence microscopy
Subconfluent osteoblasts grown on glass coverslips were
washed in PBS, fixed with 4% paraformaldehyde in PBS
(10 minutes at room temperature), and permeabilized with
methanol for 4 minutes at �208C.(28) Nonspecific binding sites
were blocked with 1% bovine serum albumin (BSA) in PBS for
2 hour. Cells then were incubated with anti-AMPK or anti-P-
AMPK antibodies (1:100 in blocking buffer) overnight at 48C.After washing, cells were exposed to a fluorescein isothiocyanate
(FITC) conjugated secondary antibody (1:200) for 1 hour at room
temperature. Cells were mounted in VECTA-SHIELD Mounting
Medium with 40,6-diamidino-2-phenylindole (DAPI) and observ-
ed with a Nikon fluorescence microscope. Fluorescence intensity
of each cell was semiquantified with an MBF-Image J program
(www.macbiophotonics.ca) using green global calibration.
Statistical analysis
Results are expressed as the mean� standard error of the mean
(SEM) and were obtained from three separate experiments
performed in sextuplicate. Differences between the groups were
assessed by one-way analysis of variance (ANOVA) using the
Tukey post hoc test. For nonnormally distributed data, the non
parametric Kruskal-Wallis test with the Dunn post hoc test was
performed using GraphPad In Stat version 3.00 (Graph Pad
Software, San Diego, CA, USA). p< .05 was considered significant
for all statistical analyses.
Results
In vitro direct effect of metformin on BMPC osteoblasticdifferentiation
In a first series of experiments, we evaluated the direct effect of
metformin on BMPC differentiation to osteoblastic phenotype.
Journal of Bone and Mineral Research 213
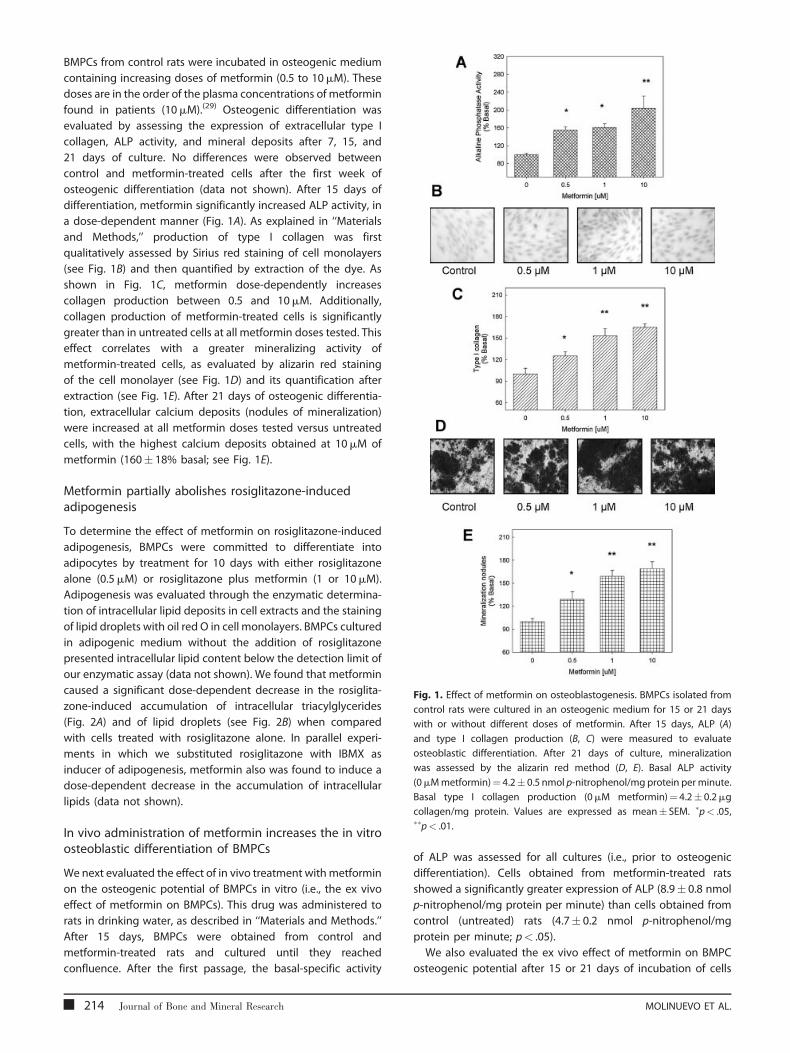
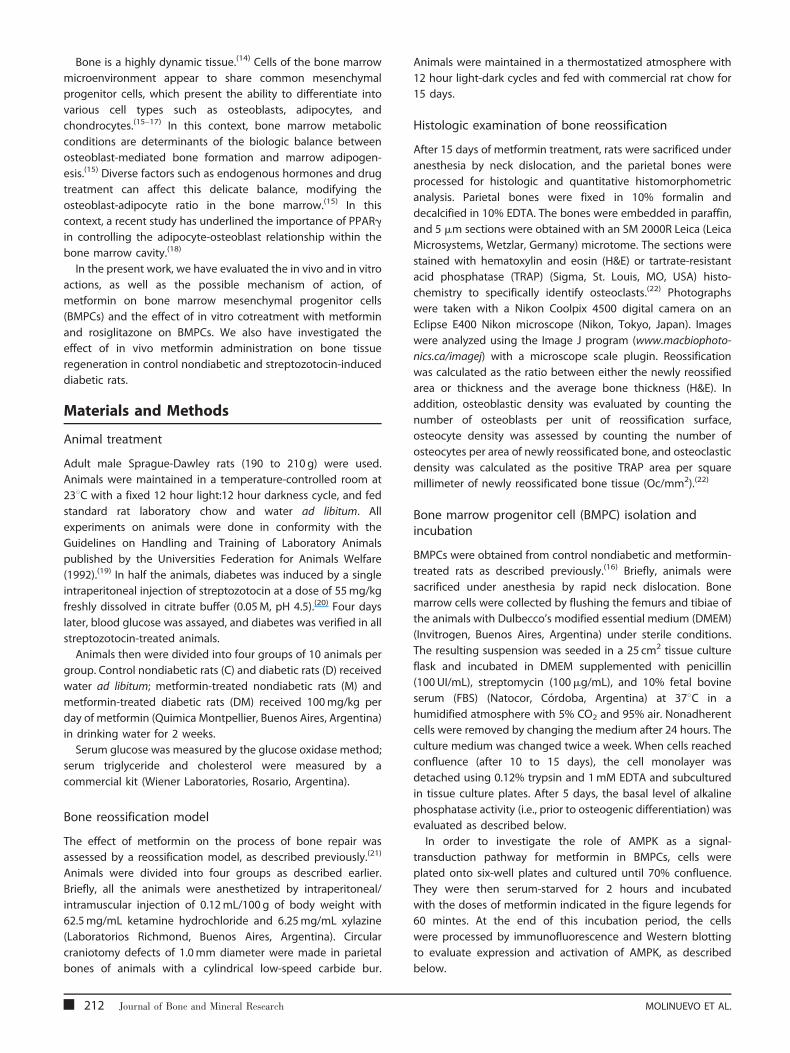
Fig. 1. Effect of metformin on osteoblastogenesis. BMPCs isolated from
control rats were cultured in an osteogenic medium for 15 or 21 days
with or without different doses of metformin. After 15 days, ALP (A)
and type I collagen production (B, C) were measured to evaluate
osteoblastic differentiation. After 21 days of culture, mineralization
was assessed by the alizarin red method (D, E). Basal ALP activity
(0mMmetformin)¼ 4.2� 0.5 nmol p-nitrophenol/mg protein per minute.
Basal type I collagen production (0mM metformin)¼ 4.2� 0.2mg
collagen/mg protein. Values are expressed as mean� SEM. �p< .05,��p< .01.
BMPCs from control rats were incubated in osteogenic medium
containing increasing doses of metformin (0.5 to 10mM). These
doses are in the order of the plasma concentrations of metformin
found in patients (10mM).(29) Osteogenic differentiation was
evaluated by assessing the expression of extracellular type I
collagen, ALP activity, and mineral deposits after 7, 15, and
21 days of culture. No differences were observed between
control and metformin-treated cells after the first week of
osteogenic differentiation (data not shown). After 15 days of
differentiation, metformin significantly increased ALP activity, in
a dose-dependent manner (Fig. 1A). As explained in ‘‘Materials
and Methods,’’ production of type I collagen was first
qualitatively assessed by Sirius red staining of cell monolayers
(see Fig. 1B) and then quantified by extraction of the dye. As
shown in Fig. 1C, metformin dose-dependently increases
collagen production between 0.5 and 10mM. Additionally,
collagen production of metformin-treated cells is significantly
greater than in untreated cells at all metformin doses tested. This
effect correlates with a greater mineralizing activity of
metformin-treated cells, as evaluated by alizarin red staining
of the cell monolayer (see Fig. 1D) and its quantification after
extraction (see Fig. 1E). After 21 days of osteogenic differentia-
tion, extracellular calcium deposits (nodules of mineralization)
were increased at all metformin doses tested versus untreated
cells, with the highest calcium deposits obtained at 10mM of
metformin (160� 18% basal; see Fig. 1E).
Metformin partially abolishes rosiglitazone-inducedadipogenesis
To determine the effect of metformin on rosiglitazone-induced
adipogenesis, BMPCs were committed to differentiate into
adipocytes by treatment for 10 days with either rosiglitazone
alone (0.5mM) or rosiglitazone plus metformin (1 or 10mM).
Adipogenesis was evaluated through the enzymatic determina-
tion of intracellular lipid deposits in cell extracts and the staining
of lipid droplets with oil red O in cell monolayers. BMPCs cultured
in adipogenic medium without the addition of rosiglitazone
presented intracellular lipid content below the detection limit of
our enzymatic assay (data not shown). We found that metformin
caused a significant dose-dependent decrease in the rosiglita-
zone-induced accumulation of intracellular triacylglycerides
(Fig. 2A) and of lipid droplets (see Fig. 2B) when compared
with cells treated with rosiglitazone alone. In parallel experi-
ments in which we substituted rosiglitazone with IBMX as
inducer of adipogenesis, metformin also was found to induce a
dose-dependent decrease in the accumulation of intracellular
lipids (data not shown).
In vivo administration of metformin increases the in vitroosteoblastic differentiation of BMPCs
We next evaluated the effect of in vivo treatment withmetformin
on the osteogenic potential of BMPCs in vitro (i.e., the ex vivo
effect of metformin on BMPCs). This drug was administered to
rats in drinking water, as described in ‘‘Materials and Methods.’’
After 15 days, BMPCs were obtained from control and
metformin-treated rats and cultured until they reached
confluence. After the first passage, the basal-specific activity
214 Journal of Bone and Mineral Research
of ALP was assessed for all cultures (i.e., prior to osteogenic
differentiation). Cells obtained from metformin-treated rats
showed a significantly greater expression of ALP (8.9� 0.8 nmol
p-nitrophenol/mg protein per minute) than cells obtained from
control (untreated) rats (4.7� 0.2 nmol p-nitrophenol/mg
protein per minute; p< .05).
We also evaluated the ex vivo effect of metformin on BMPC
osteogenic potential after 15 or 21 days of incubation of cells
MOLINUEVO ET AL.
Fig. 2. Effect of metformin on rosiglitazone-induced adipogenesis. BMPCs isolated from control rats were induced to differentiate into adipocytes with a
medium containing rosiglitazone, insulin, and dexamethasone in the presence or absence of different doses of metformin. After 10 days of culture, cell
extracts were obtained, and intracellular triacylglyceride accumulation was quantified as described in ‘‘Materials and Methods’’ (A). Alternatively, lipid
droplets were stained with oil red O in whole cells and observed with a light microscope (B). Basal triacylglyceride content (0mMmetformin)¼ 178� 6mg/
mg protein. Values are expressed as mean� SEM. �p< .05, ��p< .01.
obtained from either control or metformin-treated rats in an
osteogenic medium. After 15 days of differentiation, we found
that BMPCs from metformin-treated rats expressed higher levels
of ALP than BMPCs from control rats (Fig. 3A) and a significant
increase in type I collagen production (see Fig. 3B). Similarly, after
21 days of differentiation, we found a significant increase in
osteocalcin expression (see Fig. 3C) and in the formation of
mineralization nodules (see Fig. 3D) in BMPCs from metformin-
treated rats in comparison with BMPCs from control rats.
Metformin increases bone healing in diabetic andnondiabetic rats
We used a model of bone reossification to evaluate the effect of
the in vivo administration of metformin on bone tissue
regeneration. To this effect, we performed uniform craniotomy
defects in parietal bones as described in ‘‘Materials and
Methods’’ and allowed them to heal for 15 days. After this
period of time, this bone— in which mechanical loading can be
expected to be low—went through different stages in the repair
of intramembranous bone(30): namely, an inflammatory infiltrate
followed by formation of granulatory and fibrous tissue and
osteoclastic resorption of bone fragments and, finally, bridging
METFORMIN ACTIONS ON BONE MARROW PROGENITOR CELLS
of the lesion by a hard callus of intramembranous primary bone.
In the time span of our experiments, we were unable to find any
significant remodeling of the primary bone callus to formmature
cancellous bone.
In our experiments, both control (nondiabetic) and strepto-
zotocin-induced diabetic rats were used. The metabolic status of
the different animal groups was assessed by the biochemical
parameters showed in Table 1. At the time of sacrifice, diabetic
animals (treated or untreated with metformin) showed a 15%
reduction in body weight. Plasma glucose levels of the D and DM
groups were significantly elevated. In addition, diabetic animals
had significantly elevated cholesterol and triglyceride levels
compared with the nondiabetic control and metformin-treated
groups.
We stained the tissue sections with H&E to evaluate the
following parameters: relative quantity of newly reossified bone
(Fig. 4A–D), the number of osteocytes immersed in reossified
bone tissue (see Fig. 4E), and the number of osteoblasts on the
surface of reossified bone (see Fig. 4E). In addition, TRAP staining
was performed to evaluate the proportion of reossified surface
covered by osteoclasts (see Fig. 4F–J). Histomorphometric
analysis of the tissue sections is shown in Table 2. Diabetic
rats showed a decrease in the thickness, area, and osteoblast and
Journal of Bone and Mineral Research 215

Fig. 3. Ex vivo effect of metformin on the osteoblastic potential of BMPCs. BMPCs isolated from control or metformin-treated (100mg/kg per day) rats
were incubated in an osteogenic medium for 15 days, after which ALP activity (A) and type I collagen production (B) were measured, or BMPCs were
cultured for 21 days, after which osteocalcin (C) and mineralization nodules (D) were evaluated. Values are expressed as mean� SEM. �p< .05.
osteocyte density, of newly reossified bone when compared with
nondiabetic rats. Metformin treatment induced a significant
increase in the thickness and area of reossification in both
control and diabetic rats without affecting osteoblast and
osteocyte density. Interestingly, a significant 3.8-fold increase
was observed in the TRAP activity of nondiabetic rats after
15 days of treatment with metformin.
Effect of ex vivo metformin treatment on osteoblasticand adipogenic transcription factors
We next evaluated possible changes in the expression of the two
major transcription factors for osteoblastogenesis and adipo-
genesis, Cbfa1/Runx2 and PPARg (Fig. 5). BMPCs from either
control or metformin-treated rats were cultured in an osteogenic
or adipogenic medium for the times indicated in the figures.
Western immunoblot analysis showed that when compared with
BMPCs from basal conditions (undifferentiated cells, time 0),
BMPCs frommetformin-treated rats expressed significantly more
Table 1. Weight and Plasma Profile after 15 days of Treatment with
Diabetic Animals
Group Weight (g) Glucose (mg/dL
Control 190� 9 110� 10
Controlþmetformin 187� 6 103� 5
Diabetic 160� 7� 257� 30�
Diabeticþmetformin 155� 8��� 213� 23���
Values are mean� SEM, n¼ 10 per group.�p< .05 versus C group,��p< .05 versus CþM group.
216 Journal of Bone and Mineral Research
of the osteoblastic transcription factor Runx2 (see Fig. 5A) but a
similar amount of the adipogenic transcription factor PPARg (see
Fig. 5B). In addition, there was a time-dependent increase in
Runx2 expression after 15 and 21 days of osteoblastic
differentiation. In contrast, no changes in PPARg expression
were seen after 10 days of adipogenic differentiation in BMPCs
from metformin-treated or untreated rats.
Effect of metformin on the AMPK signalingpathway in BMPCs
In order to investigate possible signal-transduction mechanisms,
we assessed the in vitro and ex vivo effect of metformin on AMPK
signaling. We first studied the direct effect of metformin on the
activation of AMPK in BMPCs derived from control rats by both
immunofluorescence and Western blot techniques.
When analyzed by immunofluorescence, total AMPK was
found to localize in the nucleus and the cytoplasm of both
untreated and metformin-treated cells, showing no observable
or without Metformin 100 mg/kg in Control Nondiabetic and
) Cholesterol (mg/dL) Triglycerides (mg/dL)
43� 4 45� 4
36� 1 37� 3
59� 2��� 62� 5���
35� 3 48� 4
MOLINUEVO ET AL.

Fig. 4. Bone repair in a bone reossification model. A 1mm circular bone defect was performed under anesthesia in the parietal bone of control
nondiabetic rats (A, F), metformin-treated control rats (100mg/kg per day) (B, G), streptozotocin-induced diabetic rats (C, H), or metformin-treated diabetic
rats (D, I). After 15 days, all animals were sacrificed, and the parietal bones were examined by the histologic procedures detailed in ‘‘Materials and
Methods.’’ Bone sections were stained with hematoxylin & eosin (A–E) or analyzed for TRAP activity (F–J) to assess new bone formation (arrows), as well as
the density of osteocytes (E), osteoblasts (E), and osteoclasts (J). Panels (E) and (J) (control rats) are representative images of osteoblasts, osteocytes, and
osteoclasts.
difference in fluorescence intensity in either case (data not
shown). However, when we probed with an antibody that
recognizes the phosphorylated Thr172 in the a-subunit of AMPK,
we found different results (Fig. 6A). Metformin increased P-
AMPK-associated fluorescence in both the cytoplasm and the
nucleus. A semiquantitation of P-AMPK- associated fluorescence
in metformin-treated BMPCs showed that P-AMPK expression
was increased 1.5-fold versus untreated control cells in both the
nucleus and the cytoplasm.
The results obtained by immunofluorescence were further
confirmed by Western immunoblotting (see Fig. 6B). After 1 hour
of incubation, 100mM metformin significantly increased by 1.6-
fold the P-AMPK:AMPK ratio in BMPCs.
In other experiments we obtained BMPCs from both control
and metformin-treated rats and submitted them to an
Table 2. Quantitative Histomorphometric Analysis of Tissue Sections
Control
Reossification thickness/Bone thickness [%] 30� 1
Reossification area/Bone thickness [mm] 69� 9
Osteocyte number/Reossification area [mm�2] 2440� 194
Osteoblast number/Reossification length [mm�1] 145� 11
TRAP area/Reossification area [%] 2.3� 0.4
Sections of decalcified bone were stained with haematoxylin–eosin or tartrausing Image J program. Values are expressed as mean� SEM of sections.
�p< .05 vs. C group;#p< .05 vs. CþM group;�p< .05 vs D.
METFORMIN ACTIONS ON BONE MARROW PROGENITOR CELLS
osteogenic differentiation medium for 0, 15, or 21 days. After
these periods of time, we evaluated both AMPK and P-AMPK in
cell extracts by Western blotting. We found that ex vivo
metformin induced a significant 2.8-fold increase in the P-
AMPK:AMPK ratio after 21 days, with no observable difference for
0 or 15 days (see Fig. 6C).
Discussion
Bone is a complex tissue containing several cell types that is
continuously undergoing a process of self-renewal and repair
termed bone remodeling.(14) In aged people and in patients
suffering from diabetes mellitus, bone remodeling is altered, and
consequently, there is an increased skeletal fragility and fracture
risk.(1–3)
of the Lesion Area From Parietal Bones
ControlþMetformin Diabetic DiabeticþMetformin
46� 3� 19� 1�,# 43� 4�,#,�
143� 11� 16� 4�,# 160� 10�,�
2943� 226 993� 132�,# 854� 103�,#
156� 16 60� 6�,# 49� 9�,#
8.8� 1.7� 2.9� 0.1# 2.4� 0.9#
te resistance acid phosphatase (TRAP) (for osteoclasts) and quantitated
Journal of Bone and Mineral Research 217
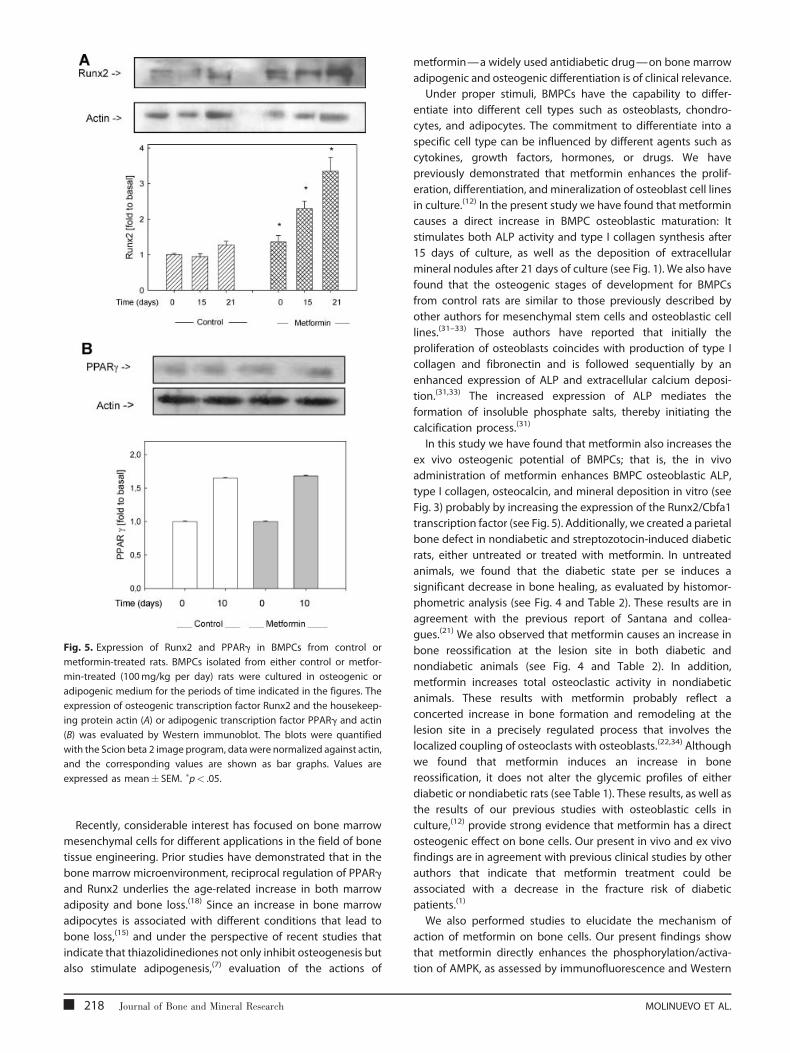
Fig. 5. Expression of Runx2 and PPARg in BMPCs from control or
metformin-treated rats. BMPCs isolated from either control or metfor-
min-treated (100mg/kg per day) rats were cultured in osteogenic or
adipogenic medium for the periods of time indicated in the figures. The
expression of osteogenic transcription factor Runx2 and the housekeep-
ing protein actin (A) or adipogenic transcription factor PPARg and actin
(B) was evaluated by Western immunoblot. The blots were quantified
with the Scion beta 2 image program, data were normalized against actin,
and the corresponding values are shown as bar graphs. Values are
expressed as mean� SEM. �p< .05.
Recently, considerable interest has focused on bone marrow
mesenchymal cells for different applications in the field of bone
tissue engineering. Prior studies have demonstrated that in the
bone marrow microenvironment, reciprocal regulation of PPARg
and Runx2 underlies the age-related increase in both marrow
adiposity and bone loss.(18) Since an increase in bone marrow
adipocytes is associated with different conditions that lead to
bone loss,(15) and under the perspective of recent studies that
indicate that thiazolidinediones not only inhibit osteogenesis but
also stimulate adipogenesis,(7) evaluation of the actions of
218 Journal of Bone and Mineral Research
metformin—a widely used antidiabetic drug—on bone marrow
adipogenic and osteogenic differentiation is of clinical relevance.
Under proper stimuli, BMPCs have the capability to differ-
entiate into different cell types such as osteoblasts, chondro-
cytes, and adipocytes. The commitment to differentiate into a
specific cell type can be influenced by different agents such as
cytokines, growth factors, hormones, or drugs. We have
previously demonstrated that metformin enhances the prolif-
eration, differentiation, and mineralization of osteoblast cell lines
in culture.(12) In the present study we have found that metformin
causes a direct increase in BMPC osteoblastic maturation: It
stimulates both ALP activity and type I collagen synthesis after
15 days of culture, as well as the deposition of extracellular
mineral nodules after 21 days of culture (see Fig. 1). We also have
found that the osteogenic stages of development for BMPCs
from control rats are similar to those previously described by
other authors for mesenchymal stem cells and osteoblastic cell
lines.(31–33) Those authors have reported that initially the
proliferation of osteoblasts coincides with production of type I
collagen and fibronectin and is followed sequentially by an
enhanced expression of ALP and extracellular calcium deposi-
tion.(31,33) The increased expression of ALP mediates the
formation of insoluble phosphate salts, thereby initiating the
calcification process.(31)
In this study we have found that metformin also increases the
ex vivo osteogenic potential of BMPCs; that is, the in vivo
administration of metformin enhances BMPC osteoblastic ALP,
type I collagen, osteocalcin, and mineral deposition in vitro (see
Fig. 3) probably by increasing the expression of the Runx2/Cbfa1
transcription factor (see Fig. 5). Additionally, we created a parietal
bone defect in nondiabetic and streptozotocin-induced diabetic
rats, either untreated or treated with metformin. In untreated
animals, we found that the diabetic state per se induces a
significant decrease in bone healing, as evaluated by histomor-
phometric analysis (see Fig. 4 and Table 2). These results are in
agreement with the previous report of Santana and collea-
gues.(21) We also observed that metformin causes an increase in
bone reossification at the lesion site in both diabetic and
nondiabetic animals (see Fig. 4 and Table 2). In addition,
metformin increases total osteoclastic activity in nondiabetic
animals. These results with metformin probably reflect a
concerted increase in bone formation and remodeling at the
lesion site in a precisely regulated process that involves the
localized coupling of osteoclasts with osteoblasts.(22,34) Although
we found that metformin induces an increase in bone
reossification, it does not alter the glycemic profiles of either
diabetic or nondiabetic rats (see Table 1). These results, as well as
the results of our previous studies with osteoblastic cells in
culture,(12) provide strong evidence that metformin has a direct
osteogenic effect on bone cells. Our present in vivo and ex vivo
findings are in agreement with previous clinical studies by other
authors that indicate that metformin treatment could be
associated with a decrease in the fracture risk of diabetic
patients.(1)
We also performed studies to elucidate the mechanism of
action of metformin on bone cells. Our present findings show
that metformin directly enhances the phosphorylation/activa-
tion of AMPK, as assessed by immunofluorescence and Western
MOLINUEVO ET AL.

Fig. 6. Effect of metformin on AMPK activation in BMPCs derived from contol or metformin-treated rats. BMPCs were isolated from untreated control rats
(A, B). After reaching confluence, cells were serum starved for 2 hours and further incubated for 1 hour in the absence (control) or the presence of 100mM
metformin. After this incubation period, cells were processed by immunofluorescence (A) or Western immunoblot (B) to detect AMPK and/or P-AMPK. In
other experiments, BMPCs were isolated from untreated control or metformin-treated rats (C). After they reached confluence, cells were induced to
differentiate in an osteogenic medium for 0, 15, or 21 days. At the end of this culture period, cells were extracted with Laemmli buffer and processed for P-
AMPK and AMPK detection by Western immunoblot. The blots were quantified with the Scion beta 2 image program, and the P-AMPK:AMPK ratio was
determined for each experimental condition. Data are representative of three different experiments. �p< .05 versus control.
blotting in BMPCs. These results agree with the previous
observations of Kanazawa and colleagues(13) in MC3T3E1
osteoblastic cells. These authors showed that metformin-
induced osteoblastic differentiation was associated with AMPK
METFORMIN ACTIONS ON BONE MARROW PROGENITOR CELLS
activation and with enhanced expression of eNOS and BMP-2
mRNA. Using this same osteoblastic cell line, we also have
demonstrated previously(12) that metformin exerts a direct
osteogenic effect associated with MAPK activation and an
Journal of Bone and Mineral Research 219
increase in e/iNOS protein expression. In our present results, we
have found that BMPCs obtained from metformin-treated rats
and submitted to an osteogenic medium for 15 to 21 days
express significantly higher levels of osteoblastic markers in
comparison with BMPCs from untreated rats (see Fig. 3). These
findings can be associated with a parallel increase in Runx2/
Cbfa1 expression (see Fig. 5A) and in the phosphorylation/
activation of AMPK (see Fig. 6C) after 15 to 21 days of osteogenic
differentiation. Altogether, our previous and present observa-
tions suggest that metformin can induce commitment of
osteoprogenitor cells to the osteoblastic phenotype and bone
formation by exerting direct effects on bone cells. The
mechanism of action of metformin appears to be mediated
by MAPK, e/iNOS, and AMPK signaling.
In addition, our present results indicate that metformin at
clinically relevant doses(29) can partially block the proadipogenic
effect of rosiglitazone on BMPCs (see Fig. 2); however, treatment
with metformin does not affect expression of the transcription
factor PPARg versus control (see Fig. 5B). Rosiglitazone is an
efficient insulin-sensitizing drug that unfortunately presents
adipogenic side effects in the bone marrow microenvironment
and that is administered frequently as monotherapy or in
combination with other oral antidiabetic drugs such as
metformin for the treatment of patients with type 2 diabetes
mellitus.(6) Large prospective clinical trials have shown recently
that rosiglitazone intake is associated with an increased fracture
rate.(35,36) In the A Diabetes Outcome Progression Trial (ADOPT),
this was demonstrated in subjects with recently diagnosed type
2 diabetes, previously naive to oral antidiabetic drugs, who were
randomized to taking either rosiglitazone, metformin, or
glyburide as monotherapy for an average 4 years.(35) Fractures
were seen predominantly in the lower and upper limbs (in the
hip and wrist). However, it should be noticed that in the present
studies we have used an in vivo model of parietal bone defects
that does not support mechanical loading, as is the case for long
bones. In addition, the healing of the defect used in our study
occurs in a relatively short period of time (15 days), and the
reossification process is intramembranous, meaning that its
healing does not include soft callus formation, as in endochon-
dral bone repair, but involves direct bridging of the lesion by a
hard callus of primary bone, which is then remodeled into
mature bone by the combined action of osteoclasts and
osteoblasts.(30) In our model of bone healing, metformin was
found to simultaneously increase reossification and osteoclastic
activity in the lesion site, suggesting a concerted increase in
bone formation and remodeling.
Additionally, our results show in an in vitro model a reversion
of rosiglitazone proadipogenic effects on BMPC differentiation
by cotreatment with metformin. However, we cannot extra-
polate these results to humans. Further clinical investigations are
needed to prove that this drug association has similar effects in
human patients.
In conclusion, our results show that metformin increases the
osteogenic induction of BMPCs both in vitro and in vivo and
enhances the process of bone repair in diabetic and nondiabetic
rats. The osteogenic actions of metformin on BMPCs are
associated both with an increase in the expression of
osteoblast-specific transcription factor Runx2/Cbfa1 and with
220 Journal of Bone and Mineral Research
an increase in the phosphorylation of AMPK. Moreover,
metformin is able to partially inhibit the adipogenic action of
rosiglitazone on BMPCs. Further investigations are needed to
elucidate the in vivo significance of the inhibition by metformin
of rosiglitazone-induced bone marrow adipogenesis.
Disclosures
The authors state that they have no conflicts of interest.
Acknowledgments
We would like to thank Quımica (Montpellier, Argentina) for
providing the rosiglitazone and metformin used in this study.
This study was supported in part by grants from the Universidad
Nacional de La Plata, Agencia Nacional de Promocion Cientıfica y
Tecnologica (ANPCyT) (BID-1728/OC-AR, PAE No. 22398), Comi-
sion de Investigaciones Cientıficas de la Provincia de Buenos
Aires (CICPBA), and Quimica Montpellier. MSM is a member of
Carrera del Investigador CONICET. AMC is a member of Carrera
del Investigador CICPBA, and MVG is a fellow of CICPBA.
References
1. Vestergaard P, Rejnmark L, Mosekilde L. Relative fracture risk in
patients with diabetes mellitus, and the impact of insulin and oral
antidiabetic medication on relative fracture risk. Diabetologia.2005;48:1292–1299.
2. Carnevale V, Romagnoli E, D’Erasmo E. Skeletal involvement in
patients with diabetes mellitus. Diabetes Metab Res Rev. 2004;20:
196–204.
3. Krakauer JC, McKenna MJ, Buderer NF, Rao DS, Whitehouse FW,
Parfitt AM. Bone loss and bone turnover in diabetes. Diabetes,
1995;44:775–782.
4. Yamagishi S, Nakamura K, Inoue H. Possible participation ofadvanced glycation end- products in the pathogenesis of osteoporo-
sis in diabetic patients. Med Hypotheses. 2005;65:1013–1015.
5. Vlassara H, Palace MR. Diabetes and advanced glycation end-pro-
ducts. J Intern Med. 2002;251:87–101.
6. Gin H, Rigalleau V. Oral anti diabetic polychemotherapy in type 2
diabetes mellitus. Diabetes Metab. 2002;28:350–353.
7. Lecka-Czernik B, Gubrij I, Moerman EJ, et al., Inhibition of Osf2/Cbfa1expression and terminal osteoblast differentiation by PPARg2. J Cell
Biochem. 7 1999;4:357–371.
8. Rzonca SO, Suva LJ, Gaddy D, Montague DC, Lecka-Czernik B. Bone is
a target for the antidiabetic compound rosiglitazone. Endocrinology.2004;145:401–406.
9. Lecka-Czernik B, Moerman EJ, Grant DF, Lehmann JM, Manolagas SC,
Jilka RL. Divergent effects of selective peroxisome proliferator-acti-
vated receptor-gamma 2 ligands on adipocyte versus osteoblastdifferentiation. Endocrinology. 2002;143:2376–2384.
10. Gimble JM, Robinson CE, Wu X, Kelly KA. The function of adipocytes in
the bone marrow stroma: an update. Bone. 1996;19:421–428.
11. Lazarenko OP, Rzonca SO, Suva LJ, Lecka-Czernik B. Netoglitazone is a
PPAR-g ligand with selective effects on bone and fat. Bone.
2006;38:74–84.
12. Cortizo AM, Sedlinsky C, McCarthy AD, Blanco A, Schurman L.Osteogenic actions of the anti-diabetic drug metformin on osteo-
blasts in culture. Eur J Pharmacol. 2006;536:38–46.
13. Kanazawa I, Yamaguchi T, Yano S, Yamauchi M, Sugimoto T. Met-
formin enhances the differentiation and mineralization of osteoblas-
MOLINUEVO ET AL.

tic MC3T3-E1 cells via AMP kinase activation as well as eNOS andBMP-2 expression. Biochem Biophys Res Commun. 2008;75:414–
419.
14. Harada S, Rodan GA. Control of osteoblast function and regulation of
bone mass. Nature. 2003;423:349–355.
15. Nuttall ME, Gimble JM. Controlling the balance between osteoblas-
togenesis and adipogenesis and the consequent therapeutic impli-
cations. Curr Opin Pharmacol. 2004;4:290–294.
16. Tropel P, Noel D, Platet N, Legrand P, Benabid AL, Berger F. Isolation
and characterisation of mesenchymal stem cells from adult mouse
bone marrow. Exp Cell Res. 2004;295:395–406.
17. Pittenger MF, Mackay AM, Beck SC, et al. Multilineage potential ofadult human mesenchymal stem cells. Science. 1999;284:143–147.
18. Akune T, Ohba S, Kamekura S, et al. PPAR-g insufficiency enhances
osteogenesis through osteoblast formation from bone marrow pro-
genitors. J Clin Invest. 2004;113:846–855.
19. Guidelines on the handling and training of laboratory animals. In:
The Biological Council of Animal Research and Welfare Panel. Potters
Bar, England: Universities Federation for Animal Welfare (UFAW),
1992.
20. El-Batran SA, Abdel-Salam OME, Nofal SM, Baiuomy AR. Effect of
rosiglitazone and nateglinide on serum glucose and lipid profile
alone or in combination with the biguanide metformin in diabeticrats. Pharmacol Res. 2006;53:69–74.
21. Santana RB, Xu L, Chase HB, Amar S, Graves DT, Trackman PC. A role
for advanced glycation end products in diminished bone healing in
type 1 diabetes. Diabetes. 2003;52:1502–1510.
22. Schell H, Lienau J, Epari DR, et al. Osteoclastic activity begins early
and increases over the course of bone healing. Bone. 2006;38:547–
554.
23. Cortizo AM, Etcheverry SB. Vanadium derivatives act as growthfactor-mimetic compounds upon differentiation and proliferation
of osteoblast-like UMR106 cells. Mol Cell Biochem. 1995;145:97–
102.
24. Bradford MM. A rapid and sensitive method for the quantitation of
microgram quantities of protein utilizing the principle of protein-dye
binding. Anal Biochem. 1976;72:248–254.
METFORMIN ACTIONS ON BONE MARROW PROGENITOR CELLS
25. Tullberg-Reinert H, Jundt G. In situ measurement of collagen synth-esis by human bone cells with a Sirius red-based colorimetric
microassay: effects of transforming growth factor b2 and ascorbic
acid 2-phosphate. Histochem Cell Biol. 1999;112:271–276.
26. Ueno A, Kitase Y, Moriyama K, Inoue H. MC3T3-E1-conditionedmedium-induced mineralization by clonal rat dental pulp cells.
Matrix Biol. 2001;20:347–355.
27. Laemmli UK. Cleavage of structural protein during the assembly ofthe head of bacteriophage T4. Nature. 1970;227:680–685.
28. Mercer N, Ahmed H, McCarthy AD, Etcheverry SB, Vasta GR, Cortizo
AM. AGE-R3/galectin-3 expression in osteoblast-like cells: regulation
by AGEs. Mol Cell Biochem. 2004;266:17–24.
29. Bailey CJ, Turner RC. Metformin. N Engl J Med. 1996;334:574–579.
30. Schindeler A, McDonald MM, Bokko P, Little DG. Bone remodeling
during fracture repair: the cellular picture. Semin Cell Dev Biol.
2008;19:459–466.
31. Kume S, Kato S, Yamagishi S, et al. Advanced glycation end-products
attenuate human mesenchymal stem cells and prevent cognate
differentiation into adipose tissue, cartilage, and bone. J Bone Miner
Res. 2005;20:1647–1658.
32. Siggelkow H, Rebenstorff K, Kurre W, et al. Development of the
osteoblast phenotype in primary human osteoblasts in culture:
comparison with rat calvarial cells in osteoblast differentiation.J Cell Biochem. 1999;75:22–35.
33. Quarles LD, Yohay DA, Lever LW, Caton R, Wenstrup RJ. Distinct
proliferative and differentiated stages of murine MC3T3-E1 cells in
culture: an in vitro model of osteoblast development. J Bone MinerRes. 1992;7:683–692.
34. Horowitz MC, Xi Y, Wilson K, Kacena MA. Control of osteoclastogen-
esis and bone resorption by members of the TNF family of receptors
and ligands. Cytokine Growth Factor Rev. 2001;12:9–18.
35. Kahn SE, Zinman B, Lachin JM, et al. Rosiglitazone-associated frac-
tures in type 2 diabetes: an analysis from A Diabetes Outcome
Progression Trial (ADOPT). Diabetes Care. 2008;31:845–851.
36. Meier C, Kraenzlin ME, Bodmer M, Jick SS, Jick H, Meier CR. Use of
thiazolidinediones and fracture risk. Arch Intern Med. 2008;168:820–
825.
Journal of Bone and Mineral Research 221