Effect of high-level fish meal replacement by plant proteins in gilthead sea bream (Sparus aurata)...
32
Please note that this is an author-produced PDF of an article accepted for publication following peer review. The definitive publisher-authenticated version is available on the publisher Web site 1 Aquaculture Nutrition October 2007, Volume 13, Issue 5, Pages 361 - 372 http://dx.doi.org/10.1111/j.1365-2095.2007.00485.x © 2009 Wiley Blackwell Publishing, Inc. The definitive version is available at www.blackwell-synergy.com Archimer, archive institutionnelle de l’Ifremer http://www.ifremer.fr/docelec/ Effect of high-level fish meal replacement by plant proteins in gilthead sea bream (Sparus aurata) on growth and body/fillet quality traits M. De Francesco 1 , G. Parisi 1 , J. Pérez-Sanchez 2 , P. Gomez-Réqueni 2 , F. Médale 3 , S.J. Kaushik 3 , M. Mecatti 1 & B.M. Poli 1, * 1 Dipartimento di Scienze Zootecniche, Università degli Studi di Firenze, Florence, Italy 2 Instituto de Acuicultura de Torre de la Sal (CSIC), Castellòn, Spain 3 Fish Nutrition Laboratory, UMR NuAGe, INRA–IFREMER – Univ. Bordeaux I, Station d'Hydrobiologie, Saint Pée-sur-Nivelle, France *: Corresponding author : Poli B. M., email address : [email protected] Abstract: Juvenile gilthead sea bream (initial body weight ca. 100 g) were reared in an indoor flow through marine water system for 1 year. Fish were fed two isoenergetic [19.2 kJ g −1 dry matter (DM)] and isoproteic (426 g kg −1 DM) diets either based on fish meal (diet FM) or on a mixture of plant protein sources (diet PP), replacing 75% of fish meal protein. The growth trial was conducted in duplicate, two tanks for each dietary treatment. Growth performance and feed utilization were registered. Fillet quality parameters were evaluated and sensory analyses on cooked fillet were performed. Both groups had similar weight gain and specific growth rates. Feed intake was higher in sea bream fed diet FM (0.48 versus 0.44), while feed efficiency and protein efficiency ratio were significantly higher in sea bream fed PP (0.83 versus 0.77 and 2.0 versus 1.76, respectively). Sea bream fed diet FM had a lower hepatosomatic index (0.80 versus 0.87%), and a higher fillet yield (45.9 versus 44.9%). The fillet from sea bream fed diet FM had higher moisture (696 versus 682 g kg −1 ), lower lipid levels (91 versus 100 g kg −1 ) with higher levels of n-3 polyunsaturated fatty acids (PUFA) and monounsaturated fatty acids (MUFA), while the PP fed sea bream presented a higher level of PUFA n-6. There were minor differences in muscle free amino acid levels between the two diet groups. As regards sensory evaluation of cooked fillet, the judges were unable to discriminate the two dietary groups of fish. Summarizing, the results demonstrate the possibility to use diets containing high levels (750 g kg −1 ) of plant ingredients in gilthead sea bream without affecting growth performance and with minor effects on quality traits of commercial size sea bream. Keywords: chemical composition • gilthead sea bream • plant protein • quality traits • sensory evaluation • Sparus aurata
Transcript of Effect of high-level fish meal replacement by plant proteins in gilthead sea bream (Sparus aurata)...

Ple
ase
note
that
this
is a
n au
thor
-pro
duce
d P
DF
of a
n ar
ticle
acc
ept
ed fo
r pu
blic
atio
n fo
llow
ing
peer
rev
iew
. The
def
initi
ve p
ub
lish
er-a
uthe
ntic
ated
ve
rsio
n is
ava
ilab
le o
n th
e pu
blis
her
Web
site
1
Aquaculture Nutrition October 2007, Volume 13, Issue 5, Pages 361 - 372 http://dx.doi.org/10.1111/j.1365-2095.2007.00485.x © 2009 Wiley Blackwell Publishing, Inc. The definitive version is available at www.blackwell-synergy.com
Archimer, archive institutionnelle de l’Ifremer http://www.ifremer.fr/docelec/
Effect of high-level fish meal replacement by plant proteins in gilthead sea bream (Sparus aurata) on growth and body/fillet quality traits
M. De Francesco1, G. Parisi1, J. Pérez-Sanchez2, P. Gomez-Réqueni2, F. Médale3, S.J. Kaushik3, M.
Mecatti1 & B.M. Poli1, * 1 Dipartimento di Scienze Zootecniche, Università degli Studi di Firenze, Florence, Italy 2 Instituto de Acuicultura de Torre de la Sal (CSIC), Castellòn, Spain 3 Fish Nutrition Laboratory, UMR NuAGe, INRA–IFREMER – Univ. Bordeaux I, Station d'Hydrobiologie, Saint Pée-sur-Nivelle, France *: Corresponding author : Poli B. M., email address : [email protected]
Abstract: Juvenile gilthead sea bream (initial body weight ca. 100 g) were reared in an indoor flow through marine water system for 1 year. Fish were fed two isoenergetic [19.2 kJ g−1 dry matter (DM)] and isoproteic (426 g kg−1 DM) diets either based on fish meal (diet FM) or on a mixture of plant protein sources (diet PP), replacing 75% of fish meal protein. The growth trial was conducted in duplicate, two tanks for each dietary treatment. Growth performance and feed utilization were registered. Fillet quality parameters were evaluated and sensory analyses on cooked fillet were performed. Both groups had similar weight gain and specific growth rates. Feed intake was higher in sea bream fed diet FM (0.48 versus 0.44), while feed efficiency and protein efficiency ratio were significantly higher in sea bream fed PP (0.83 versus 0.77 and 2.0 versus 1.76, respectively). Sea bream fed diet FM had a lower hepatosomatic index (0.80 versus 0.87%), and a higher fillet yield (45.9 versus 44.9%). The fillet from sea bream fed diet FM had higher moisture (696 versus 682 g kg−1), lower lipid levels (91 versus 100 g kg−1) with higher levels of n-3 polyunsaturated fatty acids (PUFA) and monounsaturated fatty acids (MUFA), while the PP fed sea bream presented a higher level of PUFA n-6. There were minor differences in muscle free amino acid levels between the two diet groups. As regards sensory evaluation of cooked fillet, the judges were unable to discriminate the two dietary groups of fish. Summarizing, the results demonstrate the possibility to use diets containing high levels (750 g kg−1) of plant ingredients in gilthead sea bream without affecting growth performance and with minor effects on quality traits of commercial size sea bream. Keywords: chemical composition • gilthead sea bream • plant protein • quality traits • sensory evaluation • Sparus aurata

4
1. Introduction
Production of gilthead sea bream in the Mediterranean area has increased remarkably
over the past decade reaching more than 80 000 tons and the forecasts indicate further
increase in marine finfish production (FAO, 2003). The question of sustainable
development of aquaculture in the general context of increasing demand combined with
the relative stability in supply of fish meal and fish oil (New and Wijkstroem, 2002) is a
very contemporary issue. Development of feeds with significantly reduced levels of fish
meal and fish oil is recognised by all as a major step towards reducing the pressure on
scarce marine resources at a global level (FAO, 2001). At the farm level, the
substitution of fish meal could have a positive effect on production costs (Hardy, 1996)
as well as on aquaculture waste management by lowering the content in phosphorus
(Storebakken et al., 2000; Kaushik et al., 2004) and or nitrogen responsible for
eutrophication (Tacon and Forster, 2003). Possible amino acid imbalance and the
presence of antinutritional factors often limit the use of terrestrial plant ingredients in
fish feed (Kaushik, 1990; Tacon, 1997; Francis et al., 2001). In rainbow trout, total
replacement of fish meal by plant proteins did not affect fish growth (Kaushik et al.,
1995; Watanabe et al., 1998), although long term feeding with plant protein based diets
results in reduced weight gain in large size rainbow trout (de Francesco et al., 2004).
Improvements in feed preparing technologies and the possibility to add synthetic amino
acids have enabled promising results in different marine species fed with diet containing
up to 30% of plant protein (Robaina et al., 1995; Burel et al., 2000; Gouveia and
Davies, 2000; Kissil et al., 2000; Pereira and Oliva-Teles, 2002). Inclusion of high
percentage level (from 50% to 100%) of plant protein in feedstuff for marine species,
generally results in growth reduction (Burel et al., 2000; Kissil et al., 2000). However,
recent studies suggest that almost total replacement of fish meal by vegetable
ingredients in diet for European sea bass does not affect fish growth or feed utilisation

5
(Kaushik et al., 2004). In a recent study that represent an earlier phase of our work,
Gómez-Requeni et al. (2004) found that replacement of 50 or 75% of fish meal in diet
for juveniles sea bream, led to slightly decreased growth performance in comparison to
fish fed a fish meal based diet, but that a total substitution of fish meal reduced growth
performances by about 30%. In the present study we tested the same diets used by
Gómez-Requeni et al. (2004), in the same rearing conditions, for evaluating their effects
in a long duration trial, from on-growing up to market size sea bream, focalising our
attention on quality aspects.
The effect of plant protein ingredients in feeds for farmed fish on chemical composition
of muscle show contrasting results. Some studies have reported that inclusion of
increasing levels (from 10% to 30%) of plant ingredients in feed for European sea bass
(Gouveia and Davies, 2000) or gilthead sea bream (Pereira and Oliva-Teles, 2002) does
not affect the whole body lipid content. On the other hand, Robaina et al. (1998)
observed a decrease in muscle total lipid content in sea bream fed diet containing 30%
of soy by products and Kissil et al. (2000) reported a decrease in whole body lipid
content in sea bream fed a 100% of fish meal substitution diets based either on soybean
or rapeseed protein concentrates. In contrast with these results an increase of fat in fish
fed diets containing increasing level of plant ingredients was observed in trout (Burel et
al., 2000) and in sea bass (Kaushik et al., 2004). In marine fish, Aoki et al. (1996) did
not find any difference in flesh quality between adult red sea bream fed with or without
fish meal as dietary protein source. Kaushik et al. (1995) and de Francesco et al. (2004)
showed that in rainbow trout fed diets containing plant ingredients the organoleptic
characteristics were slightly affected by dietary protein source. Given the lack of
information on the effects of dietary plant protein sources on flesh quality of marketable
size gilthead sea bream, the aim of the present study was to evaluate the effect of a high
percentage of fish meal replacement by a mixture of plant protein sources on growth,

6
morphological traits and quality of commercial sized gilthead sea bream reared over a
full annual cycle.
2. Materials and methods
Diets
Two isoenergetic and isoproteic (gross energy 19.2 k Jg-1
DM; crude protein 426 g kg-1
DM) diets, formulated to contain either fish meal as the exclusive protein source (diet
FM) or 75% of protein from fish meal supplied by a mixture of plant protein sources
such as corn gluten meal, wheat gluten, extruded peas, rapeseed meal and extruded
whole wheat (diet PP), were used in this study (Table 1). Crystalline amino acids were
added to the plant protein-based diet to meet the IAA requirement profile according to
the NRC (1993). All dry ingredients were mixed and pelleted dry (4 mm diameter)
using a Simon-Heese (Boxtel, Netherlands) pelleting machine. The PP diet was free of
genistein and daidzein and had a negligible estrogenic potency. The proximate
composition of the diets was determined according to the A.O.A.C. (1990) (Table 1).
The fatty acid composition of the diets is reported in Table 2, while the amino acids
profile of the tested diets has been previously described by Gómez-Requeni et al.
(2004). The diets were stored at 4°C during the trial.
Growth trial
Sea bream (S. aurata) were reared in the experimental rearing facilities of CSIC
(Institute of Aquaculture, Torre de la Sal, Spain) in an indoor flow trough filtered
marine water system, in circular glass fiber tanks (3000 l). Daylength followed natural
changes, salinity was 37.5 g L-1
, water flow was 100 l/ min and oxygen content of outlet
water was daily monitored and always higher than 85% of saturation. As we used
natural marine water, the temperature reflected seasonal changes in this Mediterranean
7
area (latitude: 40° 5’N, 0° 10’E), where gilthead sea bream is normally grown (Fig.1),
ranging from 10 to 25°C. Sea bream, obtained from a commercial hatchery (CUPIMAR,
Cádiz, Spain), were adapted to the experimental condition over twenty days and were
fed commercial diets until the start of the study. Duplicate groups of 60 fish (average
initial body weight 99.4 g) were hand-fed the respective diets to visual satiety in one
(cold season) or two (warm season) meals over one year. The fish were group-weighed
and counted each month, under moderate anaesthesia (3-aminobenzoic acid ethyl ester,
MS 222; 100 µg/ml) after overnight fasting, to gain information on growth and feed
intake. At the end of the growth trial, sea bream were kept unfed for two days, then
were cold stunned, sacrificed by a blow on the head and stored at 3-4 °C on ice.
Whole body measurements and chemical composition analyses
Fish (n=100 FM and n=100 PP) were individually weighed, and the following
measurements were made using an orthometric meter: total and standard length (cm),
head length (cm), and maximum height (cm) (Fig.2). From linear and weight measures,
morphometric indices, such as the condition factor = (100 x body weight/total length3),
agility index (distance between caudal plane and maximum height plane/maximum
height), cranial index (head length/total length) and relative profile (maximum
height/total length) (Geri et al., 1994), were computed. Whole body composition was
determined in a pooled sample of 10 fish at the beginning and in pools of 5 fish per tank
at the end of growth trial. Specimens for body analysis were ground, and small aliquots
were dried (105 °C) to estimate water content. The remaining samples were freeze-dried
and chemical analysis for protein, fat and ash was performed according to the A.O.A.C
(1995). Based on data from chemical composition at the beginning and at the end of the
trial, retention efficiencies and daily nitrogen and fat gains were calculated.

8
One hundred and thirty two fish were completely dissected (n=66 FM and n=66 PP),
and the main body components (fins, gills, head, liver, digestive tract, mesenteric fat,
viscera) were weighed and their relative incidence to whole body mass were computed.
The dressed weight (%) and fillet yield (fillets with skin, % of body weight) were also
calculated, this last computed as twice the right fillet weight. Due to the complexity of
the experimental design the protocol previewed to use different part of the same fish for
various analyses, thus it was impossible to conform the number of subjects used for
different determinations such as morphometric data, body components, commercial
traits, fillet composition and liver composition. This is the reason why in the tables 4-8,
the number of samples is very variable.
Proximate analysis, fatty acid composition and free amino acids
Fillets and livers were vacuum packed and stored on dry ice prior to chemical
composition analysis: moisture, crude protein, ash and phosphorus according to
A.O.A.C. (1995) and total lipids according to Folch et al. (1957). Fatty acid
composition of fillets (30 for each diet) and livers (8 samples for each diet, obtained
grouping the liver of 3 different fish from the same tank) was analysed by quantitative
gas chromatography (utilising C23:0 as internal standard) on the extracted lipids
(Morrison and Smith, 1964). Atherogenicity and thrombogenicity indexes were also
calculated (Ulbricht and Southgate, 1991). Total cholesterol content was determined by
chromatography (utilising colestane as internal standard), in isotermic conditions (290
°C) with a capillary column (Supelco SPBT -5: 30m, id 0,32 mm film 0,25 mm).
From 6 fish per dietary treatment, immediately after death and after 11 days of
refrigerated storage, a sample of the anterior portion of the dorsal muscle was
withdrawn, frozen in liquid nitrogen and stored at -80 °C to analyse the free amino acids
9
content after a trichloroacetic acid (1g muscle/ 9 ml TCA 10%) extraction by HPLC
with a post column ninydrine derivatization (Moore and Stein, 1951).
The free amino acids content was analysed at the beginning of the shelf-life and at the
11th
days after death (Scheme 1), when fish of both group were judged as unfit by a
trained panel test (unpublished data), to evaluate eventual modifications on this
parameters in not edible fish.
Degradation products
The malonaldehyde-TBA complex with solid-phase extraction (Raharjo et al., 1993) for
oxidised lipids was determined on whole fillet at 2, 6, and 9 days of refrigerated storage
(Scheme 1).
Instrumental colour measurement
Colour measures were made using a CR-200 Chroma Meter (Minolta, U.K.), each day
from the death until the end of the shelf life (when fish were judged as unfit for human
consumption) (Scheme 1). Colorimetric measurements on whole sea bream (n=82 for
each diet) stored on ice at 1 °C were made in three different skin sites (opercular,
abdominal and rostral) in order to analyse the eventual colour spots. Therefore on intact
right fillets (n=64 for each diet), withdrawn at different sampling time from whole fish
stored at 3-4 °C, the colour measurements were made at the cephalic epaxial, ventral
and caudal sites. Triplicate measurements were taken at each site, to give a mean value
for each area. Data were expressed using the L* a* b* system, representing lightness,
redness and yellowness as indicated by the CIE (1976); in addition, the values of the
chroma [√ (a*2 + b*
2)], which defines the saturation of colour, and the angle of hue
[tan-1
(b* / a*)] were calculated.

10
Sensory evaluation on cooked fillet
A sensory evaluation was made on fillets withdrawn from whole fish stored with ice at
1 °C, after 3 days of refrigerated storage, when sea bream were still fresh, and after 7
days, when sea bream were still edible (Scheme 1). The epaxial portion of each fillet
with skin was divided into 4 portions (8 portions from each fish), wrapped in a special
microwave oven paper and cooked in a microwave oven (Moulinex Optiquick
Compact), at 500 watt for 50 seconds. A trained panel consisting of 9 judges evaluated
in duplicate by a triangular test (ISO, 1983) the fillet portions in air-conditioned
individual boxes, designed for sensory analysis (ISO, 1988). The triangular test is a
forced-choice procedure, which indicates whether or not a detectable difference exists
between two samples. The assessors receive three cooked samples, are told that two of
the samples are identical and one is different, and are asked to identify the odd sample.
Statistical analysis
One-way ANOVA analysis was initially applied to evaluate the tank effect.
Nevertheless, since the diet resulted to be not affected by the tank, we collected all the
data from fish fed diet FM and all the data from fish fed the diet PP and we did a T-test
analysis to assess the statistical difference between the dietary groups. However,
because the large number of analyses performed we run independent statistical analysis
for each single parameter.
As the malonaldehyde content was determined at different time after the death, the
statistical analysis model for this parameter included the number of days of refrigerated
storage. As colour measurement was made in different sites of the fillet and of the skin
at different time after death, the colour parameters at each site of measurement were
analysed by a one-way ANOVA (diet) including in the model the days of refrigerated
storage. Analysis of results from the triangular test obtained in each session (at the days

11
3 and 7) is done by comparing the number of correct identifications with the number
you would expect to obtain by chance alone. In order to test this, the number of correct
identifications is compared to the number expected by use of a statistical table (Roessler
et al., 1948).
3. Results
Growth trial and body traits
The observed mortality rate was exactly the same in both dietary treatments (17% per
each diet).
Changes in mean body weights of both groups over the entire period of the feeding trial
are presented in Fig. 1. The growth performances of the two groups of sea bream are
reported in Table 3. Both groups had similar weight gains and specific growth rates.
Feed intake was higher in sea bream fed diet FM (0.48 vs 0.44; P<0.01), while feed
efficiency and protein efficiency ratio were significantly (P<0.01) higher in PP sea
bream (0.83 vs 0.77 and 2.0 vs 1.76, respectively).
The two groups of sea bream reached a similar final body weight (429 g FM vs 425 g
PP) and no difference resulted for most of the other morphological-commercial traits
except for the higher HSI (0.87 vs 0.80 %; P<0.05) and the lower fillet with skin yields
(45 vs 46 %; P<0.05) observed in PP diet fed sea bream compared to those fed diet FM
(Table 4).
Chemical composition
The whole body composition was similar between the two sea bream groups and no
differences were observed (Table 3). With regard to the fillet composition (Table 4),
fish fed diet FM showed higher value of moisture (696 vs 682 g kg-1
) while those fed
diet PP had a higher level of total lipids and cholesterol (100 vs 91 g kg-1
and 0.80 vs

12
0.76 g kg-1
, respectively). The average malonaldehyde content evaluated during the
shelf-life did not differ between the dietary groups (Table 4).
The only difference observed in liver composition between the two groups was the total
lipid content, higher in PP sea bream (176 vs 143 g kg-1
). The fatty acid composition
expressed as percentage of total fatty acids of fresh muscle (Table 5) showed significant
differences between FM and PP groups: monounsaturated (MUFA), polyunsaturated n-3
(n-3 PUFA) fatty acids and the n-3/n-6 ratio were significantly higher (P<0.01) in sea
bream fed FM diet, while polyunsaturated n-6 (PUFA n-6) fatty acids were significantly
higher in sea bream fed PP diet (9.8 vs 4.0 %; P<0.01) and no differences were
observed in total saturated fatty acid (SFA) content. There was a higher level of linoleic
acid in PP sea bream fillet (8.5 vs 2.9 %), while fillet from sea bream fed diet FM had
higher levels of eicosapentaenoic and docosahexaenoic acids (6.7 vs 5.4, and 12.6 vs
10.4 %, respectively). Expressed as g/100g, less differences were observed, but the level
of n-6 PUFA was confirmed to be higher in PP fed sea bream, which also had a higher
content of SFA, but the MUFA and the n-3 PUFA levels did not differ between the
dietary groups. FM fed sea bream showed better thrombogenicity index of fillet lipid
than PP ones. As regards liver fatty acid composition expressed as percentage of total
fatty acids (Table 6), the sea bream fed diet FM had higher level of n-3 PUFA respect to
the PP sea bream which had higher proportions of SFA and n-6 PUFA. No differences
were found for the MUFA level between the two groups. Expressed per weight unit of
tissue, there were no differences between groups for the hepatic n-3 PUFA levels.
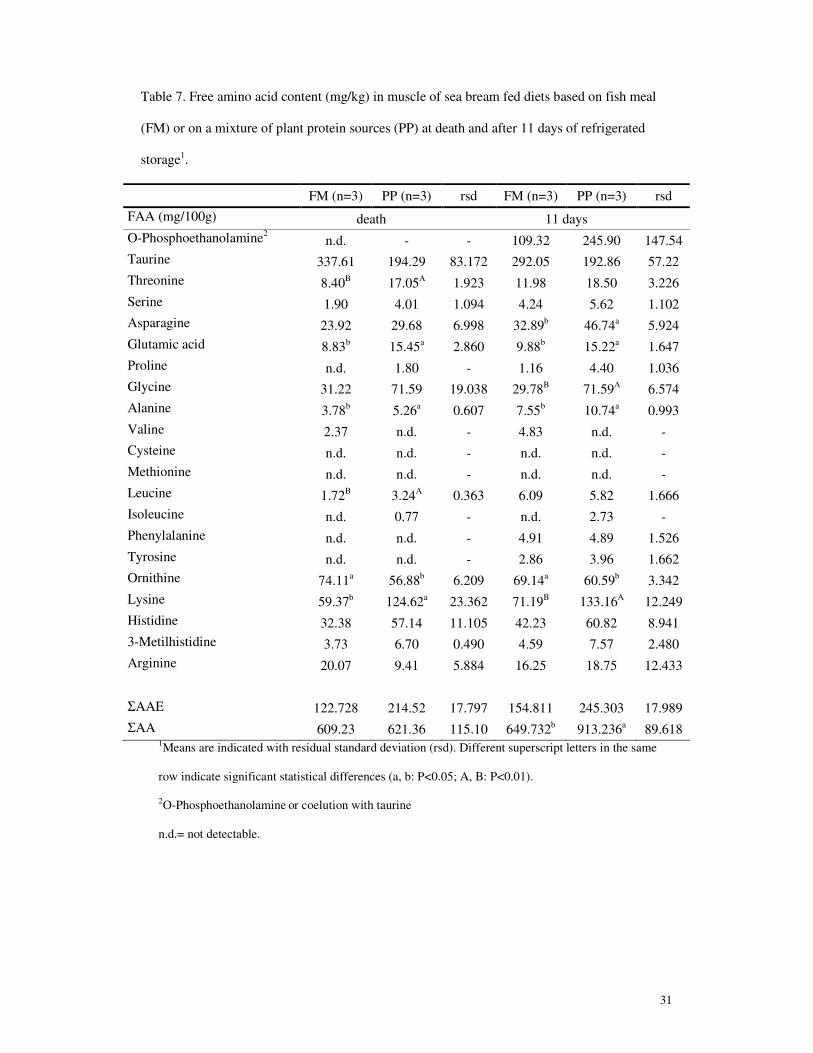
Data on muscle free amino acid levels indicated some differences (Table 7). At death,
muscle from sea bream fed diet PP had higher levels of threonine, glutamic acid,
alanine, leucine and lysine and a lower level of ornithine than the muscle from FM-fed
fish. The main differences observed were for threonine, glutamic acid, leucine and
lysine (about 2 times higher in PP fish). At 11 days post-mortem, differences in the

13
same sense were confirmed for glutamic acid, alanine, lysine and ornithine; PP sea
bream also showed higher values of asparagine and glycine. The main differences came
out for lysine and glycine (in PP fish 1.9 and 2.4 higher than in FM fish, respectively).
The sum of free amino acids did not differ at the time of slaughter but was higher in the
muscle of PP-fed sea bream after 11 days of refrigerated storage.
Instrumental colour measurement
The colour measurement resulted in few differences (table 8). As regard as the skin
colour the opercular site presented higher levels of L* and a* in sea bream fed diet FM.
Also in the abdominal site, the L* value was higher in this group. Sea bream fed diet PP
had higher values of b* in the abdominal and rostral site. The fillets showed similar
characteristics of colour, the only difference was the higher value of lightness in the
cephalic epaxial site of the fillets from PP-fed sea bream.
Sensory evaluation
The judges were unable to recognise the fillets from the two groups. Both at 3 and 7
days of refrigerated storage, the correct answers were only 50% and 39%, respectively
with no statistical difference between the FM and PP fillets.
4. Discussion
This is the first ever study over such a long duration under controlled conditions, to
produce market size sea bream for quality analysis, making comparisons with earlier
studies of shorter duration rather difficult. The higher feed intake observed in sea bream
fed diet FM with respect to those fed diet based on 75% plant proteins, differs from data
obtained by Robaina et al. (1995), who did not find any difference in feed intake of sea
bream fed diets with different levels of plant protein sources over two months. The

14
lower feed intake with diet PP could be due to lower palatability of this feed as also
suggested by the data of Pereira and Oliva-Teles (2002). However, what is important is
that the values of PER and FE were higher in this group, suggesting better utilisation of
this feed with the final outcome being similar weight gains as well as daily nitrogen and
fat gains in both groups (Table 3). These data are consistent with data of Gomez-
Réqueni et al. (2004) in juvenile sea bream (average final body weight 70g) fed the
same diets over 81 days. Combined together, these data indicate that plant protein diet
induced similar effects on parameters of feed and nutrient utilisation both in juveniles
and in commercial size sea bream.
On the other hand, the obtained specific growth rate in both group (0.4 %) was lower if
compared with the literature. Nevertheless it is worth to note that we performed a long
duration trial (one year) and that we reared sea bream under natural water temperature
condition, so that it is impossible to compare our data with the previous studies. Pereira
and Oliva Teles (2002), obtained a specific growth rate higher than 1.6 % in sea bream
feeding increasing level of pea seed meal for 12 weeks, with a constant temperature
(21° C). Gomes-Requeni et al. (2004), reported (in a study by the same group as those
submitting the present manuscript with the same diets) a specific growth rate higher
than 1.7% on sea bream during early stage of growth, for 12 weeks (temperature
ranging from 17 to 25° C).
The same final body weight of sea bream at the end of the growth trial is an important
finding, as many earlier studies have shown a decrease in growth performance in marine
fish fed diets containing high levels of plant protein sources. Inclusion of plant protein
up to 30% does not seem to affect growth in different marine species, such as gilthead
sea bream, turbot or European sea bass (Robaina et al., 1995, 1997; Burel et al., 2000;
Kissil et al., 2000). Sea bream fed soybean or rapeseed protein concentrates at 60% of
inclusion reached a final body weight lower respect to the control fed a fish meal diet

15
(Kissil et al., 2000). In the same way turbot reared with diet containing 46% of
rapeseed, reached a final body weight significant lower respect to the control (Burel et
al., 2000). In tune with our data, Kaushik et al. (2004) also did not observe any negative
effect on growth performance or nutrition utilisation in European sea bass fed a diet
containing 98% of plant protein sources.
It is also encouraging to note that inclusion of high levels of plant protein sources did
not affect morphological and body traits, except for the percentage of the fillets with
skin, higher in sea bream fed diet FM, and for the HSI which was slightly but
significantly higher in sea bream fed diet PP. Kaushik et al. (2004) did not observe any
effect of the protein source in the HSI value of reared sea bass fed diet high levels of
plant ingredients.
Different and contrasting results are reported in the literature regarding the effect of
plant protein sources on fat content in reared fish. No effects on whole fat content were
observed on salmonids (Carter and Hauler, 2000) and sea bream (Pereira and Oliva
Teles, 2002) fed diets containing plant meals. However others researches reported an
augmentation of lipid content in trout fed a diet containing 50% of extruded lupin (Burel
et al., 2000) and in sea bass (Kaushik et al., 2004) fed diets with increasing level of fish
meal replacement by plant proteins. Opposite results were obtained by Robaina et al.,
(1998) in sea bream, and by Kissil et al, (2000) in sea bass, both reported a decrease in
body fat for fish fed plant proteins. In the present trial no difference emerged between
FM and PP sea bream whole body fat.
Concerning the fillet chemical composition, ours data on lipids content are consistent
with values reported by Alasalvar et al. (2002) for farmed sea bream of 400 g body
weight. The effect of vegetal protein sources on fat in different reared fish, is still under
investigations and it is probably related to a different lipid metabolism and to the
different protein sources.
16
In spite of the clear differences in dietary cholesterol levels (2.0 and 1.2 g kg-1
in the
FM and PP diets, respectively), only the hepatic level showed a similar tendency, while
in the muscle slightly higher cholesterol was found in fish fed PP diet. We hypothesize a
negative feed-back induced in FM sea bream by the high dietary cholesterol content, but
further studies are warranted to understand tissue cholesterol homeostasis, poorly
investigated in fish.
In earlier studies with total fish meal substitution (Kaushik et al., 1995; 2004; Watanabe
et al. 1998), the possible effects on fatty acid composition have not been looked into.
The different fatty acid profile observed in the two dietary groups reflected the fatty
acid composition of the diets, as reported abundantly in several fish including gilthead
sea bream (Watanabe et al., 1982; Sargent et al., 2002; Izquierdo et al., 2003). Although
the PP diet was supplemented with fish oil, there were differences in the fatty acid
profile; especially there was a high level of 18:2 n-6 and a slight reduction in EPA and
DHA (Table 2). As in most fish, the fillet fatty acid composition reflected that of the
diet. Sea bream fed diet PP in which 75% of fish meal was substituted by plant protein
sources, had a higher percentage of n-6 PUFA and lower levels of MUFA and n-3
PUFA. The fatty acids values obtained in this trial (expressed as percentage of total
fatty acids of fresh muscle) are much higher compared to data from sea bream fed
vegetable oils in partial replacement of fish oil (Izquierdo et al., 2003). At the
quantitative level, the sum of EPA and DHA in the muscle of sea bream was 1.4 and 1.3
g / 100 g fillet in FM and PP groups (Table 5). This result is of importance given the
beneficial effects of these fatty acids, especially with regard to cardio-vascular disease
prevention in humans (Sidhu, 2003; Thies et al., 2003). The fillet fatty acids content
observed in this trial for both group is above the recommended daily intake of 0.65g of
EPA + DHA reported by Simopoulos (1999). However, the International Society for the
Study of Fatty Acids and Lipids (ISSFAL, 2004) recently suggested a minimum weakly
17
intake of eicosapentaenoic acid (EPA) and docosahexaenoic acid (DHA) combined of
3.5 g, for cardiovascular health. According to this, it should be recommended to eat
approximately 270 g of fish fillet every week.
The malonaldehyde content as observed here was higher than data reported in the
literature for marine sparids. Poli et al. (1998) observed a malonaldehyde value of 0.67
mg/kg in sea bream of similar size. Likewise, for European sea bass a malonaldehyde
level of 0.41 mg/kg at the 9th
day of refrigerated (4 °C) storage with ice covering (Poli
et al., 2001) was reported.
The slightly higher levels of free amino acids in the muscle of sea bream fed the diet PP
both at slaughter and after 11 days of refrigerated storage, is probably due to the
addition of synthetic amino acids in the diet, but do not really correspond to the
individual amino acid patterns. However, such differences do not seem to be reflected
on the organoleptic quality of the fillets. Further studies on biogenic amines might show
more light. Despite a relatively high level of corn gluten meal in the diet PP (180 g/kg),
only minor differences were observed in the colour characteristics of the two dietary
groups, mostly in the skin sites. This is contrary to the observations of Robaina et al.
(1997) who reported a yellow-orange colour in operculum and fins in juvenile gilthead
sea bream (80 g) fed diets containing increasing levels (10 to 21%) of corn gluten meal.
In the salmonids, dietary corn gluten meal has a notable effect on fillet colour (Hardy,
1996; Dias, 1999; de Francesco et al., 2004).
The evaluation of sensory quality carried out at the 3rd
and 7th
day after the refrigerated
storage by a triangular test could not discriminate the different dietary groups, despite
the observed differences in the chemical composition, related to lipid, fatty acid and free
amino acid content. This is probably not surprising since even big changes in flesh fatty
acid profiles do not seem to induce any big changes in sensory response of cooked
fillets of sea bream (Izquierdo et al., 2003).

18
In conclusion, our results demonstrate the possibility to use diets containing high
percentage (75%) of plant ingredients in gilthead sea bream, with equivalent growth
performance and with little effects on quality traits of the commercial product.
Acknowledgements
The authors thank Antonio Bonelli and Jeannine Brèque for their technical support, and
the staff of the CSIC (Institut of Aquaculture, Torre de la Sal, Spain) Experimental Fish
Farm for the care of the fish. This research was supported by the European project
QLRT-1999-30068 "Perspectives of plant protein use in aquaculture".

19
References
Alasalvar, C., Taylor, D.A.K. & Shahidi, F. (2002) Comparative quality assessment of
cultured sea bream (Sparus aurata) stored in ice. J. Agricultural and Food Chemistry,
50, 2039-2045.
A.O.A.C. (1990) Official Methods of Analysis of the Association of Official Analytical
Chemists In: Heldrich, K. (Ed.),. AOAC, Arlington, VA, 684 pp.
A.O.A.C. (1995) Official Methods of Analysis of the Association of the Official
Analysis Chemists, Association of Official Analytical Chemists, Arlington, VA,
USA.
Aoki, H., Shimazu, H., Fukushige, T., Akano, H., Yamagata, Y. & Watanabe, T. (1996)
Flesh quality in red sea bream fed with diet containing a combination of different
protein sources as total substitution for fish meal. Bull. Fish. Res. Inst. Mie., 6,
47-54.
Burel, C., Boujard, T., Tulli, F., Kaushik, S.J. (2000) Digestibility of extruded peas,
extruded lupin, and rapeseed meal in rainbow trout (Oncorhynchus mykiss) and
turbot (Psetta maxima). Aquaculture, 188, 285-298.
Carter, C.G. & Hauler, R.C. (2000) Fish meal replacement by plant meals in extruded
feeds for Atlantic salmon, Salmo salar L. Aquaculture, 185, 299–311
CIE (Commission Internationale de L'Eclairage) (1976) Colorimetry. Pub. N° 15,
Bureau Central de la CIE, Vienna, Austria.
Dias, J. (1999) Lipid deposition in rainbow trout (Oncorhynchus mykiss) and European
sea bass (Dicentrarchus labrax): Nutritional control of hepatic lipogenesis. PhD
Thesis, Univ. Porto, Portugal & Univ. Bordeaux I, France: 190 p.
de Francesco, M., Parisi, G., Médale, F., Lupi, P., Kaushik, S.J. & Poli, B.M. (2004)
Effect of long-term feeding with a plant protein mixture based diet on growth and

20
body/fillet quality traits of large rainbow trout (Oncorhynchus mykiss).
Aquaculture, 236, 413-429.
FAO (2001) Report of the Conference on Aquaculture in the Third Millennium.
Bangkok, Thailand, 20-25 February 2000. FAO Fish. Rep. No. 661, 92 p.
FAO (2003) Fishery Statistics. Aquaculture production. Vol. 92/2.
Folch, J., Lees, M. & Sloane-Stanley, G.H. (1957) A simple method for the isolation
and purification of total lipids from animal tissues. J. Biol. Chem., 226, 497-509.
Francis, G., Makkar, P.S. & Becker, K. (2001) Antinutritional factors present in plant-
derived alternate fish feed ingredients and their effects in fish. Aquaculture, 199,
197-227.
Geri, G., Gualtieri, M., Lupi, P., Parisi, G., Dell’Agnello, M. & Mecatti, M. (1994)
Evolution morphologique des téléostéens pendant la croissance: 1. Proposition
d’une méthode d’étude. In: Metrology and Instrumentation in Aquaculture
Management Measures for Success (Kestemont, P., Muir, J., Sévila, F., Williot,
P. Eds.), Proceedings of Bordeaux Aquaculture ’94, 23-25 March 1994,
Bordeaux, France, CEMA-GREF Editions, Gap, France, pp. 239-243.
Gómez-Requeni P., Mingarro, M., Calduch-Giner, J.A., Médale, F., Martin, S.A.M,
Houlihan, D.F., Kaushik, S.J. & Pérez-Sánchez, J. (2004) Protein growth
performance, amino acid utilisation and somatotropic axis responsiveness to fish
meal replacement by plant protein sources in gilthead sea bream (Sparus aurata).
Aquaculture, 232, 493-510.
Gouveia, A. & Davies, S.J. (2000) Inclusion of an extruded dehulled pea seed meal in
diets for juvenile European sea bass (Dicentrarchus labrax). Aquaculture, 182,
183-193.
Hardy, R.W. (1996) Alternate protein sources for salmon and trout diets. Anim. Feed
Sci. Techn., 59, 71-80.

21
I.S.S.F.A.L. (2004) Study of Fatty Acids and Lipids. Recommendations for intake of
polyunsaturated fatty acids in healthy adults. June 2004
ISO, 1983. 4120-1983. Sensory analysis - Triangular test. International Organization for
Standardization. Geneva, Switzerland.
ISO, 1988. 8589-1988. Sensory analysis - General guidance for the design of test
rooms. International Organization for Standardization. Geneva, Switzerland.
Izquierdo, M. S., Obach, A., Arantzamendi, L., Montero, D., Robaina, L. & Rosenlund,
G. (2003) Dietary lipid sources for seabream and seabass: growth performance,
tissue composition and flesh quality. Aquaculture Nutrition, 9, 397-407.
Kaushik, S.J. (1990) Use of alternative protein sources for the intensive rearing of
carnivorous fishes. In: Mediterranean Aquaculture (R. Flos, L. Tort & P. Torres,
Eds), Ellis Horwood, UK. pp 125-138.
Kaushik, S.J., Cravedi, J.P., Lalles, J.P., Sumpter, J., Fauconneau, B. & Laroche, M.
(1995) Partial or total replacement of fish meal by soybean protein on growth,
protein utilization, potential estrogenic or antigenic effects, cholesterolemia and
flesh quality in rainbow trout (Oncorhynchus mykiss). Aquaculture, 133, 257-
274.
Kaushik, S.J., Covès, D., Dutto, G. & Blanc, D. (2004) Almost total replacement of fish
meal by plant protein sources in the diet of a marine teleost, the European
seabass, Dicentrarchus labrax. Aquaculture, 230, 391–404.
Kissil, G.W., Lupatsch, I., Higgs, D.A. & Hardy, R.W. (2000) Dietary substitution of
soy and rapeseed protein concentrates for fish meal, and their utilization in
gilthead seabream Sparus aurata L. Aquaculture Research, 31, 595-601.
Moore S. & Stein, W.H. (1951) Chromatography of amino acids on sulfonated
polystyrene resins. J. Biol. Chemistry, 192, 663-681.

22
Morrison, R. & Smith, M. L., (1964). Preparation of fatty acid methyl esters and
dimethylacetals from lipids with boron fluoride-methanol. J. Lipid Research, 5,
600-608.
New, M. B. & Wijkstroem, U. N. (2002) Use of fishmeal and fish oil in aquafeeds.
Further thoughts on the fishmeal trap. FAO Fish. Circ. No. 975, 61 p.
NRC (National Research Council), (1993) Nutrient Requirements of Fish. National
Academy Press, Washington, DC.
Pereira, T.G. & Oliva-Teles, A. (2002) Preliminary evaluation of pea seed meal in diets
for gilthead sea bream (Sparus aurata) juveniles. Aquaculture Research, 33,
1183-1189.
Poli, B.M., Parisi, G., Lupi, P., Mecatti, M., Bonelli, A., Zampacavallo G., Gualtieri, M.
& Mascini, M. (1998) Qualitative traits and shelf life in Pagrus major x Dentex
dentex hybrids stored at refrigerated conditions and comparison with European
gilthead seabream (Sparus aurata). XXXIII International Symposium on New
Species for Mediterranean Aquaculture, Alghero, 22-24 April, 1998. Pp. 329-
336.
Poli, B.M., Parisi, G., Zampacavallo, G., Mecatti, M., Lupi, P., Gualtieri & M., Franci,
O. (2001) Quality outline of European sea bass (Dicentrarchus labrax) reared in
Italy: shelf life, edible yield, nutritional and dietetic traits. Aquaculture, 202, 303–
315.
Raharjo, S., Sofos, J.N. & Schmidt, G.R. (1993) Solid-phase acid extraction improves
thiobarbituric acid method to determine lipid oxidation. J. Food Sci., 58, 921-
924.
Robaina, L., Izquierdo, M.S., Moyano, F.J., Socorro, J., Vergara, J.M., Montero, D. &
Fernàndez-Palacios, H. (1995) Soybean and lupin seed meals as protein sources

23
in diets for gilthead seabream (Sparus aurata): nutritional and histological
implications. Aquaculture, 130, 219-233.
Robaina, L., Moyano, F.J., Izquierdo, M.S., Socorro, J., Vergara, J.M. & Montero D.
(1997) Corn gluten and meat and bone meals as protein in diets for gilthead
seabream (Sparus aurata): nutritional and histological implications. Aquaculture,
157, 347-359.
Robaina, L., Izquierdo, M.S., Moyano, F.J., Socorro, J., Vergara, J.M. & Montero D.
(1998) Increase of the dietary n-3/n-6 fatty acid ratio and addition of phosphorus
improves liver histological alterations induced by feeding diets containing
soybean meal to gilthead seabream, Sparus aurata. Aquaculture, 161, 281-293.
Roessler, E. B.; Warren, J. & Guymon, J.F. (1948) Significance in triangular taste tests.
In Lanmond, E., Laboratory Methods for Sensory Evaluation of Food. Food
Research Institute, Canada, 1977.
Sargent, J.R., Tocher, D.R. & Bell, G.J. (2002) The lipids. In: Fish Nutrition (Halver,
J.E., Hardy, R. Eds.)., 3rd edn, pp. 181-257. Academic Press, San Diego, CA,
USA.
Sidhu, K.S. (2003) Health benefits and potential risks related to consumption of fish or
fish oil. Regulatory Toxicology and Pharmacology, 38, 336 –344.
Simopoulos, A.P., Leaf, A. & Salem, N. (1999) Workshop on the essentiality of and
recommended dietary intakes for omega-6 and omega-3 fatty acids. J Am Coll
Nutr., 18, 487-489.
Storebakken, T., Shearer, K.D. & Roem, A.J. (2000) Growth, uptake and retention of
nitrogen and phosphorus, and absorption of other minerals in Atlantic salmon
Salmo salar fed diets with fish meal and soy-protein concentrate as the main
sources of protein. Aquaculture Nutrition, 6, 103-108.

24
Tacon, A.G.J. (1997) Fishmeal replacers: Review of antinutrients within oilseeds and
pulses. A limiting factor for the aquafeed green revolution? In: Feeding
tomorrow's fish. Proc. Workshop of the CIHEAM Network on Technology of
Aquaculture in the Mediterranean (TECAM), CIHEAM, FAO and IEO,
Mazarron (Spain), Cah. Options Mediterr., 22, 153-182.
Tacon, A.G.J. & Forster, I.P. (2003) Aquafeeds and the environment: policy
implications. Aquaculture, 226, 181-189.
Thies, F., Garry, J.M.C., Yaqoob, P., Rerkasem, K., Williams, J., Shearman, C.,
Gallagher, P.J., Calder, P.C. & Grimble, F.R. (2003) Association of n-3
polyunsatured fatty acids with stability of atherosclerotic plaques: a randomised
controlled trial. The Lancet, 361, 477-485.
Ulbricht T.L.V. & Southgate D.A.T. (1991) Coronary hearth disease: seven dietary
factors. The Lancet, 338, 985-992.
Watanabe, T. (1982) Lipid nutrition in fish. Comp. Biochem. Physiol., 73 B, 3-15.
Watanabe, T., Verakunpiriya, V., Watanabe, K., Viswanath, K. & Satoh, S. (1998)
Feeding of rainbow trout with non-fish meal diets. Fisheries Sci., 63, 258-266.

25
Table 1. Ingredients and chemical composition of the experimental diets.
Ingredients (g kg-1
) FM PP
Fish meal, LT (CP 70%) 703.7 176.0
Corn gluten meal 0 180.0
Wheat gluten 0 180.0
Extruded peas (Aquatex, France) 0 90.0
Rapeseed meal (Primor 00, France) 0 67.2
Extruded whole wheat 142.0 30.6
Fish oil 124.3 149.8
Binder (Na Alginate) 10.0 10.0
Mineral premix1 10.0 10.0
Vitamin premix2 10.0 10.0
CaHPO4.2H20 (18% P) 0 30.7
Amino acid mix3 0 65.7
Proximate composition
Dry matter (g kg-1) 904 896
Crude Protein (g kg-1
DM) 437 415
Lipids (g kg-1 DM) 162 177
Gross energy (k Jg-1
DM) 19.2 19.3 1 Supplied the following (mg/kg diet, except as noted): calcium carbonate (40% Ca) 2.15 g,
magnesium hydroxide (60% Mg) 1.24 g, potassium chloride 0.9 g, ferric citrate 0.2 g, potassium
iodine 4 mg, sodium chloride 0.4 g, calcium hydrogen phosphate 50 g, copper sulphate 0.3, zinc
sulphate 40, cobalt sulphate 2, manganese sulphate 30, sodium selenite 0.3.
2 Supplied the following (mg kg
-1 diet): retinyl acetate 2.58, DL-cholecalciferol 0.037, DL-α
tocopheryl acetate 30, menadione sodium bisulphite 2.5, thiamin 7.5, riboflavin 15, pyridoxine
7.5, nicotinic acid 87.5, folic acid 2.5, calcium pantothenate 2.5, vitamin B12 0.025, ascorbic acid
250, inositol 500, biotin 1.25 and choline chloride 500.
3 Amino acids g kg
-1: L-Arg: 11.3; L-His: 3.4; L-Lys: 23.6; Dl-Met: 3.6;L-Trp: 2.2; L-Thr: 7.4;
L-Ile: 6.2.

26
Table 2. Total lipids1 (% on wet weight), fatty acids
2 (% of total fatty acids) and cholesterol in
the FM and PP experimental diets fed to sea bream.
FM PP
Total lipids % 18.2 17.3
Fatty acids %
C14:0 6.5 5.2
C16:0 15.7 17.3
C16:1 n-7 4.8 4.7
C18:0 2.0 2.2
C18:1 n-9 16.4 22.0
C18:2 n-6 2.3 8.2
C18:3 n-3 1.5 2.2
C18:4 n-3 3.3 2.4
C20:1 n-9 8.1 4.6
C20:5 n-3 10.2 8.7
C22:1 n-11 12.1 7.0
C22:6 n-3 12.0 10.6
Σ SFA 24.9 25.6
Σ MUFA 44.0 39.0
Σ PUFA n-6 3.4 9.4
Σ PUFA n-3 28.8 25.6
PUFA n-3/PUFA n-6 8.5 2.7
Cholesterol (g kg-1) 2.03 1.2
1 The total lipids content was determined by Folch et al. (1957)
2The fatty acids
C12:0, C14:1 n-5, C15:0, C16:2 n-4, C17:0, C16:3 n-3, C16:4 n-1, C18:2 n-4, C18:3 n-6,
C18:3 n-4, C20:0, C20:1 n-7, C20:2 n-6, C20:3 n-3, C20:3 n-6, C20:4 n-6, C21:5 n-3, C22:4 n-6, C22:5
n-6, in percentage less than 1%, were considered in the composite fractions but not reported in the table
for brevity.

27
Table 3. Growth performance, feed intake and feed efficiency of sea bream fed the FM and PP
diets1.
FM
(n=120)
PP
(n=120)
Initial body weight (IBW) (g) 99.1 ± 0.3 99.7 ± 0.3
Final body weight (FBW) (g) 431.4 ± 1.1 427.1 ± 1.1
Feed intake (% BW/day) 0.48 ± 0.01A 0.44 ± 0.01B
Weight gain (%) 335.5 ± 1.2 328.2 ± 1.2
Specific growth rate2 (SGR) (%) 0.44 ± 0.01 0.43 ± 0.01
Feed efficiency3 (FE) 0.77 ± 0.01
B 0.83 ± 0.01
A
Protein efficiency ratio4 (PER) 1.76 ± 0.01B 2.00 ± 0.01A
Final whole body chemical composition5 (g kg
-1) (n=10) (n=10)
Moisture 615 ± 4 613 ± 5
Protein 172 ± 2 173 ± 1
Lipids 148 ± 2 151 ± 3
Daily N gain (mg/kg BW/day) 103.3 ± 1.9 103.4 ± 0.7
Daily Fat gain (g/kg BW/day) 0.60 ± 0.01 0.61 ± 0.02 1Each value is the mean ± SEM of duplicate tanks. Different superscript letters in the same row
indicate significant statistical differences (A, B: P<0.01)
2Specific growth rate = [100 x (ln FBW - ln IBW)] / days.
3Feed efficiency = wet weight gain / dry feed intake.
4Protein efficiency ratio = wet weight gain / crude protein intake.
5Initial whole body composition: moisture 663 g kg-1; protein 163 g kg-1; lipids 102g kg-1

28
Table 4. Body morphological traits, fillet and liver chemical composition (on wet weight basis) in sea
bream fed the FM or PP diets1.
n FM n PP rsd
Morphometric data
Body weight2 (g) 100 428.8 100 425.4 49.6
Total length (cm) 100 28.2 100 28.0 1.12
Standard length (cm) 100 23.5 100 23.5 1.89
Condition factor 100 1.90 100 1.94 0.47
Agility index 54 2.05 54 2.04 0.15
Cranial index 54 0.23 54 0.23 0.003
Relative profile 54 0.34 54 0.34 0.006
Body components
Fins (%) 63 6.9 63 6.8 0.19
Gills (%) 66 2.2 66 2.2 0.25
Head (%) 66 26.2 66 26.2 2.93
Hepato-somatic index3 (HSI, %) 88 0.80b 88 0.87a 0.22
Digestive tract (%) 66 1.7 66 1.6 0.37
Mesenteric fat (%) 66 2.76 66 2.90 1.05
Visceral index4 (VSI, %) 66 6.03 66 6.21 1.10
Commercial traits
Dressing (%) 66 93.97 66 93.79 1.10
Fillets with skin (%) 88 45.92a 88 44.94b 3.20
Fillet composition (g kg-1
)
Moisture 30 696A 30 682B 16.7
Crude protein 12 182 12 183 14.2
Total lipids 30 91b 30 100a 16.1
Ash 12 14 12 14 1.3
Phosphorus 12 1.9 12 1.9 0.20
Cholesterol 30 0.76B 30 0.80
A 0.173
Malonaldehyde (mg/kg) 18 1.37 18 1.05 0.50
Liver composition5(g kg
-1)
Moisture 8 636 8 600 25.3
Crude protein 8 157 8 147 9.8
Total lipids 8 143b 8 176a 25.1
Ash 8 12 8 11 1.6
Phosphorus 8 2.0 8 2.3 0.60
Cholesterol 8 1.32 8 1.24 0.102 1Means are indicated with residual standard deviation (rsd). Different superscript letters in the
same row indicate significant differences (a, b: P<0.05; A, B: P<0.01). 2 Value obtained by the fish individually weighed. 3 HSI = [100 x (liver weight/body weight)]
4 VSI = [100 x (total viscera weight/body weight)]
5 For the analysis of liver, each analysed sample has been obtained grouping livers of three
different animals.

29
Table 5. Fatty acid composition of fillets of sea bream fed diets based on fish meal (FM)
or on a mixture of plant protein sources (PP)1.
FM
(n=30)
PP
(n=30)
rsd FM
(n=30)
PP
(n=30)
rsd
Fillet fatty acids2 % of total fatty acids g/100g of fresh tissue
C14:0 5.54A 4.36B 0.17 0.415A 0.356B 0.06
C16:0 16.53B 17.41
A 0.52 1.238
B 1.448
A 0.23
C16:1 n-7 7.02A 6.74B 0.40 0.527 0.549 0.13
C18:0 2.27B 2.67
A 0.16 0.169
B 0.222
A 0.03
C18:1 n-9 20.90B 25.30A 0.78 1.568B 2.108A 0.34
C18:2 n-6 2.92B 8.47
A 0.27 0.219
B 0.702
A 0.08
C18:3 n-3 2.12B 2.55A 0.21 0.160B 0.213A 0.04
C18:4 n-3 2.18A 1.51
B 0.07 0.164
A 0.126B
0.03
C20:1 n-9 7.09A 4.39B 0.23 0.530A 0.363B 0.07
C20:4 n-3 1.17A 1.00
B 0.08 0.087 0.083 0.005
C20:5 n-3 6.72A 5.36B 0.21 0.502A 0.444B 0.08
C22:1 n-11 6.62A 4.40
B 0.28 0.540
A 0.364
B 0.70
C22:1 n-9 1.044A 0.73B 0.03 0.078A 0.060B 0.003
C22:5 n-3 1.29 1.86 0.09 0.149 0.154 0.03
C22:6 n-3 12.59A 10.44B 0.52 0.939a 0.862b 0.13
SFA 24.93 25.04 0.30 1.867b 2.082a 0.33
MUFA 43.69A 41.87
B 1.16 3.275 3.486 0.60
Σ PUFA n-6 4.05B 9.78A 0.33 0.304B 0.810A 0.10
Σ PUFA n-3 27.15A 22.99
B 0.78 2.030 1.905 0.30
PUFA n-3/PUFA n-6 6.73A 2.35B 2.43
Total 7.497b 8.308
a 1.33
AI3 1.566 1.545 0.26
TI4 0.196
B 0.430
A 0.06
1Means are indicated with residual standard deviation (rsd). Different superscript letters in the same
row indicate significant statistical differences (a, b: P<0.05; A, B: P<0.01).
2Fatty acids C12:0, C14:1 n-5, C15:0, C16:2 n-4, C17:0, C16:3 n-3, C16:4 n-1, C18:2 n-4, C18:3 n-6,
C18:3 n-4, C20:0, C20:1 n-7, C20:2 n-6, C20:3 n-3, C20:3 n-6, C20:4 n-6, C21:5 n-3, C22:4 n-6,
C22:5 n-6, in percentage less than 1%, were considered in the composite fractions but not reported in
the table for brevity.
3Atherogenicity index = (C12:0+4*C14:0+C16:0) / (PUFA n6+PUFA n3+MUFA)
4Thrombogenicity index = (C14:0+C16:0+C18:0)/[(0.5*PUFA n6) + (3*PUFA n3) + (0.5*MUFA) +
(PUFA n3/PUFA n6)]

30
Table 6. Liver fatty acid composition of sea bream fed diets based on fish meal (FM) or on a
mixture of plant protein sources (PP)1.
FM (n=8) PP (n=8) rsd FM (n=8) PP (n=8) rsd
Liver fatty acids2 % of total fatty acids g/100g of fresh tissue
C14:0 4.80A 3.83B 0.291 0.581 0.573 0.114
C16:0 19.29B 20.86
A 0.876 2.308
B 3.120
A 0.450
C16:1 n-7 5.97 5.94 0.277 0.721b 0.889a 0.155
C18:0 3.68B 4.75
A 0.516 0.437
B 0.711
A 0.114
C18:1 n-9 22.99B 28.50A 1.429 2.754B 4.280A 0.696
C18:2 n-6 2.28B 7.03
A 0.400 0.275
B 1.052
A 0.145
C18:3 n-3 1.43B 1.69A 0.167 0.174B 0.252A 0.045
C18:4 n-3 1.63A 1.07
B 0.173 0.197 0.160 0.045
C20:1 n-9 5.90A 3.48B 0.305 0.712A 0.519B 0.118
C20:4 n-3 1.20A 0.91
B 0.055 0.144 0.136 0.032
C20:5 n-3 6.57A 4.57B 0.335 0.788 0.680 0.122
C22:1 n-11 5.53A 2.73
B 0.400 0.669
A 0.408
B 0.118
C22:5 n-3 1.81 1.73 0.530 0.217 0.257 0.071
C22:6 n-3 13.20A 9.86
B 0.713 1.579 1.461 0.207
ΣSFA 28.34B 29.91
A 1.027 3.393
B 4.474
A 0.653
ΣMUFA 41.46 41.18 1.117 4.985b 6.177a 1.040
ΣPUFAn-6 3.71B 8.56
A 0.454 0.446
B 1.276
A 0.161
ΣPUFAn-3 27.66A 20.08B 3.723 3.280 2.982 0.476
Total 12.002B 14.948
A 2.230
PUFA n-3/PUFA n-6 7.431A 2.346B 0.830
1Means are indicated with residual standard deviation (rsd). Different superscript letters in the same
row indicate significant statistical differences (a, b: P<0.05; A, B: P<0.01).
2 Each analysed sample has been obtained grouping the livers of three different fish
3Fatty acids C12:0, C14:1 n-5, C15:0, C16:2 n-4, C17:0, C16:3 n-3, C16:4 n-1, C18:2 n-4, C18:3 n-6,
C20:0, C20:1 n-7, C20:2 n-6, C20:3 n-3, C20:3 n-6, C20:4 n-6, C22:1 n-9, C21:5 n-3, C22:4 n-6,
C22:5 n-6, in percentage less than 1%, were considered in the composite fractions but not reported in
the table for brevity.
31
Table 7. Free amino acid content (mg/kg) in muscle of sea bream fed diets based on fish meal
(FM) or on a mixture of plant protein sources (PP) at death and after 11 days of refrigerated
storage1.
FM (n=3) PP (n=3) rsd FM (n=3) PP (n=3) rsd
FAA (mg/100g) death 11 days
O-Phosphoethanolamine2 n.d. - - 109.32 245.90 147.54
Taurine 337.61 194.29 83.172 292.05 192.86 57.22
Threonine 8.40B 17.05
A 1.923 11.98 18.50 3.226
Serine 1.90 4.01 1.094 4.24 5.62 1.102
Asparagine 23.92 29.68 6.998 32.89b 46.74
a 5.924
Glutamic acid 8.83b 15.45a 2.860 9.88b 15.22a 1.647
Proline n.d. 1.80 - 1.16 4.40 1.036
Glycine 31.22 71.59 19.038 29.78B 71.59A 6.574
Alanine 3.78b 5.26
a 0.607 7.55
b 10.74
a 0.993
Valine 2.37 n.d. - 4.83 n.d. -
Cysteine n.d. n.d. - n.d. n.d. -
Methionine n.d. n.d. - n.d. n.d. -
Leucine 1.72B 3.24
A 0.363 6.09 5.82 1.666
Isoleucine n.d. 0.77 - n.d. 2.73 -
Phenylalanine n.d. n.d. - 4.91 4.89 1.526
Tyrosine n.d. n.d. - 2.86 3.96 1.662
Ornithine 74.11a 56.88
b 6.209 69.14
a 60.59
b 3.342
Lysine 59.37b 124.62a 23.362 71.19B 133.16A 12.249
Histidine 32.38 57.14 11.105 42.23 60.82 8.941
3-Metilhistidine 3.73 6.70 0.490 4.59 7.57 2.480
Arginine 20.07 9.41 5.884 16.25 18.75 12.433
ΣAAE 122.728 214.52 17.797 154.811 245.303 17.989
ΣAA 609.23 621.36 115.10 649.732b 913.236a 89.618 1Means are indicated with residual standard deviation (rsd). Different superscript letters in the same
row indicate significant statistical differences (a, b: P<0.05; A, B: P<0.01).
2O-Phosphoethanolamine or coelution with taurine
n.d.= not detectable.

32
Table 8. Parameters of fillet and skin colour in sea bream fed diets based on fish meal (FM) or
on a mixture of plant protein sources (PP)1.
Opercular Abdominal Rostral
Skin
colour
FM
(n=82)
PP
(n=82) rsd
FM
(n=82)
PP
(n=82) rsd
FM
(n=82)
PP
(n=82) rsd
L* 79.59A 76.30B 7.11 89.02a 86.67b 6.65 45.72 45.00 4.97
a* 0.39A -0.09
B 0.79 -1.74 -1.77 0.96 -1.12 -1.21 1.37
b* 3.30 3.27 1.83 1.33b 1.81a 1.55 -0.52B 0.38A 1.28
Cephalic epaxial Ventral Caudal
Fillet
colour
FM
(n=64)
PP
(n=64) rsd
FM
(n=64)
PP
(n=64) rsd
FM
(n=64)
PP
(n=64) rsd
L* 45.31b 48.61
a 7.70 51.38 52.78 8.77 50.46 50.69 3.66
a* -1.73 -1.71 0.62 0.33 0.02 1.16 2.73 2.32 2.48
b* -3.82 -3.38 1.75 -0.14 -0.01 1.61 -1. 65 -1.30 1.45
1Means are indicated with residual standard deviation (rsd).
Different superscript letters in the same row indicate significant statistical differences (a, b: P<0.05;
A, B: P<0.01).

33
Fig. 1. Body weight changes in gilthead sea bream fed FM or PP diet and temperature
changes over the full annual cycle.
0
50
100
150
200
250
300
350
400
450
500
0 100 200 300days
Body weight
(g)
0
5
10
15
20
25
30
Temperature
(°C)
Fig. 2 Linear measurements made by an orthometric meter on whole fish
1- Total length
2- Standard length
3- Maximum height
4- Head length
5- Caudal plane
■ FM ; ● PP
A N S O D J F M A M J J

34
Scheme 1 – Sampling time table
Parameters Days after death
1 2 3 4 5 6 7 8 9 10 11
Body measurements
Free amino acids
Malonaldehyde
Skin and fillet colour
Sensory evaluation