Localization of aquaporin 1 and 3 in the gills of the rainbow wrasse Coris julis
Upload
independentCategory
view
1download
0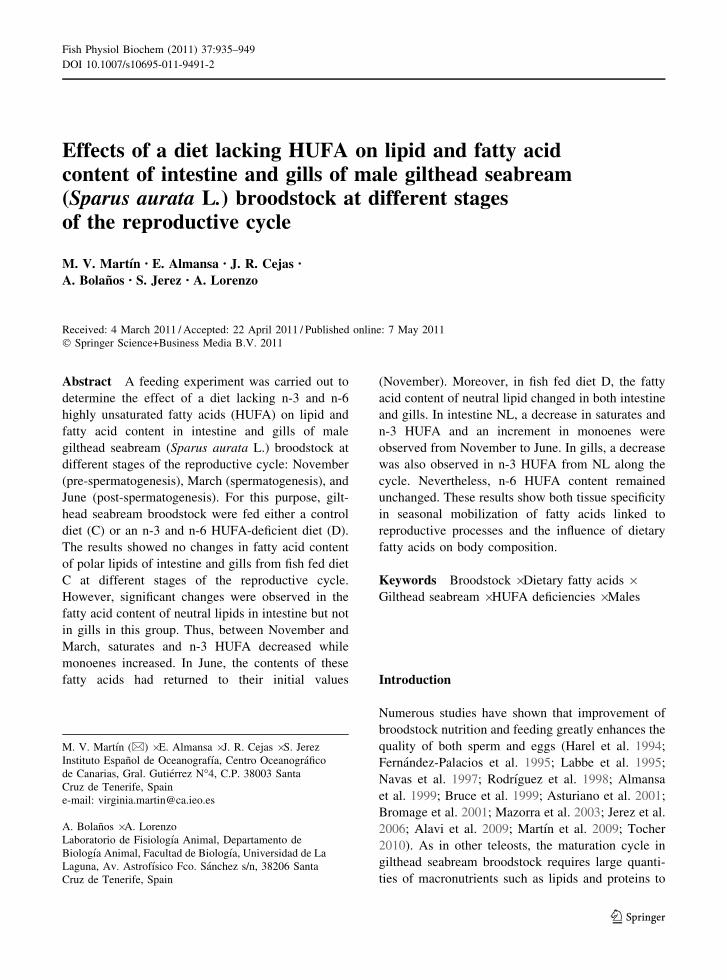
Effects of a diet lacking HUFA on lipid and fatty acidcontent of intestine and gills of male gilthead seabream(Sparus aurata L.) broodstock at different stagesof the reproductive cycle
M. V. Martın • E. Almansa • J. R. Cejas •
A. Bolanos • S. Jerez • A. Lorenzo
Received: 4 March 2011 / Accepted: 22 April 2011 / Published online: 7 May 2011
� Springer Science+Business Media B.V. 2011
Abstract A feeding experiment was carried out to
determine the effect of a diet lacking n-3 and n-6
highly unsaturated fatty acids (HUFA) on lipid and
fatty acid content in intestine and gills of male
gilthead seabream (Sparus aurata L.) broodstock at
different stages of the reproductive cycle: November
(pre-spermatogenesis), March (spermatogenesis), and
June (post-spermatogenesis). For this purpose, gilt-
head seabream broodstock were fed either a control
diet (C) or an n-3 and n-6 HUFA-deficient diet (D).
The results showed no changes in fatty acid content
of polar lipids of intestine and gills from fish fed diet
C at different stages of the reproductive cycle.
However, significant changes were observed in the
fatty acid content of neutral lipids in intestine but not
in gills in this group. Thus, between November and
March, saturates and n-3 HUFA decreased while
monoenes increased. In June, the contents of these
fatty acids had returned to their initial values
(November). Moreover, in fish fed diet D, the fatty
acid content of neutral lipid changed in both intestine
and gills. In intestine NL, a decrease in saturates and
n-3 HUFA and an increment in monoenes were
observed from November to June. In gills, a decrease
was also observed in n-3 HUFA from NL along the
cycle. Nevertheless, n-6 HUFA content remained
unchanged. These results show both tissue specificity
in seasonal mobilization of fatty acids linked to
reproductive processes and the influence of dietary
fatty acids on body composition.
Keywords Broodstock � Dietary fatty acids �Gilthead seabream � HUFA deficiencies � Males
Introduction
Numerous studies have shown that improvement of
broodstock nutrition and feeding greatly enhances the
quality of both sperm and eggs (Harel et al. 1994;
Fernandez-Palacios et al. 1995; Labbe et al. 1995;
Navas et al. 1997; Rodrıguez et al. 1998; Almansa
et al. 1999; Bruce et al. 1999; Asturiano et al. 2001;
Bromage et al. 2001; Mazorra et al. 2003; Jerez et al.
2006; Alavi et al. 2009; Martın et al. 2009; Tocher
2010). As in other teleosts, the maturation cycle in
gilthead seabream broodstock requires large quanti-
ties of macronutrients such as lipids and proteins to
M. V. Martın (&) � E. Almansa � J. R. Cejas � S. Jerez
Instituto Espanol de Oceanografıa, Centro Oceanografico
de Canarias, Gral. Gutierrez N�4, C.P. 38003 Santa
Cruz de Tenerife, Spain
e-mail: [email protected]
A. Bolanos � A. Lorenzo
Laboratorio de Fisiologıa Animal, Departamento de
Biologıa Animal, Facultad de Biologıa, Universidad de La
Laguna, Av. Astrofısico Fco. Sanchez s/n, 38206 Santa
Cruz de Tenerife, Spain
123
Fish Physiol Biochem (2011) 37:935–949
DOI 10.1007/s10695-011-9491-2
be made available for transfer to the developing of
oocytes and spermatozoids. Gilthead seabream (Spa-
rus aurata) continue eating during sexual maturation
and through the spawning season, which in Canary
Islands takes place from the end of December to the
beginning of June (Cejas et al. 1992; Jerez et al.
2006). In these circumstances, the necessary energy
for gonadal development must come from both
dietary of the broodstock and/or from its body
reserves. Teleost gonads are particularly rich in
DHA and EPA (Sargent et al. 2002, Bobe and Labbe
2010). Specifically, spermatozoa membrane contain
extremely high levels of DHA (Labbe et al. 1995;
Asturiano et al. 2001; Bobe and Labbe 2010) Thus,
these fatty acids derived directly from the dietary
input of broodstock as well as from body reserves are
crucial to gonadogenesis in both male and female and
also to fecundity and to embryo and early larval
development (Wade et al. 1994; Mercure and Van
Der Kraak 1995; Asturiano et al. 2001). Previous
studies conducted by our research group have shown
that both ovary and testicle of gilthead seabream
exhibited a dramatic increase in DHA and EPA
contents before the beginning of spawning, being it
partly due to mobilization from the liver and muscle
(Almansa et al. 2001; Martın et al. 2009). Consider-
ing the current trend of replacement of fish meal and
fish oils with plant-derived products in the existing
commercial diets, it is important to know to what
extent these seasonal lipid mobilizations can also
change the fatty acid composition of tissues, espe-
cially if the diet is inadequate to meet the broodstock
requirements. Most studies of lipid mobilization
associated with reproduction have focused on tissues
like liver and muscle, however, no information is
available about seasonal changes in lipid composition
linked to reproductive cycle in other organs like
intestine and gills, whose participation in these
processes could compromise its functionality, espe-
cially if the diet is not adequate to meet the
requirements of the species. The aim of the present
study was to determine the lipid content and fatty
acid composition of intestine and gills of male
gilthead seabream at different stages of the repro-
ductive cycle, when fish were fed with a diet rich in
HUFA (control) or a diet lacking in these fatty acids,
in an attempt to achieve a better understanding of the
patterns of mobilization and retention of lipids and
essential fatty acids during reproduction.
Materials and methods
Animals and diets
Gilthead seabream (S. aurata L.) broodstock were
selected and randomly sorted into six groups (three
groups/diet) of 12 fish each, six females (1.5 kg mean
mass) and six males (0.7 kg mean mass). Each group
of fish was stocked in an 8-m3 tank with a seawater
supply of 30 l/min, assuring suitable water conditions
and an oxygen level close to saturation. The fish were
exposed to natural photoperiod, and the water tem-
perature throughout the experimental period ranged
from 19.0 to 22.8�C.
In the Canary Islands and under captivity, the
spawning season of S. aurata takes place from
January until May to early June, although males
reach maturity in December. Therefore, the experi-
mental period began 1 month before spermatogenesis
and 2 months before spawning (November) and
ended once spermatogenesis and spawning had
concluded (June). The fish had been fed a commercial
diet (Trouw S.A., Spain) containing 12% lipid and
48% protein until the beginning of the experimental
period. At this point, three groups of fish were fed for
7 months a control diet (diet C) containing fish oil as
sole lipid source and therefore, rich in n-3 and n-6
HUFA. The other three groups were fed a deficient
diet (diet D) containing linseed oil and olive oil as
lipid sources and lacking n-3 and n-6 HUFA but rich
in 18:1n-9, 18:3n-3, and 18:2n-6. Fish were fed once
a day 1.5% of their biomass.
In order to ensure that the diets differed only in
terms of fatty acid composition, ingredients used to
formulate the two experimental diets were exactly the
same, with the exception of the lipid source. In this
sense, two diets containing 12% lipids and 46%
protein (dry mass basis, DMB) but with different
fatty acid profiles were manufactured (Table 1).
Taking into account the total amount of lipid supplied
by the fish meal (Canagrosa, Canary Islands, Spain),
65 g kg-1 of fish oil was added to diet C. Therefore,
the amount of n-3 HUFA in the control diet was
approximately 1.8% DMB and EPA/DHA ratio 2:1,
values adequate to meet the n-3 HUFA requirements
of this species broodstock (Fernandez-Palacios et al.
1995). To formulate the n-3 and n-6 HUFA-deficient
diet (diet D), the fat content from the fish meal was
removed using trichloromethane. Then, 42 g kg-1 of
936 Fish Physiol Biochem (2011) 37:935–949
123
linseed oil (ICN, Barcelona, Spain) and 70 g kg-1 of
a commercially available olive oil were added to this
diet. Finally, 10 g kg-1 of vitamin E (Sigma, St.
Louis, MO) was added to both diets. Furthermore, a
mineral and vitamin mixture (Premix) supplied by
Dibaq (Madrid, Spain) was added to both experi-
mental diets according to NRC (1993) recommenda-
tions for fish. After adding water and mixing all the
ingredients in an electric blender, diets were pelleted
by machine and dried at room temperature. After-
ward, pellets were stored at -20�C prior to use.
The tissue samplings were made in November
(before the start of feeding the experimental diets),
March (after 4 months of feeding), and June (after
7 months of feeding). Prior to sampling, the fish were
starved for 48 h to clear the intestinal tract. At each
sampling, three males from each tank were killed and
anterior intestine and gills samples were taken for
lipid analysis. The entire experiment was conducted
in accordance with Spanish law 223/1988 (B.O.E.
18th March) for protection of experimental animals,
in agreement with European law 89/609/CE.
Biochemical analysis
Moisture content analyses were performed using stan-
dard methods (Horwitz 1980). Total lipid from original
tissue was extracted with chloroform/methanol (2:1 by
vol) according to a modification of the method described
by Folch et al. (1957), with the lipid content being
determined by gravimetry (Christie 1982).
Neutral (NL) and polar (PL) lipid fractions were
also obtained from the crude lipids by means of silica
Sep-Pak cartridges (Millipore, Milford, MA), using
chloroform and methanol as solvents according to
Juaneda and Rockelin (1985). NL and PL were
subjected to acid-catalyzed transmethylation with
1% sulphuric acid (v/v) in methanol. The resultant
fatty acid methyl esters (FAME) were purified by
using thin-layer chromatography (TLC) plates (Chris-
tie 1982). FAME were separated and quantified by
using a Shimadzu GC-14A gas chromatograph
equipped with a flame ionization detector (250�C)
and a fused silica capillary column SupelcowaxTM 10
(30 m 9 0.32 mm I.D.). Helium was used as carrier
gas, and the oven initial temperature was 180�C for
10 min, followed by an increase at a rate of 2.5�C/min
to a final temperature of 215�C. Individual FAME was
identified by reference to authentic standards and to
well-characterized fish oil. Prior to transmethylation,
heneicosanoic acid (21:0) was added to the lipid
fractions as an internal standard. The results were
expressed as milligrams of each fatty acid per gram of
tissue dry mass (mg g-1 dry mass).
TLC (20 9 20 cm 9 0.25 mm) plates, precoated
with silica gel (without fluorescent indicator) were
purchased from Macherey–Nagel (Duren, Germany).
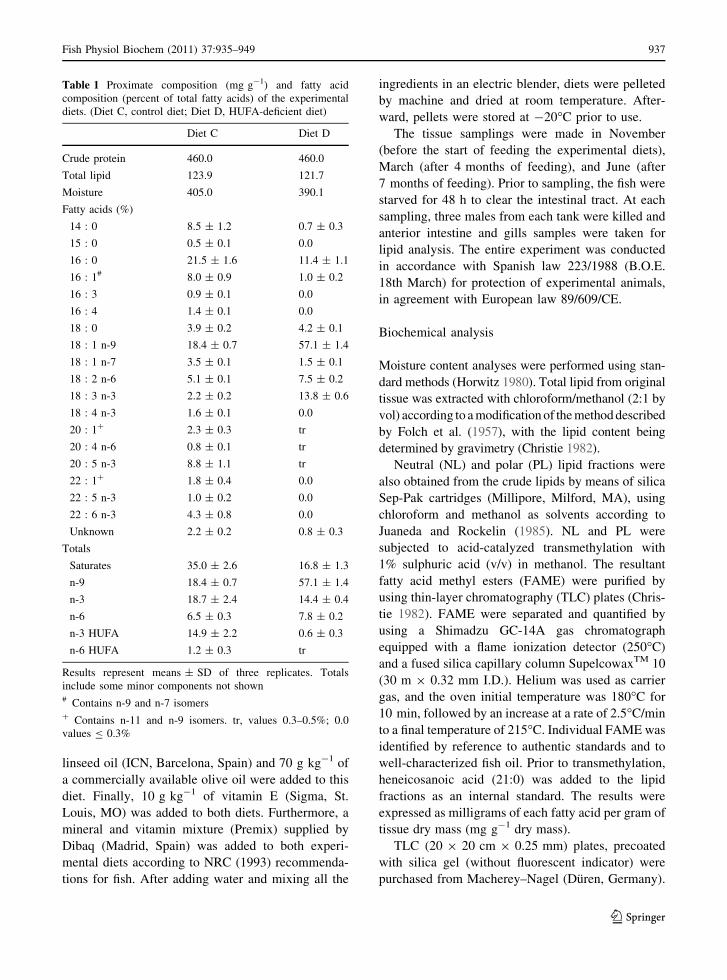
Table 1 Proximate composition (mg g-1) and fatty acid
composition (percent of total fatty acids) of the experimental
diets. (Diet C, control diet; Diet D, HUFA-deficient diet)
Diet C Diet D
Crude protein 460.0 460.0
Total lipid 123.9 121.7
Moisture 405.0 390.1
Fatty acids (%)
14 : 0 8.5 ± 1.2 0.7 ± 0.3
15 : 0 0.5 ± 0.1 0.0
16 : 0 21.5 ± 1.6 11.4 ± 1.1
16 : 1# 8.0 ± 0.9 1.0 ± 0.2
16 : 3 0.9 ± 0.1 0.0
16 : 4 1.4 ± 0.1 0.0
18 : 0 3.9 ± 0.2 4.2 ± 0.1
18 : 1 n-9 18.4 ± 0.7 57.1 ± 1.4
18 : 1 n-7 3.5 ± 0.1 1.5 ± 0.1
18 : 2 n-6 5.1 ± 0.1 7.5 ± 0.2
18 : 3 n-3 2.2 ± 0.2 13.8 ± 0.6
18 : 4 n-3 1.6 ± 0.1 0.0
20 : 1? 2.3 ± 0.3 tr
20 : 4 n-6 0.8 ± 0.1 tr
20 : 5 n-3 8.8 ± 1.1 tr
22 : 1? 1.8 ± 0.4 0.0
22 : 5 n-3 1.0 ± 0.2 0.0
22 : 6 n-3 4.3 ± 0.8 0.0
Unknown 2.2 ± 0.2 0.8 ± 0.3
Totals
Saturates 35.0 ± 2.6 16.8 ± 1.3
n-9 18.4 ± 0.7 57.1 ± 1.4
n-3 18.7 ± 2.4 14.4 ± 0.4
n-6 6.5 ± 0.3 7.8 ± 0.2
n-3 HUFA 14.9 ± 2.2 0.6 ± 0.3
n-6 HUFA 1.2 ± 0.3 tr
Results represent means ± SD of three replicates. Totals
include some minor components not shown# Contains n-9 and n-7 isomers? Contains n-11 and n-9 isomers. tr, values 0.3–0.5%; 0.0
values B 0.3%
Fish Physiol Biochem (2011) 37:935–949 937
123
All organic solvents used were of reagent grade and
were purchased from Panreac (Barcelona, Spain).
Statistical analysis
Results are presented as means ± standard deviation
(S.D.) after the analysis of triplicate samples The data
were checked for normal distribution with the one-
sample Kolmogorov–Smirnoff test as well as for
homogeneity of the variances with the Levene test
and, when necessary, arcsine transformation was
performed. The effects of three different spawning
periods on intestine and gills fatty acid composition
for each specific diet were analyzed by one-way
ANOVA followed by Student–Newman–Keuls
(SNK) multiple comparison tests. When normal
distribution and/or homogeneity of the variances were
not achieved, data were subjected to the Kruskall–
Wallis nonparametric test, followed by a nonpara-
metric multiple comparison test (Zar 1984). Differ-
ences between the two dietary treatments were
established by treating the pairs of means with a
Student’s t test. In all statistical tests used, P values of
less than 0.05 were considered statistically different.
The values of each fatty acid were chemometrically
analyzed by principal components analysis (PCA).
Factor scores were subsequently analyzed by one-way
ANOVA followed by SNK multiple comparison tests.
The statistical analysis was performed using the SPSS
package version 15.0 (SPSS Inc, Chicago, USA).
Results
Total lipid content on DMB in both broodstock diets
were almost identical, being 12.39 and 12.17% for
diets C and D, respectively (Table 1). However, they
differed in their fatty acid contents. Diet D was
characterized by having increased proportions of
monounsaturated (18:1n-9) and polyunsaturated
(18:3n-3) fatty acids compared to diet C that had a
higher content of saturated (16:0, 14:0) and highly
unsaturated n-3 and n-6 fatty acids (20:4n-6, 20:5n-3,
22:6n-3).
The total neutral and polar lipid and fatty acid
compositions of neutral and polar lipid from gilthead
seabream (S. aurata L.) intestine fed with C and D
diets are shown in Tables 2 and 3. Neither dietary
lipid nor stages of reproductive cycle had any
significant effect on total neutral and polar lipid
contents of intestine (Tables 2, 3). However, differ-
ences in the fatty acid compositions of the diets and
stages of reproductive cycle were reflected in the
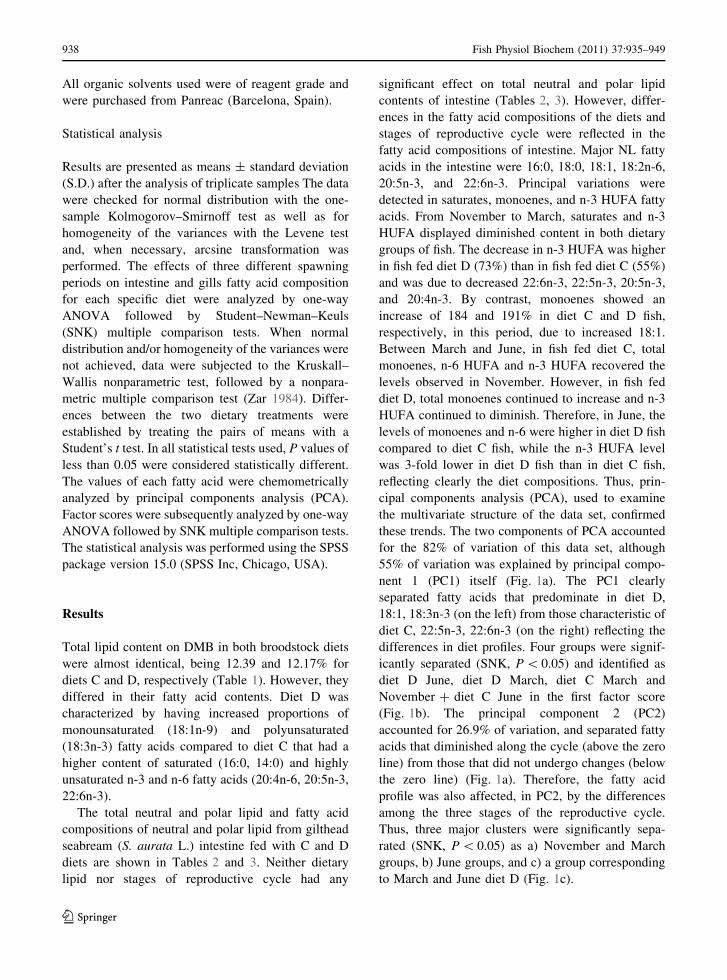
fatty acid compositions of intestine. Major NL fatty
acids in the intestine were 16:0, 18:0, 18:1, 18:2n-6,
20:5n-3, and 22:6n-3. Principal variations were
detected in saturates, monoenes, and n-3 HUFA fatty
acids. From November to March, saturates and n-3
HUFA displayed diminished content in both dietary
groups of fish. The decrease in n-3 HUFA was higher
in fish fed diet D (73%) than in fish fed diet C (55%)
and was due to decreased 22:6n-3, 22:5n-3, 20:5n-3,
and 20:4n-3. By contrast, monoenes showed an
increase of 184 and 191% in diet C and D fish,
respectively, in this period, due to increased 18:1.
Between March and June, in fish fed diet C, total
monoenes, n-6 HUFA and n-3 HUFA recovered the
levels observed in November. However, in fish fed
diet D, total monoenes continued to increase and n-3
HUFA continued to diminish. Therefore, in June, the
levels of monoenes and n-6 were higher in diet D fish
compared to diet C fish, while the n-3 HUFA level
was 3-fold lower in diet D fish than in diet C fish,
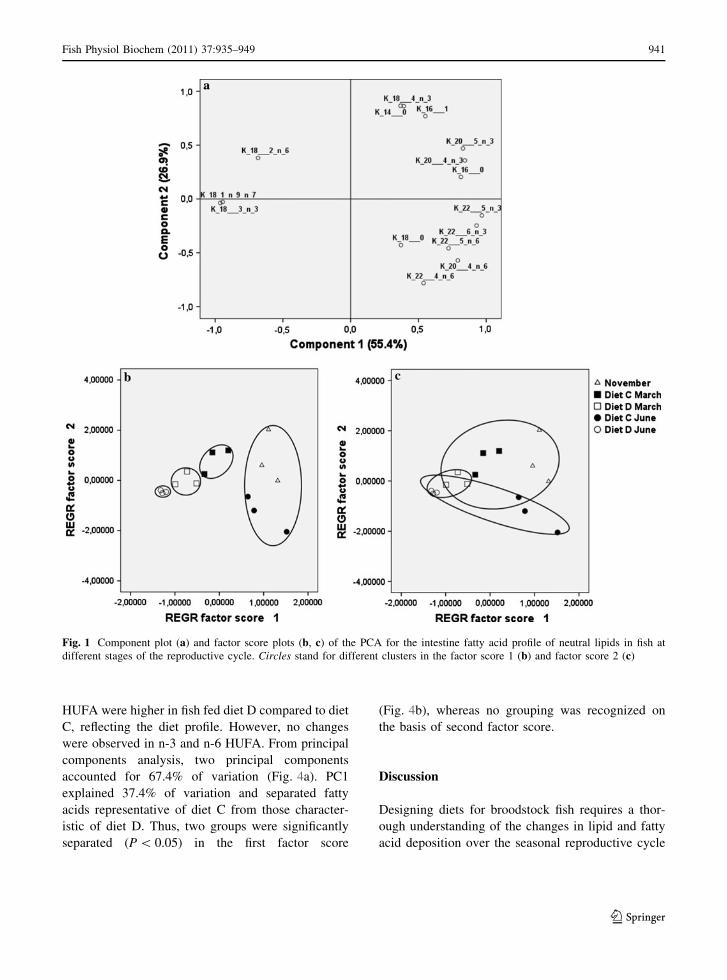
reflecting clearly the diet compositions. Thus, prin-
cipal components analysis (PCA), used to examine
the multivariate structure of the data set, confirmed
these trends. The two components of PCA accounted
for the 82% of variation of this data set, although
55% of variation was explained by principal compo-
nent 1 (PC1) itself (Fig. 1a). The PC1 clearly
separated fatty acids that predominate in diet D,
18:1, 18:3n-3 (on the left) from those characteristic of
diet C, 22:5n-3, 22:6n-3 (on the right) reflecting the
differences in diet profiles. Four groups were signif-
icantly separated (SNK, P \ 0.05) and identified as
diet D June, diet D March, diet C March and
November ? diet C June in the first factor score
(Fig. 1b). The principal component 2 (PC2)
accounted for 26.9% of variation, and separated fatty
acids that diminished along the cycle (above the zero
line) from those that did not undergo changes (below
the zero line) (Fig. 1a). Therefore, the fatty acid
profile was also affected, in PC2, by the differences
among the three stages of the reproductive cycle.
Thus, three major clusters were significantly sepa-
rated (SNK, P \ 0.05) as a) November and March
groups, b) June groups, and c) a group corresponding
to March and June diet D (Fig. 1c).
938 Fish Physiol Biochem (2011) 37:935–949
123
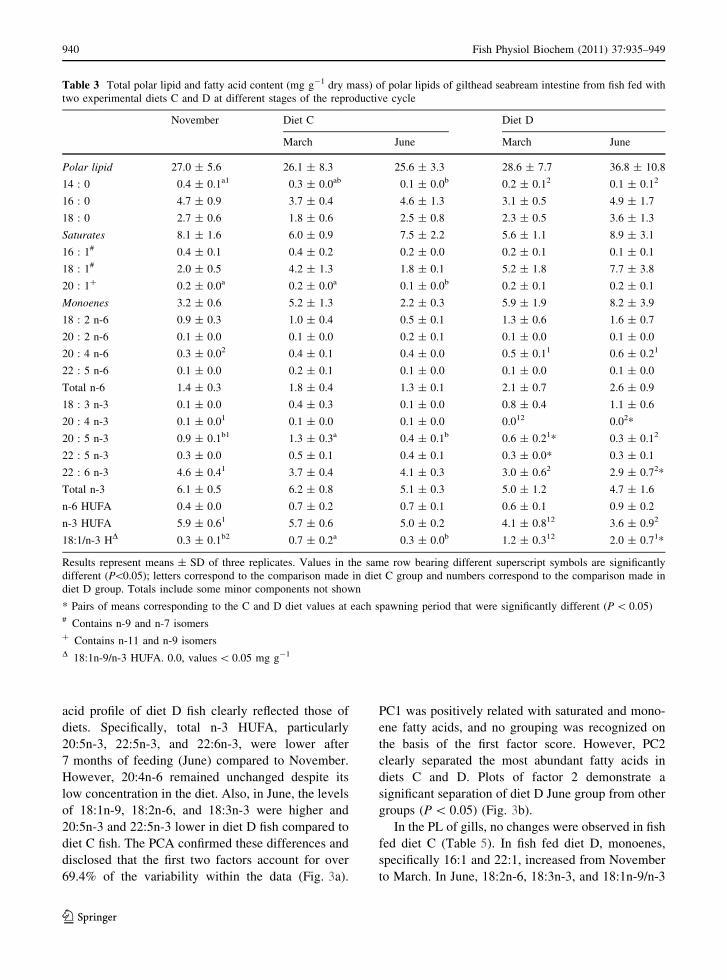
Fatty acid composition of intestine PL from fish
diet C (Table 3) showed no significant differences
throughout the study period. However, after 7 months
of feeding (June), a decrease in n-3 HUFA content,
particularly 20:5n-3 and 22:6n-3, was observed in fish
fed diet D reflecting clearly the deficient diet. When
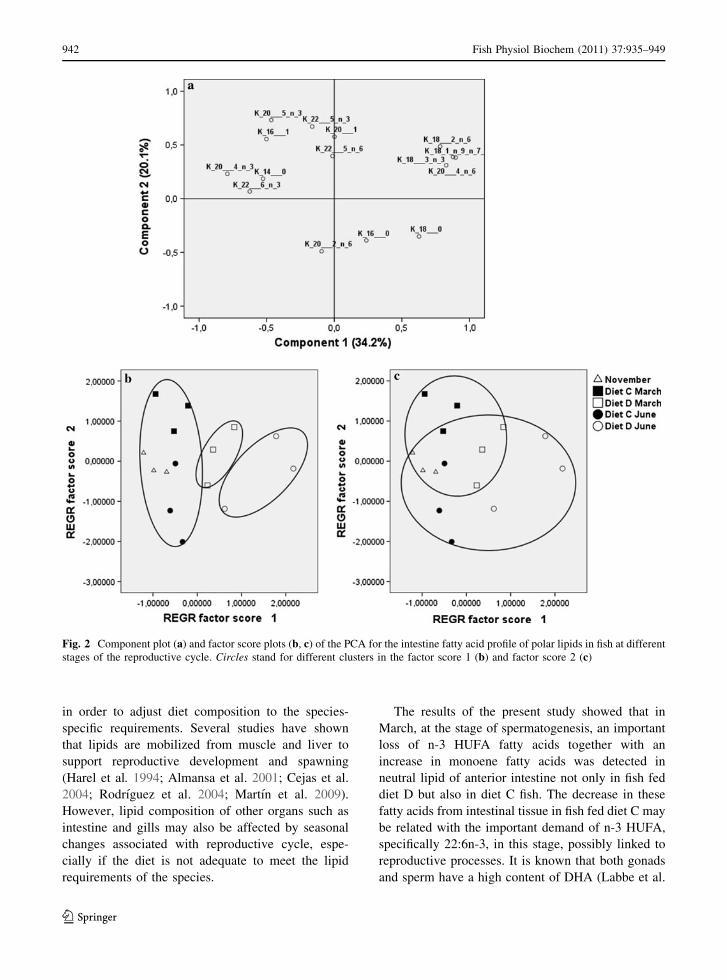
data of PL were analyzed by PCA, the two principal
components accounted for 54.3% of variation
(Fig. 2a). PC1 explained 34.2% of variation and
separated several fatty acids representative of diet D
from those characteristic of diet C grouping three
clusters: November and diet C groups, diet D March
group, and diet D June group (SNK, P \ 0.05)
(Fig. 2b). However, the fatty acid profile was also
affected in PC2 (20.1%) by the differences among the
three stages of the reproductive cycle separating
November and March stages from the June stage
(SNK, P \ 0.05) (Fig. 2c).
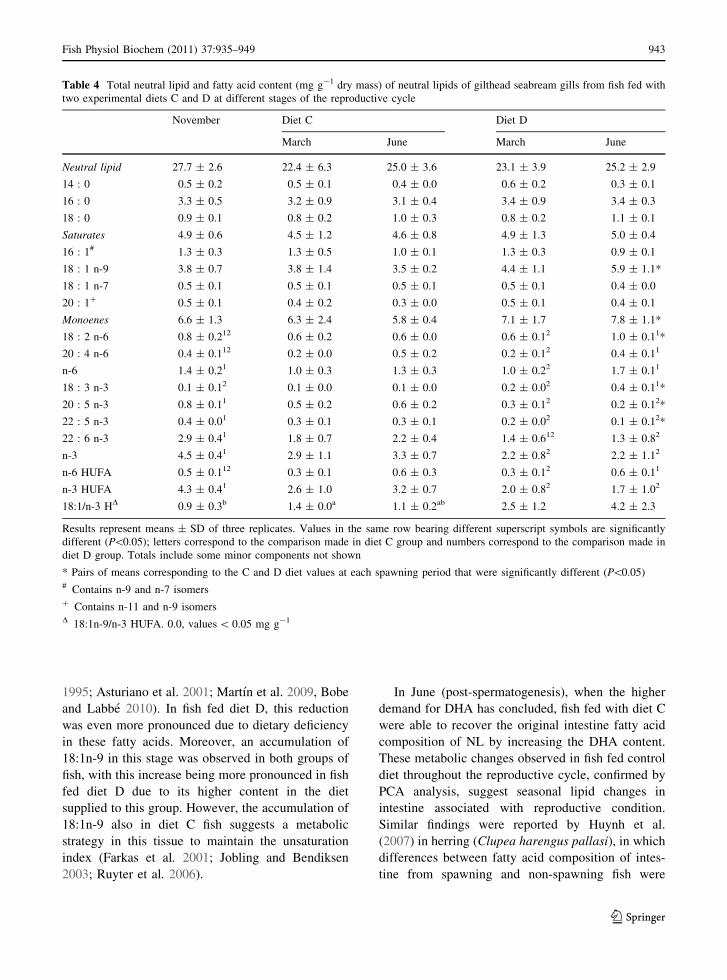
The NL and PL fatty acid compositions of the gills
in fish fed with diet C and D, in the three stages of the
reproductive cycle, are shown in Tables 4 and 5.
Major fatty acids in the NL gills were 16:0, 18:1n-9,
and 22:6n-3. In diet C fish, no changes were observed
during the three periods studied. However, the fatty
Table 2 Total neutral lipid and fatty acid content (mg g-1 dry mass) of neutral lipids of gilthead seabream intestine from fish fed
with two experimental diets C and D at different stages of the reproductive cycle
November Diet C Diet D
March June March June
Neutral lipid 74.7 ± 6.0 83.1 ± 16.1 67.1 ± 8.6 72.4 ± 13.1 80.1 ± 16.3
14 : 0 1.9 ± 1.01 1.7 ± 0.6 0.3 ± 0.3 0.8 ± 0.32 0.3 ± 0.03
16 : 0 11.0 ± 1.5a1 8.3 ± 0.3b 9.4 ± 0.8ab 5.7 ± 0.42* 6.7 ± 0.92*
18 : 0 3.7 ± 0.3a1 2.7 ± 0.4b 3.6 ± 0.2a 2.6 ± 0.42 3.5 ± 0.512
Saturates 17.2 ± 2.0a1 13.2 ± 0.5b 14.3 ± 1.0ab 9.5 ± 0.52* 10.9 ± 1.42*
16 : 1# 2.8 ± 1.21 2.5 ± 0.6 1.4 ± 0.6 1.2 ± 0.312* 0.6 ± 0.02
18 : 1# 11.3 ± 2.5b3 28.0 ± 7.3a 9.8 ± 1.4b 32.4 ± 4.62 48.3 ± 7.11*
Monoenes 18.3 ± 5.1b3 33.6 ± 6.1a 12.4 ± 2.4b 35.0 ± 4.22 49.6 ± 7.31*
18 : 2 n-6 3.9 ± 0.9a 4.2 ± 0.6a 1.9 ± 0.3b 4.1 ± 0.7 5.2 ± 0.5 *
20 : 4 n-6 1.0 ± 0.2ab1 0.5 ± 0.1b 1.7 ± 0.7a 0.5 ± 0.22 0.4 ± 0.02*
22 : 4 n-6 0.1 ± 0.1 0.0 0.2 ± 0.1 0.0 0.1 ± 0.0
22 : 5 n-6 0.2 ± 0.0b1 0.1 ± 0.0b 0.3 ± 0.1a 0.1 ± 0.112 0.02
Total n-6 5.5 ± 0.8 5.0 ± 0.6 3.7 ± 0.8 5.0 ± 0.5 5.9 ± 0.5*
18 : 3 n-3 0.6 ± 0.3b3 3.7 ± 1.4a 0.5 ± 0.1b 5.5 ± 1.52 7.7 ± 0.51*
18 : 4 n-3 0.6 ± 0.3a 0.4 ± 0.1a 0.1 ± 0.1b 0.2 ± 0.2 0.0
20 : 4 n-3 0.6 ± 0.21 0.3 ± 0.0 0.3 ± 0.0 0.1 ± 0.12 0.0c3*
20 : 5 n-3 3.4 ± 0.5a1 2.4 ± 0.7ab 1.7 ± 0.1b 0.9 ± 0.32* 0.2 ± 0.12*
22 : 5 n-3 1.3 ± 0.31 0.7 ± 0.2 1.4 ± 0.4 0.4 ± 0.22 0.2 ± 0.02*
22 : 6 n-3 8.2 ± 1.81 2.7 ± 0.5 7.9 ± 3.7 2.1 ± 1.12 0.9 ± 0.12*
Total n-3 14.9 ± 1.9 10.3 ± 0.3 11.1 ± 3.5 9.4 ± 0.4* 9.3 ± 0.3
n-6 HUFA 1.3 ± 0.3ab1 0.6 ± 0.1b 2.3 ± 0.9a 0.7 ± 0.22 0.5 ± 0.12*
n-3 HUFA 13.7 ± 2.5a1 6.2 ± 1.3b 10.9 ± 3.8ab 3.7 ± 1.62 1.5 ± 0.23*
18:1/n-3 HD 0.8 ± 0.3b2 4.7 ± 2.1a 1.0 ± 0.5b 10.0 ± 4.42 31.8 ± 5.01*
Results represent means ± SD of three replicates. Values in the same row bearing different superscript symbols are significantly
different (P \ 0.05); letters correspond to the comparison made in diet C group and numbers correspond to the comparison made in
diet D group. Totals include some minor components not shown
* Pairs of means corresponding to the C and D diet values at each spawning period that were significantly different (P \ 0.05)# Contains n-9 and n-7 isomersD 18:1n-9/n-3 HUFA. 0.0, values \0.05 mg g-1
Fish Physiol Biochem (2011) 37:935–949 939
123
acid profile of diet D fish clearly reflected those of
diets. Specifically, total n-3 HUFA, particularly
20:5n-3, 22:5n-3, and 22:6n-3, were lower after
7 months of feeding (June) compared to November.
However, 20:4n-6 remained unchanged despite its
low concentration in the diet. Also, in June, the levels
of 18:1n-9, 18:2n-6, and 18:3n-3 were higher and
20:5n-3 and 22:5n-3 lower in diet D fish compared to
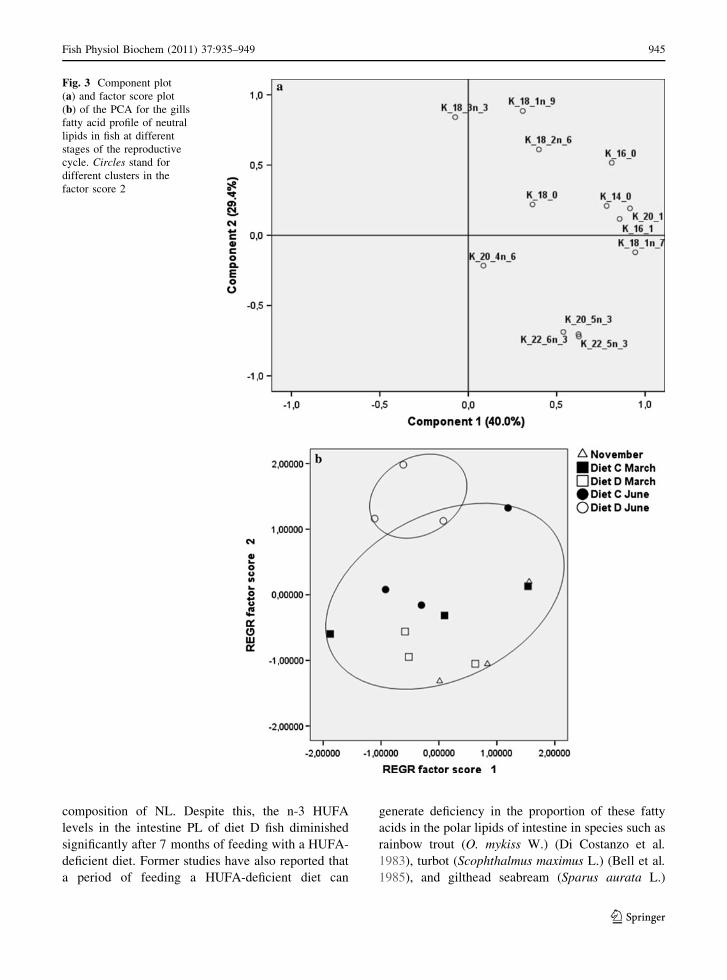
diet C fish. The PCA confirmed these differences and
disclosed that the first two factors account for over
69.4% of the variability within the data (Fig. 3a).
PC1 was positively related with saturated and mono-
ene fatty acids, and no grouping was recognized on
the basis of the first factor score. However, PC2
clearly separated the most abundant fatty acids in
diets C and D. Plots of factor 2 demonstrate a
significant separation of diet D June group from other
groups (P \ 0.05) (Fig. 3b).
In the PL of gills, no changes were observed in fish
fed diet C (Table 5). In fish fed diet D, monoenes,
specifically 16:1 and 22:1, increased from November
to March. In June, 18:2n-6, 18:3n-3, and 18:1n-9/n-3
Table 3 Total polar lipid and fatty acid content (mg g-1 dry mass) of polar lipids of gilthead seabream intestine from fish fed with
two experimental diets C and D at different stages of the reproductive cycle
November Diet C Diet D
March June March June
Polar lipid 27.0 ± 5.6 26.1 ± 8.3 25.6 ± 3.3 28.6 ± 7.7 36.8 ± 10.8
14 : 0 0.4 ± 0.1a1 0.3 ± 0.0ab 0.1 ± 0.0b 0.2 ± 0.12 0.1 ± 0.12
16 : 0 4.7 ± 0.9 3.7 ± 0.4 4.6 ± 1.3 3.1 ± 0.5 4.9 ± 1.7
18 : 0 2.7 ± 0.6 1.8 ± 0.6 2.5 ± 0.8 2.3 ± 0.5 3.6 ± 1.3
Saturates 8.1 ± 1.6 6.0 ± 0.9 7.5 ± 2.2 5.6 ± 1.1 8.9 ± 3.1
16 : 1# 0.4 ± 0.1 0.4 ± 0.2 0.2 ± 0.0 0.2 ± 0.1 0.1 ± 0.1
18 : 1# 2.0 ± 0.5 4.2 ± 1.3 1.8 ± 0.1 5.2 ± 1.8 7.7 ± 3.8
20 : 1? 0.2 ± 0.0a 0.2 ± 0.0a 0.1 ± 0.0b 0.2 ± 0.1 0.2 ± 0.1
Monoenes 3.2 ± 0.6 5.2 ± 1.3 2.2 ± 0.3 5.9 ± 1.9 8.2 ± 3.9
18 : 2 n-6 0.9 ± 0.3 1.0 ± 0.4 0.5 ± 0.1 1.3 ± 0.6 1.6 ± 0.7
20 : 2 n-6 0.1 ± 0.0 0.1 ± 0.0 0.2 ± 0.1 0.1 ± 0.0 0.1 ± 0.0
20 : 4 n-6 0.3 ± 0.02 0.4 ± 0.1 0.4 ± 0.0 0.5 ± 0.11 0.6 ± 0.21
22 : 5 n-6 0.1 ± 0.0 0.2 ± 0.1 0.1 ± 0.0 0.1 ± 0.0 0.1 ± 0.0
Total n-6 1.4 ± 0.3 1.8 ± 0.4 1.3 ± 0.1 2.1 ± 0.7 2.6 ± 0.9
18 : 3 n-3 0.1 ± 0.0 0.4 ± 0.3 0.1 ± 0.0 0.8 ± 0.4 1.1 ± 0.6
20 : 4 n-3 0.1 ± 0.01 0.1 ± 0.0 0.1 ± 0.0 0.012 0.02*
20 : 5 n-3 0.9 ± 0.1b1 1.3 ± 0.3a 0.4 ± 0.1b 0.6 ± 0.21* 0.3 ± 0.12
22 : 5 n-3 0.3 ± 0.0 0.5 ± 0.1 0.4 ± 0.1 0.3 ± 0.0* 0.3 ± 0.1
22 : 6 n-3 4.6 ± 0.41 3.7 ± 0.4 4.1 ± 0.3 3.0 ± 0.62 2.9 ± 0.72*
Total n-3 6.1 ± 0.5 6.2 ± 0.8 5.1 ± 0.3 5.0 ± 1.2 4.7 ± 1.6
n-6 HUFA 0.4 ± 0.0 0.7 ± 0.2 0.7 ± 0.1 0.6 ± 0.1 0.9 ± 0.2
n-3 HUFA 5.9 ± 0.61 5.7 ± 0.6 5.0 ± 0.2 4.1 ± 0.812 3.6 ± 0.92
18:1/n-3 HD 0.3 ± 0.1b2 0.7 ± 0.2a 0.3 ± 0.0b 1.2 ± 0.312 2.0 ± 0.71*
Results represent means ± SD of three replicates. Values in the same row bearing different superscript symbols are significantly
different (P\0.05); letters correspond to the comparison made in diet C group and numbers correspond to the comparison made in
diet D group. Totals include some minor components not shown
* Pairs of means corresponding to the C and D diet values at each spawning period that were significantly different (P \ 0.05)# Contains n-9 and n-7 isomers? Contains n-11 and n-9 isomersD 18:1n-9/n-3 HUFA. 0.0, values \ 0.05 mg g-1
940 Fish Physiol Biochem (2011) 37:935–949
123
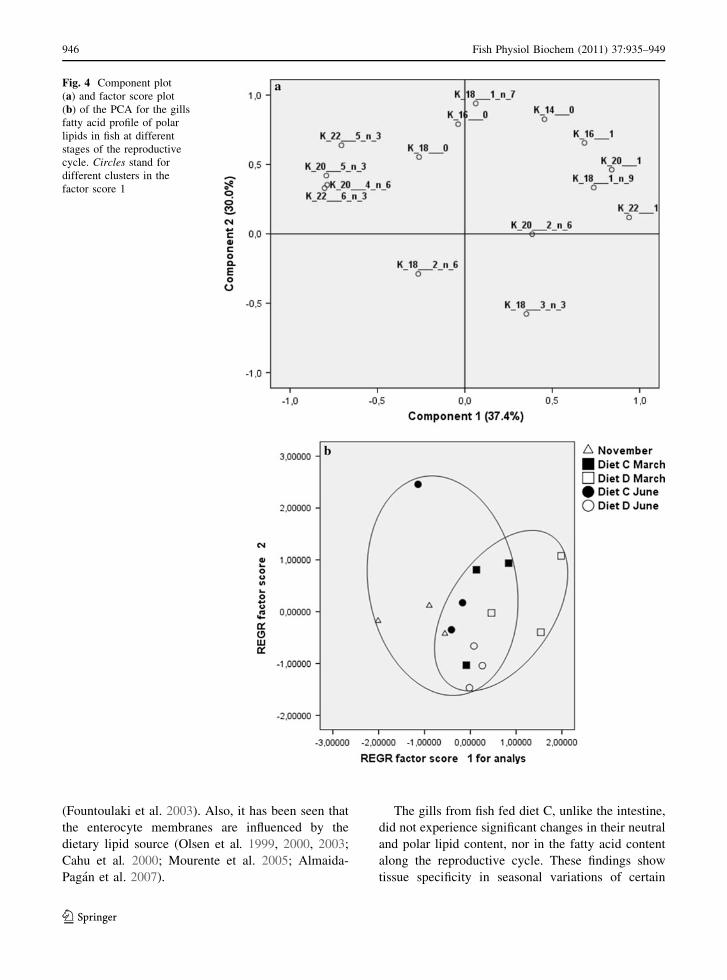
HUFA were higher in fish fed diet D compared to diet
C, reflecting the diet profile. However, no changes
were observed in n-3 and n-6 HUFA. From principal
components analysis, two principal components
accounted for 67.4% of variation (Fig. 4a). PC1
explained 37.4% of variation and separated fatty
acids representative of diet C from those character-
istic of diet D. Thus, two groups were significantly
separated (P \ 0.05) in the first factor score
(Fig. 4b), whereas no grouping was recognized on
the basis of second factor score.
Discussion
Designing diets for broodstock fish requires a thor-
ough understanding of the changes in lipid and fatty
acid deposition over the seasonal reproductive cycle
Fig. 1 Component plot (a) and factor score plots (b, c) of the PCA for the intestine fatty acid profile of neutral lipids in fish at
different stages of the reproductive cycle. Circles stand for different clusters in the factor score 1 (b) and factor score 2 (c)
Fish Physiol Biochem (2011) 37:935–949 941
123
in order to adjust diet composition to the species-
specific requirements. Several studies have shown
that lipids are mobilized from muscle and liver to
support reproductive development and spawning
(Harel et al. 1994; Almansa et al. 2001; Cejas et al.
2004; Rodrıguez et al. 2004; Martın et al. 2009).
However, lipid composition of other organs such as
intestine and gills may also be affected by seasonal
changes associated with reproductive cycle, espe-
cially if the diet is not adequate to meet the lipid
requirements of the species.
The results of the present study showed that in
March, at the stage of spermatogenesis, an important
loss of n-3 HUFA fatty acids together with an
increase in monoene fatty acids was detected in
neutral lipid of anterior intestine not only in fish fed
diet D but also in diet C fish. The decrease in these
fatty acids from intestinal tissue in fish fed diet C may
be related with the important demand of n-3 HUFA,
specifically 22:6n-3, in this stage, possibly linked to
reproductive processes. It is known that both gonads
and sperm have a high content of DHA (Labbe et al.
Fig. 2 Component plot (a) and factor score plots (b, c) of the PCA for the intestine fatty acid profile of polar lipids in fish at different
stages of the reproductive cycle. Circles stand for different clusters in the factor score 1 (b) and factor score 2 (c)
942 Fish Physiol Biochem (2011) 37:935–949
123
1995; Asturiano et al. 2001; Martın et al. 2009, Bobe
and Labbe 2010). In fish fed diet D, this reduction
was even more pronounced due to dietary deficiency
in these fatty acids. Moreover, an accumulation of
18:1n-9 in this stage was observed in both groups of
fish, with this increase being more pronounced in fish
fed diet D due to its higher content in the diet
supplied to this group. However, the accumulation of
18:1n-9 also in diet C fish suggests a metabolic
strategy in this tissue to maintain the unsaturation
index (Farkas et al. 2001; Jobling and Bendiksen
2003; Ruyter et al. 2006).
In June (post-spermatogenesis), when the higher
demand for DHA has concluded, fish fed with diet C
were able to recover the original intestine fatty acid
composition of NL by increasing the DHA content.
These metabolic changes observed in fish fed control
diet throughout the reproductive cycle, confirmed by
PCA analysis, suggest seasonal lipid changes in
intestine associated with reproductive condition.
Similar findings were reported by Huynh et al.
(2007) in herring (Clupea harengus pallasi), in which
differences between fatty acid composition of intes-
tine from spawning and non-spawning fish were
Table 4 Total neutral lipid and fatty acid content (mg g-1 dry mass) of neutral lipids of gilthead seabream gills from fish fed with
two experimental diets C and D at different stages of the reproductive cycle
November Diet C Diet D
March June March June
Neutral lipid 27.7 ± 2.6 22.4 ± 6.3 25.0 ± 3.6 23.1 ± 3.9 25.2 ± 2.9
14 : 0 0.5 ± 0.2 0.5 ± 0.1 0.4 ± 0.0 0.6 ± 0.2 0.3 ± 0.1
16 : 0 3.3 ± 0.5 3.2 ± 0.9 3.1 ± 0.4 3.4 ± 0.9 3.4 ± 0.3
18 : 0 0.9 ± 0.1 0.8 ± 0.2 1.0 ± 0.3 0.8 ± 0.2 1.1 ± 0.1
Saturates 4.9 ± 0.6 4.5 ± 1.2 4.6 ± 0.8 4.9 ± 1.3 5.0 ± 0.4
16 : 1# 1.3 ± 0.3 1.3 ± 0.5 1.0 ± 0.1 1.3 ± 0.3 0.9 ± 0.1
18 : 1 n-9 3.8 ± 0.7 3.8 ± 1.4 3.5 ± 0.2 4.4 ± 1.1 5.9 ± 1.1*
18 : 1 n-7 0.5 ± 0.1 0.5 ± 0.1 0.5 ± 0.1 0.5 ± 0.1 0.4 ± 0.0
20 : 1? 0.5 ± 0.1 0.4 ± 0.2 0.3 ± 0.0 0.5 ± 0.1 0.4 ± 0.1
Monoenes 6.6 ± 1.3 6.3 ± 2.4 5.8 ± 0.4 7.1 ± 1.7 7.8 ± 1.1*
18 : 2 n-6 0.8 ± 0.212 0.6 ± 0.2 0.6 ± 0.0 0.6 ± 0.12 1.0 ± 0.11*
20 : 4 n-6 0.4 ± 0.112 0.2 ± 0.0 0.5 ± 0.2 0.2 ± 0.12 0.4 ± 0.11
n-6 1.4 ± 0.21 1.0 ± 0.3 1.3 ± 0.3 1.0 ± 0.22 1.7 ± 0.11
18 : 3 n-3 0.1 ± 0.12 0.1 ± 0.0 0.1 ± 0.0 0.2 ± 0.02 0.4 ± 0.11*
20 : 5 n-3 0.8 ± 0.11 0.5 ± 0.2 0.6 ± 0.2 0.3 ± 0.12 0.2 ± 0.12*
22 : 5 n-3 0.4 ± 0.01 0.3 ± 0.1 0.3 ± 0.1 0.2 ± 0.02 0.1 ± 0.12*
22 : 6 n-3 2.9 ± 0.41 1.8 ± 0.7 2.2 ± 0.4 1.4 ± 0.612 1.3 ± 0.82
n-3 4.5 ± 0.41 2.9 ± 1.1 3.3 ± 0.7 2.2 ± 0.82 2.2 ± 1.12
n-6 HUFA 0.5 ± 0.112 0.3 ± 0.1 0.6 ± 0.3 0.3 ± 0.12 0.6 ± 0.11
n-3 HUFA 4.3 ± 0.41 2.6 ± 1.0 3.2 ± 0.7 2.0 ± 0.82 1.7 ± 1.02
18:1/n-3 HD 0.9 ± 0.3b 1.4 ± 0.0a 1.1 ± 0.2ab 2.5 ± 1.2 4.2 ± 2.3
Results represent means ± SD of three replicates. Values in the same row bearing different superscript symbols are significantly
different (P\0.05); letters correspond to the comparison made in diet C group and numbers correspond to the comparison made in
diet D group. Totals include some minor components not shown
* Pairs of means corresponding to the C and D diet values at each spawning period that were significantly different (P\0.05)# Contains n-9 and n-7 isomers? Contains n-11 and n-9 isomersD 18:1n-9/n-3 HUFA. 0.0, values \ 0.05 mg g-1
Fish Physiol Biochem (2011) 37:935–949 943
123
found. Likewise, in Esox lucius, intestinal lipids are
mobilized before any change in lipid from other
tissues is apparent (Navarro and Gutierrez 1995).
In fish fed with diet D, the deficiencies in HUFA
were accentuated in June, while monoene content was
increased, reflecting clearly the influence not only
seasonal changes linked to reproductive process but
also the fatty acid profile of the deficient diet supplied
to this group. This notion is supported by PCA analysis
that revealed that the 55% of variation in the intestine
fatty acid profile of NL is explained by dietary
components. In addition, NL of November group and
fish fed diet C groups (March and June) appeared as a
highly homogeneous group, whereas fish fed diet D
groups deficient in HUFA appeared as outlier groups
in the PCA analysis. Likewise, numerous studies have
shown the critical influence of diet on fatty acid
composition of intestine and enterocytes (Olsen et al.
1999, 2000; Cahu et al. 2000; Caballero et al. 2003;
Tocher et al. 2002, 2004; Ruyter et al. 2006).
On the other hand, the fatty acid composition of
PL was less affected by diet than the fatty acid
Table 5 Total polar lipid and fatty acid content (mg g-1 dry mass) of polar lipids of gilthead seabream gills from fish fed with two
experimental diets C and D at different stages of the reproductive cycle
November Diet C Diet D
March June March June
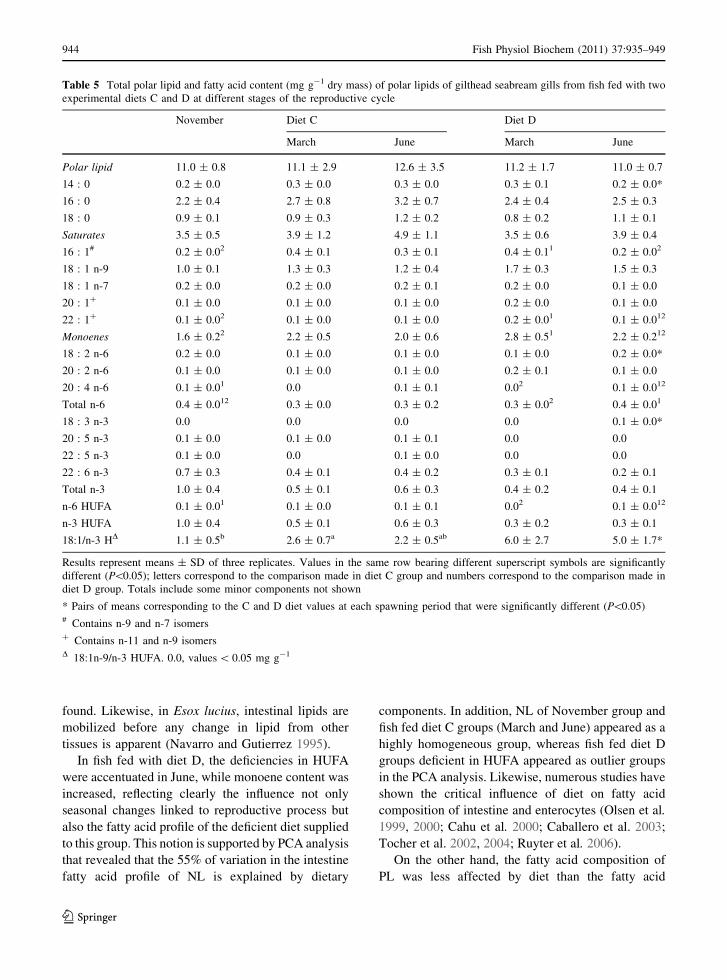
Polar lipid 11.0 ± 0.8 11.1 ± 2.9 12.6 ± 3.5 11.2 ± 1.7 11.0 ± 0.7
14 : 0 0.2 ± 0.0 0.3 ± 0.0 0.3 ± 0.0 0.3 ± 0.1 0.2 ± 0.0*
16 : 0 2.2 ± 0.4 2.7 ± 0.8 3.2 ± 0.7 2.4 ± 0.4 2.5 ± 0.3
18 : 0 0.9 ± 0.1 0.9 ± 0.3 1.2 ± 0.2 0.8 ± 0.2 1.1 ± 0.1
Saturates 3.5 ± 0.5 3.9 ± 1.2 4.9 ± 1.1 3.5 ± 0.6 3.9 ± 0.4
16 : 1# 0.2 ± 0.02 0.4 ± 0.1 0.3 ± 0.1 0.4 ± 0.11 0.2 ± 0.02
18 : 1 n-9 1.0 ± 0.1 1.3 ± 0.3 1.2 ± 0.4 1.7 ± 0.3 1.5 ± 0.3
18 : 1 n-7 0.2 ± 0.0 0.2 ± 0.0 0.2 ± 0.1 0.2 ± 0.0 0.1 ± 0.0
20 : 1? 0.1 ± 0.0 0.1 ± 0.0 0.1 ± 0.0 0.2 ± 0.0 0.1 ± 0.0
22 : 1? 0.1 ± 0.02 0.1 ± 0.0 0.1 ± 0.0 0.2 ± 0.01 0.1 ± 0.012
Monoenes 1.6 ± 0.22 2.2 ± 0.5 2.0 ± 0.6 2.8 ± 0.51 2.2 ± 0.212
18 : 2 n-6 0.2 ± 0.0 0.1 ± 0.0 0.1 ± 0.0 0.1 ± 0.0 0.2 ± 0.0*
20 : 2 n-6 0.1 ± 0.0 0.1 ± 0.0 0.1 ± 0.0 0.2 ± 0.1 0.1 ± 0.0
20 : 4 n-6 0.1 ± 0.01 0.0 0.1 ± 0.1 0.02 0.1 ± 0.012
Total n-6 0.4 ± 0.012 0.3 ± 0.0 0.3 ± 0.2 0.3 ± 0.02 0.4 ± 0.01
18 : 3 n-3 0.0 0.0 0.0 0.0 0.1 ± 0.0*
20 : 5 n-3 0.1 ± 0.0 0.1 ± 0.0 0.1 ± 0.1 0.0 0.0
22 : 5 n-3 0.1 ± 0.0 0.0 0.1 ± 0.0 0.0 0.0
22 : 6 n-3 0.7 ± 0.3 0.4 ± 0.1 0.4 ± 0.2 0.3 ± 0.1 0.2 ± 0.1
Total n-3 1.0 ± 0.4 0.5 ± 0.1 0.6 ± 0.3 0.4 ± 0.2 0.4 ± 0.1
n-6 HUFA 0.1 ± 0.01 0.1 ± 0.0 0.1 ± 0.1 0.02 0.1 ± 0.012
n-3 HUFA 1.0 ± 0.4 0.5 ± 0.1 0.6 ± 0.3 0.3 ± 0.2 0.3 ± 0.1
18:1/n-3 HD 1.1 ± 0.5b 2.6 ± 0.7a 2.2 ± 0.5ab 6.0 ± 2.7 5.0 ± 1.7*
Results represent means ± SD of three replicates. Values in the same row bearing different superscript symbols are significantly
different (P\0.05); letters correspond to the comparison made in diet C group and numbers correspond to the comparison made in
diet D group. Totals include some minor components not shown
* Pairs of means corresponding to the C and D diet values at each spawning period that were significantly different (P\0.05)# Contains n-9 and n-7 isomers? Contains n-11 and n-9 isomersD 18:1n-9/n-3 HUFA. 0.0, values \ 0.05 mg g-1
944 Fish Physiol Biochem (2011) 37:935–949
123
composition of NL. Despite this, the n-3 HUFA
levels in the intestine PL of diet D fish diminished
significantly after 7 months of feeding with a HUFA-
deficient diet. Former studies have also reported that
a period of feeding a HUFA-deficient diet can
generate deficiency in the proportion of these fatty
acids in the polar lipids of intestine in species such as
rainbow trout (O. mykiss W.) (Di Costanzo et al.
1983), turbot (Scophthalmus maximus L.) (Bell et al.
1985), and gilthead seabream (Sparus aurata L.)
Fig. 3 Component plot
(a) and factor score plot
(b) of the PCA for the gills
fatty acid profile of neutral
lipids in fish at different
stages of the reproductive
cycle. Circles stand for
different clusters in the
factor score 2
Fish Physiol Biochem (2011) 37:935–949 945
123
(Fountoulaki et al. 2003). Also, it has been seen that
the enterocyte membranes are influenced by the
dietary lipid source (Olsen et al. 1999, 2000, 2003;
Cahu et al. 2000; Mourente et al. 2005; Almaida-
Pagan et al. 2007).
The gills from fish fed diet C, unlike the intestine,
did not experience significant changes in their neutral
and polar lipid content, nor in the fatty acid content
along the reproductive cycle. These findings show
tissue specificity in seasonal variations of certain
Fig. 4 Component plot
(a) and factor score plot
(b) of the PCA for the gills
fatty acid profile of polar
lipids in fish at different
stages of the reproductive
cycle. Circles stand for
different clusters in the
factor score 1
946 Fish Physiol Biochem (2011) 37:935–949
123
fatty acids. However, the diet lacking in HUFA was
reflected in the fatty acid composition of gills from
fish fed diet D after 7 months of feeding. At this time,
a decrease was observed in n-3 HUFA fatty acids that
affected the NL. The factor score plot showed two
major clusters corresponding to the diet D June group
and the other groups (November, March diet C and D,
and diet C June) which appeared as a homogeneous
group, evidence of robustness of the NL fatty acid
profile of this tissue along the reproductive cycle
when requirements are covered. Moreover, the n-3
HUFA content of gills PL in fish fed diet D did not
diminish along the cycle. The decrease in n-3 HUFA
in the NL compared with their conservation in PL,
when these fatty acids are absent from the diet,
appears to be a strategy to conserve these fatty acids
in the PL to maintain membrane structure and
function.
In fish, 20:4n-6 plays an important role despite
not presenting a high percentage, as it is the most
important precursor of eicosanoids in fish (Bell and
Sargent 2003; Evans et al. 2005). The present results
showed preferential conservation of this fatty acid in
both intestine and gills PL after 7 months of feeding
a diet lacking in HUFA. This retention may be
necessary to maintain eicosanoid synthesis in these
tissues, which guarantees the integrity and function-
ality of the branchial and intestinal epithelia.
Supplementation of 20:4n-6 in commercial gilthead
seabream broodstock diets is quite low despite the
fact that this species in the wild contains 10 times
the amount present in cultured seabream (Grigorakis
et al. 2002). Previous studies have suggested the use
of arachidonic-supplemented diets for several mar-
ine teleosts (Bell et al. 1996; Cejas et al. 2003,
2004; Rodrıguez et al. 2004; Perez et al. 2007;
Martın et al. 2009). The retention of this fatty acid
observed in the present study in both groups of fish
leads us to suggest a similar recommendation for
gilthead seabream males, particularly at the repro-
duction stage.
In summary, the results of the present study
showed changes in the fatty acid composition of
both intestine and gills of male gilthead seabream
broodstock fed either a control diet or an n-3 and
n-6 HUFA-deficient diet, these changes being more
accentuated in intestine than in gills. These tissue-
specific variations can be attributed not only to the
influence of diet fatty acid profile but also probably
to seasonal changes associated with reproduction.
Acknowledgments Dr. Antonio Lorenzo is member from the
Instituto de Tecnologıas Biomedicas (ITB) of La Laguna
University (Spain).
References
Alavi SMH, Psenicka M, Policar T, Rodina M, Hamackova J,
Kozak P, Linhart O (2009) Sperm quality in male Barbusbarbus L. fed different diets during the spawning season.
Fish Physiol Biochem 35(4):683–693
Almaida-Pagan PF, Hernandez MD, Garcıa Garcıa B, Madrid
JA, De Costa J, Mendiola P (2007) Effects of total
replacement of fish oil by vegetable oils on n-3 and n-6
polyunsaturated fatty acid desaturation and elongation in
sharpsnout seabream (Diplodus puntazzo) hepatocytes and
enterocytes. Aquaculture 272:589–598
Almansa E, Perez MJ, Cejas JR, Badıa P, Villamandos JE,
Lorenzo A (1999) Influence of broodstock gilthead sea-
bream (Sparus aurata L.) dietary fatty acids on egg
quality and egg fatty acid composition throughout the
spawning season. Aquaculture 170:323–336
Almansa E, Martın MV, Cejas JR, Badıa P, Jerez S, Lorenzo A
(2001) Lipid and fatty acid composition of female gilt-
head seabream during their reproductive cycle: effects of
a diet lacking n-3 HUFA. J Fish Biol 59:267–286
Asturiano JF, Sorbera LA, Carrillo M, Zanuy S, Ramos J,
Navarro JC, Bromage N (2001) Reproductive perfor-
mance in male European sea bass (Dicentrarchus labrax,
L.) fed two PUFA-enriched experimental diets: a com-
parison with males fed a wet diet. Aquaculture
194:173–190
Bell JG, Sargent JR (2003) Arachidonic acid in aquaculture
feeds: current status and future opportunities. Aquaculture
218:491–499
Bell MV, Henderson RJ, Sargent JR (1985) Changes in the
fatty acid composition of phospholipids from turbot
(Scophthalmus maximus) in relation to dietary polyun-
saturated fatty acid deficiencies. Comp Biochem Physiol
B 81(1):193–198
Bell JG, Farndale BM, Dick JR, Sargent JR (1996) Modifica-
tion of membrane fatty acid composition, eicosanoid
production, and phospholipase-A activity in Atlantic sal-
mon (Salmo salar) gill and kidney by dietary lipid. Lipids
31:1163–1171
Bobe J, Labbe C (2010) Egg and sperm quality in fish. Gen
Comp Endocrinol 165:535–548
Bromage NR, Mazorra C, Davie A, Alorend E, Bruce MP, Bell
JG, Porter M (2001) Optimising broodstock performance:
maturation, fecundity, and gamete quality. In: Hendry CI,
Van Stappen G, Wille M, Sorgeloos P (eds) Larvi 01-fish
and shellfish larviculture symposium european aquacul-
ture society, Special Publication, vol 30, Oostende, Bel-
gium, p 87
Fish Physiol Biochem (2011) 37:935–949 947
123
Bruce MP, Oyen F, Bell JG, Farndale BM, Asturiano JF,
Bromage NR, Carrillo M, Zanuy S, Ramos J (1999)
Development of broodstock diets for the European sea
bass (Dicentrarchus labrax) with special emphasis on the
importance of n-3 and n-6 HUFA to reproductive per-
formance. Aquaculture 177:85–98
Caballero MJ, Izquierdo MS, Kjorsvik E, Montero D, Socorro
J, Fernandez AJ, Rosenlund G (2003) Morphological
aspects of intestinal cells from gilthead seabream (Sparusaurata) fed diets containing different lipid sources.
Aquaculture 225:325–340
Cahu CL, Zambonino Infante JL, Corraze G, Coves D (2000)
Dietary lipid level affects fatty acid composition and
hydrolase activities of intestinal brush border membrane
in seabass. Fish Physiol Biochem 23:165–172
Cejas JR, Villamandos JE, Samper M (1992) Estudio sobre la
reproduccion de la dorada (Sparus aurata) en Canarias.
Influencia del peso/edad de los reproductores sobre la
calidad de puesta. Instituto Espanol de Oceanografıa. In-
formes Tecnicos N� 126
Cejas JR, Almansa E, Villamandos JE, Badıa P, Bolanos A,
Lorenzo A (2003) Lipid and fatty acid composition of
ovaries from wild fish and ovaries and eggs from captive
fish of white seabream (Diplodus sargus). Aquaculture
216:299–313
Cejas JR, Almansa E, Jerez S, Bolanos A, Samper M, Lorenzo
A (2004) Lipid and fatty acid composition of muscle and
liver from wild and captive mature female broodstocks of
white seabream, Diplodus sargus. Comp Biochem Physiol
B 138:91–102
Christie WW (1982) Lipids analysis. Pergamon Press, Oxford,
pp 17–23, 51–61
Di Costanzo G, Florentz A, Leray C, Nonnotte L (1983) Structural
and functional organization of the brush border membrane in
the rainbow trout intestine. Mol Physiol 4:111–123
Evans DH, Piermarini PM, Choe KP (2005) The multifunc-
tional fish gill: dominant site of gas exchange, osmoreg-
ulation, acid-base regulation, and excretion of nitrogenous
waste. Physiol Rev 85:97–177
Farkas T, Fodor E, Kitajka K, Halver JE (2001) Response of
fish membranes to environmental temperature. Aquac Res
32:645–655
Fernandez-Palacios H, Izquierdo MS, Robaina L, Valencia A,
Salhi M, Vergara J (1995) Effect of ny3 HUFA level in
broodstock diets on egg quality of gilthead seabream
(Sparus aurata L.). Aquaculture 132:325–337
Folch J, Lees N, Sloane-Stanley GH (1957) A simple method
for the isolation and purification of total lipids from ani-
mal tissues. J Biol Chem 226:497–509
Fountoulaki E, Alexis MN, Nengas I, Venou B (2003) Effects
of dietary arachidonic acid (20:4n–6), on growth, body
composition, and tissue fatty acid profile of gilthead sea-
bream fingerlings (Sparus aurata L.). Aquaculture
225:309–323
Grigorakis K, Alexis MA, Taylor KD, Hole M (2002) Com-
parison of wild and cultured gilthead seabream (Sparusaurata); composition, appearance and seasonal variations.
Int J Food Sc Tech 37:477–484
Harel M, Tandler A, Kissil GW (1994) The kinetics of nutrient
incorporation into body tissues of gilthead seabream
(Sparus aurata) females and the subsequent effects on
eggs composition and egg quality. Br J Nutr 72:45–48
Horwitz W (1980) Official method of analysis, 13th edn. Asso-
ciation of Official Analytical Chemists, Washington, DC
Huynh MD, Kitts DD, Hu C, Trites AW (2007) Comparison of
fatty acid profiles of spawning and non-spawning Pacific
herring, Clupea harengus pallasi. Comp Biochem Physiol
B 146:504–511
Jerez S, Rodrıguez C, Cejas JR, Bolanos A, Lorenzo A (2006)
Lipid dynamics and plasma level changes of 17b-estradiol
and testosterona during the spawing season of gilthead
seabream (Sparus aurata) females of different ages. Comp
Biochem Physiol B 143:180–189
Jobling M, Bendiksen EA (2003) Dietary lipids and tempera-
ture interact to influence tissue fatty acid compositions of
Atlantic salmon, Salmo salar L., parr. Aquac Res
34(15):1423–1441
Juaneda P, Rockelin G (1985) Rapid and convenient separation
of phospholipids in rat heart using silica cartridges. Lipids
20:40–41
Labbe C, Maisse G, Muller R, Zachowski A, Kaushik S, Loir
M (1995) Thermal acclimation and dietary lipids alter
composition, but not fluidity, of trout sperm plasma
membrane. Lipids 30(1):23–32
Martın MV, Rodrıguez C, Cejas JR, Perez MJ, Jerez S, Lore-
nzo A (2009) Body lipid and fatty acid composition in
male gilthead seabream broodstock at different stages of
the reproductive cycle: effects of a diet lacking n-3 and
n-6 HUFA. Aquac Nutr 15:60–72
Mazorra C, Bruce MP, Bell JG, Davie A, Alorend E, Jordan N,
Rees J, Papanikos N, Porter M, Bromage N (2003) Dietary
lipid enhancement of broodstock reproductive perfor-
mance and egg and larval quality in Atlantic halibut
(Hippoglossus hippoglossus). Aquaculture 227:21–33
Mercure F, Van der Kraak G (1995) Inhibition of gonadotro-
pin-stimulated ovarian steroid production by polyunsatu-
rated fatty acids in teleost fish. Lipids 30(6):547–554
Mourente G, Dick JR, Bell JG, Tocher DR (2005) Effect of
partial substitution of dietary fish oil by vegetable oils on
desaturation and b-oxidation of [1–14C] 18:3n–3 (LNA)
and [1–14C] 20:5n–3 (EPA) in hepatocytes and entero-
cytes of European seabass (Dicentrarchus labrax L.).
Aquaculture 248:173–186
Navarro I, Gutierrez J (1995) Fasting and starvation. In: Hochachka
PW, Mommsen TP (eds) Biochemistry and molecular biology
of fishes. Elsevier Science, Amsterdam, pp 393–434
Navas JM, Bruce M, Thrush M, Farndale BM, Bromage N,
Zanuy S, Carrillo M, Bell JG, Ramos J (1997) The impact
of seasonal alteration in the lipid composition of brood-
stock diets on egg quality in the European sea bass. J Fish
Biol 51(4):760–773
Olsen RE, Myklebust R, Kaino T, Ringo E (1999) Lipid
digestibility and ultrastructural changes in the enterocytes
of Arctic charr (Salvelinus alpinus L.) fed linseed oil and
soybean lecithin. Fish Physiol Biochem 21:35–44
Olsen RE, Myklebust R, Ringo E, Mayhew TM (2000) The
influences of dietary linseed oil and saturated fatty acids
on caecal enterocytes in Arctic charr (Salvelinus alpinusL.): a quantitative ultrastructural study. Fish Physiol
Biochem 22:207–216
948 Fish Physiol Biochem (2011) 37:935–949
123
Olsen RE, Dragnes BT, Myklebust R, Ringø E (2003) Effect of
soybean oil and soybean lecithin on intestinal lipid com-
position and lipid droplet accumulation of rainbow trout,
Oncorhynchus mykiss Walbaum. Fish Physiol Biochem
29:181–192
Perez MJ, Rodrıguez C, Cejas JR, Martın MV, Jerez S, Lore-
nzo A (2007) Lipid and fatty acid content in male and
female wild white seabream (Diplodus sargus) broodstock
at different stages of the reproductive cycle. Comp Bio-
chem Physiol B 146:187–196
Rodrıguez C, Cejas JR, Martın MV, Badıa P, Samper M,
Lorenzo A (1998) Influence of n-3 highly unsaturated
fatty acid deficiency on the lipid composition of brood-
stock gilthead seabream (Sparus aurata L.) and on egg
quality. Fish Physiol Biochem 18:177–187
Rodrıguez C, Acosta C, Badıa P, Cejas JR, Santamarıa FJ,
Lorenzo A (2004) Assessment of lipid and essential fatty
acids requirements of black seabream (Spondyliosomacantharus), by comparison of lipid composition in muscle
and liver of wild and captive adult fish. Comp Biochem
Physiol (B) 139:619–629
Ruyter B, Moya-Falcon C, Roselund G, Vegusdal A (2006) Fat
content and morphology of liver and intestine of Atlantic
salmon (Salmo salar): effects of temperature and dietary
soybean oil. Aquaculture 252:441–452
Sargent JR, Tocher DR, Bell JG (2002) The lipids. In: Halver
JE, Hardy RW (eds) Fish nutrition, 3rd edn. Academic
Press, New York, pp 181–257
Tocher DR (2010) Fatty acid requirements in ontogeny of
marine and freshwater fish. Aquac Res 41:717–732
Tocher DR, Fonseca-Madrigal J, Bell JG, Dick JR, Henderson
RJ, Sargent JR (2002) Effects of diets containing linseed
oil on fatty acid desaturation and oxidation in hepatocytes
and intestinal enterocytes in Atlantic salmon (Salmo sa-lar). Fish Physiol Biochem 26:157–170
Tocher DR, Fonseca-Madrigal J, Dick JR, Wing Keong NG,
Bell JG, Campbell PJ (2004) Effects of water temperature
and diets containing palm oil on fatty acid desaturation
and oxidation in hepatocytes and intestinal enterocytes of
rainbow trout (Oncorhynchus mykiss). Comp Biochem
Physiol B 137:49–63
Wade MG, Van Der Kraak G, Gerrits MF, Ballantyne JS
(1994) Release and steroidogenic actions of polyunsatu-
rated fatty acids in the goldfish testis. Biol Reprod
51:131–139
Zar JH (1984) Biostatistical analysis, 3rd edn. Prentice-Hall,
Upper Saddle, p 622
Fish Physiol Biochem (2011) 37:935–949 949
123
Copyright © 2022 FDOKUMEN