Effect of Dietary L-Threonine and Toxin Binder on ... - MDPI
23
Citation: Mesgar, A.; Aghdam Shahryar, H.; Bailey, C.A.; Ebrahimnezhad, Y.; Mohan, A. Effect of Dietary L-Threonine and Toxin Binder on Performance, Blood Parameters, and Immune Response of Broilers Exposed to Aflatoxin B 1 . Toxins 2022, 14, 192. https://doi.org/ 10.3390/toxins14030192 Received: 7 February 2022 Accepted: 1 March 2022 Published: 4 March 2022 Publisher’s Note: MDPI stays neutral with regard to jurisdictional claims in published maps and institutional affil- iations. Copyright: © 2022 by the authors. Licensee MDPI, Basel, Switzerland. This article is an open access article distributed under the terms and conditions of the Creative Commons Attribution (CC BY) license (https:// creativecommons.org/licenses/by/ 4.0/). toxins Article Effect of Dietary L-Threonine and Toxin Binder on Performance, Blood Parameters, and Immune Response of Broilers Exposed to Aflatoxin B 1 Aydin Mesgar 1 , Habib Aghdam Shahryar 1 , Christopher Anthony Bailey 2, *, Yahya Ebrahimnezhad 1 and Anand Mohan 3, * 1 Department of Animal Science, Shabestar Branch, Islamic Azad University, Shabestar 5381637181, Iran; [email protected] (A.M.); [email protected] (H.A.S.); [email protected] (Y.E.) 2 Department of Poultry Science, Texas A&M University, College Station, TX 77843, USA 3 Department of Food Science and Technology, University of Georgia, Athens, GA 30602, USA * Correspondence: [email protected] (C.A.B.); [email protected] (A.M.) Abstract: To evaluate the effect of L-Threonine (L-Thr) and Mycofix ® Plus (MP) on aflatoxicosis, an experiment with a 3-way ANOVA model was carried out with 8 replicates and 640 birds. Treatments included two levels of L-Thr (100% and 125% of the requirements, Cobb 500, Cobb-Vantress), Aflatoxin B 1 (AFB 1 ) (0, 500 ppb), and MP (0, 1 g/kg). As the main effects showed, AFB 1 decreased breast meat yield and carcass percentage (p < 0.001), serum urea, antibody titer against infectious bronchitis virus (IBV), and bone density (p < 0.05), while it increased the plasma concentrations of glucose and alkaline phosphatase (ALP) (p < 0.05). Mycofix Plus improved the grower feed intake (FI), tibia fresh weight, and body weight (BW) to bone weight (p < 0.05). L-Threonine increased the grower FI, breast meat yield, serum aspartate transaminase (AST), and glutathione peroxidase (GPX) (p < 0.05). There were positive interactions with breast meat yield, cholesterol, lactate dehydrogenase (LDH), and IBV titer. Of the treatments used, the combination of L-Thr and MP without AFB 1 improved breast meat and carcass percentage. L-Threonine and MP significantly improved IBV titer in birds challenged with AFB 1 (p < 0.001). In conclusion, L-Thr and MP were beneficial to improve immunity. Keywords: aflatoxin; threonine; toxin binder; Mycofix Plus; broiler; performance; immunity Key Contribution: Supplemental L-Thr or an increased L-Thr to Lysine (Lys) ratio improved breast meat yield. The harmful effects of low-level (industry-relevant) aflatoxicosis were minimal during 5 weeks; however, reduced breast meat yield and carcass percentage by AFB 1 are severe concerns, and further investigations are recommended. 1. Introduction Mycotoxins are secondary metabolites produced by fungi that grow in hot, humid climates and are detrimental to poultry health and performance [1]. Among mycotoxins, depending on the region, aflatoxins are the primary concern in the poultry feed industry, and aflatoxin B 1 (AFB 1 ) is the most dangerous and common toxin in foodstuffs among aflatoxin G 1 (AFG 1 ), aflatoxin B 2 (AFB 2 ), and aflatoxin G 2 (AFG 2 )[2]. Aflatoxins are mainly produced by Aspergillus flavus and Aspergillus parasiticus (A. parasiticus)[3], which commonly contaminate corn and other crops, from planting to harvesting and storage to processing [4]. It has been reported that aflatoxicosis negatively affected performance (40–1500 ppb) [3–7] and blood parameters (500 ppb) [3], disturbed the immunity (50–2000 ppb) [3,8–11], reduced the antioxidant capacity (100–2000 ppb) [9,12–17], increased the blood or tissue malondi- aldehyde (MDA) concentration (74–2000 ppb) [9,12,13,15–18], and damaged the intestinal morphology (100–2000 ppb) [12,19–23] and intestinal microbiota (40 ppb) [4,7] in broiler Toxins 2022, 14, 192. https://doi.org/10.3390/toxins14030192 https://www.mdpi.com/journal/toxins
-
Upload
khangminh22 -
Category
Documents
-
view
1 -
download
0
Transcript of Effect of Dietary L-Threonine and Toxin Binder on ... - MDPI

�����������������
Citation: Mesgar, A.; Aghdam
Shahryar, H.; Bailey, C.A.;
Ebrahimnezhad, Y.; Mohan, A. Effect
of Dietary L-Threonine and Toxin
Binder on Performance, Blood
Parameters, and Immune Response
of Broilers Exposed to Aflatoxin B1.
Toxins 2022, 14, 192. https://doi.org/
10.3390/toxins14030192
Received: 7 February 2022
Accepted: 1 March 2022
Published: 4 March 2022
Publisher’s Note: MDPI stays neutral
with regard to jurisdictional claims in
published maps and institutional affil-
iations.
Copyright: © 2022 by the authors.
Licensee MDPI, Basel, Switzerland.
This article is an open access article
distributed under the terms and
conditions of the Creative Commons
Attribution (CC BY) license (https://
creativecommons.org/licenses/by/
4.0/).
toxins
Article
Effect of Dietary L-Threonine and Toxin Binder on Performance,Blood Parameters, and Immune Response of Broilers Exposedto Aflatoxin B1
Aydin Mesgar 1 , Habib Aghdam Shahryar 1, Christopher Anthony Bailey 2,*, Yahya Ebrahimnezhad 1
and Anand Mohan 3,*
1 Department of Animal Science, Shabestar Branch, Islamic Azad University, Shabestar 5381637181, Iran;[email protected] (A.M.); [email protected] (H.A.S.); [email protected] (Y.E.)
2 Department of Poultry Science, Texas A&M University, College Station, TX 77843, USA3 Department of Food Science and Technology, University of Georgia, Athens, GA 30602, USA* Correspondence: [email protected] (C.A.B.); [email protected] (A.M.)
Abstract: To evaluate the effect of L-Threonine (L-Thr) and Mycofix® Plus (MP) on aflatoxicosis, anexperiment with a 3-way ANOVA model was carried out with 8 replicates and 640 birds. Treatmentsincluded two levels of L-Thr (100% and 125% of the requirements, Cobb 500, Cobb-Vantress), AflatoxinB1 (AFB1) (0, 500 ppb), and MP (0, 1 g/kg). As the main effects showed, AFB1 decreased breastmeat yield and carcass percentage (p < 0.001), serum urea, antibody titer against infectious bronchitisvirus (IBV), and bone density (p < 0.05), while it increased the plasma concentrations of glucose andalkaline phosphatase (ALP) (p < 0.05). Mycofix Plus improved the grower feed intake (FI), tibia freshweight, and body weight (BW) to bone weight (p < 0.05). L-Threonine increased the grower FI, breastmeat yield, serum aspartate transaminase (AST), and glutathione peroxidase (GPX) (p < 0.05). Therewere positive interactions with breast meat yield, cholesterol, lactate dehydrogenase (LDH), and IBVtiter. Of the treatments used, the combination of L-Thr and MP without AFB1 improved breast meatand carcass percentage. L-Threonine and MP significantly improved IBV titer in birds challengedwith AFB1 (p < 0.001). In conclusion, L-Thr and MP were beneficial to improve immunity.
Keywords: aflatoxin; threonine; toxin binder; Mycofix Plus; broiler; performance; immunity
Key Contribution: Supplemental L-Thr or an increased L-Thr to Lysine (Lys) ratio improved breastmeat yield. The harmful effects of low-level (industry-relevant) aflatoxicosis were minimal during5 weeks; however, reduced breast meat yield and carcass percentage by AFB1 are severe concerns,and further investigations are recommended.
1. Introduction
Mycotoxins are secondary metabolites produced by fungi that grow in hot, humidclimates and are detrimental to poultry health and performance [1]. Among mycotoxins,depending on the region, aflatoxins are the primary concern in the poultry feed industry,and aflatoxin B1 (AFB1) is the most dangerous and common toxin in foodstuffs amongaflatoxin G1 (AFG1), aflatoxin B2 (AFB2), and aflatoxin G2 (AFG2) [2]. Aflatoxins aremainly produced by Aspergillus flavus and Aspergillus parasiticus (A. parasiticus) [3], whichcommonly contaminate corn and other crops, from planting to harvesting and storage toprocessing [4].
It has been reported that aflatoxicosis negatively affected performance (40–1500 ppb) [3–7]and blood parameters (500 ppb) [3], disturbed the immunity (50–2000 ppb) [3,8–11], reducedthe antioxidant capacity (100–2000 ppb) [9,12–17], increased the blood or tissue malondi-aldehyde (MDA) concentration (74–2000 ppb) [9,12,13,15–18], and damaged the intestinalmorphology (100–2000 ppb) [12,19–23] and intestinal microbiota (40 ppb) [4,7] in broiler
Toxins 2022, 14, 192. https://doi.org/10.3390/toxins14030192 https://www.mdpi.com/journal/toxins

Toxins 2022, 14, 192 2 of 23
chickens. Moreover, previous studies represented an opposed relationship between bonemineralization and AFB1 (625–10,000 ppb) [24], or a negative correlation between thecalcification or utilization of cholecalciferol and AFB1 (500–20,000 ppb) [25]. However,these calcification studies are rare. Aflatoxin-contaminated feeds threaten poultry healthand performance and lead to economic losses by depressing meat production. Accordingto FDA, 2019 [26], the upper limit with respect to adult poultry is 100 ppb. However,different concentrations are expected depending on the temperature, relative humidity,and storage conditions. In the United States, any cereal grain (feedstuff) containing over1000 ppb must not be allowed to enter commerce (usually buried in the fields if discov-ered) where 500 ppb can be a practical testing concentration, as an occasional dose underinappropriate conditions.
The absorption rate of aflatoxins from the gastrointestinal tract is quick. Compared toother organs, the gastrointestinal tract is the first site to contact mycotoxins, which makes itmore vulnerable to AFB1 [27]. Aflatoxin B1 alters intestinal morphology [19,21,22], whichcan reduce the absorption of nutrients. According to some reports, aflatoxin reduced theabsorption of essential nutrients, and probably increased the amino acid requirements [28].As Grenier and Applegate reported in 2013 [28], aflatoxins are absorbed by passive trans-port, and the absorption rate is more than 80 percent, regardless of the species. Thegastrointestinal tract is the first line of contact with mycotoxins [27,28], and often at a higherconcentration than other tissues, due to the high protein turnover and activated cells of thegut epithelium. Mycotoxins can disturb nutrient absorption, barrier function, or facilitatethe persistence of intestinal pathogens and potentiate intestinal inflammation, and aflatoxinprobably increases the amino acid requirements and disturbs the utilization of essentialnutrients [28].
Agriopoulou et al. (2020) [29] noted numerous mycotoxin control strategies, includ-ing physical treatment (sorting, processing, storage, radiation, cold plasma, and toxinbinders), chemical control (bases such as ammonia and hydrated oxide, chitosan, andozone treatment), biological control (bacteria, yeast, food fermentation, and non-toxicstrains of fungi), enzymatic detoxification, and novel strategies (nanoparticles and plantextracts) as post-harvest controls. Several of these approaches to mitigating the adverseeffects of aflatoxicosis, such as additives containing adsorbents, probiotics, prebiotics, andphytogenics, are among the most practical, safe, and cost-effective methods. In this re-gard, there are three ways to manage mycotoxins, containing biological (probiotics andprebiotics), physical (adsorbents), or chemical (herbal essential oils) methods [3]. Themulti-component toxin binder (Toxin Binder + Toxin Deactivator) applied in this study(Mycofix Plus MP, Biomin GmbH, Herzogenburg, Austria) is a combination of mineraladsorbents, specific enzymes, biological components (biotransformation), plants, and algaeextracts (bio-protection). The high-quality bentonite (dioctahedral montmorillonite) inMP is a powerful binder with more than 90% binding affinity to aflatoxins, based on theEuropean Union Reference Laboratory method [30]. However, there are not enough reportsabout the efficacy of MP in broilers fed low levels (Industry-Relevant) of aflatoxins.
L-Threonine (L-Thr) is often the third limiting amino acid in corn–soybean meal-baseddiets, and plays a vital role in many areas, including gut health, morphology, and function,the optimal utilization of total sulfur amino acids and lysine (Lys), immunity, carcasstraits, the synthesis of structural proteins, antibody, uric acid, and pancreatic enzymes, themaintenance of intestinal barrier, and mucin synthesis [31]. The mucus layer protects theintestinal mucosa, which contains mucins, heavyweight glycoproteins that require L-Thrfor the synthesis. The supplementation of L-Thr above the National Research Council (NRC,1994) [32] requirements has been reported to be helpful for the gut health and immunityof broilers [31], and the best results on antioxidant function and gut morphology wereobserved at 125% of NRC, 1994 [32] recommendations [33].
The inclusion of excess L-Thr above NRC, 1994 [32] requirements has been repeatedlyworked on, while new researches on the last commercial requirements are still neededunder stress, or in abnormal conditions or diseases.
Toxins 2022, 14, 192 3 of 23
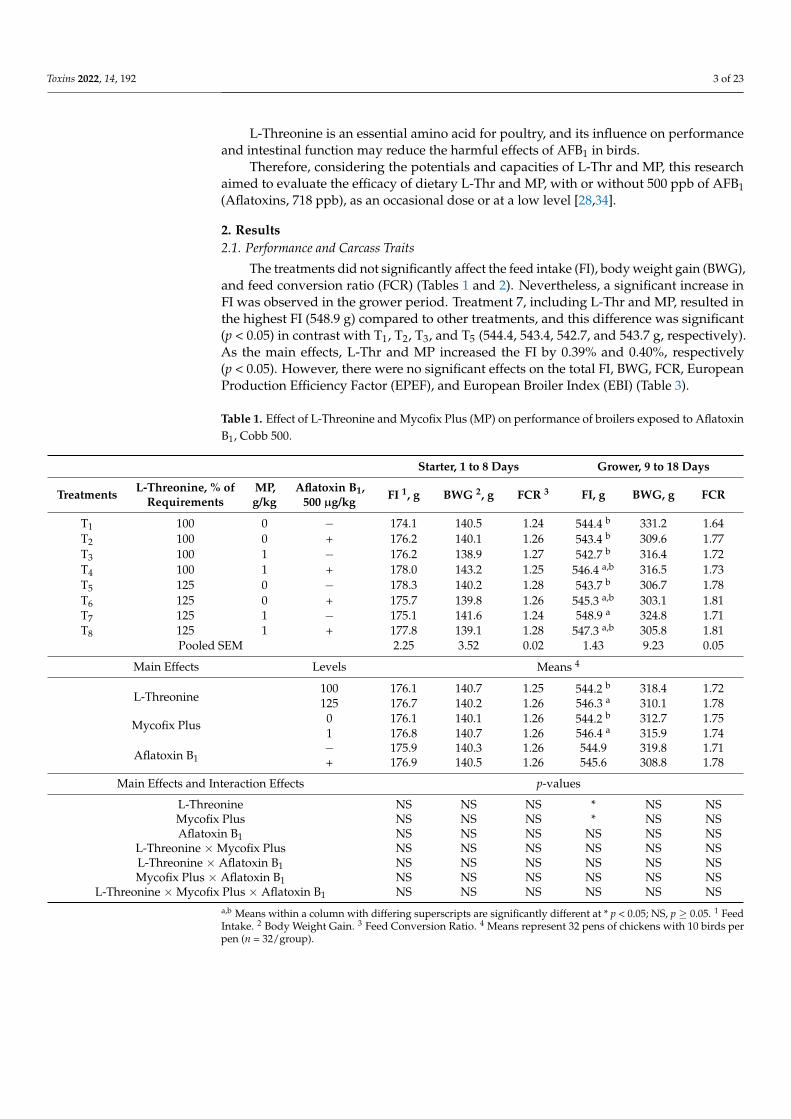
L-Threonine is an essential amino acid for poultry, and its influence on performanceand intestinal function may reduce the harmful effects of AFB1 in birds.
Therefore, considering the potentials and capacities of L-Thr and MP, this researchaimed to evaluate the efficacy of dietary L-Thr and MP, with or without 500 ppb of AFB1(Aflatoxins, 718 ppb), as an occasional dose or at a low level [28,34].
2. Results2.1. Performance and Carcass Traits
The treatments did not significantly affect the feed intake (FI), body weight gain (BWG),and feed conversion ratio (FCR) (Tables 1 and 2). Nevertheless, a significant increase inFI was observed in the grower period. Treatment 7, including L-Thr and MP, resulted inthe highest FI (548.9 g) compared to other treatments, and this difference was significant(p < 0.05) in contrast with T1, T2, T3, and T5 (544.4, 543.4, 542.7, and 543.7 g, respectively).As the main effects, L-Thr and MP increased the FI by 0.39% and 0.40%, respectively(p < 0.05). However, there were no significant effects on the total FI, BWG, FCR, EuropeanProduction Efficiency Factor (EPEF), and European Broiler Index (EBI) (Table 3).
Table 1. Effect of L-Threonine and Mycofix Plus (MP) on performance of broilers exposed to AflatoxinB1, Cobb 500.
Starter, 1 to 8 Days Grower, 9 to 18 Days
Treatments L-Threonine, % ofRequirements
MP,g/kg
Aflatoxin B1,500 µg/kg FI 1, g BWG 2, g FCR 3 FI, g BWG, g FCR
T1 100 0 − 174.1 140.5 1.24 544.4 b 331.2 1.64T2 100 0 + 176.2 140.1 1.26 543.4 b 309.6 1.77T3 100 1 − 176.2 138.9 1.27 542.7 b 316.4 1.72T4 100 1 + 178.0 143.2 1.25 546.4 a,b 316.5 1.73T5 125 0 − 178.3 140.2 1.28 543.7 b 306.7 1.78T6 125 0 + 175.7 139.8 1.26 545.3 a,b 303.1 1.81T7 125 1 − 175.1 141.6 1.24 548.9 a 324.8 1.71T8 125 1 + 177.8 139.1 1.28 547.3 a,b 305.8 1.81
Pooled SEM 2.25 3.52 0.02 1.43 9.23 0.05
Main Effects Levels Means 4
L-Threonine100 176.1 140.7 1.25 544.2 b 318.4 1.72125 176.7 140.2 1.26 546.3 a 310.1 1.78
Mycofix Plus 0 176.1 140.1 1.26 544.2 b 312.7 1.751 176.8 140.7 1.26 546.4 a 315.9 1.74
Aflatoxin B1− 175.9 140.3 1.26 544.9 319.8 1.71+ 176.9 140.5 1.26 545.6 308.8 1.78
Main Effects and Interaction Effects p-values
L-Threonine NS NS NS * NS NSMycofix Plus NS NS NS * NS NSAflatoxin B1 NS NS NS NS NS NS
L-Threonine × Mycofix Plus NS NS NS NS NS NSL-Threonine × Aflatoxin B1 NS NS NS NS NS NSMycofix Plus × Aflatoxin B1 NS NS NS NS NS NS
L-Threonine × Mycofix Plus × Aflatoxin B1 NS NS NS NS NS NSa,b Means within a column with differing superscripts are significantly different at * p < 0.05; NS, p ≥ 0.05. 1 FeedIntake. 2 Body Weight Gain. 3 Feed Conversion Ratio. 4 Means represent 32 pens of chickens with 10 birds perpen (n = 32/group).

Toxins 2022, 14, 192 4 of 23
Table 2. Effect of L-Threonine and Mycofix Plus (MP) on performance of broilers exposed to AflatoxinB1, Cobb 500.
Finisher 1, 19 to 28 Days Finisher 2, 29 to 35 Days
Treatmenst L-Threonine, % ofRequirements
MP,g/kg
Aflatoxin B1,500 µg/kg FI 1, g BWG 2, g FCR 3 FI, g BWG, g FCR
T1 100 0 − 1055.7 656.7 1.61 951.1 499.1 1.92T2 100 0 + 1054.9 659.4 1.60 962.3 500.0 1.94T3 100 1 − 1060.9 667.6 1.59 951.8 468.5 2.05T4 100 1 + 1011.4 653.3 1.56 946.2 498.6 1.91T5 125 0 − 1072.6 689.2 1.56 943.9 517.8 1.85T6 125 0 + 1072.9 684.4 1.57 944.9 488.6 1.95T7 125 1 − 1067.6 661.4 1.61 953.0 512.5 1.87T8 125 1 + 1066.5 663.4 1.61 955.9 521.9 1.84
Pooled SEM 20.24 13.60 0.03 12.43 17.45 0.06
Main Effects Levels Means 4
L-Threonine 100 1045.7 659.2 1.59 952.8 491.5 1.95125 1069.9 674.6 1.59 949.4 510.2 1.88
Mycofix Plus 0 1064.0 672.4 1.58 950.5 501.4 1.911 1051.6 661.4 1.59 951.7 500.4 1.92
Aflatoxin B1− 1064.2 668.7 1.59 949.9 499.5 1.92+ 1051.4 665.1 1.58 952.3 502.3 1.91
Main Effects and Interaction Effects p-values
L-Threonine NS NS NS NS NS NSMycofix Plus NS NS NS NS NS NSAflatoxin B1 NS NS NS NS NS NS
L-Threonine × Mycofix Plus NS NS NS NS NS NSL-Threonine × Aflatoxin B1 NS NS NS NS NS NSMycofix Plus × Aflatoxin B1 NS NS NS NS NS NS
L-Threonine × Mycofix Plus × Aflatoxin B1 NS NS NS NS NS NS1 Feed Intake. 2 Body Weight Gain. 3 Feed Conversion Ratio. 4 Means represent 32 pens of chickens with 10 birdsper pen. (n = 32/group). NS, p ≥ 0.05.
Table 3. Effect of L-Threonine and Mycofix Plus (MP) on performance of broilers exposed to AflatoxinB1, Cobb 500.
Total, 1 to 35 Days
Treatments L-Threonine, % ofRequirements MP, g/kg Aflatoxin B1,
500 µg/kg FI 1, g BWG 2, g FCR 3 EPEF 4 EBI 5
T1 100 0 − 2725.2 1627.4 1.68 269.2 261.5T2 100 0 + 2736.7 1609.1 1.71 265.5 257.9T3 100 1 − 2731.6 1591.4 1.72 264.2 256.4T4 100 1 + 2682.0 1611.6 1.67 278.7 270.7T5 125 0 − 2738.5 1653.9 1.66 277.1 269.3T6 125 0 + 2738.8 1615.9 1.70 264.5 257.0T7 125 1 − 2744.6 1640.3 1.68 274.5 266.7T8 125 1 + 2747.5 1630.2 1.69 269.6 261.8
Pooled SEM 25.87 31.16 0.03 14.29 13.98
Main Effects Levels Means 6
L-Threonine 100 2718.9 1609.9 1.69 269.4 261.6125 2742.3 1635.1 1.68 271.4 263.7
Mycofix Plus 0 2734.8 1626.6 1.68 269.1 261.41 2726.4 1618.4 1.69 271.7 263.9
Aflatoxin B1− 2735.0 1628.3 1.68 271.2 263.5+ 2726.2 1616.7 1.69 269.6 261.8
Main Effects and Interaction Effects p-values
L-Threonine NS NS NS NS NSMycofix Plus NS NS NS NS NSAflatoxin B1 NS NS NS NS NS
L-Threonine × Mycofix Plus NS NS NS NS NSL-Threonine × Aflatoxin B1 NS NS NS NS NSMycofix Plus × Aflatoxin B1 NS NS NS NS NS
L-Threonine × Mycofix Plus × Aflatoxin B1 NS NS NS NS NS1 Feed Intake. 2 Body Weight Gain. 3 Feed Conversion Ratio. 4 European Production Efficiency Factor. 5 EuropeanBroiler Index. 6 Means represent 32 pens of chickens with 10 birds per pen (n = 32/group). NS, p ≥ 0.05.

Toxins 2022, 14, 192 5 of 23
As noted in Table 4, T7 resulted in the highest percentage of breast meat (23.32)compared to other treatments, except control (22.75) (p < 0.01). The breast meat yield wassignificantly decreased by T2, T3, T4, and T8 compared to control (p < 0.01). As the maineffect, AFB1 decreased the relative weight of breast meat by 1.53%, significantly (p < 0.001).L-Threonine increased breast meat yield by 0.9% (p < 0.05). The 2-way interaction effectbetween L-Thr and MP was positive and increased breast meat yield, in contrast withMP alone (p < 0.05) (data table is contained within the supplementary material; Table S1).The carcass percentage was significantly decreased by T2, T3, T4, T6, and T8 compared tocontrol (p < 0.01). The best carcass yield was observed in T7 (62.38%), significantly higherthan other treatments, except for the control. (61.61%) (p < 0.01). As the main effect, AFB1decreased the carcass yield from 60.68% to 58.74% by 1.94% (p < 0.001). The other variables,such as wings, back, neck, and thigh (WBNT), drumsticks, liver, spleen, kidneys, bursa ofFabricius, pancreas, heart, gizzard, and abdominal fat, were not significantly affected bythe treatments in this study (Tables 4 and 5). However, AFB1 numerically decreased therelative weight of the drumsticks by 0.49% (p = 0.06).
Table 4. Effect of L-Threonine and Mycofix Plus (MP) on carcass traits of broilers exposed to AflatoxinB1 at day 35, Cobb 500.
Breast Drumsticks WBNT 1 Carcass Liver Spleen
Treatmenst L-Threonine, % ofRequirements
MP,g/kg
Aflatoxin B1,500 µg/kg Relative Weights, % of Live Body Weight
T1 100 0 − 22.75 a,b 20.34 18.53 61.61 a,b 2.68 0.09T2 100 0 + 19.89 c 19.88 18.79 58.55 c 2.77 0.10T3 100 1 − 20.39 c 19.99 18.68 59.06 c 2.89 0.10T4 100 1 + 19.73 c 19.97 19.27 58.97 c 2.67 0.11T5 125 0 − 21.14 b,c 19.94 18.60 59.68 b,c 2.62 0.09T6 125 0 + 21.42 b,c 19.29 18.41 59.12 c 2.62 0.09T7 125 1 − 23.32 a 20.13 18.94 62.38 a 2.53 0.11T8 125 1 + 20.45 c 19.28 18.57 58.30 c 2.71 0.09
Pooled SEM 0.60 0.37 0.34 0.76 0.16 0.01
Main Effects Levels Means 2
L-Threonine100 20.69 b 20.04 18.82 59.55 2.75 0.10125 21.59 a 19.66 18.63 59.87 2.62 0.09
Mycofix Plus 0 21.30 19.86 18.58 59.74 2.67 0.091 20.98 19.84 18.86 59.68 2.70 0.10
Aflatoxin B1− 21.90 a 20.10 18.68 60.68 a 2.68 0.10+ 20.37 b 19.61 18.76 58.74 b 2.69 0.10
Main Effects and Interaction Effects p-values
L-Threonine * NS NS NS NS NSMycofix Plus NS NS NS NS NS NSAflatoxin B1 *** NS NS *** NS NS
L-Threonine × Mycofix Plus * NS NS NS NS NSL-Threonine × Aflatoxin B1 NS NS NS NS NS NSMycofix Plus × Aflatoxin B1 NS NS NS NS NS NS
L-Threonine × Mycofix Plus × Aflatoxin B1 ** NS NS ** NS NSa–c Means within a column with differing superscripts are significantly different at * p < 0.05; ** p < 0.01;*** p < 0.001. NS, p ≥ 0.05. 1 Wings, Back, Neck, Thigh. 2 Means represent 32 pens of chickens with 10 birds perpen (n = 32/group).

Toxins 2022, 14, 192 6 of 23
Table 5. Effect of L-Threonine and Mycofix Plus (MP) on carcass traits of broilers exposed to AflatoxinB1 at day 35, Cobb 500.
Kidneys Bursa ofFabricius Pancreas Heart Gizzard Abdominal Fat
Treatmenst L-Threonine, % ofRequirements
MP,g/kg
Aflatoxin B1,500 µg/kg Relative Weights, % of Live Body Weight
T1 100 0 − 0.44 0.15 0.24 0.55 1.74 1.37T2 100 0 + 0.44 0.16 0.24 0.54 1.89 2.12T3 100 1 − 0.50 0.16 0.25 0.60 1.78 2.01T4 100 1 + 0.50 0.14 0.27 0.61 1.96 2.12T5 125 0 − 0.53 0.15 0.25 0.57 1.73 1.93T6 125 0 + 0.46 0.15 0.25 0.58 1.70 1.71T7 125 1 − 0.51 0.19 0.26 0.59 1.83 1.79T8 125 1 + 0.41 0.16 0.27 0.59 1.79 1.64
Pooled SEM 0.04 0.02 0.01 0.03 0.08 0.25
Main Effects Levels Means 1
L-Threonine100 0.47 0.15 0.25 0.57 1.84 1.90125 0.48 0.16 0.26 0.58 1.76 1.77
Mycofix Plus 0 0.47 0.15 0.24 0.56 1.76 1.781 0.48 0.16 0.26 0.60 1.84 1.89
Aflatoxin B1− 0.49 0.16 0.25 0.58 1.77 1.77+ 0.45 0.15 0.26 0.58 1.83 1.90
Main Effects and Interaction Effects p-values
L-Threonine NS NS NS NS NS NSMycofix Plus NS NS NS NS NS NSAflatoxin B1 NS NS NS NS NS NS
L-Threonine × Mycofix Plus NS NS NS NS NS NSL-Threonine × Aflatoxin B1 NS NS NS NS NS NSMycofix Plus × Aflatoxin B1 NS NS NS NS NS NS
L-Threonine × Mycofix Plus × Aflatoxin B1 NS NS NS NS NS NS
1 Means represent 32 pens of chickens with 10 birds per pen (n = 32/group). NS, p ≥ 0.05.
2.2. Blood Biochemical Parameters and Serum Enzymatic Activity
The concentration of glucose, cholesterol, triglycerides, high-density lipoprotein(HDL), low-density lipoprotein (LDL), very low-density lipoprotein (VLDL), uric acid,urea, total protein, albumin, and globulin are presented in Tables 6 and 7. As the maineffect, AFB1 increased the serum glucose level by 9.11% (p < 0.05). A 2-way interactionbetween MP and AFB1 on cholesterol resulted in a higher concentration compared to AFB1alone (p < 0.05) (data table is contained within the supplementary material; Table S2). AflatoxinB1 decreased HDL concentration compared to the control in a 2-way interaction between MPand AFB1 (p < 0.05) (data table is contained within the Supplementary Material; Table S2).
Table 6. Effect of L-Threonine and Mycofix Plus (MP) on blood biochemical parameters of broilersexposed to Aflatoxin B1 at day 35, Cobb 500.
Glucose Cholesterol Triglycerides HDL 1 LDL 2 VLDL 3
Treatmenst L-Threonine, %of Requirements
MP,g/kg
Aflatoxin B1,500 µg/kg mg/dL mg/dL mg/dL mg/dL mg/dL mg/dL
T1 100 0 − 208.38 130.21 96.38 83.50 27.44 19.28T2 100 0 + 247.88 117.05 96.85 76.38 21.31 19.37T3 100 1 − 218.50 123.20 94.81 76.75 27.49 18.96T4 100 1 + 226.38 134.35 87.24 76.63 40.28 17.45T5 125 0 − 224.63 133.60 91.04 77.13 38.27 18.21T6 125 0 + 234.38 128.79 111.83 72.25 34.17 22.37T7 125 1 − 204.50 126.43 99.38 77.25 29.30 19.88T8 125 1 + 225.38 132.24 106.16 81.13 29.88 21.23
Pooled SEM 12.22 4.77 10.49 2.67 4.86 2.10

Toxins 2022, 14, 192 7 of 23
Table 6. Cont.
Glucose Cholesterol Triglycerides HDL 1 LDL 2 VLDL 3
Treatmenst L-Threonine, %of Requirements
MP,g/kg
Aflatoxin B1,500 µg/kg mg/dL mg/dL mg/dL mg/dL mg/dL mg/dL
Main Effects Levels Means 4
L-Threonine100 225.28 126.20 93.82 78.31 29.13 18.76125 222.22 130.26 102.10 76.94 32.91 20.42
Mycofix Plus 0 228.81 127.41 99.02 77.31 30.30 19.801 218.69 129.05 96.90 77.94 31.74 19.38
Aflatoxin B1− 214.00 b 128.36 95.40 78.66 30.62 19.08+ 233.50 a 128.11 100.52 76.59 31.41 20.10
Main Effects and Interaction Effects p-values
L-Threonine NS NS NS NS NS NSMycofix Plus NS NS NS NS NS NSAflatoxin B1 * NS NS NS NS NS
L-Threonine × Mycofix Plus NS NS NS NS * NSL-Threonine × Aflatoxin B1 NS NS NS NS NS NSMycofix Plus × Aflatoxin B1 NS * NS * NS NS
L-Threonine × Mycofix Plus × Aflatoxin B1 NS NS NS NS NS NS
a,b Means within a column with differing superscripts are significantly different at * p < 0.05. NS, p ≥ 0.05.1 High-Density Lipoprotein. 2 Low-Density Lipoprotein. 3 Very Low-Density Lipoprotein. 4 Means represent32 pens of chickens with 10 birds per pen. (n = 32/group).
Table 7. Effect of L-Threonine and Mycofix Plus (MP) on blood biochemical parameters of broilersexposed to Aflatoxin B1 at day 35, Cobb 500.
Uric Acid Urea Total Protein Albumin Globulin A/G 1
Treatmenst L-Threonine, %of Requirements
MP,g/kg
Aflatoxin B1,500 µg/kg mg/dl mg/dL g/dL g/dL g/dL
T1 100 0 − 3.53 2.69 3.97 1.26 2.72 0.47T2 100 0 + 4.46 1.54 3.85 1.16 2.69 0.43T3 100 1 − 4.30 2.41 4.17 1.18 2.99 0.41T4 100 1 + 3.43 2.20 3.50 1.06 2.44 0.44T5 125 0 − 4.29 1.96 4.10 1.31 2.79 0.47T6 125 0 + 3.85 1.93 3.82 1.12 2.70 0.43T7 125 1 − 4.50 2.39 3.77 1.17 2.61 0.45T8 125 1 + 4.05 1.72 4.03 1.30 2.73 0.49
Pooled SEM 0.33 0.32 0.21 0.07 0.17 0.03
Main Effects Levels Means 2
L-Threonine100 3.93 2.21 3.87 1.16 2.71 0.44125 4.17 2.00 3.93 1.22 2.71 0.46
Mycofix Plus 0 4.03 2.03 3.93 1.21 2.72 0.451 4.07 2.18 3.87 1.18 2.69 0.44
Aflatoxin B1− 4.15 2.36 a 4.00 1.23 2.78 0.45+ 3.94 1.85 b 3.80 1.16 2.64 0.45
Main Effects and Interaction Effects p-values
L-Threonine NS NS NS NS NS NSMycofix Plus NS NS NS NS NS NSAflatoxin B1 NS * NS NS NS NS
L-Threonine × Mycofix Plus NS NS NS NS NS NSL-Threonine × Aflatoxin B1 NS NS NS NS NS NSMycofix Plus × Aflatoxin B1 NS NS NS NS NS NS
L-Threonine × Mycofix Plus × Aflatoxin B1 NS NS NS NS NS NS
a,b Means within a column with differing superscripts are significantly different at * p < 0.05. NS, p ≥ 0.05.1 Albumin to Globulin. 2 Means represent 32 pens of chickens with 10 birds per pen (n = 32/group).
As a 2-way interaction between L-Thr and MP, the supplementation of L-Thr resultedin a higher LDL in contrast with the control (p < 0.05) (data table is contained withinthe Supplementary Material; Table S1). As the main effect, AFB1 decreased the serumconcentration of urea by 21.61% (p < 0.05).

Toxins 2022, 14, 192 8 of 23
The levels of aspartate transaminase (AST) and alkaline phosphatase (ALP) weresignificantly increased by L-Thr and AFB1 (10.21% and 5.92%), respectively (p < 0.05)(Table 8). Aflatoxin B1 increased the concentration of alanine aminotransferase (ALT) in a2-way interaction with MP compared to the control (p < 0.05) (data table is contained withinthe supplementary material; Table S2). The 2-way interaction between MP and AFB1 onlactate dehydrogenase (LDH) was significant (p < 0.05), and MP decreased the concentrationof LDH (data table is contained within the Supplementary Material; Table S2).
Table 8. Effect of L-Threonine and Mycofix Plus (MP) on serum enzymatic activity of broilers exposedto Aflatoxin B1 at day 35, Cobb 500.
AST 1 ALT 2 ALP 3 LDH 4
Treatments L-Threonine, % ofRequirements MP, g/kg Aflatoxin B1,
500 µg/kg u/L u/L u/L u/L
T1 100 0 − 192.50 4.04 1789.00 910.75T2 100 0 + 180.00 5.60 2047.50 1017.75T3 100 1 − 158.50 4.39 1923.50 990.00T4 100 1 + 176.75 4.10 2015.50 672.75T5 125 0 − 192.88 3.73 1961.25 711.25T6 125 0 + 191.38 5.01 1917.25 1132.00T7 125 1 − 188.38 5.31 1987.75 883.38T8 125 1 + 207.38 4.16 2135.00 848.00
Pooled SEM 12.45 0.65 71.03 134.78
Main Effects Levels Means 5
L-Threonine100 176.94 b 4.53 1943.88 897.81125 195.00 a 4.55 2000.31 893.66
Mycofix Plus 0 189.19 4.59 1928.75 942.941 182.75 4.49 2015.44 848.53
Aflatoxin B1− 183.06 4.37 1915.38 b 873.84+ 188.88 4.72 2028.81 a 917.63
Main Effects and Interaction Effects p-values
L-Threonine * NS NS NSMycofix Plus NS NS NS NSAflatoxin B1 NS NS * NS
L-Threonine × Mycofix Plus NS NS NS NSL-Threonine × Aflatoxin B1 NS NS NS NSMycofix Plus × Aflatoxin B1 NS * NS *
L-Threonine × Mycofix Plus × Aflatoxin B1 NS NS NS NSa,b Means within a column with differing superscripts are significantly different at * p < 0.05. NS, p ≥ 0.05.1 Aspartate transaminase. 2 Alanine aminotransferase. 3 Alkaline phosphatase. 4 Lactate dehydrogenase. 5 Meansrepresent 32 pens of chickens with 10 birds per pen (n = 32/group).
2.3. Stress Status, Antibody Titer and Antioxidant Capacity
All of the related variables are presented in Tables 9 and 10. The treatments did notsignificantly affect the Heterophil (H), Lymphocyte (L), and H to L ratio. However, thelowest and highest percentages of H (32.08) and L (67.92) were observed in control, MP,and L-Thr plus MP treatments; also, the best ratio of H to L (0.47) was observed in thecontrol group and birds fed supplemental MP alone.

Toxins 2022, 14, 192 9 of 23
Table 9. Effect of L-Threonine and Mycofix Plus (MP) on stress status and serum anti-body titer 1 ofbroilers exposed to Aflatoxin B1, Cobb 500.
Heterophil Lymphocyte H:L 2 IBV 3 IBDV 4
Treatmenst L-Threonine, % ofRequirements MP, g/kg Aflatoxin B1,
500 µg/kg % % log10 log10
T1 100 0 − 32.08 67.92 0.47 3.833 a 3.675T2 100 0 + 34.79 65.21 0.54 3.824 b,c 3.723T3 100 1 − 32.08 67.92 0.47 3.826 a,b 3.737T4 100 1 + 32.50 67.50 0.48 3.821 b,c 3.667T5 125 0 − 32.29 67.71 0.48 3.828 a,b 3.669T6 125 0 + 32.50 67.50 0.48 3.818 c 3.639T7 125 1 − 32.08 67.92 0.48 3.826 a,b 3.657T8 125 1 + 35.21 64.79 0.55 3.833 a 3.675
Pooled SEM 1.30 1.30 0.03 0.003 0.06
Main Effects Levels Means 5
L-Threonine 100 32.86 67.14 0.49 3.826 3.701125 33.02 66.98 0.50 3.826 3.660
Mycofix Plus 0 32.92 67.08 0.49 3.826 3.6761 32.97 67.03 0.50 3.827 3.684
Aflatoxin B1− 32.14 67.86 0.48 3.828 a 3.685+ 33.75 66.25 0.51 3.824 b 3.676
Main Effects and Interaction Effects p-values
L-Threonine NS NS NS NS NSMycofix Plus NS NS NS NS NSAflatoxin B1 NS NS NS * NS
L-Threonine × Mycofix Plus NS NS NS ** NSL-Threonine × Aflatoxin B1 NS NS NS NS NSMycofix Plus × Aflatoxin B1 NS NS NS ** NS
L-Threonine × Mycofix Plus × Aflatoxin B1 NS NS NS NS NS
a,b Means within a column with differing superscripts are significantly different at * p < 0.05; ** p < 0.01. NS,p ≥ 0.05. 1 Blood samples for measuring IBDV titers were collected at day 30. 2 Heterophil to Lymphocyte.3 Infectious Bronchitis Virus. 4 Infectious Bursal Disease Virus. 5 Means represent 32 pens of chickens with 10 birdsper pen (n = 32/group).
Table 10. Effect of L-Threonine and Mycofix Plus (MP) on serum antioxidant capacity of broilersexposed to Aflatoxin B1, Cobb 500.
SOD 1 GPX 2 CAT 3
Treatments L-Threonine, % ofRequirements
MP,g/kg
Aflatoxin B1,500 µg/kg u/mL u/mL u/mL
T1 100 0 − 14.89 564.29 7.91T2 100 0 + 14.37 518.98 6.01T3 100 1 − 13.16 648.57 5.68T4 100 1 + 14.23 651.32 6.87T5 125 0 − 16.05 649.48 6.21T6 125 0 + 13.71 686.27 5.62T7 125 1 − 15.37 735.98 7.80T8 125 1 + 14.43 728.32 7.44
Pooled SEM 1.25 69.28 1.37
Main Effects Levels Means 4
L-Threonine 100 14.16 595.79 b 6.62125 14.89 700.01 a 6.77
Mycofix Plus 0 14.75 604.75 6.441 14.30 691.05 6.95
Aflatoxin B1+ 14.87 649.58 6.90− 14.18 646.22 6.48
Main Effects and Interaction Effects p-values
L-Threonine NS * NSMycofix Plus NS NS NSAflatoxin B1 NS NS NS
L-Threonine × Mycofix Plus NS NS NSL-Threonine × Aflatoxin B1 NS NS NSMycofix Plus × Aflatoxin B1 NS NS NS
L-Threonine × Mycofix Plus × Aflatoxin B1 NS NS NSa,b Means within a column with differing superscripts are significantly different at * p < 0.05. NS, p ≥ 0.05.1 Superoxide dismutase. 2 Glutathione peroxidase. 3 Catalase. 4 Means represent 32 pens of chickens with 10 birdsper pen (n = 32/group).

Toxins 2022, 14, 192 10 of 23
As the main effect, AFB1 decreased the antibody titer against infectious bronchitisvirus (IBV) almost by 0.1% (p < 0.05). The IBV titer was significantly lower in treatmentscontaining AFB1 compared to control. The best concentration of IBV titer among thetreatments was observed in T8 and the control. Antibody titer against IBV was significantlyhigher in T8 (3.833) compared to T2 (3.824), T4 (3.821), and T6 (3.818), showing the positiveinteraction between L-Thr and MP. The interaction effect of L-Thr and MP was significant(p < 0.01) and showed an improved titer against IBV via the supplementation of MP (datatable is contained within the Supplementary Material; Table S3).
In addition, similar results were obtained for the interaction effect between MP andAFB1 (p < 0.01) when MP increased the antibody titer against IBV compared to the AFB1group (data table is contained within the Supplementary Material; Table S4). The indepen-dent variables did not affect the infectious bursal disease virus (IBDV) titers significantly.
The serum concentration of glutathione peroxidase (GPX) significantly increased by17.49% via the inclusion of L-Thr (p < 0.05). The highest and the lowest GPX concentrationswere observed in T7 (L-Thr + MP) and T2 (AFB1), respectively. The serum concentrationsof superoxide dismutase (SOD) and catalase (CAT) were not significantly affected by thetreatments (Table 10).
2.4. Meat Quality and Tibia Characteristics
The meat quality variables such as pH, water holding capacity (WHC), cook loss, andMDA were not affected (data table is contained within the Supplementary Material; TableS5). As the main effect, MP increased tibia fresh weight by 0.03% (p < 0.05) and significantlyimproved body weight (BW) to bone weight by 4.51% (p < 0.05) (Table 11). There were nomore significant effects on the other variables, except for bone density. As the main effect,AFB1 significantly decreased bone density by 3.33% (p < 0.05) (Table 12).
Table 11. Effect of L-Threonine and Mycofix Plus (MP) on tibia characteristics of broilers exposed toAflatoxin B1 at day 35, Cobb 500.
Fresh Weight 1 Fat Free Dry Weight 1 Ash 2 BW 3: Bone Weight
Treatments L-Threonine, %of Requiremens MP, g/kg Aflatoxin B1,
500 µg/kg % % %
T1 100 0 − 0.49 0.20 51.72 205.99T2 100 0 + 0.48 0.20 50.33 210.02T3 100 1 − 0.53 0.21 50.18 189.64T4 100 1 + 0.52 0.21 51.20 191.84T5 125 0 − 0.48 0.19 50.07 208.17T6 125 0 + 0.52 0.21 50.36 194.95T7 125 1 − 0.50 0.21 51.87 202.71T8 125 1 + 0.51 0.20 49.62 197.96
Pooled SEM 0.02 0.01 0.57 6.42
Main Effects Levels Means 4
L-Threonine 100 0.51 0.20 50.86 199.37125 0.50 0.20 50.48 200.95
Mycofix Plus 0 0.49 b 0.20 50.62 204.78 a
1 0.52 a 0.20 50.72 195.54 b
Aflatoxin B1− 0.50 0.20 50.96 201.63+ 0.51 0.20 50.38 198.69
Main Effects and Interaction Effects p-values
L-Threonine NS NS NS NSMycofix Plus * NS NS *Aflatoxin B1 NS NS NS NS
L-Threonine × Mycofix Plus NS NS NS NSL-Threonine × Aflatoxin B1 NS NS NS NSMycofix Plus × Aflatoxin B1 NS NS NS NS
L-Threonine × Mycofix Plus × Aflatoxin B1 NS NS NS NS
a,b Means within a column with differing superscripts are significantly different at * p < 0.05. NS, p ≥ 0.05.1 Percentage of Live Body Weight. 2 Percentage of Defatted Dry Tibia Weight. 3 Body Weight. 4 Means represent32 pens of chickens with 10 birds per pen. (n = 32/group).

Toxins 2022, 14, 192 11 of 23
Table 12. Effect of L-Threonine and Mycofix Plus (MP) on tibia characteristics of broilers exposed toAflatoxin B1 at day 35, Cobb 500.
Length Thickness RobusticityIndex Density
Treatments L-Threonine, %of Requirements
MP,g/kg
Aflatoxin B1,500 µg/kg cm cm g/cm3
T1 100 0 − 9.03 0.85 4.13 1.16T2 100 0 + 8.88 0.78 4.16 1.15T3 100 1 − 9.18 0.86 4.08 1.21T4 100 1 + 8.82 0.84 4.13 1.13T5 125 0 − 8.95 0.82 4.16 1.21T6 125 0 + 8.89 0.86 4.13 1.16T7 125 1 − 8.88 0.84 4.13 1.20T8 125 1 + 8.83 0.81 4.14 1.19
Pooled SEM 0.12 0.03 0.03 0.02
Main Effects Levels Means 1
L-Threonine 100 8.98 0.83 4.12 1.16125 8.89 0.83 4.14 1.19
Mycofix Plus 0 8.94 0.83 4.14 1.171 8.93 0.84 4.12 1.18
Aflatoxin B1− 9.01 0.84 4.12 1.20 a
+ 8.86 0.82 4.14 1.16 b
Main Effects and Interaction Effects p-valuesL-Threonine NS NS NS NSMycofix Plus NS NS NS NSAflatoxin B1 NS NS NS *
L-Threonine × Mycofix Plus NS NS NS NSL-Threonine × Aflatoxin B1 NS NS NS NSMycofix Plus × Aflatoxin B1 NS NS NS NS
L-Threonine × Mycofix Plus × Aflatoxin B1 NS NS NS NSa,b Means within a column with differing superscripts are significantly different at * p < 0.05. NS, p ≥ 0.05. 1 Meansrepresent 32 pens of chickens with 10 birds per pen (n = 32/group).
2.5. Intestinal Morphometry and Cecal Microflora
Jejunal indices, including villus height (VH), villus width (VW), crypt depth (CD),VH:CD, muscular layer, surface area, and apparent absorptive surface area were not signifi-cantly affected by the inclusion of L-Thr or MP (Table 13). The AFB1 did not significantlyalter the jejunal morphometry; however, as the main effect, the muscular layer was numeri-cally thinner in the AFB1 group (p = 0.06).
Total aerobic bacteria counts (TAC), E. coli, and Lactobacilli were not significantlyaffected in the present study. However, L-Thr at 125% of the recommended intake didnumerically reduce the log10 of colony-forming units of cecal E. coli by 0.45 (CFU) g−1 inthe presence of AFB1 (data table is contained within the Supplementary Material; Table S6).

Toxins 2022, 14, 192 12 of 23
Table 13. Effect of L-Threonine and Mycofix Plus (MP) on jejunal morphometry of broilers exposedto Aflatoxin B1 at day 35, Cobb 500.
VillusHeight
VillusWidth
CryptDepth VH:CD 1 Muscular
LayerSurface
AreaApparent
AbsorptiveSurface Area
Treat-ments
L-Threonine,% of Require-
mentsMP,g/kg
AflatoxinB1, 500µg/kg
µm µm µm µm µm2 µm2
T1 100 0 − 1112.89 204.14 240.75 4.99 172.66 718,299 1968.3T2 100 0 + 1229.83 201.13 237.08 5.47 152.13 761,173 2099.3T3 100 1 − 1182.54 209.36 240.03 5.19 168.44 795,178 2068.1T4 100 1 + 1133.84 187.84 225.14 5.43 158.42 663,192 1942.9T5 125 0 − 1115.22 201.79 226.37 5.25 174.40 710,441 1963.8T6 125 0 + 1174.73 207.81 237.51 5.19 141.63 774,398 2053.9T7 125 1 − 1244.00 188.41 220.87 5.97 161.44 724,213 2076.9T8 125 1 + 1205.36 206.20 239.13 5.34 157.94 777,047 2085.7
Pooled SEM 85.13 10.54 13.55 0.41 12.52 66,123.29 107.58
Main Effects Levels Means 2
L-Threonine 100 1164.77 200.62 235.75 5.27 162.91 734,460 2019.6125 1184.83 201.06 230.97 5.43 158.85 746,525 2045.1
Mycofix Plus 0 1158.16 203.72 235.43 5.22 160.20 741,078 2021.31 1191.43 197.95 231.29 5.48 161.56 739,908 2043.4
Aflatoxin B1− 1163.66 200.93 232.00 5.35 169.23 737,033 2019.3+ 1185.94 200.75 234.72 5.36 152.53 743,953 2045.4
Main Effects and Interaction Effects p-values
L-Threonine NS NS NS NS NS NS NSMycofix Plus NS NS NS NS NS NS NSAflatoxin B1 NS NS NS NS NS NS NS
L-Threonine × Mycofix Plus NS NS NS NS NS NS NSL-Threonine × Aflatoxin B1 NS NS NS NS NS NS NSMycofix Plus × Aflatoxin B1 NS NS NS NS NS NS NS
L-Threonine × Mycofix Plus × Aflatoxin B1 NS NS NS NS NS NS NS1 Villus Height to Crypt Depth. 2 Means represent 32 pens of chickens with 10 birds per pen (n = 32/group). NS, p ≥ 0.05.
3. Discussion
This study was designed to evaluate the efficacy of dietary L-Thr and MP to reduce theharmful effects of a commercially relevant concentration of aflatoxin (AFB1, 500 ppb) overthe course of 5 weeks. Growth performance, carcass traits, blood–biochemical metabolites,enzymatic activities, immune response, serum antioxidant capacity, meat quality, tibiacharacteristics, intestinal morphometry, and cecal microflora were studied. The wholeperiod performance was not affected by AFB1, L-Thr, or MP. Nevertheless, FI was increasedby supplemental L-Thr in the grower period, which may relate to a triggered appetite-regulating mechanism [31]. Ahmed et al. (2020) [31] reported a better growth performanceof Ross 308 broilers fed extra L-Thr above NRC; 1994 [32] recommended requirements (110and 120%) due to more dietary L-Thr to support the growth and digestive system, followedby an enhanced apparent ileal digestibility of proteins and amino acids. However, wholeperiod growth performance was not significantly affected by L-Thr in this study. Chen et al.(2017) [35] observed no effects of supplemental L-Thr (1 and 3 g/kg of feed) on the growthperformance of Arbor-Acres Plus broilers for 21 days. Our findings are almost similar toMin et al. (2017) [33], who found no significant differences among L-Thr levels (100, 125,and 150% of NRC, 1994 requirements) on the growth performance of Arbor Acre broilerchickens from 0 to 21, 22 to 42, and 0 to 42 days of age. The appetite stimulation effect byMP in the grower period may relate to its phytogenic compounds, such as plant and algaeextracts. However, similar results were not observed for other periods; more research isneeded to make a conclusion. Moreover, a non-significant higher FCR was observed in MPtreatment at finisher-2, and the reason is not readily apparent. Dänicke et al. (2003) [36]reported a tendency to stimulate the FI in Lohmann male broilers fed 2.5 g of MP/kg of diet.Their findings showed decreased final live BW, increased FCR, and impaired performance,regardless of mycotoxin concentration. From 1 to 28 days, no significant improvements inFI, BWG, and FCR were observed by 2 g of MP/kg of diet in Ross 308 male broiler chickenscompared to control [37]. Moreover, Hanif et al. (2008) [38] observed no significant positiveeffects of MP (1 and 2 g/kg) on the FI, BW, and FCR of Starbro broilers over the course of

Toxins 2022, 14, 192 13 of 23
six weeks compared to the control group; however, a higher MP level resulted in a higherBW in week 5, in contrast with the control group. Giambrone et al. (1985) [39] had reportedthat AFB1 less than 1000 ppb is subclinical for birds with a balanced diet and excellentmanagement. Likewise, Chen et al. (2014) [34] showed that FI, weekly BWG, and feedefficiency were not affected by the 500 and 1000 ppb of AFB1; total BWG was lower than thecontrol treatment at 21 days of age, and the severe harmful effects of AFB1 on performanceonly occurred at 2000 ppb. It has been reported that an average of 950 ppb of AFB1 reducesthe FI and BWG by 11% [34]; therefore, it is not necessarily unusual to observe the minimaleffects of feeding 500 ppb of AFB1 on performance.
In the present study, AFB1 decreased the relative weights of breast meat and carcasses.Aflatoxin prevents essential functions such as protein and nucleic acid synthesis [40]. Dis-turbed amino acid utilization and impaired protein synthesis may explain the lower breastmeat in this study. Furthermore, the MP treatment decreased breast meat yield; the reasonfor this is not readily apparent. Supplemental L-Thr increased breast meat yield significantly,which is almost similar to Ahmed et al. (2020) [31], who obtained more breast meat yield bythe inclusion of L-Thr in diet (110% and 120% of the NRC, 1994 requirements) comparedto the control group, but observed no significant difference between 110% and 120%. Thehigher breast meat yield produced by L-Thr may relate to an interaction between L-Thrand Lys, which increases the utilization of Lys for muscle development [31]. According toour findings, an average ratio of digestible L-Thr to Lys of (0.79) resulted in higher breastmeat yield compared to the basal diet ratio of (0.63), which is almost equal to the Cobb500 recommendation of (0.66). When it comes to amino acids, the most important thing isbalance, rather than absolute amounts. Kidd et al. (1997) [41] showed an interaction betweenThr and Lys to increase breast fillet yields (Thr: Lys ratio of approximately 70%), somewhatsimilar to results obtained with the 79% average in this study; therefore, the breast meatyield may increase in the range of the 70 to 79% ratio of Thr to Lys.
Additionally, the best breast meat yield and carcass percentahe were observed inT7 containing L-Thr and MP. The 2-way interaction effect between L-Thr and MP wassignificant, and it increased breast meat yield. Our results represent that the combinationof L-Thr and MP in the diet is helpful to increase the breast meat yield.
The serum levels of glucose and urea were affected by AFB1, and an impaired glu-cose utilization may explain this effect. Our result is almost different from the otherreports [3,42,43], which observed no changes in glucose levels with 500, 2000, and 800 ppbof AFB1, respectively. During the first 8 weeks, a considerable amount of urea can besynthesized by chickens that will be metabolized to uric acid production by the residualembryonic hepatic arginase, which will be decreased as birds grow [44]. Aravind et al.(2003) [44] reported a lower blood urea nitrogen in birds fed a naturally contaminated diet(aflatoxin 168 ppb, ochratoxin 8.4 ppb, zearalenone 54 ppb, and T-2 toxin 32 ppb) at 21and 35 days of age; and concluded that an altered functional status of the liver occurred.The concentration of cholesterol, HDL, and LDL was affected by 2-way interaction effects,which means that the effect of the one experimental factor depends on the level of the otherexperimental factor. It has been reported that AFB1 restrains cholesterol biosynthesis dueto liver problems and impaired lipid transport [45–47]. In a 2-way interaction, cholesterolconcentration was raised by MP compared to AFB1 alone, which suggests a positive effectof MP on cholesterol under the aflatoxicosis challenge.
The negative impact of AFB1 on the ALT concentration was significant as a 2-wayinteraction; some hepatic stress may explain this effect. The positive effect of MP on theconcentration of LDH in a 2-way interaction with AFB1 demonstrates that the inclusion ofMP may be helpful for birds under a low-level aflatoxicosis. The serum enzymatic activityof AST increased with higher L-Thr, which refers to increased amino acid metabolism.However, Kolbadinejad and Rezaeipour (2020) [48] did not observe any effects of 105, 110,and 115% of L-Thr on the concentration of the AST of Ross male broiler chickens at day 35.
Similarly, Sigolo et al. (2017) [49] represented the fact that AST was not affected by theincreasing levels of L-Thr above the Ross recommendation (110, 120, and 130%) at day 42.

Toxins 2022, 14, 192 14 of 23
Nevertheless, other researchers observed higher levels of AST, due to the metabolism ofexcess amino acid, imbalanced L-Thr, or higher dietary branched-chain amino acids [33].Other than AST, ALP was increased in the present study. Aflatoxin B1 increased theconcentration of ALP; this agrees with the previous reports [3,19], which indicated higherlevels of ALP in birds fed contaminated diets with 500 ppb of AFB1, due to altered liverfunction followed by hepatocyte damage.
Alkaline phosphatase is a zinc–metalloenzyme consisting of zinc and magnesium [50],synthesized by the liver, bone, and smaller amount in intestines and kidneys [51]. Ithas been reported that any serum activity of ALP mainly reflects the liver and boneproblems [34]. Aflatoxin B1 decreased bone density, which suggests some changes in theutilization of cholecalciferol and bone mineralization. Bird (1978) [25] reported a significantinteraction between AFB1 and vitamin D3 on the bone mineralization of white leghorncockerels, using a regression equation which shows that each ppm of AFB1 increases thevitamin D3 requirements by 8.84 ICU/kg of diet; this indicates an interference with theconversion of vitamin D3 to its more active physiological derivatives. Correspondingly,Huff. (1980) [24] represented that bone ashes were decreased by dietary aflatoxin (2500 ppband more) in Hubbard male broilers, and mentioned that aflatoxin inhibits the vitaminD3-mediated mineralization of bones, and contributes to bone development problems.
Furthermore, 2000 ppb of AFB1 decreased tibia and ash weight in Cobb male broilerchickens [52]. Overall, Bird. (1978) [25] and Huff (1980) [24] described the capacity ofaflatoxin to decrease bone ash, the result of which was not observed in this study. However,bone density decreased by AFB1, which indicates that even a low concentration of AFB1can interfere with bone development and strength.
On the other hand, tibia fresh weight and BW to bone weight improved by dietaryMP, representing no harmful bone-related consequences in birds fed MP, which may beexplained by the better utilization of minerals.
Aflatoxin B1 had no severe consequences on H, L, and H to L ratio; only numerical,minimal adverse effects were observed (p = 0.09; p = 0.07). It can be concluded that higherlevels of aflatoxins may have enough potential to impair the birds’ usual status and exposethem to stress. Our results are almost different from other reports [3,8,27,53]. It has beenreported that the adverse effects of mycotoxins such as AFB1 on H and L are related to theeffects on inflammatory and immune response, hematopoiesis, or changes in the formationof humoral substances such as cytokines [46,54]. The negative impacts of aflatoxins on Lhinder antibody production and depress the antibody half-life [8].
However, the percentage of L was not significantly decreased by AFB1 in the presentstudy; but the antibody titer against IBV was significantly decreased in birds fed AFB1(T2) compared to T1 and T8. Moreover, AFB1 decreased the IBV titer significantly. Thesefindings are almost contrary to [55], which observed no impacts of AFB1 on the IBV titerof Ross 308 male broiler chickens at 75 and 750 ppb over the course of 5 weeks. On theother hand, there was a strong negative correlation (r2 = 0.96) at day 42 between the IBVtiter and AFB1 concentrations (0, 250, 500, 750 ppb) in Ross broilers, revealing that thiseffect might relate to the potential of AFB1 to inhibit RNA polymerase, and consequently,depression in protein synthesis and specific immunoglobulins [56]. Moreover, Jahanianet al. (2019) [8] observed a reduction for IBV titers (20 days of age) in birds fed aflatoxins(500, 2000 ppb) from 7 to 28 days of age. Aflatoxin B1 increases the activity of lysosomalenzymes of skeletal muscle and liver; this effect enhances antibody degradation; aflatoxininhibits the phagocytic cells of the reticuloendothelial systems, which are involved in theprocessing of antigens, as well as cells of the bursa of fabricius involved in the initiation ofthe humoral response [56]. It has been expressed that lymphoid organs are vulnerable tomycotoxins because of lysosomes and hydrolytic enzymes activities. Furthermore, proteinsynthesis depression, particularly immunoglobulins A and G, might be the reason foran immunocompromised status induced by aflatoxins [8]. However, the alternations ofimmunoglobulins were not under investigation in this experiment, but IBV titers weredecreased. The antibody titer against IBDV was not significantly affected; however, it was

Toxins 2022, 14, 192 15 of 23
suggested that there might be a relation with immunosuppression, due to aflatoxins andsevere IBDV outbreak [57]. No significant effects of L-Thr on H and L were observed.
Further research to reveal the effect and mechanism of different levels of L-Thr on H andL is warranted. The serum titers of IBV and IBDV were not affected by extra L-Thr, which wasnot expected, due to the more utilized L-Thr as an important component of immunoglobulins.Our results are almost different from Ahmed et al. (2020) [31], but the interaction effects ofL-Thr and MP resulted in a higher IBV titer, which can be interpreted as a synergistic effect.Moreover, supplemental L-Thr and MP treatment (T8) showed a higher IBV titer than T2, T4,and T6, indicating the efficacy of L-Thr and MP under an aflatoxicosis challenge. No significanteffects of MP on H and L were observed, which agrees with other reports [36,58]. Despite apositive non-significant effect of Mycofix (2.5 g/kg of diet) on H and L, better physiologicalstress responses can be concluded [58]. Higher IBV titer in a 2-way interaction between MPand AFB1 demonstrates the ability of MP to counter the consequences of aflatoxicosis.
It has been reported that increasing levels of L-Thr improved the antioxidant capac-ity [33,59] by the best effects at 125% of the NRC; 1994 [32] recommended amounts. In thepresent study, the concentrations of SOD and CAT were not affected by the treatments, buta markable positive change in the GPX level was observed.
As the main effect, supplemental L-Thr significantly increased the concentration ofGPX by almost 17.49%, indicating an enhanced antioxidant capacity.
Serum antioxidant capacity was not altered by the low level of AFB1, which almostagrees with Li et al. (2014) [18].
Some reports indicated improved gut health by dietary L-Thr more than recommendedrequirements [31,33,35], but intestinal morphometry was not affected by the dietary L-Thrin the present study. Despite a series of reports [19,21–23,60], AFB1 had no harmful effectson the intestinal morphometry, which is almost similar to Chen et al. (2016) [61]. However,due to the different intestinal sections, length of exposure, or species, the consequences ofAFB1 on intestinal morphology are not wholly conclusive [23], and further research shouldbe carried out to extend these findings.
No harmful effects of AFB1 on cecal microflora were observed in the present study. Galarza-Seeber et al. (2016) [27] reported inconsistent effects of AFB1 on cecal microflora by more than500 ppb. Moreover, Liu et al. (2018) [4,7] indicated that 40 ppb of AFB1 significantly increasedthe Clostridium perfringens (C. perfringens), E. coli, and Gram-negative bacteria of ileal digestain Arbor Acres broiler chickens at 21 and 42 days of age, respectively. Aflatoxin B1 can affectintestinal function by mechanisms such as toxin secretion, toxin cytotoxicity, and genotoxicityin broilers [4]. On the other hand, Liu et al. (2018) [6] did not observe any significant effects ofAFB1 (40 ppb) on the ileal populations of Lactobacilli, Bifidobacteria, C. perfringens, and E. coli ofCobb male broilers compared to control at day 21. However, the microbiota of ileal digesta werenot under investigation in the present study. The cecal population was not affected by AFB1,but extra L-Thr numerically reduced the population of E. coli compared to the AFB1 treatment.Finally, differences among species, sex, age, diets, management, length of exposure to aflatoxins,and Aspergillus species, or methods used in studies, induce different responses to aflatoxicosis(similar or identical concentrations of aflatoxins).
4. Conclusions
Aflatoxin B1 did not affect the performance in this study. However, the breast meatyield and carcass percentage, glucose and urea metabolism, serum ALP, IBV titer, andbone density were negatively affected by AFB1. L-Threonine and MP treatment improvedthe breast meat yield and carcass percentage. Supplemental L-Thr and MP were helpfulto improve the impaired immune response of broilers exposed to AFB1. Dietary L-Thrwas useful for raising serum antioxidant capacity. Mycofix Plus improved some of thetibia characteristics, regardless of AFB1 concentration. The supplemental MP corrected theserum cholesterol and LDH levels in a 2-way interaction with AFB1.
An industry-relevant aflatoxicosis had almost minimal consequences in Cobb 500 broilerchickens over the course of 5 weeks. However, the negative effect of AFB1 on breast

Toxins 2022, 14, 192 16 of 23
meat yield and carcass percentage is a significant concern, and further investigations arewarranted. The authors suggest that severe harmful effects of AFB1 up to 500 ppb can beobserved in the long term as chronic aflatoxicosis.
5. Materials and Methods5.1. Experimental Design, Birds and Diets
A 2 × 2 × 2 factorial arrangement in a completely randomized design with 8 replicateswas conducted to evaluate the efficacy of L-Thr and MP under a low-level aflatoxicosis for5 weeks. A total of 640 1-day-old Cobb 500 male and female broiler chickens were allocatedto 64 experimental units (1 m × 1.2 m) with 10 birds per unit. Feed and water consumptionwere “ad libitum,” and temperature, humidity, and lighting programs were performedaccording to the Cobb 500 management guide. Two corn–soybean meal-based basal dietswere carefully formulated to meet the desired requirements to provide 100 and 125 percentof L-Thr for each stage of the production (Table 14). Treatments were as follows: T1 basaldiet (L-Thr, 100), T2 (T1 + AFB1), T3 (T1 + MP), T4 (T1 + AFB1 + MP), T5 basal diet (L-Thr,125), T6 (T5 + AFB1), T7 (T5 + MP), and T8 (T5 + AFB1 + MP). Corn grain was analyzed forAMEn and digestible amino acids, and soybean meal was analyzed for digestible aminoacids by near-infrared spectroscopy (FOSS NIRS-DS2500, 91744463, Denmark).
Table 14. Composition of the diets 1, analyzed and calculated nutrients in different periods of theexperiment, including two levels of L-Threonine (100 and 125% of the requirements, Cobb 500).
Ingredients, %Starter, 1 to 8 Days Grower, 9 to 18 Days Finisher 1, 19 to 28 Days Finisher 2, 29 to 35 Days
100% 125% 100% 125% 100% 125% 100% 125%
Corn grain 55.42 55.32 60.32 60.40 62.10 62.10 63.77 63.81Soybean meal (44% CP) 35.87 35.75 31.11 30.85 28.75 28.58 26.40 26.20
Soybean oil 3.78 3.78 4.20 4.20 5.10 5.10 5.80 5.80Calcium carbonate 1.17 1.17 0.82 0.82 0.76 0.76 0.76 0.76
Dicalcium phosphate 2.04 2.04 1.92 1.92 1.72 1.72 1.74 1.74Sodium bicarbonate 0.17 0.17 0.18 0.18 0.18 0.18 0.18 0.18
Salt 0.29 0.29 0.29 0.29 0.29 0.29 0.29 0.29Methionine 2 0.35 0.35 0.32 0.32 0.30 0.30 0.28 0.28
Lysine 2 0.42 0.42 0.38 0.38 0.38 0.38 0.36 0.36L-threonine 2 0.09 0.31 0.06 0.24 0.02 0.19 0.02 0.18
Mineral premix 3 0.20 0.20 0.20 0.20 0.20 0.20 0.20 0.20Vitamin premix 3 0.20 0.20 0.20 0.20 0.20 0.20 0.20 0.20
Nutrients Composition
AMEn, Kcal/kg 2911 2913 2992 2995 3072 3074 3132 3134CP, % (Analyzed) 21 21 19 19 18 18 17 17
Calcium, % (Analyzed) 0.90 0.90 0.84 0.84 0.77 0.77 0.76 0.76Total phosphorous. %
(Analyzed) 0.76 0.76 0.71 0.71 0.64 0.64 0.63 0.63
Available phosphorous, % 0.45 0.45 0.42 0.42 0.38 0.38 0.38 0.38Digestible threonine, % 0.83 1.04 0.73 0.91 0.66 0.83 0.63 0.79Digestible arginine, % 1.34 1.34 1.21 1.20 1.14 1.13 1.07 1.06
Digestible lysine, % 1.28 1.27 1.14 1.14 1.08 1.08 1.02 1.01Digestible methionine 4, % 0.63 0.63 0.58 0.58 0.55 0.55 0.52 0.52
Digestible methionine +cysteine, % 0.91 0.91 0.85 0.84 0.81 0.81 0.77 0.77
Arginine to Lysine 1.05 1.05 1.06 1.06 1.05 1.05 1.05 1.05Sodium, % 0.17 0.17 0.18 0.18 0.18 0.18 0.18 0.18
Potassium, % 0.89 0.88 0.81 0.80 0.76 0.76 0.72 0.72Chloride, % 0.21 0.21 0.21 0.21 0.21 0.21 0.21 0.21
DCAD 5, mEq/kg 242 242 223 222 212 211 202 201
1 Aflatoxin B1 was detected lower than 8 µg/kg. 2 Evonik Nutrition & Care GmbH. 3 The premixes providedthe following per kilogram of diet: zinc, 88 mg; iron, 16 mg; manganese, 96 mg; copper, 12.8 mg; iodine, 1 mg;selenium, 0.24 mg; vitamin A, 10,000 IU; vitamin D3, 4000 IU; vitamin E, 36 mg; vitamin K3, 3 mg; thiamine,3.2 mg; riboflavin, 7.2 mg; pantothenic acid, 12 mg; niacin, 52 mg; pyridoxine, 3.36 mg; folic acid, 2.08 mg; vitaminB12, 20 µg; biotin, 120 µg; and choline chloride, 400 mg. 4 The excess of calculated methionine converts to cysteineto provide methionine + cysteine. 5 Dietary cation–anion difference.

Toxins 2022, 14, 192 17 of 23
The nutrient compositions of basal diets were analyzed for crude protein, calcium,and total phosphorous by AOAC methods [62]. All procedures involving animals wereapproved by the Department of Animal Science and the Research Council of Islamic AzadUniversity, Shabestar, Iran (code: 162305888; date of approval: 12 June 2018).
5.2. Aflatoxin Production
Aspergillus parasiticus (PTCC-5286) was purchased from the Iranian Research Orga-nization for Science and Technology (IROST) to produce aflatoxin by fermentation. Theprotocols [63] were performed in the Department of Poultry Science, Tarbiat Modares Uni-versity, Tehran, Iran. Briefly, 100 of 1000 mL-inoculated Erlenmeyer flasks (100 g of whiterice/flask; 100 mL water/flask) containing 200 mL (2 mL/flask) of A. parasiticus suspension(6.5 × 10⁶ spores/mL) were incubated for 7 days at 28 ◦C for the fermentation process. Therice grains were autoclaved to kill the spores, and then were dried and grounded [63]. Theconcentration of aflatoxins was measured by HPLC at the end of the experiment. Aflatoxinassays were conducted based on the Institute of Standards and Industrial Research of Iran(ISIRI 6872), according to Mazaheri. (2009) [64]. In summary, 50 g of sample was extractedwith 200 mL of methanol–water (80:20), then diluted with water and filtered through a glassmicrofiber filter. AflaTest WB immunoaffinity columns (IACs) were used for purification.Ten ml of phosphate buffer saline and 75 mL of the filtrate were passed through the IACat a ca. 1 drop per second flow rate. For elution, 0.5 and 1.0 mL of methanol were passedthrough the column by gravity, and collected as the first and second portions, respectively.After dilution with water, reverse-phase HPLC (C18) and fluorescence detector with post-column derivatization (Kobra Cell) involving bromination were used to analyze aflatoxinvia injection of 100 µL into HPLC. The excitation wavelength of 365 nm and emissionwavelength of 435 nm were used for detection.
Finally, calculated amounts of moldy rice powder were carefully incorporated into thebasal diets to reach the desired concentration in each production period (AFB1, 500 ppb)using a horizontal mixer. The analyzed and calculated concentrations of aflatoxins arepresented in Table 15.
Table 15. Analyzed and calculated concentrations of Aflatoxins.
Moldy Rice Powder 1 Diets 2
Aflatoxins mg/kg µg/kg
B1 65.6 500B2 2.1 16G1 25.5 195G2 0.9 7.0
Total 94.1 7181 Analyzed by HPLC. 2 The dietary concentration was calculated based on the portions of the contaminated rice(moldy rice powder).
5.3. Performance, Carcass Traits and Blood Biochemical Parameters
Cumulative FI, BWG, and FCR were recorded per experimental unit and were calcu-lated per bird for each period of production. European Production Efficiency Factor, andEBI, respectively, were calculated according to [65,66] by using the following formulas:
EPEF = (Survival Rate × Final Body Weight (BW)) ÷ (Age × FCR)× 100 (1)
EBI = (Daily BWG × Survival Rate) ÷ (FCR × 10) (2)
where Survival Rate = 100-mortality %; Final BW = average BW in kilogram at the endof the period; Age = market age or age at the end of the period; FCR = feed conversionratio. At 35 days of age, one bird was selected per experimental unit and euthanized bycervical dislocation, then dissected to record the carcass traits, such as relative weightsof breast, drumsticks, WBNT, carcass, liver, spleen, kidneys, bursa of fabricius, pancreas,

Toxins 2022, 14, 192 18 of 23
heart, gizzard, and abdominal fat, after collecting blood samples by the puncture of theright-wing vein using injection syringes and sample tubes. Blood samples were centrifuged(Centrifuge, Hermle Z320, Germany) for 12 min at 3200 RPM (1500× g) to obtain serums,and then stored at −20 ◦C until the analysis. After thawing, blood serums were assessedfor glucose, cholesterol, triglycerides, uric acid, urea, total protein, albumin, AST, ALT,ALP, and LDH using commercial kits (Pars Azmun Company, Karaj, Iran) by an auto-analyzer (Technicon RA-XT, Oakland, CA, USA). The serum globulin concentration wascalculated by subtracting the albumin from the total protein, then the albumin to globulinratio was calculated. High-density lipoprotein was measured using the same kits byspectrophotometry (Spectrophotometer, Jenway 6300, UK). Very low-density lipoproteinand LDL were calculated by Friedwald’s equations [67]:
VLDL = triglycerides ÷ 5 (3)
LDL = total cholesterol − (HDL + VLDL) (4)
5.4. Differential Diagnosis of H and L
At the end of the rearing period, 64 blood samples were collected by puncturing theright-wing vein using injection syringes and EDTA tubes. Blood smears were fixed withmethanol, and after drying, stained with Wrights–Giemsa stain (Water, 9 mL + Stain, 1 mL).The samples were counted for about 60 leukocytes [68] under 1000× total magnificationwith an optical microscope (Olympus CHK, Taiwan) and immersion oil. The H to L ratiowas calculated by dividing the percentage of H to L.
5.5. Antibody Titer and Antioxidant Capacity
All birds were vaccinated against IBDV (16 days of age) and IBV (20 days of age)in drinking water. Blood samples were obtained at 30 and 35 days of age, respectively.Samples were centrifuged (Centrifuge, Hermle Z320, Germany) for 12 min at 3200 RPM(1500× g) to obtain serums, then were stored at −20 ◦C until the analysis. After thawing,blood serums were assessed for IBDV and IBV by a microplate reader (MPR4 Plus, Hiperion,Germany) with indirect ELISA Diagnostic Kits (IBDV, Lot-680-012; IBV, Lot-679-018, ID.vet,France). Superoxide dismutase, GPX, and CAT were measured using colorimetric assaykits (Cat-ZB-SOD-96A Lot-ZB-A5191121; Cat-ZB-GPX-A96 Lot-ZB-A7191210; Cat-ZB-CAT-96A Lot-ZB-A4191127, ZellBio GmbH, Lonsee, Germany) according to the protocols ofthe manufacturers.
5.6. Meat Quality
All of the protocols were based on Castellini et al. (2002) [69]. About 1 g of raw breastmeat was homogenized for 30 s in 10 mL of 5 M iodoacetate; then, pH was measured witha digital pHmeter (Shimaz Company, Tehran, Iran). For estimation of WHC, 1 g of rawbreast meats was centrifuged on tissue paper for 4 min at (1500× g), and dried overnight at70 ◦C (Elektro-Helios, Stockholm, Sweden). Water holding capacity was calculated by thefollowing formula [69]:
(weight a f ter centri f ugation − weight a f ter drying) ÷ initial weight × 100 (5)
About 20 g of breast meats were placed in aluminum pans; then, they were cooked for15 min in a pre-heated oven (200 ◦C) to reach an internal temperature of 75 ◦C (the mostreported temperature). Cooked samples were cooled at 15 ◦C for 30 min and were weighed.The differences between the initial and the final weights were calculated for the estimationof cook loss. Cook loss was expressed as a percentage of the initial weight. About 15 g ofraw breast and drumstick meats were stored at 4 ◦C for 10 days to measure lipid oxidation.Ten grams of breast and drumstick were separately homogenized with 95.7 mL of distilledwater and 2.5 mL of 4 N hydrochloric acid for 2 min. The mixtures were distilled toreach 50 mL; then, 5 mL of distillate and 5 mL of thiobarbituric acid-reactive reagent (15%

Toxins 2022, 14, 192 19 of 23
trichloroacetic acid and 0.375% thiobarbituric acid) were heated in a water bath for 35 min.The mixtures were then cooled under tap water for 10 min, and the absorbance was readat 538 nm (Spectrophotometer, Jenway 6300, UK) against an appropriate blank sampleto obtain thiobarbituric acid-reactive substances values by multiplying optical density by7.843. The final products were expressed as mg MDA per kg of meat [69].
5.7. Tibia Characteristics
Left tibia samples were carefully defleshed and cleaned of soft tissues and fibula at35 days of age and weighed. Length and thickness (mid-point) measured by an electroniccaliper (Insize 1112-150, Suzhou, China); then, the Robusticity Index and bone density werecalculated according to Hafeez et al. (2014) [70] by the following formulae:
Robusticity index = bone length ÷ cube root o f bone weight (6)
Bone density = weight o f bone in air ÷ (weight o f bone in air− weight o f bone in water)× water density at water temperature
(7)
Samples were wrapped in saline-soaked gauze, then stored at −20 ◦C [71] until thenext step. After equilibrating to room temperature and drying for 3 h in an oven (Elektro-Helios, Stockholm, Sweden) at 100 ◦C, tibias were defatted by immersion in petroleumether for 48 h [72], and dried again for 12 h at 110 ◦C [73], and weighed before burning in amuffle furnace (Thermo-Lab, Hakim Azma Tajhiz, Tehran, Iran) at 600 ◦C for 6 h to obtainashes [70].
5.8. Intestinal Morphometry and Cecal Microflora
At 35 days of age, 0.5 cm of distal jejunum was cut, rinsed with tap water, fixed in 10%neutral buffered formalin, dehydrated automatically by a tissue processor, and embeddedin paraffin, sectioned (5-µm thick), set on a glass slide stained with Alcian Blue; then,examined by light microscopy (HD Lite Camera and TCapture V 4.3 Software, Tucsen,Fuzhou, China) for morphometric analysis. Villus height was measured from the tip of thevillus to the top of the lamina propria, VW was measured at the base area of each villus,and CD was measured from the base of the invagination between the villus up to the regionof transition between the crypt and villus [74]. Muscularis thickness was also investigated,and overall, 80 villi were studied per treatment. Villus surface area [75], and apparentabsorptive surface area [21], respectively, were calculated using these formulae:
(2π) (VW/2) (VH) (8)
3.1 × VW + 3.2 × VH)× 1 – (2 × VH) (9)
After dissection, one gram of cecal contents dissolved in 9 mL of cold-sterile normalphysiological saline (Sterile Water, 1 L + NaCl, 9 g); and homogenized using falcon tubesand a vortex mixer. Each sample was serially diluted 10-fold until 10−6 with the normalsaline (0.9% NaCl). Final diluted samples (100 µL) were inoculated by mechanical pipette(TopPette, Dragon Lab, China) into the De Man, Rogosa and Sharpe agar (MRS), EosinMethylene Blue (EMB), and Plate Count Agar (PCA) (Ibresco, Iran) for counting Lactobacilli,E. coli, and TAC, respectively. Samples were incubated (Incubator SHIH 55, Shimaz Com-pany, Tehran, Iran) for 24 h with 37 ◦C, and the counted colonies (Colony Counter SanaSL-902, Shimaz Company, Iran) were multiplied by 106, and then expressed as the log10of (CFU) g−1.
5.9. Statistical Analysis
Experimental data and residuals were checked for normality using the Kolmogorov–Smirnov test. Data were analyzed as a 3-way ANOVA model using a 2-level factorial

Toxins 2022, 14, 192 20 of 23
arrangement in a completely randomized design by the general linear models procedure ofSAS 9.4 (SAS Institute, Cary, NC), according to the following formula:
xiklm = u + αk + βl + ym + (αβ)kl + (αy)km + (βy)lm + (αβy)klm + εiklm (10)
where xiklm is the value of each observation; µ is the mean of the dependent variables; αk,βl, ym are the independent variables; (αβ)kl, (αy)km, (βy)lm, (αβy)klm are the interactioneffects of independent variables; and εiklm is the experimental error. In the presence ofmain and interaction effects (p < 0.05), all means were compared using Duncan’s multiplerange test, with a significance level of 0.05. A one-way ANOVA model was used tocompare the treatments. Data tables for 2-way interactions are contained within theSupplementary Material.
Supplementary Materials: The following are available online at https://www.mdpi.com/article/10.3390/toxins14030192/s1, Table S1: Interaction effect between L-Threonine and Mycofix Plus (MP);on breast meat yield and LDL1 of broilers, Cobb 5002; Table S2: Interaction effect between MycofixPlus (MP) and Aflatoxin B1, on Cholesterol, HDL1, ALT2, and LDH3 of broilers, Cobb 5004; Table S3:Interaction effect between L-Threonine and Mycofix Plus (MP), on IBV1 titer of broilers, Cobb 5002;Table S4: Interaction effect between Mycofix Plus (MP) and Aflatoxin B1, on IBV1 titer of broilers,Cobb 5002. Table S5: Effect of L-Threonine and Mycofix Plus (MP) on meat quality of broilers exposedto Aflatoxin B1, Cobb 500; Table S6: Effect of L-Threonine and Mycofix Plus (MP) on cecal microfloraof broilers exposed to Aflatoxin B1, Cobb 500.
Author Contributions: Conceptualization, A.M. (Aydin Mesgar) and Y.E.; Data curation, A.M. (AydinMesgar); Formal analysis, A.M. (Aydin Mesgar) and C.A.B.; Investigation, A.M. (Aydin Mesgar);Methodology, A.M. (Aydin Mesgar), H.A.S., Y.E. and A.M. (Anand Mohan); Project administration,A.M. (Aydin Mesgar); Resources, A.M. (Aydin Mesgar); Software, A.M. (Aydin Mesgar); Supervision,H.A.S., C.A.B., Y.E. and A.M. (Anand Mohan); Validation, A.M. (Aydin Mesgar), H.A.S., C.A.B., Y.E.and A.M. (Anand Mohan); Writing—original draft, A.M. (Aydin Mesgar); Writing—review & editing,A.M. (Aydin Mesgar), H.A.S., C.A.B., Y.E. and A.M. (Anand Mohan). All authors have read andagreed to the published version of the manuscript.
Funding: This research received no external funding.
Institutional Review Board Statement: All procedures involving animals were approved by theDepartment of Animal Science and the Research Council of Islamic Azad University, Shabestar, Iran(code: 162305888; date of approval: 12 June 2018).
Informed Consent Statement: Not applicable.
Data Availability Statement: Raw data sharing is not applicable to this article.
Acknowledgments: The authors sincerely thank Todd. J. Applegate (University of Georgia) andJustin Fowler (University of Georgia) for the technical assistance and fully appreciate to Bonyann-Danesh Poultry Research Farm and Feed Analysis Laboratory, Qaemshahr, Mazandaran, Iran for thefull-time collaboration.
Conflicts of Interest: The authors declare no conflict of interest.
References1. Mgbeahuruike, A.C.; Ejioffor, T.E.; Christian, O.C.; Shoyinka, V.C.; Karlsson, M.; Nordkvist, E. Detoxification of Aflatoxin-
Contaminated Poultry Feeds by 3 Adsorbents, Bentonite, Activated Charcoal, and Fuller’s Earth. J. Appl. Poult. Res. 2018, 27,461–471. [CrossRef]
2. Yang, J.; Bai, F.; Zhang, K.; Bai, S.; Peng, X.; Ding, X.; Li, Y.; Zhang, J.; Zhao, L. Effects of feeding corn naturally contaminated withaflatoxin B1 and B2 on hepatic functions of broilers. Poult. Sci. 2012, 91, 2792–2801. [CrossRef] [PubMed]
3. Rashidi, N.; Khatibjoo, A.; Taherpour, K.; Akbari-Gharaei, M.; Shirzadi, H. Effects of licorice extract, probiotic, toxin binderand poultry litter biochar on performance, immune function, blood indices and liver histopathology of broilers exposed toaflatoxin-B1. Poult. Sci. 2020, 99, 5896–5906. [CrossRef] [PubMed]
4. Liu, N.; Wang, J.Q.; Liu, Z.Y.; Wang, Y.C.; Wang, J.P. Comparison of probiotics and clay detoxifier on the growth performance andenterotoxic markers of broilers fed diets contaminated with aflatoxin B1. J. Appl. Poult. Res. 2018, 27, 341–348. [CrossRef]

Toxins 2022, 14, 192 21 of 23
5. Cravens, R.L.; Goss, G.R.; Chi, F.; De Boer, E.D.; Davis, S.W.; Hendrix, S.M.; Richardson, J.A.; Johnston, S.L. The effects of necroticenteritis, aflatoxin B1, and virginiamycin on growth performance, necrotic enteritis lesion scores, and mortality in young broilers.Poult. Sci. 2013, 92, 1997–2004. [CrossRef]
6. Liu, N.; Wang, J.Q.; Jia, S.C.; Chen, Y.K.; Wang, J.P. Effect of yeast cell wall on the growth performance and gut health of broilerschallenged with aflatoxin B 1 and necrotic enteritis. Poult. Sci. 2018, 97, 477–484. [CrossRef]
7. Liu, N.; Wang, J.Q.; Liu, Z.Y.; Chen, Y.K.; Wang, J.P. Effect of cysteamine hydrochloride supplementation on the growthperformance, enterotoxic status, and glutathione turnover of broilers fed aflatoxin B1 contaminated diets. Poult. Sci. 2018, 97,3594–3600. [CrossRef]
8. Jahanian, E.; Mahdavi, A.H.; Asgary, S.; Jahanian, R.; Tajadini, M.H. Effect of dietary supplementation of mannanoligosaccharideson hepatic gene expressions and humoral and cellular immune responses in aflatoxin-contaminated broiler chicks. Prev. Vet. Med.2019, 168, 9–18. [CrossRef]
9. Ali Rajput, S.A.; Sun, L.; Zhang, N.; Mohamed Khalil, M.; Gao, X.; Ling, Z.; Zhu, L.; Khan, F.A.; Zhang, J.; Qi, D. Ameliorativeeffects of grape seed proanthocyanidin extract on growth performance, immune function, antioxidant capacity, biochemicalconstituents, liver histopathology and aflatoxin residues in broilers exposed to aflatoxin B1. Toxins 2017, 9, 371. [CrossRef]
10. Tessari, E.N.C.; Oliveira, C.A.F.; Cardoso, A.; Ledoux, D.R.; Rottinghaus, G.E. Effects of aflatoxin B1 and fumonisin B1 on bodyweight, antibody titres and histology of broiler chicks. Br. Poult. Sci. 2006, 47, 357–364. [CrossRef]
11. Verma, J.; Johri, T.S.; Swain, B.K.; Ameena, S. Effect of graded levels of aflatoxin, ochratoxin and their combinations on theperformance and immune response of broilers. Br. Poult. Sci. 2004, 45, 512–518. [CrossRef] [PubMed]
12. Malekinezhad, P.; Ellestad, L.E.; Afzali, N.; Farhangfar, S.H.; Omidi, A.; Mohammadi, A. Evaluation of berberine efficacy inreducing the effects of aflatoxin B1 and ochratoxin A added to male broiler rations. Poult. Sci. 2021, 100, 797–809. [CrossRef][PubMed]
13. Guo, Y.; Balasubramanian, B.; Zhao, Z.-H.; Liu, W.-C. Marine algal polysaccharides alleviate aflatoxin B1-induced bursa ofFabricius injury by regulating redox and apoptotic signaling pathway in broilers. Poult. Sci. 2021, 100, 844–857. [CrossRef][PubMed]
14. Sridhar, M.; Suganthi, R.U.; Thammiaha, V. Effect of dietary resveratrol in ameliorating aflatoxin B1-induced changes in broilerbirds. J. Anim. Physiol. Anim. Nutr. 2015, 99, 1094–1104. [CrossRef]
15. Wang, F.; Shu, G.; Peng, X.; Fang, J.; Chen, K.; Cui, H.; Chen, Z.; Zuo, Z.; Deng, J.; Geng, Y. Protective effects of sodium seleniteagainst aflatoxin B1-induced oxidative stress and apoptosis in broiler spleen. Int. J. Environ. Res. Public Health 2013, 10, 2834–2844.[CrossRef]
16. Shi, Y.H.; Xu, Z.R.; Feng, J.L.; Wang, C.Z. Efficacy of modified montmorillonite nanocomposite to reduce the toxicity of aflatoxinin broiler chicks. Anim. Feed Sci. Technol. 2006, 129, 138–148. [CrossRef]
17. Eraslan, G.; Akdogan, M.; Yarsan, E.; Sahindokuyucu, F.; Essiz, D.; Altintas, L. The effects of aflatoxins on oxidative stress inbroiler chickens. Turk. J. Vet. Anim. Sci. 2005, 29, 701–707.
18. Li, Y.; Ma, Q.-G.; Zhao, L.-H.; Wei, H.; Duan, G.-X.; Zhang, J.-Y.; Ji, C. Effects of lipoic acid on immune function, the antioxidantdefense system, and inflammation-related genes expression of broiler chickens fed aflatoxin contaminated diets. Int. J. Mol. Sci.2014, 15, 5649–5662. [CrossRef]
19. Abdolmaleki, M.; Saki, A.A.; Alikhani, M.Y. Protective effects of Bacillus sp. MBIA2.40 and gallipro on growth performance,immune status, gut morphology and serum biochemistry of broiler chickens feeding by aflatoxin B1. Poult. Sci. J. 2019, 7, 185–194.[CrossRef]
20. Jahanian, E.; Mahdavi, A.H.; Asgary, S.; Jahanian, R. Effects of dietary inclusion of silymarin on performance, intestinalmorphology and ileal bacterial count in aflatoxin-challenged broiler chicks. J. Anim. Physiol. Anim. Nutr. 2017, 101, e43–e54.[CrossRef]
21. Poloni, V.; Magnoli, A.; Fochesato, A.; Cristofolini, A.; Caverzan, M.; Merkis, C.; Montenegro, M.; Cavaglieri, L. A Saccharomycescerevisiae RC016-based feed additive reduces liver toxicity, residual aflatoxin B1 levels and positively influences intestinalmorphology in broiler chickens fed chronic aflatoxin B1-contaminated diets. Anim. Nutr. 2020, 6, 31–38. [CrossRef] [PubMed]
22. Wang, F.; Zuo, Z.; Chen, K.; Gao, C.; Yang, Z.; Zhao, S.; Li, J.; Song, H.; Peng, X.; Fang, J. Histopathological injuries, ultrastructuralchanges, and depressed TLR expression in the small intestine of broiler chickens with aflatoxin B1. Toxins 2018, 10, 131. [CrossRef]
23. Zhang, S.; Peng, X.; Fang, J.; Cui, H.; Zuo, Z.; Chen, Z. Effects of aflatoxin B 1 exposure and sodium selenite supplementation onthe histology, cell proliferation, and cell cycle of jejunum in broilers. Biol. Trace Elem. Res. 2014, 160, 32–40. [CrossRef] [PubMed]
24. Huff, W.E. Discrepancies between bone ash and toe ash during aflatoxicosis. Poult. Sci. 1980, 59, 2213–2215. [CrossRef]25. Bird, F.H. The effect of aflatoxin B1 on the utilization of cholecalciferol by chicks. Poult. Sci. 1978, 57, 1293–1296. [CrossRef]
[PubMed]26. Food and Drug Administration Office of Regulatory Affairs and; Center for Veterinary Medicine Sec. 683.100 Action Levels
for Aflatoxins in Animal Food Compliance Policy Guide Guidance for FDA Staff. Available online: https://www.fda.gov/regulatory-information/search-fda-guidance-documents/cpg-sec-683100-action-levels-aflatoxins-animal-feeds (accessed on4 February 2022).
27. Galarza-Seeber, R.; Latorre, J.D.; Bielke, L.R.; Kuttappan, V.A.; Wolfenden, A.D.; Hernandez-Velasco, X.; Merino-Guzman, R.;Vicente, J.L.; Donoghue, A.; Cross, D.; et al. Leaky Gut and Mycotoxins: Aflatoxin B1 does not increase gut permeability in broilerchickens. Front. Vet. Sci. 2016, 3, 10. [CrossRef]

Toxins 2022, 14, 192 22 of 23
28. Grenier, B.; Applegate, T.J. Modulation of intestinal functions following mycotoxin ingestion: Meta-analysis of publishedexperiments in animals. Toxins 2013, 5, 396–430. [CrossRef]
29. Agriopoulou, S.; Stamatelopoulou, E.; Varzakas, T. Advances in occurrence, importance, and mycotoxin control strategies:Prevention and detoxification in foods. Foods 2020, 9, 137. [CrossRef]
30. Biomin. Available online: https://www.biomin.net/solutions/mycotoxin-risk-management/mycotoxin-deactivation/mycofix-plus/ (accessed on 6 October 2021).
31. Ahmed, I.; Qaisrani, S.N.; Azam, F.; Pasha, T.N.; Bibi, F.; Naveed, S.; Murtaza, S. Interactive effects of threonine levels and proteinsource on growth performance and carcass traits, gut morphology, ileal digestibility of protein and amino acids, and immunity inbroilers. Poult. Sci. 2020, 99, 280–289. [CrossRef]
32. National Research Council. Nutrient Requirements of Chickens. In Nutrient Requirements of Poultry, 9th ed.; National AcademyPress: Washington DC, USA, 1994; pp. 19–34.
33. Min, Y.N.; Liu, S.G.; Qu, Z.X.; Meng, G.H.; Gao, Y.P. Effects of dietary threonine levels on growth performance, serum biochemicalindexes, antioxidant capacities, and gut morphology in broiler chickens. Poult. Sci. 2017, 96, 1290–1297. [CrossRef]
34. Chen, X.; Horn, N.; Applegate, T.J. Efficiency of hydrated sodium calcium aluminosilicate to ameliorate the adverse effects ofgraded levels of aflatoxin B1 in broiler chicks. Poult. Sci. 2014, 93, 2037–2047. [CrossRef] [PubMed]
35. Chen, Y.P.; Cheng, Y.F.; Li, X.H.; Yang, W.L.; Wen, C.; Zhuang, S.; Zhou, Y.M. Effects of threonine supplementation on the growthperformance, immunity, oxidative status, intestinal integrity, and barrier function of broilers at the early age. Poult. Sci. 2017, 96,405–413. [CrossRef] [PubMed]
36. Dänicke, S.; Matthes, S.; Halle, I.; Ueberschär, K.H.; Döll, S.; Valenta, H. Effects of graded levels of Fusarium toxin-contaminatedwheat and of a detoxifying agent in broiler diets on performance, nutrient digestibility and blood chemical parameters. Br. Poult.Sci. 2003, 44, 113–126. [CrossRef] [PubMed]
37. Diaz, G.J.; Cortés, A.; Roldán, L. Evaluation of the efficacy of four feed additives against the adverse effects of T-2 toxin in growingbroiler chickens. J. Appl. Poult. Res. 2005, 14, 226–231. [CrossRef]
38. Hanif, N.Q.; Muhammad, G.; Siddique, M.; Khanum, A.; Ahmed, T.; Gadahai, J.A.; Kaukab, G. Clinico-pathomorphological,serum biochemical and histological studies in broilers fed ochratoxin A and a toxin deactivator (Mycofix® Plus). Br. Poult. Sci.2008, 49, 632–642. [CrossRef]
39. Giambrone, J.J.; Diener, U.L.; Davis, N.D.; Panangala, V.S.; Hoerr, F.J. Effects of aflatoxin on young turkeys and broiler chickens.Poult. Sci. 1985, 64, 1678–1684. [CrossRef]
40. Smith, J.W.; Hamilton, P.B. Aflatoxicosis in the broiler chicken. Poult. Sci. 1970, 49, 207–215. [CrossRef]41. Kidd, M.T.; Kerr, B.J.; Anthony, N.B. Dietary Interactions between Lysine and Threonine in Broilers. Poult. Sci. 1997, 76, 608–614.
[CrossRef]42. Shannon, T.A.; Ledoux, D.R.; Rottinghaus, G.E.; Shaw, D.P.; Dakovic, A.; Markovic, M. The efficacy of raw and concentrated
bentonite clay in reducing the toxic effects of aflatoxin in broiler chicks. Poult. Sci. 2017, 96, 1651–1658. [CrossRef]43. Tedesco, D.; Steidler, S.; Galletti, S.; Tameni, M.; Sonzogni, O.; Ravarotto, L. Efficacy of silymarin-phospholipid complex in
reducing the toxicity of aflatoxin B1 in broiler chicks. Poult. Sci. 2004, 83, 1839–1843. [CrossRef]44. Aravind, K.L.; Patil, V.S.; Devegowda, G.; Umakantha, B.; Ganpule, S.P. Efficacy of esterified glucomannan to counteract
mycotoxicosis in naturally contaminated feed on performance and serum biochemical and hematological parameters in broilers.Poult. Sci. 2003, 82, 571–576. [CrossRef]
45. Gowda, N.K.S.; Ledoux, D.R.; Rottinghaus, G.E.; Bermudez, A.J.; Chen, Y.C. Efficacy of turmeric (Curcuma longa), containing aknown level of curcumin, and a hydrated sodium calcium aluminosilicate to ameliorate the adverse effects of aflatoxin in broilerchicks. Poult. Sci. 2008, 87, 1125–1130. [CrossRef] [PubMed]
46. Keçeci, T.; Oguz, H.; Kurtoglu, V.; Demet, Ö. Effects of polyvinylpolypyrrolidone, synthetic zeolite and bentonite on serumbiochemical and haematological characters of broiler chickens during aflatoxicosis. Br. Poult. Sci. 1998, 39, 452–458. [CrossRef]
47. Kubena, L.F.; Harvey, R.B.; Bailey, R.H.; Buckley, S.A.; Rottinghaus, G.E. Effects of a Hydrated Sodium Calcium Aluminosilicate(T-BindTM) on Mycotoxicosis in Young Broiler Chickens. Poult. Sci. 1998, 77, 1502–1509. [CrossRef] [PubMed]
48. Kolbadinejad, A.; Rezaeipour, V. Efficacy of ajwain (Trachyspermum ammi L.) seed at graded levels of dietary threonine ongrowth performance, serum metabolites, intestinal morphology and microbial population in broiler chickens. J. Anim. Physiol.Anim. Nutr. 2020, 104, 1333–1342. [CrossRef]
49. Sigolo, S.; Zohrabi, Z.; Gallo, A.; Seidavi, A.; Prandini, A. Effect of a low crude protein diet supplemented with different levels ofthreonine on growth performance, carcass traits, blood parameters, and immune responses of growing broilers. Poult. Sci. 2017,96, 2751–2760. [CrossRef]
50. Wang, W.; Yeung, K.W.K. Bone grafts and biomaterials substitutes for bone defect repair: A review. Bioact. Mater. 2017, 2, 224–247.[CrossRef]
51. Cho, Y.-E.; Lomeda, R.-A.R.; Ryu, S.-H.; Sohn, H.-Y.; Shin, H.-I.; Beattie, J.H.; Kwun, I.-S. Zinc deficiency negatively affects alkalinephosphatase and the concentration of Ca, Mg and P in rats. Nutr. Res. Pract. 2007, 1, 113. [CrossRef]
52. Dos Anjos, F.R.; Ledoux, D.R.; Rottinghaus, G.E.; Chimonyo, M. Efficacy of adsorbents (bentonite and diatomaceous earth) andturmeric (Curcuma longa) in alleviating the toxic effects of aflatoxin in chicks. Br. Poult. Sci. 2015, 56, 459–469. [CrossRef]

Toxins 2022, 14, 192 23 of 23
53. Matur, E.; Ergul, E.; Akyazi, I.; Eraslan, E.; Inal, G.; Bilgic, S.; Demircan, H. Effects of Saccharomyces cerevisiae extract onhaematological parameters, immune function and the antioxidant defence system in breeder hens fed aflatoxin contaminateddiets. Br. Poult. Sci. 2011, 52, 541–550. [CrossRef]
54. Andretta, I.; Kipper, M.; Lehnen, C.R.; Lovatto, P.A. Meta-analysis of the relationship of mycotoxins with biochemical andhematological parameters in broilers. Poult. Sci. 2012, 91, 376–382. [CrossRef] [PubMed]
55. Yunus, A.W.; Böhm, J. Temporary modulation of responses to common vaccines and serum cation status in broilers duringexposure to low doses of aflatoxin B1. Poult. Sci. 2013, 92, 2899–2903. [CrossRef] [PubMed]
56. Tuekam, T.D.; Miles, R.D.; Butcher, G.D. Performance and cell-mediated and humoral immune responses in broilers fed anaflatoxin supplemented diet. J. Appl. Anim. Res. 1994, 6, 27–35. [CrossRef]
57. Mahajan, A.; Katoch, R.C.; Chahota, R.; Verma, S.; Manuja, S. Concurrent outbreak of infectious bursal disease (IBD), aflatoxicosisand secondary microbial infection in broiler chicks. Vet. Arh. 2002, 72, 81–90.
58. Ghareeb, K.; Awad, W.A.; Böhm, J. Ameliorative effect of a microbial feed additive on infectious bronchitis virus antibody titerand stress index in broiler chicks fed deoxynivalenol. Poult. Sci. 2012, 91, 800–807. [CrossRef]
59. Ji, S.; Qi, X.; Ma, S.; Liu, X.; Min, Y. Effects of Dietary Threonine Levels on Intestinal Immunity and Antioxidant Capacity Basedon Cecal Metabolites and Transcription Sequencing of Broiler. Animals 2019, 9, 739. [CrossRef]
60. Applegate, T.J.; Schatzmayr, G.; Pricket, K.; Troche, C.; Jiang, Z. Effect of aflatoxin culture on intestinal function and nutrient lossin laying hens. Poult. Sci. 2009, 88, 1235–1241. [CrossRef]
61. Chen, X.; Naehrer, K.; Applegate, T.J. Interactive effects of dietary protein concentration and aflatoxin B1 on performance, nutrientdigestibility, and gut health in broiler chicks. Poult. Sci. 2016, 95, 1312–1325. [CrossRef]
62. Association of the Official Analytical Chemists. Animal Feed. In Official Methods of Analysis, 15th ed.; Helrich, K., Padmore, J.M.,Eds.; Association of the Official Analytical Chemists: Arlington, TX, USA, 1990; pp. 69–90.
63. Shotwell, O.L.; Hesseltine, C.W.; Stubblefield, R.D.; Sorenson, W.G. Production of aflatoxin on rice. Appl. Microbiol. 1966, 14,425–428. [CrossRef]
64. Mazaheri, M. Determination of aflatoxins in imported rice to Iran. Food Chem. Toxicol. 2009, 47, 2064–2066. [CrossRef]65. Adler, C.; Tiemann, I.; Hillemacher, S.; Schmithausen, A.J.; Müller, U.; Heitmann, S.; Spindler, B.; Kemper, N.; Büscher, W. Effects
of a partially perforated flooring system on animal-based welfare indicators in broiler housing. Poult. Sci. 2020, 99, 3343–3354.[CrossRef] [PubMed]
66. Abo Ghanima, M.M.; Abd El-Hack, M.E.; Othman, S.I.; Taha, A.E.; Allam, A.A.; Eid Abdel-Moneim, A.M. Impact of differentrearing systems on growth, carcass traits, oxidative stress biomarkers, and humoral immunity of broilers exposed to heat stress.Poult. Sci. 2020, 99, 3070–3078. [CrossRef] [PubMed]
67. Friedewald, W.T.; Levy, R.I.; Fredrickson, D.S. Estimation of the concentration of low-density lipoprotein cholesterol in plasma,without use of the preparative ultracentrifuge. Clin. Chem. 1972, 18, 499–502. [CrossRef]
68. Zulkifli, I.; Norma, M.T.C.; Chong, C.H.; Loh, T.C. Heterophil to lymphocyte ratio and tonic immobility reactions to preslaughterhandling in broiler chickens treated with ascorbic acid. Poult. Sci. 2000, 79, 402–406. [CrossRef] [PubMed]
69. Castellini, C.; Mugnai, C.; Dal Bosco, A. Effect of organic production system on broiler carcass and meat quality. Meat Sci. 2002,60, 219–225. [CrossRef]
70. Hafeez, A.; Mader, A.; Boroojeni, F.G.; Ruhnke, I.; Röhe, I.; Männer, K.; Zentek, J. Impact of thermal and organic acid treatment offeed on apparent ileal mineral absorption, tibial and liver mineral concentration, and tibia quality in broilers. Poult. Sci. 2014, 93,1754–1763. [CrossRef] [PubMed]
71. Yair, R.; Shahar, R.; Uni, Z. In ovo feeding with minerals and vitamin D3 improves bone properties in hatchlings and maturebroilers. Poult. Sci. 2015, 94, 2695–2707. [CrossRef] [PubMed]
72. Walk, C.L.; Rama Rao, S.V. Dietary phytate has a greater anti-nutrient effect on feed conversion ratio compared to body weightgain and greater doses of phytase are required to alleviate this effect as evidenced by prediction equations on growth performance,bone ash and phytate degradation in broilers. Poult. Sci. 2020, 99, 246–255. [CrossRef]
73. Brenes, A.; Viveros, A.; Arija, I.; Centeno, C.; Pizarro, M.; Bravo, C. The effect of citric acid and microbial phytase on mineralutilization in broiler chicks. Anim. Feed Sci. Technol. 2003, 110, 201–219. [CrossRef]
74. Latorre, J.D.; Hernandez-Velasco, X.; Vicente, J.L.; Wolfenden, R.; Hargis, B.M.; Tellez, G. Effects of the inclusion of a Bacillusdirect-fed microbial on performance parameters, bone quality, recovered gut microflora, and intestinal morphology in broilersconsuming a grower diet containing corn distillers dried grains with solubles. Poult. Sci. 2017, 96, 2728–2735. [CrossRef]
75. Sakamoto, K.; Hirose, H.; Onizuka, A.; Hayashi, M.; Futamura, N.; Kawamura, Y.; Ezaki, T. Quantitative study of changes inintestinal morphology and mucus gel on total parenteral nutrition in rats. J. Surg. Res. 2000, 94, 99–106. [CrossRef] [PubMed]
![Binder 216, Terminology [Trematoda Taxon Notebooks]](https://static.fdokumen.com/doc/165x107/63338ab23108fad7760f19c8/binder-216-terminology-trematoda-taxon-notebooks.jpg)