EFFECT OF ASYMMETRY AND ROUGHNESS OF STENOSIS ON NON-NEWTONIAN FLOW PAST AN ARTERIAL SEGMENT
28
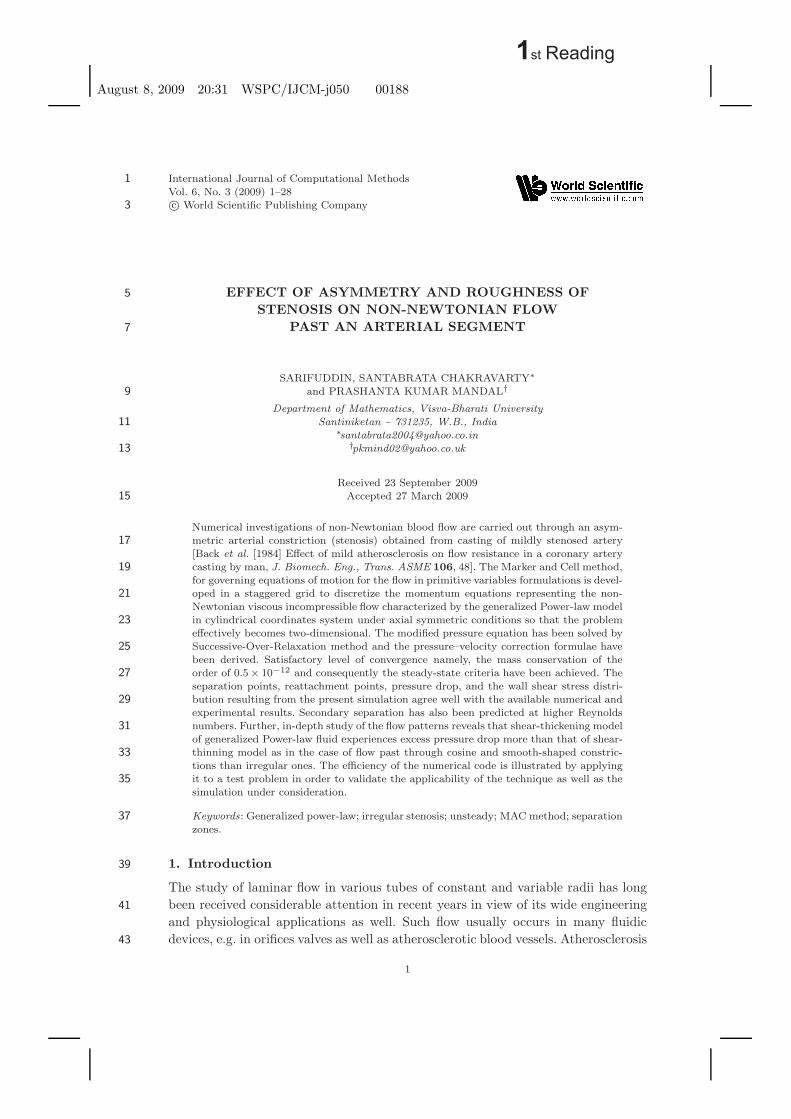
1st Reading August 8, 2009 20:31 WSPC/IJCM-j050 00188 International Journal of Computational Methods 1 Vol. 6, No. 3 (2009) 1–28 c World Scientific Publishing Company 3 EFFECT OF ASYMMETRY AND ROUGHNESS OF 5 STENOSIS ON NON-NEWTONIAN FLOW PAST AN ARTERIAL SEGMENT 7 SARIFUDDIN, SANTABRATA CHAKRAVARTY ∗ and PRASHANTA KUMAR MANDAL † 9 Department of Mathematics, Visva-Bharati University Santiniketan – 731235, W.B., India 11 ∗ [email protected] † [email protected] 13 Received 23 September 2009 Accepted 27 March 2009 15 Numerical investigations of non-Newtonian blood flow are carried out through an asym- metric arterial constriction (stenosis) obtained from casting of mildly stenosed artery 17 [Back et al. [1984] Effect of mild atherosclerosis on flow resistance in a coronary artery casting by man, J. Biomech. Eng., Trans. ASME 106, 48]. The Marker and Cell method, 19 for governing equations of motion for the flow in primitive variables formulations is devel- oped in a staggered grid to discretize the momentum equations representing the non- 21 Newtonian viscous incompressible flow characterized by the generalized Power-law model in cylindrical coordinates system under axial symmetric conditions so that the problem 23 effectively becomes two-dimensional. The modified pressure equation has been solved by Successive-Over-Relaxation method and the pressure–velocity correction formulae have 25 been derived. Satisfactory level of convergence namely, the mass conservation of the order of 0.5 × 10 −12 and consequently the steady-state criteria have been achieved. The 27 separation points, reattachment points, pressure drop, and the wall shear stress distri- bution resulting from the present simulation agree well with the available numerical and 29 experimental results. Secondary separation has also been predicted at higher Reynolds numbers. Further, in-depth study of the flow patterns reveals that shear-thickening model 31 of generalized Power-law fluid experiences excess pressure drop more than that of shear- thinning model as in the case of flow past through cosine and smooth-shaped constric- 33 tions than irregular ones. The efficiency of the numerical code is illustrated by applying it to a test problem in order to validate the applicability of the technique as well as the 35 simulation under consideration. Keywords : Generalized power-law; irregular stenosis; unsteady; MAC method; separation 37 zones. 1. Introduction 39 The study of laminar flow in various tubes of constant and variable radii has long been received considerable attention in recent years in view of its wide engineering 41 and physiological applications as well. Such flow usually occurs in many fluidic devices, e.g. in orifices valves as well as atherosclerotic blood vessels. Atherosclerosis 43 1
-
Upload
independent -
Category
Documents
-
view
0 -
download
0
Transcript of EFFECT OF ASYMMETRY AND ROUGHNESS OF STENOSIS ON NON-NEWTONIAN FLOW PAST AN ARTERIAL SEGMENT
1st Reading
August 8, 2009 20:31 WSPC/IJCM-j050 00188
International Journal of Computational Methods1Vol. 6, No. 3 (2009) 1–28c© World Scientific Publishing Company3
EFFECT OF ASYMMETRY AND ROUGHNESS OF5
STENOSIS ON NON-NEWTONIAN FLOWPAST AN ARTERIAL SEGMENT7
SARIFUDDIN, SANTABRATA CHAKRAVARTY∗and PRASHANTA KUMAR MANDAL†9
Department of Mathematics, Visva-Bharati UniversitySantiniketan – 731235, W.B., India11
∗[email protected]†[email protected]
Received 23 September 2009Accepted 27 March 200915
Numerical investigations of non-Newtonian blood flow are carried out through an asym-metric arterial constriction (stenosis) obtained from casting of mildly stenosed artery17[Back et al. [1984] Effect of mild atherosclerosis on flow resistance in a coronary arterycasting by man, J. Biomech. Eng., Trans. ASME 106, 48]. The Marker and Cell method,19for governing equations of motion for the flow in primitive variables formulations is devel-oped in a staggered grid to discretize the momentum equations representing the non-21Newtonian viscous incompressible flow characterized by the generalized Power-law modelin cylindrical coordinates system under axial symmetric conditions so that the problem23effectively becomes two-dimensional. The modified pressure equation has been solved bySuccessive-Over-Relaxation method and the pressure–velocity correction formulae have25been derived. Satisfactory level of convergence namely, the mass conservation of theorder of 0.5× 10⁻¹² and consequently the steady-state criteria have been achieved. The27separation points, reattachment points, pressure drop, and the wall shear stress distri-bution resulting from the present simulation agree well with the available numerical and29experimental results. Secondary separation has also been predicted at higher Reynoldsnumbers. Further, in-depth study of the flow patterns reveals that shear-thickening model31of generalized Power-law fluid experiences excess pressure drop more than that of shear-thinning model as in the case of flow past through cosine and smooth-shaped constric-33tions than irregular ones. The efficiency of the numerical code is illustrated by applyingit to a test problem in order to validate the applicability of the technique as well as the35simulation under consideration.
Keywords: Generalized power-law; irregular stenosis; unsteady; MAC method; separation37zones.
1. Introduction39
The study of laminar flow in various tubes of constant and variable radii has longbeen received considerable attention in recent years in view of its wide engineering41
and physiological applications as well. Such flow usually occurs in many fluidicdevices, e.g. in orifices valves as well as atherosclerotic blood vessels. Atherosclerosis43
1
1st Reading
August 8, 2009 20:31 WSPC/IJCM-j050 00188
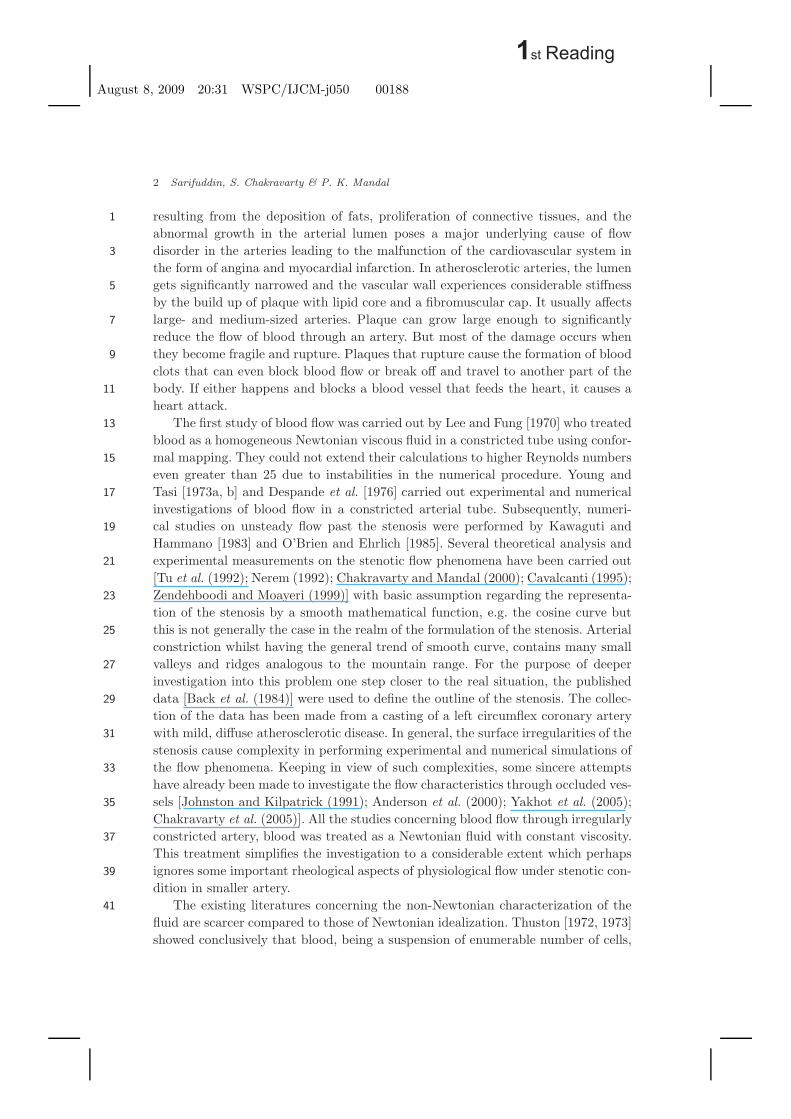
2 Sarifuddin, S. Chakravarty & P. K. Mandal
resulting from the deposition of fats, proliferation of connective tissues, and the1
abnormal growth in the arterial lumen poses a major underlying cause of flowdisorder in the arteries leading to the malfunction of the cardiovascular system in3
the form of angina and myocardial infarction. In atherosclerotic arteries, the lumengets significantly narrowed and the vascular wall experiences considerable stiffness5
by the build up of plaque with lipid core and a fibromuscular cap. It usually affectslarge- and medium-sized arteries. Plaque can grow large enough to significantly7
reduce the flow of blood through an artery. But most of the damage occurs whenthey become fragile and rupture. Plaques that rupture cause the formation of blood9
clots that can even block blood flow or break off and travel to another part of thebody. If either happens and blocks a blood vessel that feeds the heart, it causes a11
heart attack.The first study of blood flow was carried out by Lee and Fung [1970] who treated13
blood as a homogeneous Newtonian viscous fluid in a constricted tube using confor-mal mapping. They could not extend their calculations to higher Reynolds numbers15
even greater than 25 due to instabilities in the numerical procedure. Young andTasi [1973a, b] and Despande et al. [1976] carried out experimental and numerical17
investigations of blood flow in a constricted arterial tube. Subsequently, numeri-cal studies on unsteady flow past the stenosis were performed by Kawaguti and19
Hammano [1983] and O’Brien and Ehrlich [1985]. Several theoretical analysis andexperimental measurements on the stenotic flow phenomena have been carried out21
[Tu et al. (1992); Nerem (1992); Chakravarty and Mandal (2000); Cavalcanti (1995);Zendehboodi and Moayeri (1999)] with basic assumption regarding the representa-23
tion of the stenosis by a smooth mathematical function, e.g. the cosine curve butthis is not generally the case in the realm of the formulation of the stenosis. Arterial25
constriction whilst having the general trend of smooth curve, contains many smallvalleys and ridges analogous to the mountain range. For the purpose of deeper27
investigation into this problem one step closer to the real situation, the publisheddata [Back et al. (1984)] were used to define the outline of the stenosis. The collec-29
tion of the data has been made from a casting of a left circumflex coronary arterywith mild, diffuse atherosclerotic disease. In general, the surface irregularities of the31
stenosis cause complexity in performing experimental and numerical simulations ofthe flow phenomena. Keeping in view of such complexities, some sincere attempts33
have already been made to investigate the flow characteristics through occluded ves-sels [Johnston and Kilpatrick (1991); Anderson et al. (2000); Yakhot et al. (2005);35
Chakravarty et al. (2005)]. All the studies concerning blood flow through irregularlyconstricted artery, blood was treated as a Newtonian fluid with constant viscosity.37
This treatment simplifies the investigation to a considerable extent which perhapsignores some important rheological aspects of physiological flow under stenotic con-39
dition in smaller artery.The existing literatures concerning the non-Newtonian characterization of the41
fluid are scarcer compared to those of Newtonian idealization. Thuston [1972, 1973]showed conclusively that blood, being a suspension of enumerable number of cells,
1st Reading
August 8, 2009 20:31 WSPC/IJCM-j050 00188
Effect of Asymmetry and Roughness of Stenosis 3
may be treated as non-Newtonian (viscoelastic) fluid when the shear rate is low1
in the case of the flow in smaller arteries and in the downstream of the stenosis.However, viscoelasticity of blood diminishes very rapidly as shear rate rises and3
at physiological hematocrit values (45%) as propounded by McMillan et al. [1986].This suggested that viscoelasticity has a secondary impact on normal physiological5
flow. Non-Newtonian fluids are broad class of fluids in which the relation connectingthe shear stress and the shear rate is not linear and hence no single constitutive7
relation possesses the potentiality to predict all kinds of non-Newtonian behavior ofthe fluid flowing in various situations. In an extensive study, Easthope and Brooks9
[1980] found that the fluid rheological model framed by Walburn and Schneck [1976]reducable to the familiar Power-law relationship, is highly effective in modeling11
blood flow. Khanafer et al. [2006] indicated that the velocity fields were significantlyinfluenced by non-Newtonian properties in pathologically altered configurations and13
non-Newtonian fluid shear stress was found to be greater than Newtonian fluidshear stress during systole. For the purpose of connecting the relationship between15
the arterial wall geometries and hemodynamics of the streaming blood, the recenttheoretical modeling of microscale biological phenomena in human coronary arteries17
was successfully studied by Wong et al. [2006] who predicted flow properties forgeometrically complex pathology at microscale levels. Very recently, Mandal [2005],19
Sarifuddin et al. [2008] and Mandal et al. [2007a, b] concluded from their theoreticalinvestigations that the non-Newtonian rheology of the streaming blood affects the21
flow characteristic significantly.Keeping in view of the above-mentioned characteristics of the flow under con-23
stricted condition, we consider a stenosed arterial flow study in which the streamingblood is treated to be a generalized Power-law fluid that includes both the shear-25
thinning and shear-thickening characteristics of blood rheology. Malek et al. [1995,1996] extensively studied the existence and uniqueness as well as the stability char-27
acteristics of such flow problems. Although the present paper does not deal with theexistence of the flow characterized by generalized Power-law fluid, the already cited29
references [Malek et al. (1995), (1996)] bear the foundation to make an attemptsafely to explore the flow characteristics of the streaming blood. The arterial wall is31
considered to be rigid having differently shaped stenoses in its lumen arising fromthe formation of various types of abnormal growth or plaque. The assumption of33
wall rigidity may not seriously affect the flow since the development of atheroscle-rosis in arteries causes a significant reduction in the distensibility of its wall. It is, of35
course, evident from the observation of Nerem [1992] that the vessel wall can safelybe assumed to be rigid. The Navier–Stokes equations governing the unsteady flow37
phenomena are solved numerically by Marker and Cell (MAC) method primarilyintroduced by Harlow and Welch [1965] and achieved desired accuracy. The pri-39
mary objective of the present study is to explore the effects of some essential issueslike flow unsteadiness, different stenosis shapes, Reynolds number, and Power-law41
model parameters on the velocity profile of the blood stream and on the wall shearstresses quantitatively so as to validate the applicability of the present model with
1st Reading
August 8, 2009 20:31 WSPC/IJCM-j050 00188
4 Sarifuddin, S. Chakravarty & P. K. Mandal
reference to the latest findings in the literature. The novelty of the present study is1
the treatment of generalized Power-law model characterising blood rheology in gen-eral and the choice of differently shaped stenosis models, in particular resembling a3
step closer to the physiological situation.
2. Governing Equations5
The streaming fluid representing blood is generally considered as a generalizedPower-law fluid having both shear-thinning and shear-thickening characteristicsof rheology. The fluid flow through an axisymmetric stenosis can be simulated intwo dimensions by making use of cylindrical coordinate system. The dimensionlessNavier–Stokes equations and the equation of continuity for the present system inthe unsteady state may be written in conservative form as
∂w
∂t+
∂(wu)∂r
+∂w2
∂z+
(wu)r
= −∂p
∂z− 1
Re
[1r
∂(rτrz)∂r
+∂τzz
∂z
], (1)
∂u
∂t+
∂u2
∂r+
∂(wu)∂z
+u2
r= −∂p
∂r− 1
Re
[1r
∂(rτrr)∂r
+∂τrz
∂z
], (2)
and
r∂w
∂z+
∂(ur)∂r
= 0, (3)
with
τzz = −2
∣∣∣∣∣∣[2
(∂u
∂r
)2
+ 2(u
r
)2
+ 2(
∂w
∂z
)2
+(
∂u
∂z+
∂w
∂r
)2] 1
2
∣∣∣∣∣∣n−1
(∂w
∂z
),
(4)
τrr = −2 {· · ·}(
∂u
∂r
), (5)
τrz = −{· · ·}(
∂w
∂r+
∂u
∂z
), (6)
where r and z are the dimensionless coordinates, scaled with respect to r0, with thez-axis located along the symmetry axis of the artery. As there is no secondary or7
rotational flow so the total velocity is defined by the dimensionless radial and axialcomponents, u and w scaled with respect to the cross-sectional average velocity9
U0. The generalized Reynolds number Re, and the dimensionless pressure may bedefined as11
Re =ρU0
2−nr0n
m, p =
p′
ρU20
, (7)
in which ρ is the density of fluid, p′ the pressure and, m and n being, respectively,13
the consistency and power indices of the Power-law model.
1st Reading
August 8, 2009 20:31 WSPC/IJCM-j050 00188
Effect of Asymmetry and Roughness of Stenosis 5
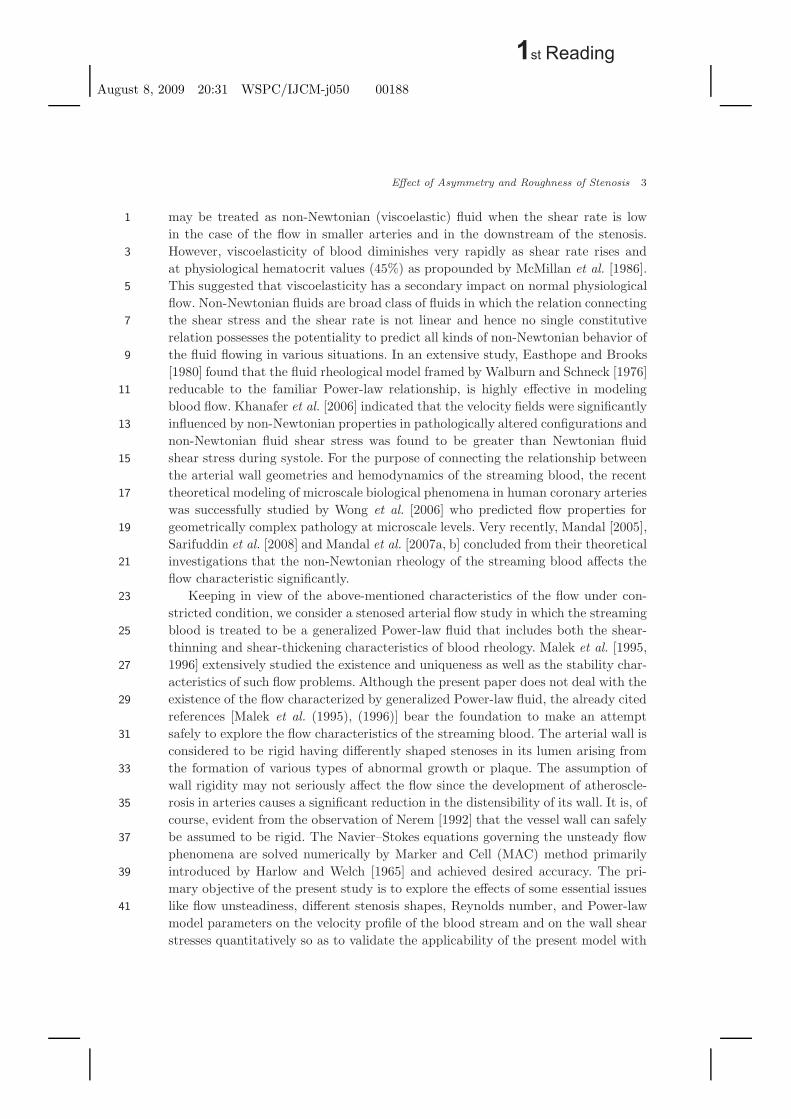
Fig. 1. Comparison of three different stenosis models.
Three differently shaped models of stenosis having 48% areal occlusion each1
shown in Fig. 1 have been examined. The first profile of the stenosis consideredhere is the straight axisymmetric model of Back et al. [1984] mimicing real surface3
irregularities since the actual variation of the cross-sectional area of a left circumflexcoronary artery casting from a human cadaver is retained. This stenosis is not5
symmetric with respect to its narrowest point. The second geometrical model of thestenosis considered is the most conventional use of cosine curve7
R(z) =
1 − δ
2r0[1 + cos{π(z − z1)/z0}], d ≤ z ≤ d + 2z0,
1, otherwise,(8)
where z0 is the half length, δ, the maximum width, and z1 the center of the stenosis9
with δ = 0.276r0, r0 being the unconstricted radius of the stenosed artery. Finally,a new stenosis model is investigated similar to the irregular stenosis model having11
no surface irregularities or roughness elements. Thus this model can be treated assmooth, but in contrast to the cosine-shaped model, the profile of stenosis is no13
longer symmetric about its narrowest point.
3. Boundary and Initial Conditions15
The velocity boundary conditions on the tube wall treated to be rigid are the usualno-slip conditions given by17
w(z, r, t) = 0 = u(z, r, t) on r = R(z). (9)
Along the axis of symmetry, the normal component of velocity and shear stress19
vanish which may be stated mathematically as
∂w(z, r, t)∂r
= 0 = u(z, r, t) on r = 0. (10)21
1st Reading
August 8, 2009 20:31 WSPC/IJCM-j050 00188
6 Sarifuddin, S. Chakravarty & P. K. Mandal
The inlet velocity conditions were assumed to have a parabolic velocity profile1
corresponding to Hagen–Poiseuille flow through a long circular tube as
w(z, r, t) =(
1 − r2
R2
), u(z, r, t) = 0 at z = 0, (11)
3
and the outlet conditions are given by
∂w
∂z= 0 =
∂u
∂zat z = L. (12)5
L being the length of the constricted tube under consideration. Moreover, it isassumed that initially no flow takes place when the system is at rest except at the7
inlet, that means,
w(z, r, 0) = 0 = u(z, r, 0), p(z, r, 0) = 0 for z > 0. (13)9
4. Radial Coordinate Transformation
In order to avoid interpolation error while discretizing the governing equations, weuse a suitable coordinate transformation to map the constricted domain into a rect-angular one. Equations (1)–(6) together with the boundary and initial conditions(9)–(13) are transformed by the introduction of new variable
x =r
R(z)as
∂w
∂t= − 1
R
∂(wu)∂x
− ∂w2
∂z+
x
R
∂w2
∂x
dR
dz− wu
xR− ∂p
∂z+
x
R
∂p
∂x
dR
dz
− 1Re
[1R
∂τxz
∂x+
τxz
xR+
∂τzz
∂z− x
R
∂τzz
∂x
dR
dz
], (14)
∂u
∂t= − 1
R
∂u2
∂x− ∂(wu)
∂z+
x
R
∂(wu)∂x
dR
dz− u2
xR− 1
R
∂p
∂x
− 1Re
[1R
∂τxx
∂x+
τxx
xR+
∂τxz
∂z− x
R
∂τxz
∂x
dR
dz
], (15)
xR∂w
∂z− x2 ∂w
∂x
dR
dz+
∂(ux)∂x
= 0, (16)11
where
τzz = −2
∣∣∣∣∣∣[2
(1R
∂u
∂x
)2
+ 2( u
xR
)2
+ 2(
∂w
∂z− x
R
∂w
∂x
dR
dz
)2
+(
∂u
∂z− x
R
∂u
∂x
dR
dz+
1R
∂w
∂x
)2] 1
2
∣∣∣∣∣∣n−1
(∂w
∂z− x
R
∂w
∂x
dR
dz
), (17)
1st Reading
August 8, 2009 20:31 WSPC/IJCM-j050 00188
Effect of Asymmetry and Roughness of Stenosis 7
τxx = −2 {· · ·}(
1R
∂u
∂x
), (18)
τxz = −{· · ·}(
∂u
∂z− x
R
∂u
∂x
dR
dz+
1R
∂w
∂x
)(19)
and
w(z, x, t) = 0 = u(z, x, t) at x = 1, (20)
∂w(z, x, t)∂x
= 0 = u(z, x, t) on x = 0, (21)
w(z, x, t) = (1 − x2), u(z, x, t) = 0 at z = 0, (22)
∂w(z, x, t)∂z
= 0 =∂u(z, x, t)
∂zat z = L, (23)
and finally1
w(z, x, 0) = 0 = u(z, x, 0), p(z, x, 0) = 0 for z > 0. (24)
5. The MAC Methodology3
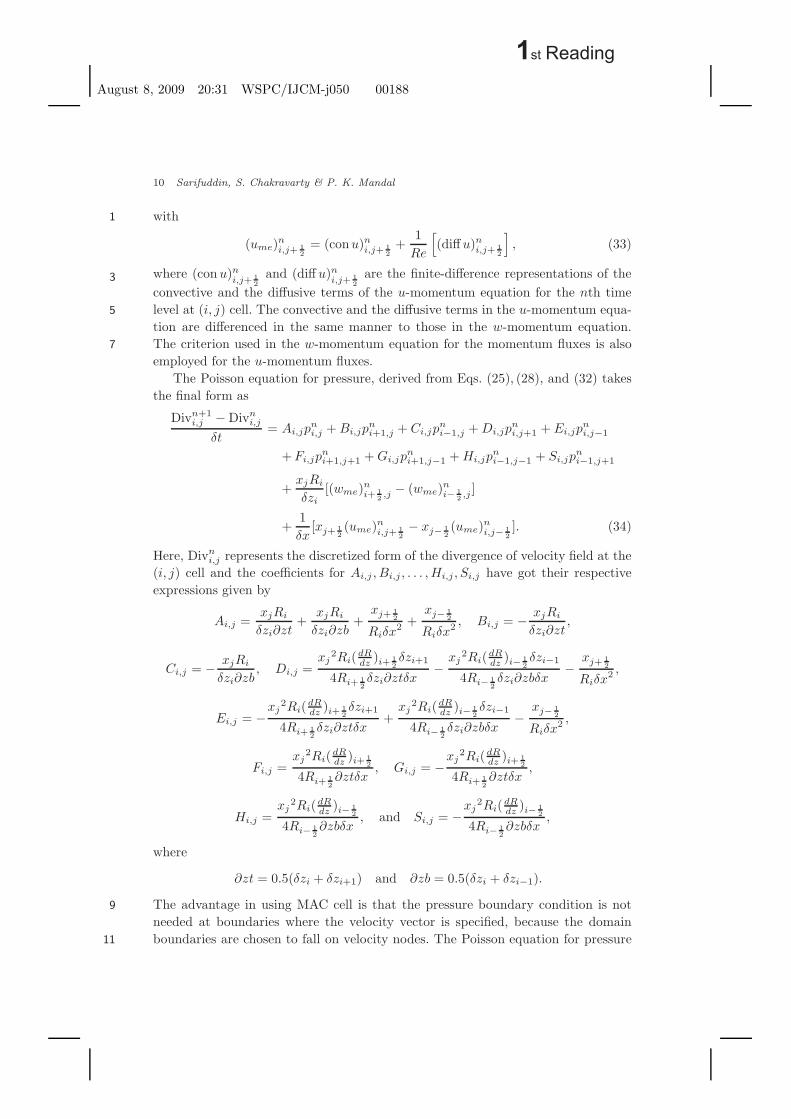
The above governing equations along with the set of initial and boundary condi-tions are solved numerically by finite-difference method in nonuniform grid alongthe axis of symmetry. Control volume-based finite-difference discretization of thoseequations is carried out in staggered grid. In this type of grid alignment, the veloci-ties and pressure are calculated at different locations of the control volume as indi-cated in Fig. 2 while the difference equations have been derived in three distinctcells corresponding to the continuity equation, the axial momentum, and the radial
Fig. 2. A typical MAC model.
1st Reading
August 8, 2009 20:31 WSPC/IJCM-j050 00188
8 Sarifuddin, S. Chakravarty & P. K. Mandal
momentum equations. The discretizations of the time derivative terms are basedon the first-order accurate two-level forward time differencing formula while thosefor the convective terms in the momentum equations are accorded with a hybridformula consisting of central differencing and second-order upwinding. The diffusiveterms are however discretized by second-order accurate three-point central differ-ence formula. Thus in a finite-difference formula with x = jδx, z = iδzi, t = nδt,and p(z, x, t) = p(iδzi, jδx, nδt) = pn
i,j in which n refers to the time direction, δt,the time increment, and δzi, δx are the respective width and length of the (i, j)thcell of the control volume. The discretized version of the continuity equation (16)at the (i, j) cell becomes
xjRi
δzi(wn
i+ 12 ,j − wn
i− 12 ,j) −
(xj)2
δx(wn
i,j+ 12− wn
i,j− 12)(
dR
dz
)i
+1δx
(xj+ 12un
i,j+ 12− xj− 1
2un
i,j− 12) = 0, (25)
where
wni,j+ 1
2= 0.25(wn
i− 12 ,j + wn
i+ 12 ,j + wn
i− 12 ,j+1 + wn
i+ 12 ,j+1), (26)
wni,j− 1
2= 0.25(wn
i− 12 ,j + wn
i+ 12 ,j + wn
i− 12 ,j−1 + wn
i+ 12 ,j−1). (27)
Here (zi, xj) and (zi+ 12, xj+ 1
2) represent the respective coordinates of the cell center
and the cell top right corner of the (i, j)th control volume (cf. Fig. 2). Consideringthe source, convective, and diffusion terms at the nth time level, the momentumequation in z-direction may be put to the form
wn+1i+ 1
2 ,j− wn
i+ 12 ,j
δt=
pni,j − pn
i+1,j
0.5(δzi + δzi+1)+
xj
Ri+ 12
(dR
dz
)i+ 1
2
×(pn
i+ 12 ,j+ 1
2− pn
i+ 12 ,j− 1
2)
δx+ (wme)n
i+ 12 ,j , (28)
in which pni+ 1
2 ,j+ 12
and pni+ 1
2 ,j− 12
designate the pressure at the top and bottom1
positions of the right face of MAC cell, respectively, and (wme)ni+ 1
2 ,jconsisting of
the convective and diffusive terms of the w-momentum at the nth time level at (i, j)3
cell may be written as
(wme)ni+ 1
2 ,j = (conw)ni+ 1
2 ,j +1
Re[(diff w)n
i+ 12 ,j], (29)5
where
(con w)ni+ 1
2 ,j = − 1Ri+ 1
2
[(1 − β)
(wni+ 1
2 ,j+ 12un
i+ 12 ,j+ 1
2− wn
i+ 12 ,j− 1
2un
i+ 12 ,j− 1
2)
δx
+ β(un
i+ 12 ,j+ 1
2φwt − un
i+ 12 ,j− 1
2φwb
)
δx
]−
[(1 − β)
((w2)ni+1,j − (w2)n
i,j)0.5(δzi + δzi+1)
1st Reading
August 8, 2009 20:31 WSPC/IJCM-j050 00188
Effect of Asymmetry and Roughness of Stenosis 9
+ β(wn
i+1,jφwr − wni,jφwl
)0.5(δzi + δzi+1)
]−
wni+ 1
2 ,jun
i+ 12 ,j
xjRi+ 12
+xj
Ri+ 12
(dR
dz
)i+ 1
2
[(1 − β)
((w2)ni+ 1
2 ,j+ 12− (w2)n
i+ 12 ,j− 1
2)
δx
+ β(wn
i+ 12 ,j+ 1
2φwt − wn
i+ 12 ,j− 1
2φwb
)
δx
], (30)
and the expressions for momentum fluxes φwt , φwb, φwr , φwl
appearing in (30)1
passing through the interface of the control volume depending on the sign of thevelocities at the interface, are defined as follows3
if wni+1,j ≥ 0, φwr = wn
i+ 12 ,j
; if wni+1,j < 0, φwr = wn
i+ 32 ,j
;
if wni,j ≥ 0, φwl
= wni− 1
2 ,j; if wn
i,j < 0, φwl= wn
i+ 12 ,j
;
if uni+ 1
2 ,j+ 12≥ 0, φwt = wn
i+ 12 ,j
; if uni+ 1
2 ,j+ 12
< 0, φwt = wni+ 1
2 ,j+1;
if uni+ 1
2 ,j− 12≥ 0, φwb
= wni+ 1
2 ,j−1; if un
i+ 12 ,j− 1
2< 0, φwb
= wni+ 1
2 ,j;
and
(diff w)ni+ 1
2 ,j = −[
1Ri+ 1
2
(∂τxz
∂x
)n
i+ 12 ,j
+(τxz)n
i+ 12 ,j
xjRi+ 12
+(
∂τzz
∂z
)n
i+ 12 ,j
− xj
Ri+ 12
(∂τzz
∂x
)n
i+ 12 ,j
(dR
dz
)i+ 1
2
]. (31)
The expressions on the right-hand side of (31) have been discretized by making useof the following difference schemes
∂w
∂x=
(wni+ 1
2 ,j+1− wn
i+ 12 ,j−1
)
2δx,
∂w
∂z=
wni+ 3
2 ,jδz2
i + (δz2i+1 − δz2
i )wni+ 1
2 ,j− wn
i− 12 ,j
δz2i+1
δziδzi+1(δzi + δzi+1),
∂u
∂x=
uni+ 1
2 ,j+ 12− un
i+ 12 ,j− 1
2
δx,
∂u
∂z=
uni+1j − un
i,j
0.5(δzi + δzi+1).
The finite-difference equation approximating the momentum equation in5
x-direction is
un+1i,j+ 1
2− un
i,j+ 12
δt=
1Ri
(pni,j − pn
i,j+1)δx
+ (ume)ni,j+ 1
2, (32)7
1st Reading
August 8, 2009 20:31 WSPC/IJCM-j050 00188
10 Sarifuddin, S. Chakravarty & P. K. Mandal
with1
(ume)ni,j+ 1
2= (conu)n
i,j+ 12
+1
Re
[(diff u)n
i,j+ 12
], (33)
where (con u)ni,j+ 1
2and (diff u)n
i,j+ 12
are the finite-difference representations of the3
convective and the diffusive terms of the u-momentum equation for the nth timelevel at (i, j) cell. The convective and the diffusive terms in the u-momentum equa-5
tion are differenced in the same manner to those in the w-momentum equation.The criterion used in the w-momentum equation for the momentum fluxes is also7
employed for the u-momentum fluxes.The Poisson equation for pressure, derived from Eqs. (25), (28), and (32) takes
the final form as
Divn+1i,j − Divn
i,j
δt= Ai,jp
ni,j + Bi,jp
ni+1,j + Ci,jp
ni−1,j + Di,jp
ni,j+1 + Ei,jp
ni,j−1
+ Fi,jpni+1,j+1 + Gi,jp
ni+1,j−1 + Hi,jp
ni−1,j−1 + Si,jp
ni−1,j+1
+xjRi
δzi[(wme)n
i+ 12 ,j − (wme)n
i− 12 ,j ]
+1δx
[xj+ 12(ume)n
i,j+ 12− xj− 1
2(ume)n
i,j− 12]. (34)
Here, Divni,j represents the discretized form of the divergence of velocity field at the
(i, j) cell and the coefficients for Ai,j , Bi,j , . . . , Hi,j , Si,j have got their respectiveexpressions given by
Ai,j =xjRi
δzi∂zt+
xjRi
δzi∂zb+
xj+ 12
Riδx2 +
xj− 12
Riδx2 , Bi,j = − xjRi
δzi∂zt,
Ci,j = − xjRi
δzi∂zb, Di,j =
xj2Ri(dR
dz )i+ 12δzi+1
4Ri+ 12δzi∂ztδx
−xj
2Ri(dRdz )i− 1
2δzi−1
4Ri− 12δzi∂zbδx
−xj+ 1
2
Riδx2 ,
Ei,j = −xj
2Ri(dRdz )i+ 1
2δzi+1
4Ri+ 12δzi∂ztδx
+xj
2Ri(dRdz )i− 1
2δzi−1
4Ri− 12δzi∂zbδx
−xj− 1
2
Riδx2 ,
Fi,j =xj
2Ri(dRdz )i+ 1
2
4Ri+ 12∂ztδx
, Gi,j = −xj2Ri(dR
dz )i+ 12
4Ri+ 12∂ztδx
,
Hi,j =xj
2Ri(dRdz )i− 1
2
4Ri− 12∂zbδx
, and Si,j = −xj
2Ri(dRdz )i− 1
2
4Ri− 12∂zbδx
,
where
∂zt = 0.5(δzi + δzi+1) and ∂zb = 0.5(δzi + δzi−1).
The advantage in using MAC cell is that the pressure boundary condition is not9
needed at boundaries where the velocity vector is specified, because the domainboundaries are chosen to fall on velocity nodes. The Poisson equation for pressure11
1st Reading
August 8, 2009 20:31 WSPC/IJCM-j050 00188
Effect of Asymmetry and Roughness of Stenosis 11
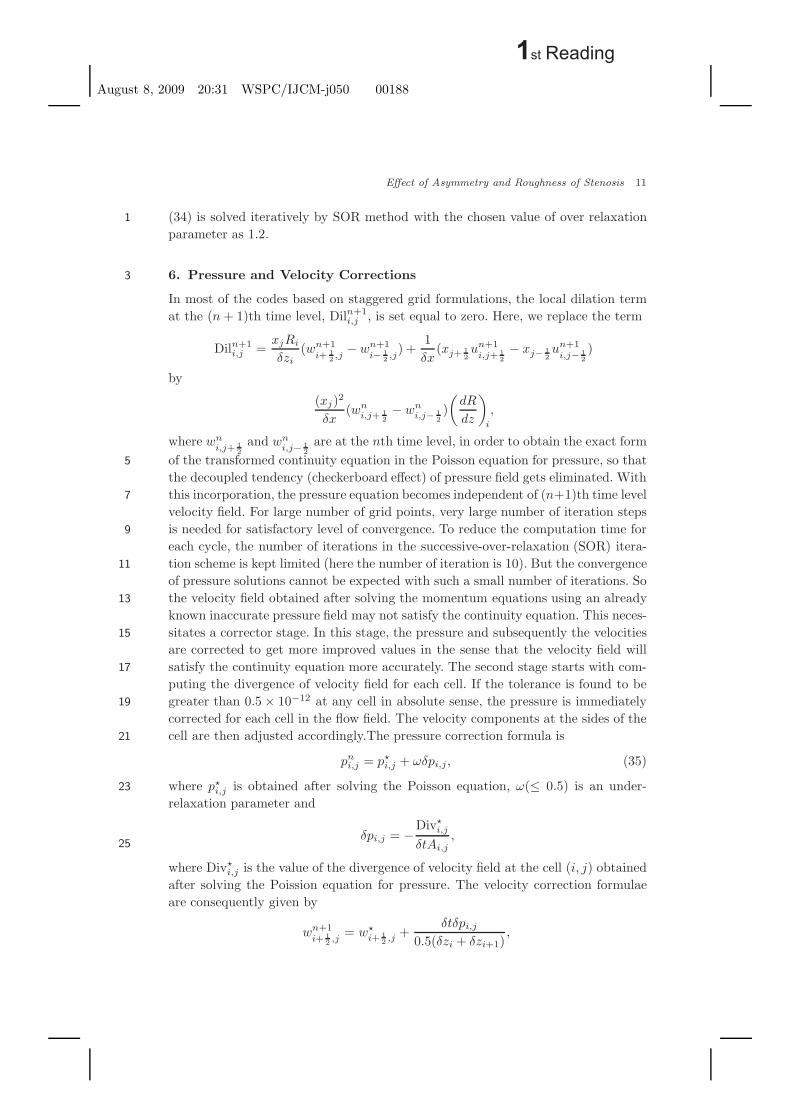
(34) is solved iteratively by SOR method with the chosen value of over relaxation1
parameter as 1.2.
6. Pressure and Velocity Corrections3
In most of the codes based on staggered grid formulations, the local dilation termat the (n + 1)th time level, Diln+1
i,j , is set equal to zero. Here, we replace the term
Diln+1i,j =
xjRi
δzi(wn+1
i+ 12 ,j
− wn+1i− 1
2 ,j) +
1δx
(xj+ 12un+1
i,j+ 12− xj− 1
2un+1
i,j− 12)
by
(xj)2
δx(wn
i,j+ 12− wn
i,j− 12)(
dR
dz
)i
,
where wni,j+ 1
2and wn
i,j− 12
are at the nth time level, in order to obtain the exact formof the transformed continuity equation in the Poisson equation for pressure, so that5
the decoupled tendency (checkerboard effect) of pressure field gets eliminated. Withthis incorporation, the pressure equation becomes independent of (n+1)th time level7
velocity field. For large number of grid points, very large number of iteration stepsis needed for satisfactory level of convergence. To reduce the computation time for9
each cycle, the number of iterations in the successive-over-relaxation (SOR) itera-tion scheme is kept limited (here the number of iteration is 10). But the convergence11
of pressure solutions cannot be expected with such a small number of iterations. Sothe velocity field obtained after solving the momentum equations using an already13
known inaccurate pressure field may not satisfy the continuity equation. This neces-sitates a corrector stage. In this stage, the pressure and subsequently the velocities15
are corrected to get more improved values in the sense that the velocity field willsatisfy the continuity equation more accurately. The second stage starts with com-17
puting the divergence of velocity field for each cell. If the tolerance is found to begreater than 0.5 × 10⁻¹² at any cell in absolute sense, the pressure is immediately19
corrected for each cell in the flow field. The velocity components at the sides of thecell are then adjusted accordingly.The pressure correction formula is21
pni,j = p�
i,j + ωδpi,j, (35)
where p�i,j is obtained after solving the Poisson equation, ω(≤ 0.5) is an under-23
relaxation parameter and
δpi,j = −Div�i,j
δtAi,j,
25
where Div�i,j is the value of the divergence of velocity field at the cell (i, j) obtained
after solving the Poission equation for pressure. The velocity correction formulaeare consequently given by
wn+1i+ 1
2 ,j= w�
i+ 12 ,j +
δtδpi,j
0.5(δzi + δzi+1),
1st Reading
August 8, 2009 20:31 WSPC/IJCM-j050 00188
12 Sarifuddin, S. Chakravarty & P. K. Mandal
wn+1i− 1
2 ,j= w�
i− 12 ,j −
δtδpi,j
0.5(δzi + δzi−1),
un+1i,j+ 1
2= u�
i,j+ 12
+δtδpi,j
Riδx,
un+1i,j− 1
2= u�
i,j− 12− δtδpi,j
Riδx,
where w�i+ 1
2 ,j, w�
i− 12 ,j
, u�i,j+ 1
2and u�
i,j− 12
represent the updated velocity field.1
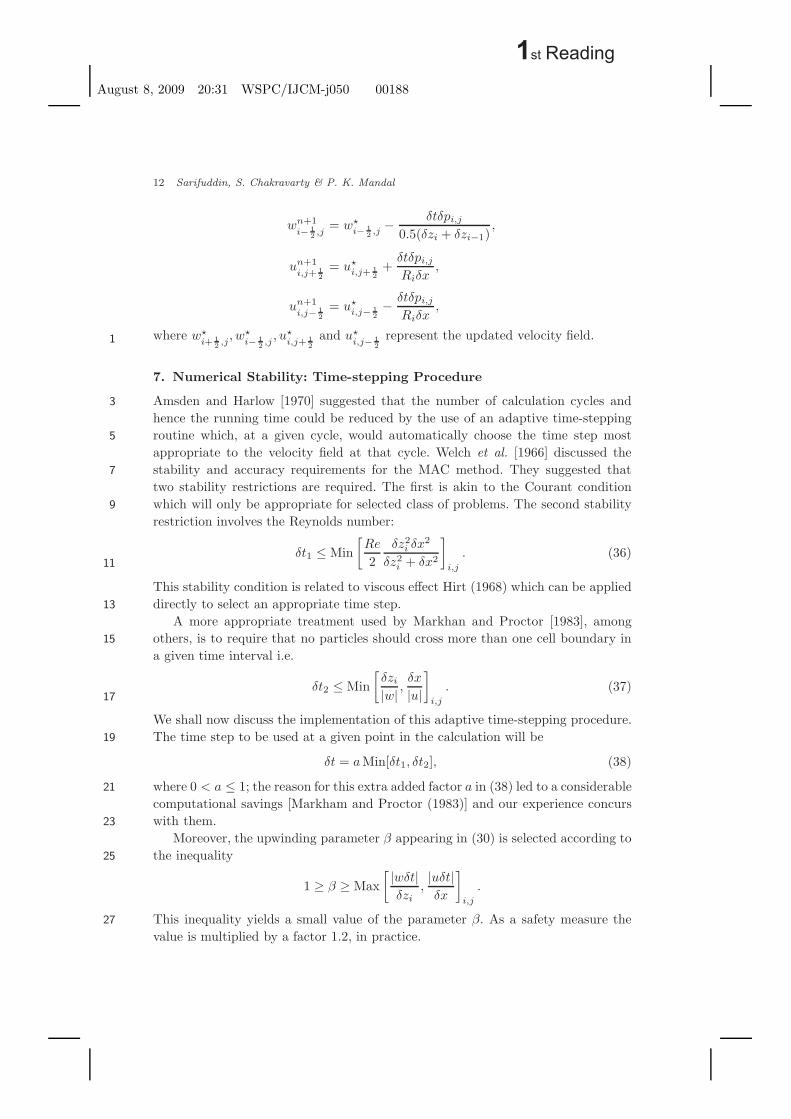
7. Numerical Stability: Time-stepping Procedure
Amsden and Harlow [1970] suggested that the number of calculation cycles and3
hence the running time could be reduced by the use of an adaptive time-steppingroutine which, at a given cycle, would automatically choose the time step most5
appropriate to the velocity field at that cycle. Welch et al. [1966] discussed thestability and accuracy requirements for the MAC method. They suggested that7
two stability restrictions are required. The first is akin to the Courant conditionwhich will only be appropriate for selected class of problems. The second stability9
restriction involves the Reynolds number:
δt1 ≤ Min[Re
2δz2
i δx2
δz2i + δx2
]i,j
. (36)11
This stability condition is related to viscous effect Hirt (1968) which can be applieddirectly to select an appropriate time step.13
A more appropriate treatment used by Markhan and Proctor [1983], amongothers, is to require that no particles should cross more than one cell boundary in15
a given time interval i.e.
δt2 ≤ Min[δzi
|w| ,δx
|u|]
i,j
. (37)17
We shall now discuss the implementation of this adaptive time-stepping procedure.The time step to be used at a given point in the calculation will be19
δt = a Min[δt1, δt2], (38)
where 0 < a ≤ 1; the reason for this extra added factor a in (38) led to a considerable21
computational savings [Markham and Proctor (1983)] and our experience concurswith them.23
Moreover, the upwinding parameter β appearing in (30) is selected according tothe inequality25
1 ≥ β ≥ Max[ |wδt|
δzi,|uδt|δx
]i,j
.
This inequality yields a small value of the parameter β. As a safety measure the27
value is multiplied by a factor 1.2, in practice.
1st Reading
August 8, 2009 20:31 WSPC/IJCM-j050 00188
Effect of Asymmetry and Roughness of Stenosis 13
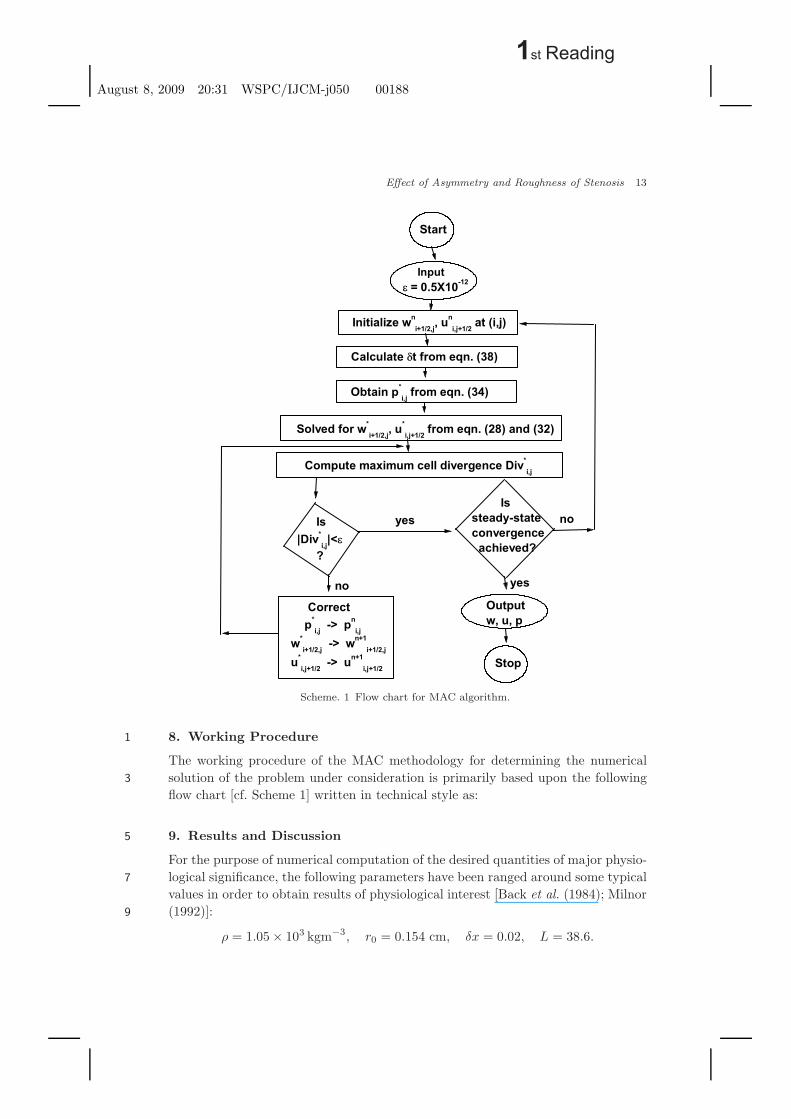
Scheme. 1 Flow chart for MAC algorithm.
8. Working Procedure1
The working procedure of the MAC methodology for determining the numericalsolution of the problem under consideration is primarily based upon the following3
flow chart [cf. Scheme 1] written in technical style as:
9. Results and Discussion5
For the purpose of numerical computation of the desired quantities of major physio-logical significance, the following parameters have been ranged around some typical7
values in order to obtain results of physiological interest [Back et al. (1984); Milnor(1992)]:9
ρ = 1.05 × 10³ kgm−3, r0 = 0.154 cm, δx = 0.02, L = 38.6.
1st Reading
August 8, 2009 20:31 WSPC/IJCM-j050 00188
14 Sarifuddin, S. Chakravarty & P. K. Mandal
The computational domain has been confined with a finite-nondimensional arterial1
length of 38.6 in which the upstream and downstream lengths have been selected tobe 8 and 10 times the nondimensional radius, respectively. For this computational3
domain, solutions are computed through the generation of staggered grid with a sizeof 702× 50 while the insertion of additional points whatsoever needed between any5
two consecutive original irregular stenosis data of Back et al. [1984] by interpolationhas been made for the purpose of generating finer mesh adequately. The governing7
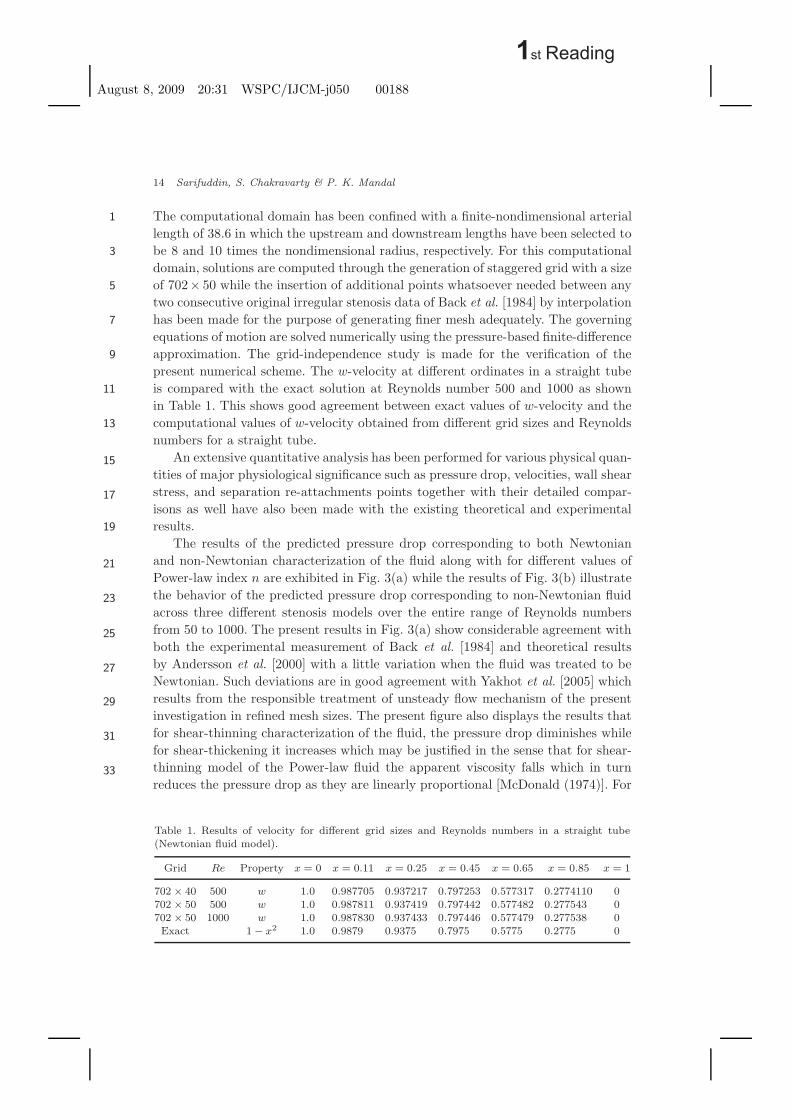
equations of motion are solved numerically using the pressure-based finite-differenceapproximation. The grid-independence study is made for the verification of the9
present numerical scheme. The w-velocity at different ordinates in a straight tubeis compared with the exact solution at Reynolds number 500 and 1000 as shown11
in Table 1. This shows good agreement between exact values of w-velocity and thecomputational values of w-velocity obtained from different grid sizes and Reynolds13
numbers for a straight tube.An extensive quantitative analysis has been performed for various physical quan-15
tities of major physiological significance such as pressure drop, velocities, wall shearstress, and separation re-attachments points together with their detailed compar-17isons as well have also been made with the existing theoretical and experimentalresults.19
The results of the predicted pressure drop corresponding to both Newtonianand non-Newtonian characterization of the fluid along with for different values of21Power-law index n are exhibited in Fig. 3(a) while the results of Fig. 3(b) illustratethe behavior of the predicted pressure drop corresponding to non-Newtonian fluid23across three different stenosis models over the entire range of Reynolds numbersfrom 50 to 1000. The present results in Fig. 3(a) show considerable agreement with25both the experimental measurement of Back et al. [1984] and theoretical resultsby Andersson et al. [2000] with a little variation when the fluid was treated to be27Newtonian. Such deviations are in good agreement with Yakhot et al. [2005] whichresults from the responsible treatment of unsteady flow mechanism of the present29investigation in refined mesh sizes. The present figure also displays the results thatfor shear-thinning characterization of the fluid, the pressure drop diminishes while31for shear-thickening it increases which may be justified in the sense that for shear-thinning model of the Power-law fluid the apparent viscosity falls which in turn33reduces the pressure drop as they are linearly proportional [McDonald (1974)]. For
Table 1. Results of velocity for different grid sizes and Reynolds numbers in a straight tube(Newtonian fluid model).
Grid Re Property x = 0 x = 0.11 x = 0.25 x = 0.45 x = 0.65 x = 0.85 x = 1
702 × 40 500 w 1.0 0.987705 0.937217 0.797253 0.577317 0.2774110 0702 × 50 500 w 1.0 0.987811 0.937419 0.797442 0.577482 0.277543 0702 × 50 1000 w 1.0 0.987830 0.937433 0.797446 0.577479 0.277538 0Exact 1 − x2 1.0 0.9879 0.9375 0.7975 0.5775 0.2775 0

1st Reading
August 8, 2009 20:31 WSPC/IJCM-j050 00188
Effect of Asymmetry and Roughness of Stenosis 15
(a)
(b)
Fig. 3. Comparison of non-dimensional pressure drop (a) for irregular stenosis, (b) across threedifferently shaped models for n = 0.639.
shear-thickening model, the apparent viscosity increases and the velocity profiles1
tend to become parabolic (cf. Fig. 4(a)) and hence greater changes are prone totake place which may, perhaps responsible for increase in pressure drop. Further3
observation from Fig. 3(b) clearly indicates that the pressure drop for the irregularand the smooth stenosis geometrical models are almost indistinguishable while that5
for cosine-shaped stenosis model experiences consistently higher values over theentire range of Reynolds numbers. Thus, the results of the present study are in7
1st Reading
August 8, 2009 20:31 WSPC/IJCM-j050 00188
16 Sarifuddin, S. Chakravarty & P. K. Mandal
(a)
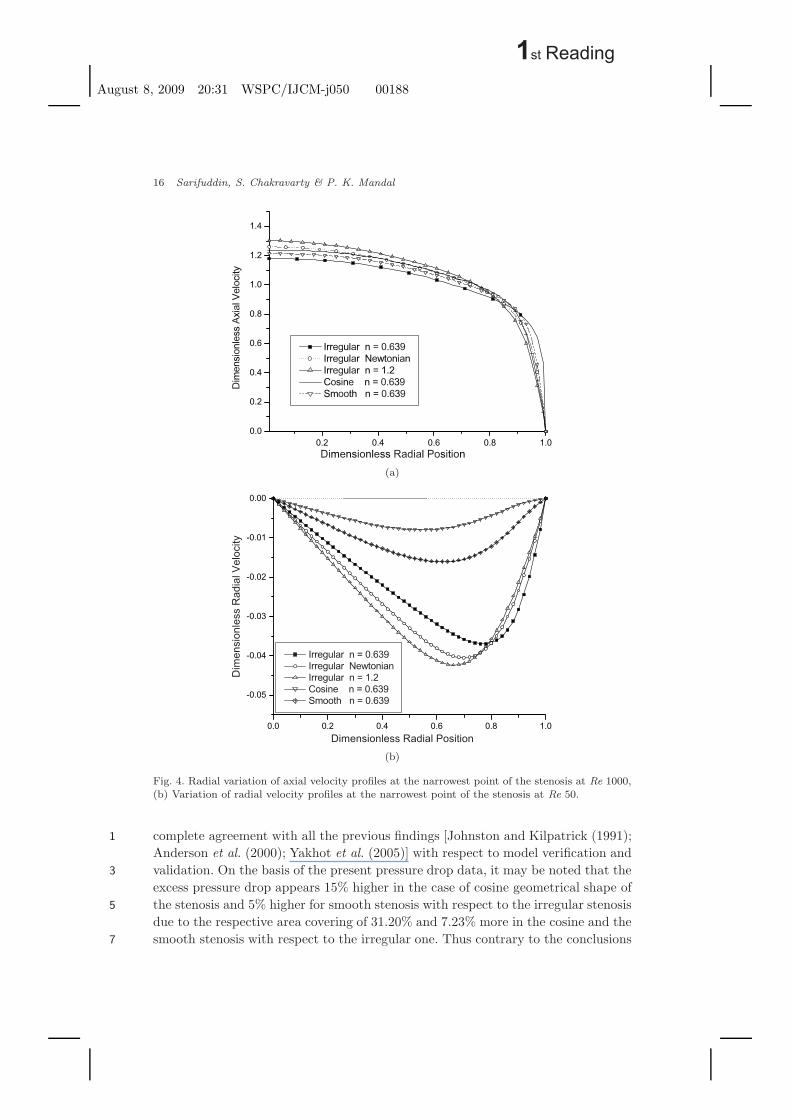
(b)
Fig. 4. Radial variation of axial velocity profiles at the narrowest point of the stenosis at Re 1000,(b) Variation of radial velocity profiles at the narrowest point of the stenosis at Re 50.
complete agreement with all the previous findings [Johnston and Kilpatrick (1991);1
Anderson et al. (2000); Yakhot et al. (2005)] with respect to model verification andvalidation. On the basis of the present pressure drop data, it may be noted that the3
excess pressure drop appears 15% higher in the case of cosine geometrical shape ofthe stenosis and 5% higher for smooth stenosis with respect to the irregular stenosis5
due to the respective area covering of 31.20% and 7.23% more in the cosine and thesmooth stenosis with respect to the irregular one. Thus contrary to the conclusions7
1st Reading
August 8, 2009 20:31 WSPC/IJCM-j050 00188
Effect of Asymmetry and Roughness of Stenosis 17
of the previous studies, the present findings demonstrate along with Yakhot et al.1
[2005] that the excess pressure drop is neither caused by the smoothness of thestenosis nor by its higher degree of symmetry relative to the irregular stenosis, but3
is rather an effect of area covering with respect to the irregular stenosis.The variation of the axial and the radial velocity profiles along the radial direc-5
tion corresponding to Re = 1000 and 50 are exhibited in Figs. 4(a) and 4(b),respectively. These figures compare and quantify the effects of shear-thinning and7
shear-thickening model of the generalized Power-law fluid and also of Newtonianrheology for differently shaped stenosis including the irregular one. Figure 4(a)9
shows that the shear-thinning rheology of fluid corresponding to irregular stenosispredicts lower velocities than those in the cosine and smooth ones until a radial11
position of 0.82 and beyond which, that is, in the vicinity of the arterial wall theyare slightly reversed. Similar observation can also be found for shear-thickening13
rheology of generalized Power-law and Newtonian model of the streaming fluid.However, the analogous shape of all the velocity profiles appears to be flattened to15
some extent owing to the flow under stenotic conditions. This phenomenon doesagree well again with the observations recorded by Johnston and Kilpatrick [1991].17
One may predict from Fig. 4(b) that the radial velocities for irregular stenosis modelare higher in magnitude than those for the cosine and the smooth stenosis models as19
concerned for the shear-thinning model of the generalized Power-law fluid. Also, itis noted from the present figure that the curves corresponding to cosine and smooth21
stenosis models are symmetric in nature about the point of mid-arterial radius, buthigh degree of symmetry is observed for cosine stenosis model only. For the irregular23
stenosis model the curve is no longer symmetric. This figure also indicates that thecurves corresponding to shear-thinning and shear-thickening models representing25
the generalized Power-law fluid and Newtonian model appear to have analogousnature, but radial velocities for shear-thickening model are higher than those cor-27
responding to shear-thinning and Newtonian, model until a radial position of 0.82and beyond that they are slightly reversed. These reversing trend of both the axial29
and the radial velocity profiles for shear-thinning, Newtonian, and shear-thickeningmodels may be justified by the fact that for shear-thinning model the apparent31
viscosity falls short from that of its shear-thickening and Newtonian models whicheventually diminishes the length of the boundary layer.33
The conclusion drawn behind the appropriate reasoning of area covering theexcess pressure drop across the three geometrically different stenosis and the pres-35
sure drop corresponding to shear-thinning, shear-thickening, and Newtonian modelsmay further be justified substantially from the behavior of the axial centerline veloc-37
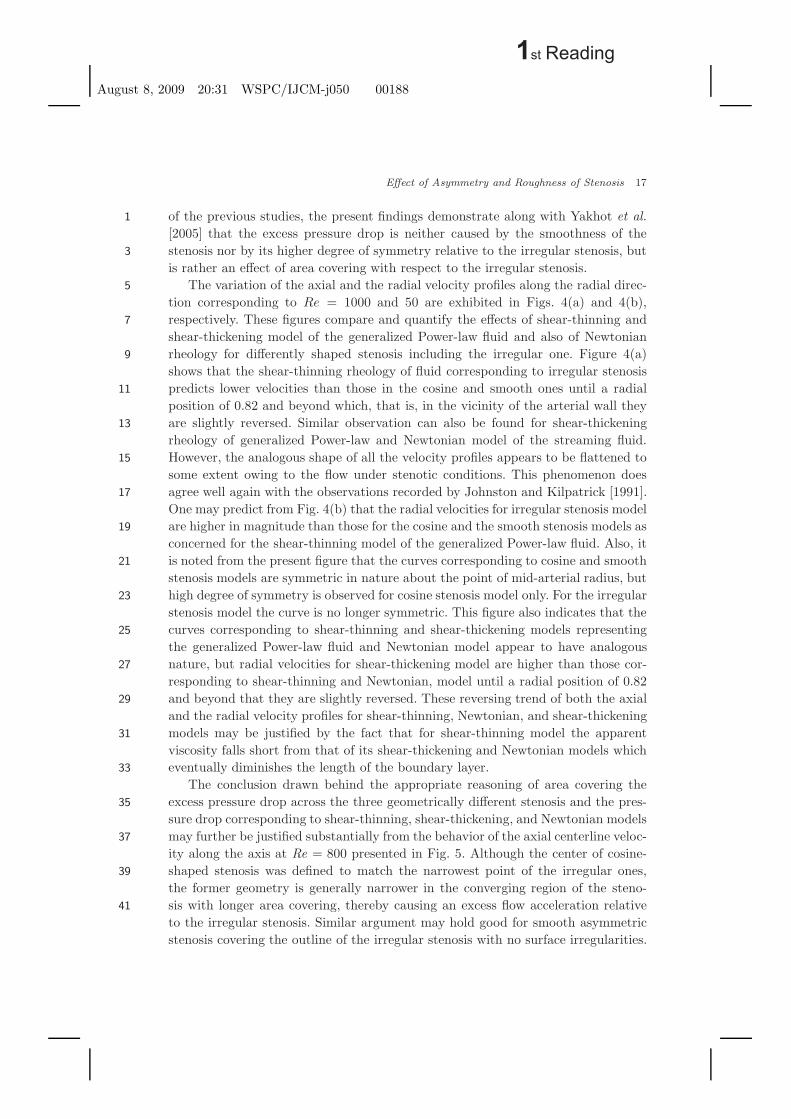
ity along the axis at Re = 800 presented in Fig. 5. Although the center of cosine-shaped stenosis was defined to match the narrowest point of the irregular ones,39
the former geometry is generally narrower in the converging region of the steno-sis with longer area covering, thereby causing an excess flow acceleration relative41
to the irregular stenosis. Similar argument may hold good for smooth asymmetricstenosis covering the outline of the irregular stenosis with no surface irregularities.
1st Reading
August 8, 2009 20:31 WSPC/IJCM-j050 00188
18 Sarifuddin, S. Chakravarty & P. K. Mandal
Fig. 5. Variation of the axial centerline velocity at Re 800.
The results of the present figure once again indicate that shear-thinning model1
predicts lower velocity than that corresponding to shear-thickening and Newtonianmodels. The occurrence of such behavior may be argued by the fact that for shear-3
thickening model the apparent viscosity increases which causes an increase in thelength of boundary layer or in other words, in the vicinity of the arterial wall the5
increasing rate of velocity is slow towards the center but the substantial increaseof the centerline velocity ensures the flow continuity throughout the system under7
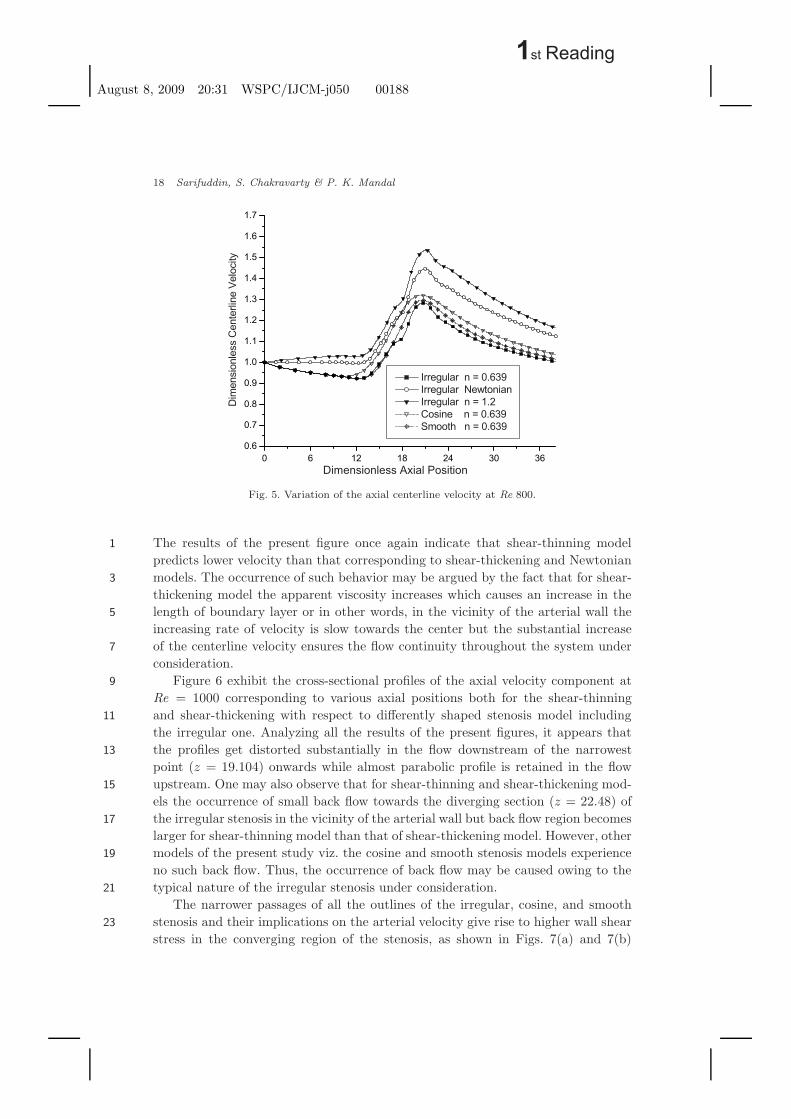
consideration.Figure 6 exhibit the cross-sectional profiles of the axial velocity component at9
Re = 1000 corresponding to various axial positions both for the shear-thinningand shear-thickening with respect to differently shaped stenosis model including11
the irregular one. Analyzing all the results of the present figures, it appears thatthe profiles get distorted substantially in the flow downstream of the narrowest13
point (z = 19.104) onwards while almost parabolic profile is retained in the flowupstream. One may also observe that for shear-thinning and shear-thickening mod-15
els the occurrence of small back flow towards the diverging section (z = 22.48) ofthe irregular stenosis in the vicinity of the arterial wall but back flow region becomes17
larger for shear-thinning model than that of shear-thickening model. However, othermodels of the present study viz. the cosine and smooth stenosis models experience19
no such back flow. Thus, the occurrence of back flow may be caused owing to thetypical nature of the irregular stenosis under consideration.21
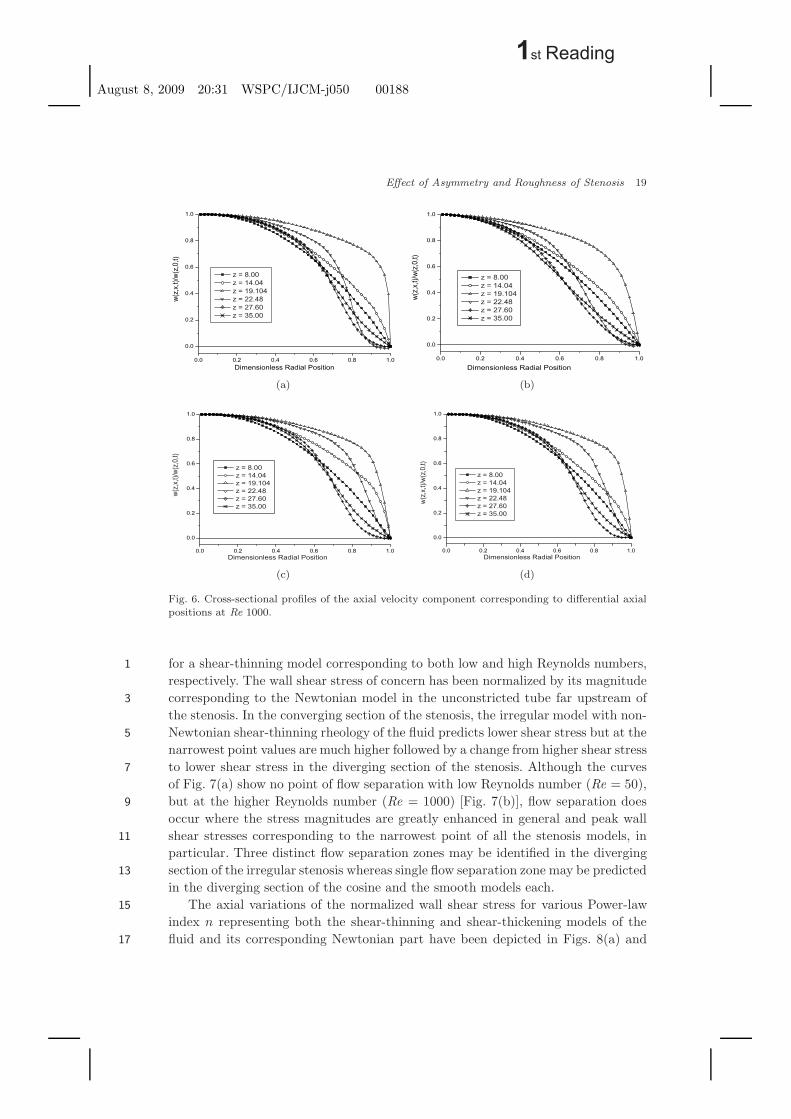
The narrower passages of all the outlines of the irregular, cosine, and smoothstenosis and their implications on the arterial velocity give rise to higher wall shear23
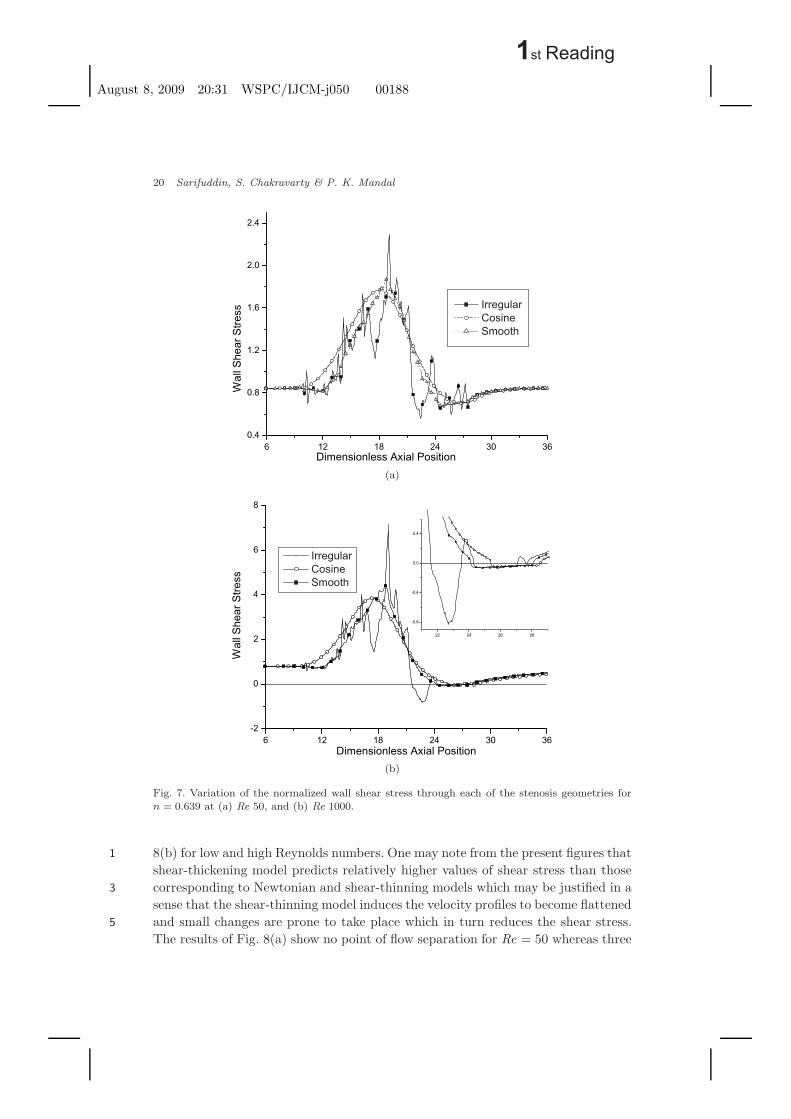
stress in the converging region of the stenosis, as shown in Figs. 7(a) and 7(b)
1st Reading
August 8, 2009 20:31 WSPC/IJCM-j050 00188
Effect of Asymmetry and Roughness of Stenosis 19
(a) (b)
(c) (d)
Fig. 6. Cross-sectional profiles of the axial velocity component corresponding to differential axialpositions at Re 1000.
for a shear-thinning model corresponding to both low and high Reynolds numbers,1
respectively. The wall shear stress of concern has been normalized by its magnitudecorresponding to the Newtonian model in the unconstricted tube far upstream of3
the stenosis. In the converging section of the stenosis, the irregular model with non-Newtonian shear-thinning rheology of the fluid predicts lower shear stress but at the5
narrowest point values are much higher followed by a change from higher shear stressto lower shear stress in the diverging section of the stenosis. Although the curves7
of Fig. 7(a) show no point of flow separation with low Reynolds number (Re = 50),but at the higher Reynolds number (Re = 1000) [Fig. 7(b)], flow separation does9
occur where the stress magnitudes are greatly enhanced in general and peak wallshear stresses corresponding to the narrowest point of all the stenosis models, in11
particular. Three distinct flow separation zones may be identified in the divergingsection of the irregular stenosis whereas single flow separation zone may be predicted13
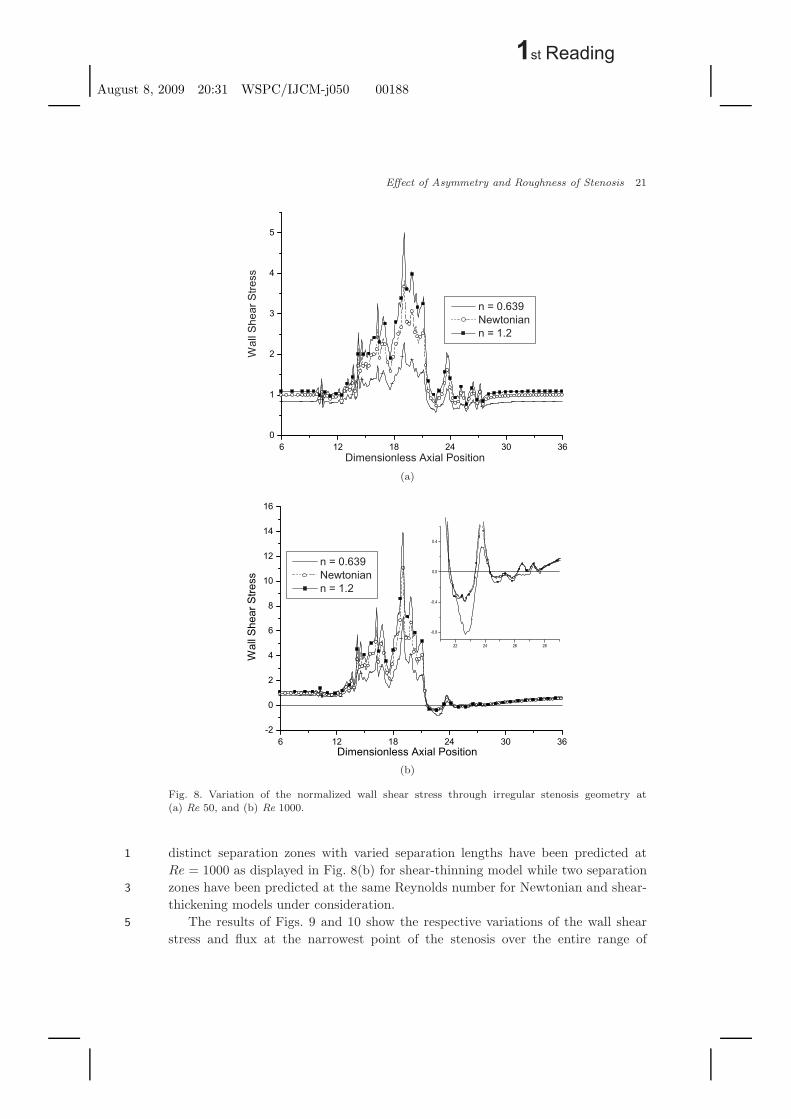
in the diverging section of the cosine and the smooth models each.The axial variations of the normalized wall shear stress for various Power-law15
index n representing both the shear-thinning and shear-thickening models of thefluid and its corresponding Newtonian part have been depicted in Figs. 8(a) and17
1st Reading
August 8, 2009 20:31 WSPC/IJCM-j050 00188
20 Sarifuddin, S. Chakravarty & P. K. Mandal
(a)
(b)
Fig. 7. Variation of the normalized wall shear stress through each of the stenosis geometries forn = 0.639 at (a) Re 50, and (b) Re 1000.
8(b) for low and high Reynolds numbers. One may note from the present figures that1
shear-thickening model predicts relatively higher values of shear stress than thosecorresponding to Newtonian and shear-thinning models which may be justified in a3
sense that the shear-thinning model induces the velocity profiles to become flattenedand small changes are prone to take place which in turn reduces the shear stress.5
The results of Fig. 8(a) show no point of flow separation for Re = 50 whereas three
1st Reading
August 8, 2009 20:31 WSPC/IJCM-j050 00188
Effect of Asymmetry and Roughness of Stenosis 21
(a)
(b)
Fig. 8. Variation of the normalized wall shear stress through irregular stenosis geometry at(a) Re 50, and (b) Re 1000.
distinct separation zones with varied separation lengths have been predicted at1
Re = 1000 as displayed in Fig. 8(b) for shear-thinning model while two separationzones have been predicted at the same Reynolds number for Newtonian and shear-3
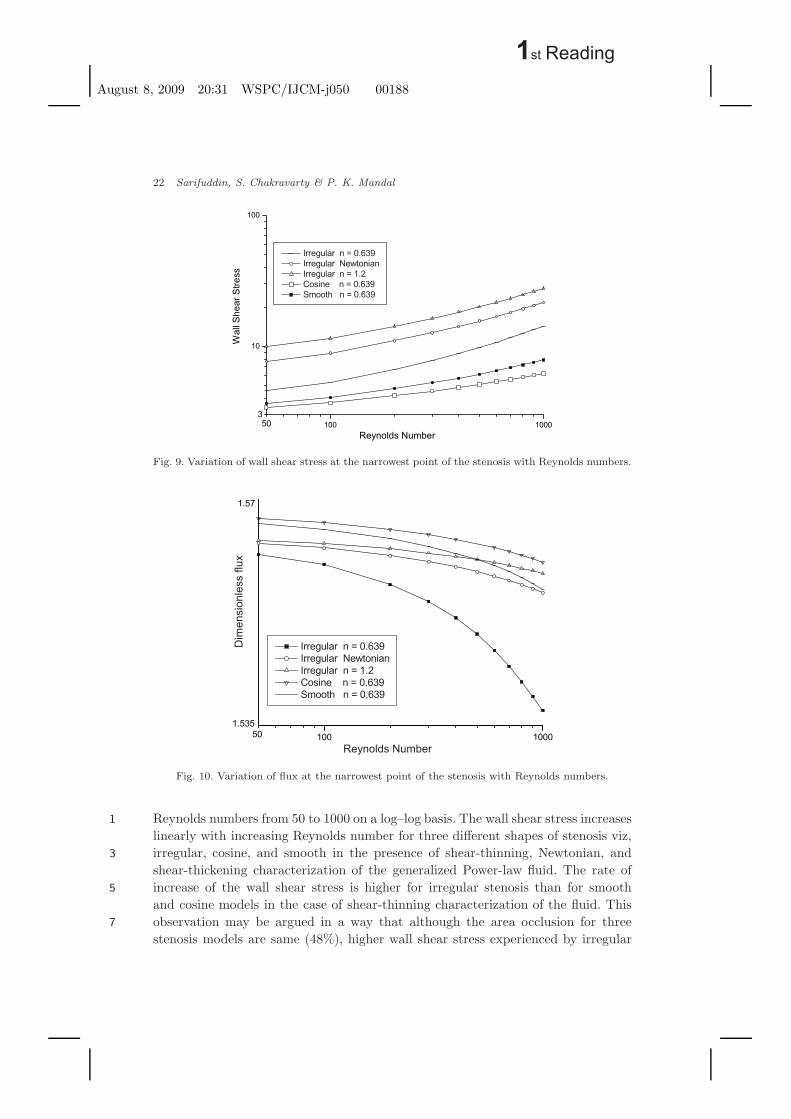
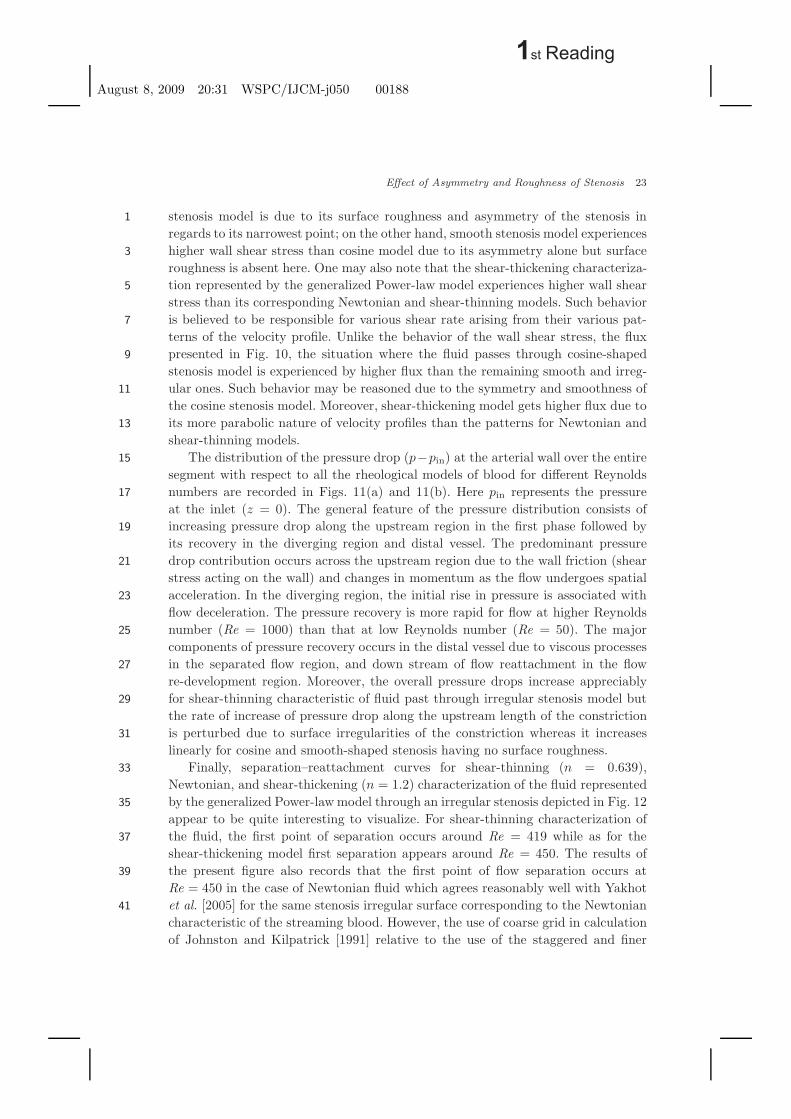
thickening models under consideration.The results of Figs. 9 and 10 show the respective variations of the wall shear5
stress and flux at the narrowest point of the stenosis over the entire range of
1st Reading
August 8, 2009 20:31 WSPC/IJCM-j050 00188
22 Sarifuddin, S. Chakravarty & P. K. Mandal
Fig. 9. Variation of wall shear stress at the narrowest point of the stenosis with Reynolds numbers.
Fig. 10. Variation of flux at the narrowest point of the stenosis with Reynolds numbers.
Reynolds numbers from 50 to 1000 on a log–log basis. The wall shear stress increases1
linearly with increasing Reynolds number for three different shapes of stenosis viz,irregular, cosine, and smooth in the presence of shear-thinning, Newtonian, and3
shear-thickening characterization of the generalized Power-law fluid. The rate ofincrease of the wall shear stress is higher for irregular stenosis than for smooth5
and cosine models in the case of shear-thinning characterization of the fluid. Thisobservation may be argued in a way that although the area occlusion for three7
stenosis models are same (48%), higher wall shear stress experienced by irregular
1st Reading
August 8, 2009 20:31 WSPC/IJCM-j050 00188
Effect of Asymmetry and Roughness of Stenosis 23
stenosis model is due to its surface roughness and asymmetry of the stenosis in1
regards to its narrowest point; on the other hand, smooth stenosis model experienceshigher wall shear stress than cosine model due to its asymmetry alone but surface3
roughness is absent here. One may also note that the shear-thickening characteriza-tion represented by the generalized Power-law model experiences higher wall shear5
stress than its corresponding Newtonian and shear-thinning models. Such behavioris believed to be responsible for various shear rate arising from their various pat-7
terns of the velocity profile. Unlike the behavior of the wall shear stress, the fluxpresented in Fig. 10, the situation where the fluid passes through cosine-shaped9
stenosis model is experienced by higher flux than the remaining smooth and irreg-ular ones. Such behavior may be reasoned due to the symmetry and smoothness of11
the cosine stenosis model. Moreover, shear-thickening model gets higher flux due toits more parabolic nature of velocity profiles than the patterns for Newtonian and13
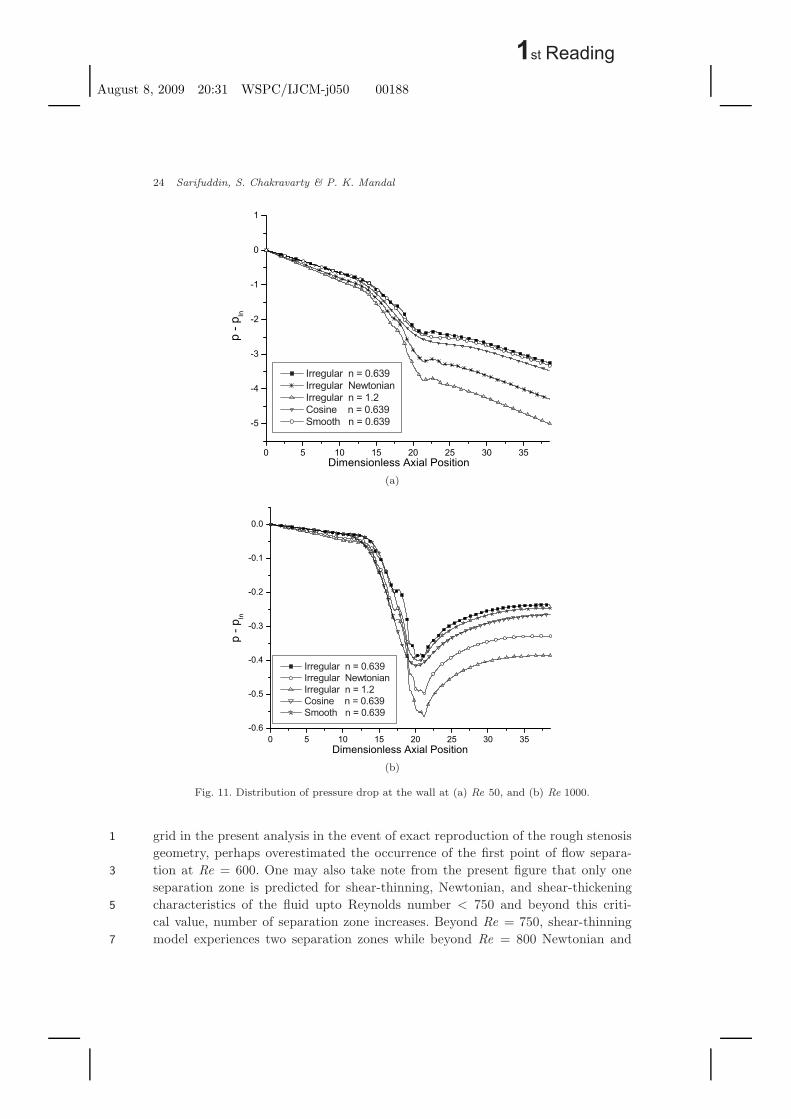
shear-thinning models.The distribution of the pressure drop (p−pin) at the arterial wall over the entire15
segment with respect to all the rheological models of blood for different Reynoldsnumbers are recorded in Figs. 11(a) and 11(b). Here pin represents the pressure17
at the inlet (z = 0). The general feature of the pressure distribution consists ofincreasing pressure drop along the upstream region in the first phase followed by19
its recovery in the diverging region and distal vessel. The predominant pressuredrop contribution occurs across the upstream region due to the wall friction (shear21
stress acting on the wall) and changes in momentum as the flow undergoes spatialacceleration. In the diverging region, the initial rise in pressure is associated with23
flow deceleration. The pressure recovery is more rapid for flow at higher Reynoldsnumber (Re = 1000) than that at low Reynolds number (Re = 50). The major25
components of pressure recovery occurs in the distal vessel due to viscous processesin the separated flow region, and down stream of flow reattachment in the flow27
re-development region. Moreover, the overall pressure drops increase appreciablyfor shear-thinning characteristic of fluid past through irregular stenosis model but29
the rate of increase of pressure drop along the upstream length of the constrictionis perturbed due to surface irregularities of the constriction whereas it increases31
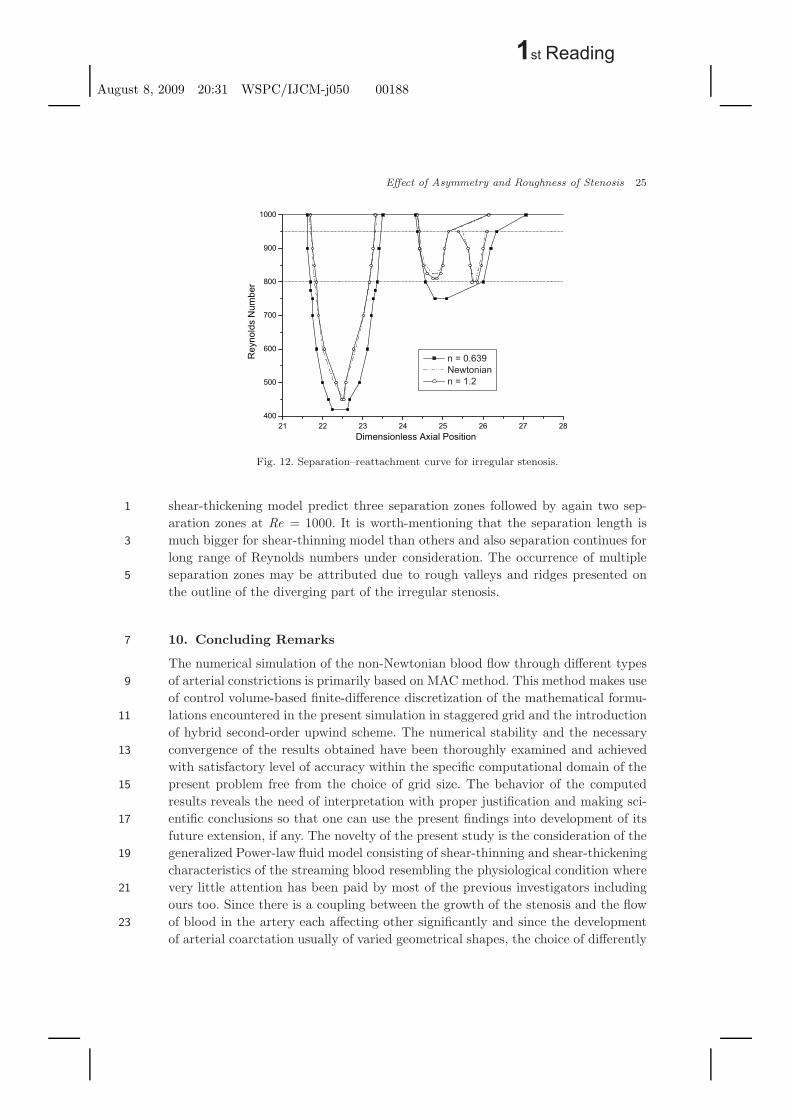
linearly for cosine and smooth-shaped stenosis having no surface roughness.Finally, separation–reattachment curves for shear-thinning (n = 0.639),33
Newtonian, and shear-thickening (n = 1.2) characterization of the fluid representedby the generalized Power-law model through an irregular stenosis depicted in Fig. 1235
appear to be quite interesting to visualize. For shear-thinning characterization ofthe fluid, the first point of separation occurs around Re = 419 while as for the37
shear-thickening model first separation appears around Re = 450. The results ofthe present figure also records that the first point of flow separation occurs at39
Re = 450 in the case of Newtonian fluid which agrees reasonably well with Yakhotet al. [2005] for the same stenosis irregular surface corresponding to the Newtonian41
characteristic of the streaming blood. However, the use of coarse grid in calculationof Johnston and Kilpatrick [1991] relative to the use of the staggered and finer
1st Reading
August 8, 2009 20:31 WSPC/IJCM-j050 00188
24 Sarifuddin, S. Chakravarty & P. K. Mandal
(a)
(b)
Fig. 11. Distribution of pressure drop at the wall at (a) Re 50, and (b) Re 1000.
grid in the present analysis in the event of exact reproduction of the rough stenosis1
geometry, perhaps overestimated the occurrence of the first point of flow separa-tion at Re = 600. One may also take note from the present figure that only one3
separation zone is predicted for shear-thinning, Newtonian, and shear-thickeningcharacteristics of the fluid upto Reynolds number < 750 and beyond this criti-5
cal value, number of separation zone increases. Beyond Re = 750, shear-thinningmodel experiences two separation zones while beyond Re = 800 Newtonian and7
1st Reading
August 8, 2009 20:31 WSPC/IJCM-j050 00188
Effect of Asymmetry and Roughness of Stenosis 25
Fig. 12. Separation–reattachment curve for irregular stenosis.
shear-thickening model predict three separation zones followed by again two sep-1
aration zones at Re = 1000. It is worth-mentioning that the separation length ismuch bigger for shear-thinning model than others and also separation continues for3
long range of Reynolds numbers under consideration. The occurrence of multipleseparation zones may be attributed due to rough valleys and ridges presented on5
the outline of the diverging part of the irregular stenosis.
10. Concluding Remarks7
The numerical simulation of the non-Newtonian blood flow through different typesof arterial constrictions is primarily based on MAC method. This method makes use9
of control volume-based finite-difference discretization of the mathematical formu-lations encountered in the present simulation in staggered grid and the introduction11
of hybrid second-order upwind scheme. The numerical stability and the necessaryconvergence of the results obtained have been thoroughly examined and achieved13
with satisfactory level of accuracy within the specific computational domain of thepresent problem free from the choice of grid size. The behavior of the computed15
results reveals the need of interpretation with proper justification and making sci-entific conclusions so that one can use the present findings into development of its17
future extension, if any. The novelty of the present study is the consideration of thegeneralized Power-law fluid model consisting of shear-thinning and shear-thickening19
characteristics of the streaming blood resembling the physiological condition wherevery little attention has been paid by most of the previous investigators including21
ours too. Since there is a coupling between the growth of the stenosis and the flowof blood in the artery each affecting other significantly and since the development23
of arterial coarctation usually of varied geometrical shapes, the choice of differently
1st Reading
August 8, 2009 20:31 WSPC/IJCM-j050 00188
26 Sarifuddin, S. Chakravarty & P. K. Mandal
shaped stenosis models considered in the present study is of much importance in1
analyzing and estimating their influences on the flow phenomena.One of the remarkable features is the occurrence of larger pressure drop expe-3
rienced by the streaming blood over the entire range of Reynolds numbers in thecosine-shaped stenosis model only relative to the other constricted models owing to5
the factor of larger area covering. This remark contradicted the conclusion drawnby the previous researchers excepting Yakhot et al. [2005] in their similar findings7
of the excess pressure drop to the present one. Moreover, of the three differentfluid models characterizing blood rheology, only the shear-thickening model where9
the apparent viscosity increases, predicts higher centerline flow velocity causing anincrease of the length of the boundary layer compared to other models.11
However, back flow does occur in the vicinity of the arterial wall for both theshear-thinning and shear-thickening characterizations of the non-Newtonian gener-13
alized Power-law fluid representing blood under irregular stenotic condition only.In the pattern of the wall shear stress, the flow separation does occur for large15
Reynolds number (Re = 1000) with the attainment of the peak stresses correspond-ing to the narrowest locations of all the stenosis. It is important to record that for a17
shear-thinning model the diverging section of the irregular stenosis experiences flowseparation at three distinct points while only single flow separation point exists in19
each of the cosine and smooth-shaped stenosis under study. The shear-thickeningmodel, however, predicts three separation zones with varied lengths in the irregular21
stenosis and two separation points each in other stenosis models.For the purpose of validation of the present simulation, a comparative study has23
been carried out with the previous researchers in the relevant domain. Analyzingthe separation–reattachment results thoroughly, one may record that the first point25
of separation appears at Re = 419 for shear-thinning model and at Re = 450 bothfor shear-thickening and Newtonian fluid models. The present results agree well27
with Yakhot et al. [2005] who also predicted the first point of separation to occur atRe = 450 for Newtonian fluid while Johnston and Kilpatrick [1991] overestimated29
it to be Re = 600 due to limitations of their numerical simulation. Thus, thepresent numerical simulation bears the potential to represent the non-Newtonian31
flow phenomena of the streaming blood under stenotic conditions in the realm ofarterial biomechanics and hence the applicability of the model under consideration33
is established.The major limitations of the present study include the consideration of a rigid35
tube and the chosen sites of the stenoses in the arterial lumen. It has been speculatedthat the atherosclerotic lesions preferentially occurred in arteries and arterioles in37
regions of high curvatures where there are bifurcations and junctions, the criticalsites where there would be major changes in fluid loading on the vessel walls. Any39
development of the future extension of the present investigation in order to get awaythese limitations can be made successfully, however complex it may be, based on41
the present findings so that the model refinement analysis shall continue to achieveresults closer to the reat situation.
1st Reading
August 8, 2009 20:31 WSPC/IJCM-j050 00188
Effect of Asymmetry and Roughness of Stenosis 27
Acknowledgments1
The authors are thankful to the reviewers for careful reading of the manuscriptand for valuable suggestions. The present work is part of the special assistance3
programme [ Grant No. F.510/8/DRS/2004 (SAP –I)] sponsored by the UniversityGrants Commission (UGC), New Delhi, India.5
References
Amsden, A. A. and Harlow, F. H. [1970] The SMAC Method: A numerical technique for7calculating incompressible fluid flow, Los Alamos Scientific Lab. Report LA-4370.
Andersson, H. I., Halden, R. and Glomsaker, T. [1991] Effect of surface irregularities on9flow resistance in differently shaped arterial stenoses, J. Biomech. 33, 1257 (2000).
Back, L. H., Chow, Y. I., Crawford, D. W. and Cuffel, R. F. [1984] Effect of mild atheroscle-11rosis on flow resistance in a coronary artery casting of man, J. Biomech. Eng., Trans.ASME 106, 48.13
Cavalcanti, S. [1995] Haemodynamics of an artery with mild stenosis, J. Biomech. 28, 387.Chakravarty, S. and Mandal, P. K. [2000] Two-dimensional blood flow through tapered15
arteries under stenotic conditions, Int. J. Nonlinear. Mech. 35, 779.Chakravarty, S, Mandal, P. K. and Sarifuddin [2005] Effect of surface irregularities on17
unsteady pulsatile flow in a complient artery, Int. J. Nonlinear. Mech. 40, 1268.Deshpande, M. D., Giddens, D. P. and Mabon, R. F. [1976] Steady laminar flow through19
modelled vascular stenoses, J. Biomech. 9, 165.Easthope, P. and Brooks, D. [1980] A comparison of rheological constitutive functions for21
whole human blood, Biorheology 17, 235.Harlow, F. H. and Welch, J. E. [1965] Numerical calculation of time-dependent viscous23
incompressible flow of fluid with free surface, Phys. Fluids 8, 2182.Hirt, C. W. [1968] Heuristic stability theory for finite-difference equations, J. Comput.25
Phys. 2, 339.Johnston, P. R. and Kilpatrick, D. [1991] Mathematical modelling of flow through an27
irregular arterial stenosis, J. Biomech. 24, 1069.Kawaguti, M. and Hammano, A. [1983] Numerical study on post-stenotic dilation,29
Biorheology 20, 507.Khanafer, K. M., Gadhoke, P., Berguer, R. and Bull, J. L. [2006] Modeling pulsatile flow31
in aortic aneurysms: Effect of non-Newtonian properties of blood, Biorheology 43,661.33
Lee, J. S. and Fung, Y. C. [1970] Flow in locally constricted tubes at low Reynolds numbers,J. Appl. Mech. Trans. ASME 37, 9.35
Markham, G. and Proctor, M. V. [1983] C.E.G.B. Report TPRD/L/0063/M82.McDonald, D. A. [1974] Blood Flow in Arteries, 2nd edn. (Edward Arnold, London).37McMillan, D., Utterback, N., Nasrinasrabadi, M. and Lee, M. [1986] An instrument to eval-
uate the time dependent flow properties of blood at moderate shear rates, Biorheology3923, 63.
Malek, J., Rajagopal, K. R. and Ruzicka, M. [1995] Exixtence and regularity of solutions41and stability of the rest state of fluids with shear dependent viscosity, Math. ModelsMeth. Appl. Sci. 5, 789.43
Malek, J., Necas, J., Rokyta, M. and Ruzicka, M. [1996] Weak and Measure-ValuedSolutions to Evaluating PDE’s (Chapman and Hall, New York).45
Mandal, P. K. [2005] An unsteady analysis of non-Newtonoan blood flow through taperedarteries with a stenosis, Int. J. Nonlinear. Mech. 40, 151.47
1st Reading
August 8, 2009 20:31 WSPC/IJCM-j050 00188
28 Sarifuddin, S. Chakravarty & P. K. Mandal
Mandal, P. K., Chakravarty, S., Mandal, A. and Amin, N. [2007a] Effect of body accel-1eration on unsteady pulsatile flow of non-Newtonian fluid through a stenosed artery,Appl. Math. Comput. 189, 766.3
Mandal, P. K., Chakravarty, S. and Mandal, A. [2007b] Numerical study of the unsteadyflow of non-Newtonian fluid through differently shaped arterial stenoses, Int. J.5Comput. Math. 84, 1059.
Milnor, W. R. [1992] Haemodynamics (Williams and Williams, Baltimore).7Nerem, R. E. [1992] Vascular fluid mechanics, the arterial wall, and arteriosclerosis, J.
Biomech. Engng. Trans. ASME 114, 274.9O‘Brien, V. and Ehrlich, L. W. I. [1985] Simple pulsatile flow in an artery with a constric-
tion, J. Biomech. 18, 117.11Sarifuddin, Chakravarty, S., Mandal, P. K. and Layek, G. C. [2008] Numerical simulation
of unsteady generalized Newtonian blood flow through differently shaped distensible13arterial stenoses, J. Med. Eng. Tech. 32, 385 .
Thuston, G. B. [1972] Viscoelasticity of human blood, Biophys. J. 12, 1205.15Thuston, G. B. [1973] Frequency and shear rate dependence of viscoelasticity of human
blood, Biorheology 10, 375.17Tu, C., Deville, M., Dheur, L. and Vanderschuren, L. [1992] Finite element simulation of
pulsatile flow through arterial stenosis, J. Biomech. 25, 1141.19Walburn, F. and Schneck, D. [1976] A constitutive equation for whole human blood,
Biorheology 13, 210.21Welch, J. E., Harlow, F. H., Shannon, J. P. and Daly, B. J. [1966] The MAC method,
Los Alamos Scientific Lab. Report LA-3425, Los Alamos.23Wong, K., Mazumdar, J., Pincombe, B., Worthley, S. G., Sanders, P. and Abbott, D.
[2006] Theoretical modeling of micro-scale biological phenomena in human coronary25arteries, Med. Bio. Eng. Comput. 44, 971.
Yakhot, A., Grinberga, L. and Nikitin, N. [2005] Modeling rough stenoses by immersed-27boundary method, J. Biomech. 38, 1115.
Young, D. F. and Tsai, F. Y. [1973a] Flow characteristics in models of arterial stenoses -I,29J. Biomech. 6, 395.
Young, D. F. and Tsai, F. Y. [1973b] Flow characteristics in models of arterial stenoses31-II, J. Biomech. 6, 547.
Zendehboodi, G. R. and Moayeri, M. S. [1999] Comparison of physiological and simple33pulsatile flows through stenosed arteries, J. Biomech. 32, 959.