
Ecophysiological responses of citrus trees and sugar ...
102
ECOPHYSIOLOGICAL RESPONSES OF CITRUS TREES AND SUGAR ACCUMULATION OF FRUIT IN RESPONSE TO ALTERED PLANT WATER RELATIONS JOHAN ANDRIES PRINSLOO Thesis presented in partial fulfilment of the requirements for the degree of Master of Science in Agriculture, University of Stellenbosch Supervisor: Dr. G.H. Barry (Department of Horticultural Science) Co-supervisor: Prof. E. Rabe (Department of Horticultural Science) March 2007
-
Upload
khangminh22 -
Category
Documents
-
view
4 -
download
0
Transcript of Ecophysiological responses of citrus trees and sugar ...

ECOPHYSIOLOGICAL RESPONSES OF CITRUS TREES AND
SUGAR ACCUMULATION OF FRUIT
IN RESPONSE TO ALTERED PLANT WATER RELATIONS
JOHAN ANDRIES PRINSLOO
Thesis presented in partial fulfilment of the requirements for the degree of Master of Science
in Agriculture, University of Stellenbosch
Supervisor: Dr. G.H. Barry (Department of Horticultural Science)
Co-supervisor: Prof. E. Rabe (Department of Horticultural Science)
March 2007

DECLARATION
I, the undersigned, hereby declare that the work contained in this thesis is my own original
work and that I have not previously in its entirety or in part submitted it at any university for a
degree.
………………………… ………………………..
Signature Date
i

ACKNOWLEDGEMENTS
I gratefully acknowledge the following institutions and individuals:
The Foundation for Research and Development and Citrus Research International for their
financial support.
Dr. G.H. Barry for his guidance, advice, encouragement and patience during the long duration
of the study.
The lecturers and staff of the Department of Horticultural Science, University of Stellenbosch,
for their assistance during the study.
All personnel at Backsberg and Greendale for their time and effort in helping to prepare the
orchards for the project.
My family and friends for their love, support and encouragement throughout my studies.
vi

SUMMARY
This study was undertaken to quantify some of the effects of daily fertigation on
ecophysiological responses in citrus trees (Citrus spp.). Initial research was conducted to
optimise and standardise the sampling procedure to quantify stem water potential (ψstem) in
citrus trees. To reliably determine the plant water status of citrus trees, the following
conditions are required to minimise unwanted variation in ψstem measurements. Bagging of
leaves with black polyethylene envelopes covered with aluminium foil 3 to 4 hours prior to
measuring ψstem allows the plant water status in those leaves to equilibrate with whole-tree
plant water status, thereby providing a realistic measurement of the current water status. The
use of aluminium foil to cover the bagged leaves, reduces unwanted heat stress by reflecting
sunlight, and dramatically reduced variation in ψstem. The time of day at which ψstem
measurements are made is important to ensure consistency in comparisons among treatments
and interpretation of irrigation treatment effects. “Physiological midday” is the preferred time
of day to measure ψstem, i.e. 1100 HR. Transpiring leaves with open stomata would be in sun-
exposed positions on the east side of trees and should be used for making ψstem measurements.
Under similar experimental conditions as those used here, only three leaves per replicate are
required to detect a difference of 0.05 MPa in ψstem between treatment means. Plant water
status categories were developed which may have useful practical applications, i.e. >-1.0 MPa
= no water deficit; -1.0 to -1.2 MPa = low water deficit; -1.2 to -1.4 MPa = moderate water
deficit; <-1.4 to -1.6 MPa = high water deficit; and <-1.6 MPa = severe water deficit.
Attempts are being made to develop systems that improve crop management and enhance
citrus fruit production through efficient and timeous application of water and mineral
nutrients which has led to the use of daily drip fertigation or the open hydroponics system
(OHS). However, the perceived benefits are not necessarily supported by facts. Fruit size
ii

and yield are apparently enhanced, but possible negative aspects of the system have not been
quantified. Fruit produced on trees grown under daily drip fertigation generally have a lower
total soluble solids concentration than on trees under micro-sprinkler irrigation. This is
mainly due to a dilution effect that is caused by the greater availability of water and the
uptake thereof. Sugar accumulation can be optimised by controlling the amount of water that
the plant receives at different developmental stages. Therefore, it is essential to quantify the
ecophysiological responses and benefits of OHS/daily fertigation, as well as the effects of this
technology on fruit quality. ‘Nules Clementine’ mandarin (C. reticulata Blanco) trees in two
commercial orchards in Simondium, Western Cape province, South Africa, received
differential irrigation treatments. The treatments were applied at the end of stage I (± mid
December) of fruit development. Stem water potential, fruit size and internal fruit quality
were determined. Water-deficit stress enhanced sugar accumulation of ‘Nules Clementine’
mandarin by 0.3 to 0.6 °Brix under certain conditions. These conditions require that the
difference in ψstem should be of a sufficient intensity of between 0.16 and 0.3 MPa, and this
difference should be maintained for a sufficient duration of between 4 and 6 weeks.
Furthermore, deficit irrigation should be applied relatively early in fruit development, namely
during the sugar accumulation stage which starts within 4 weeks of the end of the fruit drop
period and continues until harvest.
iii

OPSOMMING
Dié studie is onderneem om van die effekte van daaglikse sproeibemesting op die
ekofisiologiese veranderinge in sitrus bome (Citrus spp.) te bepaal. Aanvanklike navorsing is
gedoen om die proses waarmee stamwaterpotensiaal (ψstam) in sitrus bome bepaal word te
optimaliseer en te standaardiseer. Om betroubare waardes vir die water status van die plant
te bepaal, word die volgende voorwaardes vereis om ongewenste wisseling in ψstam te
minimaliseer. Blare is 3 tot 4 uur voor die meet van ψstam in swart poli-etileen sakkies geplaas
sodat die plant se water status in die spesifieke blare in ewewig gebring kan word met die
water status van die algehele plant. ‘n Realistiese maatstaf van die huidige water status word
hiermee verkry. Die sakkies word omhul met aluminium foelie om ongewenste hitte stres
weens sonlig te verminder en sodoende variasie in ψstam ook drasties te verminder. Die tyd
gedurende die dag waartydens ψstam bepaal word is van belang om te verseker dat
konsekwente vergelykings getref kan word tussen verskillende besproeiing behandelings.
“Fisiologiese middag” is die gewenste tyd van die dag om ψstam te bepaal, nl. om 1100 HR.
Transpirerende blare met oop stomata wat aan sonlig blootgestel is aan die oostelike kant van
die boom moet gebruik word om ψstam te bepaal. Onder soortgelyke eksperimentele
toestande, is slegs drie blare per herhaling nodig om ’n verskil van 0.05 MPa in ψstam tussen
behandelings te bepaal. Plantwaterstatus kategorië is ontwikkel om `n praktiese manier van
waterstres te bepaal, m.a.w. >-1.0 MPa = geen watertekort; -1.0 to -1.2 MPa = lae watertekort;
-1.2 tot -1.4 MPa = gematigde watertekort; -1.4 MPa tot -1.6 MPa = hoë watertekort; <-1.6
MPa = ernstige watertekort.
Die ontwikkeling van sisteme om oesbestuur te verbeter en om sitrus opbrengste te verhoog
deur effektiewe en tydige toediening van water en minerale voedingelemente het gelei tot die
gebruik van daaglikse drip bemesting of die oop hidroponiese stelsel (OHS). Ongelukkig is
iv

die waargenome voordele nie ondersteun deur feite nie. Vruggrootte en opbrengs word
skynbaar verbeter, maar die negatiewe aspekte van die stelsel is nog nie gekwantifiseer nie.
Vrugte van bome wat daaglikse drip bemesting gekry het, het in die algemeen ’n laer totale
oplosbare stowwe konsentrasie gehad as bome wat mikro-besproeiing gekry het. Dit kan
grootliks toegeskryf word aan die verdunningseffek wat plaasvind weens die groter
beskikbaarheid van water aan die bome en die verhoogde opname daarvan. Die
optimalisering van suiker akkumulasie kan bereik word deur die hoeveelheid water wat
toegedien word gedurende verskillende groeistadiums van die plant te beheer. Dit is dus van
belang om die ekofisiologiese veranderinge en die voordele van OHS/daaglikse besproeiing
asook die effek van hierdie tegnologie op vrugkwaliteit te bepaal. ‘Nules Clementine’
mandaryn (C. reticulata Blanco) bome in twee kommersiële boorde in Simondium, Wes-
Kaap provinsie, Suid-Afrika, het differensiële besproeiing behandelings ontvang. Die
behandelings is toegepas aan die einde van groeifase I (± middel Desember) van
vrugontwikkeling. Stamwaterpotensiaal, vruggrootte en interne vrugkwaliteit is bepaal. Stres
a.g.v. water onthouding het gelei tot verhoogde suiker akkumulasie van ‘Nules Clementine’
mandaryn van 0.3 tot 0.6 °Brix onder sekere toestande. Hierdie toestande vereis dat ‘n
voldoende verskil in ψstam van tussen 0.16 en 0.3 MPa waargeneem word en dat hierdie
verskil gehandhaaf moet word vir ’n tydperk van tussen 4 en 6 weke. Differensiële
besproeiing moet ook relatief vroeg tydens vrugontwikkeling toegedien word, nl. tydens die
suiker akkumulasie stadium wat begin 4 weke voor die einde van die vrugval stadium en strek
tot oestyd.
v

TABLE OF CONTENTS
Declaration i
Summary ii
Opsomming iv
Acknowledgements vi
Table of contents vii
Chapter 1. Introduction 1
Chapter 2. Review of literature 4
2.1 Fruit growth and development 4
2.2 Sugar metabolism 6
2.3 Factors affecting sugar accumulation 10
2.4 Water potential 14
2.4.1 Definition of water potential 14
2.4.2 Key factors affecting water potential gradients 15
2.4.2.1 Concentration 15
2.4.2.2 Temperature 15
2.4.2.3 Pressure 16
2.4.2.4 Effect of solutes 16
2.4.2.5 Matrix potential 17
2.4.3 Components of water potential 17
vii

2.5 Techniques to determine water potential and osmotic potential 18
2.5.1 Water potential 18
2.5.1.1 Chardakov’s dye method 18
2.5.1.2 Tissue volume / liquid equilibration method 19
2.5.1.3 Thermocouple psychrometer 20
2.5.1.4 Pressure chamber 22
2.5.2 Osmotic potential 25
2.5.2.1 Cryoscopic/ freezing-point method 25
2.5.2.2 Plasmolysis 26
2.5.2.3 Refractomeric method 26
2.5.2.4 Thermocouple psychrometer 26
2.5.2.5 Pressure chamber 27
2.6 Fertigation 28
2.7 Open Hydroponics System (OHS) 30
2.7.1 Advantages of OHS 32
2.7.2 Disadvantages of OHS 34
2.8 Daily Drip Fertigation (DDF) 35
Chapter 3. Stem water potential as a measure of plant water status
in citrus trees (Citrus spp.) 37
Chapter 4. Quantification of Daily Drip Fertigation on plant water
status and sugar accumulation in citrus trees (Citrus spp.) 53
viii

Chapter 5. Overall discussion and conclusions 80
Literature cited 82
Language and style used in this thesis are in accordance with the requirements of the scientific
journals of the American Society for Horticultural Science. This thesis presents a compilation
of manuscripts where each chapter is an individual entity and some repetition between
chapters has, therefore, been unavoidable.
ix

CHAPTER 1
INTRODUCTION
The water potential of a plant is an indication of the plant’s water status as water potential
accounts for the integrated effect of soil, plant and atmospheric conditions on water
availability within the plant (McCutchan and Shackel, 1992). The potentials and resistances
to water flow within a plant could not be measured accurately until the development of the
pressure chamber simplified the measurement of water potentials in fields and orchards
(Scholander et al., 1964; 1965). By measuring the water potential of sun-exposed
(transpiring) leaves, leaf water potential could be estimated.
Leaf water potential is highly variable due to prevailing environmental conditions
(McCutchan and Shackel, 1992). Variability due to changing environmental conditions can
be reduced by using predawn water potential measurements. These measurements indicate
overnight recovery in water potential through equilibration with soil water potential, rather
than the water potential experienced under midday conditions when a plant’s stomata are open
and water demand is highest due to large vapour pressure deficit.
In contrast, stem water potential is closely related to plant water use and stomatal
conductance, and is thus a more appropriate measure of plant water stress (McCutchan and
Shackel, 1992; Shackel et al., 1997). Stem water potential is less influenced by
environmental variability than transpiring leaf water potential. However, the technique of
stem water potential as a reliable measure of plant water status has not been extensively used
in citrus trees (Citrus spp.) (Goldhamer and Salinas, 2000; Barry et al., 2004b).
1

Fertigation is the application of water-soluble fertilisers typically with drip irrigation to
control water and nutrient supplies to crops (Bar-Yosef, 1999). The main differences between
drip irrigation and micro-sprinkler irrigation are that with drip irrigation water is generally
applied to a restricted root zone of the plant and at more frequent intervals than micro-
sprinkler irrigation (Elfving, 1982). By applying fertilisers through the drip irrigation system
the fertilisation efficiency is increased since nutrients are applied to a restricted root zone
(Bar-Yosef, 1999) and the roots are capable of much faster uptake of nutrients (Bar-Yosef,
1988).
The open hydroponics system (OHS) is a sensitive nutrient and moisture management system
with a high degree of control over the development of the crop (Stassen et al., 1999). Specific
water and nutrient requirements for different phenological stages of the plant are applied
through daily fertigation. A balanced nutrient solution with controlled pH and EC is applied
using a drip irrigation system.
At the beginning of the 1990’s, Professor Rafael Martinez Valero of Spain brought all the
concepts of hydroponics together to develop the commercial application of the open
hydroponics system and later called it Martinez Open Hydroponics Technologies (MOHT)
(Martinez and Fernandez, 2004; Falivene et al., 2005). Since the implementation of OHS in
horticultural practices all over the world, many variations of the concept have developed. The
variation in OHS will be referred to as Daily Drip Fertigation (DDF). Daily drip fertigation
involves drip fertigation of plants on a daily basis during daylight hours (Stassen et al., 1999;
Pijl, 2001; Schoeman, 2002). DDF results in increased yield and fruit size (Kruger et al.
2000a; 2000b; Kuperus et al., 2002; Martinez and Fernandez, 2004), but there is no evidence
that DDF does not adversely affect sugar accumulation. Anecdotal evidence from several
2
citrus producers in South Africa suggests that the sugar content of fruit produced under OHS
tends to be lower than that of fruit produced under conventional micro-sprinkler irrigation
(G.H. Barry, personal communication).
The reported reduction in sugar content under OHS conditions could be explained as follows:
DDF results in a dilution effect as the amount of water given by the continuous/daily
irrigation dilutes the sugars which accumulate in the fruit. It is well-known that rootstocks of
differing vigour have varying affects on the dilution of accumulated sugars (Harding and
Lewis, 1941; Miller, 1990; Barry et al., 2004b). Managed drought stress is known to increase
sugar accumulation in Citrus (Yakushiji et al., 1996; 1998). Meyer and Boyer (1981),
Yakushiji et al. (1996; 1998) and Barry et al. (2004b) observed more sugar accumulation in
plants under water stress than in unstressed plants.
The timing of water deficit stress seems to be important in enhancing juice quality in citrus.
Barry et al. (2004b) found that when deficit irrigation was applied late in fruit development
(stage III) of ‘Valencia’ sweet orange [C. sinensis (L.) Osbeck], no increase in soluble solids
concentration (SSC) was achieved. However, when deficit irrigation was applied during the
major sugar accumulation period (stage II) of fruit development, increases in SSC occurred.
The objectives of this study were to optimise the sampling procedure to reliably determine the
plant water status of citrus trees, and to quantify the effects of water deficit stress on SSC of
‘Nules Clementine’ mandarin (C. reticulata Blanco) fruit grown under OHS conditions.
3
CHAPTER 2
REVIEW OF LITERATURE
2.1 Fruit growth and development
The mature citrus (Citrus spp.) fruit is the end product of a complex set of events that starts
with the formation of the reproductive structures, or flowers. The ovary develops into a
mature fruit by the processes of cell division, cell differentiation and cell growth. Citrus fruit
have a single sigmoid growth curve and are classified as nonclimacteric fruit (Coombe, 1976).
Bain (1958) described the three stages of fruit development for ‘Valencia’ orange [C. sinensis
(L.) Osb.]. During stage I, there is slow volume growth, but intense cell division. This period
is approximately 9 weeks in duration. Holtzhausen (1969) found the same results and growth
patterns for ‘Navel’ orange. Cell division occurs only in the outer layers of the rind and in
juice sacs (Fig. 2.1). Most of the volume growth that occurs is due to the growth in the rind
(Lowell et al., 1989). Bain (1958) found that at the end of stage I, the rind represents 95% of
the fruit volume. The growth of the juice sacs is primarily due to cell division. This cell
division is mainly at the head of developing juice sacs.
Stage II of fruit development is characterised by very rapid fruit growth, and is due to cell
enlargement and cell differentiation. Cell division stops at the beginning of stage II, except
for the outer layers of the flavedo and the tips of the juice sacs. During this stage, the rind
becomes thinner as the pulp segments undergo rapid growth due to cell enlargement.
Although the rind becomes thinner, the albedo cells continue to enlarge. This is due to the
albedo cells enlarging in a tangential direction which results in spongy tissue in which the cell
layers are fewer than in the rind at the end of stage I. The same spongy tissue development
4

that develops in the albedo, develops in the central axis and in the septum tissue. Most of the
increase in size during stage II is due to growth of the pulp segments (Lowell et al., 1989).
According to Bain (1958), the central axis and the pulp account for 5% of the volume of the
developing fruit at the end of stage I, but at the end of stage II, the central axis and the pulp
account for 58% of the volume and 67% of the fresh weight of the fruit. Most of this is due to
pulp segments. Juice sacs become larger and juice content increases in the enlarging cells of
the juice sacs. The majority of sugar accumulation takes place during stage II of fruit
development (Bain 1958).
Fig. 2.1. Diagrammatic cross-section of a citrus fruit (Holtzhausen, 1969).
Stage III of fruit development is the maturation period. Although volume growth still
continues, the rate of growth is much lower than in stage II. Chlorophyll pigments disappear
from the flavedo, with the subsequent carotenoid pigment development. Carotenoids increase
significantly and are converted into highly coloured pigments during and after the loss of
chlorophyll.
5

2.2 Sugar metabolism
Citrus leaves begin exporting photosynthates when they are fully expanded (Kriedemann,
1969a; 1969b). Schaffer et al. (1987) found that this expansion can take 2 months or more to
complete. Several leaves are produced at a time on a new shoot and expand together during
elongation of the shoot. This results in a significant intensity and duration of photosynthate
import into young leaves until the leaves develop export capabilities. Thus, new leaves can
compete strongly for photosynthates with other sinks (Schaffer et al., 1987; Goldschmidt and
Koch, 1996). Older leaves export more photosynthates and at a more rapid rate than younger
leaves (Kriedemann, 1969a; 1969b). Canny et al. (1968) described citrus trees as “slow paced
organisms” with regards to the rate of photo-assimilate translocation. Wallerstein et al.
(1978) found that export from source leaves only started 19 hours after labelling. Fruit
located at the apical end of a shoot, derive their photo-assimilates acropetally from the leaves
of the same growth cycle, whereas leaves of lower vegetative laterals revealed basipetal, root-
directed transport (Kriedemann, 1970). Leaves from previous growth cycles initially provide
photosynthates for the new developing leaves and flowers, but ultimately their export is
destined to the roots (Goldschmidt and Koch, 1996).
Photo-assimilates are transported through the phloem from source leaves into the albedo of
fruit. As the amount of photosynthates increase during development, the diameter of the
phloem tissue also increases. This structural change helps the transport into growing fruit
(Koch and Avigne, 1990). The leaf-to-fruit transfer of photosynthates can be affected by the
xylem backflow of water from the fruit. Net water movement from fruit to leaves proceeds in
the opposite direction than that of phloem transfer. Elfving and Kaufmann (1972) indicated
that water outflow from fruit to transpiring leaves may occur nearly continuously from mid-
6

morning until sundown. Mass flow into fruit via phloem requires a turgor gradient opposite
that of the total water potential drawing xylem water from the fruit to the leaves. Phloem
loading in the leaf with a reduced turgor at the sink can provide the necessary gradient. Low
turgor may be difficult to achieve in a sink where water loss is extremely limited (Huang et
al., 1992) and high pressures are present in internal tissues (Kaufmann, 1971).
Vascular bundle strands become amphicribral as they enter fruit, thus the xylem is completely
surrounded by phloem (Lowell, 1986; Tomlinson et al., 1991). This can influence the phloem
turgor by reducing the turgor in the fruit end of the translocation path. It may also maximise
the capacity of phloem to reload any solutes moving toward the xylem during xylem backflow
(Lowell, 1986).
As the vascular bundle strands enter citrus fruit, there is a reduction in the xylem content with
distance from the point of entry into fruit. Only a single vessel member can remain inside
encircling primary and secondary phloem (Goldschmidt and Koch, 1996). This contributes
further to the xylem backflow.
According to Huang et al. (1992), phloem can supply all the water and carbon needed for fruit
maturation. Relatively little water is required via xylem, although the amount can change
during diurnal influx and efflux. Mantell et al. (1980) indicated that both directions of flow
occur throughout the development of fruit. But the amount of water that can be withdrawn
from juice sacs decreases during growth due to the extension of long threadlike, nonvascular
stalks that increases the distance between the juice sacs and vascular bundle strands (Huang et
al., 1992). Most of the water loss that takes place is from the rind of the fruit (Mantell et al.
1980; Huang et al., 1992).
7
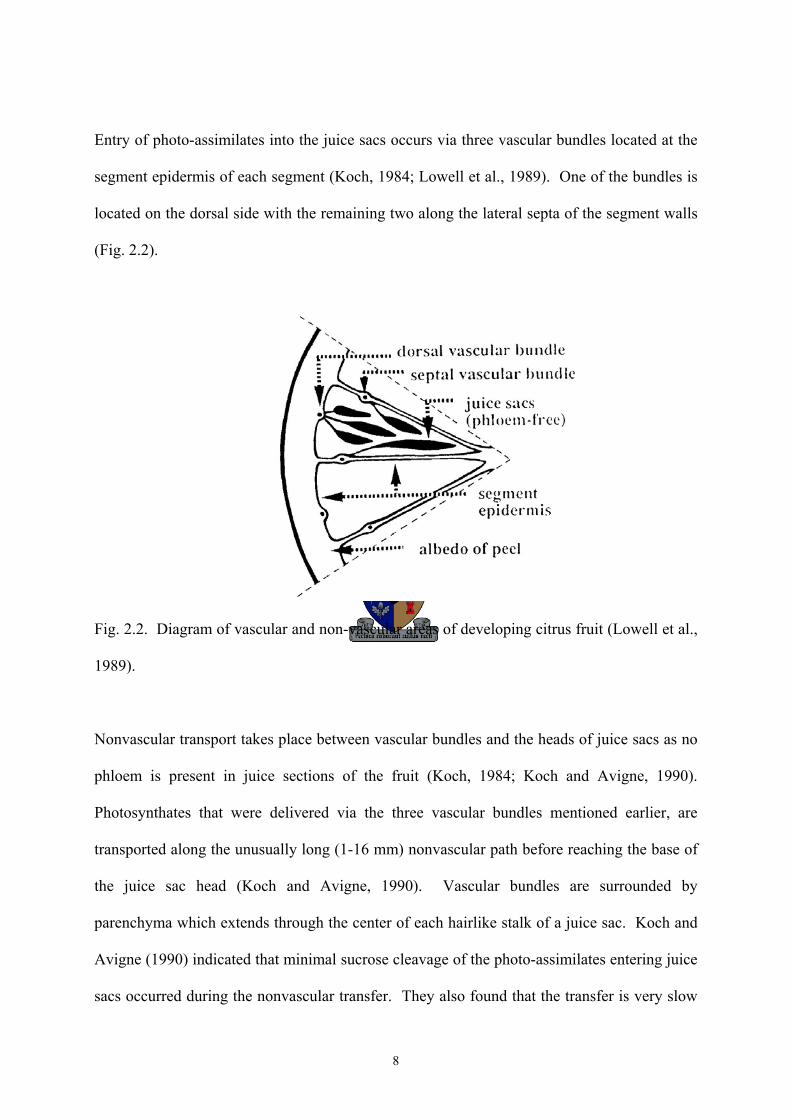
Entry of photo-assimilates into the juice sacs occurs via three vascular bundles located at the
segment epidermis of each segment (Koch, 1984; Lowell et al., 1989). One of the bundles is
located on the dorsal side with the remaining two along the lateral septa of the segment walls
(Fig. 2.2).
Fig. 2.2. Diagram of vascular and non-vascular areas of developing citrus fruit (Lowell et al.,
1989).
Nonvascular transport takes place between vascular bundles and the heads of juice sacs as no
phloem is present in juice sections of the fruit (Koch, 1984; Koch and Avigne, 1990).
Photosynthates that were delivered via the three vascular bundles mentioned earlier, are
transported along the unusually long (1-16 mm) nonvascular path before reaching the base of
the juice sac head (Koch and Avigne, 1990). Vascular bundles are surrounded by
parenchyma which extends through the center of each hairlike stalk of a juice sac. Koch and
Avigne (1990) indicated that minimal sucrose cleavage of the photo-assimilates entering juice
sacs occurred during the nonvascular transfer. They also found that the transfer is very slow
8

with photo-assimilates taking 24 hours to reach the end of vascular bundles and a further 3
days are required for the assimilates to reach the juice sac heads. The final intended location
for photo-assimilate in the juice sac heads is in the vacuoles with different amounts and types
of sugars differing from sac to sac (Ting, 1969). The process of vascular
compartmentalisation is very important to the final import capacity in an expansion sink.
When juice sacs expand, the rind is stretched to half its original thickness (Bain, 1958). The
expansion process is driven by a high internal turgor and negative osmotic potentials in the
juice sac heads (Kaufmann, 1970), combined with an ascending concentration of sugars along
the post-phloem transport path (Koch and Avigne, 1990). Yakushiji et al. (1996; 1998)
indicated that water plays a direct role in the osmotic adjustment and this causes differences in
sink strength which in turn effects the assimilate translocation and accumulation.
Sucrose is the main form of photo-assimilate for translocation and phloem unloading in citrus
fruit (Kriedemann, 1969a; 1969b; Garcia-Luis et al., 1991). Sucrose acts as an energy source
in photosynthetic cells. Synthesis of sucrose occurs in the cytosol of leaves and is then
translocated through the phloem to growing tissues. Sucrose (Fig. 2.3) is synthesised by
combining the phosphorylated forms of glucose and fructose sugars (Bean, 1960). This
process requires energy which is provided by uridine triphosphate (UTP). UTP reacts with
the glucose-1-phosphate to form a molecule called uridine diphosphate glucose (UDPG). The
glucose in UDPG can then be transferred to an acceptor molecule such as fructose-6-
phosphate to form sucrose and UDP (energy) (Salisbury and Ross, 1991).
The enzymes of sucrose metabolism are most active in juice sac heads prior to the period of
maximum translocation into the juice sac heads (Lowell et al., 1989). Sucrose synthase and
invertase were most active during the cell division stage. During the cell expansion period,
9

minimal activity of soluble invertase was detected (Kato and Kubota, 1978). Some alkaline
invertase and sucrose synthase could be detected, but sucrose phosphate synthase was most
active (Koch and Avigne, 1990).
Fig. 2.3. The structure of sucrose, a molecule made of a glucose unit (left) and a fructose unit
(right) connected between carbons 1 and 2, as shown (Salisbury and Ross, 1991).
2.3 Factors affecting sugar accumulation
All plant organs act as sinks or receivers of photoassimilates at some stage of development.
The ability of a sink organ to import photoassimilates is defined as the sink strength (Ho,
1988). The import rate for a sink can be altered by changing the sink strength or changing the
strength of the competing sink.
Competition for photosynthates can be among different sinks in a tree, e.g. shoots and fruit, or
it can be among the same type of sinks, e.g. fruit and fruit. As mentioned earlier, new leaves
can compete strongly for photosynthates with other sinks (Schaffer et al., 1987; Goldschmidt
and Koch, 1996), until leaves have fully expanded and start to export photosynthates
(Kriedemann, 1969a; 1969b). The competition between fruit has been linked to the
carbohydrate status of the tree due to the reduction in fruit numbers during early fruit
development through fruitlet abscission (Schaffer et al., 1985). This is also linked to the
10

inverse relationship between the number of fruit and fruit size. Processes like girdling and
fruit thinning alter the source-sink relationship (Goldschmidt and Koch, 1996).
Girdling is the process of blocking the transport of photoassimilates by removing a ring of
bark from the trunk or scaffold branches. The effect of girdling depends on the time period
when girdling is done. Girdling in autumn enhances flowering (Goldschmidt and Golomb,
1982), girdling at full bloom improves fruit set (Monselise et al., 1972) and girdling in
summer enhances fruit size (Fishler et al., 1983).
Fruit thinning is the removal of some fruit, with the result that the same leaf area supports less
fruit. This results in more photosynthate being available for each fruit and thus increases the
fruit size (Fishler et al., 1983).
The potential sink strength and activity are genetically determined (Ho, 1988). The actual
sink strength is determined by factors affecting the transport rate within the sinks during
development, e.g. low yields due to drought or high temperatures. Yields can thus be
increased by manipulating growing conditions to optimise rate-limiting processes.
Genetics also influence the ability of different rootstocks to absorb and translocate water
while also affecting sugar accumulation. Scions budded on invigorating rootstocks, e.g.
rough lemon (C. jambhiri Lush.), produce large fruit with low sugars, while scions budded on
less invigorating rootstocks, e.g. trifoliate [Poncirus trifoliata (L.) Raf.] or citrange (C.
sinensis x P. trifoliata ), produce smaller fruit with higher sugars (Harding and Lewis, 1941;
Miller, 1990; Barry et al., 2004a; 2004b). Rough lemon rootstock has a more extensive root
system than citrange rootstocks, which allows the roots to absorb more water from a larger
11
soil volume. Rough lemon rootstock is also more effective at water absorption due to
differences measured in plant water status between these rootstocks. Fruit harvested from
scions on citrange rootstock had 30% higher sugars than fruit from rough lemon trees (Barry
et al., 2004b).
Sink strength is also determined by the ability of the sink to metabolise sucrose and the
storage thereof (Ho, 1988; Sung, 1989). There are two specific enzymes capable of cleaving
sucrose. The first is invertase, which yields fructose and glucose through a catalytic action.
The second is sucrose synthase which uses sucrose and UDP to form UDP-glucose and
fructose (Hockema and Echeverria, 2000). The isolation of sucrose in the vacuole allows the
sink to maintain a sucrose gradient which in turn permits continuous transport of sucrose into
the sink. Song et al. (1998) found that the activity of sucrose synthase in the juice cells in the
stylar-end of fruit is significantly higher than in the stem-end of fruit. A low vacuolar pH
may be involved in sink strength as sucrose cleavage takes place at a low pH (Hockema and
Echeverria, 2000). This would allow acid hydrolysis of sucrose without the necessary
enzymes of sucrose metabolism (Echeverria and Burns, 1989).
Drought stress influences sugar accumulation in Citrus (Yakushiji et al., 1996; 1998; Barry et
al., 2004b). Although Syvertsen and Albrigo (1980) found no evidence of osmotic adjustment
in citrus trees to water stress, the water stress conditions that they applied was not severe
enough. Meyer and Boyer (1981), Yakushiji et al. (1996; 1998) and Barry et al. (2004b)
observed more sugar accumulation in plants under water stress than unstressed plants.
Osmotic adjustment is a physiological function that takes place under water stress conditions
(Meyer and Boyer, 1981). This process involves enough solute accumulation in cells to
decrease the cell osmotic potential when cell water potential decreases at low water potential.
12

Water can then be absorbed from a water source by cells without losing cell turgor or
decreasing cell volume, while solutes accumulate in juice vesicles (Morgan, 1984). During
water stress conditions, the cell size and turgor will be maintained due to solute accumulation
in cells at low water potentials. Yakushiji et al. (1996; 1998) found that ‘Satsuma’ mandarin
(C. unshiu Marc.) fruit underwent osmotic adjustment as a mechanism of accumulating sugars
under low water potentials when trees were moderately stressed by mulching or withholding
irrigation. The sugar accumulation was not due to dehydration. The water stress increased
concentrations of sucrose, glucose and fructose (Yakushiji et al., 1998). Barry et al. 2004b)
also demonstrated this phenomenon. Hockema and Etxeberria (2001) explained the
importance of sucrose hydrolysing enzymes in this process.
The timing of water deficit stress seems to be important in enhancing juice quality in citrus.
Barry et al. (2004b) found that when deficit irrigation was applied late in fruit development
(stage III) on ‘Valencia’ sweet orange [C. sinensis (L.) Osbeck], no increase in soluble solids
concentration (SSC) was achieved. However, when the deficit irrigation was applied during
the major sugar accumulation period (stage II) of fruit development, increases in SSC
occurred. This is in contrast to what Ginestar and Castel (1996) and Gonzalez-Altozano and
Castel (1999) found on ‘Nules Clementine’ mandarin (C. reticulata Blanco). SSC was
increased when deficit irrigation was applied during stage III and not during stage II, but fruit
size was smaller for treatments applied in stage III. Applying regulated deficit irrigation early
in the season did not decrease fruit size at harvest due to accelerated fruit growth that
occurred following the reintroduction of full irrigation (Goldhamer and Arpaia, 1998;
Goldhamer and Salinas, 2000).
13
2.4 Water potential
Water movement in the soil-plant-atmosphere continuum is due to differences in the free
energy content (capacity to do work) of water in different parts of the continuum. The free
energy change is called the chemical potential (Spanner, 1964; Slatyer, 1967). The free
energy content of the water in a well-watered plant decreases progressively as it moves from
the soil through the plant to the atmosphere. A diffusing solute tends to move from a region
of high chemical potential to a region of low chemical potential. The result is that water
flows from the soil through the plant to the air in response to the gradient in free energy
(Fitter and Hay, 1981).
2.4.1 Definition of water potential
Water potential (ψ) is defined as the chemical potential of water in a system compared to the
chemical potential of pure water at atmospheric pressure and at the same temperature (Slatyer
and Taylor, 1960; Slatyer, 1967). Further, the chemical potential of the reference pure water
is set at zero (Fitter and Hay, 1981). This definition can be expressed with the following
relationship (Slatyer and Taylor, 1960):
ψ = (μw – μw* )/Vw
Where
ψ = water potential
μw = chemical potential of water in the system under consideration
μw* = chemical potential of pure water at atmospheric pressure and at the same
temperature as the system under consideration
Vw = partial molar volume of water (18 cm3·mol-1).
14

If the chemical potential of the water being considered is less than that of pure water, its water
potential will have a negative value. Water potential is nearly always negative in all parts of
the soil-plant-atmosphere continuum. It is usually most negative in the atmosphere and least
negative in the soil. The result is a net movement of water from the soil towards regions with
more negative values, i.e. the atmosphere. The formation of dew is an example of water flow
from the atmosphere to the plant (Fitter and Hay, 1981).
2.4.2 Key factors affecting water potential gradients
The water potentials that are within plants are functions of the availability of water from the
soil, atmospheric demand for water and the resistance of water movement within the plant
(Kramer, 1983). The gradients in chemical potential or water potential produce the driving
force for diffusion (Spanner, 1964). These gradients are produced by the following five
factors.
2.4.2.1 Concentration
The effective concentration of the solution is the most important factor in establishing the
chemical-potential gradients that drive diffusion. Solute particles in plants (minerals, sugars,
etc.) diffuse from a region with a high concentration to a region of low concentration
(Salisbury and Ross, 1991).
2.4.2.2 Temperature
Temperature differences are normally ignored because the thermodynamic equations assume
that temperature is constant throughout the system and its surroundings (Spanner, 1964). But
it is important to consider temperature effects because temperature gradients may exit. When
temperatures at soil surfaces decrease at night, water vapour diffuses from deeper in the soil
15
to the surface (Kramer, 1934; Kramer, 1940). As temperatures increase during the day, water
vapour will diffuse deeper into the soils. The same applies to plants growing in the arctic.
The roots of these plants are in soil that is close to freezing point while their leaves can be
warmed during the day to above 20 °C (Salisbury and Ross, 1991).
2.4.2.3 Pressure
Increasing pressure increases the free energy and hence the chemical potential in a system is
increased. The contents of most plant cells are under pressure when compared to the
surroundings. Fluids in xylem can be under tension (negative pressure) when not enough
water is available in the soil. This will result in water moving from the cell to the xylem
(Slatyer, 1967).
2.4.2.4 Effect of solutes
Solute particles decrease the chemical potential of the solvent (Slatyer, 1967). This is due to
the mole fraction, which is the number of solvent particles compared with the total number of
particles in the solution. The mole fraction is calculated by using the following equation
(Salisbury and Ross, 1991):
mole fraction of solvent = moles of solvent j moles of solute + moles of solvent.
In a closed container with pure water on one side of a membrane and a solution on the other
side, a water potential gradient will be present (Slatyer, 1967). The water potential will be
lower on the solution side. Water will diffuse from the pure water side through the membrane
into the solution. This case of diffusion is called osmosis (Slatyer and Taylor, 1960). In
16

plants, osmosis is the process whereby water moves from the soil into the plant and then from
cell to cell through the membranes.
2.4.2.5 Matrix potential
A matrix is a material with surfaces that bind water (Salisbury and Ross, 1991). Negatively
charged surfaces (i.e. clay particles in soil, proteins) attract water by binding with the positive
side of the polar water molecules. This process is called hydration. Hydration and gravity are
the main causes of water flow in soils.
2.4.3 Components of water potential
Slatyer (1967) stated that the total water potential of any system is the sum of various effects
or components including solute or osmotic potential (ψs), gravitational potential (ψg), matric
potential (ψm) and pressure potential (ψp). Water potential is a pressure and is measured in
megapascal (MPa), using the following equation:
ψ = ψp + ψs + (ψg + ψm).
Pressure potential is caused by additional pressure and is equal to the real pressure in the part
of the system being considered. Osmotic potential is caused by the presence of solute
particles in the water. The gravitational component of the total water potential is only 0.01
MPa·m-1 and can thus be ignored except in very tall trees (Kramer, 1983). However, in wet
soils, gravity may have a significant effect on water flow (Turner, 1981). Matric potential is a
measure at atmospheric pressure of the tendency for the matrix to adsorb additional water
molecules. In the cytosol the matric component of the final water potential is small and could
17
also be neglected (Wiebe, 1966). This reduces the equation to the two most contributing
factors of water potential, pressure potential and osmotic potential:
ψ = ψp + ψs.
Pressure potential can have any value and can be positive, negative or zero (i.e. at
atmospheric pressure). Positive pressure is the result of an increase in pressure while tension
(sucking or pulling) results in a negative pressure. Osmotic potential is always negative, or
zero in pure water. The osmotic potential is negative because the solvent water in a solution
can only do less work than pure water. Water potential can be negative, zero or positive due
to pressure that can be positive and very high while osmotic potential can be zero or negative
(Salisbury and Ross, 1991).
2.5 Techniques to determine water potential and osmotic potential
2.5.1 Water potential
The most useful single measurement in the soil-plant-atmosphere continuum is water
potential (Kramer, 1983). Water potential can be measured by Chardakov’s dye method,
tissue volume equilibration, thermocouple psychrometers or the pressure chamber.
2.5.1.1 Chardakov’s dye method
Test tubes, with solutions with known but different concentrations, are coloured by adding a
crystal of dye such as methylene blue to the solution (Knipling, 1967; Slavik, 1974). Samples
of plant tissue are placed in test tubes with similar concentrated solutions but with no dye.
Sufficient time for the possibility of water exchange to take place is allowed. After the
removal of the tissue, a small drop of the equivalent coloured solution is added to the test
tube. If the coloured drop rises, then the solution in which the tissue was held became denser.
This means that the tissue has absorbed water and that the tissue had a lower (more negative)
18

water potential than the solution. If the drop sinks, the solution has absorbed water from the
tissue and became less dense. The solution had a lower water potential than the tissue. If the
drop diffuses evenly without rising or sinking, then there was no change in concentration and
the water potential of the solution equals that of the tissue.
Knipling and Kramer (1967) found differences of 1 to 5 bar in water potential measurements
determined by the dye and psychrometric methods.
2.5.1.2 Tissue volume / liquid equilibration method
Solutions of varying concentrations are made by using sucrose, sorbitol, mannitol or
polyethylene glycol (PEG) (Slavik, 1974). Goode and Hegarty (1965) found that sucrose
penetrates into the intact plant cells and tissues and that mannitol is absorbed by higher plants.
Jackson (1962) used PEG with a molecular weight of 400 to 20 000, but Lagerwerff et al.
(1961) found that PEG with a molecular weight of 6 000 was toxic and recommends a weight
of 20 000.
A sample of plant tissue which has been measured (length or weight) is placed in the series of
solutions (Slavik, 1974). After sufficient time has been allowed for the possibility of water
exchange to take place, the tissues are measured again. A tissue that measures the same
before and after being in the solution had no gain or loss of water. This is an indication that
the tissue and solution is in equilibrium. The osmotic potential of the solution is theoretically
equal to the water potential of the tissue. Using the method of measuring tissue length is only
feasible for tissue composed of thin-walled cells with no major vascular bundles. The
gravimetric method is only suited for large masses of tissue and errors occur from failing to
dry tissue uniformly and loss of weight during handling (Kramer, 1983).
19

To avoid some of the problems with the gravimetric method, the sucrose solution can be
measured instead of the plant tissue (Kramer, 1983). The tissue gains water from solutions
with a higher potential which results in a higher concentrated solution. If the solution has a
lower potential, water will diffuse from the tissue and dilute the solution. Changes in
concentration of the sucrose solutions can be measured with a refractometer or by the
Chardakov dye method (Knipling, 1967; Knipling and Kramer, 1967).
2.5.1.3 Thermocouple psychrometer
Tissue samples and thermocouples are enclosed in small containers and immersed in a water
bath which is kept at a constant temperature (Boyer and Knipling, 1965). The sample will
generate a relative humidity in the container that is equivalent to the total water potential of
the sample at the time of sealing of the containers (Turner, 1981). By measuring the relative
humidity with a thermocouple psychrometer, the water potential can be determined by the
following equation (Turner, 1981):
ψ 0ln ee
VRT
=
Where
ψ = water potential
R = the gas constant (0.0831 kg·barsmol-1K-1)
T = the absolute temperature (K) = ˚C + 273
V = the partial molar volume of water (18 cm3·mol-1)
e/e0 = the relative humidity.
A problem with this method is measuring the relative humidity in the containers (Slavik,
1974; Turner, 1981). A psychrometer design suggested by Spanner (1951) uses the Peltier
20

effect to condense water on a thermocouple junction (Fig. 2.4). The rate of cooling depends
on the humidity of the air in the chamber and the current generated during the cooling is
measured. It was suggested that a drop of water is placed on the junction and the current
generated by evaporative cooling is measured (Richards and Otaga, 1958). Both types of
thermocouple psychrometers must be calibrated over a range of solutions with known osmotic
potentials. By modifying the Richards psychrometer with a removable thermocouple and
obtaining equilibrium readings with drops of solution of three or four different concentrations
on the junction, the isopiestic method was developed. This eliminates the need for calibration
and can be used for tissues with very low water potentials (Boyer and Knipling, 1965).
Various changes have been made to thermocouple psychrometers for monitoring soil water
potentials, the water potential in tree trunks, attached roots and attached shoots (Turner, 1981;
Kramer, 1983).
Fig. 2.4. A Peltier thermocouple psychrometer that is used for measuring water potential of
leaf tissue. To prevent a pressure build-up in the cup, the relief valve is left open until the cap
and cup are joined together (Kramer, 1983).
21
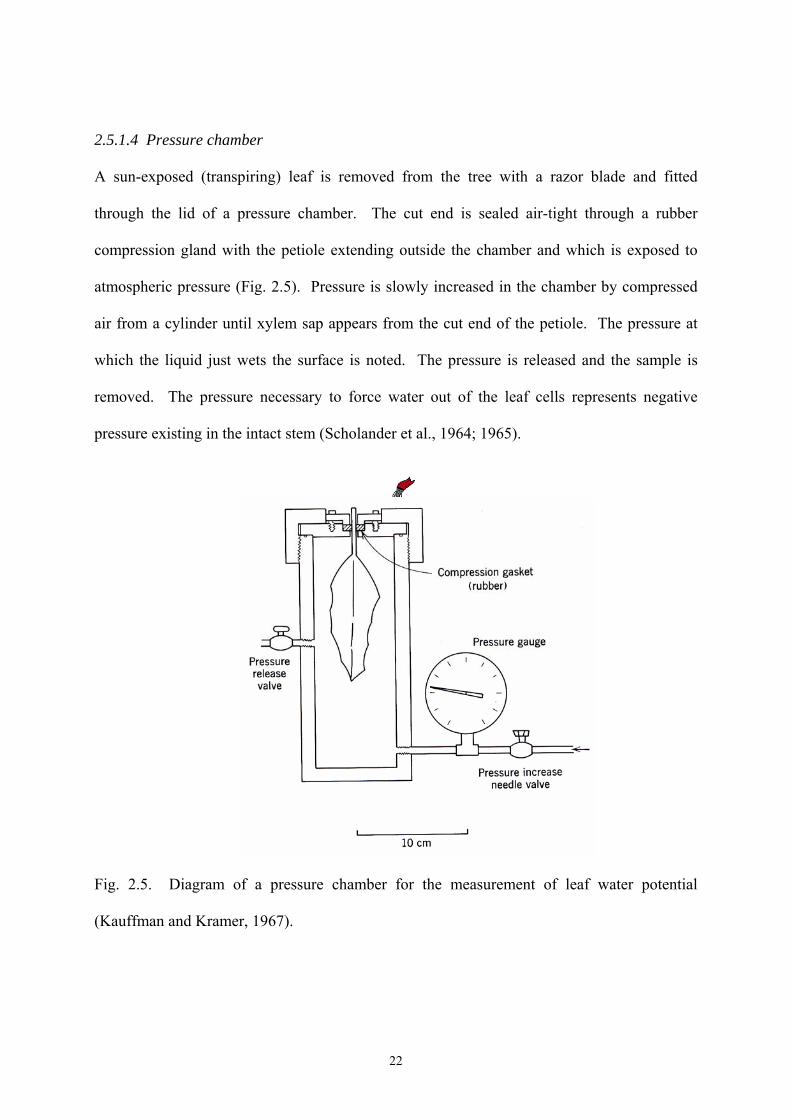
2.5.1.4 Pressure chamber
A sun-exposed (transpiring) leaf is removed from the tree with a razor blade and fitted
through the lid of a pressure chamber. The cut end is sealed air-tight through a rubber
compression gland with the petiole extending outside the chamber and which is exposed to
atmospheric pressure (Fig. 2.5). Pressure is slowly increased in the chamber by compressed
air from a cylinder until xylem sap appears from the cut end of the petiole. The pressure at
which the liquid just wets the surface is noted. The pressure is released and the sample is
removed. The pressure necessary to force water out of the leaf cells represents negative
pressure existing in the intact stem (Scholander et al., 1964; 1965).
Fig. 2.5. Diagram of a pressure chamber for the measurement of leaf water potential
(Kauffman and Kramer, 1967).
22
Leaf water potential is highly variable due to environmental conditions (McCutchan and
Shackel, 1992). Variability due to changing environmental conditions can be reduced by
predawn water potential measurements. These measurements indicate overnight recovery in
water potential through equilibration with soil water potential, rather than the water potential
experienced under midday conditions when a plant’s stomata are open and water demand is
highest due to large vapour pressure deficit. However, leaf water potential has not been
clearly related to plant water status (McCutchan and Shackel, 1992) as Jones (1985) found
that apples (Malus domestica Borkh.) grown under water stress conditions showed symptoms
of premature leaf senescence when compared to well irrigated trees, while both had similar
water potential measurements.
In contrast, stem water potential is closely related to plant water use and stomatal
conductance, and is thus a more appropriate measure of plant water stress (McCutchan and
Shackel, 1992; Schackel et al., 1997). To measure stem water potential, a leaf should be
enclosed in a black polyethylene bag and covered with aluminium foil 4 to 5 hours prior to
measurement (Begg and Turner, 1970; McCutchan and Shackel, 1992; Shackel et al., 1997;
Barry et al., 2004b). Bagging of a leaf prevents evaporation from the enclosed leaf and
eliminates within-leaf water potential gradients (Begg and Turner, 1970; Garnier and Berger,
1985). When bagged leaves remain attached to the plant, leaf water potential would be able
to reach equilibrium with the water potential of the stem and thus the plant (McCutchan and
Shackel, 1992).
Stem water potential is less influenced by environmental variability than transpiring leaf
water potential. Garnier and Berger (1985) found no difference in leaf water potential of
stressed vs. control trees, whereas there was a significant difference in stem water potential in
23

leaves of trees exposed to different water stress levels. The influence of stomatal conductance
and leaf transpiration on the water potential gradient between the leaf and the stem may be
responsible for the difference in stem and leaf water potentials (McCutchan and Shackel,
1992). During transpiration, leaf water potential is lower than stem water potential and the
difference between these two potentials will represent a water potential gradient. If this
gradient is large, then stomatal responses could cause any reduction in stem water potential to
be counterbalanced by a reduction in transpiration and the size of the water potential gradient.
If both reductions are equivalent, there could be a reduction in stomatal conductance with
decreases in stem water potential, but no change in leaf water potential.
However, the technique of stem water potential as a reliable measure of plant water status has
not been extensively used in citrus trees (Citrus spp.) (Goldhamer and Salinas, 2000; Barry et
al., 2004b). Previous studies that used this technique were done on tobacco (Nicotiana
tabacum L.) (Begg and Turner, 1970), prunes (Prunus domestica L.) (McCutchan and
Shackel, 1992), almonds (P. dulcis (Miller) D. A. Webb), cherries (P. cerasus L.) and pears
(Pyrus communis L. ) (Shackel et al., 1997), nectarines (Prunus persica (L.) Batsch) (Naor et
al., 1999) and apples (Naor and Cohen, 2003). The number and the position of leaves used
for measuring ψstem differed in each of the studies. For example, a single leaf per tree from
four trees per treatment was used by Goldhamer and Salinas (2000). Barry et al. (2004b)
measured ψstem from two terminal, sun-exposed leaves per tree that were situated in the
southwest upper canopy from two trees per treatment. McCutchan and Shackel (1992) used
two to three leaves that were located near the main scaffold branch of the tree, whereas Naor
et al. (1999) and Naor and Cohen (2003) used two leaves situated in the inner part of the tree
canopy.
24
The pressure chamber provides approximate measurements of water potential, but there is
likely more variability than using a psychrometer (Boyer, 1967).
2.5.2 Osmotic potential
The absolute value of osmotic potential is equal to the real pressure in pure water at
equilibrium (Salisbury and Ross, 1991). Osmotic potential varies with changes in solute
concentrations and is thus a less satisfactory measurement of water potential (Kramer, 1983).
The osmotic potential of solutions can be measured by using the cryoscopic / freezing-point
method, plasmolysis, refractomeric method, thermocouple psychrometers and the pressure
chamber.
2.5.2.1 Cryoscopic / freezing-point method
Properties of solutions that are functions of the mole fraction are called colligative properties
(Salisbury and Ross, 1991), and include freezing point, boiling point, vapour pressure and
osmotic potential. Osmotic potential can be calculated by using any of the other values.
Measuring the freezing point to calculate the osmotic potential is called cryoscopic or
freezing-point method and is a very accurate method of measuring the freezing point of
solutions (Slavik, 1974). Mercury thermometers and thermocouples are used for accurately
determining the freezing points of solutions. Osmotic potential can then be calculated using
the following equation (Salisbury and Ross, 1991):
ψs (in MPa) = 1.22 x freezing point (˚C).
Obtaining a plant sap solution is problematic, with different methods resulting in different
values for ψs from the same plant tissue (Slavik, 1974; Turner, 1981).
25
2.5.2.2 Plasmolysis
Tissue samples are placed in a series of solutions with known osmotic potentials (Slatyer,
1967). After an equilibration period, the tissue is examined under a microscope. Plasmolysis
occurs when half the cells in the tissue begin to plasmolyse (protoplasts begin to pull away
from cell walls). This represents an internal pressure of zero. The osmotic potential of the
solution that caused plamolysis is then the same as the osmotic potential within the cells
(Slavik, 1974).
2.5.2.3 Refractomeric method
In the refractomeric method, a drop of sap is placed on the prism of a refractometer to
determine the reading (Slavik, 1974). The relationship between the refractive index and the
osmotic potential is influenced by the concentration of solutes as well as the components of
the solution. Sugars have a larger effect than electrolytes. As the concentration of sugars
increases, so does the effect on the refractive index. Results will be more reliable if the
temperature of the measuring and illuminating prisms is kept constant. Readings are easily
made, but prisms must be cleaned and dried after each measurement (Turner, 1981).
2.5.2.4 Thermocouple psychrometer
Osmotic potential can also be measured with a psychrometer (Slavik, 1974). After the water
potential is measured, the tissue is killed by freezing with liquid nitrogen (Turner, 1981). The
equilibrium vapour pressure is measured again. The turgor pressure has been eliminated by
killing of the tissue, the new measurement represents the osmotic potential. The main
problem with this method is that the vascular sap is diluted by cell wall sap after the
disruption of the cell membranes by freezing. This may create matric potentials which are not
present in the unfrozen tissue (Kramer, 1983).
26
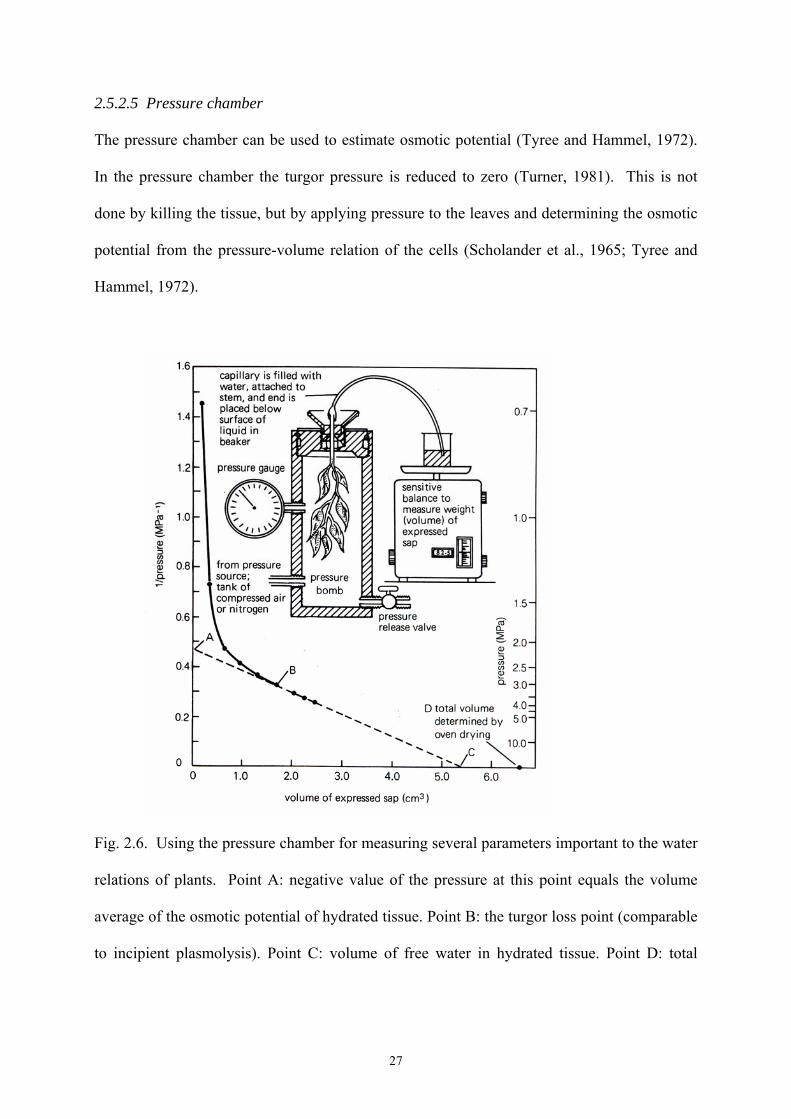
2.5.2.5 Pressure chamber
The pressure chamber can be used to estimate osmotic potential (Tyree and Hammel, 1972).
In the pressure chamber the turgor pressure is reduced to zero (Turner, 1981). This is not
done by killing the tissue, but by applying pressure to the leaves and determining the osmotic
potential from the pressure-volume relation of the cells (Scholander et al., 1965; Tyree and
Hammel, 1972).
Fig. 2.6. Using the pressure chamber for measuring several parameters important to the water
relations of plants. Point A: negative value of the pressure at this point equals the volume
average of the osmotic potential of hydrated tissue. Point B: the turgor loss point (comparable
to incipient plasmolysis). Point C: volume of free water in hydrated tissue. Point D: total
27

volume of tissue water. Bound water (including some apoplastic water) equals D minus C
(Salisbury and Ross, 1991).
A leaf is hydrated by placing the cut end in pure water for several hours and then fitted
through the lid of a pressure chamber (Salisbury and Ross, 1991). The cut end is sealed air-
tight through a rubber compression gland with the petiole extending outside the chamber
(Scholander et al., 1965). Pressure is slowly increased in the chamber until xylem sap appears
from the cut end of the petiole. As mentioned before, this pressure is an indication of the leaf
water potential. The leaf is then over-pressurised and the water which is forced from the leaf
is collected and weighed (Tyree and Hammel, 1972). From these data a pressure-volume
curve can be plotted (Fig. 2.6) which indicates the original osmotic potential and the volume
of apoplastic water (Tyree and Hammel, 1972; Turner, 1981).
2.6 Fertigation
Fertigation is the application of water-soluble fertilisers typically with drip or micro-sprinkler
irrigation systems to control water and nutrient supplies to crops (Bar-Yosef, 1999). The
main differences between drip irrigation and micro-sprinkler irrigation are that with drip
irrigation water is generally applied to a restricted root zone of the plant and at more frequent
intervals than micro-sprinkler irrigation (Elfving, 1982). By applying fertilisers through the
drip irrigation system the fertilisation efficiency is increased since nutrients are applied to a
restricted root zone (Bar-Yosef, 1999) and the roots are capable of much faster uptake of
nutrients (Bar-Yosef, 1988).
There are several advantages of fertigation. By modifying the factors affecting the changes in
the phenological stages of plant growth and development, e.g. change from reproductive to
28

vegetative growth, helps the development of trees during the first year after planting to form a
structure on which to bear fruit the following year (Richards, 1986).
Bravdo and Poebstring (1993) found that by using fertigation better control over the quality
aspects of fruit can be achieved. The best fruit quality is obtained when fruit ripens under
conditions of sufficient leaf area and minimal vegetative growth. Robinson and Stiles (1993)
found that fertigation resulted in larger apple trees with greater bearing capacity. In addition
to increasing the total yield, fertigation also increased fruit size. Boman (1996) found that
fertigation increased yield and total soluble solids for grapefruit (C. paradisi Macf.) when
compared to conventional broadcast application of nutrients. Minute concentrations of minor
elements can easily be applied by drip fertigation with less runoff than micro-sprinkler
irrigation (Bar-Yosef, 1999).
By comparing different fertigation methods, Tolmay et al. (2002) found that double drip
fertigation line treatments, each fertigated four and eight times per day, had the highest yield.
This was followed by the micro-sprinkler fertigation treatments, also fertigated four and eight
times per day. These treatments were better than the single drip fertigation treatment. Kruger
et al. (2000a) also found that a double drip line with higher fertigation frequencies had the
highest yields. This was also followed by micro-sprinkler irrigation with a single drip line
having significantly lower yields than other treatments. Lombaard (1994) found that both
double and single drip line fertigation were better than micro-sprinkler fertigation for young
citrus trees. Syvertsen and Sax (1999) found no difference in canopy growth, tree water
usage, fruit yield or growth when they compared different micro-sprinkler fertigation
treatments.
29

2.7 Open Hydroponics System (OHS)
Hydroponics is the technique of growing plants without soil (Mason, 1990). By using
hydroponics, the biosphere is altered by changing the growth medium and thereby eliminating
the dependence of plants on soil. Under normal conditions, soils function as support for the
plant and as a source of water and nutrients (Schwarz, 1995). The plant roots in a
hydroponics system grow either in air, water or in some solid, non-soil medium. This
medium does not provide or store nutrients. The water around the roots contains a balanced
mixture of nutrients which provides the food for the plant (Mason, 1990). Therefore,
hydroponics is the science of growing plants in a medium, using mixtures of essential plant
nutrient elements dissolved in water (Harris, 1971).
Hydroponic systems can be classified as either being open or closed. In open systems, the
surplus amounts of nutrient solutions are not recovered, whereas in closed systems the surplus
nutrient solution is recovered and re-used. The recovered solution is analysed for nutrients,
and nutrients that have been used by the plants can then be replaced before returning the
solution to the plants (Lippert, 1993; Stanghellini and Rasmussen 1994; Jones, 1997; Jensen,
1999; Venter, 1999).
The word hydroponics is derived from two Greek words: “hydro” meaning water and “ponos”
meaning labour (Bentley, 1959; Harris, 1971; Harris, 1987; Mason, 1990; Schwarz, 1995;
Jones, 1997). The term was first used in 1929 by Dr. W.F. Gericke, a Californian professor
who began to develop a laboratory technique into a commercial means of growing plants
(Bentley, 1959; Harris, 1971; Harris, 1987; Mason, 1990; Jones, 1997).
30

The concept of hydroponics has been practiced for centuries, for example, in the ancient
Hanging Gardens of Babylon and the floating gardens of the Aztecs in Mexico (Jones, 1990).
The basic concept was established by plant scientists investigating how plants grow. In 1600,
Jan Van Helmont of Belgium conducted an experiment that showed that plants obtain their
necessary substances from water (Schwarz, 1995). In 1699, John Woodward from England
grew plants in water to which he added different types of soil and found that certain
substances derived from soil, rather than water, were responsible for plant growth (Harris,
1971; Schwarz, 1995). German scientists, Sachs in 1860 and Knop in 1861, made synthetic
solutions of essential plant nutrients in water (Harris, 1971; Mason 1990). These
formulations combined with many other experiments, provided Dr. Gericke with the
knowledge to make an effective nutrient solution, realising the commercial potential of
hydroponics.
In the Second World War, the U.S. Army established large hydroponic gardens on several
Pacific islands to supply fresh vegetables to troops (Harris, 1971; Mason, 1990; Jones, 1997).
The development of a system known as Nutrient Film Technique (NFT) by Dr. A. Cooper
from the United Kingdom in the 1970’s made the hydroponic growing of a wide range of
plants commercially viable (Mason, 1990; Cooper, 1996).
Open hydroponics adapts the principles of soil-less hydroponics to the production of fruit
trees in a soil medium. The open hydroponics system (OHS) is a sensitive nutrient and
moisture management system with a high degree of control over the development of the crop
(Stassen et al., 1999). Specific water and nutrient requirements for different phenological
stages of the plant are applied through daily fertigation. A balanced nutrient solution with
controlled pH and EC is applied using a drip irrigation system. This concept includes
31
reducing the influence of soil as a water and nutrient storage medium, and using the soil to
anchor the plant and to deliver nutrients to the roots (Stassen et al., 1999). The principles of
these adaptations are to reduce the size of the root zone, by reducing the wetted soil volume,
and the continuous application of a pH-buffered nutrient solution. At the beginning of the
1990’s, Professor Rafael Martinez Valero of Spain brought all the concepts of hydroponics
together to develop the commercial application of the open hydroponics system and later
called it Martinez Open Hydroponics Technologies (MOHT) (Martinez and Fernandez, 2004;
Falivene et al., 2005).
2.7.1 Advantages of OHS
The advantages of using OHS include: crops can be grown in areas where soils are not
suitable for cultivation (Mason, 1990; Jones, 1997); less labour is required as fertilisers are
applied through the irrigation system and not by hand (Schwarz, 1995); water and nutrients
are conserved as both are applied in correct quantities and close to the plant with less waste
(Mason, 1990; Schwarz, 1995; Jones, 1997), which also leads to less weed growth (Harris,
1971; Mason, 1990); yields are increased with increases in fruit size (Harris, 1971; Schwarz,
1995); and producers have better control over the system to ensure that the correct amounts of
nutrients are applied at the different physiological stages of plant development to optimise
growth (Harris, 1971).
Reducing the wetted soil volume by reducing the amount of drippers per tree restricts the root
zone. This principle makes it possible to practice OHS in arid climates (Falivene et al., 2005).
Studies done on restricting root zones found a decrease in fruit yields. Boland et al. (2000)
found a decrease in yield and growth of peach trees. Bar-Yosef et al. (1988) found that
restricting root zones decreased yield, total dry matter production and water uptake rates, but
32

found an increase in soluble solids in fruit. These declines coincided with a decrease in apple
tree growth. It is possible that under OHS conditions, roots grow more densely in a smaller
soil volume, but that this volume is sufficient to support root growth and a productive tree
(Falivene et al., 2005). The smaller tree makes harvesting easier (Coetzee, 1998).
As a nutrient solution moves through the soil to the roots, the soil will buffer and change the
nutrient solution. In a restricted root zone, the applied nutrients move through a smaller
amount of soil to reach the roots (Falivene et al., 2005). Water and nutrients are conserved as
both are applied in correct quantities and close to the plant with less waste (Mason, 1990;
Schwarz, 1995; Jones, 1997).
Different nutrient solutions are used at different physiological growth stages, but any nutrient
can be added at any stage (Woods, 1999). A computer system is necessary for injecting the
nutrients in the correct amounts as programmed before entering the irrigation system (Van
Rooyen, 2000).
OHS attempts to maintain soil moisture near field capacity whereas in the MOHT system soil
moisture is maintained above field capacity. Martinez and Fernandez (2004) suggests that
roots are able to take up more water and nutrients at soil moisture levels above field capacity.
Martinez and Fernandez (2004) claim that this allows stomata to stay open longer during peak
water demand periods. Leaves will be able to photosynthesise longer, producing more
carbohydrates which increases the productivity of the tree. To optimise this productivity,
Woods (1999) suggests that irrigation should be applied at 1300 HR. However, Schoeman
(2002) suggested that morning conditions should be optimised by early irrigation so that
plants can perform optimally at the time of highest photosynthetic activity.
33

Water from the drippers form separate “onion-shaped” wetting patterns in the soil with 96%
of roots found in the wetted areas. Drippers should be spaced to ensure that the wetted areas
do not touch (Woods, 1999). The roots are always well aerated as flooding of the whole root
system does not occur.
Trees can easily be manipulated by using OHS. By applying water stress selectively, fruit
quality can be manipulated (Woods, 1999) and shoot growth can be controlled (Woods, 1999;
Groenewald, 2000).
Martinez and Fernandez (2004) claimed to have eliminated alternate bearing and increased
yields with citrus fruit quality being better than the export thresholds by using the MOHT
system. Kuperus et al. (2002) found an increase in fruit yield for ‘Valencia’ orange on OHS
when compared to conventional systems. Kruger et al. (2000b) found an increase in yield in
‘Clementine’ mandarin, but fruit size was smaller than conventional treatment. They also
found an increase in yield and fruit size in ‘Valencia’ orange.
2.7.2 Disadvantages of OHS
The disadvantages of using OHS are mainly related to costs and control. The initial costs of
construction and implementation of OHS equipment is high (Harris, 1971, Mason, 1990,
Jones, 1997), and converting from a conventional system to OHS is expensive (Woods,
1999).
To successfully use the open hydroponic system, knowledge is required to operate the system
and of the principles of plant physiology and plant nutrition (Harris, 1971; Mason, 1990;
34

Jones, 1997; Schwarz, 1997). As the root zone is more restricted, a higher level of control
over the irrigation and nutrient solution is required (Falivene et al., 2005).
OHS requires a constant supply of water. The shut down of the irrigation system has major
implications for OHS with a restricted root zone whereas the implication for a conventional
system is relatively minor (Falivene et al., 2005). By using OHS, the advantages of receiving
rainfall are neutralised (Woods, 1999).
An intensive fertigation system increases the possibility of soil acidification and salt
accumulation on the edges of the wetted zone. The opposite is also possible with maintaining
soil moisture close to field capacity, the risk of nutrient leaching is increased, although
leaching can be a problem in all irrigation systems.
2.8 Daily Drip Fertigation (DDF)
Since the implementation of MOHT in horticultural practices all over the world, many
variations of the concept have developed. The variation in OHS will be referred to as Daily
Drip Fertigation (DDF). Daily drip fertigation involves drip fertigation of plants on a daily
basis during daylight hours (Stassen et al., 1999; Pijl, 2001; Schoeman, 2002).
The main difference between OHS and DDF is that DDF uses a larger conventional root zone
volume with irrigation being applied more frequently and only during daylight hours
compared with OHS (Falivene et al., 2005). The implication hereof is that the characteristics
of the soil, and its function as a storage medium is better utilised. This reduces the
application rate of certain nutrients, and the cost-benefit should also be taken into account.
35
The larger wetted volume contains more water and nutrients that is available for a longer
period of time for the roots. Irrigation is applied in numerous “pulses” using the DDF system.
The highest concentration of roots is found under drippers where the most nutrients and water
are available (Falivene et al., 2005). Pijl (2001) found that root development under DDF was
excellent, but limited to the strip next to and between the wetted zones. Roots of plants under
conventional (micro-sprinkler) irrigation were well developed and much more scattered than
DDF.
Pre-dawn xylem water potential measurements indicated that plants under DDF performed
optimally early in the morning compared to plants under micro-sprinkler irrigation
(Schoeman, 2002). However, the plants were also under stress since midday depression
occurred with little recovery in the afternoon. In general, plants under DDF have excellent
water conditions in rooting volume and therefore experience minimal levels of stress. The
limited root volume does not supply water to the same extent as a larger root volume would in
response to high atmospheric demand. A larger root volume enhances recovery from midday
depression (Schoeman, 2002).
36
CHAPTER 3
STEM WATER POTENTIAL AS A MEASURE OF PLANT WATER STATUS IN
CITRUS TREES (CITRUS SPP.)
Abstract
This study was undertaken to quantify the effects of daily fertigation on ecophysiological
responses in citrus trees (Citrus spp.) as part of a larger study. Initial research was conducted
to optimise and standardise the sampling procedure to quantify stem water potential (ψstem) in
citrus trees. To reliably determine the plant water status of citrus trees, the following
conditions are required to minimise unwanted variation in ψstem measurements. Bagging of
leaves with black polyethylene envelopes covered with aluminium foil 3 to 4 hours prior to
measuring ψstem allows the plant water status in those leaves to equilibrate with whole-tree
plant water status, thereby providing a realistic measurement of the current water status. The
use of aluminium foil to cover the bagged leaves, reduces unwanted heat stress by reflecting
sunlight, and dramatically reduced variation in ψstem. On average, the difference between
measurements of bagged leaves without aluminium foil and bagged leaves covered with
aluminium foil was 0.19 MPa in the 2002-03 season and 0.13 MPa in the 2003-04 season.
The time of day at which ψstem measurements are made is important to ensure consistency in
comparisons among treatments and interpretation of irrigation treatment effects.
“Physiological midday” is the preferred time of day to measure ψstem, i.e. 1100 HR.
Transpiring leaves with open stomata would be in sun-exposed positions on the east side of
trees and should be used for making ψstem measurements. On average, the difference in ψstem
on the east and west side of trees was 0.17 MPa and 0.22 MPa in the 2002-03 and 2003-04
seasons, respectively. Under similar experimental conditions as those used here, only three
leaves per replicate are required to detect a difference of 0.05 MPa in ψstem between treatment
37

means. Plant water status categories were developed which may have useful practical
applications, i.e. >-1.0 MPa = no water deficit; -1.0 to -1.2 MPa = low water deficit; -1.2 to -
1.4 MPa = moderate water deficit; <-1.4 to -1.6 MPa = high water deficit; and <-1.6 MPa =
severe water deficit.
Introduction
The water potential of a plant is an indication of the plant’s water status as water potential
accounts for the integrated effect of soil, plant and atmospheric conditions on water
availability within the plant (McCutchan and Shackel, 1992). The potentials and resistances
to water flow within a plant could not be measured accurately until the development of the
pressure chamber simplified the measurement of water potentials in fields and orchards
(Scholander et al., 1964; 1965). By measuring the water potential of sun-exposed
(transpiring) leaves, leaf water potential could be estimated.
Leaf water potential is highly variable due to prevailing environmental conditions
(McCutchan and Shackel, 1992). Variability due to changing environmental conditions can
be reduced by using predawn water potential measurements. These measurements indicate
overnight recovery in water potential through equilibration with soil water potential, rather
than the water potential experienced under midday conditions when a plant’s stomata are open
and water demand is highest due to large vapour pressure deficit. However, leaf water
potential has not been clearly related to plant water status (McCutchan and Shackel, 1992) as
Jones (1985) found that apples (Malus domestica Borkh.) grown under water stress conditions
showed symptoms of premature leaf senescence when compared to well irrigated trees, while
both had similar water potential measurements.
38

In contrast, stem water potential is closely related to plant water use and stomatal
conductance, and is thus a more appropriate measure of plant water stress (McCutchan and
Shackel, 1992; Shackel et al., 1997). To measure stem water potential, a leaf is enclosed in a
black polyethylene bag and covered with aluminium foil 4 to 5 hours prior to measurement
(Begg and Turner, 1970; McCutchan and Shackel, 1992; Shackel et al., 1997; Barry et al.,
2004b). Bagging of a leaf prevents transpiration from the enclosed leaf and eliminates within-
leaf water potential gradients (Begg and Turner, 1970; Garnier and Berger, 1985). When
bagged leaves remain attached to the plant, leaf water potential would be able to reach
equilibrium with the water potential of the stem and thus the plant (McCutchan and Shackel,
1992).
Stem water potential is less influenced by environmental variability than transpiring leaf
water potential. Garnier and Berger (1985) found no difference in leaf water potential of
stressed vs. control trees, whereas there was a significant difference in stem water potential in
leaves of trees exposed to different water stress levels. The influence of stomatal conductance
and leaf transpiration on the water potential gradient between the leaf and the stem may be
responsible for the difference in stem and leaf water potentials (McCutchan and Shackel,
1992). During transpiration, leaf water potential is lower than stem water potential and the
difference between these two potentials will represent a water potential gradient. If this
gradient is large, then stomatal responses could cause any reduction in stem water potential to
be counterbalanced by a reduction in transpiration and the size of the water potential gradient.
If both reductions are equivalent, there could be a reduction in stomatal conductance with
decreases in stem water potential, but no change in leaf water potential.
39
However, the technique of stem water potential as a reliable measure of plant water status has
not been extensively used in citrus trees (Citrus spp.) (Goldhamer and Salinas, 2000; Barry et
al., 2004b). Previous studies that used this technique were done on tobacco (Nicotiana
tabacum L.) (Begg and Turner, 1970), prunes (Prunus domestica L.) (McCutchan and
Shackel, 1992), almonds [P. dulcis (Miller) D.A. Webb], cherries (P. cerasus L.) and pears
(Pyrus communis L.) (Shackel et al., 1997), nectarines (P. persica (L.) Batsch) (Naor et al.,
1999) and apples (Naor and Cohen, 2003). The number and the position of leaves used for
measuring stem water potential differed in each of the studies. For example, a single leaf per
tree from four trees per treatment was used by Goldhamer and Salinas (2000). Barry et al.
(2004b) measured stem water potential from two terminal, sun-exposed leaves per tree that
were situated in the southwest upper canopy from two trees per treatment. McCutchan and
Shackel (1992) used two to three leaves that were located near the main scaffold branch of the
tree, whereas Naor et al. (1999) and Naor and Cohen (2003) used two leaves situated in the
inner part of the tree canopy.
Therefore, the purpose of this study was to optimise the sampling procedure to reliably
determine the plant water status of citrus trees. To optimise this sampling procedure, leaf and
stem water potentials were quantified under varying conditions to minimise the variation in
water potential measurements and thereby develop a reliable sampling procedure to determine
plant water status.
Materials and Methods
Site and plant material. This experiment was conducted at Welgevallen Experimental Farm,
Stellenbosch University, Stellenbosch, Western Cape province, South Africa (33°57’S,
18°53’E; 75 m elev.). ‘Nules Clementine’ mandarin trees (C. reticulata Blanco) on ‘Troyer’
40

citrange rootstock [Poncirus trifoliata (L.) Raf x C. sinensis (L.) Osb.] planted in 1992 in a N-
S row orientation, were used during the late summer and autumn of 2002-03 and 2003-04.
Data collection. To determine the importance of minimising heat build-up of bagged leaves
when measuring stem water potential (ψstem), 20 mature, healthy leaves were selected on the
east side of five trees. Leaves were bagged with small, black polyethylene envelopes at 0800
HR, and half of the bagged leaves were immediately covered with aluminium foil and the other
half were left uncovered. Stem water potential was measured with a PMS 600 pressure
chamber (PMS Instruments, Albany, Ore., USA) at 1100 HR following procedures outlined by
McCutchan and Shackel (1992) and Barry et al. (2004b).
To determine whether canopy position on which leaves are borne affects ψstem, 10 mature,
healthy leaves were randomly selected from each of the east and west sides of five trees.
Leaves were bagged and covered with aluminium foil, as described above, at 0800 HR. Stem
water potential was measured at 1100 HR.
To quantify the diurnal changes in leaf water potential (ψleaf) to determine optimal sampling
time for ψstem measurements, 10 mature, healthy leaves were selected on the east side of five
trees. Leaf water potential of unbagged leaves was measured at 0630 HR, 0800 HR, 1045 HR
and 1400 HR.
Statistical analysis. Data were subjected to analysis of variance (ANOVA) using the GLM
procedure of SAS (SAS Inc., Cary, N.C., USA). Means were separated by Fisher’s least
significant difference (LSD).
41

To determine sample size, a standard sample size equation (Steel and Torrie, 1980) was used
to calculate sample size estimates for the number of leaves per sample or trees (replicates)
required to detect a difference between two means, n = (2 • tα2 • S2)/d2, where n is the number
of leaves or trees, t is Student’s t-value for the degrees of freedom associated with S2 at P ≤
0.05 (when α = 0.05 and df = 15 to 27, then t ≈ 2.1), S2 is the sample variance for leaves or
trees, and d is the desired degree of precision, or the difference to be detected between
treatment means. The numbers of leaves per sample and replications required to detect
differences between two treatment means for ψstem, at a desired degree of precision and at P ≤
0.05, was plotted to generate Fig. 3.7.
Results
Effect of reducing heat build-up on ψstem. During both seasons, ψstem measurements of bagged
leaves without aluminium foil were significantly (P<0.05) more negative than that of bagged
leaves covered with aluminium foil (Figs. 3.1 and 3.2). On average, over all sampling dates,
this difference was 0.19 MPa in the 2002-03 season and 0.13 MPa in the 2003-04 season. In
both seasons, sample variance was greatest in this component of the overall study where the
black polyethylene bags were either covered with aluminium foil or left uncovered (Table
3.1).
Effect of canopy position on ψstem. Stem water potential at 1100 HR was significantly (P<0.05)
more negative on the east than the west side of trees in both the 2002-03 (Fig. 3.3) and the
2003-04 (Fig. 3.4) seasons. The difference in ψstem between the east and west side of trees
was consistent over nine sampling dates during the two seasons. On average, this difference
in ψstem was 0.17 MPa and 0.22 MPa in the 2002-03 and 2003-04 seasons, respectively.
42

Where ψstem measurements were taken from two canopy positions, sample variance was
relatively large (0.01008; Table 3.1).
Diurnal changes in ψleaf. Leaf water potential was highest (least negative) at dawn and
decreased through the day until stomatal closure at physiological midday (1045 HR), at which
time ψleaf was most negative. This response was consistent over both the 2002-03 (Fig. 3.5)
and 2003-04 seasons (Fig. 3.6). During 2002-03, ψleaf at 1400 HR was slightly less negative
than at 0800 HR, until 13 Jan. 2003 after which time the 1400 HR ψleaf measurements were
slightly more negative. There was no significant difference in ψleaf on 13 Jan. 2003 and 4 Feb.
2003. During the 2003-04 season, the 1400 HR ψleaf measurements were more negative except
on 16 Jan. 2004 and 5 Feb. 2004. Leaf water potential measurements were significantly
(P<0.05) different on 5 Dec. 2003 and 12 Mar. 2004. The average differences in ψleaf
between dawn and midday measurements were 0.41 MPa in 2002-03 and 0.58 MPa in 2003-
04. Sample variance was 0.00738 during the 2003-04 season when ψleaf was measured at
different times of the day (Table 3.1).
Determining optimal sample size. The relationship between the number of leaves or
replicates and the difference to be detected between treatment means (degree of precision) are
represented by an asymptotic line (Fig. 3.7). The difference to be detected, or the degree of
precision, becomes smaller as the number of leaves increases, and the slope of the line
decreases with the increasing sample size. To detect a difference in ψstem between treatment
means of 0.05 MPa, three leaves would be required to take ψstem measurements.
43

Discussion and Conclusions
Stem water potential of leaves that were bagged in black polyethylene envelopes, but not
covered with aluminium foil, was more negative than leaves that were bagged and covered.
The uncovered black polyethylene envelopes have the ability to absorb more sunlight than
envelopes covered by aluminium foil which probably results in an increase in temperature,
although this was not measured. The rise in temperature will affect humidity in the envelope,
and changes in humidity will adversely effect stomatal functioning. Whereas aluminium foil
has the ability to reflect more sunlight than the black envelopes, the micro-climate in the
covered envelopes is less affected. Furthermore, potential variance in ψstem measurements
was dramatically reduced when the black polyethylene envelopes were covered with
aluminium foil.
In rows planted in a north-south orientation, which is considered to be the most efficient row
orientation for the interception of available sunlight for photosynthesis, the east side of trees
in the row is exposed to morning sun, while the west side of trees is partly shaded during the
morning when the rate of photosynthesis is highest and stomata are open. Stem water
potential was more negative on the east side of trees during both the 2002-03 and the 2003-04
seasons, which is the side that is more representative of transpiring trees prior to midday
depression (1100 HR). By sampling leaves from a fixed canopy position, variation in ψstem
measurements was reduced. The difference in ψstem between the east and west sides of trees
was relatively consistent within a season and between seasons. Although it appears not to be
critical which side of the tree is used for ψstem measurements, it is imperative that leaves be
sampled from only one canopy position, and sampling from sun-exposed leaves provides a
more accurate measurement of plant water status.
44

Where water potential of unbagged leaves was measured, the typical diurnal changes in ψleaf
were observed; leaf water potential was highest at dawn and lowest at physiological midday
due to depression of photosynthesis, with recovery thereafter resulting in less negative values
of ψleaf at 1400 HR.
Seasonal changes in ψstem were observed in both seasons. More negative ψstem measurements
at certain times of the year were likely due to hotter, drier conditions experienced during those
times. Direct comparisons of ψstem between sampling dates or between seasons cannot be
meaningfully made unless soil water status is also taken into account. However, the
development of plant water status categories may have useful practical applications, i.e. >-1.0
MPa = no water deficit; -1.0 to -1.2 MPa = low water deficit; -1.2 to -1.4 MPa = moderate
water deficit; <-1.4 to -1.6 MPa = high water deficit; and <-1.6 MPa = severe water deficit.
To optimise and standardise the sampling procedure to reliably determine the plant water
status of citrus trees, the following conditions are required to minimise unwanted variation in
ψstem measurements. Bagging of leaves with black polyethylene envelopes covered with
aluminium foil 3 to 4 hours prior to measuring ψstem allows the plant water status in those
leaves to equilibrate with whole-tree plant water status, thereby providing a realistic
measurement of the current water status. The use of aluminium foil to cover the bagged
leaves reduces heat build-up by reflecting sunlight and dramatically reduces variation in ψstem.
The time of day at which ψstem measurements are made is important to ensure consistency in
comparisons among treatments. The preferred time of day to measure ψstem is prior to midday
depression in photosynthesis (1100 HR). The east side of trees is more representative of
transpiring leaves with open stomata and should be used for making ψstem measurements.
When a standardised sampling procedure was used to determine ψstem, sample variance was
45

relatively low (0.00317; Table 3.1), and under similar experimental conditions, only three
leaves per replicate would be required to detect a difference in ψstem between treatment means
of 0.05 MPa.
46

Table 3.1. Summary of sample variances during the 2003-04 season for various experiments.
Experiment Sample variance
Cover with aluminium foil 0.01526 Canopy position 0.01008 Time of day 0.00738 Backsberg (5 Mar 2004) 0.00317
47

-1.70
-1.50
-1.30
-1.10
-0.90
-0.70
-0.5005/1
1/2002
29/11/200
2
06/12/200
2
13/01/200
3
04/02/200
3
24/02/200
3
11/03/200
3
08/04/200
3
24/04/200
3St
em w
ater
pot
entia
l (M
Pa)
With aluminium foilWithout aluminium foil b
bb
bb
bb
bb
a
aa
aaa
a
aa
Fig. 3.1. Effect of aluminium foil on stem water potential (MPa) of ‘Nules Clementine’ mandarin sampled at Welgevallen Experimental Farm, Stellenbosch, during the 2002-03 season. Leaves from the east side of the trees were bagged and either covered with aluminium foil or left uncovered at 0800 HR and sampled at 1100 HR. There were 10 leaves per replicate, and five replicates. Data points, within sampling dates, with different letters are significantly different (P<0.05).
-1.70
-1.50
-1.30
-1.10
-0.90
-0.70
-0.5005/1
2/2003
16/01/200
4
05/02/200
4
27/02/200
4
12/03/200
4
09/04/200
4
23/04/200
4
Stem
wat
er p
oten
tial (
MPa
) With aluminium foilWithout aluminium foil
aaa
aa
a
b
a
bbbb
b
b
Fig. 3.2. Effect of aluminium foil on stem water potential (MPa) of ‘Nules Clementine’ mandarin sampled at Welgevallen Experimental Farm, Stellenbosch, during the 2003-04 season. Leaves from the east side of the trees were bagged and either covered with aluminium foil or left uncovered at 0800 HR and sampled at 1100 HR. There were 10 leaves per replicate, and five replicates. Data points, within sampling dates, with different letters are significantly different (P<0.05).
48

-1.50
-1.40
-1.30
-1.20
-1.10
-1.00
-0.9007/1
1/2002
27/11/200
2
03/12/200
2
17/01/200
3
07/02/200
3
27/02/200
3
13/03/200
3
10/04/200
3
25/04/200
3St
em w
ater
pot
entia
l (M
Pa)
EastWest
bbbb
bbbb
aaa
b
a
a
a
a
aa
Fig. 3.3. Effect of canopy position on stem water potential (MPa) of ‘Nules Clementine’ mandarin sampled at Welgevallen Experimental Farm, Stellenbosch, during the 2002-03 season. Leaves from the east and west sides of the trees were bagged and covered with aluminium foil at 0700 HR and sampled at 1100 HR. There were 10 leaves per replicate, and five replicates. Data points, within sampling dates, with different letters are significantly different (P<0.05).
-1.50
-1.40
-1.30
-1.20
-1.10
-1.00
-0.9005/1
2/2003
16/01/200
4
05/02/200
4
27/02/200
4
12/03/200
4
09/04/200
4
23/04/200
4
Stem
wat
er p
oten
tial (
MPa
)
EastWest
bbb
bbb
a
b
a
aaaa
a
Fig. 3.4. Effect of canopy position on stem water potential (MPa) of ‘Nules Clementine’ mandarin sampled at Welgevallen Experimental Farm, Stellenbosch, during the 2003-04 season. Leaves from the east and west sides of the trees were bagged and covered with aluminium foil at 0700 HR and sampled at 1100 HR. There were 10 leaves per replicate, and five replicates. Data points, within sampling dates, with different letters are significantly different (P<0.05).
49

-1.60
-1.40
-1.20
-1.00
-0.80
-0.60
-0.4022
/10/
2002
05/1
1/20
02
29/1
1/20
02
06/1
2/20
02
13/0
1/20
03
04/0
2/20
03
24/0
2/20
03
11/0
3/20
03
08/0
4/20
03
24/0
4/20
03
Leaf
wat
er p
oten
tial (
MPa
) 0630 HR0800 HR1045 HR1400 HR
Time 22/10/2002 05/11/2002 29/11/2002 06/12/2002 13/01/2003
0630 HR -0.64 a -0.62 a -0.56 a -0.53 a -0.60 a 0800 HR -0.82 b -0.74 b -0.77 b -0.82 c -0.78 b 1045 HR -1.02 c -1.08 c -1.11 c -1.06 d -1.07 c 1400 HR -0.69 a -0.68 ab -0.65 ab -0.70 b -0.76 b
P-value 0.0001 0.0001 0.0001 0.0001 0.0001
lsd 0.118 0.111 0.119 0.102 0.099
Time 04/02/2003 24/02/2003 11/03/2003 08/04/2003 24/04/2003
0630 HR -0.84 a -1.04 a -1.08 a -1.05 a -1.02 a 0800 HR -1.06 b -1.09 a -1.18 b -1.12 b -1.11 b 1045 HR -1.32 c -1.38 c -1.49 d -1.30 d -1.33 c 1400 HR -1.09 b -1.22 b -1.27 c -1.19 c -1.15 b
P-value 0.0001 0.0001 0.0001 0.0001 0.0001
lsd 0.083 0.078 0.080 0.068 0.065
Fig. 3.5. Effect of time of day on leaf water potential (MPa) of ‘Nules Clementine’ mandarin sampled at Welgevallen Experimental Farm, Stellenbosch, during the 2002-03 season. Unbagged leaves from the east side of the trees were sampled. There were 10 leaves per replicate and five replicates. Data are presented both in graphical and in tabular format to assist with interpretation.
50

-1.60
-1.40
-1.20
-1.00
-0.80
-0.60
-0.4005
/12/
2003
16/0
1/20
04
05/0
2/20
04
27/0
2/20
04
12/0
3/20
04
09/0
4/20
04
23/0
4/20
04
Leaf
wat
er p
oten
tial (
MPa
) 0630 HR0800 HR1045 HR1400 HR
Time 05/12/2003 16/01/2004 05/02/2004 27/02/2004 12/03/2004 09/04/2004 23/04/2004
0630 HR -0.60 a -0.81 a -0.83 a -0.86 a -0.86 a -0.83 a -0.83 a 0800 HR -0.81 b -1.03 b -1.07 b -1.06 b -1.03 b -1.14 b -1.09 b 1045 HR -1.21 d -1.33 c -1.35 c -1.42 c -1.42 d -1.53 c -1.45 c 1400 HR -0.97 c -1.02 b -1.05 b -1.09 b -1.19 c -1.18 b -1.14 b
P-value 0.0001 0.0001 0.0001 0.0001 0.0001 0.0001 0.0001
lsd 0.078 0.080 0.093 0.102 0.086 0.100 0.100 Fig. 3.6. Effect of time of day on leaf water potential (MPa) of ‘Nules Clementine’ mandarin sampled at Welgevallen Experimental Farm, Stellenbosch, during the 2003-04 season. Unbagged leaves from the east side of the trees were sampled. There were 10 leaves per replicate and five replicates. Data are presented both in graphical and in tabular format to assist with interpretation.
51
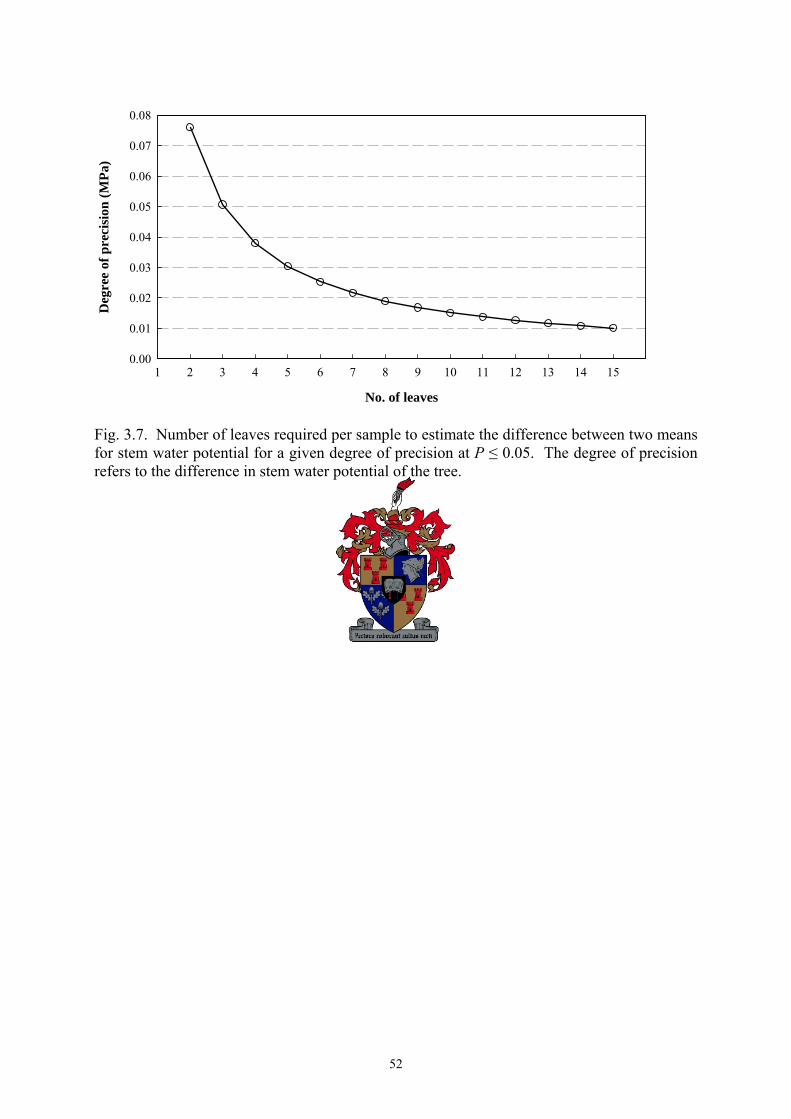
No. of leaves
1 2 3 4 5 6 7 8 9 10 11 12 13 14 15
Deg
ree
of p
reci
sion
(MPa
)
0.00
0.01
0.02
0.03
0.04
0.05
0.06
0.07
0.08
Fig. 3.7. Number of leaves required per sample to estimate the difference between two means for stem water potential for a given degree of precision at P ≤ 0.05. The degree of precision refers to the difference in stem water potential of the tree.
52

CHAPTER 4
QUANTIFICATION OF DAILY DRIP FERTIGATION ON PLANT WATER STATUS
AND SUGAR ACCUMULATION IN CITRUS TREES (CITRUS SPP.)
Abstract
Attempts are being made to develop systems that improve crop management and enhance
citrus fruit (Citrus spp.) production through efficient and timeous application of water and
mineral nutrients which has led to the use of daily drip fertigation or the open hydroponics
system (OHS). However, these perceived benefits are not necessarily supported by facts.
Fruit size and yield are apparently enhanced, but possible negative aspects of the system have
not been quantified. Fruit produced on trees grown under daily drip fertigation generally have
a lower total soluble solids concentration. This is mainly due to a dilution effect that is
caused by the greater availability of water and the uptake thereof. Sugar accumulation can be
optimised by controlling the amount of water that the plant receives at different
developmental stages. Therefore, it is essential to quantify the ecophysiological responses
and benefits of OHS/daily fertigation, as well as the effects of this technology on fruit quality.
‘Nules Clementine’ mandarin (C. reticulata Blanco) trees in two commercial orchards in
Simondium, Western Cape province, South Africa, received differential irrigation treatments.
The treatments were applied at the end of stage I (± mid December) of fruit development.
Stem water potential, fruit size and internal fruit quality were determined. Water-deficit stress
enhanced sugar accumulation of ‘Nules Clementine’ mandarin by 0.3 to 0.6 °Brix under
certain conditions. These conditions require that the difference in ψstem should be of a
sufficient intensity of between 0.16 and 0.3 MPa, and this difference should be maintained for
a sufficient duration of between 4 and 6 weeks. Furthermore, deficit irrigation should be
53

applied relatively early in fruit development, namely during the sugar accumulation stage
which starts within 4 weeks of the end of the fruit drop period and continues until harvest.
Introduction
Fertigation is the application of water-soluble fertilisers typically with drip or micro-sprinkler
irrigation systems to control water and nutrient supplies to crops (Bar-Yosef, 1999). The
main differences between drip irrigation and micro-sprinkler irrigation are that with drip
irrigation water is generally applied to a restricted root zone of the plant and at more frequent
intervals than micro-sprinkler irrigation (Elfving, 1982). By applying fertilisers through the
drip irrigation system the fertilisation efficiency is increased since nutrients are applied to a
restricted root zone (Bar-Yosef, 1999) and the roots are capable of much faster uptake of
nutrients (Bar-Yosef, 1988).
The open hydroponics system (OHS) is a sensitive nutrient and moisture management system
with a high degree of control over the development of the crop (Stassen et al., 1999). Specific
water and nutrient requirements for different phenological stages of the plant are applied
through daily fertigation. A balanced nutrient solution with controlled pH and EC is applied
using a drip irrigation system.
At the beginning of the 1990’s, Professor Rafael Martinez Valero of Spain brought all the
concepts of hydroponics together to develop the commercial application of the open
hydroponics system and later called it Martinez Open Hydroponics Technologies (MOHT)
(Martinez and Fernandez, 2004; Falivene et al., 2005). Since the implementation of MOHT
in horticultural practices all over the world, many variations of the concept have developed.
The variation in OHS will be referred to as Daily Drip Fertigation (DDF). Daily drip
54

fertigation involves drip fertigation of plants on a daily basis during daylight hours (Stassen et
al., 1999; Pijl, 2001; Schoeman, 2002).
DDF results in increased yield and fruit size (Kruger et al. 2000a; 2000b; Kuperus et al.,
2002; Martinez and Fernandez, 2004), but there is no evidence that DDF does not adversely
affect sugar accumulation. Anecdotal evidence from several citrus producers in South Africa
suggests that the sugar content of fruit produced under OHS tends to be lower than that of
fruit produced under conventional micro-sprinkler irrigation (G.H. Barry, personal
communication). The reported reduction in sugar content under OHS conditions could be
explained as follows: DDF results in a dilution effect as the amount of water given by the
pulse/daily irrigation dilutes the sugars which accumulate in the fruit. It is well-known that
rootstocks of differing vigour have varying affects on the dilution of accumulated sugars
(Harding and Lewis, 1941; Miller, 1990; Barry et al., 2004b). Scions budded on invigorating
rootstocks, e.g. rough lemon (C. jambhiri Lush.), produce large fruit with low sugars, while
scions budded on less invigorating rootstocks, e.g. trifoliate [Poncirus trifoliata (L.) Raf.] or
citrange (C. sinensis x P. trifoliata), produce smaller fruit with higher sugars (Harding and
Lewis, 1941; Miller, 1990; Barry et al., 2004a; 2004b). Rough lemon rootstock has a more
extensive root system than citrange rootstocks, which allows the roots to absorb more water
from a larger soil volume. Rough lemon rootstock is also more effective at water absorption
due to differences measured in plant water status between these rootstocks. Fruit harvested
from scions on citrange rootstock had 30% higher sugars than fruit from rough lemon trees
(Barry et al., 2004b).
Managed drought stress is known to increase sugar accumulation in Citrus (Yakushiji et al.,
1996; 1998; Barry et al., 2004b). Although Syvertsen and Albrigo (1980) found no evidence
55
of osmotic adjustment in citrus trees to water stress, the water stress conditions that they
applied was not severe enough. Meyer and Boyer (1981), Yakushiji et al. (1996; 1998) and
Barry et al. (2004b) observed more sugar accumulation in plants under water stress than in
unstressed plants. Osmotic adjustment is a physiological function that takes place under
water stress conditions (Meyer and Boyer, 1981). This process involves enough solute
accumulation in cells to decrease the cell osmotic potential when cell water potential
decreases at low water potential. Water can then be absorbed from a water source by cells
without losing cell turgor or decreasing cell volume, while solutes accumulate in juice
vesicles (Morgan, 1984). During water stress conditions, the cell size and turgor will be
maintained due to solute accumulation in cells at low water potentials. Yakushiji et al. (1996;
1998) found that ‘Satsuma’ mandarin (C. unshiu Marc.) fruit underwent osmotic adjustment
as a mechanism of accumulating sugars under low water potentials when trees were
moderately stressed by mulching or withholding irrigation. The sugar accumulation was not
due to dehydration. The water stress increased concentrations of sucrose, glucose and
fructose (Yakushiji et al., 1998). Barry et al. (2004b) also demonstrated this phenomenon.
The timing of water deficit stress seems to be important in enhancing juice quality in citrus.
Barry et al. (2004b) found that when deficit irrigation was applied late in fruit development
(stage III) of ‘Valencia’ sweet orange [C. sinensis (L.) Osbeck], no increase in soluble solids
concentration (SSC) was achieved. However, when the deficit irrigation was applied during
the major sugar accumulation period (stage II) of fruit development, increases in SSC
occurred. This is in contrast to what Ginestar and Castel (1996) and Gonzalez-Altozano and
Castel (1999) found on ‘Nules Clementine’ mandarin (C. reticulata Blanco). SSC was
increased when deficit irrigation was applied during stage III and not during stage II, but fruit
size was smaller for treatments applied in stage III. Applying regulated deficit irrigation early
56
in the season did not decrease fruit size at harvest due to accelerated fruit growth that
occurred following the reintroduction of full irrigation (Goldhamer and Arpaia, 1998;
Goldhamer and Salinas, 2000).
Therefore, the objective of this study was to quantify the effects of water deficit stress on SSC
of ‘Nules Clementine’ mandarin (C. reticulata Blanco) fruit grown under OHS conditions.
Materials and Methods
Sites and plant material. This study was conducted on two commercial citrus farms
(Backsberg and Greendale) near Simondium, Western Cape province, South Africa (33°50’S,
18°54’E; 300 m elev.). ‘Nules Clementine’ mandarin trees (C. reticulata Blanco) on ‘Troyer’
citrange rootstock (Poncirus trifoliata (L.) Raf x C. sinensis (L.) Osb.) were used at both sites
during the 2002-03 and 2003-04 seasons. At Backsberg, trees were planted in 1991 with a
spacing of 5 m x 3 m. The trees were planted in 1992 at Greendale with a spacing of 4.5 m x
2.5 m. Healthy, mature trees were selected within the orchards which were subjected to
standard cultural practices.
Treatments and experimental design. Differential irrigation treatment consisting of 2X, X and
1/2X was applied at the end of stage I (± mid Dec.) of physiological fruit development. For
the X treatment the existing drip irrigation line was used with a delivery rate of 3.5 L·h-1.
Emitters were 1 m apart and every third emitter was closed. This means that each tree had
two emitters that delivered 7 L·h-1 in total. The 2X treatment was applied by inserting an
additional irrigation line with the same delivery volume as the existing drip irrigation line.
For the 1/2X treatment, the emitters of the existing drip irrigation line were closed and a new
drip irrigation line with a delivery volume of 1.6 L·h-1 was inserted. Six replicates of six trees
57

per replicate were selected in a completely randomised experimental layout. Sampling was
conducted on the middle four trees in each replicate.
Data collection. Soil water content. Soil samples were taken from between two trees in the
row, between the drip-emitters at a depth of 15 cm using a 7-cm diameter soil auger. Samples
were weighed, baked in an oven for 30 minutes at 140 °C and then reweighed, from which
gravimetric soil water content was calculated.
Stem water potential. Two healthy, fully developed leaves were randomly selected on the
west side of the trees. Leaves were bagged with small, black polyethylene envelopes and
immediately wrapped with aluminium foil before sunrise. Stem water potential
measurements were taken at 1100 HR at Greendale and at 1200 HR at Backsberg with a PMS
600 pressure chamber (PMS Instruments, Albany, Ore., USA).
Fruit size and juice quality. Five fruit were randomly selected and tagged on both sides of the
trees when the treatments were applied. Fruit size measurements were taken two-weekly by
using an electronic caliper integrated with a data logger (Güss Manufacturing, Strand, South
Africa). At harvest, the tagged fruit were analysed for fruit quality variables. An additional
five fruit were randomly harvested every 2 weeks from both sides of the trees for fruit
analysis. Fruit samples were weighed, fruit diameter was measured, and fruit were cut in half
to extract juice for juice weight and percentage calculations. Brix was measured with an
electronic temperature-compensating refractometer (Atago, Tokyo, Japan). Titratable acid
was determined by titrating 10 ml juice sample against 0.1N NaOH to end-point pH 8.2 using
a 719 S Metrohm titrino autotrator (Metrohm, Herisau, Switzerland). The ratio of Brix-to-TA
was calculated.
58
Statistical analysis. Data were subjected to analysis of variance (ANOVA) using the GLM
procedure of SAS (SAS Inc., Cary, N.C., USA). Means were separated by least significant
difference (LSD).
Results
Soil water content (SWC) 2002-03 season. At Backsberg, there was no significant difference
in SWC at the beginning of differential irrigation treatments in mid Dec. (Fig. 4.1).
Significant differences (P<0.05) in SWC were recorded throughout the rest of the season
except on 16 and 30 Apr. 2003. The 2X treatment had a consistently higher SWC during the
season with the highest value of 12.6% on 3 Apr. 2003. The 1/2X treatment had the lowest
SWC throughout the season with the lowest value (9.9%) on 5 Mar. 2003.
At Greendale, there were no significant differences in SWC during the season except on 20
Mar. 2003 (Fig. 4.2). On this day, the 2X treatment had the highest SWC (6.3%) compared to
the lowest (5.2%) of the 1/2X treatment. Soil water content for all treatments during the
season ranged between 4.6% and 7.5%.
Soil water content (SWC) 2003-04 season. On all sampling dates at Backsberg, there were
significant (P<0.05) differences in SWC (Fig. 4.3). The 2X treatment had the highest SWC
during the season except on 6 Feb. 2004 when the SWC of the X treatment was higher.
Similar to the situation in 2002-03, the 1/2X treatment had the lowest SWC throughout the
season. Soil water content for all treatments during the season ranged between 2.0% and
5.0%.
59

On all sampling dates at Greendale, there were significant differences in SWC (Fig. 4.4).
Once again the 1/2X treatment had the lowest SWC throughout the season with the lowest
value (1.6%) on 9 Jan. 2004. The 2X treatment had the highest SWC throughout the season
with the highest value (4.1%) on 30 April 2004. Soil water content for all treatments during
the season ranged between 1.6% and 4.1%.
The SWC in the 2003-04 season at both Backsberg and Greendale was much lower than in the
2002-03 season, i.e. the soil was drier. The average SWC for all treatments at Greendale was
6.1% in 2002-03 and 2.6% in 2003-04. The difference at Backsberg was even greater, with
the average for the 2002-03 season being 12.0% and 3.5% for 2003-04.
Stem water potential (ψstem) 2002-03 season. At the start of the differential irrigation
treatments at Backsberg, there were no differences in ψstem among treatments (Fig. 4.5).
Statistical differences (P<0.05) in ψstem were measured from 22 Jan. 2003 until fruit maturity.
From 19 Feb. 2003, 2X had the highest (least negative) ψstem, while 1/2X had the lowest (most
negative) ψstem. The average ψstem for all treatments fluctuated between -0.95 MPa and -1.55
MPa. A difference of 0.2 MPa between the 1/2X and 2X treatments was only reached after 3
months at Backsberg on 20 Mar. 2003. During the remainder of the 2002-03 season the
difference in ψstem was <0.2 MPa.
At Greendale, the 2X treatment had the highest ψstem throughout the experiment, except on 19
Feb. 2003 when it was the lowest (Fig. 4.6). The average ψstem for all treatments fluctuated
between -0.87 MPa and -1.30 MPa. The 1/2X treatment had the lowest ψstem throughout the
season, except on 19 Feb. 2003 and on 3 Apr. 2003. A difference of 0.28 MPa was reached
60
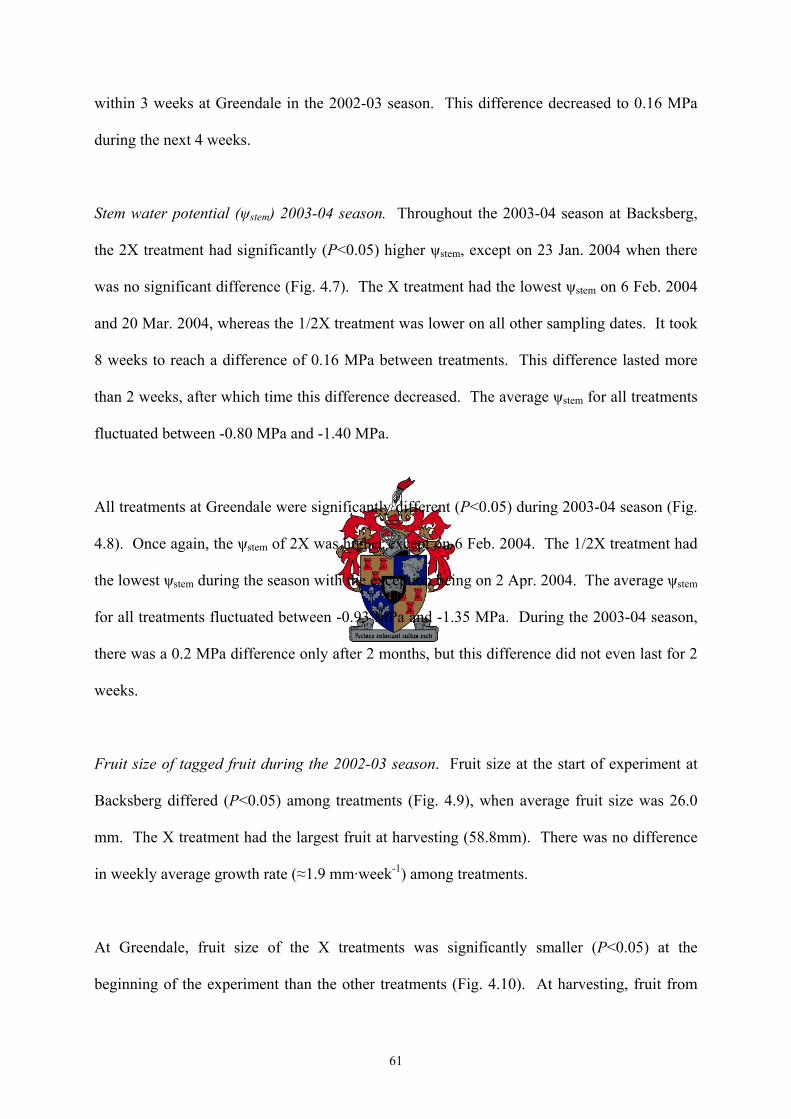
within 3 weeks at Greendale in the 2002-03 season. This difference decreased to 0.16 MPa
during the next 4 weeks.
Stem water potential (ψstem) 2003-04 season. Throughout the 2003-04 season at Backsberg,
the 2X treatment had significantly (P<0.05) higher ψstem, except on 23 Jan. 2004 when there
was no significant difference (Fig. 4.7). The X treatment had the lowest ψstem on 6 Feb. 2004
and 20 Mar. 2004, whereas the 1/2X treatment was lower on all other sampling dates. It took
8 weeks to reach a difference of 0.16 MPa between treatments. This difference lasted more
than 2 weeks, after which time this difference decreased. The average ψstem for all treatments
fluctuated between -0.80 MPa and -1.40 MPa.
All treatments at Greendale were significantly different (P<0.05) during 2003-04 season (Fig.
4.8). Once again, the ψstem of 2X was higher except on 6 Feb. 2004. The 1/2X treatment had
the lowest ψstem during the season with the exception being on 2 Apr. 2004. The average ψstem
for all treatments fluctuated between -0.93 MPa and -1.35 MPa. During the 2003-04 season,
there was a 0.2 MPa difference only after 2 months, but this difference did not even last for 2
weeks.
Fruit size of tagged fruit during the 2002-03 season. Fruit size at the start of experiment at
Backsberg differed (P<0.05) among treatments (Fig. 4.9), when average fruit size was 26.0
mm. The X treatment had the largest fruit at harvesting (58.8mm). There was no difference
in weekly average growth rate (≈1.9 mm·week-1) among treatments.
At Greendale, fruit size of the X treatments was significantly smaller (P<0.05) at the
beginning of the experiment than the other treatments (Fig. 4.10). At harvesting, fruit from
61

the X treatment were significantly smaller than fruit from the 1/2X treatment although the X
treatment had an average weekly growth rate of 2.1 mm·week-1 compared with 1.9 mm·week-1
for the 1/2X and 2X treatments. The average fruit size at harvesting was smaller (56.4 mm)
than at Backsberg.
Fruit size of tagged fruit during the 2003-04 season. At Backsberg, fruit size among
treatments did not differ throughout the measurement period (Fig. 4.11), and the average fruit
size of 52.4 mm at harvest was smaller than in the 2002-03 season. The average weekly
growth rate was 2.0 mm·week-1 for the 1/2X treatment and 1.9 mm·week-1 for both the X and
the 2X treatment.
The fruit size at Greendale was only significantly different (P<0.05) at harvesting (Fig. 4.12).
The X treatment had the largest fruit and the 1/2X treatment had the smallest fruit. At
harvesting, the average fruit size was 51.8 mm. There was no difference in the weekly growth
rate of the X and 2X treatments (2.0 mm·week-1), whereas the 1/2X treatment had a lower
weekly growth rate (1.8 mm·week-1).
Quality analysis of tagged fruit during the 2002-03 season. There were no significant
differences in all fruit quality variables, except fruit size at Backsberg (Table 1). The X
treatment had significantly (P<0.05) larger fruit (58.8mm) than other treatments. Average
fruit weight at harvest was 77.1 g, when fruit juice content was 54.6%. Soluble solid content
and acid values were 10.2 °Brix and 0.82%, respectively, and the Brix-to-acid ratio was 12.5.
At Greendale, there were no significant differences in all fruit quality variables, except SSC
(Table 4.2). Average fruit weight was 68.7 g and juice content was 53.5%. The 1/2X
62
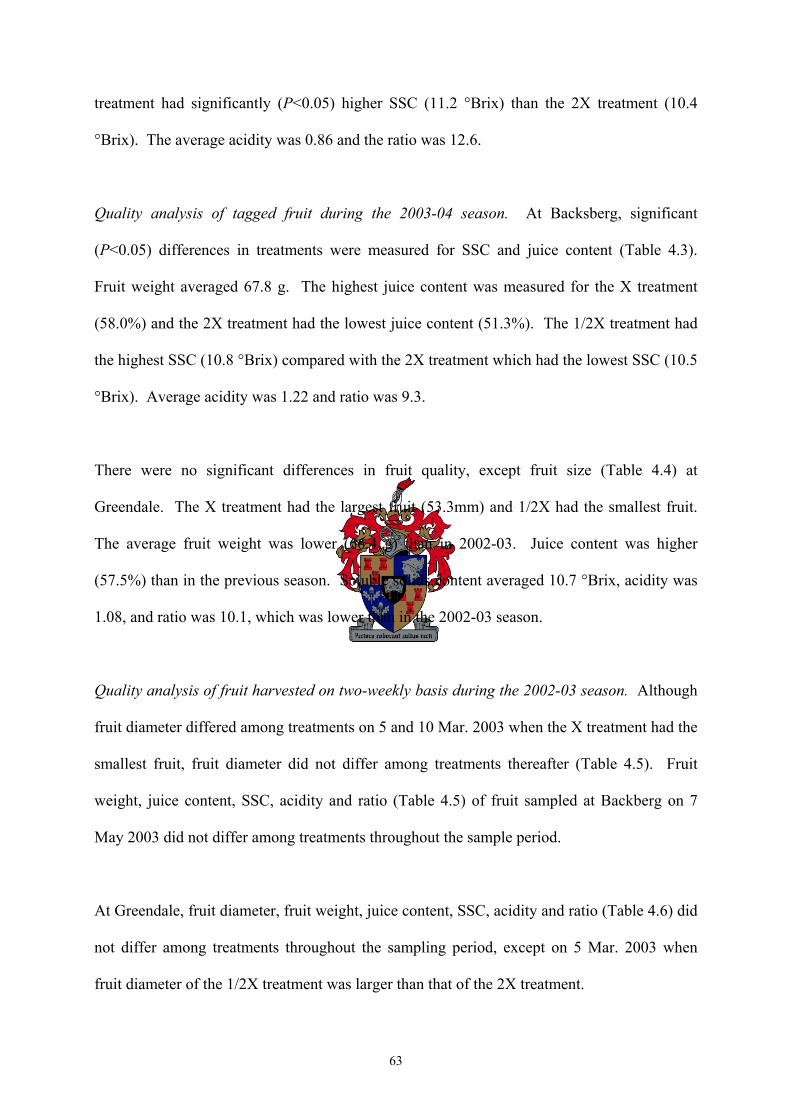
treatment had significantly (P<0.05) higher SSC (11.2 °Brix) than the 2X treatment (10.4
°Brix). The average acidity was 0.86 and the ratio was 12.6.
Quality analysis of tagged fruit during the 2003-04 season. At Backsberg, significant
(P<0.05) differences in treatments were measured for SSC and juice content (Table 4.3).
Fruit weight averaged 67.8 g. The highest juice content was measured for the X treatment
(58.0%) and the 2X treatment had the lowest juice content (51.3%). The 1/2X treatment had
the highest SSC (10.8 °Brix) compared with the 2X treatment which had the lowest SSC (10.5
°Brix). Average acidity was 1.22 and ratio was 9.3.
There were no significant differences in fruit quality, except fruit size (Table 4.4) at
Greendale. The X treatment had the largest fruit (53.3mm) and 1/2X had the smallest fruit.
The average fruit weight was lower (66.4 g) than in 2002-03. Juice content was higher
(57.5%) than in the previous season. Soluble solids content averaged 10.7 °Brix, acidity was
1.08, and ratio was 10.1, which was lower than in the 2002-03 season.
Quality analysis of fruit harvested on two-weekly basis during the 2002-03 season. Although
fruit diameter differed among treatments on 5 and 10 Mar. 2003 when the X treatment had the
smallest fruit, fruit diameter did not differ among treatments thereafter (Table 4.5). Fruit
weight, juice content, SSC, acidity and ratio (Table 4.5) of fruit sampled at Backberg on 7
May 2003 did not differ among treatments throughout the sample period.
At Greendale, fruit diameter, fruit weight, juice content, SSC, acidity and ratio (Table 4.6) did
not differ among treatments throughout the sampling period, except on 5 Mar. 2003 when
fruit diameter of the 1/2X treatment was larger than that of the 2X treatment.
63

Quality analysis of fruit harvested on two-weekly basis during the 2003-04 season. At
Backsberg, fruit diameter and fruit weight differed among treatments on 2 and 16 Apr. 2004
when the 2X treatment had the largest and heaviest fruit and the 1/2X treatment had the
smallest fruit (Table 4.7). Juice content and SSC did not differ among treatments. Acidity
was significantly (P<0.09) higher for the 1/2X treatment (1.27%) than the 2X treatment
(1.05%) resulting in a marginally (P<0.14) higher ratio (10.4:1) for the 2X treatment than the
1/2X treatment (8.9:1).
At Greendale, the average fruit diameter was larger (Table 4.8) than for the tagged fruit
(Table 4.4), but there was no difference in fruit diameter among treatments. There was also
no significant difference among treatments in fruit weight, juice content, SSC, acidity and
ratio (Table 4.8).
Discussion
At both sites and in both seasons, SWC was highest in the 2X treatment and lowest in the
1/2X treatment, according to the experimental plan. The only exceptions were on 6 Feb. 2004
at Backsberg and on 16 Apr. 2003 at Greendale. This is probably due to rain that fell during
the week before SWC was measured. The 1/2X treatment had the lowest SWC during the
experiment with the exception of 16 Apr. 2003 at Greendale. The soils at Greendale are
compact and the surface appears to be sealed as irrigation water tending to run off the ridges.
The trees at Backsberg are larger than at Greendale and these trees are probably capable of
obtaining water from greater depths due to a generally better developed root system.
64

As a result of these differences in SWC among treatments, ‘Nules Clementine’ mandarin trees
in the 2X treatment had less negative ψstem throughout the duration of the experiment, with a
difference of 0.2 MPa between 1/2X and 2X treatments only being reached 8 to 12 weeks
after the treatments were applied.
On average, the tagged fruit were larger at harvest during the 2002-03 season than during the
2003-04 season, despite a smaller crop load in the 2003-04 season. The tagged fruit were
harvested on 7 May 2003 in the first season, but on 30 Apr. 2004 during the second season of
the experiment. The reason for the earlier harvesting was that the second season was an “off”
year for production. This meant that the yield was lower and to be cost effective, the picking
of fruit had to be more severe, i.e. two harvests instead of three. Fruit that were relatively
large at the start of the differential irrigation treatments tended to remain relatively large as
found by Koch (1995), irrespective of irrigation treatment. However, the average growth rate
(1.9 mm·week-1) over a 3- to 4-month period was similar among treatments. Fruit harvested
on a two-weekly basis were larger than the tagged fruit during the 2002-03 season at both
Greendale and Backsberg. There were more fruit on the trees during 2002-03 than in 2003-
04. As these fruit matured, they increased in weight and this made the branches bend down,
in turn causing the tagged fruit to be closer to the bottom of the tree and to be over-shadowed.
To prevent this in the 2003-04 season, the tagged fruit were randomly selected 20 cm higher
than the previous season.
Although SSC at Backsberg was not significantly different (P=0.43) during the 2002-03
season, the X and 2X treatments had a lower SSC (10.1 °Brix) than the 1/2X treatment (10.5
°Brix). However, during the 2003-04 season, SSC was significantly higher for the 1/2X
treatment (10.8 °Brix) than for the 2X treatment (10.5 °Brix).
65

During the 2002-03 season, the 1/2X treatment at Greendale had the largest fruit, probably as
a result of too much water being applied to the X and 2X treatments. The X treatment had the
largest fruit during the second season at Greendale, and average fruit growth rate did not
differ among treatments. There was a significant difference in SSC during 2002-03, with the
1/2X treatment having the highest value (11.2 °Brix) and the 2X treatment the lowest (10.4
°Brix). In 2003-04, SSC did not differ significantly among treatments. Apparently, a general
over-irrigation occurred in both the X and 2X treatments during both the 2002-03 and 2003-
04 seasons at Backsberg and Greendale.
In conclusion, withholding water by applying differential irrigation increased SSC by 0.3 to
0.6 °Brix under certain conditions. For example, SSC increased by 0.6 °Brix at Greendale in
the 2002-03 season when irrigation volume was reduced resulting in a difference in ψstem of
0.28 MPa between the 1/2X and 2X treatments within 3 weeks of applying differential
irrigation, although this difference decreased to 0.16 MPa over a period of 4 weeks. SSC also
increased at Backsberg by 0.3 °Brix in the 2003-04 season when a difference in ψstem of 0.16
MPa was achieved within 8 weeks of applying the differential irrigation treatments, but this
differential only lasted for 2 weeks. However, where a ψstem differential of 0.2 MPa could
only be achieved after more than 2 months, e.g. Greendale in the 2003-04 season and
Backsberg in the 2002-03 season, SSC was not increased.
These data are consistent with previous work. Barry and co-workers (2004b) suggested that
the severity of the differential irrigation should be between 0.15 MPa and 0.20 MPa for
‘Valencia’ sweet orange. This difference in ψstem was sufficient to cause a difference in the
SSC. No mention was made about the duration of the difference in ψstem. However, where
66

over-irrigation may have occurred, no difference in fruit size occurred between the relatively
wet and relatively dry treatments. In such cases, SSC did not differ between these treatments.
Therefore, certain water-deficit stress conditions must be met to enhance sugar accumulation
of ‘Nules Clementine’ mandarin. These conditions require that the difference in ψstem should
be of a sufficient intensity of between 0.16 and 0.3 MPa, and this difference should be
maintained for a sufficient duration of between 4 and 6 weeks. Furthermore, deficit irrigation
should be applied relatively early in fruit development (Barry et al., 2004b), namely during
the sugar accumulation stage which starts within 4 weeks of the end of the fruit drop period
and continues until harvest.
67

9.0
9.5
10.0
10.5
11.0
11.5
12.0
12.5
13.0
19/12/2002 05/03/2003 20/03/2003 03/04/2003 16/04/2003 30/04/2003
Soil
wat
er C
onte
nt (%
)
1/2 XX2 X
b
a
b
aa
a
bab
ab
Fig. 4.1. Soil water content (%) of ‘Nules Clementine’ mandarin over a period of 5 months at
Backsberg during the 2002-03 season. Soil samples were taken between trees. One soil
sample was taken for each of the six trees in a replicate (n=6).
4.0
4.5
5.0
5.5
6.0
6.5
7.0
7.5
8.0
19/12/2002 05/03/2003 20/03/2003 03/04/2003 16/04/2003 30/04/2003
Soil
Wat
er C
onte
nt (%
)
1/2 XX2 X
a
b
ab
Fig. 4.2. Soil water content (%) of ‘Nules Clementine’ mandarin over a period of 5 months at
Greendale during the 2002-03 season. Soil samples were taken between trees. One soil
sample was taken for each of the six trees in a replicate (n=6).
68

1.5
2.0
2.5
3.0
3.5
4.0
4.5
5.0
5.5
09/01/2004 06/02/2004 05/03/2004 02/04/2004 30/04/2004
Soil
wat
er C
onte
nt (%
)
1/2 XX2 X
a
b
b
a b
a
a
b
b
a a
c
b
ac
Fig. 4.3. Soil water content (%) of ‘Nules Clementine’ mandarin over a period of 4 months at
Backsberg during the 2003-04 season. Soil samples were taken between trees. One soil
sample was taken for each of the six trees in a replicate (n=6).
1.5
2.0
2.5
3.0
3.5
4.0
4.5
5.0
5.5
09/01/2004 06/02/2004 05/03/2004 02/04/2004 30/04/2004
Soil
Wat
er C
onte
nt (%
)
1/2 XX2 X
a
b
a
b
a
c
ab
a
ba
bc
b
a
a
Fig. 4.4. Soil water content (%) of ‘Nules Clementine’ mandarin over a period of 4 months at
Greendale during the 2003-04 season. Soil samples were taken between trees. One soil
sample was taken for each of the six trees in a replicate (n=6).
69

-1.55
-1.45
-1.35
-1.25
-1.15
-1.05
-0.95
-0.85
-0.7519/1
2/2003
10/01/200
3
22/01/200
3
06/02/200
3
19/02/200
3
05/03/200
3
20/03/200
3
03/04/200
3
16/04/200
3
30/04/200
3St
em w
ater
pot
entia
l (M
Pa)
1/2 XX2 X
aa
a a
a
a
a
a
aab
b
b
bb
b
bb
b
bb
bc
c
Fig. 4.5. Stem water potential (MPa) of ‘Nules Clementine’ mandarin over a period of 5
months at Backsberg during the 2002-03 season. Leaves were bagged on the west side of
trees before sunrise. Measurements were taken from 1200 HR. There were six replicates with
two leaves per replicate.
-1.55
-1.45
-1.35
-1.25
-1.15
-1.05
-0.95
-0.85
-0.7519/1
2/200
2
09/01/2
003
22/01/2
003
06/02/2
003
19/02/2
003
05/03/2
003
20/03/2
003
03/04/2
003
16/04/2
003
30/04/2
003
Stem
wat
er p
oten
tial (
MPa
)
1/2 XX2 X
a
a
a
a
a
a
a
a
a a
aa
a
b
bb b
b bb b
bb
bab
c c
c cc
Fig. 4.6. Stem water potential (MPa) of ‘Nules Clementine’ mandarin over a period of 5
months at Greendale during the 2002-03 season. Leaves were bagged on the west side of
trees before sunrise. Measurements were taken from 1100 HR. There were six replicates with
two leaves per replicate.
70
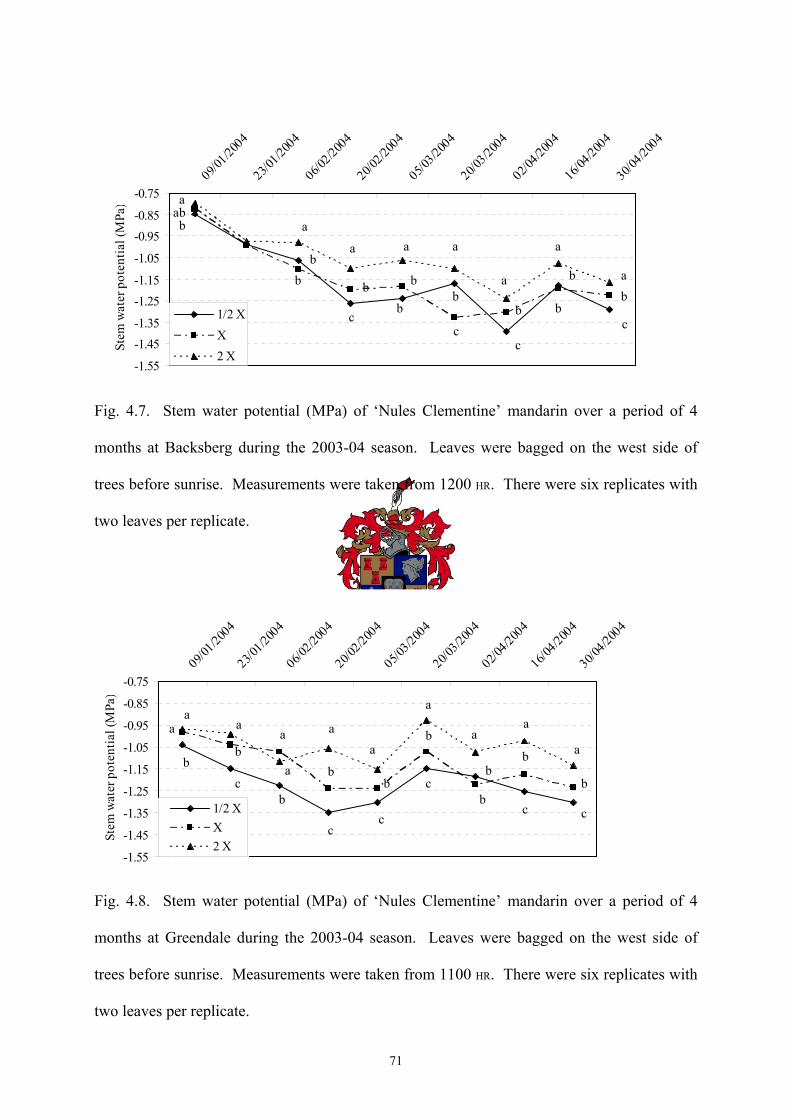
-1.55
-1.45-1.35
-1.25-1.15
-1.05
-0.95-0.85
-0.7509/0
1/2004
23/01/200
4
06/02/200
4
20/02/200
4
05/03/200
4
20/03/200
4
02/04/200
4
16/04/200
4
30/04/200
4St
em w
ater
pot
entia
l (M
Pa)
1/2 XX2 X
a
c
a a a
c
a
a
a
ab
bb
bb
bb
b
c
bb
a
b
bc
Fig. 4.7. Stem water potential (MPa) of ‘Nules Clementine’ mandarin over a period of 4
months at Backsberg during the 2003-04 season. Leaves were bagged on the west side of
trees before sunrise. Measurements were taken from 1200 HR. There were six replicates with
two leaves per replicate.
-1.55
-1.45
-1.35
-1.25
-1.15
-1.05
-0.95
-0.85
-0.7509/0
1/2004
23/01/200
4
06/02/200
4
20/02/200
4
05/03/200
4
20/03/200
4
02/04/200
4
16/04/200
4
30/04/200
4
Stem
wat
er p
oten
tial (
MPa
)
1/2 XX2 X
aa
ba
a
aa
a
aa
ab
a
cb
c
b
b
b
b
b
c
cb
c c
b
Fig. 4.8. Stem water potential (MPa) of ‘Nules Clementine’ mandarin over a period of 4
months at Greendale during the 2003-04 season. Leaves were bagged on the west side of
trees before sunrise. Measurements were taken from 1100 HR. There were six replicates with
two leaves per replicate.
71

15202530354045505560
10/01
/2003
22/01
/2003
06/02
/2003
19/02
/2003
05/03
/2003
20/03
/2003
03/04
/2003
16/04
/2003
30/04
/2003
07/05
/2003
Frui
t dia
met
er (m
m)
1/2 XX2 X
a
a a
a
bb
b b
b
ab ab
ab
Fig. 4.9. Fruit diameter measurements of tagged fruit of ‘Nules Clementine’ mandarin over a
period of 5 months at Backsberg during the 2002-03 season. There were six replicates with
ten tagged fruit per replicate.
15
20
25
30
35
40
45
50
55
60
10/01/200
3
22/01/200
3
06/02/200
3
19/02/200
3
05/03/200
3
20/03/200
3
03/04/200
3
16/04/200
3
30/04/200
3
07/05/200
3
Frui
t dia
met
er (m
m)
1/2 XX2 X
a
a
aa
aa a
bb
b
bb
ab
ab
ab
Fig. 4.10. Fruit diameter measurements of tagged fruit of ‘Nules Clementine’ mandarin over
a period of 5 months at Greendale during the 2002-03 season. There were six replicates with
ten tagged fruit per replicate.
72
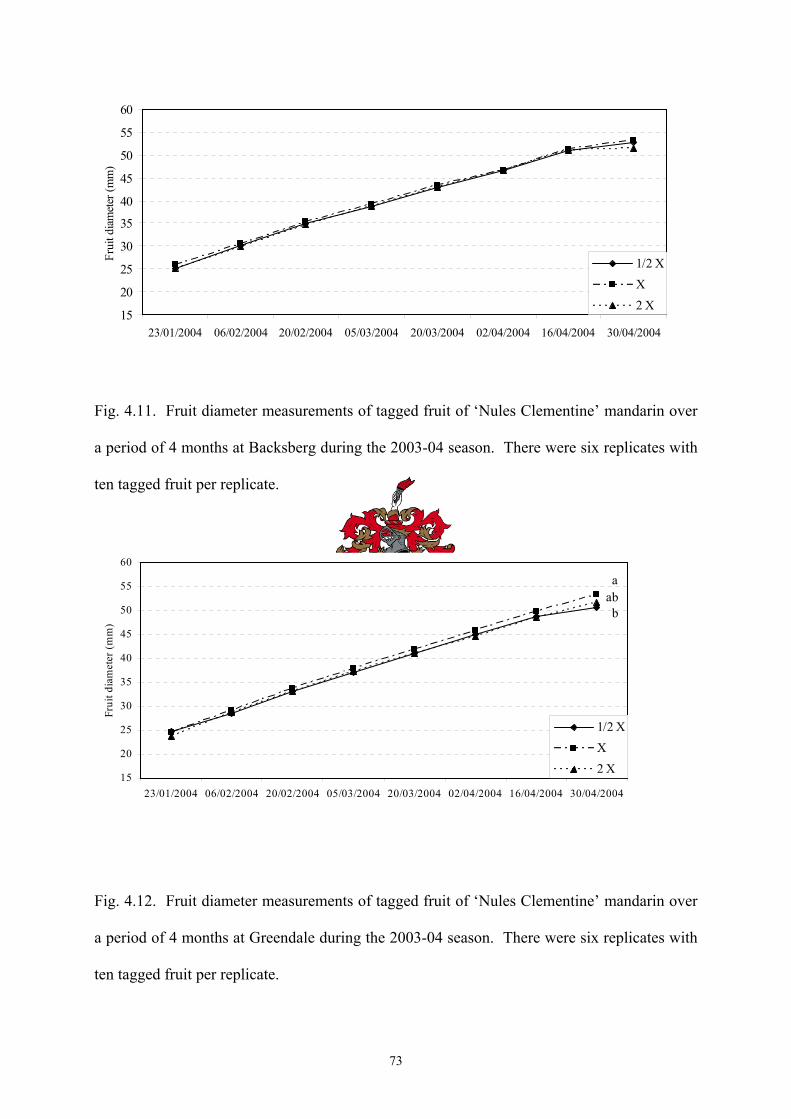
15
20
25
30
35
40
45
50
55
60
23/01/2004 06/02/2004 20/02/2004 05/03/2004 20/03/2004 02/04/2004 16/04/2004 30/04/2004
Frui
t dia
met
er (m
m)
1/2 XX2 X
Fig. 4.11. Fruit diameter measurements of tagged fruit of ‘Nules Clementine’ mandarin over
a period of 4 months at Backsberg during the 2003-04 season. There were six replicates with
ten tagged fruit per replicate.
15
20
25
30
35
40
45
50
55
60
23/01/2004 06/02/2004 20/02/2004 05/03/2004 20/03/2004 02/04/2004 16/04/2004 30/04/2004
Frui
t dia
met
er (m
m)
1/2 XX2 X
a
bab
Fig. 4.12. Fruit diameter measurements of tagged fruit of ‘Nules Clementine’ mandarin over
a period of 4 months at Greendale during the 2003-04 season. There were six replicates with
ten tagged fruit per replicate.
73

Table 4.1. Fruit quality of tagged ‘Nules Clementine’ mandarin fruit harvested on 7 May
2003 at Backsberg.
Fruit size Fruit
weight Juice
content SSC Acid Ratio Treatment (mm) (g) (%) (˚Brix) (%)
1/2 X 56.8 69.3 54.5 10.5 0.81 12.9
X 58.8 82.3 52.8 10.1 0.81 12.5 2 X 58.3 79.8 56.5 10.1 0.84 12.1
P-value 0.1364 0.1473 0.3195 0.4287 0.7633 0.4716
lsd 1.92 14.07 5.09 0.74 0.08 1.34
Table 4.2. Fruit quality of tagged ‘Nules Clementine’ mandarin fruit harvested on 7 May
2003 at Greendale.
Fruit size Fruit
weight Juice
content SSC Acid Ratio Treatment (mm) (g) (%) (˚Brix) (%)
1/2 X 58.0 a 70.0 52.4 11.2 a 0.91 12.6
X 54.8 b 69.2 53.2 10.6 ab 0.87 12.3 2 X 56.3 ab 66.0 55.0 10.4 b 0.81 13.0
P-value 0.0595 0.9784 0.2688 0.0331 0.4044 0.8262
lsd 2.57 37.21 3.78 0.61 0.18 2.34
74
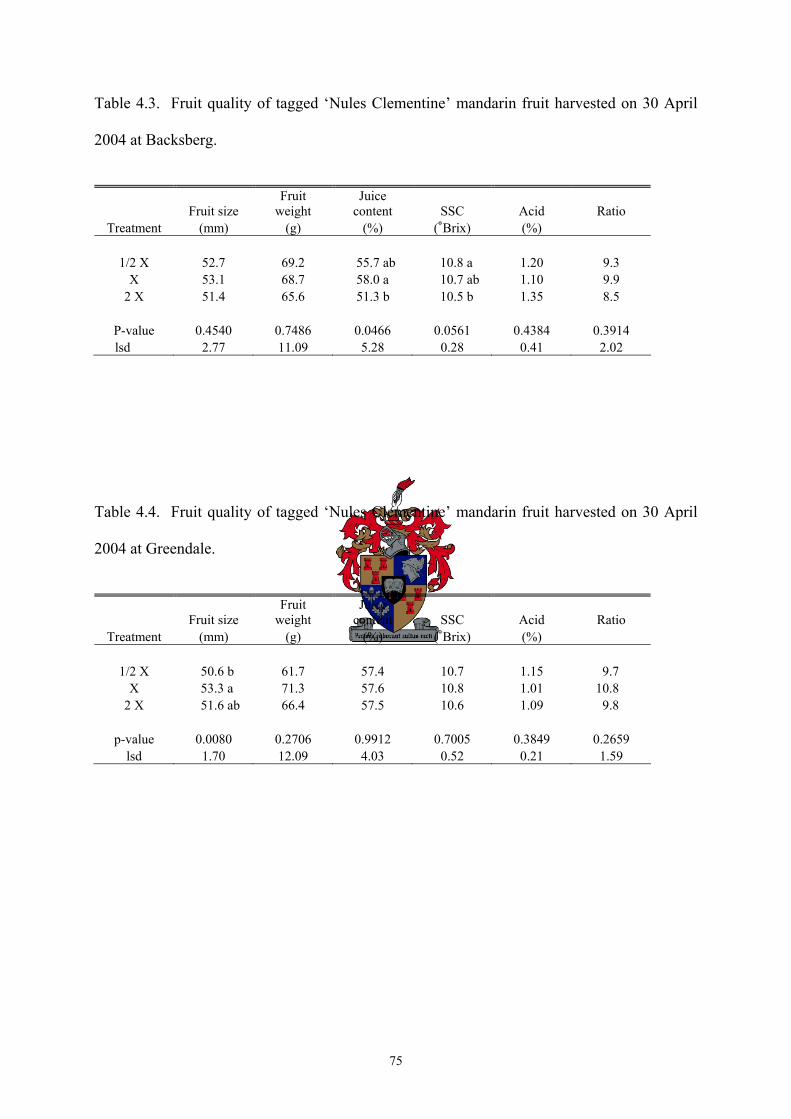
Table 4.3. Fruit quality of tagged ‘Nules Clementine’ mandarin fruit harvested on 30 April
2004 at Backsberg.
Fruit size Fruit
weight Juice
content SSC Acid Ratio Treatment (mm) (g) (%) (˚Brix) (%)
1/2 X 52.7 69.2 55.7 ab 10.8 a 1.20 9.3
X 53.1 68.7 58.0 a 10.7 ab 1.10 9.9 2 X 51.4 65.6 51.3 b 10.5 b 1.35 8.5
P-value 0.4540 0.7486 0.0466 0.0561 0.4384 0.3914
lsd 2.77 11.09 5.28 0.28 0.41 2.02
Table 4.4. Fruit quality of tagged ‘Nules Clementine’ mandarin fruit harvested on 30 April
2004 at Greendale.
Fruit size Fruit
weight Juice
content SSC Acid Ratio Treatment (mm) (g) (%) (˚Brix) (%)
1/2 X 50.6 b 61.7 57.4 10.7 1.15 9.7
X 53.3 a 71.3 57.6 10.8 1.01 10.8 2 X 51.6 ab 66.4 57.5 10.6 1.09 9.8
p-value 0.0080 0.2706 0.9912 0.7005 0.3849 0.2659
lsd 1.70 12.09 4.03 0.52 0.21 1.59
75

Table 4.5. Fruit quality of ‘Nules Clementine’ mandarin fruit harvested on a two-weekly
basis at Backsberg during the 2002-03 season. There were six replicates with ten fruit per
replicate.
Sampling date Treatment 05/03/2003 20/03/2003 03/04/2003 16/04/2003 30/04/2003
Fruit diameter (mm) 1/2 X 46.4 a 50.0 ab 53.0 57.2 61.3
X 44.7 b 49.1 b 53.1 56.5 61.2 2 X 46.2 a 50.8 a 53.2 56.6 60.3
P-value 0.0540 0.0517 0.9371 0.5849 0.3633
lsd 1.50 1.37 1.38 1.51 1.44 Fruit weight (g)
1/2 X 52.7 63.3 72.3 86.1 101.5 X 47.7 60.0 73.0 83.3 101.9
2 X 52.0 64.8 72.2 83.9 96.9
P-value 0.3407 0.4052 0.9469 0.7101 0.5221 lsd 7.58 7.50 5.78 7.56 10.03
Juice content (%) 1/2 X 41.0 47.4 50.2 52.1 52.2
X 41.0 48.0 50.5 51.9 52.3 2 X 42.0 48.5 50.2 51.6 52.3
P-value 0.8733 0.5269 0.8339 0.6719 0.9325
lsd 4.59 2.06 1.36 1.12 0.94 SSC (˚Brix)
1/2 X 10.9 10.4 10.9 10.9 11.4 X 10.6 10.4 10.5 10.7 11.1
2 X 10.8 10.3 10.7 10.7 11.4
P-value 0.4694 0.9893 0.2460 0.6668 0.3798 lsd 0.44 0.74 0.53 0.53 0.47
Acidity (%) 1/2 X 2.64 1.99 1.42 1.16 0.94
X 2.72 1.89 1.43 1.14 0.93 2 X 2.64 1.88 1.44 1.09 0.92
P-value 0.8412 0.6080 0.9337 0.3075 0.6201
lsd 0.32 0.25 0.13 0.09 0.06 Ratio
1/2 X 4.1 5.3 7.7 9.5 12.1 X 4.0 5.5 7.4 9.4 12.0
2 X 4.1 5.6 7.4 9.9 12.4
P-value 0.7034 0.7346 0.5895 0.5204 0.5328 lsd 0.51 0.78 0.75 0.83 0.77
76

Table 4.6. Fruit quality of ‘Nules Clementine’ mandarin fruit harvested on a two-weekly
basis at Greendale during the 2002-03 season. There were six replicates with ten fruit per
replicate.
Sampling date Treatment 05/03/2003 20/03/2003 03/04/2003 16/04/2003 30/04/2003
Fruit diameter (mm) 1/2 X 42.8 a 47.4 51.8 56.5 60.6
X 41.2 ab 46.1 50.7 55.5 60.0 2 X 40.8 b 46.6 51.3 56.2 60.7
P-value 0.0966 0.4384 0.5261 0.5975 0.7061
lsd 1.99 2.00 1.95 1.90 1.76 Fruit weight (g)
1/2 X 43.9 55.1 71.2 88.6 104.1 X 40.1 52.5 66.6 84.8 102.7
2 X 38.3 53.9 70.2 88.6 103.6
P-value 0.6276 0.9301 0.8441 0.8899 0.9834 lsd 12.89 14.02 17.26 17.00 16.36
Juice content (%) 1/2 X 44.3 49.3 50.1 52.3 52.7
X 43.5 46.1 49.1 50.8 52.7 2 X 41.8 48.0 49.0 52.1 54.9
P-value 0.6573 0.5099 0.8182 0.7340 0.0901
lsd 6.18 5.77 3.88 4.15 2.32 SSC (˚Brix)
1/2 X 10.3 ab 10.2 10.6 10.7 11.7 X 10.7 a 10.3 10.7 10.5 11.3
2 X 9.7 b 10.4 10.6 10.7 11.4
P-value 0.0548 0.7121 0.8260 0.5130 0.1919 lsd 0.82 0.67 0.42 0.39 0.45
Acidity (%) 1/2 X 2.97 2.33 1.58 1.07 0.93
X 3.29 2.42 1.67 1.16 0.93 2 X 3.27 2.23 1.53 1.06 0.92
P-value 0.8246 0.8755 0.8253 0.4565 0.9712
lsd 1.25 0.77 0.49 0.18 2.13 Ratio
1/2 X 3.7 4.8 7.1 10.2 12.7 X 3.6 4.4 6.8 9.3 12.2
2 X 3.2 5.0 7.2 10.3 12.4
P-value 0.6689 0.7766 0.9030 0.5006 0.8278 lsd 1.49 1.85 2.12 1.82 1.55
77

Table 4.7. Fruit quality of ‘Nules Clementine’ mandarin fruit harvested on a two-weekly
basis at Backsberg during the 2003-04 season. There were six replicates with ten fruit per
replicate.
Sampling date Treatment 02/04/2004 16/04/2004 30/04/2004
Fruit diameter (mm) 1/2 X 46.2 49.9 b 53.1
X 46.9 52.2 a 52.5 2 X 47.6 53.0 a 53.6
P-value 0.1451 0.0001 0.4618
lsd 1.41 1.44 1.68 Fruit weight (g)
1/2 X 46.8 b 58.1 b 67.9 X 49.5 ab 65.5 ab 66.0
2 X 52.1 a 69.3 a 72.2
P-value 0.0720 0.0290 0.4570 lsd 4.47 8.01 10.36
Juice content (%) 1/2 X 45.5 54.1 54.7
X 48.4 54.1 56.2 2 X 48.4 53.3 56.4
P-value 0.3784 0.8184 0.3860
lsd 5.15 2.77 2.91 SSC (˚Brix)
1/2 X 11.1 10.8 11.2 X 11.2 10.8 11.0
2 X 10.8 10.6 10.8
P-value 0.4025 0.3155 0.3507 lsd 0.59 0.29 0.55
Acidity (%) 1/2 X 2.20 1.47 1.27 a
X 2.02 1.38 1.16 ab 2 X 1.90 1.34 1.05 b
P-value 0.2976 0.5235 0.0863
lsd 0.40 0.25 0.20 Ratio
1/2 X 5.2 7.4 8.9 b X 5.6 7.9 9.5 ab
2 X 5.8 8.0 10.4 a
P-value 0.4637 0.4837 0.1387 lsd 1.05 1.09 1.49
78

Table 4.8. Fruit quality of ‘Nules Clementine’ mandarin fruit harvested on a two-weekly
basis at Greendale during the 2003-04 season. There were six replicates with ten fruit per
replicate.
Sampling date Treatment 02/04/2004 16/04/2004 30/04/2004
Fruit diameter (mm) 1/2 X 46.9 51.3 53.7
X 46.5 49.6 52.0 2 X 46.2 50.5 53.1
P-value 0.5909 0.1119 0.1291
lsd 1.50 1.58 1.68 Fruit weight (g)
1/2 X 52.3 65.7 75.4 X 50.0 59.3 67.9
2 X 49.2 64.2 72.7
P-value 0.6007 0.3865 0.2713 lsd 7.26 9.87 9.51
Juice content (%) 1/2 X 48.7 56.3 58.0
X 51.2 56.7 58.6 2 X 49.2 56.7 59.4
P-value 0.5114 0.9667 0.4705
lsd 4.65 3.61 2.53 SSC (˚Brix)
1/2 X 10.4 10.5 10.9 X 10.6 10.6 11.0
2 X 10.4 10.4 10.9
P-value 0.6337 0.9089 0.9228 lsd 0.62 0.54 0.71
Acidity (%) 1/2 X 1.81 1.28 1.00
X 1.91 1.40 1.10 2 X 1.94 1.26 0.97
P-value 0.5575 0.3789 0.2330
lsd 0.28 0.22 0.15 Ratio
1/2 X 5.8 8.2 11.0 X 5.6 7.7 10.1
2 X 5.3 8.3 11.2
P-value 0.4146 0.5522 0.4672 lsd 0.78 1.39 5.71
79
CHAPTER 5
OVERALL DISCUSSION AND CONCLUSION
In the first study, the importance of optimising and standardising the sampling procedure used
for the quantification of stem water potential (ψstem) was illustrated. By minimising the
variation in ψstem, the reliability of the procedure as a measure of plant water status can be
enhanced. Bagging of leaves at sunrise with black polyethylene envelopes and measuring
ψstem 3 to 4 hours later allows the plant water status of the bagged leaves to reach equilibrium
with the plant water status of the whole tree, and a realistic measurement of the current ψstem
can then be made. The use of aluminium foil to cover the bagged leaves reduces heat build-
up by reflecting sunlight and dramatically reduces variation in ψstem. The time of day at which
ψstem measurements are made is important to ensure consistency in comparisons among
treatments. The preferred time of day to measure ψstem is prior to midday depression in
photosynthesis (1100 HR). The east side of trees is more representative of transpiring leaves
with open stomata and should be used for making ψstem measurements. Under similar
experimental conditions, only three leaves per replicate would be required to detect a
difference in ψstem between treatment means of 0.05 MPa.
In the second study, the effect of differential irrigation on sugar accumulation was
determined. Withholding water by applying differential irrigation increased SSC by 0.3 to 0.6
°Brix under certain conditions. For example, SSC increased by 0.6 °Brix at Greendale in the
2002-03 season when irrigation volume was reduced resulting in a difference in ψstem of 0.28
MPa between the 1/2X and 2X treatments within 3 weeks of applying differential irrigation,
although this difference decreased to 0.16 MPa over a period of 4 weeks. SSC also increased
at Backsberg by 0.3 °Brix in the 2003-04 season when a difference in ψstem of 0.16 MPa was
80
achieved within 8 weeks of applying the differential irrigation treatments, but this differential
only lasted for 2 weeks. However, where a ψstem differential of 0.2 MPa could only be
achieved after more than 2 months, e.g. Greendale in the 2003-04 season and Backsberg in
the 2002-03 season, SSC was not increased.
Therefore, certain water-deficit stress conditions must be met to enhance sugar accumulation
of ‘Nules Clementine’ mandarin. These conditions require that the difference in ψstem should
be of a sufficient intensity of between 0.16 and 0.3 MPa, and this difference should be
maintained for a sufficient duration of between 4 and 6 weeks. Furthermore, deficit irrigation
should be applied relatively early in fruit development (Barry et al., 2004b), namely during
the sugar accumulation stage which starts within 4 weeks of the end of the fruit drop period
and continues until harvest.
81
LITERATURE CITED
Bain, J.M. 1958. Morphological, anatomical, and physiological changes in the developing
fruit of the Valencia orange, Citrus sinensis (L.) Osbeck. Austr. J. Bot. 6:1-24.
Barry, G.H., W.S. Castle and F.S. Davies. 2004a. Soluble solids accumulation in ‘Valencia’
sweet orange as related to rootstock selection and fruit size. J. Amer. Soc. Hort. Sci.
129:594-598.
Barry, G.H., W.S. Castle and F.S. Davies. 2004b. Rootstocks and plant water relations affect
sugar accumulation of citrus fruit via osmotic adjustment. J. Amer. Soc. Hort. Sci.
129:881-889.
Bar-Yosef, B., S. Schwartz, T. Markovich, B. Lucas and R. Assaf. 1988. Effect of root
volume and nitrate solution concentration on growth, fruit yield, and temporal N and
water uptake rates by apple trees. Plant and Soil 107:49-56.
Bar-Yosef, B. 1999. Advances in fertigation. Adv. Agron. 65:1-77.
Bean, R.C. 1960. Carbohydrate metabolism of citrus fruits: I. Mechanisms of sucrose
syntheses in oranges and lemons. Plant Physiol. 35:429-434.
Begg, J.E. and N.C. Turner. 1970. Water potential gradients in field tobacco. Plant Physiol.
46:343-346.
Bentley, M. 1959. Commercial hydroponics: Facts and figures. Bendon Books. Johannesburg.
Boland, A.M., P.H. Jerie, P.D. Mitchell and I Goodwin. 2000. Long-term effects of restricted
root volume and regulated deficit irrigation on peach: I. Growth and mineral nutrition.
J. Amer. Soc. Hort. Sci.125(1): 135-142.
Boman, B.J. 1996. Fertigation versus conventional fertilization of flatwoods grapefruit.
Fertilizer Research 44:123-128.
Boyer, J.S. 1967. Leaf water potentials measured with a pressure chamber. Plant Physiol.
42:133-137.
82

Boyer, J.S. and E.B. Knipling. 1965. Isopiestic technique for measuring leaf water potentials
with a thermocouple psychrometer. Proc. Natl. Acad. Sci. 54:1044-1051.
Canny, M.J., B. Nairn and M. Harvey. 1968. The velocity of translocation in trees. Aust. J.
Bot. 16:479-485.
Coetzee, E. 1998. More citrus from poor soil, with less water. Farmer’s Weekly 5 June 1998
pp26-28.
Coombe, B.G. 1976. The development of fleshy fruits. Ann. Rev. Plant Physiol. 26:207-228.
Cooper, A. 1996. The ABC of NFT, Nutrient Film Technique. Casper Publications, Austalia.
Echeverria, E. and J.K. Burns. 1989. Vacuolar acid hydrolysis as a physiological mechanism
for sucrose breakdown. Plant Physiol. 90:530-533.
Echeverria, E. 1992. Activities of sucrose metabolising enzymes during sucrose accumulation
in developing acid limes. Plant Science. 85:125-129.
Elfving, D.C. and M.R. Kaufmann. 1972. Diurnal and seasonal effects of environment on
plant water relations and fruit diameter of citrus. J. Amer. Soc. Hort. Sci. 107:139-142.
Elfving, D.C. 1982. Crop response to trickle irrigation. Hort. Rev. 4:1-48.
Falivene, S., I. Goodwin, D. Williams, A.M. Boland. 2005. Open Hydroponics: Risks and
opportunities. Stage 1: General principles & literature review. NSW department of
primary industries and Land & Water Austalia.
Fishler, M., E.E. Goldschmidt and S.P. Monselise. 1983. Leaf area and fruit size in girdled
grapefruit branches. J. Amer. Soc. Hort. Sci. 108:218-221.
Fitter, A.H. and R.K.M. Hay. 1981. Environmental physiology of plants. Academic Press,
New York.
Garcia-Luis, A., Didehvar, F., Guardiola, J.L. and D.A. Baker. 1991. The transport of sugars
in developing fruits of Satsuma mandarin. Annals of Botany 68:349-357.
83

Garnier, E. and A. Berger. 1985. Testing water potential in peach trees as an indicator of
water stress. J. Hort. Sci. 60(1):47-56.
Ginestar, C. and J.R. Castel. 1996. Responses of young Clementine citrus tress to water stress
during different phonological periods. Journal of Horticultural Science 71(4):551-559.
Goldhamer, D.A. and M.L. Arpaia, 1998. Regulated deficit irrigation of citrus. Citrograph,
Mar.
Goldhamer, D.A. and M. Salinas, 2000. Evaluation of regulated deficit irrigation on mature
orange trees grown under high evaporative demand. Proc. Intl. soc. Citicult. IX Congr.
227-231.
Goldschmidt, E.E. and A. Golomb. 1982. The carbohydrate balance of alternate bearing citrus
trees and the significance of reserves for flowering and fruiting. J. Amer. Soc. Hort.
Sci. 107:206-208.
Goldschmidt, E.E. and K.E. Koch, 1996. In. Photoassimilate distribution in plants and crops:
Source sink relationships. p 797-823. Ed. E. Zamski and A.A. Schaffer. Marcel
Dekker Inc., New York.
Gonzalez-Altozano, P. and J.R. Castel, 1999. Regulated deficit irrigation in ‘Clementina de
Nules’ citrus tree. I. Yield and fruit quality effects. Journal of Horticultural Science &
Biotechnology 74(6):706-713.
Goode, J.E. and T.W. Hegarty. 1965. Measurement of water potential of leaves by methods
involving immersion in sucrose solutions. Nature 206:109-110.
Groenewald, A. 2000. Hidroponiese stelsel sorg vir vet sitrus-bonus. Landbouweekblad 19
Mei 2000 pp 16-20.
Harding P.L and W.E. Lewis. 1941. The relation of size of fruit to solids, acid, and volume of
juice in the principal varieties of Florida oranges. Proc. Fla. State Hort. Soc. 54:52-56.
Harris, D.A. 1971. Hydroponics: The gardening without soil. Purnell. Cape Town
84
Harris, D.A. 1987. Hydroponics: The South African guide to gardening without soil. Struik.
Cape Town.
Ho, L.C. 1988. Metabolism and compartmentation of imported sugars in sink organs in
relation to sink strength. Ann. Rev. Plant Physiol. Plant Mol. Biol. 39:355-378.
Hockema, B.R. and E. Echeverria. 2000. Factors involved in soluble solids accumulation in
citrus fruit. Proc. Fla. State Hort. Soc. 113:126-130.
Hockema, B.R. and E. Etxeberria. 2001. Metabolic contributors to drought-enhanced
accumulation of sugars and acids in oranges. J. Amer. Soc. Hort. Sci. 126:599-605.
Holtzhauzen, L.C.1969. Observations on the developing fruit of Citrus sinensis cv.
Washington navel from anthesis to ripeness. Tech. Comm. 91. Department of
Agricultural Technical Services, Univ. of Stellenbosch, South Africa.
Huang, T.B., R.L. Darnell and K.E. Koch. 1992. Water and carbon budgets of developing
citrus fruit. J. Amer. Soc. Hort. Sci. 117:287-293.
Jackson, W.T. 1962. Use of carbowaxes (polyethylene glycols) as osmotic agents. Plant
Physiol. 37:513-519.
Jensen, M.H. 1999. Hydroponics worldwide. Acta Horticulturae 481:719-729.
Jones, J.B. 1997. Hydroponics: A Practical guide for the soilless grower. St. Lucie Press.
Florida.
Kato, T. and S. Kubota. 1978. Properties of invertases in sugar storage tissues of citrus fruit
and changes in their activities during maturation. Physiol. Plant.42.67-72.
Kauffman, M.R. and P.J. Kramer, 1967. Phloem water relations and translocation. Plant
Physiol. 42:191-194.
Kaufmann, M.R. 1970. Water potential components in growing citrus fruits. Plant Physiol.
46.:145-149.
85
Knipling, E.B. 1967. Measurement of leaf water potential by the dye method. Ecology
48:1038-1041.
Knipling E.B. and P.J. Kramer, 1967. Comparison of the dye method with the thermocouple
psychrometer for measuring leaf water potentials. Plant Physiol. 20:67-72.
Koch, K.E. 1984. The path of photosynthate translocation into citrus fruit. Plant,Cell and
Environment 7:647-653.
Koch, K.E. and W.T. Avigne. 1990. Postphloem, non-vascular transfer in citrus: Kinetics,
metabolism and sugar gradients. Plant Physiol. 93:1405-1416.
Koch, N.C. 1995. Studies on the improvement of mandarin fruit size. MSc(Agric) Thesis,
University of Stellenbosch, South Africa.
Kramer, P.J. 1934. Effects of soil temperature on the absorption of water by plants. Science
79:371-372.
Kramer, P.J. 1940. Root resistance as the cause of decreased water absorption by plants at low
temperatures. Plant Physiol. 15:63-79.
Kramer, P.J. 1983. Water relations of plants. Academic Press, New York.
Kriedemann, P.E. 1969a. 14C distribution in lemon plants. J. Hortic. Sci. 44:273-279.
Kriedemann, P.E. 1969b. 14C distribution in orange plants. Aust. J. agric. Res. 20:291-300.
Kriedemann, P.E. 1970. The distribution of 14C-labelled assimilates in mature lemon trees.
Aust. J. agric. Res. 21:623-632.
Krizek, D.T. 1985. Methods of inducing water stress in plants. HortScience 20(6):1028-1037.
Kruger, J.A., C.D. Tolmay and K. Britz. 2000a. Effects of fertigation frequencies and
irrigation systems on performance of Valencia oranges in two subtropical areas of
South Africa. Proc. Intl. Soc. Citricult. IX Congr. 232-235.
86

Kruger, J.A., K. Britz, C.D. Tolmay and S.F. du Plessis. 2000b. Evaluation of an open
hydroponics systems (OHS) for citrus in South Africa: Preliminary results. Proc. Intl.
Soc. Citricult. IX Congr. 239-242.
Kuperus, K.H., N. Combrink, K. Britz and J. Ngalo. 2002 Evaluation of an open hydroponic
system (OHS) for the production of citrus in South Africa. Citrus Research
International (Pty) Ltd. Annual Research Report.
Lagerwerff, J.V., G. Otaga and H.E. Eagle. 1961. Control of osmotic pressure of culture
solutions with polyethylene glycol. Science. 133:1486-1487.
Lippert, F. 1993. Amounts of organic constituents in tomato cultivated in open and closed
hydroponic systems. Acta Hort. 339:113-123.
Lombaard, S. 1994. Sproeibemesting van jong sitrusbome. Instituut vir tropiese en
subtropiese gewasse. 262:10-11.
Lowell, C.A. 1986. Structure and sucrose metabolizing enzymes of the transport path:
Implications for assimilate translocation in grapefruit. PhD dissertation. Univ. of
Florida, Gainesville.
Lowell, C.A., P.T. Tomlinson and K.E. Koch, 1989. Sucrose-metabolizing enzymes in
transport tissues and adjacent sink structures in developing citrus fruit. Plant Physiol.
90:1394-1402.
Mantell, A., E.E. Goldschmidt, S.P. Manselise. 1980. Turnover of tritiated water in
calamondin plants. J. Amer. Soc. Hort. Sci. 105:741-744.
Martinez, R. and C. Fernandez. 2004. Preliminary results on citrus groves under the MOHT
system. Xth Intl. Citrus Congr. pp103. (abstr.)
Mason, J. 1990. Commercial hydroponics: How to grow 86 different plants in hydroponics.
Kangaroo Press.
87
McCutchan, H. and K.A. Shackel. 1992. Stem-water potential as a sensitive indicator of water
stress in prune trees (Prunus domestica L. cv. French). J. Amer. Soc. Hort. Sci.
117(4):607-611.
Meyer, R.F. and J.S. Boyer. 1981. Osmoregulation, solute distribution, and growth in soybean
seedlings having low water potentials. Planta 1151:482-489.
Miller, W.M. 1990. Internal quality attributes of Florida Valencia orange and their
relationship to fruit density measurements. Appl. Eng. Agr. 6:461-464.
Monselise, S.P., R. Goren and I. Wallerstein. 1972. Girdling effect on orange fruit set and
young fruit abscission. HortScience 7: 514-515.
Morgan, J.M. 1984. Osmoregulation and water status in higher plants. Ann. Rev. Plant.
Physiol. 35:223-242.
Naor, A., I. Klein, H. Hpert, Y. Grinblat, M. Peres and A. Kaufman. 1999. Water stress and
crop level interactions in relation to nectarine yield, fruit size distribution, and water
potentials. J. Amer. Soc. Hort. Sci. 124(2):189-193.
Naor, A. and S. Cohen. 2003. Sensitivity and variability of maximum trunk shrinkage,
midday stem water potential, and transpiration rate in response to withholding
irrigation from field-grown apple trees. Hortscience 38(4):547-551.
Pijl, I. 2001. Drip fertigation: Effects on water movement, soil characteristics and root
distribution. MSc(Agric) Thesis, University of Stellenbosch, South Africa.
Richards, L.A. and G. Otaga. 1958. Thermocouple for vapour pressure measurement in
biological and soil systems at high humidity. Science. 128:1089-1090.
Richards, D. 1986. Tree growth and productivity – the role of roots. Acta Hort. 175:27-36.
Robinson, T.L. and W.C. Stiles. 1993. Fertigation of young apple trees to improve growth and
cropping. Compact Fruit Tree 26:61-65.
88
Salisbury, F.B. and C.W. Ross, 1991. Plant Physiology. Fourth edition. Wadsworth,
California.
Schaffer, A.A., E.E. Goldschmidt, R. Goren and E. Galili. 1985. Fruit set and carbohydrate
status in alternate and non-alternate bearing Citrus cultivars. J. Amer. Soc. Hort. Sci.
110:574-578.
Schaffer, A.A., O. Sagee, E.E. Goldschmidt and R. Goren. 1987. Invertase and sucrose
synthase activity, carbohydrate status and endogenous IAA levels during Citrus leaf
development. Physiol. Plant. 69:151-155.
Schoeman, S.P. 2002. Physiological measurements of daily daylight fertigated citrus trees.
MSc(Agric) Thesis, University of Stellenbosch, South Africa.
Scholander, P.F., H.T. Hammel, E.D Bradstreet, and E.A. Hemmington. 1964. Hydrostatic
pressure and osmotic potential in leaves of mangroves and some other plants. Proc.
Natl. Acad. Sci. 52:119-125.
Scholander, P.F., H.T. Hammel, E.D. Bradstreet and E.A. Hemmington. 1965. Sap pressure in
vascular plants. Science 148:339-346.
Schwarz, M. 1995. Soilless culture management. Springer-Verlag.
Shackel, K.A., H. Ahmadi, W. Biasi, R. Bucher, D. Goldhamer, S. Gurusinghe, J. Hasey, D.
Kester, B. Krueger, B. Lampinen, G. McGourty, W. Micke, E. Mitcham, B. Olson, K.
Pelletrau, H. Philips, D. Ramos, L. Schwankl, S. Sibbett, R. Snyder, S Southwick, M.
Stevenson, M. Thorpe, S. Weinbaum, and J. Yeager. 1997. Plant water status as an
index of irrigation need in deciduous fruit trees. HortTechnology 7(1):23-29.
Slatyer, R.O. 1967. Plant-water relationships. Academic Press, New York.
Slatyer, R.O. and S.O. Taylor. 1960. Terminology in plant-soil-water relationships. Nature.
187:922-924.
89
Slavik, B. 1974. Methods of studying plant water relations. Academia Publishing House,
Prague, Springer-Verlag, New York.
Song, K.J., E. Echeverria and H.S. Lee. 1998. Distribution of sugars and related enzymes in
the stem and blossom halves of ‘Valencia” oranges. J. Amer. Soc. Hort. Sci. 123:416-
420.
Spanner, D.C. 1951. The Peltier effect and its use in the measurement of suction pressure. J.
Exp. Bot. 2:145-168.
Spanner, D.C. 1964. Introduction to thermodynamics. Academic Press, New York.
Stanghellini, M.E. and S.L. Rasmussen, 1994. Hydroponics: A solution for zoosporic
pathogens. Plant disease. December 1129-1137
Stassen, P.J.C., P.G. Mostert and B.L. Smith. 1999. Mango tree nutrition: A crop perspective.
Neltropika, January 1999 pp41-51.
Steel, R.G.D. and J.H. Torrie. 1980. Principles and procedures of statistics. 2nd ed. McGraw-
Hill, New York.
Sung, S.S., D. Xu and C.C. Black. 1989. Identification of actively filling sucrose sinks. Plant
Physiol. 89:1117-1121.
Syvertsen, J.P. and L.G. Albrigo. 1980. Seasonal and diurnal citrus leaf and fruit water
relations. Bot. Gaz. 141:440-446.
Syvertsen, J.P. and S.M. Sax. Fertigation frequency, wetting patterns and nitrate leaching
from lysimeter-grown citrus trees. Proc. Fla. State Hort. Soc. 112:9-14.
Ting, S.V. 1969. Distribution of soluble components and quality factors in the edible portion
of citrus fruit. J. Amer. Soc. Hort. Sci. 94:515-519.
Tolmay, C.D., K. Britz and B. Delamini. 2002 Effects of fertigation frequency and irrigation
system on performance of Valencia oranges in a cool subtropical area of South Africa.
Citrus Research International (Pty) Ltd. Annual Research Report.
90

Tomlinson, P.T., E.R. Duke, K.D. Nolte and K.E. Koch. 1991. Sucrose synthase and invertase
in isolated vascular bundles. Plant Physiol. 97:1249-1252.
Turner, N.C. 1981. Techniques and experimental approaches for the measurement of plant
water status. Plant and Soil. 58:339-366.
Tyree, M.T. and H.T. Hammel. 1972. The measurement of the turgor pressure and the water
relations of plants by the pressure-bomb technique. J. Expt. Bot. 23:267-282.
Van Rooyen, C. 2000. Sitrus vaar goed in hidroponika stelsel. Lanbouweekblad 4 February
2000 pp36-37.
Venter, G. 1999. Oop en geslote hidroponiese stelsels. Landbouweekkblad. 15 January 1999
pp30-31.
Wallerstein, I., R. Goren and S.P. Monselise. 1978. Rapid and slow translocation of 14C-
sucrose and 14C-assimilates in citrus and Phaseolus with special reference to ringing
effect. J. Hortic. Sci. 53:203-208.
Wiebbe, H.H. 1966. Matric potential of several plant tissues and biocolloids. Plant Physoil.
41:1439-1442.
Woods, D. 1999. Fundamentals of open hydroponics in the citrus industry. S.A. Besproeiing
April/Mei 1999 pp4-6.
Yakushiji, H., H. Nonami, T. Fukuyama, S. Ono, N. Takagi and Y. Hashimoto. 1996. Sugar
accumulation enhanced by osmoregulation in Satsuma mandarin fruit. J. Amer. Soc.
Hort. Sci. 121:466-472.
Yakushiji, H., K.Morinaga and H. Nonami. 1998. Sugar accumulation and partitioning in
Satsuma mandarin tree tissues and fruit in response to drought stress. J. Amer. Soc.
Hort. Sci. 123:719-726.
91

Yen, C.R. and K.E. Koch. 1990. Developmental changes in translocation and localization of
14C-labelled assimilates in grapefruit: Light and dark CO2 fixation by leaves and fruit.
J. Amer. Soc. Hort. Sci. 115:815-819.
92