
Economic Improvement of Power Factor Correction
11
Journal of Power and Energy Engineering, 2021, 9, 1-11 https://www.scirp.org/journal/jpee ISSN Online: 2327-5901 ISSN Print: 2327-588X DOI: 10.4236/jpee.2021.96001 Jun. 8, 2021 1 Journal of Power and Energy Engineering Economic Improvement of Power Factor Correction: A Case Study Kassem Wahab, Mohamad Rahal * , Roger Achkar Department of Computer and Communications Engineering, Faculty of Engineering, American University of Science and Technology, Beirut, Lebanon Abstract Power factor (PF) is simply an expression of energy efficiency, which is al- ways expressed in terms of percentage. Technically, PF is a ratio of real power in Kilowatts to the apparent power, which is always expressed in kilovolts amperes. In AC power analysis, power is always expressed in three ways, the real power (P), reactive power (Q), and the apparent power (S). The real power is the work useful power, while the reactive power is the wasted power in the 3-phase AC system, and the apparent power is the vectorial sum of the two powers. The increase of reactive power will reduce the presence of real power, thus making the power to be more expensive. In this paper, we will analyze the importance of improving the power factor by applying a bank of capacitors to a case study in Lebanon. Analysis of the economic improvement in the application of power factor correction is carried out. The result shows a reduction of 12 percent in the total cost. Keywords Power Factor, Reactive Power, kVAR, Inductive, Apparent Power, Active Power 1. Introduction In the production of power, there are a lot of inductors used in AC machines like transformers and motors. Inductances are caused by the magnetic fields, which are produced by the currents flowing in the electrical circuit. Basically, the coils of wires are employed as the coil increases the magnetic field coupling. In the process of transmission of power, the power factor shows the effectiveness of the electricity used. The improvement of the power factor is very significant eco- nomically as it helps to reduce the electricity bill. Improving the power factor is a How to cite this paper: Wahab, K., Rahal, M. and Achkar, R. (2021) Economic Im- provement of Power Factor Correction: A Case Study. Journal of Power and Energy Engineering, 9, 1-11. https://doi.org/10.4236/jpee.2021.96001 Received: April 23, 2021 Accepted: June 5, 2021 Published: June 8, 2021 Copyright © 2021 by author(s) and Scientific Research Publishing Inc. This work is licensed under the Creative Commons Attribution International License (CC BY 4.0). http://creativecommons.org/licenses/by/4.0/ Open Access
-
Upload
khangminh22 -
Category
Documents
-
view
0 -
download
0
Transcript of Economic Improvement of Power Factor Correction
Journal of Power and Energy Engineering, 2021, 9, 1-11 https://www.scirp.org/journal/jpee
ISSN Online: 2327-5901 ISSN Print: 2327-588X
DOI: 10.4236/jpee.2021.96001 Jun. 8, 2021 1 Journal of Power and Energy Engineering
Economic Improvement of Power Factor Correction: A Case Study
Kassem Wahab, Mohamad Rahal*, Roger Achkar
Department of Computer and Communications Engineering, Faculty of Engineering, American University of Science and Technology, Beirut, Lebanon
Abstract Power factor (PF) is simply an expression of energy efficiency, which is al-ways expressed in terms of percentage. Technically, PF is a ratio of real power in Kilowatts to the apparent power, which is always expressed in kilovolts amperes. In AC power analysis, power is always expressed in three ways, the real power (P), reactive power (Q), and the apparent power (S). The real power is the work useful power, while the reactive power is the wasted power in the 3-phase AC system, and the apparent power is the vectorial sum of the two powers. The increase of reactive power will reduce the presence of real power, thus making the power to be more expensive. In this paper, we will analyze the importance of improving the power factor by applying a bank of capacitors to a case study in Lebanon. Analysis of the economic improvement in the application of power factor correction is carried out. The result shows a reduction of 12 percent in the total cost.
Keywords Power Factor, Reactive Power, kVAR, Inductive, Apparent Power, Active Power
1. Introduction
In the production of power, there are a lot of inductors used in AC machines like transformers and motors. Inductances are caused by the magnetic fields, which are produced by the currents flowing in the electrical circuit. Basically, the coils of wires are employed as the coil increases the magnetic field coupling. In the process of transmission of power, the power factor shows the effectiveness of the electricity used. The improvement of the power factor is very significant eco-nomically as it helps to reduce the electricity bill. Improving the power factor is a
How to cite this paper: Wahab, K., Rahal, M. and Achkar, R. (2021) Economic Im-provement of Power Factor Correction: A Case Study. Journal of Power and Energy Engineering, 9, 1-11. https://doi.org/10.4236/jpee.2021.96001 Received: April 23, 2021 Accepted: June 5, 2021 Published: June 8, 2021 Copyright © 2021 by author(s) and Scientific Research Publishing Inc. This work is licensed under the Creative Commons Attribution International License (CC BY 4.0). http://creativecommons.org/licenses/by/4.0/
Open Access

K. Wahab et al.
DOI: 10.4236/jpee.2021.96001 2 Journal of Power and Energy Engineering
verified technique of improving the effective usage of the electricity through the utilities as well as the end-users (final consumers of electricity). The economic benefit for the final consumer of electricity is lower power losses in the cables as well as in the transformer. Increased power factor also helps in reducing the electricity bills and improving voltage conditions as the benefits of utilities from the system release capacity [1].
The real power is taken as the power for producing work, which is always given in watts (kilowatts); the reactive power, which is due to the inductors and capacitors, is not used to do any work (it is a wasted power), but it is needed in AC 3-phase power system for the equipment to operate. Several industrial loads are inductive, like the transformers, motors, industrial furnaces, and induction furnaces [2]. The current drawn by the inductive load includes two key compo-nents: the power-producing current and the magnetizing current. The magne-tizing current is needed to sustain the electromagnetic field in the component and generate reactive power [3]. The inductive load will draw current, which al-ways lags the voltage.
When the harmonics are absent, the apparent power (demanded power) is composed of the vectorial sum of both, the real power and the reactive power, thus showing how much power the electrical power will use. The PF also is the cosine angle between the current and the voltage in the phasor diagram. For the electrical loads which are inductive like motor, they consume of about 80 per-cent to 90 percent (power factor) which is delivered to them while the remaining percentage of power (10 percent to 20 percent) delivered is wasted as they are employed to establish the electromagnetic field in the machines. The electro-magnetic field will expand and collapse, so the drawn power to the field in one instant is just a return to the supply of electrical power in the subsequent instant [4]. Thus, the mean power drawn by the magnetic field will remain zero, and the reactive power doesn’t appear in the meter of kilowatts-hour. The magnetic current will generate reactive power. Even though it does not do useful work, it will circu-late between the places and the generator to heavily drain the power source [5].
To reduce the reactive power, some banks of capacitors are added which is an economical technique to adjust the power factor. As the current via an inductive load will lag the voltage, the current will lead the voltage in a capacitor. There-fore, the capacitors are added to serve as leading reactive current producers to help counter the lagging reactive current in electrical transmission [6]. The re-lease of capacity implies that the total current flowing will be minimized as the system’s power factor. This will allow the extra load to be included and served by the available system. In case the equipment like the generators, cables, and transformers might be thermally overloaded, by increasing the power factor, the current will be minimized and overload condition will be eliminated.
Basically, the correction of power factor should be encouraged by applying penalties which is introduced by some utilities. When entirely considered, there may also be some economic factors that may result in capacitors’ addition for power factor correction, which gives a justifiable investment return [7]. There
K. Wahab et al.
DOI: 10.4236/jpee.2021.96001 3 Journal of Power and Energy Engineering
are also other savings like the reduction in the distribution losses, increased vol-tage reduction, and current increased facilities. Even though the real power often produces little in the savings of cost and is smaller than the saving to be gained from the power factor penalties reduction.
This paper is organized as follow. Section 2 presents the power factor correc-tion background along with materials and methods. The full details about ma-thematical calculations are explained. Section 3 presents a case study of one juice factory for the period of four years. Appropriate conclusion is drawn in Section 4.
2. Background, Materials, and Methods 2.1. Background
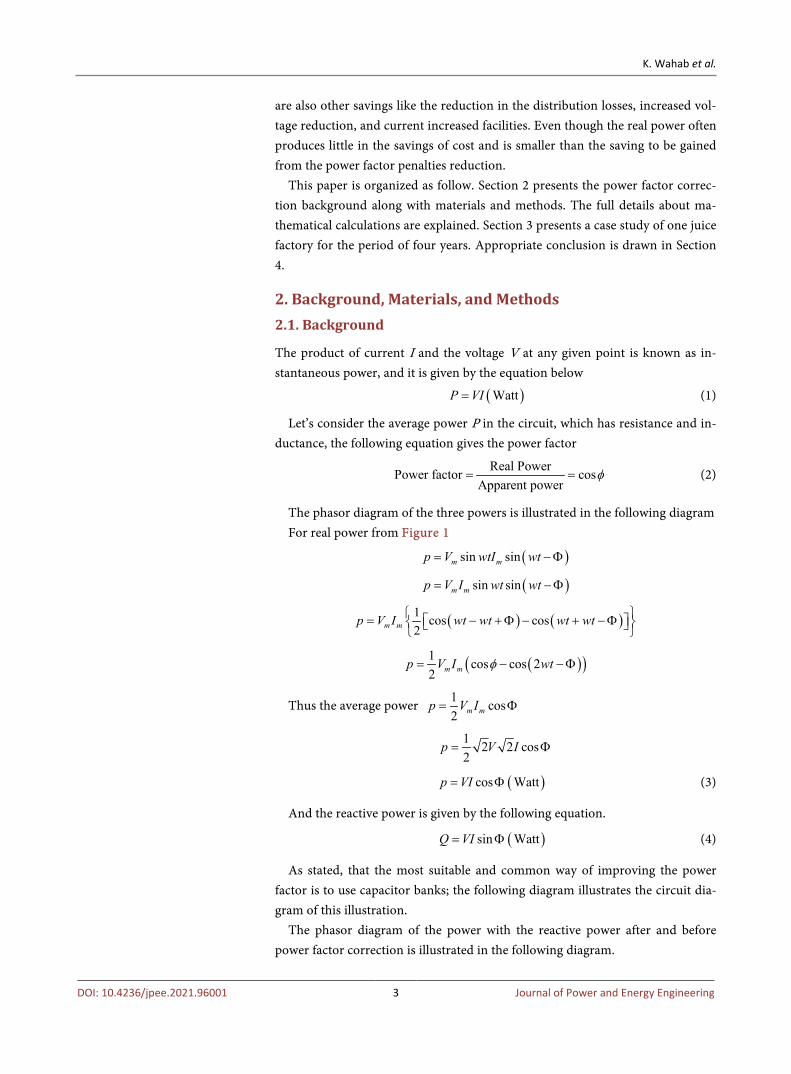
The product of current I and the voltage V at any given point is known as in-stantaneous power, and it is given by the equation below
( )WattP VI= (1)
Let’s consider the average power P in the circuit, which has resistance and in-ductance, the following equation gives the power factor
Real Power cosApparent p
Power fower
actor φ== (2)
The phasor diagram of the three powers is illustrated in the following diagram For real power from Figure 1
( )sin sinm mp V wtI wt= −Φ
( )sin sinm mp V I wt wt= −Φ
( ) ( )1 cos cos2m mp V I wt wt wt wt = − +Φ − + −Φ
( )( )1 cos cos 22 m mp V I wtφ= − −Φ
Thus the average power 1 cos2 m mp V I= Φ
1 2 2 cos2
p V I= Φ
( )cos Wattp VI= Φ (3)
And the reactive power is given by the following equation.
( )sin WattQ VI= Φ (4)
As stated, that the most suitable and common way of improving the power factor is to use capacitor banks; the following diagram illustrates the circuit dia-gram of this illustration.
The phasor diagram of the power with the reactive power after and before power factor correction is illustrated in the following diagram.
K. Wahab et al.
DOI: 10.4236/jpee.2021.96001 4 Journal of Power and Energy Engineering
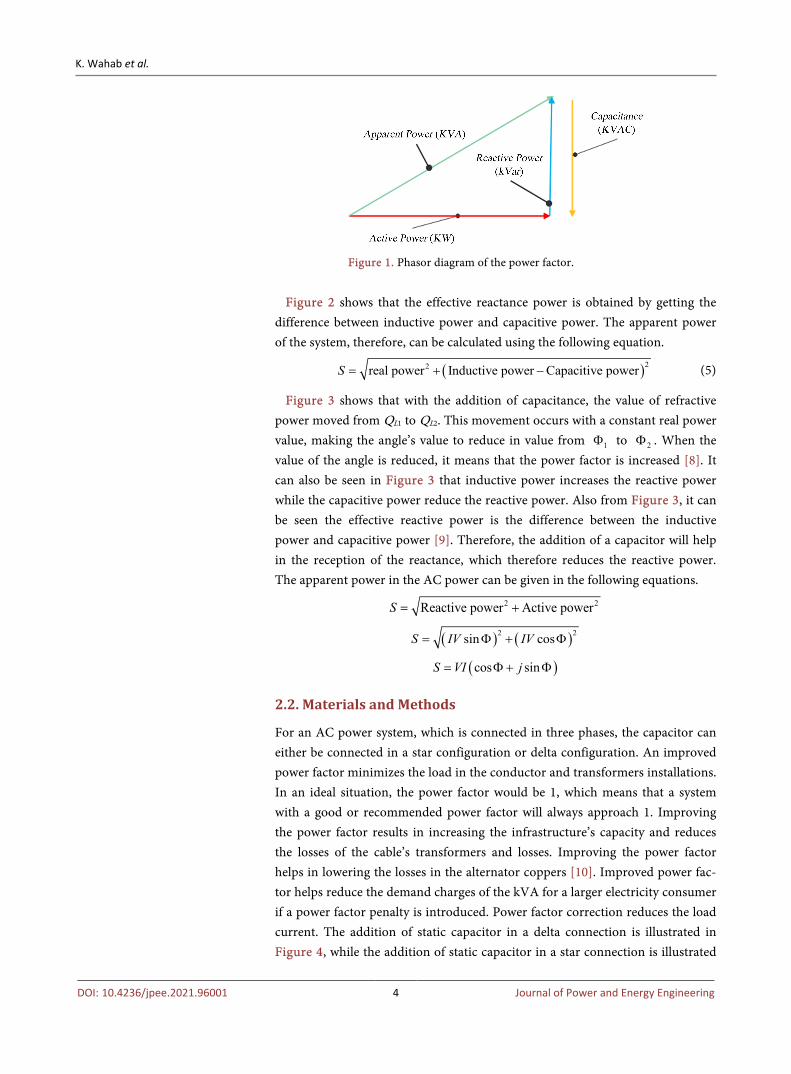
Figure 1. Phasor diagram of the power factor.
Figure 2 shows that the effective reactance power is obtained by getting the
difference between inductive power and capacitive power. The apparent power of the system, therefore, can be calculated using the following equation.
( )22real power Inductive power Capacitive powerS = + − (5)
Figure 3 shows that with the addition of capacitance, the value of refractive power moved from QL1 to QL2. This movement occurs with a constant real power value, making the angle’s value to reduce in value from 1Φ to 2Φ . When the value of the angle is reduced, it means that the power factor is increased [8]. It can also be seen in Figure 3 that inductive power increases the reactive power while the capacitive power reduce the reactive power. Also from Figure 3, it can be seen the effective reactive power is the difference between the inductive power and capacitive power [9]. Therefore, the addition of a capacitor will help in the reception of the reactance, which therefore reduces the reactive power. The apparent power in the AC power can be given in the following equations.
2 2Reactive power Active powerS = +
( ) ( )2 2sin cosS IV IV= Φ + Φ
( )cos sinS VI j= Φ + Φ
2.2. Materials and Methods
For an AC power system, which is connected in three phases, the capacitor can either be connected in a star configuration or delta configuration. An improved power factor minimizes the load in the conductor and transformers installations. In an ideal situation, the power factor would be 1, which means that a system with a good or recommended power factor will always approach 1. Improving the power factor results in increasing the infrastructure’s capacity and reduces the losses of the cable’s transformers and losses. Improving the power factor helps in lowering the losses in the alternator coppers [10]. Improved power fac-tor helps reduce the demand charges of the kVA for a larger electricity consumer if a power factor penalty is introduced. Power factor correction reduces the load current. The addition of static capacitor in a delta connection is illustrated in Figure 4, while the addition of static capacitor in a star connection is illustrated

K. Wahab et al.
DOI: 10.4236/jpee.2021.96001 5 Journal of Power and Energy Engineering
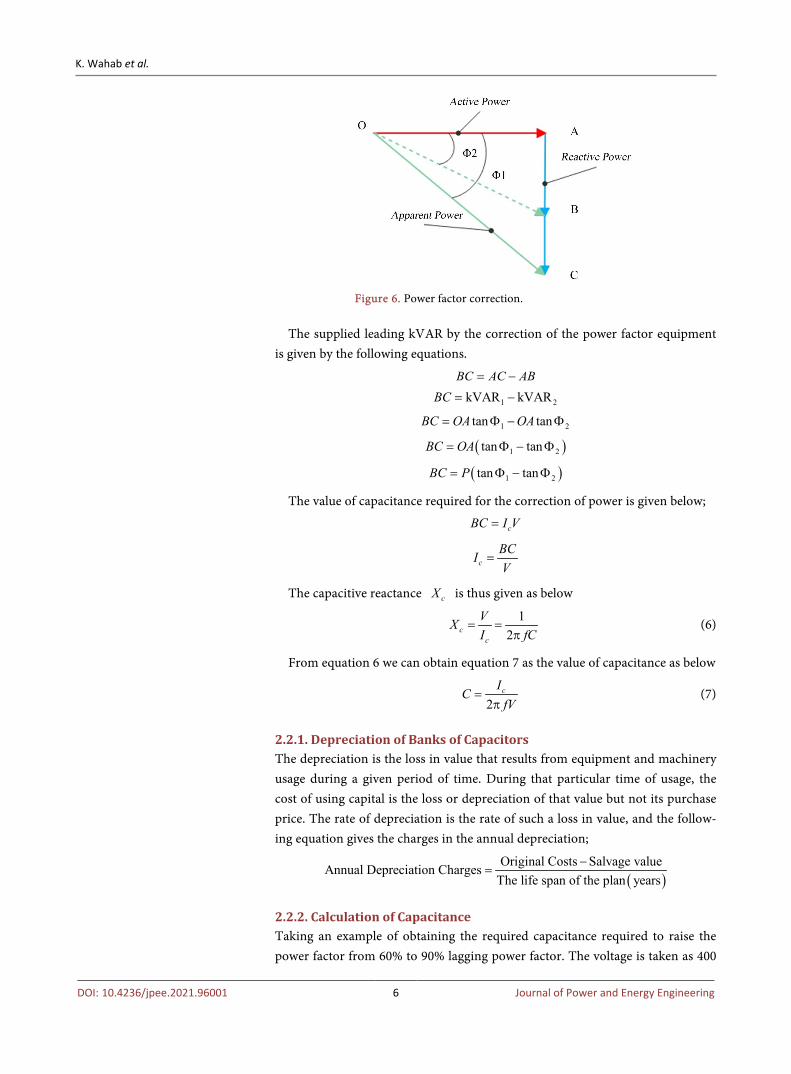
in Figure 5. We can make a good analysis of the reactive power using Figure 6 as an
example
Figure 2. Circuit diagram of a capacitor for power factor rectification.
Figure 3. Phasor diagram of the power with the reactive power after and before power factor correction.
Figure 4. Addition of static capacitor in delta configuration.
Figure 5. Addition of static capacitor in delta configuration.
K. Wahab et al.
DOI: 10.4236/jpee.2021.96001 6 Journal of Power and Energy Engineering
Figure 6. Power factor correction.
The supplied leading kVAR by the correction of the power factor equipment
is given by the following equations.
BC AC AB= −
1 2kVAR kVARBC = −
1 2tan tanBC OA OA= Φ − Φ
( )1 2tan tanBC OA= Φ − Φ
( )1 2tan tanBC P= Φ − Φ
The value of capacitance required for the correction of power is given below;
cBC I V=
cBCIV
=
The capacitive reactance cX is thus given as below
12c
c
VXI fC
= =π
(6)
From equation 6 we can obtain equation 7 as the value of capacitance as below
2cI
CfV
=π
(7)
2.2.1. Depreciation of Banks of Capacitors The depreciation is the loss in value that results from equipment and machinery usage during a given period of time. During that particular time of usage, the cost of using capital is the loss or depreciation of that value but not its purchase price. The rate of depreciation is the rate of such a loss in value, and the follow-ing equation gives the charges in the annual depreciation;
( )Original Costs Salvage value
ThAnnual Deprecia
e life span of tion Charge
the plan y rs
ea s−
=
2.2.2. Calculation of Capacitance Taking an example of obtaining the required capacitance required to raise the power factor from 60% to 90% lagging power factor. The voltage is taken as 400
K. Wahab et al.
DOI: 10.4236/jpee.2021.96001 7 Journal of Power and Energy Engineering
V and at a frequency of 50 Hz. The input power = 5 kW The actual power factor = 1cos 0.6Φ = The desired power factor = 2cos 0.9Φ =
( )11 cos 0.60 53.13−Φ = =
( )12 cos 0.90 25.84−Φ = =
The desired capacitive power (kVAR) to increase Power Factor from 0.60 to 0.90.
The desired capacitive power (kVAR) = ( )1 2tan tanP Φ − Φ
( )kVAR 5 kW 1.333 0.4843= × −
The desired capacitive power = 10.188 kVAR The kVAR = 10.188
From Equation (6), 12c
c
VXI fC
= =π
2cI fCV= π
125663.7cI C= ×
And
kVAR 400 125663.71000
cVIC= = × ×
50265.48cI C= ×
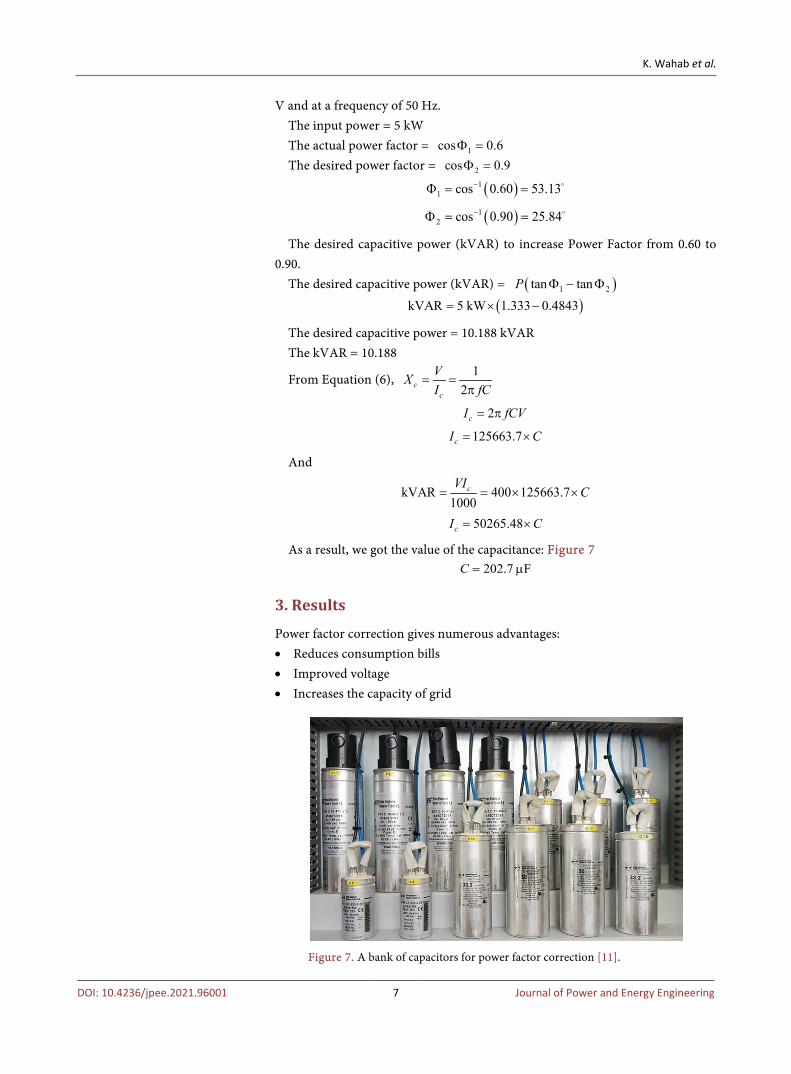
As a result, we got the value of the capacitance: Figure 7 202.7 FC = µ
3. Results
Power factor correction gives numerous advantages: • Reduces consumption bills • Improved voltage • Increases the capacity of grid
Figure 7. A bank of capacitors for power factor correction [11].
K. Wahab et al.
DOI: 10.4236/jpee.2021.96001 8 Journal of Power and Energy Engineering
Case Study
BALQIS is a factory in south Lebanon engaged in fruit juice production business. This study is based on their data provided for 9 machines for the past four years. The aim from this study is to correct the power factor from 0.8 to 0.9.
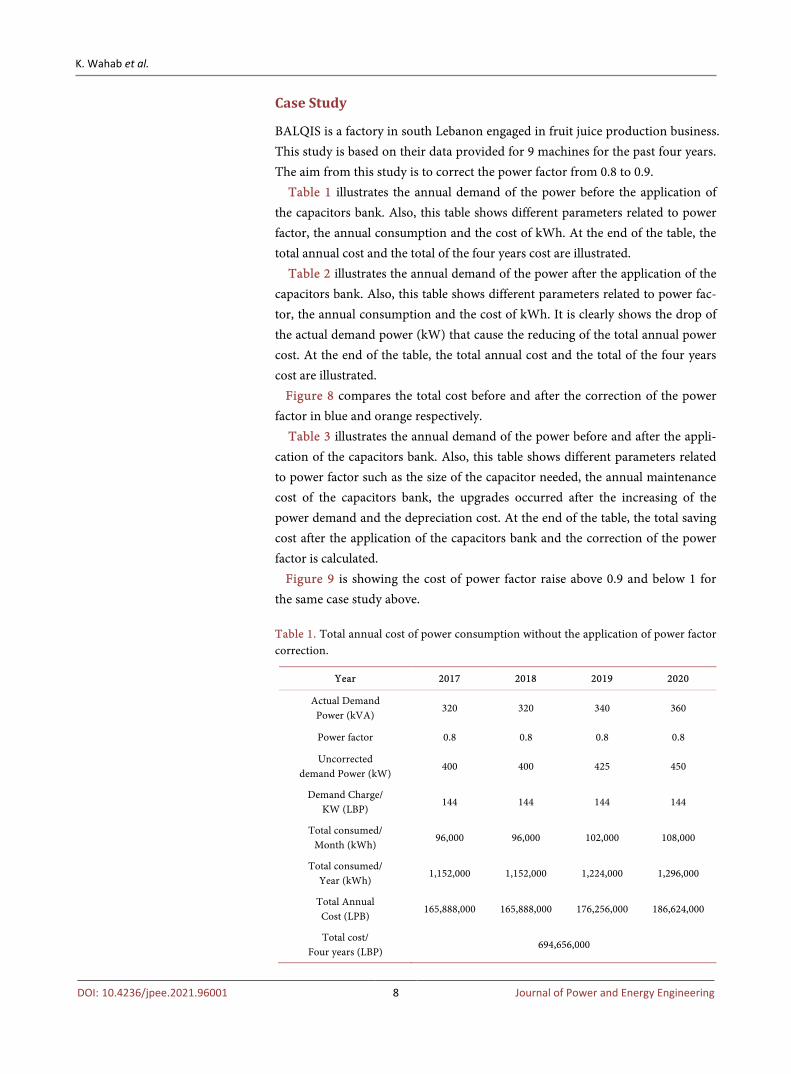
Table 1 illustrates the annual demand of the power before the application of the capacitors bank. Also, this table shows different parameters related to power factor, the annual consumption and the cost of kWh. At the end of the table, the total annual cost and the total of the four years cost are illustrated.
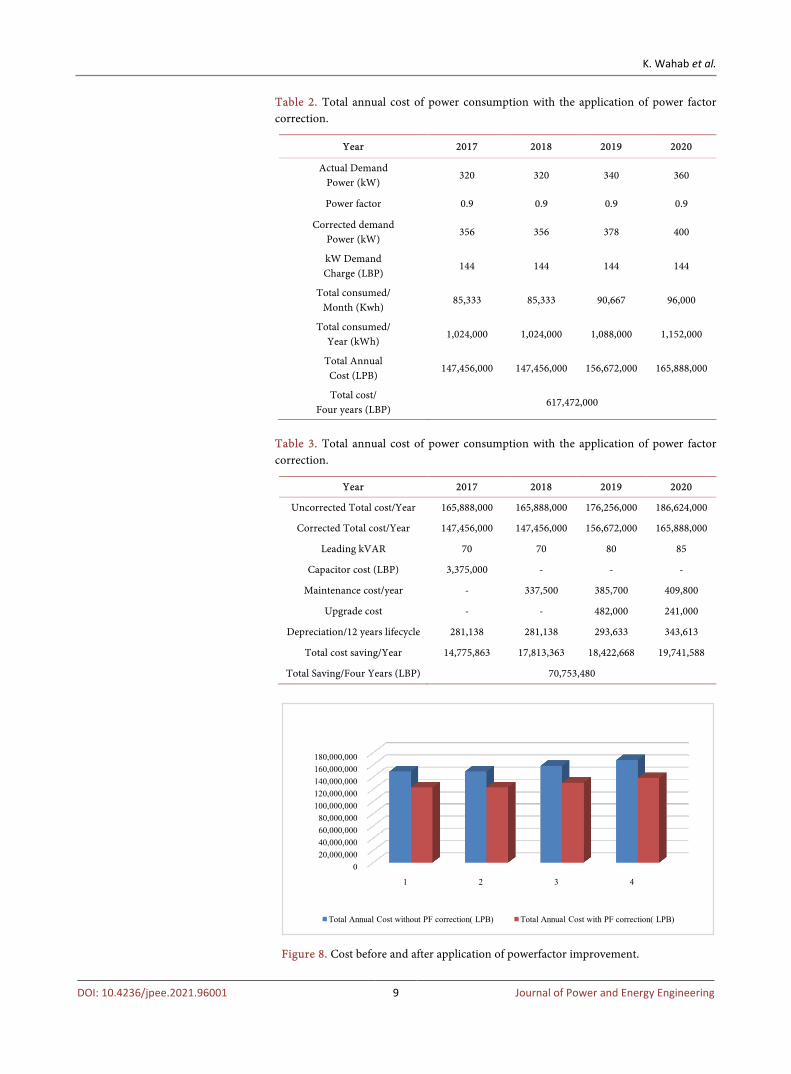
Table 2 illustrates the annual demand of the power after the application of the capacitors bank. Also, this table shows different parameters related to power fac-tor, the annual consumption and the cost of kWh. It is clearly shows the drop of the actual demand power (kW) that cause the reducing of the total annual power cost. At the end of the table, the total annual cost and the total of the four years cost are illustrated.
Figure 8 compares the total cost before and after the correction of the power factor in blue and orange respectively.
Table 3 illustrates the annual demand of the power before and after the appli-cation of the capacitors bank. Also, this table shows different parameters related to power factor such as the size of the capacitor needed, the annual maintenance cost of the capacitors bank, the upgrades occurred after the increasing of the power demand and the depreciation cost. At the end of the table, the total saving cost after the application of the capacitors bank and the correction of the power factor is calculated.
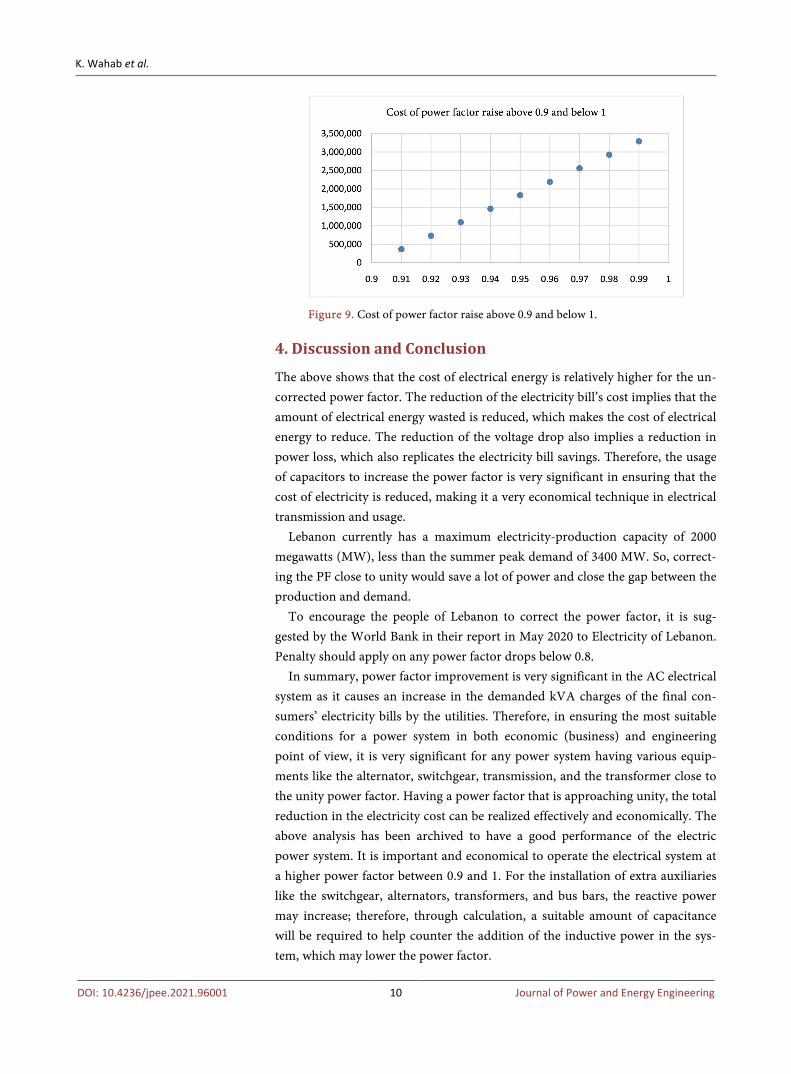
Figure 9 is showing the cost of power factor raise above 0.9 and below 1 for the same case study above.
Table 1. Total annual cost of power consumption without the application of power factor correction.
Year 2017 2018 2019 2020
Actual Demand Power (kVA)
320 320 340 360
Power factor 0.8 0.8 0.8 0.8
Uncorrected demand Power (kW)
400 400 425 450
Demand Charge/ KW (LBP)
144 144 144 144
Total consumed/ Month (kWh)
96,000 96,000 102,000 108,000
Total consumed/ Year (kWh)
1,152,000 1,152,000 1,224,000 1,296,000
Total Annual Cost (LPB)
165,888,000 165,888,000 176,256,000 186,624,000
Total cost/ Four years (LBP)
694,656,000
K. Wahab et al.
DOI: 10.4236/jpee.2021.96001 9 Journal of Power and Energy Engineering
Table 2. Total annual cost of power consumption with the application of power factor correction.
Year 2017 2018 2019 2020
Actual Demand Power (kW)
320 320 340 360
Power factor 0.9 0.9 0.9 0.9
Corrected demand Power (kW)
356 356 378 400
kW Demand Charge (LBP)
144 144 144 144
Total consumed/ Month (Kwh)
85,333 85,333 90,667 96,000
Total consumed/ Year (kWh)
1,024,000 1,024,000 1,088,000 1,152,000
Total Annual Cost (LPB)
147,456,000 147,456,000 156,672,000 165,888,000
Total cost/ Four years (LBP)
617,472,000
Table 3. Total annual cost of power consumption with the application of power factor correction.
Year 2017 2018 2019 2020
Uncorrected Total cost/Year 165,888,000 165,888,000 176,256,000 186,624,000
Corrected Total cost/Year 147,456,000 147,456,000 156,672,000 165,888,000
Leading kVAR 70 70 80 85
Capacitor cost (LBP) 3,375,000 - - -
Maintenance cost/year - 337,500 385,700 409,800
Upgrade cost - - 482,000 241,000
Depreciation/12 years lifecycle 281,138 281,138 293,633 343,613
Total cost saving/Year 14,775,863 17,813,363 18,422,668 19,741,588
Total Saving/Four Years (LBP) 70,753,480
Figure 8. Cost before and after application of powerfactor improvement.
020,000,00040,000,00060,000,00080,000,000
100,000,000120,000,000140,000,000160,000,000180,000,000
1 2 3 4
Total Annual Cost without PF correction( LPB) Total Annual Cost with PF correction( LPB)
K. Wahab et al.
DOI: 10.4236/jpee.2021.96001 10 Journal of Power and Energy Engineering
Figure 9. Cost of power factor raise above 0.9 and below 1.
4. Discussion and Conclusion
The above shows that the cost of electrical energy is relatively higher for the un-corrected power factor. The reduction of the electricity bill’s cost implies that the amount of electrical energy wasted is reduced, which makes the cost of electrical energy to reduce. The reduction of the voltage drop also implies a reduction in power loss, which also replicates the electricity bill savings. Therefore, the usage of capacitors to increase the power factor is very significant in ensuring that the cost of electricity is reduced, making it a very economical technique in electrical transmission and usage.
Lebanon currently has a maximum electricity-production capacity of 2000 megawatts (MW), less than the summer peak demand of 3400 MW. So, correct-ing the PF close to unity would save a lot of power and close the gap between the production and demand.
To encourage the people of Lebanon to correct the power factor, it is sug-gested by the World Bank in their report in May 2020 to Electricity of Lebanon. Penalty should apply on any power factor drops below 0.8.
In summary, power factor improvement is very significant in the AC electrical system as it causes an increase in the demanded kVA charges of the final con-sumers’ electricity bills by the utilities. Therefore, in ensuring the most suitable conditions for a power system in both economic (business) and engineering point of view, it is very significant for any power system having various equip-ments like the alternator, switchgear, transmission, and the transformer close to the unity power factor. Having a power factor that is approaching unity, the total reduction in the electricity cost can be realized effectively and economically. The above analysis has been archived to have a good performance of the electric power system. It is important and economical to operate the electrical system at a higher power factor between 0.9 and 1. For the installation of extra auxiliaries like the switchgear, alternators, transformers, and bus bars, the reactive power may increase; therefore, through calculation, a suitable amount of capacitance will be required to help counter the addition of the inductive power in the sys-tem, which may lower the power factor.
K. Wahab et al.
DOI: 10.4236/jpee.2021.96001 11 Journal of Power and Energy Engineering
Conflicts of Interest
The authors declare no conflicts of interest regarding the publication of this pa-per.
References [1] Adefarati, T. (2013) Economic and Industrial Application of Power Factor Im-
provement. CRC Press, Hull.
[2] Joshi, H. (2018) Residential, Commercial and Industrial Electrical Systems: Equip-ment and Selection. Tata McGraw-Hill Education, Hull.
[3] Whitfield, J. (2014) Electrical Craft Principles. IET, Liverpool.
[4] (2018) Resources, Market-Oriented Program Planning Study: Hearings before the Committee on Energy and Natural Resources, United States Senate, Ninety-fifth Congress, First Session on the Energy Research and Development Administration’s Market-oriented Program Planning Study. U.S. Government Printing Office, Chi-cago.
[5] Clayton, A.E. (2019) Power Factor Correction: Explaining the Meaning and Impor-tance of Power Factor, and Describing Methods for the Improvement of Power Factor. Sir I. Pitman & Sons, Limited, Liverpool.
[6] Paschal, J. (2019) Practical Guide to Power Factor Correction and Harmonics and Your Electric Bill. EC&M Books/Intertec Pub, Liverpool.
[7] Teo, H.S. (2013) Designing Power Factor Correction Circuit for Fluorescent Lamp Ballast. Jabatan Kejuruteraan Elektrik, Fakulti Kejuruteraan, Universiti Malaya, New York.
[8] Natarajan, R. (2018) Power System Capacitors. CRC Press, Washington DC. https://doi.org/10.1201/9781420027204
[9] Rashid, M.H. (2014) Power Electronics Handbook: Devices, Circuits, and Applica-tions. Elsevier, Amsterdam.
[10] Willis, L. (2019) Power Distribution Planning Reference Book. CRC Press, Florida.
[11] EEP-Electrical Engineering Portal. (2019) Reactive Power and Power Factor Correc-tion Essentials to ALWAYS Keep on Mind. Electrical-Engineering-portal.com.