Correction Notice Consumer Trends - AWS
267
22 July 2010 Correction Notice Consumer Trends No.56 Quarter 1 2010 Production errors were identified in the Consumer Trends 2010 Q1 release, originally published 15 July 2010. The errors were found in two disaggregated chain volume measures. The affected disaggregated series are 04.1.1 and 12.6.1. The error affects non-seasonal and seasonally adjusted data and also the implied deflator. Aggregated levels are not affected. These errors have been corrected. For further information please contact [email protected] ONS apologises for any inconvenience caused. Issued by: Office for National Statistics Government Buildings Cardiff Road Newport NP10 8XG Telephone: Media Office 0845 604 1858 Contact Centre 0845 601 3034
-
Upload
khangminh22 -
Category
Documents
-
view
0 -
download
0
Transcript of Correction Notice Consumer Trends - AWS

22 July 2010
Correction Notice
Consumer Trends
No.56 Quarter 1 2010 Production errors were identified in the Consumer Trends 2010 Q1 release, originally published 15 July 2010. The errors were found in two disaggregated chain volume measures. The affected disaggregated series are 04.1.1 and 12.6.1. The error affects non-seasonal and seasonally adjusted data and also the implied deflator. Aggregated levels are not affected. These errors have been corrected. For further information please contact [email protected] ONS apologises for any inconvenience caused. Issued by: Office for National Statistics Government Buildings Cardiff Road Newport NP10 8XG Telephone: Media Office 0845 604 1858 Contact Centre 0845 601 3034
Consumer Trends
Quarter 1 2010
No 56
Editor: Denise Blackmore

ISSN 1749–5431
A National Statistics publication National Statistics are produced to high professional standards set out in the National Statistics Code of Practice. They are produced free from political influence. About us The Office for National Statistics The Office for National Statistics (ONS) is the executive office of the UK Statistics Authority, a non-ministerial department which reports directly to Parliament. ONS is the UK government’s single largest statistical producer. It compiles information about the UK’s society and economy which provides evidence for policy and decision-making and in the allocation of resources. The Director of ONS is also the National Statistician. Contacts This publication For information about the content of this publication, contact the Editor: Denise Blackmore Tel: 01633 45 6660 Email: [email protected] Other customer and media enquiries ONS Customer Contact Centre Tel: 0845 601 3034 Media Relations 0845 6041858 International: +44 (0)845 601 3034 Minicom: 01633 812399 Email: [email protected] Fax: 01633 652747 Room 1015, Government Buildings, Cardiff Road, Newport, South Wales NP10 8XG
You can find more information about our other statistical releases at www.statistics.gov.uk
Copyright and reproduction © Crown copyright 2010
Published with the permission of the Office for Public Sector Information (OPSI) You may use this publication (excluding logos) free of charge in any format for research, private study or internal circulation within an organisation providing it is used accurately and not in a misleading context. The material must be acknowledged as Crown copyright and you must give the title of the source publication. Where we have identified any third party copyright material you will need to obtain permission from the copyright holders concerned. For re-use of this material you must apply for a Click-Use Public Sector Information (PSI) Licence from:
Office of Public Sector Information, Crown Copyright Licensing and Public Sector Information, Kew, Richmond, Surrey TW9 4DU.
Tel: 020 8876 3444
www.opsi.gov.uk/click-use/index.htm

Contents Guide to this publication ......................................................................................................................... 4 Consumer Trends briefing ...................................................................................................................... 7 Detailed tables on household consumption expenditure: 0 Summary.............................................................................................................................. 16 01 Food and non-alcoholic beverages ...................................................................................... 22 02 Alcoholic beverages and tobacco......................................................................................... 28 03 Clothing and footwear .......................................................................................................... 34 04 Housing, water, electricity, gas and other fuels .................................................................... 40 05 Furnishings, household equipment and routine maintenance of the house.......................... 52 06 Health................................................................................................................................... 64 07 Transport .............................................................................................................................. 70 08 Communication .................................................................................................................... 82 09 Recreation and culture ......................................................................................................... 88 10 Education ........................................................................................................................... 100 11 Restaurants and hotels ...................................................................................................... 106 12 Miscellaneous goods and services..................................................................................... 112 TOUR UK and foreign tourist expenditure ..................................................................................... 124 0GS Goods and services summary............................................................................................ 130 TG Total goods ........................................................................................................................ 136 DG Durable goods .................................................................................................................... 142 SDG Semi-durable goods ........................................................................................................... 154 NDG Non-durable goods............................................................................................................. 166 SER Services ............................................................................................................................. 190 0A.CN Summary: COICOP sub-division, annual data, current prices............................................ 226 0GSA.CN Summary: Goods and services, annual data, current prices .............................................. 227 0A.KN Summary: COICOP sub-division, annual data, chained volume measures........................ 228 0GSA.KN Summary: Goods and services, annual data, chained volume measures .......................... 229 0A.DN Summary: COICOP sub-division, annual data, implied deflators ....................................... 230 0GSA.DN Summary: Goods and services, annual data, implied deflators.......................................... 231 ALC.CN Total alcoholic beverages................................................................................................... 232 DET.CN Selected detailed components, current prices.................................................................... 238 ADD.KS Additional totals requested by users, chained volume measures....................................... 239 Appendix A: Definitions and conventions ........................................................................................... 240 B: Sources.......................................................................................................................... 244 C: Classification of household consumption headings ....................................................... 252 Index ........................................................................................................................................... 265
3
Guide to this publication
Noticeboard
Date of this publication: 15 July 2010.
Revised data are included from 2006 quarter 1 and is
consistent with the National Accounts Blue Book
2010. There are larger revisions than at other times
of the year. The estimates reflect the incorporation of
the annual benchmarked survey data for 2008 for the
first time.
Household expenditure volume series are
chainlinked annually. In addition to the above
revisions, volume estimates have been re-referenced
to reflect more recent price structures. Estimates in
this issue are now based on 2006 price structures,
i.e. the chained volume measure in 2006 equals the
current price value of expenditure in 2006. This is the
first publication using reference year 2006. In
previous issues, the chain volume series have been
referenced to 2005.
Growth in each year up to and including 2007 is
calculated at average prices of the previous year.
Growth from 2007 onwards is calculated at average
prices of 2006. Volume series are additive only for
the most recent periods; annual data for 2006
onwards and quarterly data for 2007 quarter 1
onwards.
The next issue of Consumer Trends will be available
on 28 September 2010.
Consumer Trends presents comprehensive
estimates of household final consumption
expenditure, constructed to conform to the European
System of Accounts 1995 (ESA 95) Classification Of
Individual Consumption by Purpose (COICOP)
Definition of household consumption A definition of household final consumption
expenditure within the context of the UK national
accounts is:
Personal expenditure on goods - durable, semi-
durable and non-durable - and on services, including
the imputed rent of owner-occupied dwellings, the
administrative costs of non-life insurance and life
insurance and superannuation schemes.
Business expenditure and expenses, interest and
other transfer payments and capital expenditure on
dwellings are all excluded from household
consumption.
At UK national level, which represents final
consumption expenditure in the UK and abroad by
UK resident households, net tourism expenditure is
included. This is excluded to produce the aggregate
total UK domestic expenditure, representing final
consumption expenditure in the UK by UK and
foreign households. These and other points which
affect the general definition of household final
consumption expenditure are discussed in greater
detail in Appendix A.
Sources of data
The quarterly and annual estimates of household
final consumption expenditure at current and
previous year prices are built up commodity by
commodity from a variety of independent sources.
Where more than one potential source is available
the source used for a particular good or service is the
one which is judged to provide the most reliable
estimate of the level and changes in expenditure on
that good or service. In some cases a combination of
sources is employed so as to make the best use of
the available information. Each component series
within household final consumption expenditure is
individually seasonally adjusted in current price and
volume terms. The main sources of data for
household final consumption expenditure are detailed
in Appendix B.
COICOP
COICOP is one of the functional classifications in the
System of National Accounts 1993, adapted for
Europe as the European System of Accounts 1995.
4

As well as being used for Household Final
Consumption Expenditure (HHFCE), as published in
Consumer Trends, it is also used for household
budget surveys, as adopted for the UK Living Costs
and Food Survey, and international comparisons of
Gross Domestic Product.
COICOP splits total HHFCE into 12 divisions by purpose:
01 Food and non-alcoholic beverages
02 Alcoholic beverages and tobacco
03 Clothing and footwear
04 Housing, water, electricity, gas and other fuels
05 Furnishings, household equipment and
routine household maintenance
06 Health
07 Transport
08 Communication
09 Recreation and culture
10 Education
11 Restaurants and hotels
12 Miscellaneous goods and services
COICOP also identifies durable goods, semi-durable
goods, non-durable goods and services within these
divisions.
Consumer Trends uses COICOP Division numbers
(with the grand total shown as 0) for the first set of
tables. This is followed by tables grouping the
estimates using initial letters:-
TOUR for UK and foreign tourist expenditure
0GS for goods and services summary
TG for total goods
DG for durable goods
SDG for semi-durable goods
NDG for non-durable goods
SER for services
0A for annual data summary
0GSA for goods and services annual summary
ALC for total alcoholic beverages
DET for selected detailed components
ADD for additional total requested by users
Each table has six variants, denoted by a suffix:-
CN for current prices, not seasonally adjusted
CS for current prices, seasonally adjusted
KN for chained volumes, not seasonally adjusted
KS for chained volumes, seasonally adjusted
DN for implied deflators, not seasonally adjusted
DS for implied deflators, seasonally adjusted
The Consumer Trends briefing article and the
information covered by the three regular appendices
(A: Definitions and conventions; B: Sources; and C:
Classification of household consumption headings)
reflects the COICOP classification.
More information on the detail contained within each
COICOP division can be found in Appendix C, and at
the United Nations Classifications Registry Online
http://esa.un.org/unsd/cr/registry
Annual chain-linking
With the publication of the 2003 Q2 edition of
Consumer Trends the volume measures of
expenditure (shown in the .KN and .KS tables)
moved to a calculation method using annual chain-
linking. Previously, a fixed base methodology was
used, in which expenditure on goods and services
were valued at prices of a particular year, most
recently 1995. Growth in expenditure since 1995 was
measured in the same terms, with the relative
importance of individual goods and services in the
total being a reflection of expenditure on them in
1995.
The base year had previously been changed roughly
every five years in a process known as re-basing.
Earlier time periods used expenditure shares from
1990, 1985 and so on to weight together the various
goods and services purchased. Under annual chain
linking, re-basing is carried out every year, with
growth being measured by re-valuing current period
expenditure at average prices prevailing in the
previous year and comparing the result with actual
expenditure in the previous year. The weight given to
individual goods and services within the total is
updated every year. In this way changes in the
structure of the economy are reflected in statistics of
growth at a much earlier stage than previously.
The move to annual chain-linking involved a change
in the reference year used for volume series. The
reference year is the one in which current price
series and the corresponding volume measures
equal each other in £ (or take the value 100 in index
number form). This year is now 2006.
5

Although the use of chain-linking produces more
accurate growth rates there is a loss of additivity for
the volume series. This means that components no
longer sum to the totals before 2006 for the annual
figures and 2007 for the quarters.
The volume series are now referred to as chained
volume measures (CVM) in £ million rather than
constant prices. The individual series identifiers did
not change from the previous 1995-based ones.
Revisions analysis
An analysis of revisions to the key household
expenditure series - growth rates of total expenditure
at current prices and in chained volume terms -
appears at the end of the following article entitled
Consumer Trends briefing.
Consumer Trends on the Internet
In line with other National Statistics publications,
Consumer Trends is published on the National
Statistics website. It can be found at:-
www.statistics.gov.uk/consumertrends
Consumer Trends is no longer published on paper,
but basic paper copies can be easily printed by the
customer direct from this website. Please refer to
respective bookmarks for the pages you wish to print.
For all tables appearing in Consumer Trends, historic
estimates pre-2005 are available electronically from
the website using the Time Series Data link on the
Consumer Trends page or the link to Consumer
Trends datasets which are in excel spreadsheet
format.
ONS Website www.statistics.gov.uk/default.asp The household final consumption data in this publication can be obtained via the ONS website, which hosts time series data, cross sectional data and metadata from across the organisation. Information is posted in PDF, or in XLS and CSV formats. This is available using the site search and index functions from the homepage. To access the full range of government statistical releases please visit the Publication Hub: http://www.statistics.gov.uk/hub/index.html
Time Series Data http://www.statistics.gov.uk/statbase/tsdintro.asp A free-of-charge service that gives you access to a
comprehensive database of more than 40,000 time
series from major National Statistics economic and
socio-economic releases. The complete histories of
the time series are available in the database. You
can download complete releases to your PC; or
make your own custom selection to view or
download.
Consistency with other publications
The household final consumption estimates in this
edition of Consumer Trends are consistent with those
appearing at Tables E1-E4 of the statistical bulletin
Quarterly National Accounts published on 12 July
2010.
Acknowledgements
We would like to thank everyone who provided data
and analyses.
Work is continuously undertaken to improve the
collection of detailed data below the headings
published. We would welcome feedback via e-mail
on specific areas of interest to readers of Consumer
Trends so that we may prioritise requirements when
planning future publications.
6
Consumer Trends Briefing
Total expenditure [All comment below relates to data in volume terms,
seasonally adjusted, unless otherwise indicated].
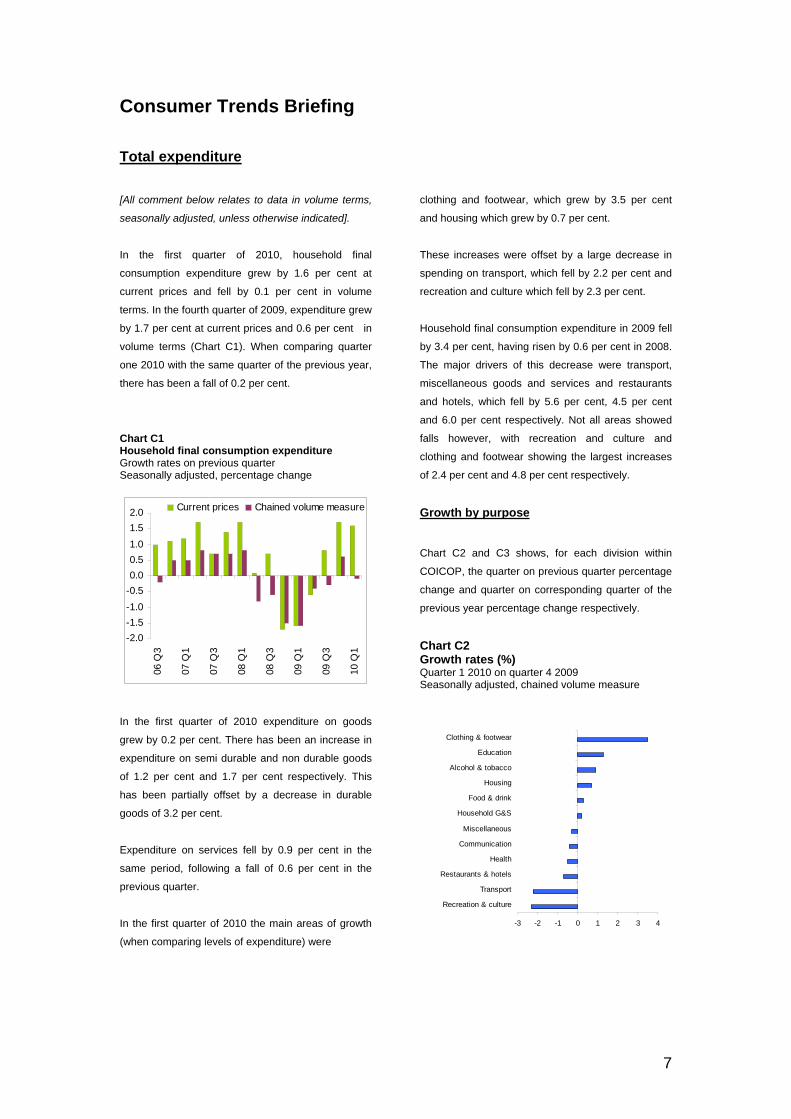
In the first quarter of 2010, household final
consumption expenditure grew by 1.6 per cent at
current prices and fell by 0.1 per cent in volume
terms. In the fourth quarter of 2009, expenditure grew
by 1.7 per cent at current prices and 0.6 per cent in
volume terms (Chart C1). When comparing quarter
one 2010 with the same quarter of the previous year,
there has been a fall of 0.2 per cent.
Chart C1 Household final consumption expenditure Growth rates on previous quarter Seasonally adjusted, percentage change
-2.0-1.5-1.0-0.50.00.51.01.52.0
06 Q
3
07 Q
1
07 Q
3
08 Q
1
08 Q
3
09 Q
1
09 Q
3
10 Q
1
Current prices Chained volume measure
In the first quarter of 2010 expenditure on goods
grew by 0.2 per cent. There has been an increase in
expenditure on semi durable and non durable goods
of 1.2 per cent and 1.7 per cent respectively. This
has been partially offset by a decrease in durable
goods of 3.2 per cent.
Expenditure on services fell by 0.9 per cent in the
same period, following a fall of 0.6 per cent in the
previous quarter.
In the first quarter of 2010 the main areas of growth
(when comparing levels of expenditure) were
clothing and footwear, which grew by 3.5 per cent
and housing which grew by 0.7 per cent.
These increases were offset by a large decrease in
spending on transport, which fell by 2.2 per cent and
recreation and culture which fell by 2.3 per cent.
Household final consumption expenditure in 2009 fell
by 3.4 per cent, having risen by 0.6 per cent in 2008.
The major drivers of this decrease were transport,
miscellaneous goods and services and restaurants
and hotels, which fell by 5.6 per cent, 4.5 per cent
and 6.0 per cent respectively. Not all areas showed
falls however, with recreation and culture and
clothing and footwear showing the largest increases
of 2.4 per cent and 4.8 per cent respectively.
Growth by purpose Chart C2 and C3 shows, for each division within
COICOP, the quarter on previous quarter percentage
change and quarter on corresponding quarter of the
previous year percentage change respectively.
Chart C2 Growth rates (%) Quarter 1 2010 on quarter 4 2009 Seasonally adjusted, chained volume measure
-3 -2 -1 0 1 2 3 4
Clothing & footwear
Education
Alcohol & tobacco
Housing
Food & drink
Household G&S
Miscellaneous
Communication
Health
Restaurants & hotels
Transport
Recreation & culture
7

Chart C3 Growth rates (%) Quarter 1 2010 on quarter 1 2009 S
easonally adjusted, chained volume measure
-6 -4 -2 0 2 4 6
Clothing & footwear
Transport
Food & drink
Alcohol & tobacco
Communication
Housing
Recreation & culture
Education
Restaurants & hotels
Household G&S
Health
Miscellaneous
Deflators Implied deflator
The implied deflators are calculated by dividing
expenditure at current prices by expenditure in
volume terms. Changes reflect both price movements
and changes in the expenditure on commodities
relative to one another.
The implied deflator grew by 1.7 per cent in the first
quarter of 2010, following a growth of 1.0 per cent in
the previous quarter (Chart 4). The durable goods
deflator grew by 1.4 per cent following growth of 0.7
per cent in the previous quarter. The semi-durable
goods deflator grew by 0.7 per cent following growth
of 0.5 per cent in quarter four. The deflator for non-
durable goods grew by 1.9 per cent following growth
of 1.4 per cent in the previous quarter. The services
deflator grew by 2.3 per cent, following growth of 1.5
per cent in the previous quarter.
Chart C4 Household final consumption expenditure Implied deflator total, seasonally adjusted
-2
-1
0
1
2
3
4
5
05 Q
1
05 Q
3
06 Q
1
06 Q
3
07 Q
1
07 Q
3
08 Q
1
08 Q
3
09 Q
1
09 Q
3
10 Q
1
Year on yearQuarter on quarter
Source deflators
Most of household expenditure is deflated by low
level components of the Retail Prices Index (RPI)
and Consumer Prices Index (CPI).
Chart C5 shows the year-on-year percentage
change, not seasonally adjusted in the total
household expenditure implied deflator compared
with the RPI excluding mortgage interest payments
(MIPs) and council tax, and the CPI.
Chart C5 Deflators Not seasonally adjusted Year on year percentage change
0
1
2
3
4
5
6
05 Q
1
05 Q
3
06 Q
1
06 Q
3
07 Q
1
07 Q
3
08 Q
1
08 Q
3
09 Q
1
09 Q
3
10 Q
1
RPI excl.MIPs & council tax
HE implied deflator
CPI
8
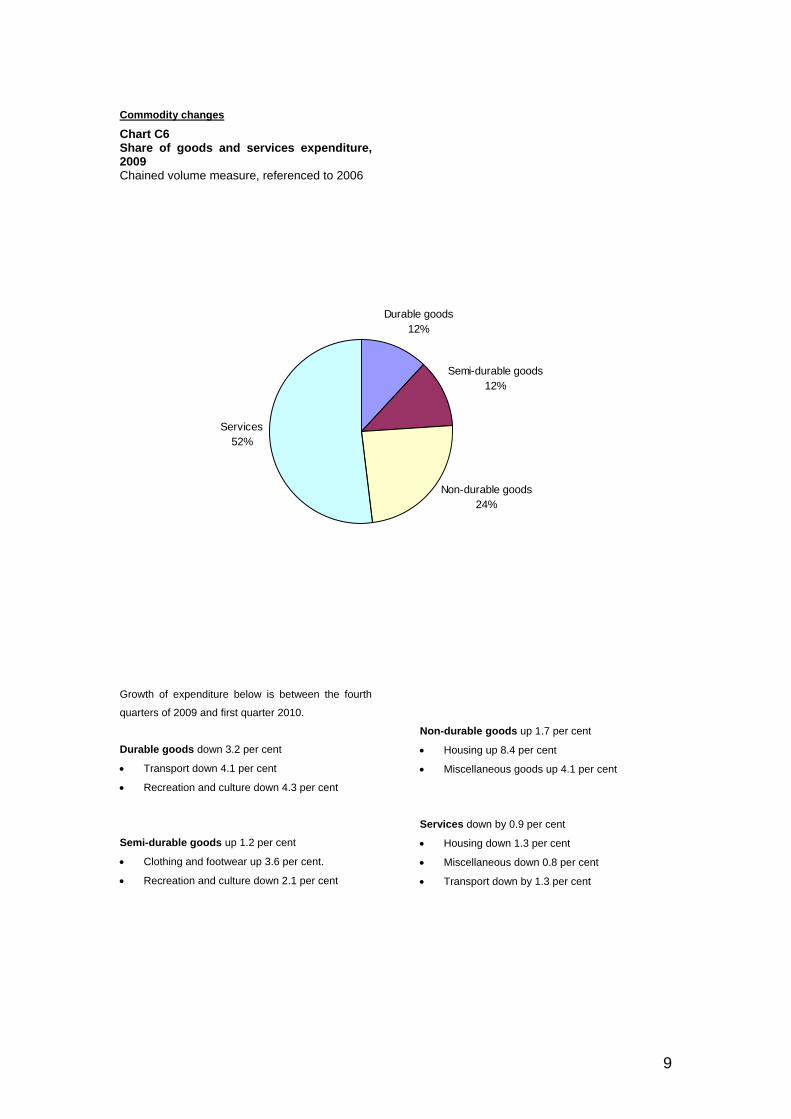
Commodity changes
Chart C6 Share of goods and services expenditure, 2009
Chained volume measure, referenced to 2006
Durable goods12%
Non-durable goods24%
Services 52%
Semi-durable goods12%
Growth of expenditure below is between the fourth
quarters of 2009 and first quarter 2010.
Durable goods down 3.2 per cent
• Transport down 4.1 per cent
• Recreation and culture down 4.3 per cent
Semi-durable goods up 1.2 per cent
• Clothing and footwear up 3.6 per cent.
• Recreation and culture down 2.1 per cent
Non-durable goods up 1.7 per cent
• Housing up 8.4 per cent
• Miscellaneous goods up 4.1 per cent
Services down by 0.9 per cent
• Housing down 1.3 per cent
• Miscellaneous down 0.8 per cent
• Transport down by 1.3 per cent
9
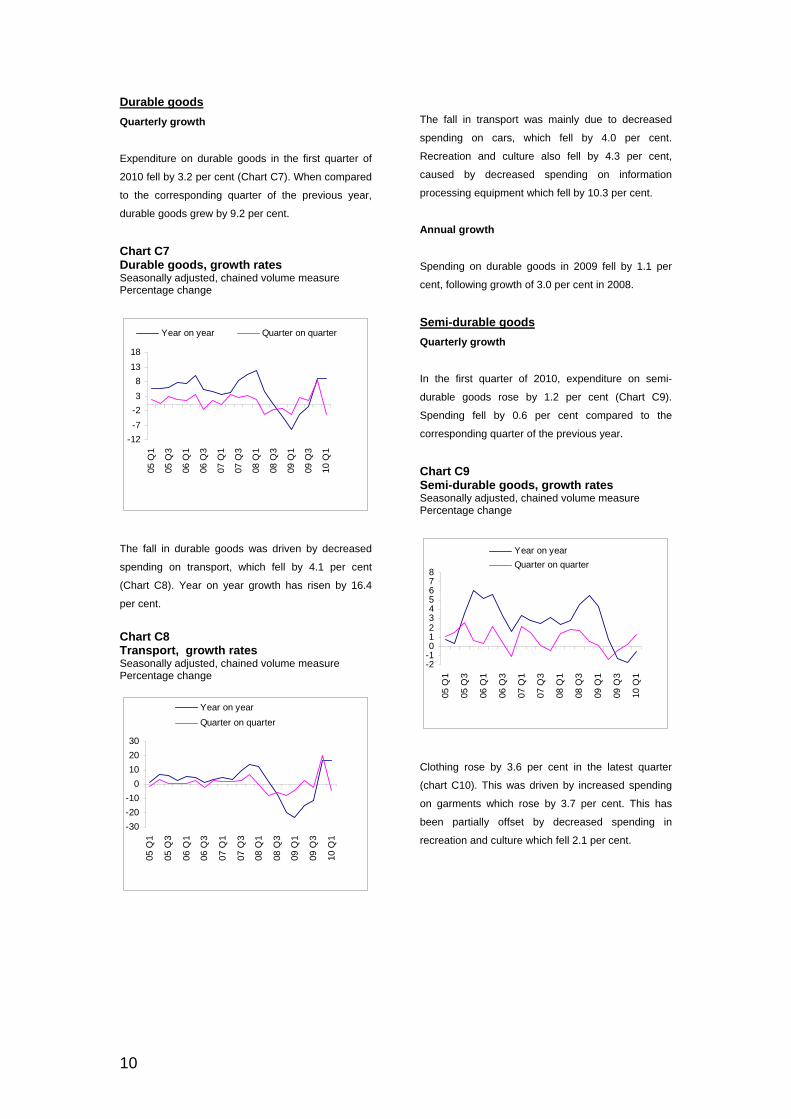
Durable goods Quarterly growth
Expenditure on durable goods in the first quarter of
2010 fell by 3.2 per cent (Chart C7). When compared
to the corresponding quarter of the previous year,
durable goods grew by 9.2 per cent.
Chart C7 Durable goods, growth rates Seasonally adjusted, chained volume measure Percentage change
-12-7-238
1318
05 Q
1
05 Q
3
06 Q
1
06 Q
3
07 Q
1
07 Q
3
08 Q
1
08 Q
3
09 Q
1
09 Q
3
10 Q
1 Year on year Quarter on quarter
The fall in durable goods was driven by decreased
spending on transport, which fell by 4.1 per cent
(Chart C8). Year on year growth has risen by 16.4
per cent.
Chart C8 Transport, growth rates Seasonally adjusted, chained volume measure Percentage change
-30-20-10
0102030
05 Q
1
05 Q
3
06 Q
1
06 Q
3
07 Q
1
07 Q
3
08 Q
1
08 Q
3
09 Q
1
09 Q
3
10 Q
1
Year on yearQuarter on quarter
The fall in transport was mainly due to decreased
spending on cars, which fell by 4.0 per cent.
Recreation and culture also fell by 4.3 per cent,
caused by decreased spending on information
processing equipment which fell by 10.3 per cent.
Annual growth Spending on durable goods in 2009 fell by 1.1 per
cent, following growth of 3.0 per cent in 2008.
Semi-durable goods Quarterly growth
In the first quarter of 2010, expenditure on semi-
durable goods rose by 1.2 per cent (Chart C9).
Spending fell by 0.6 per cent compared to the
corresponding quarter of the previous year.
Chart C9 Semi-durable goods, growth rates Seasonally adjusted, chained volume measure Percentage change
-2-1012345678
05 Q
1
05 Q
3
06 Q
1
06 Q
3
07 Q
1
07 Q
3
08 Q
1
08 Q
3
09 Q
1
09 Q
3
10 Q
1
Year on yearQuarter on quarter
Clothing rose by 3.6 per cent in the latest quarter
(chart C10). This was driven by increased spending
on garments which rose by 3.7 per cent. This has
been partially offset by decreased spending in
recreation and culture which fell 2.1 per cent.
10

Chart C10 Clothing and Footwear growth rates Percentage change
-2
0
2
4
6
8
10
05 Q
1
05 Q
3
06 Q
1
06 Q
3
07 Q
1
07 Q
3
08 Q
1
08 Q
3
09 Q
1
09 Q
3
10 Q
1
Year on year Quarter on quarter
Annual growth Semi-durable goods growth was 0.5 per cent in 2009,
down from 3.9 per cent in 2008.
Non-durable goods Quarterly growth
Expenditure on non-durable goods grew by 1.7 per
cent in the first quarter of 2010. Year on year growth
is flat this quarter. (Chart C11).
Chart C11 Non-durable goods, growth rates Seasonally adjusted, chained volume measure Percentage change
-6-5-4-3-2-101234567
05 Q
1
05 Q
3
06 Q
1
06 Q
3
07 Q
1
07 Q
3
08 Q
1
08 Q
3
09 Q
1
09 Q
3
10 Q
1
Year on yearQuarter on quarter
Expenditure on housing rose by 8.4 per cent in
quarter one (Chart 12). This was mainly driven by
increased expenditure on electricity, gas and other
fuels which grew by 12.1 per cent.
Chart C12 Housing growth rates Seasonally adjusted, chained volume measure Percentage change
-15
-10
-5
0
5
10
05 Q
1
05 Q
3
06 Q
1
06 Q
3
07 Q
1
07 Q
3
08 Q
1
08 Q
3
09 Q
1
09 Q
3
10 Q
1
Year on year Quarter on quarter
Annual growth Spending on non-durable goods fell by 4.2 per cent
in 2009 down from a fall of 0.9 per cent in 2008.
Services Quarterly growth In the first quarter of 2010 expenditure on services
fell by 0.9 per cent. This was a fall of 2.5 per cent
when compared to the corresponding quarter of the
previous year (Chart C13).
Chart C13 Services, growth rates Seasonally adjusted, chained volume measure Percentage change
-5-4-3-2-1012345
05 Q
1
05 Q
3
06 Q
1
06 Q
3
07 Q
1
07 Q
3
08 Q
1
08 Q
3
09 Q
1
09 Q
3
10 Q
1
Year on yearQuarter on quarter
Expenditure on housing has fallen by 1.3 per cent
(Chart 14). This was mainly driven by a fall in
spending on imputed rentals which fell by 1.8 per
cent.
11
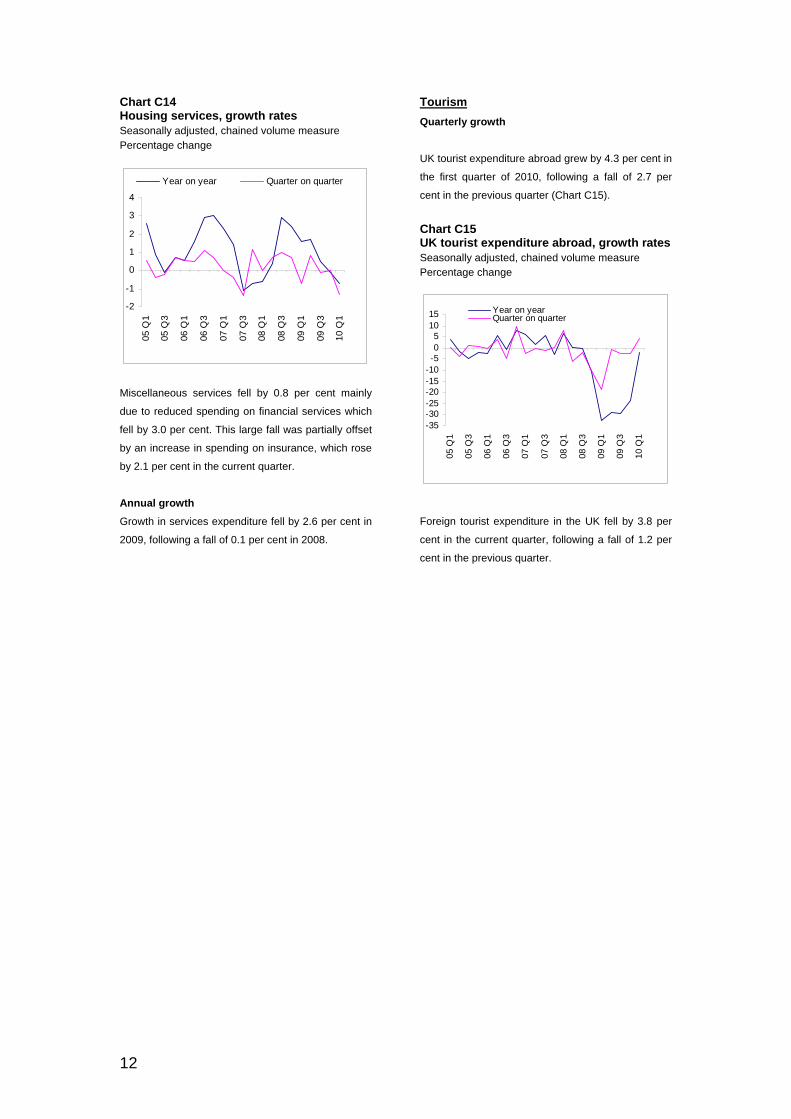
Chart C14 Housing services, growth rates Seasonally adjusted, chained volume measure Percentage change
-2
-1
0
1
2
3
4
05 Q
1
05 Q
3
06 Q
1
06 Q
3
07 Q
1
07 Q
3
08 Q
1
08 Q
3
09 Q
1
09 Q
3
10 Q
1
Year on year Quarter on quarter
Miscellaneous services fell by 0.8 per cent mainly
due to reduced spending on financial services which
fell by 3.0 per cent. This large fall was partially offset
by an increase in spending on insurance, which rose
by 2.1 per cent in the current quarter.
Annual growth Growth in services expenditure fell by 2.6 per cent in
2009, following a fall of 0.1 per cent in 2008.
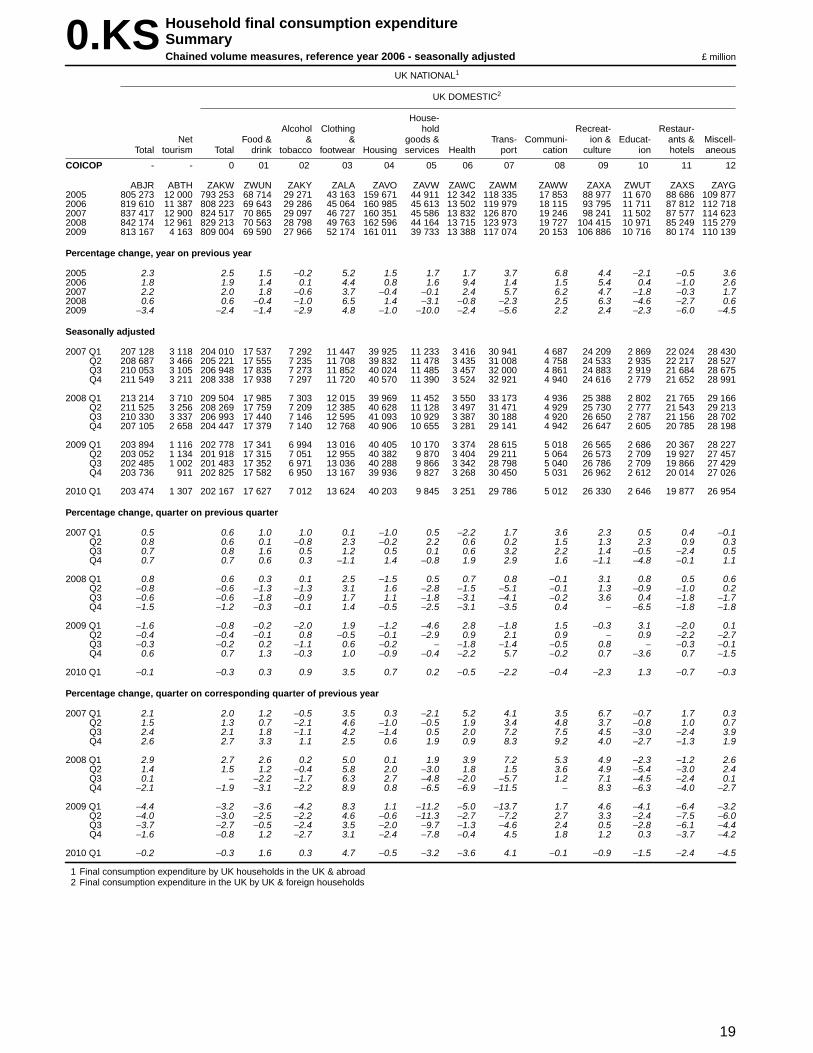
Tourism Quarterly growth UK tourist expenditure abroad grew by 4.3 per cent in
the first quarter of 2010, following a fall of 2.7 per
cent in the previous quarter (Chart C15). Chart C15 UK tourist expenditure abroad, growth rates Seasonally adjusted, chained volume measure Percentage change
-35-30-25-20-15-10-505
1015
05 Q
1
05 Q
3
06 Q
1
06 Q
3
07 Q
1
07 Q
3
08 Q
1
08 Q
3
09 Q
1
09 Q
3
10 Q
1
Year on yearQuarter on quarter
Foreign tourist expenditure in the UK fell by 3.8 per
cent in the current quarter, following a fall of 1.2 per
cent in the previous quarter.
12

Long term trends
Long run quarterly and annual data are obtainable for
most of the series in Consumer Trends - for details
see the guide to this publication. These indicate the
pattern of changes to trends in household
expenditure over time.
In current price terms, the share of total spending in
1970 on services was 35 per cent. This has risen
continually over time to reach 52 per cent in 2009.
Tourism which in 1970 had no significant share, has
also increased over time to 1 per cent. As spending
on services and tourism has increased, there has
been a corresponding fall in the share of spending on
goods; over the same period, the share of household
expenditure on non-durable goods fell from 41 per
cent to 26 per cent. Semi-durable goods have fallen
from 14 per cent to 11 per cent and durable goods
have remained constant at 10 per cent of total share
(Chart C16).
Chart C16 Household final consumption expenditure Main component shares Current prices, annual data
0%
25%
50%
75%
100%
1970 1990 2009
Durable goods
Semi-durablegoods
Non-durablegoods
Services
Tourism
Chart C17 Household final consumption expenditure 1970-2009 Chained volume measures annual data Index Numbers (1970 = 100)
100
200
300
400
500
600
700
8001970
1972
1974
1976
1978
1980
1982
1984
1986
1988
1990
1992
1994
1996
1998
2000
2002
2004
2006
2008
Durable goods
Semi-durablegoods
Services
Non-durablegoods
The different patterns of growth for the four main
groups of goods and services can be seen in Chart
C17, in volume terms. Spending on durable goods,
while erratic, has risen at the highest rate since 1970,
closely followed by semi-durable goods.
Since 1990, the growth rate of services has slowed
down after matching the growth rate of semi-durable
goods between 1970 and 1990. Non-durable goods,
which include food and drink, utilities and vehicle
fuels, have shown minor fluctuations, but overall
remained constant during this period.
13

Revisions
In common with all components of UK gross domestic product (GDP), household final consumption expenditure is subject to the revisions policy of the national accounts. This allows revisions to earlier data to be made only at particular times of the year. As well as re-referencing to 2006 prices (see guide to this publication for more details) revisions since the last edition of Consumer Trends, published in March 2010, are summarised in table 1. As well as incorporating the Annual Business Survey results for 2008 and other updated data from suppliers, data may also have been revised to include adjustments required by the GDP balancing process.
Table 1 Revisions to household final consumption expenditure Seasonally adjusted Revisions Revisions Revisions to value to growth to growth (current (current (volume prices) prices) measure) £ million % % 2005 - - - 2006 2574 0.3 0.3 2007 2427 - -0.3 2008 823 -0.2 -0.3 2009 -2320 -0.4 -0.3 2008 Q1 1256 -0.3 -0.1 2008 Q2 532 -0.3 -0.5 2008 Q3 -95 -0.3 -0.3 2008 Q4 -870 -0.3 -0.4 2009 Q1 124 0.4 - 2009 Q2 -480 -0.3 0.4 2009 Q3 -1473 -0.5 -0.3 2009 Q4 -491 0.5 0.3
14

16
0.CN Household final consumption expenditureSummar yCurrent prices - not seasonally adjusted £ million
UK NATIONAL1
UK DOMESTIC2
House-Alcohol Clothing hold Recreat- Restaur-
Net Food & & & goods & Tr ans- Communi- ion & Educat- ants & Miscell-Total tourism Total drink tobacco footwear Housing services Health por t cation culture ion hotels aneous
COICOP - - 0 01 02 03 04 05 06 07 08 09 10 11 12
ABPB ABTE ABQI ABZV ADFL ADFP ADFS ADFY ADGP ADGT ADGX ADGY ADIE ADIF ADII2005 784 140 11 959 772 181 67 138 28 853 43 532 149 309 44 475 12 183 116 186 17 939 90 130 11 050 85 473 105 9132006 819 610 11 387 808 223 69 643 29 286 45 064 160 985 45 613 13 502 119 979 18 115 93 795 11 711 87 812 112 7182007 861 695 12 209 849 486 74 133 29 787 46 327 171 959 46 806 14 130 129 780 18 471 96 742 12 356 90 729 118 2662008 892 194 13 487 878 707 80 316 30 306 47 473 186 958 46 723 14 209 132 534 18 340 99 089 12 591 91 933 118 2352009 872 914 9 613 863 301 83 439 31 131 47 600 194 245 43 836 14 259 124 814 18 686 99 083 13 024 88 563 104 621
Percentage chang e , year on previous year
2005 4.6 4.6 3.0 1.0 2.8 7.3 2.3 2.5 6.1 4.2 1.9 2.7 3.1 7.42006 4.5 4.7 3.7 1.5 3.5 7.8 2.6 10.8 3.3 1.0 4.1 6.0 2.7 6.42007 5.1 5.1 6.4 1.7 2.8 6.8 2.6 4.7 8.2 2.0 3.1 5.5 3.3 4.92008 3.5 3.4 8.3 1.7 2.5 8.7 −0.2 0.6 2.1 −0.7 2.4 1.9 1.3 −2009 −2.2 −1.8 3.9 2.7 0.3 3.9 −6.2 0.4 −5.8 1.9 − 3.4 −3.7 −11.5
Not seasonally adjusted
2007 Q1 204 820 2 354 202 466 17 616 6 941 9 691 44 672 10 826 3 420 30 704 4 553 22 939 3 017 19 903 28 184Q2 211 955 3 486 208 469 18 422 7 274 11 169 41 035 11 577 3 493 32 226 4 467 23 881 3 087 23 201 28 637Q3 217 466 4 842 212 624 17 975 7 367 11 271 40 358 11 557 3 488 36 037 4 536 23 262 3 115 24 472 29 186Q4 227 454 1 527 225 927 20 120 8 205 14 196 45 894 12 846 3 729 30 813 4 915 26 660 3 137 23 153 32 259
2008 Q1 215 829 2 995 212 834 19 072 6 785 9 983 46 546 11 281 3 597 34 455 4 583 23 332 3 163 20 407 29 630Q2 220 254 3 405 216 849 20 159 7 465 11 332 43 856 11 518 3 611 33 958 4 523 24 207 3 141 23 464 29 615Q3 225 323 5 533 219 790 19 693 7 508 11 562 44 114 11 492 3 480 36 155 4 467 24 124 3 176 25 043 28 976Q4 230 788 1 554 229 234 21 392 8 548 14 596 52 442 12 432 3 521 27 966 4 767 27 426 3 111 23 019 30 014
2009 Q1 211 363 2 239 209 124 20 234 7 161 10 118 52 400 10 441 3 509 28 707 4 548 23 394 3 210 19 674 25 728Q2 212 783 2 598 210 185 21 098 7 665 11 286 46 225 10 628 3 613 30 819 4 633 24 244 3 238 22 278 24 458Q3 218 088 3 931 214 157 20 140 7 682 11 431 44 963 10 759 3 532 34 635 4 568 23 694 3 272 24 029 25 452Q4 230 680 845 229 835 21 967 8 623 14 765 50 657 12 008 3 605 30 653 4 937 27 751 3 304 22 582 28 983
2010 Q1 218 580 1 688 216 892 20 883 7 550 10 851 54 306 10 799 3 464 32 232 4 722 23 344 3 336 19 681 25 724
Percentage chang e , quar ter on corresponding quarter of previous year
2007 Q1 5.4 5.5 5.5 2.9 3.1 9.3 −0.2 7.6 5.2 −0.4 6.1 6.8 4.9 4.2Q2 5.0 5.0 6.5 0.2 4.4 6.5 2.5 5.0 7.7 0.2 2.7 6.7 4.7 4.3Q3 5.1 4.9 5.1 1.2 4.3 5.6 4.2 4.1 8.1 3.5 2.3 4.4 1.7 7.0Q4 5.0 5.0 8.5 2.6 0.3 5.8 3.7 2.2 11.8 4.6 1.8 4.3 2.4 4.2
2008 Q1 5.4 5.1 8.3 −2.2 3.0 4.2 4.2 5.2 12.2 0.7 1.7 4.8 2.5 5.1Q2 3.9 4.0 9.4 2.6 1.5 6.9 −0.5 3.4 5.4 1.3 1.4 1.7 1.1 3.4Q3 3.6 3.4 9.6 1.9 2.6 9.3 −0.6 −0.2 0.3 −1.5 3.7 2.0 2.3 −0.7Q4 1.5 1.5 6.3 4.2 2.8 14.3 −3.2 −5.6 −9.2 −3.0 2.9 −0.8 −0.6 −7.0
2009 Q1 −2.1 −1.7 6.1 5.5 1.4 12.6 −7.4 −2.4 −16.7 −0.8 0.3 1.5 −3.6 −13.2Q2 −3.4 −3.1 4.7 2.7 −0.4 5.4 −7.7 0.1 −9.2 2.4 0.2 3.1 −5.1 −17.4Q3 −3.2 −2.6 2.3 2.3 −1.1 1.9 −6.4 1.5 −4.2 2.3 −1.8 3.0 −4.0 −12.2Q4 − 0.3 2.7 0.9 1.2 −3.4 −3.4 2.4 9.6 3.6 1.2 6.2 −1.9 −3.4
2010 Q1 3.4 3.7 3.2 5.4 7.2 3.6 3.4 −1.3 12.3 3.8 −0.2 3.9 − −
1 Final consumption expenditure by UK households in the UK & abroad2 Final consumption expenditure in the UK by UK & foreign households

17
0.CS Household final consumption expenditureSummar yCurrent prices - seasonally adjusted £ million
UK NATIONAL1
UK DOMESTIC2
House-Alcohol Clothing hold Recreat- Restaur-
Net Food & & & goods & Tr ans- Communi- ion & Educat- ants & Miscell-Total tourism Total drink tobacco footwear Housing services Health por t cation culture ion hotels aneous
COICOP - - 0 01 02 03 04 05 06 07 08 09 10 11 12
ABJQ ABTF ZAKV ZWUM ZAKX ZAKZ ZAVN ZAVV ZAWB ZAWL ZAWV ZAWZ ZWUS ZAXR ZAYF2005 784 140 11 959 772 181 67 138 28 853 43 532 149 309 44 475 12 183 116 186 17 939 90 130 11 050 85 473 105 9132006 819 610 11 387 808 223 69 643 29 286 45 064 160 985 45 613 13 502 119 979 18 115 93 795 11 711 87 812 112 7182007 861 695 12 209 849 486 74 133 29 787 46 327 171 959 46 806 14 130 129 780 18 471 96 742 12 356 90 729 118 2662008 892 194 13 487 878 707 80 316 30 306 47 473 186 958 46 723 14 209 132 534 18 340 99 089 12 591 91 933 118 2352009 872 914 9 613 863 301 83 439 31 131 47 600 194 245 43 836 14 259 124 814 18 686 99 083 13 024 88 563 104 621
Percentage chang e , year on previous year
2005 4.6 4.6 3.0 1.0 2.8 7.3 2.3 2.5 6.1 4.2 1.9 2.7 3.1 7.42006 4.5 4.7 3.7 1.5 3.5 7.8 2.6 10.8 3.3 1.0 4.1 6.0 2.7 6.42007 5.1 5.1 6.4 1.7 2.8 6.8 2.6 4.7 8.2 2.0 3.1 5.5 3.3 4.92008 3.5 3.4 8.3 1.7 2.5 8.7 −0.2 0.6 2.1 −0.7 2.4 1.9 1.3 −2009 −2.2 −1.8 3.9 2.7 0.3 3.9 −6.2 0.4 −5.8 1.9 − 3.4 −3.7 −11.5
Seasonally adjusted
2007 Q1 211 190 2 728 208 462 17 990 7 491 11 344 42 245 11 411 3 473 31 220 4 588 24 165 3 017 22 508 29 010Q2 214 762 3 270 211 492 18 269 7 378 11 707 42 484 11 827 3 507 32 195 4 542 24 239 3 087 22 888 29 369Q3 216 318 3 012 213 306 18 609 7 454 11 735 43 237 11 790 3 532 32 366 4 638 24 277 3 115 22 559 29 994Q4 219 425 3 199 216 226 19 265 7 464 11 541 43 993 11 778 3 618 33 999 4 703 24 061 3 137 22 774 29 893
2008 Q1 223 065 3 754 219 311 19 495 7 319 11 676 44 020 11 923 3 655 35 397 4 627 24 597 3 163 23 096 30 343Q2 223 348 3 129 220 219 19 922 7 608 11 885 45 658 11 776 3 616 33 950 4 595 24 568 3 141 23 159 30 341Q3 224 803 3 502 221 301 20 342 7 622 11 986 47 940 11 651 3 516 32 453 4 571 25 235 3 176 22 954 29 855Q4 220 978 3 102 217 876 20 557 7 757 11 926 49 340 11 373 3 422 30 734 4 547 24 689 3 111 22 724 27 696
2009 Q1 217 439 2 670 214 769 20 750 7 741 11 861 48 915 10 963 3 552 29 601 4 592 24 716 3 210 22 298 26 570Q2 216 161 2 446 213 715 20 822 7 794 11 844 48 265 10 844 3 613 30 797 4 701 24 653 3 238 21 982 25 162Q3 217 821 2 311 215 510 20 735 7 786 11 867 48 396 10 959 3 580 31 057 4 678 24 803 3 272 22 018 26 359Q4 221 493 2 186 219 307 21 132 7 810 12 028 48 669 11 070 3 514 33 359 4 715 24 911 3 304 22 265 26 530
2010 Q1 224 997 1 995 223 002 21 444 8 167 12 619 51 032 11 182 3 509 33 365 4 783 24 667 3 336 22 330 26 568
Percentage chang e , quar ter on previous quarter
2007 Q1 1.2 1.4 1.5 2.9 −0.9 1.3 1.0 −1.6 3.0 1.9 2.1 0.3 1.2 0.4Q2 1.7 1.5 1.6 −1.5 3.2 0.6 3.6 1.0 3.1 −1.0 0.3 2.3 1.7 1.2Q3 0.7 0.9 1.9 1.0 0.2 1.8 −0.3 0.7 0.5 2.1 0.2 0.9 −1.4 2.1Q4 1.4 1.4 3.5 0.1 −1.7 1.7 −0.1 2.4 5.0 1.4 −0.9 0.7 1.0 −0.3
2008 Q1 1.7 1.4 1.2 −1.9 1.2 0.1 1.2 1.0 4.1 −1.6 2.2 0.8 1.4 1.5Q2 0.1 0.4 2.2 3.9 1.8 3.7 −1.2 −1.1 −4.1 −0.7 −0.1 −0.7 0.3 −Q3 0.7 0.5 2.1 0.2 0.8 5.0 −1.1 −2.8 −4.4 −0.5 2.7 1.1 −0.9 −1.6Q4 −1.7 −1.5 1.1 1.8 −0.5 2.9 −2.4 −2.7 −5.3 −0.5 −2.2 −2.0 −1.0 −7.2
2009 Q1 −1.6 −1.4 0.9 −0.2 −0.5 −0.9 −3.6 3.8 −3.7 1.0 0.1 3.2 −1.9 −4.1Q2 −0.6 −0.5 0.3 0.7 −0.1 −1.3 −1.1 1.7 4.0 2.4 −0.3 0.9 −1.4 −5.3Q3 0.8 0.8 −0.4 −0.1 0.2 0.3 1.1 −0.9 0.8 −0.5 0.6 1.1 0.2 4.8Q4 1.7 1.8 1.9 0.3 1.4 0.6 1.0 −1.8 7.4 0.8 0.4 1.0 1.1 0.6
2010 Q1 1.6 1.7 1.5 4.6 4.9 4.9 1.0 −0.1 − 1.4 −1.0 1.0 0.3 0.1
Percentage chang e , quar ter on corresponding quarter of previous year
2007 Q1 5.4 5.5 5.8 3.1 2.6 9.5 0.1 7.4 5.5 −0.2 6.2 6.8 5.3 4.0Q2 5.2 5.1 6.1 0.1 4.4 6.9 3.3 4.6 7.1 0.3 2.7 6.7 4.7 5.1Q3 4.8 4.7 5.2 1.2 3.4 5.5 2.8 4.3 7.8 3.4 2.2 4.4 1.0 7.2Q4 5.2 5.2 8.7 2.6 0.8 5.5 4.3 2.6 12.2 4.5 1.7 4.3 2.4 3.5
2008 Q1 5.6 5.2 8.4 −2.3 2.9 4.2 4.5 5.2 13.4 0.9 1.8 4.8 2.6 4.6Q2 4.0 4.1 9.0 3.1 1.5 7.5 −0.4 3.1 5.5 1.2 1.4 1.7 1.2 3.3Q3 3.9 3.7 9.3 2.3 2.1 10.9 −1.2 −0.5 0.3 −1.4 3.9 2.0 1.8 −0.5Q4 0.7 0.8 6.7 3.9 3.3 12.2 −3.4 −5.4 −9.6 −3.3 2.6 −0.8 −0.2 −7.3
2009 Q1 −2.5 −2.1 6.4 5.8 1.6 11.1 −8.1 −2.8 −16.4 −0.8 0.5 1.5 −3.5 −12.4Q2 −3.2 −3.0 4.5 2.4 −0.3 5.7 −7.9 −0.1 −9.3 2.3 0.3 3.1 −5.1 −17.1Q3 −3.1 −2.6 1.9 2.2 −1.0 1.0 −5.9 1.8 −4.3 2.3 −1.7 3.0 −4.1 −11.7Q4 0.2 0.7 2.8 0.7 0.9 −1.4 −2.7 2.7 8.5 3.7 0.9 6.2 −2.0 −4.2
2010 Q1 3.5 3.8 3.3 5.5 6.4 4.3 2.0 −1.2 12.7 4.2 −0.2 3.9 0.1 −
1 Final consumption expenditure by UK households in the UK & abroad2 Final consumption expenditure in the UK by UK & foreign households

18
0.KN Household final consumption expenditureSummar yChained volume measures, reference year 2006 - not seasonally adjusted £ million
UK NATIONAL1
UK DOMESTIC2
House-Alcohol Clothing hold Recreat- Restaur-
Net Food & & & goods & Tr ans- Communi- ion & Educat- ants & Miscell-Total tourism Total drink tobacco footwear Housing services Health por t cation culture ion hotels aneous
COICOP - - 0 01 02 03 04 05 06 07 08 09 10 11 12
ABPF ABTG ABQJ ADIP ADIS ADIW ADIZ ADJF ADJM ADJQ ADJU ADJV ADMJ ADMK ADMN2005 805 273 12 000 793 253 68 714 29 271 43 163 159 671 44 911 12 342 118 335 17 853 88 977 11 670 88 686 109 8772006 819 610 11 387 808 223 69 643 29 286 45 064 160 985 45 613 13 502 119 979 18 115 93 795 11 711 87 812 112 7182007 837 417 12 900 824 517 70 865 29 097 46 727 160 351 45 586 13 832 126 870 19 246 98 241 11 502 87 577 114 6232008 842 174 12 961 829 213 70 563 28 798 49 763 162 596 44 164 13 715 123 973 19 727 104 415 10 971 85 249 115 2792009 813 167 4 163 809 004 69 590 27 966 52 174 161 011 39 733 13 388 117 074 20 153 106 886 10 716 80 174 110 139
Percentage chang e , year on previous year
2005 2.3 2.5 1.5 −0.2 5.2 1.5 1.7 1.7 3.7 6.8 4.4 −2.1 −0.5 3.62006 1.8 1.9 1.4 0.1 4.4 0.8 1.6 9.4 1.4 1.5 5.4 0.4 −1.0 2.62007 2.2 2.0 1.8 −0.6 3.7 −0.4 −0.1 2.4 5.7 6.2 4.7 −1.8 −0.3 1.72008 0.6 0.6 −0.4 −1.0 6.5 1.4 −3.1 −0.8 −2.3 2.5 6.3 −4.6 −2.7 0.62009 −3.4 −2.4 −1.4 −2.9 4.8 −1.0 −10.0 −2.4 −5.6 2.2 2.4 −2.3 −6.0 −4.5
Not seasonally adjusted
2007 Q1 201 165 2 744 198 421 17 160 6 808 9 912 42 004 10 716 3 369 30 721 4 650 23 033 2 869 19 504 27 675Q2 205 501 3 651 201 850 17 670 7 078 11 107 38 498 11 185 3 418 31 088 4 658 24 014 2 935 22 479 27 720Q3 211 017 4 915 206 102 17 302 7 156 11 468 37 445 11 310 3 409 35 185 4 756 23 721 2 919 23 533 27 898Q4 219 734 1 590 218 144 18 733 8 055 14 240 42 404 12 375 3 636 29 876 5 182 27 473 2 779 22 061 31 330
2008 Q1 206 683 3 041 203 642 17 565 6 811 10 394 42 192 10 897 3 497 32 725 4 882 24 081 2 801 19 247 28 550Q2 207 874 3 433 204 441 17 945 7 051 11 710 39 122 10 827 3 490 31 500 4 817 25 009 2 777 21 812 28 381Q3 211 032 5 199 205 833 16 970 7 044 12 207 38 389 10 819 3 348 33 253 4 796 25 256 2 787 23 093 27 871Q4 216 585 1 288 215 297 18 083 7 892 15 452 42 893 11 621 3 380 26 495 5 232 30 069 2 606 21 097 30 477
2009 Q1 198 033 1 084 196 949 16 853 6 540 11 246 42 726 9 726 3 336 28 204 4 958 25 149 2 686 17 975 27 550Q2 199 264 1 246 198 018 17 542 6 883 12 267 39 002 9 618 3 402 29 210 4 950 25 667 2 709 20 178 26 590Q3 202 425 1 901 200 524 16 932 6 848 12 640 37 968 9 741 3 296 31 784 4 901 25 328 2 709 21 725 26 652Q4 213 445 −68 213 513 18 263 7 695 16 021 41 315 10 648 3 354 27 876 5 344 30 742 2 612 20 296 29 347
2010 Q1 197 148 1 205 195 943 17 122 6 529 11 872 42 554 9 554 3 209 28 747 4 933 24 954 2 646 17 511 26 312
Percentage chang e , quar ter on corresponding quarter of previous year
2007 Q1 2.0 1.8 0.9 −0.8 4.0 0.2 −2.5 5.3 4.1 3.1 6.2 −0.7 1.2 0.5Q2 1.4 1.2 1.1 −2.3 4.5 −1.3 −1.2 2.2 4.0 4.7 3.5 −0.8 1.1 −Q3 2.5 2.2 1.7 −1.0 4.9 −2.6 1.9 1.8 7.3 7.7 4.7 −3.0 −1.7 3.7Q4 2.8 2.8 3.3 1.3 1.9 1.8 1.4 0.7 7.5 9.3 4.7 −2.7 −1.3 2.5
2008 Q1 2.7 2.6 2.4 − 4.9 0.4 1.7 3.8 6.5 5.0 4.5 −2.4 −1.3 3.2Q2 1.2 1.3 1.6 −0.4 5.4 1.6 −3.2 2.1 1.3 3.4 4.1 −5.4 −3.0 2.4Q3 − −0.1 −1.9 −1.6 6.4 2.5 −4.3 −1.8 −5.5 0.8 6.5 −4.5 −1.9 −0.1Q4 −1.4 −1.3 −3.5 −2.0 8.5 1.2 −6.1 −7.0 −11.3 1.0 9.4 −6.2 −4.4 −2.7
2009 Q1 −4.2 −3.3 −4.1 −4.0 8.2 1.3 −10.7 −4.6 −13.8 1.6 4.4 −4.1 −6.6 −3.5Q2 −4.1 −3.1 −2.2 −2.4 4.8 −0.3 −11.2 −2.5 −7.3 2.8 2.6 −2.4 −7.5 −6.3Q3 −4.1 −2.6 −0.2 −2.8 3.5 −1.1 −10.0 −1.6 −4.4 2.2 0.3 −2.8 −5.9 −4.4Q4 −1.4 −0.8 1.0 −2.5 3.7 −3.7 −8.4 −0.8 5.2 2.1 2.2 0.2 −3.8 −3.7
2010 Q1 −0.4 −0.5 1.6 −0.2 5.6 −0.4 −1.8 −3.8 1.9 −0.5 −0.8 −1.5 −2.6 −4.5
1 Final consumption expenditure by UK households in the UK & abroad2 Final consumption expenditure in the UK by UK & foreign households
19
0.KS Household final consumption expenditureSummar yChained volume measures, reference year 2006 - seasonally adjusted £ million
UK NATIONAL1
UK DOMESTIC2
House-Alcohol Clothing hold Recreat- Restaur-
Net Food & & & goods & Tr ans- Communi- ion & Educat- ants & Miscell-Total tourism Total drink tobacco footwear Housing services Health por t cation culture ion hotels aneous
COICOP - - 0 01 02 03 04 05 06 07 08 09 10 11 12
ABJR ABTH ZAKW ZWUN ZAKY ZALA ZAVO ZAVW ZAWC ZAWM ZAWW ZAXA ZWUT ZAXS ZAYG2005 805 273 12 000 793 253 68 714 29 271 43 163 159 671 44 911 12 342 118 335 17 853 88 977 11 670 88 686 109 8772006 819 610 11 387 808 223 69 643 29 286 45 064 160 985 45 613 13 502 119 979 18 115 93 795 11 711 87 812 112 7182007 837 417 12 900 824 517 70 865 29 097 46 727 160 351 45 586 13 832 126 870 19 246 98 241 11 502 87 577 114 6232008 842 174 12 961 829 213 70 563 28 798 49 763 162 596 44 164 13 715 123 973 19 727 104 415 10 971 85 249 115 2792009 813 167 4 163 809 004 69 590 27 966 52 174 161 011 39 733 13 388 117 074 20 153 106 886 10 716 80 174 110 139
Percentage chang e , year on previous year
2005 2.3 2.5 1.5 −0.2 5.2 1.5 1.7 1.7 3.7 6.8 4.4 −2.1 −0.5 3.62006 1.8 1.9 1.4 0.1 4.4 0.8 1.6 9.4 1.4 1.5 5.4 0.4 −1.0 2.62007 2.2 2.0 1.8 −0.6 3.7 −0.4 −0.1 2.4 5.7 6.2 4.7 −1.8 −0.3 1.72008 0.6 0.6 −0.4 −1.0 6.5 1.4 −3.1 −0.8 −2.3 2.5 6.3 −4.6 −2.7 0.62009 −3.4 −2.4 −1.4 −2.9 4.8 −1.0 −10.0 −2.4 −5.6 2.2 2.4 −2.3 −6.0 −4.5
Seasonally adjusted
2007 Q1 207 128 3 118 204 010 17 537 7 292 11 447 39 925 11 233 3 416 30 941 4 687 24 209 2 869 22 024 28 430Q2 208 687 3 466 205 221 17 555 7 235 11 708 39 832 11 478 3 435 31 008 4 758 24 533 2 935 22 217 28 527Q3 210 053 3 105 206 948 17 835 7 273 11 852 40 024 11 485 3 457 32 000 4 861 24 883 2 919 21 684 28 675Q4 211 549 3 211 208 338 17 938 7 297 11 720 40 570 11 390 3 524 32 921 4 940 24 616 2 779 21 652 28 991
2008 Q1 213 214 3 710 209 504 17 985 7 303 12 015 39 969 11 452 3 550 33 173 4 936 25 388 2 802 21 765 29 166Q2 211 525 3 256 208 269 17 759 7 209 12 385 40 628 11 128 3 497 31 471 4 929 25 730 2 777 21 543 29 213Q3 210 330 3 337 206 993 17 440 7 146 12 595 41 093 10 929 3 387 30 188 4 920 26 650 2 787 21 156 28 702Q4 207 105 2 658 204 447 17 379 7 140 12 768 40 906 10 655 3 281 29 141 4 942 26 647 2 605 20 785 28 198
2009 Q1 203 894 1 116 202 778 17 341 6 994 13 016 40 405 10 170 3 374 28 615 5 018 26 565 2 686 20 367 28 227Q2 203 052 1 134 201 918 17 315 7 051 12 955 40 382 9 870 3 404 29 211 5 064 26 573 2 709 19 927 27 457Q3 202 485 1 002 201 483 17 352 6 971 13 036 40 288 9 866 3 342 28 798 5 040 26 786 2 709 19 866 27 429Q4 203 736 911 202 825 17 582 6 950 13 167 39 936 9 827 3 268 30 450 5 031 26 962 2 612 20 014 27 026
2010 Q1 203 474 1 307 202 167 17 627 7 012 13 624 40 203 9 845 3 251 29 786 5 012 26 330 2 646 19 877 26 954
Percentage chang e , quar ter on previous quarter
2007 Q1 0.5 0.6 1.0 1.0 0.1 −1.0 0.5 −2.2 1.7 3.6 2.3 0.5 0.4 −0.1Q2 0.8 0.6 0.1 −0.8 2.3 −0.2 2.2 0.6 0.2 1.5 1.3 2.3 0.9 0.3Q3 0.7 0.8 1.6 0.5 1.2 0.5 0.1 0.6 3.2 2.2 1.4 −0.5 −2.4 0.5Q4 0.7 0.7 0.6 0.3 −1.1 1.4 −0.8 1.9 2.9 1.6 −1.1 −4.8 −0.1 1.1
2008 Q1 0.8 0.6 0.3 0.1 2.5 −1.5 0.5 0.7 0.8 −0.1 3.1 0.8 0.5 0.6Q2 −0.8 −0.6 −1.3 −1.3 3.1 1.6 −2.8 −1.5 −5.1 −0.1 1.3 −0.9 −1.0 0.2Q3 −0.6 −0.6 −1.8 −0.9 1.7 1.1 −1.8 −3.1 −4.1 −0.2 3.6 0.4 −1.8 −1.7Q4 −1.5 −1.2 −0.3 −0.1 1.4 −0.5 −2.5 −3.1 −3.5 0.4 − −6.5 −1.8 −1.8
2009 Q1 −1.6 −0.8 −0.2 −2.0 1.9 −1.2 −4.6 2.8 −1.8 1.5 −0.3 3.1 −2.0 0.1Q2 −0.4 −0.4 −0.1 0.8 −0.5 −0.1 −2.9 0.9 2.1 0.9 − 0.9 −2.2 −2.7Q3 −0.3 −0.2 0.2 −1.1 0.6 −0.2 − −1.8 −1.4 −0.5 0.8 − −0.3 −0.1Q4 0.6 0.7 1.3 −0.3 1.0 −0.9 −0.4 −2.2 5.7 −0.2 0.7 −3.6 0.7 −1.5
2010 Q1 −0.1 −0.3 0.3 0.9 3.5 0.7 0.2 −0.5 −2.2 −0.4 −2.3 1.3 −0.7 −0.3
Percentage chang e , quar ter on corresponding quarter of previous year
2007 Q1 2.1 2.0 1.2 −0.5 3.5 0.3 −2.1 5.2 4.1 3.5 6.7 −0.7 1.7 0.3Q2 1.5 1.3 0.7 −2.1 4.6 −1.0 −0.5 1.9 3.4 4.8 3.7 −0.8 1.0 0.7Q3 2.4 2.1 1.8 −1.1 4.2 −1.4 0.5 2.0 7.2 7.5 4.5 −3.0 −2.4 3.9Q4 2.6 2.7 3.3 1.1 2.5 0.6 1.9 0.9 8.3 9.2 4.0 −2.7 −1.3 1.9
2008 Q1 2.9 2.7 2.6 0.2 5.0 0.1 1.9 3.9 7.2 5.3 4.9 −2.3 −1.2 2.6Q2 1.4 1.5 1.2 −0.4 5.8 2.0 −3.0 1.8 1.5 3.6 4.9 −5.4 −3.0 2.4Q3 0.1 − −2.2 −1.7 6.3 2.7 −4.8 −2.0 −5.7 1.2 7.1 −4.5 −2.4 0.1Q4 −2.1 −1.9 −3.1 −2.2 8.9 0.8 −6.5 −6.9 −11.5 − 8.3 −6.3 −4.0 −2.7
2009 Q1 −4.4 −3.2 −3.6 −4.2 8.3 1.1 −11.2 −5.0 −13.7 1.7 4.6 −4.1 −6.4 −3.2Q2 −4.0 −3.0 −2.5 −2.2 4.6 −0.6 −11.3 −2.7 −7.2 2.7 3.3 −2.4 −7.5 −6.0Q3 −3.7 −2.7 −0.5 −2.4 3.5 −2.0 −9.7 −1.3 −4.6 2.4 0.5 −2.8 −6.1 −4.4Q4 −1.6 −0.8 1.2 −2.7 3.1 −2.4 −7.8 −0.4 4.5 1.8 1.2 0.3 −3.7 −4.2
2010 Q1 −0.2 −0.3 1.6 0.3 4.7 −0.5 −3.2 −3.6 4.1 −0.1 −0.9 −1.5 −2.4 −4.5
1 Final consumption expenditure by UK households in the UK & abroad2 Final consumption expenditure in the UK by UK & foreign households

20
0.DN Household final consumption expenditureSummar yImplied deflators - not seasonally adjusted 2006 = 100
UK NATIONAL1
UK DOMESTIC2
House-Alcohol Clothing hold Recreat- Restaur-
Net Food & & & goods & Tr ans- Communi- ion & Educat- ants & Miscell-Total tourism Total drink tobacco footwear Housing services Health por t cation culture ion hotels aneous
COICOP - - 0 01 02 03 04 05 06 07 08 09 10 11 12
ABQU UTJA UTJB UTJC UTJD UTJE UTJF UTJG UTJH UTJI UTJJ UTJK UTJL UTJM2005 97.4 97.3 97.7 98.6 100.9 93.5 99.0 98.7 98.2 100.5 101.3 94.7 96.4 96.42006 100.0 100.0 100.0 100.0 100.0 100.0 100.0 100.0 100.0 100.0 100.0 100.0 100.0 100.02007 102.9 103.0 104.6 102.4 99.1 107.2 102.7 102.2 102.3 96.0 98.5 107.4 103.6 103.22008 105.9 106.0 113.8 105.2 95.4 115.0 105.8 103.6 106.9 93.0 94.9 114.8 107.8 102.62009 107.3 106.7 119.9 111.3 91.2 120.6 110.3 106.5 106.6 92.7 92.7 121.5 110.5 95.0
Percentage chang e , year on previous year
2005 2.3 2.1 1.5 1.2 −2.2 5.6 0.5 0.8 2.4 −2.4 −2.3 4.9 3.7 3.82006 2.7 2.8 2.4 1.4 −0.9 7.0 1.0 1.3 1.8 −0.5 −1.3 5.6 3.7 3.72007 2.9 3.0 4.6 2.4 −0.9 7.2 2.7 2.2 2.3 −4.0 −1.5 7.4 3.6 3.22008 2.9 2.9 8.8 2.7 −3.7 7.3 3.0 1.4 4.5 −3.1 −3.7 6.9 4.1 −0.62009 1.3 0.7 5.4 5.8 −4.4 4.9 4.3 2.8 −0.3 −0.3 −2.3 5.8 2.5 −7.4
Not seasonally adjusted
2007 Q1 101.8 102.0 102.7 102.0 97.8 106.4 101.0 101.5 99.9 97.9 99.6 105.2 102.0 101.8Q2 103.1 103.3 104.3 102.8 100.6 106.6 103.5 102.2 103.7 95.9 99.4 105.2 103.2 103.3Q3 103.1 103.2 103.9 102.9 98.3 107.8 102.2 102.3 102.4 95.4 98.1 106.7 104.0 104.6Q4 103.5 103.6 107.4 101.9 99.7 108.2 103.8 102.6 103.1 94.8 97.0 112.9 104.9 103.0
2008 Q1 104.4 104.5 108.6 99.6 96.0 110.3 103.5 102.9 105.3 93.9 96.9 112.9 106.0 103.8Q2 106.0 106.1 112.3 105.9 96.8 112.1 106.4 103.5 107.8 93.9 96.8 113.1 107.6 104.3Q3 106.8 106.8 116.0 106.6 94.7 114.9 106.2 103.9 108.7 93.1 95.5 114.0 108.4 104.0Q4 106.6 106.5 118.3 108.3 94.5 122.3 107.0 104.2 105.6 91.1 91.2 119.4 109.1 98.5
2009 Q1 106.7 106.2 120.1 109.5 90.0 122.6 107.4 105.2 101.8 91.7 93.0 119.5 109.5 93.4Q2 106.8 106.1 120.3 111.4 92.0 118.5 110.5 106.2 105.5 93.6 94.5 119.5 110.4 92.0Q3 107.7 106.8 118.9 112.2 90.4 118.4 110.5 107.2 109.0 93.2 93.5 120.8 110.6 95.5Q4 108.1 107.6 120.3 112.1 92.2 122.6 112.8 107.5 110.0 92.4 90.3 126.5 111.3 98.8
2010 Q1 110.9 110.7 122.0 115.6 91.4 127.6 113.0 107.9 112.1 95.7 93.5 126.1 112.4 97.8
Percentage chang e , quar ter on corresponding quarter of previous year
2007 Q1 3.4 3.6 4.6 3.8 −0.9 9.1 2.3 2.2 1.0 −3.5 −0.1 7.6 3.6 3.7Q2 3.5 3.8 5.4 2.6 −0.1 7.9 3.8 2.7 3.6 −4.3 −0.9 7.6 3.5 4.3Q3 2.6 2.8 3.4 2.1 −0.6 8.5 2.2 2.2 0.8 −3.8 −2.2 7.6 3.6 3.2Q4 2.2 2.2 5.1 1.3 −1.6 3.8 2.3 1.6 4.0 −4.4 −2.7 7.2 3.7 1.8
2008 Q1 2.6 2.5 5.7 −2.4 −1.8 3.7 2.5 1.4 5.4 −4.1 −2.7 7.3 3.9 2.0Q2 2.8 2.7 7.7 3.0 −3.8 5.2 2.8 1.3 4.0 −2.1 −2.6 7.5 4.3 1.0Q3 3.6 3.5 11.6 3.6 −3.7 6.6 3.9 1.6 6.2 −2.4 −2.7 6.8 4.2 −0.6Q4 3.0 2.8 10.1 6.3 −5.2 13.0 3.1 1.6 2.4 −3.9 −6.0 5.8 4.0 −4.4
2009 Q1 2.2 1.6 10.6 9.9 −6.2 11.2 3.8 2.2 −3.3 −2.3 −4.0 5.8 3.3 −10.0Q2 0.8 − 7.1 5.2 −5.0 5.7 3.9 2.6 −2.1 −0.3 −2.4 5.7 2.6 −11.8Q3 0.8 − 2.5 5.3 −4.5 3.0 4.0 3.2 0.3 0.1 −2.1 6.0 2.0 −8.2Q4 1.4 1.0 1.7 3.5 −2.4 0.2 5.4 3.2 4.2 1.4 −1.0 5.9 2.0 0.3
2010 Q1 3.9 4.2 1.6 5.6 1.6 4.1 5.2 2.6 10.1 4.4 0.5 5.5 2.6 4.7
1 Final consumption expenditure by UK households in the UK & abroad2 Final consumption expenditure in the UK by UK & foreign households

21
0.DS Household final consumption expenditureSummar yImplied deflators - seasonally adjusted 2006 = 100
UK NATIONAL1
UK DOMESTIC2
House-Alcohol Clothing hold Recreat- Restaur-
Net Food & & & goods & Tr ans- Communi- ion & Educat- ants & Miscell-Total tourism Total drink tobacco footwear Housing services Health por t cation culture ion hotels aneous
COICOP - - 0 01 02 03 04 05 06 07 08 09 10 11 12
ABJS UTJN UTJO UTJP UTJQ UTJR UTJS UTJT UTJU UTJV UTJW UTJX UTJY UTJZ2005 97.4 97.3 97.7 98.6 100.9 93.5 99.0 98.7 98.2 100.5 101.3 94.7 96.4 96.42006 100.0 100.0 100.0 100.0 100.0 100.0 100.0 100.0 100.0 100.0 100.0 100.0 100.0 100.02007 102.9 103.0 104.6 102.4 99.1 107.2 102.7 102.2 102.3 96.0 98.5 107.4 103.6 103.22008 105.9 106.0 113.8 105.2 95.4 115.0 105.8 103.6 106.9 93.0 94.9 114.8 107.8 102.62009 107.3 106.7 119.9 111.3 91.2 120.6 110.3 106.5 106.6 92.7 92.7 121.5 110.5 95.0
Percentage chang e , year on previous year
2005 2.3 2.1 1.5 1.2 −2.2 5.6 0.5 0.8 2.4 −2.4 −2.3 4.9 3.7 3.82006 2.7 2.8 2.4 1.4 −0.9 7.0 1.0 1.3 1.8 −0.5 −1.3 5.6 3.7 3.72007 2.9 3.0 4.6 2.4 −0.9 7.2 2.7 2.2 2.3 −4.0 −1.5 7.4 3.6 3.22008 2.9 2.9 8.8 2.7 −3.7 7.3 3.0 1.4 4.5 −3.1 −3.7 6.9 4.1 −0.62009 1.3 0.7 5.4 5.8 −4.4 4.9 4.3 2.8 −0.3 −0.3 −2.3 5.8 2.5 −7.4
Seasonally adjusted
2007 Q1 102.0 102.2 102.6 102.7 99.1 105.8 101.6 101.7 100.9 97.9 99.8 105.2 102.2 102.0Q2 102.9 103.1 104.1 102.0 100.0 106.7 103.0 102.1 103.8 95.5 98.8 105.2 103.0 103.0Q3 103.0 103.1 104.3 102.5 99.0 108.0 102.7 102.2 101.1 95.4 97.6 106.7 104.0 104.6Q4 103.7 103.8 107.4 102.3 98.5 108.4 103.4 102.7 103.3 95.2 97.7 112.9 105.2 103.1
2008 Q1 104.6 104.7 108.4 100.2 97.2 110.1 104.1 103.0 106.7 93.7 96.9 112.9 106.1 104.0Q2 105.6 105.7 112.2 105.5 96.0 112.4 105.8 103.4 107.9 93.2 95.5 113.1 107.5 103.9Q3 106.9 106.9 116.6 106.7 95.2 116.7 106.6 103.8 107.5 92.9 94.7 114.0 108.5 104.0Q4 106.7 106.6 118.3 108.6 93.4 120.6 106.7 104.3 105.5 92.0 92.7 119.4 109.3 98.2
2009 Q1 106.6 105.9 119.7 110.7 91.1 121.1 107.8 105.3 103.4 91.5 93.0 119.5 109.5 94.1Q2 106.5 105.8 120.3 110.5 91.4 119.5 109.9 106.1 105.4 92.8 92.8 119.5 110.3 91.6Q3 107.6 107.0 119.5 111.7 91.0 120.1 111.1 107.1 107.8 92.8 92.6 120.8 110.8 96.1Q4 108.7 108.1 120.2 112.4 91.3 121.9 112.6 107.5 109.6 93.7 92.4 126.5 111.2 98.2
2010 Q1 110.6 110.3 121.7 116.5 92.6 126.9 113.6 107.9 112.0 95.4 93.7 126.1 112.3 98.6
Percentage chang e , quar ter on previous quarter
2007 Q1 0.8 0.9 0.5 1.9 −1.0 2.4 0.6 0.7 1.2 −1.6 −0.2 −0.1 0.8 0.5Q2 0.9 0.9 1.5 −0.7 0.9 0.9 1.4 0.4 2.9 −2.5 −1.0 − 0.8 1.0Q3 0.1 − 0.2 0.5 −1.0 1.2 −0.3 0.1 −2.6 −0.1 −1.2 1.4 1.0 1.6Q4 0.7 0.7 3.0 −0.2 −0.5 0.4 0.7 0.5 2.2 −0.2 0.1 5.8 1.2 −1.4
2008 Q1 0.9 0.9 0.9 −2.1 −1.3 1.6 0.7 0.3 3.3 −1.6 −0.8 − 0.9 0.9Q2 1.0 1.0 3.5 5.3 −1.2 2.1 1.6 0.4 1.1 −0.5 −1.4 0.2 1.3 −0.1Q3 1.2 1.1 3.9 1.1 −0.8 3.8 0.8 0.4 −0.4 −0.3 −0.8 0.8 0.9 0.1Q4 −0.2 −0.3 1.5 1.8 −1.9 3.3 0.1 0.5 −1.9 −1.0 −2.1 4.7 0.7 −5.6
2009 Q1 −0.1 −0.7 1.2 1.9 −2.5 0.4 1.0 1.0 −2.0 −0.5 0.3 0.1 0.2 −4.2Q2 −0.1 −0.1 0.5 −0.2 0.3 −1.3 1.9 0.8 1.9 1.4 −0.2 − 0.7 −2.7Q3 1.0 1.1 −0.7 1.1 −0.4 0.5 1.1 0.9 2.3 − −0.2 1.1 0.5 4.9Q4 1.0 1.0 0.6 0.6 0.3 1.5 1.4 0.4 1.7 1.0 −0.2 4.7 0.4 2.2
2010 Q1 1.7 2.0 1.2 3.6 1.4 4.1 0.9 0.4 2.2 1.8 1.4 −0.3 1.0 0.4
Percentage chang e , quar ter on corresponding quarter of previous year
2007 Q1 3.2 3.4 4.5 3.5 −0.9 9.2 2.2 2.2 1.3 −3.6 −0.6 7.6 3.5 3.7Q2 3.5 3.8 5.5 2.2 −0.2 8.0 3.8 2.6 3.6 −4.3 −1.0 7.6 3.6 4.4Q3 2.4 2.5 3.3 2.3 −0.8 6.9 2.3 2.3 0.6 −3.8 −2.2 7.6 3.5 3.2Q4 2.5 2.5 5.2 1.5 −1.6 4.9 2.4 1.7 3.6 −4.3 −2.3 7.2 3.7 1.6
2008 Q1 2.5 2.4 5.7 −2.4 −1.9 4.1 2.5 1.3 5.7 −4.3 −2.9 7.3 3.8 2.0Q2 2.6 2.5 7.8 3.4 −4.0 5.3 2.7 1.3 3.9 −2.4 −3.3 7.5 4.4 0.9Q3 3.8 3.7 11.8 4.1 −3.8 8.1 3.8 1.6 6.3 −2.6 −3.0 6.8 4.3 −0.6Q4 2.9 2.7 10.1 6.2 −5.2 11.3 3.2 1.6 2.1 −3.4 −5.1 5.8 3.9 −4.8
2009 Q1 1.9 1.1 10.4 10.5 −6.3 10.0 3.6 2.2 −3.1 −2.3 −4.0 5.8 3.2 −9.5Q2 0.9 0.1 7.2 4.7 −4.8 6.3 3.9 2.6 −2.3 −0.4 −2.8 5.7 2.6 −11.8Q3 0.7 0.1 2.5 4.7 −4.4 2.9 4.2 3.2 0.3 −0.1 −2.2 6.0 2.1 −7.6Q4 1.9 1.4 1.6 3.5 −2.2 1.1 5.5 3.1 3.9 1.8 −0.3 5.9 1.7 −
2010 Q1 3.8 4.2 1.7 5.2 1.6 4.8 5.4 2.5 8.3 4.3 0.8 5.5 2.6 4.8
1 Final consumption expenditure by UK households in the UK & abroad2 Final consumption expenditure in the UK by UK & foreign households
22
01.CN Household final consumption expenditureFood and non-alcoholic beveragesCurrent prices - not seasonally adjusted £ million
Food and non-alcoholic beverages
Food Non-alcoholic beverages
MineralMilk, Sugar & Food Coffee, water &
Bread and cheese & Oils and Vegetabl- sweet products tea and softTotal Total cereals Meat Fish eggs fats Fruit es products n.e.c. Total cocoa dr inks
COICOP 01 01.1 01.1.1 01.1.2 01.1.3 01.1.4 01.1.5 01.1.6 01.1.7 01.1.8 01.1.9 01.2 01.2.1 01.2.2
ABZV ABZW ADST CDCJ CDCK CDCL CDCM CDCN ADSZ ADTD ADTH ADFK CDCU CDCV2005 67 138 58 822 9 826 13 757 2 468 8 293 1 232 5 462 8 891 7 180 1 713 8 316 2 101 6 2152006 69 643 60 856 10 240 14 006 2 750 8 667 1 310 5 800 9 193 7 134 1 756 8 787 2 119 6 6682007 74 133 65 080 10 889 14 773 2 981 9 451 1 384 6 011 10 089 7 559 1 943 9 053 2 271 6 7822008 80 316 70 973 11 734 15 990 3 144 10 450 1 540 6 658 11 066 8 140 2 251 9 343 2 381 6 9622009 83 439 73 435 11 915 16 215 3 059 10 965 1 500 7 542 11 417 8 633 2 189 10 004 2 676 7 328
Percentage chang e , year on previous year
2005 3.0 3.1 2.7 1.1 6.4 5.0 3.7 9.5 3.2 −0.2 1.9 2.7 0.8 3.42006 3.7 3.5 4.2 1.8 11.4 4.5 6.3 6.2 3.4 −0.6 2.5 5.7 0.9 7.32007 6.4 6.9 6.3 5.5 8.4 9.0 5.6 3.6 9.7 6.0 10.6 3.0 7.2 1.72008 8.3 9.1 7.8 8.2 5.5 10.6 11.3 10.8 9.7 7.7 15.9 3.2 4.8 2.72009 3.9 3.5 1.5 1.4 −2.7 4.9 −2.6 13.3 3.2 6.1 −2.8 7.1 12.4 5.3
Not seasonally adjusted
2007 Q1 17 616 15 486 2 574 3 495 722 2 258 331 1 397 2 437 1 812 460 2 130 555 1 575Q2 18 422 16 054 2 660 3 498 842 2 274 317 1 624 2 661 1 712 466 2 368 566 1 802Q3 17 975 15 632 2 698 3 549 709 2 305 319 1 531 2 435 1 618 468 2 343 553 1 790Q4 20 120 17 908 2 957 4 231 708 2 614 417 1 459 2 556 2 417 549 2 212 597 1 615
2008 Q1 19 072 16 886 2 911 3 919 734 2 466 370 1 439 2 569 1 967 511 2 186 569 1 617Q2 20 159 17 779 2 932 3 945 903 2 592 390 1 719 2 907 1 842 549 2 380 559 1 821Q3 19 693 17 265 2 850 3 947 768 2 557 373 1 705 2 746 1 718 601 2 428 601 1 827Q4 21 392 19 043 3 041 4 179 739 2 835 407 1 795 2 844 2 613 590 2 349 652 1 697
2009 Q1 20 234 17 909 2 886 3 928 730 2 735 371 1 784 2 882 2 042 551 2 325 660 1 665Q2 21 098 18 531 2 952 3 984 842 2 765 367 2 080 3 043 1 965 533 2 567 638 1 929Q3 20 140 17 573 2 927 3 908 764 2 657 355 1 848 2 725 1 868 521 2 567 655 1 912Q4 21 967 19 422 3 150 4 395 723 2 808 407 1 830 2 767 2 758 584 2 545 723 1 822
2010 Q1 20 883 18 388 2 985 4 165 758 2 710 403 1 834 2 834 2 191 508 2 495 714 1 781
Percentage chang e , quar ter on corresponding quarter of previous year
2007 Q1 5.5 5.1 2.4 2.6 13.2 3.5 2.2 1.0 9.8 11.7 4.3 8.1 9.3 7.7Q2 6.5 6.5 5.5 3.6 15.0 8.8 −1.6 4.2 11.3 3.2 10.4 6.3 11.6 4.7Q3 5.1 6.1 7.5 4.1 5.2 7.5 1.3 2.8 8.1 6.6 12.2 −1.4 2.0 −2.4Q4 8.5 9.7 9.7 10.9 0.3 16.2 19.5 6.6 9.7 3.5 15.3 − 6.2 −2.1
2008 Q1 8.3 9.0 13.1 12.1 1.7 9.2 11.8 3.0 5.4 8.6 11.1 2.6 2.5 2.7Q2 9.4 10.7 10.2 12.8 7.2 14.0 23.0 5.8 9.2 7.6 17.8 0.5 −1.2 1.1Q3 9.6 10.4 5.6 11.2 8.3 10.9 16.9 11.4 12.8 6.2 28.4 3.6 8.7 2.1Q4 6.3 6.3 2.8 −1.2 4.4 8.5 −2.4 23.0 11.3 8.1 7.5 6.2 9.2 5.1
2009 Q1 6.1 6.1 −0.9 0.2 −0.5 10.9 0.3 24.0 12.2 3.8 7.8 6.4 16.0 3.0Q2 4.7 4.2 0.7 1.0 −6.8 6.7 −5.9 21.0 4.7 6.7 −2.9 7.9 14.1 5.9Q3 2.3 1.8 2.7 −1.0 −0.5 3.9 −4.8 8.4 −0.8 8.7 −13.3 5.7 9.0 4.7Q4 2.7 2.0 3.6 5.2 −2.2 −1.0 − 1.9 −2.7 5.5 −1.0 8.3 10.9 7.4
2010 Q1 3.2 2.7 3.4 6.0 3.8 −0.9 8.6 2.8 −1.7 7.3 −7.8 7.3 8.2 7.0

23
01.CS Household final consumption expenditureFood and non-alcoholic beveragesCurrent prices - seasonally adjusted £ million
Food and non-alcoholic beverages
Food Non-alcoholic beverages
MineralMilk, Sugar & Food Coffee, water &
Bread and cheese & Oils and Vegetabl- sweet products tea and softTotal Total cereals Meat Fish eggs fats Fruit es products n.e.c. Total cocoa dr inks
COICOP 01 01.1 01.1.1 01.1.2 01.1.3 01.1.4 01.1.5 01.1.6 01.1.7 01.1.8 01.1.9 01.2 01.2.1 01.2.2
ZWUM UVAE UVAF CCRL CCRM CCRN CCRO CCRP UVDX UVER UVFB UVFC CCWH CCRW2005 67 138 58 822 9 826 13 757 2 468 8 293 1 232 5 462 8 891 7 180 1 713 8 316 2 101 6 2152006 69 643 60 856 10 240 14 006 2 750 8 667 1 310 5 800 9 193 7 134 1 756 8 787 2 119 6 6682007 74 133 65 080 10 889 14 773 2 981 9 451 1 384 6 011 10 089 7 559 1 943 9 053 2 271 6 7822008 80 316 70 973 11 734 15 990 3 144 10 450 1 540 6 658 11 066 8 140 2 251 9 343 2 381 6 9622009 83 439 73 435 11 915 16 215 3 059 10 965 1 500 7 542 11 417 8 633 2 189 10 004 2 676 7 328
Percentage chang e , year on previous year
2005 3.0 3.1 2.7 1.1 6.4 5.0 3.7 9.5 3.2 −0.2 1.9 2.7 0.8 3.42006 3.7 3.5 4.2 1.8 11.4 4.5 6.3 6.2 3.4 −0.6 2.5 5.7 0.9 7.32007 6.4 6.9 6.3 5.5 8.4 9.0 5.6 3.6 9.7 6.0 10.6 3.0 7.2 1.72008 8.3 9.1 7.8 8.2 5.5 10.6 11.3 10.8 9.7 7.7 15.9 3.2 4.8 2.72009 3.9 3.5 1.5 1.4 −2.7 4.9 −2.6 13.3 3.2 6.1 −2.8 7.1 12.4 5.3
Seasonally adjusted
2007 Q1 17 990 15 753 2 605 3 568 739 2 244 334 1 481 2 450 1 874 458 2 237 539 1 698Q2 18 269 15 977 2 680 3 556 771 2 284 325 1 479 2 502 1 894 486 2 292 592 1 700Q3 18 609 16 334 2 761 3 669 731 2 361 338 1 504 2 538 1 932 500 2 275 578 1 697Q4 19 265 17 016 2 843 3 980 740 2 562 387 1 547 2 599 1 859 499 2 249 562 1 687
2008 Q1 19 495 17 196 2 955 3 983 765 2 458 371 1 532 2 601 2 021 510 2 299 559 1 740Q2 19 922 17 628 2 948 4 007 812 2 601 400 1 541 2 723 2 026 570 2 294 583 1 711Q3 20 342 17 976 2 904 4 071 780 2 615 392 1 687 2 854 2 037 636 2 366 623 1 743Q4 20 557 18 173 2 927 3 929 787 2 776 377 1 898 2 888 2 056 535 2 384 616 1 768
2009 Q1 20 750 18 311 2 938 4 008 768 2 733 372 1 904 2 942 2 093 553 2 439 651 1 788Q2 20 822 18 345 2 967 4 049 760 2 768 376 1 883 2 861 2 129 552 2 477 663 1 814Q3 20 735 18 216 2 986 4 018 762 2 713 369 1 833 2 815 2 171 549 2 519 678 1 841Q4 21 132 18 563 3 024 4 140 769 2 751 383 1 922 2 799 2 240 535 2 569 684 1 885
2010 Q1 21 444 18 830 3 051 4 253 808 2 718 404 1 945 2 902 2 235 514 2 614 706 1 908
Percentage chang e , quar ter on previous quarter
2007 Q1 1.5 1.8 0.4 −0.6 0.8 1.4 3.4 3.0 3.1 5.5 6.3 −0.8 1.5 −1.6Q2 1.6 1.4 2.9 −0.3 4.3 1.8 −2.7 −0.1 2.1 1.1 6.1 2.5 9.8 0.1Q3 1.9 2.2 3.0 3.2 −5.2 3.4 4.0 1.7 1.4 2.0 2.9 −0.7 −2.4 −0.2Q4 3.5 4.2 3.0 8.5 1.2 8.5 14.5 2.9 2.4 −3.8 −0.2 −1.1 −2.8 −0.6
2008 Q1 1.2 1.1 3.9 0.1 3.4 −4.1 −4.1 −1.0 0.1 8.7 2.2 2.2 −0.5 3.1Q2 2.2 2.5 −0.2 0.6 6.1 5.8 7.8 0.6 4.7 0.2 11.8 −0.2 4.3 −1.7Q3 2.1 2.0 −1.5 1.6 −3.9 0.5 −2.0 9.5 4.8 0.5 11.6 3.1 6.9 1.9Q4 1.1 1.1 0.8 −3.5 0.9 6.2 −3.8 12.5 1.2 0.9 −15.9 0.8 −1.1 1.4
2009 Q1 0.9 0.8 0.4 2.0 −2.4 −1.5 −1.3 0.3 1.9 1.8 3.4 2.3 5.7 1.1Q2 0.3 0.2 1.0 1.0 −1.0 1.3 1.1 −1.1 −2.8 1.7 −0.2 1.6 1.8 1.5Q3 −0.4 −0.7 0.6 −0.8 0.3 −2.0 −1.9 −2.7 −1.6 2.0 −0.5 1.7 2.3 1.5Q4 1.9 1.9 1.3 3.0 0.9 1.4 3.8 4.9 −0.6 3.2 −2.6 2.0 0.9 2.4
2010 Q1 1.5 1.4 0.9 2.7 5.1 −1.2 5.5 1.2 3.7 −0.2 −3.9 1.8 3.2 1.2
Percentage chang e , quar ter on corresponding quarter of previous year
2007 Q1 5.8 5.5 2.6 3.2 16.6 4.0 2.8 0.7 10.6 10.6 4.8 7.7 10.2 6.9Q2 6.1 6.1 5.6 3.6 13.4 8.7 −1.2 3.3 11.2 2.4 10.2 6.1 11.3 4.4Q3 5.2 6.1 7.5 4.1 4.0 7.6 1.5 3.1 8.0 6.6 11.9 −0.8 1.9 −1.7Q4 8.7 10.0 9.6 10.9 1.0 15.8 19.8 7.6 9.4 4.6 15.8 −0.3 5.8 −2.2
2008 Q1 8.4 9.2 13.4 11.6 3.5 9.5 11.1 3.4 6.2 7.8 11.4 2.8 3.7 2.5Q2 9.0 10.3 10.0 12.7 5.3 13.9 23.1 4.2 8.8 7.0 17.3 0.1 −1.5 0.6Q3 9.3 10.1 5.2 11.0 6.7 10.8 16.0 12.2 12.5 5.4 27.2 4.0 7.8 2.7Q4 6.7 6.8 3.0 −1.3 6.4 8.4 −2.6 22.7 11.1 10.6 7.2 6.0 9.6 4.8
2009 Q1 6.4 6.5 −0.6 0.6 0.4 11.2 0.3 24.3 13.1 3.6 8.4 6.1 16.5 2.8Q2 4.5 4.1 0.6 1.0 −6.4 6.4 −6.0 22.2 5.1 5.1 −3.2 8.0 13.7 6.0Q3 1.9 1.3 2.8 −1.3 −2.3 3.7 −5.9 8.7 −1.4 6.6 −13.7 6.5 8.8 5.6Q4 2.8 2.1 3.3 5.4 −2.3 −0.9 1.6 1.3 −3.1 8.9 − 7.8 11.0 6.6
2010 Q1 3.3 2.8 3.8 6.1 5.2 −0.5 8.6 2.2 −1.4 6.8 −7.1 7.2 8.4 6.7

24
01.KN Household final consumption expenditureFood and non-alcoholic beveragesChained volume measures, reference year 2006 - not seasonally adjusted £ million
Food and mon-alcoholic beverages
Food Non-alcoholic beverages
MineralMilk, Sugar & Food Coffee, water &
Bread and cheese & Oils and Vegetabl- sweet products tea and softTotal Total cereals Meat Fish eggs fats Fruit es products n.e.c. Total cocoa dr inks
COICOP 01 01.1 01.1.1 01.1.2 01.1.3 01.1.4 01.1.5 01.1.6 01.1.7 01.1.8 01.1.9 01.2 01.2.1 01.2.2
ADIP ADIQ ADMV CCFG CCFH CCFI CCFJ CCFK ADNZ ADOA ADOB ADIR CCFP CCFQ2005 68 714 60 092 10 019 14 005 2 652 8 418 1 279 5 505 9 064 7 457 1 701 8 625 2 207 6 4202006 69 643 60 856 10 240 14 006 2 750 8 667 1 310 5 800 9 193 7 134 1 756 8 787 2 119 6 6682007 70 865 62 151 10 441 14 442 2 763 8 830 1 299 5 925 9 257 7 285 1 909 8 714 2 197 6 5172008 70 563 61 813 10 139 14 185 2 778 8 520 1 238 6 163 9 384 7 320 2 086 8 750 2 195 6 5552009 69 590 60 636 9 813 13 497 2 624 8 592 1 208 6 637 9 130 7 247 1 888 8 954 2 254 6 700
Percentage chang e , year on previous year
2005 1.5 1.4 1.4 1.1 2.5 2.3 5.6 7.6 0.2 −3.0 2.2 2.3 0.6 2.92006 1.4 1.3 2.2 − 3.7 3.0 2.4 5.4 1.4 −4.3 3.2 1.9 −4.0 3.92007 1.8 2.1 2.0 3.1 0.5 1.9 −0.8 2.2 0.7 2.1 8.7 −0.8 3.7 −2.32008 −0.4 −0.5 −2.9 −1.8 0.5 −3.5 −4.7 4.0 1.4 0.5 9.3 0.4 −0.1 0.62009 −1.4 −1.9 −3.2 −4.9 −5.5 0.8 −2.4 7.7 −2.7 −1.0 −9.5 2.3 2.7 2.2
Not seasonally adjusted
2007 Q1 17 160 15 079 2 525 3 419 681 2 215 323 1 405 2 275 1 780 456 2 081 538 1 543Q2 17 670 15 401 2 560 3 421 783 2 193 312 1 611 2 408 1 654 459 2 269 547 1 722Q3 17 302 15 061 2 612 3 513 656 2 156 308 1 550 2 246 1 561 459 2 241 534 1 707Q4 18 733 16 610 2 744 4 089 643 2 266 356 1 359 2 328 2 290 535 2 123 578 1 545
2008 Q1 17 565 15 485 2 646 3 748 668 2 085 312 1 417 2 295 1 821 493 2 080 548 1 532Q2 17 945 15 710 2 575 3 573 805 2 142 316 1 620 2 485 1 671 523 2 235 529 1 706Q3 16 970 14 715 2 388 3 338 671 2 064 287 1 585 2 297 1 537 548 2 255 544 1 711Q4 18 083 15 903 2 530 3 526 634 2 229 323 1 541 2 307 2 291 522 2 180 574 1 606
2009 Q1 16 853 14 746 2 384 3 282 633 2 146 295 1 576 2 217 1 739 474 2 107 561 1 546Q2 17 542 15 238 2 424 3 300 720 2 162 293 1 820 2 392 1 667 460 2 304 544 1 760Q3 16 932 14 648 2 420 3 250 652 2 085 291 1 699 2 239 1 563 449 2 284 544 1 740Q4 18 263 16 004 2 585 3 665 619 2 199 329 1 542 2 282 2 278 505 2 259 605 1 654
2010 Q1 17 122 14 968 2 458 3 451 636 2 129 316 1 541 2 216 1 776 445 2 154 581 1 573
Percentage chang e , quar ter on corresponding quarter of previous year
2007 Q1 0.9 0.5 −0.4 −1.5 1.9 1.1 −5.0 −1.7 0.4 7.6 3.2 3.5 1.9 4.0Q2 1.1 1.1 0.9 0.2 4.3 2.3 −2.8 2.3 −0.2 −0.2 8.5 1.2 5.4 −Q3 1.7 2.7 4.2 4.1 −0.2 1.7 − 3.1 −0.6 3.7 10.1 −5.0 0.8 −6.7Q4 3.3 4.0 3.1 9.2 −4.6 2.4 4.4 5.1 3.3 −1.2 12.9 −2.4 6.6 −5.4
2008 Q1 2.4 2.7 4.8 9.6 −1.9 −5.9 −3.4 0.9 0.9 2.3 8.1 − 1.9 −0.7Q2 1.6 2.0 0.6 4.4 2.8 −2.3 1.3 0.6 3.2 1.0 13.9 −1.5 −3.3 −0.9Q3 −1.9 −2.3 −8.6 −5.0 2.3 −4.3 −6.8 2.3 2.3 −1.5 19.4 0.6 1.9 0.2Q4 −3.5 −4.3 −7.8 −13.8 −1.4 −1.6 −9.3 13.4 −0.9 − −2.4 2.7 −0.7 3.9
2009 Q1 −4.1 −4.8 −9.9 −12.4 −5.2 2.9 −5.4 11.2 −3.4 −4.5 −3.9 1.3 2.4 0.9Q2 −2.2 −3.0 −5.9 −7.6 −10.6 0.9 −7.3 12.3 −3.7 −0.2 −12.0 3.1 2.8 3.2Q3 −0.2 −0.5 1.3 −2.6 −2.8 1.0 1.4 7.2 −2.5 1.7 −18.1 1.3 − 1.7Q4 1.0 0.6 2.2 3.9 −2.4 −1.3 1.9 0.1 −1.1 −0.6 −3.3 3.6 5.4 3.0
2010 Q1 1.6 1.5 3.1 5.1 0.5 −0.8 7.1 −2.2 − 2.1 −6.1 2.2 3.6 1.7

25
01.KS Household final consumption expenditureFood and non-alcoholic beveragesChained volume measures, reference year 2006 - seasonally adjusted £ million
Food and non-alcoholic beverages
Food Non-alcoholic beverages
MineralMilk, Sugar & Food Coffee, water &
Bread and cheese & Oils and Vegetabl- sweet products tea and softTotal Total cereals Meat Fish eggs fats Fruit es products n.e.c. Total cocoa dr inks
COICOP 01 01.1 01.1.1 01.1.2 01.1.3 01.1.4 01.1.5 01.1.6 01.1.7 01.1.8 01.1.9 01.2 01.2.1 01.2.2
ZWUN UWBK UWBL CCTK CCTL CCTM CCTN CCTO UWFD UWFX UWGH UWGI CCTT CCTU2005 68 714 60 092 10 019 14 005 2 652 8 418 1 279 5 505 9 064 7 457 1 701 8 625 2 207 6 4202006 69 643 60 856 10 240 14 006 2 750 8 667 1 310 5 800 9 193 7 134 1 756 8 787 2 119 6 6682007 70 865 62 151 10 441 14 442 2 763 8 830 1 299 5 925 9 257 7 285 1 909 8 714 2 197 6 5172008 70 563 61 813 10 139 14 185 2 778 8 520 1 238 6 163 9 384 7 320 2 086 8 750 2 195 6 5552009 69 590 60 636 9 813 13 497 2 624 8 592 1 208 6 637 9 130 7 247 1 888 8 954 2 254 6 700
Percentage chang e , year on previous year
2005 1.5 1.4 1.4 1.1 2.5 2.3 5.6 7.6 0.2 −3.0 2.2 2.3 0.6 2.92006 1.4 1.3 2.2 − 3.7 3.0 2.4 5.4 1.4 −4.3 3.2 1.9 −4.0 3.92007 1.8 2.1 2.0 3.1 0.5 1.9 −0.8 2.2 0.7 2.1 8.7 −0.8 3.7 −2.32008 −0.4 −0.5 −2.9 −1.8 0.5 −3.5 −4.7 4.0 1.4 0.5 9.3 0.4 −0.1 0.62009 −1.4 −1.9 −3.2 −4.9 −5.5 0.8 −2.4 7.7 −2.7 −1.0 −9.5 2.3 2.7 2.2
Seasonally adjusted
2007 Q1 17 537 15 350 2 551 3 478 689 2 203 323 1 471 2 340 1 842 453 2 187 524 1 663Q2 17 555 15 356 2 581 3 475 717 2 189 320 1 478 2 288 1 831 477 2 199 568 1 631Q3 17 835 15 657 2 666 3 649 680 2 206 323 1 485 2 300 1 860 488 2 178 560 1 618Q4 17 938 15 788 2 643 3 840 677 2 232 333 1 491 2 329 1 752 491 2 150 545 1 605
2008 Q1 17 985 15 796 2 680 3 789 689 2 087 313 1 492 2 375 1 877 494 2 189 540 1 649Q2 17 759 15 599 2 593 3 622 725 2 135 324 1 463 2 356 1 840 541 2 160 548 1 612Q3 17 440 15 240 2 428 3 459 686 2 111 300 1 522 2 347 1 814 573 2 200 566 1 634Q4 17 379 15 178 2 438 3 315 678 2 187 301 1 686 2 306 1 789 478 2 201 541 1 660
2009 Q1 17 341 15 121 2 423 3 330 660 2 169 297 1 671 2 299 1 790 482 2 220 557 1 663Q2 17 315 15 093 2 440 3 347 651 2 142 298 1 657 2 281 1 806 471 2 222 560 1 662Q3 17 352 15 109 2 459 3 365 653 2 129 300 1 640 2 273 1 821 469 2 243 566 1 677Q4 17 582 15 313 2 491 3 455 660 2 152 313 1 669 2 277 1 830 466 2 269 571 1 698
2010 Q1 17 627 15 359 2 506 3 503 672 2 158 319 1 625 2 304 1 815 457 2 268 578 1 690
Percentage chang e , quar ter on previous quarter
2007 Q1 1.0 1.3 −0.7 −1.0 −2.0 0.8 2.2 4.9 3.4 3.9 5.3 −1.2 2.3 −2.3Q2 0.1 − 1.2 −0.1 4.1 −0.6 −0.9 0.5 −2.2 −0.6 5.3 0.5 8.4 −1.9Q3 1.6 2.0 3.3 5.0 −5.2 0.8 0.9 0.5 0.5 1.6 2.3 −1.0 −1.4 −0.8Q4 0.6 0.8 −0.9 5.2 −0.4 1.2 3.1 0.4 1.3 −5.8 0.6 −1.3 −2.7 −0.8
2008 Q1 0.3 0.1 1.4 −1.3 1.8 −6.5 −6.0 0.1 2.0 7.1 0.6 1.8 −0.9 2.7Q2 −1.3 −1.2 −3.2 −4.4 5.2 2.3 3.5 −1.9 −0.8 −2.0 9.5 −1.3 1.5 −2.2Q3 −1.8 −2.3 −6.4 −4.5 −5.4 −1.1 −7.4 4.0 −0.4 −1.4 5.9 1.9 3.3 1.4Q4 −0.3 −0.4 0.4 −4.2 −1.2 3.6 0.3 10.8 −1.7 −1.4 −16.6 − −4.4 1.6
2009 Q1 −0.2 −0.4 −0.6 0.5 −2.7 −0.8 −1.3 −0.9 −0.3 0.1 0.8 0.9 3.0 0.2Q2 −0.1 −0.2 0.7 0.5 −1.4 −1.2 0.3 −0.8 −0.8 0.9 −2.3 0.1 0.5 −0.1Q3 0.2 0.1 0.8 0.5 0.3 −0.6 0.7 −1.0 −0.4 0.8 −0.4 0.9 1.1 0.9Q4 1.3 1.4 1.3 2.7 1.1 1.1 4.3 1.8 0.2 0.5 −0.6 1.2 0.9 1.3
2010 Q1 0.3 0.3 0.6 1.4 1.8 0.3 1.9 −2.6 1.2 −0.8 −1.9 − 1.2 −0.5
Percentage chang e , quar ter on corresponding quarter of previous year
2007 Q1 1.2 1.0 −0.2 −1.1 4.6 2.0 −4.7 −1.7 0.9 7.3 4.1 3.2 2.5 3.4Q2 0.7 0.6 0.9 − 2.6 1.7 −3.0 1.3 −0.1 −1.5 7.7 1.0 4.8 −0.2Q3 1.8 2.7 4.2 4.2 −1.3 1.7 −0.6 3.0 −0.8 4.2 8.9 −4.3 1.1 −6.0Q4 3.3 4.2 2.9 9.3 −3.7 2.1 5.4 6.3 2.9 −1.2 14.2 −2.9 6.4 −5.7
2008 Q1 2.6 2.9 5.1 8.9 − −5.3 −3.1 1.4 1.5 1.9 9.1 0.1 3.1 −0.8Q2 1.2 1.6 0.5 4.2 1.1 −2.5 1.3 −1.0 3.0 0.5 13.4 −1.8 −3.5 −1.2Q3 −2.2 −2.7 −8.9 −5.2 0.9 −4.3 −7.1 2.5 2.0 −2.5 17.4 1.0 1.1 1.0Q4 −3.1 −3.9 −7.8 −13.7 0.1 −2.0 −9.6 13.1 −1.0 2.1 −2.6 2.4 −0.7 3.4
2009 Q1 −3.6 −4.3 −9.6 −12.1 −4.2 3.9 −5.1 12.0 −3.2 −4.6 −2.4 1.4 3.1 0.8Q2 −2.5 −3.2 −5.9 −7.6 −10.2 0.3 −8.0 13.3 −3.2 −1.8 −12.9 2.9 2.2 3.1Q3 −0.5 −0.9 1.3 −2.7 −4.8 0.9 − 7.8 −3.2 0.4 −18.2 2.0 − 2.6Q4 1.2 0.9 2.2 4.2 −2.7 −1.6 4.0 −1.0 −1.3 2.3 −2.5 3.1 5.5 2.3
2010 Q1 1.6 1.6 3.4 5.2 1.8 −0.5 7.4 −2.8 0.2 1.4 −5.2 2.2 3.8 1.6
26
01.DN Household final consumption expenditureFood and non-alcoholic beveragesImplied deflators - not seasonally adjusted 2006 = 100
Food and non-alcoholic beverages
Food Non-alcoholic beverages
MineralMilk, Sugar & Food Coffee, water &
Bread and cheese & Oils and Vegetabl- sweet products tea and softTotal Total cereals Meat Fish eggs fats Fruit es products n.e.c. Total cocoa dr inks
COICOP 01 01.1 01.1.1 01.1.2 01.1.3 01.1.4 01.1.5 01.1.6 01.1.7 01.1.8 01.1.9 01.2 01.2.1 01.2.2
UTJB UTNC AWLJ AWLK AWLL AWLM AWLN AWLO AWLP AWLQ AWLR UTND AWLS AWLT2005 97.7 97.9 98.1 98.2 93.1 98.5 96.3 99.2 98.1 96.3 100.7 96.4 95.2 96.82006 100.0 100.0 100.0 100.0 100.0 100.0 100.0 100.0 100.0 100.0 100.0 100.0 100.0 100.02007 104.6 104.7 104.3 102.3 107.9 107.0 106.5 101.5 109.0 103.8 101.8 103.9 103.4 104.12008 113.8 114.8 115.7 112.7 113.2 122.7 124.4 108.0 117.9 111.2 107.9 106.8 108.5 106.22009 119.9 121.1 121.4 120.1 116.6 127.6 124.2 113.6 125.0 119.1 115.9 111.7 118.7 109.4
Percentage chang e , year on previous year
2005 1.5 1.7 1.2 − 3.9 2.7 −1.8 1.7 2.9 3.0 −0.3 0.4 0.2 0.42006 2.4 2.1 1.9 1.8 7.4 1.5 3.8 0.8 1.9 3.8 −0.7 3.7 5.0 3.32007 4.6 4.7 4.3 2.3 7.9 7.0 6.5 1.5 9.0 3.8 1.8 3.9 3.4 4.12008 8.8 9.6 10.9 10.2 4.9 14.7 16.8 6.4 8.2 7.1 6.0 2.8 4.9 2.02009 5.4 5.5 4.9 6.6 3.0 4.0 −0.2 5.2 6.0 7.1 7.4 4.6 9.4 3.0
Not seasonally adjusted
2007 Q1 102.7 102.7 101.9 102.2 106.0 101.9 102.5 99.4 107.1 101.8 100.9 102.4 103.2 102.1Q2 104.3 104.2 103.9 102.3 107.5 103.7 101.6 100.8 110.5 103.5 101.5 104.4 103.5 104.6Q3 103.9 103.8 103.3 101.0 108.1 106.9 103.6 98.8 108.4 103.7 102.0 104.6 103.6 104.9Q4 107.4 107.8 107.8 103.5 110.1 115.4 117.1 107.4 109.8 105.5 102.6 104.2 103.3 104.5
2008 Q1 108.6 109.0 110.0 104.6 109.9 118.3 118.6 101.6 111.9 108.0 103.7 105.1 103.8 105.5Q2 112.3 113.2 113.9 110.4 112.2 121.0 123.4 106.1 117.0 110.2 105.0 106.5 105.7 106.7Q3 116.0 117.3 119.3 118.2 114.5 123.9 130.0 107.6 119.5 111.8 109.7 107.7 110.5 106.8Q4 118.3 119.7 120.2 118.5 116.6 127.2 126.0 116.5 123.3 114.1 113.0 107.8 113.6 105.7
2009 Q1 120.1 121.4 121.1 119.7 115.3 127.4 125.8 113.2 130.0 117.4 116.2 110.3 117.6 107.7Q2 120.3 121.6 121.8 120.7 116.9 127.9 125.3 114.3 127.2 117.9 115.9 111.4 117.3 109.6Q3 118.9 120.0 121.0 120.2 117.2 127.4 122.0 108.8 121.7 119.5 116.0 112.4 120.4 109.9Q4 120.3 121.4 121.9 119.9 116.8 127.7 123.7 118.7 121.3 121.1 115.6 112.7 119.5 110.2
2010 Q1 122.0 122.8 121.4 120.7 119.2 127.3 127.5 119.0 127.9 123.4 114.2 115.8 122.9 113.2
Percentage chang e , quar ter on corresponding quarter of previous year
2007 Q1 4.6 4.6 2.7 4.2 11.0 2.3 7.6 2.7 9.4 3.8 1.1 4.5 7.3 3.4Q2 5.4 5.4 4.5 3.4 10.3 6.4 1.3 1.8 11.5 3.4 1.7 5.0 5.9 4.7Q3 3.4 3.3 3.1 0.1 5.4 5.7 1.3 −0.3 8.7 2.9 2.0 3.9 1.3 4.7Q4 5.1 5.5 6.5 1.6 5.2 13.5 14.5 1.4 6.2 4.7 2.2 2.5 −0.4 3.5
2008 Q1 5.7 6.1 7.9 2.3 3.7 16.1 15.7 2.2 4.5 6.1 2.8 2.6 0.6 3.3Q2 7.7 8.6 9.6 7.9 4.4 16.7 21.5 5.3 5.9 6.5 3.4 2.0 2.1 2.0Q3 11.6 13.0 15.5 17.0 5.9 15.9 25.5 8.9 10.2 7.8 7.5 3.0 6.7 1.8Q4 10.1 11.0 11.5 14.5 5.9 10.2 7.6 8.5 12.3 8.2 10.1 3.5 10.0 1.1
2009 Q1 10.6 11.4 10.1 14.4 4.9 7.7 6.1 11.4 16.2 8.7 12.1 4.9 13.3 2.1Q2 7.1 7.4 6.9 9.3 4.2 5.7 1.5 7.7 8.7 7.0 10.4 4.6 11.0 2.7Q3 2.5 2.3 1.4 1.7 2.4 2.8 −6.2 1.1 1.8 6.9 5.7 4.4 9.0 2.9Q4 1.7 1.4 1.4 1.2 0.2 0.4 −1.8 1.9 −1.6 6.1 2.3 4.5 5.2 4.3
2010 Q1 1.6 1.2 0.2 0.8 3.4 −0.1 1.4 5.1 −1.6 5.1 −1.7 5.0 4.5 5.1
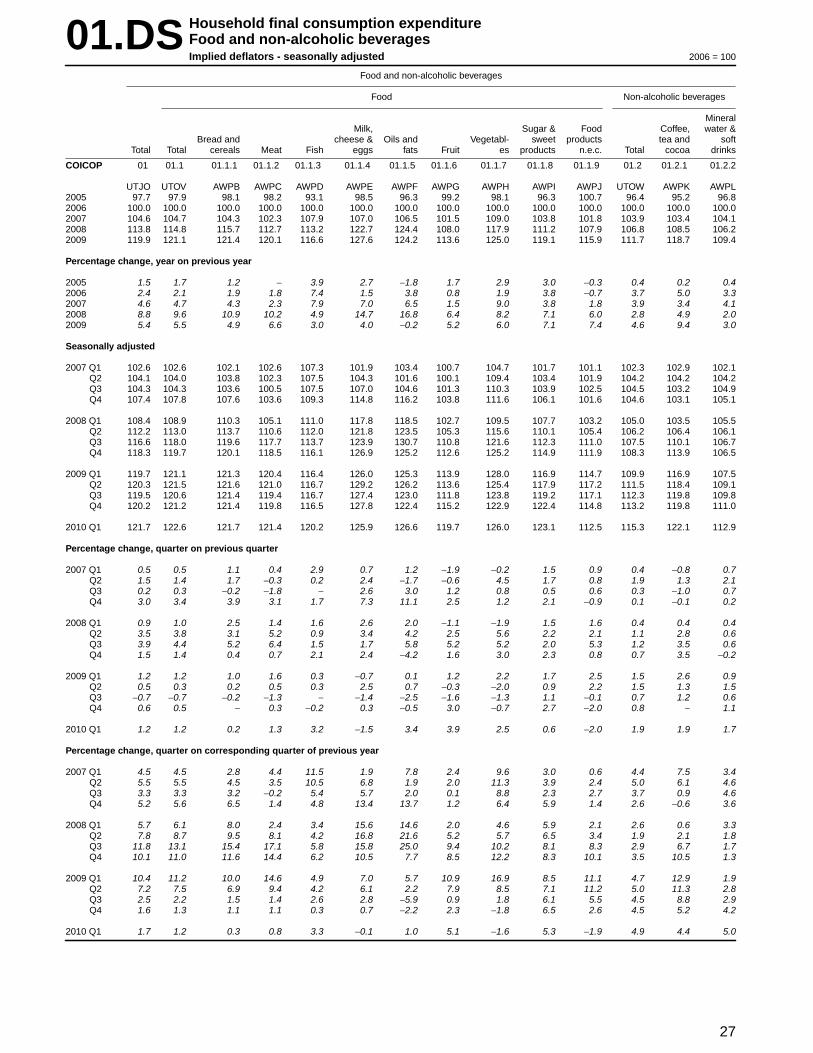
27
01.DS Household final consumption expenditureFood and non-alcoholic beveragesImplied deflators - seasonally adjusted 2006 = 100
Food and non-alcoholic beverages
Food Non-alcoholic beverages
MineralMilk, Sugar & Food Coffee, water &
Bread and cheese & Oils and Vegetabl- sweet products tea and softTotal Total cereals Meat Fish eggs fats Fruit es products n.e.c. Total cocoa dr inks
COICOP 01 01.1 01.1.1 01.1.2 01.1.3 01.1.4 01.1.5 01.1.6 01.1.7 01.1.8 01.1.9 01.2 01.2.1 01.2.2
UTJO UTOV AWPB AWPC AWPD AWPE AWPF AWPG AWPH AWPI AWPJ UTOW AWPK AWPL2005 97.7 97.9 98.1 98.2 93.1 98.5 96.3 99.2 98.1 96.3 100.7 96.4 95.2 96.82006 100.0 100.0 100.0 100.0 100.0 100.0 100.0 100.0 100.0 100.0 100.0 100.0 100.0 100.02007 104.6 104.7 104.3 102.3 107.9 107.0 106.5 101.5 109.0 103.8 101.8 103.9 103.4 104.12008 113.8 114.8 115.7 112.7 113.2 122.7 124.4 108.0 117.9 111.2 107.9 106.8 108.5 106.22009 119.9 121.1 121.4 120.1 116.6 127.6 124.2 113.6 125.0 119.1 115.9 111.7 118.7 109.4
Percentage chang e , year on previous year
2005 1.5 1.7 1.2 − 3.9 2.7 −1.8 1.7 2.9 3.0 −0.3 0.4 0.2 0.42006 2.4 2.1 1.9 1.8 7.4 1.5 3.8 0.8 1.9 3.8 −0.7 3.7 5.0 3.32007 4.6 4.7 4.3 2.3 7.9 7.0 6.5 1.5 9.0 3.8 1.8 3.9 3.4 4.12008 8.8 9.6 10.9 10.2 4.9 14.7 16.8 6.4 8.2 7.1 6.0 2.8 4.9 2.02009 5.4 5.5 4.9 6.6 3.0 4.0 −0.2 5.2 6.0 7.1 7.4 4.6 9.4 3.0
Seasonally adjusted
2007 Q1 102.6 102.6 102.1 102.6 107.3 101.9 103.4 100.7 104.7 101.7 101.1 102.3 102.9 102.1Q2 104.1 104.0 103.8 102.3 107.5 104.3 101.6 100.1 109.4 103.4 101.9 104.2 104.2 104.2Q3 104.3 104.3 103.6 100.5 107.5 107.0 104.6 101.3 110.3 103.9 102.5 104.5 103.2 104.9Q4 107.4 107.8 107.6 103.6 109.3 114.8 116.2 103.8 111.6 106.1 101.6 104.6 103.1 105.1
2008 Q1 108.4 108.9 110.3 105.1 111.0 117.8 118.5 102.7 109.5 107.7 103.2 105.0 103.5 105.5Q2 112.2 113.0 113.7 110.6 112.0 121.8 123.5 105.3 115.6 110.1 105.4 106.2 106.4 106.1Q3 116.6 118.0 119.6 117.7 113.7 123.9 130.7 110.8 121.6 112.3 111.0 107.5 110.1 106.7Q4 118.3 119.7 120.1 118.5 116.1 126.9 125.2 112.6 125.2 114.9 111.9 108.3 113.9 106.5
2009 Q1 119.7 121.1 121.3 120.4 116.4 126.0 125.3 113.9 128.0 116.9 114.7 109.9 116.9 107.5Q2 120.3 121.5 121.6 121.0 116.7 129.2 126.2 113.6 125.4 117.9 117.2 111.5 118.4 109.1Q3 119.5 120.6 121.4 119.4 116.7 127.4 123.0 111.8 123.8 119.2 117.1 112.3 119.8 109.8Q4 120.2 121.2 121.4 119.8 116.5 127.8 122.4 115.2 122.9 122.4 114.8 113.2 119.8 111.0
2010 Q1 121.7 122.6 121.7 121.4 120.2 125.9 126.6 119.7 126.0 123.1 112.5 115.3 122.1 112.9
Percentage chang e , quar ter on previous quarter
2007 Q1 0.5 0.5 1.1 0.4 2.9 0.7 1.2 −1.9 −0.2 1.5 0.9 0.4 −0.8 0.7Q2 1.5 1.4 1.7 −0.3 0.2 2.4 −1.7 −0.6 4.5 1.7 0.8 1.9 1.3 2.1Q3 0.2 0.3 −0.2 −1.8 − 2.6 3.0 1.2 0.8 0.5 0.6 0.3 −1.0 0.7Q4 3.0 3.4 3.9 3.1 1.7 7.3 11.1 2.5 1.2 2.1 −0.9 0.1 −0.1 0.2
2008 Q1 0.9 1.0 2.5 1.4 1.6 2.6 2.0 −1.1 −1.9 1.5 1.6 0.4 0.4 0.4Q2 3.5 3.8 3.1 5.2 0.9 3.4 4.2 2.5 5.6 2.2 2.1 1.1 2.8 0.6Q3 3.9 4.4 5.2 6.4 1.5 1.7 5.8 5.2 5.2 2.0 5.3 1.2 3.5 0.6Q4 1.5 1.4 0.4 0.7 2.1 2.4 −4.2 1.6 3.0 2.3 0.8 0.7 3.5 −0.2
2009 Q1 1.2 1.2 1.0 1.6 0.3 −0.7 0.1 1.2 2.2 1.7 2.5 1.5 2.6 0.9Q2 0.5 0.3 0.2 0.5 0.3 2.5 0.7 −0.3 −2.0 0.9 2.2 1.5 1.3 1.5Q3 −0.7 −0.7 −0.2 −1.3 − −1.4 −2.5 −1.6 −1.3 1.1 −0.1 0.7 1.2 0.6Q4 0.6 0.5 − 0.3 −0.2 0.3 −0.5 3.0 −0.7 2.7 −2.0 0.8 − 1.1
2010 Q1 1.2 1.2 0.2 1.3 3.2 −1.5 3.4 3.9 2.5 0.6 −2.0 1.9 1.9 1.7
Percentage chang e , quar ter on corresponding quarter of previous year
2007 Q1 4.5 4.5 2.8 4.4 11.5 1.9 7.8 2.4 9.6 3.0 0.6 4.4 7.5 3.4Q2 5.5 5.5 4.5 3.5 10.5 6.8 1.9 2.0 11.3 3.9 2.4 5.0 6.1 4.6Q3 3.3 3.3 3.2 −0.2 5.4 5.7 2.0 0.1 8.8 2.3 2.7 3.7 0.9 4.6Q4 5.2 5.6 6.5 1.4 4.8 13.4 13.7 1.2 6.4 5.9 1.4 2.6 −0.6 3.6
2008 Q1 5.7 6.1 8.0 2.4 3.4 15.6 14.6 2.0 4.6 5.9 2.1 2.6 0.6 3.3Q2 7.8 8.7 9.5 8.1 4.2 16.8 21.6 5.2 5.7 6.5 3.4 1.9 2.1 1.8Q3 11.8 13.1 15.4 17.1 5.8 15.8 25.0 9.4 10.2 8.1 8.3 2.9 6.7 1.7Q4 10.1 11.0 11.6 14.4 6.2 10.5 7.7 8.5 12.2 8.3 10.1 3.5 10.5 1.3
2009 Q1 10.4 11.2 10.0 14.6 4.9 7.0 5.7 10.9 16.9 8.5 11.1 4.7 12.9 1.9Q2 7.2 7.5 6.9 9.4 4.2 6.1 2.2 7.9 8.5 7.1 11.2 5.0 11.3 2.8Q3 2.5 2.2 1.5 1.4 2.6 2.8 −5.9 0.9 1.8 6.1 5.5 4.5 8.8 2.9Q4 1.6 1.3 1.1 1.1 0.3 0.7 −2.2 2.3 −1.8 6.5 2.6 4.5 5.2 4.2
2010 Q1 1.7 1.2 0.3 0.8 3.3 −0.1 1.0 5.1 −1.6 5.3 −1.9 4.9 4.4 5.0

28
02.CN Household final consumption expenditureAlcoholic beverages and tobaccoCurrent prices - not seasonally adjusted £ million
Alcoholic beverages and tobacco
Alcoholic beverages
Total Total Spirits Wine Beer Tobacco
COICOP 02 02.1 02.1.1 02.1.2 02.1.3 02.2
ADFL ADFM UUHX UTHT UUMI ADFN2005 28 853 13 476 3 713 6 488 3 275 15 3772006 29 286 13 637 3 675 6 543 3 419 15 6492007 29 787 14 134 3 826 6 974 3 334 15 6532008 30 306 14 656 4 114 7 108 3 434 15 6502009 31 131 14 851 4 037 7 120 3 694 16 280
Percentage chang e , year on previous year
2005 1.0 1.5 2.7 2.5 −1.7 0.52006 1.5 1.2 −1.0 0.8 4.4 1.82007 1.7 3.6 4.1 6.6 −2.5 −2008 1.7 3.7 7.5 1.9 3.0 −2009 2.7 1.3 −1.9 0.2 7.6 4.0
Not seasonally adjusted
2007 Q1 6 941 2 963 807 1 453 703 3 978Q2 7 274 3 370 874 1 646 850 3 904Q3 7 367 3 468 861 1 734 873 3 899Q4 8 205 4 333 1 284 2 141 908 3 872
2008 Q1 6 785 2 918 886 1 365 667 3 867Q2 7 465 3 553 958 1 724 871 3 912Q3 7 508 3 565 902 1 752 911 3 943Q4 8 548 4 620 1 368 2 267 985 3 928
2009 Q1 7 161 3 146 888 1 544 714 4 015Q2 7 665 3 598 898 1 718 982 4 067Q3 7 682 3 589 890 1 692 1 007 4 093Q4 8 623 4 518 1 361 2 166 991 4 105
2010 Q1 7 550 3 321 892 1 645 784 4 229
Percentage chang e , quar ter on corresponding quarter of previous year
2007 Q1 2.9 3.6 6.3 2.4 3.2 2.3Q2 0.2 0.6 4.4 1.8 −5.2 −0.2Q3 1.2 3.8 2.6 10.1 −5.7 −1.1Q4 2.6 6.0 3.5 10.8 −0.8 −0.9
2008 Q1 −2.2 −1.5 9.8 −6.1 −5.1 −2.8Q2 2.6 5.4 9.6 4.7 2.5 0.2Q3 1.9 2.8 4.8 1.0 4.4 1.1Q4 4.2 6.6 6.5 5.9 8.5 1.4
2009 Q1 5.5 7.8 0.2 13.1 7.0 3.8Q2 2.7 1.3 −6.3 −0.3 12.7 4.0Q3 2.3 0.7 −1.3 −3.4 10.5 3.8Q4 0.9 −2.2 −0.5 −4.5 0.6 4.5
2010 Q1 5.4 5.6 0.5 6.5 9.8 5.3

29
02.CS Household final consumption expenditureAlcoholic beverages and tobaccoCurrent prices - seasonally adjusted £ million
Alcoholic beverages and tobacco
Alcoholic beverages
Total Total Spirits Wine Beer Tobacco
COICOP 02 02.1 02.1.1 02.1.2 02.1.3 02.2
ZAKX JJDA UUIE UTHU UUPI ZWUO2005 28 853 13 476 3 713 6 488 3 275 15 3772006 29 286 13 637 3 675 6 543 3 419 15 6492007 29 787 14 134 3 826 6 974 3 334 15 6532008 30 306 14 656 4 114 7 108 3 434 15 6502009 31 131 14 851 4 037 7 120 3 694 16 280
Percentage chang e , year on previous year
2005 1.0 1.5 2.7 2.5 −1.7 0.52006 1.5 1.2 −1.0 0.8 4.4 1.82007 1.7 3.6 4.1 6.6 −2.5 −2008 1.7 3.7 7.5 1.9 3.0 −2009 2.7 1.3 −1.9 0.2 7.6 4.0
Seasonally adjusted
2007 Q1 7 491 3 508 936 1 699 873 3 983Q2 7 378 3 493 967 1 706 820 3 885Q3 7 454 3 561 963 1 786 812 3 893Q4 7 464 3 572 960 1 783 829 3 892
2008 Q1 7 319 3 452 1 025 1 600 827 3 867Q2 7 608 3 717 1 062 1 810 845 3 891Q3 7 622 3 682 1 010 1 819 853 3 940Q4 7 757 3 805 1 017 1 879 909 3 952
2009 Q1 7 741 3 727 1 027 1 807 893 4 014Q2 7 794 3 751 1 007 1 793 951 4 043Q3 7 786 3 694 1 002 1 754 938 4 092Q4 7 810 3 679 1 001 1 766 912 4 131
2010 Q1 8 167 3 942 1 035 1 925 982 4 225
Percentage chang e , quar ter on previous quarter
2007 Q1 2.9 4.7 1.2 6.5 5.1 1.5Q2 −1.5 −0.4 3.3 0.4 −6.1 −2.5Q3 1.0 1.9 −0.4 4.7 −1.0 0.2Q4 0.1 0.3 −0.3 −0.2 2.1 −
2008 Q1 −1.9 −3.4 6.8 −10.3 −0.2 −0.6Q2 3.9 7.7 3.6 13.1 2.2 0.6Q3 0.2 −0.9 −4.9 0.5 0.9 1.3Q4 1.8 3.3 0.7 3.3 6.6 0.3
2009 Q1 −0.2 −2.0 1.0 −3.8 −1.8 1.6Q2 0.7 0.6 −1.9 −0.8 6.5 0.7Q3 −0.1 −1.5 −0.5 −2.2 −1.4 1.2Q4 0.3 −0.4 −0.1 0.7 −2.8 1.0
2010 Q1 4.6 7.1 3.4 9.0 7.7 2.3
Percentage chang e , quar ter on corresponding quarter of previous year
2007 Q1 3.1 4.1 6.2 3.3 3.3 2.2Q2 0.1 0.5 4.3 2.0 −6.4 −0.3Q3 1.2 3.6 2.2 9.6 −6.3 −1.0Q4 2.6 6.6 3.8 11.7 −0.2 −0.8
2008 Q1 −2.3 −1.6 9.5 −5.8 −5.3 −2.9Q2 3.1 6.4 9.8 6.1 3.0 0.2Q3 2.3 3.4 4.9 1.8 5.0 1.2Q4 3.9 6.5 5.9 5.4 9.7 1.5
2009 Q1 5.8 8.0 0.2 12.9 8.0 3.8Q2 2.4 0.9 −5.2 −0.9 12.5 3.9Q3 2.2 0.3 −0.8 −3.6 10.0 3.9Q4 0.7 −3.3 −1.6 −6.0 0.3 4.5
2010 Q1 5.5 5.8 0.8 6.5 10.0 5.3

30
02.KN Household final consumption expenditureAlcoholic beverages and tobaccoChained volume measures, reference year 2006 - not seasonally adjusted £ million
Alcoholic beverages and tobacco
Alcoholic beverages
Total Total Spirits Wine Beer Tobacco
COICOP 02 02.1 02.1.1 02.1.2 02.1.3 02.2
ADIS ADIT UUIL UTHV UUSC ADIU2005 29 271 13 649 3 725 6 675 3 254 16 0392006 29 286 13 637 3 675 6 543 3 419 15 6492007 29 097 14 105 3 837 6 883 3 385 14 9922008 28 798 14 235 3 897 6 857 3 481 14 5632009 27 966 13 463 3 701 6 551 3 211 14 503
Percentage chang e , year on previous year
2005 −0.2 3.1 1.3 3.5 4.2 −3.22006 0.1 −0.1 −1.3 −2.0 5.1 −2.42007 −0.6 3.4 4.4 5.2 −1.0 −4.22008 −1.0 0.9 1.6 −0.4 2.8 −2.92009 −2.9 −5.4 −5.0 −4.5 −7.8 −0.4
Not seasonally adjusted
2007 Q1 6 808 2 952 816 1 451 685 3 857Q2 7 078 3 360 882 1 621 857 3 717Q3 7 156 3 440 866 1 705 869 3 717Q4 8 055 4 353 1 273 2 106 974 3 701
2008 Q1 6 811 3 148 886 1 516 747 3 663Q2 7 051 3 426 918 1 632 875 3 626Q3 7 044 3 392 858 1 648 886 3 652Q4 7 892 4 269 1 235 2 061 973 3 622
2009 Q1 6 540 2 898 830 1 431 637 3 641Q2 6 883 3 256 832 1 579 845 3 626Q3 6 848 3 228 822 1 546 859 3 620Q4 7 695 4 081 1 217 1 995 870 3 616
2010 Q1 6 529 2 942 798 1 493 650 3 588
Percentage chang e , quar ter on corresponding quarter of previous year
2007 Q1 −0.8 2.7 6.1 −0.1 4.1 −3.2Q2 −2.3 0.8 4.5 2.3 −5.3 −5.0Q3 −1.0 3.2 2.6 7.8 −4.1 −4.6Q4 1.3 6.3 4.5 9.4 2.5 −3.9
2008 Q1 − 6.6 8.6 4.5 9.1 −5.0Q2 −0.4 2.0 4.1 0.7 2.1 −2.4Q3 −1.6 −1.4 −0.9 −3.3 2.0 −1.7Q4 −2.0 −1.9 −3.0 −2.1 −0.1 −2.1
2009 Q1 −4.0 −7.9 −6.3 −5.6 −14.7 −0.6Q2 −2.4 −5.0 −9.4 −3.2 −3.4 −Q3 −2.8 −4.8 −4.2 −6.2 −3.0 −0.9Q4 −2.5 −4.4 −1.5 −3.2 −10.6 −0.2
2010 Q1 −0.2 1.5 −3.9 4.3 2.0 −1.5

31
02.KS Household final consumption expenditureAlcoholic beverages and tobaccoChained volume measures, reference year 2006 - seasonally adjusted £ million
Alcoholic beverages and tobacco
Alcoholic beverages
Total Total Spirits Wine Beer Tobacco
COICOP 02 02.1 02.1.1 02.1.2 02.1.3 02.2
ZAKY JRBA UUIS UTHW UUVG ZWUP2005 29 271 13 649 3 725 6 675 3 254 16 0392006 29 286 13 637 3 675 6 543 3 419 15 6492007 29 097 14 105 3 837 6 883 3 385 14 9922008 28 798 14 235 3 897 6 857 3 481 14 5632009 27 966 13 463 3 701 6 551 3 211 14 503
Percentage chang e , year on previous year
2005 −0.2 3.1 1.3 3.5 4.2 −3.22006 0.1 −0.1 −1.3 −2.0 5.1 −2.42007 −0.6 3.4 4.4 5.2 −1.0 −4.22008 −1.0 0.9 1.6 −0.4 2.8 −2.92009 −2.9 −5.4 −5.0 −4.5 −7.8 −0.4
Seasonally adjusted
2007 Q1 7 292 3 438 934 1 653 852 3 854Q2 7 235 3 510 972 1 703 835 3 724Q3 7 273 3 556 962 1 761 834 3 717Q4 7 297 3 601 969 1 766 864 3 697
2008 Q1 7 303 3 642 1 010 1 713 920 3 661Q2 7 209 3 578 1 006 1 722 849 3 632Q3 7 146 3 494 946 1 701 847 3 651Q4 7 140 3 521 935 1 721 865 3 619
2009 Q1 6 994 3 352 946 1 616 790 3 641Q2 7 051 3 420 926 1 672 822 3 630Q3 6 971 3 350 916 1 610 824 3 620Q4 6 950 3 341 913 1 653 775 3 612
2010 Q1 7 012 3 424 916 1 696 812 3 589
Percentage chang e , quar ter on previous quarter
2007 Q1 1.0 1.9 0.8 3.1 1.3 0.2Q2 −0.8 2.1 4.1 3.0 −2.0 −3.4Q3 0.5 1.3 −1.0 3.4 −0.1 −0.2Q4 0.3 1.3 0.7 0.3 3.6 −0.5
2008 Q1 0.1 1.1 4.2 −3.0 6.5 −1.0Q2 −1.3 −1.8 −0.4 0.5 −7.7 −0.8Q3 −0.9 −2.3 −6.0 −1.2 −0.2 0.5Q4 −0.1 0.8 −1.2 1.2 2.1 −0.9
2009 Q1 −2.0 −4.8 1.2 −6.1 −8.7 0.6Q2 0.8 2.0 −2.1 3.5 4.1 −0.3Q3 −1.1 −2.0 −1.1 −3.7 0.2 −0.3Q4 −0.3 −0.3 −0.3 2.7 −5.9 −0.2
2010 Q1 0.9 2.5 0.3 2.6 4.8 −0.6
Percentage chang e , quar ter on corresponding quarter of previous year
2007 Q1 −0.5 2.8 6.4 0.4 3.8 −3.3Q2 −2.1 1.2 4.7 3.0 −5.8 −5.0Q3 −1.1 3.0 2.1 7.4 −4.2 −4.6Q4 1.1 6.8 4.5 10.2 2.7 −3.9
2008 Q1 0.2 5.9 8.1 3.6 8.0 −5.0Q2 −0.4 1.9 3.5 1.1 1.7 −2.5Q3 −1.7 −1.7 −1.7 −3.4 1.6 −1.8Q4 −2.2 −2.2 −3.5 −2.5 0.1 −2.1
2009 Q1 −4.2 −8.0 −6.3 −5.7 −14.1 −0.5Q2 −2.2 −4.4 −8.0 −2.9 −3.2 −0.1Q3 −2.4 −4.1 −3.2 −5.3 −2.7 −0.8Q4 −2.7 −5.1 −2.4 −4.0 −10.4 −0.2
2010 Q1 0.3 2.1 −3.2 5.0 2.8 −1.4
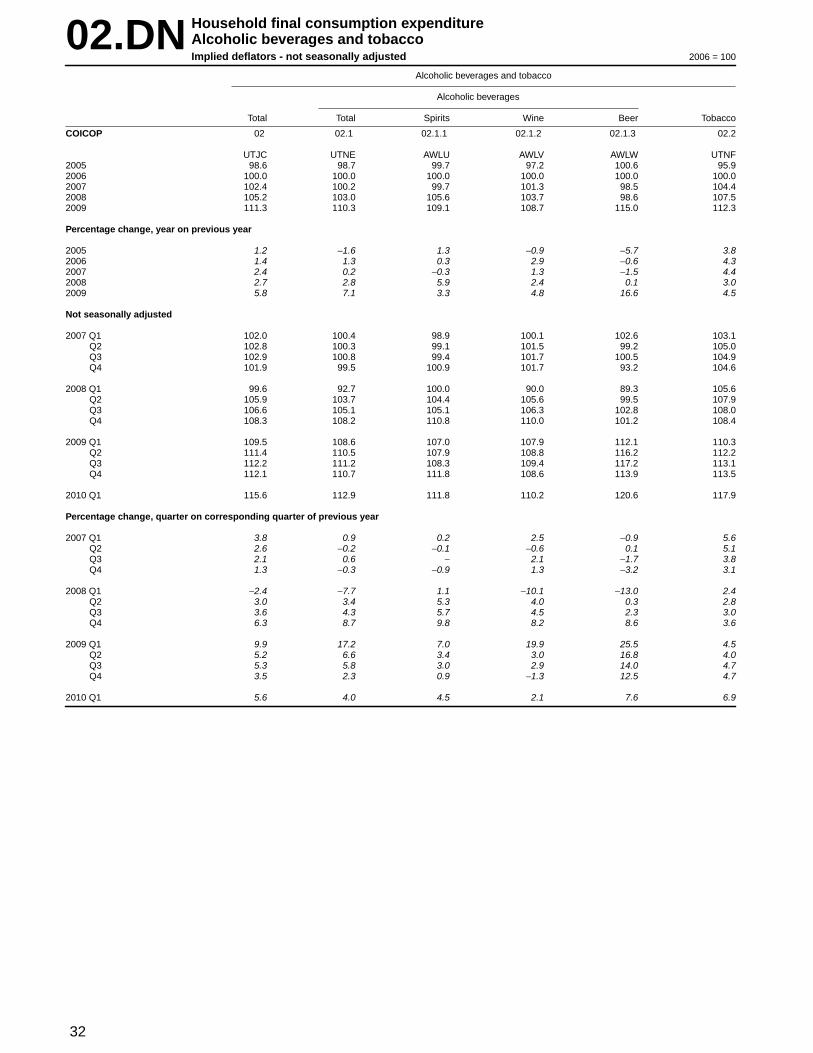
32
02.DN Household final consumption expenditureAlcoholic beverages and tobaccoImplied deflators - not seasonally adjusted 2006 = 100
Alcoholic beverages and tobacco
Alcoholic beverages
Total Total Spirits Wine Beer Tobacco
COICOP 02 02.1 02.1.1 02.1.2 02.1.3 02.2
UTJC UTNE AWLU AWLV AWLW UTNF2005 98.6 98.7 99.7 97.2 100.6 95.92006 100.0 100.0 100.0 100.0 100.0 100.02007 102.4 100.2 99.7 101.3 98.5 104.42008 105.2 103.0 105.6 103.7 98.6 107.52009 111.3 110.3 109.1 108.7 115.0 112.3
Percentage chang e , year on previous year
2005 1.2 −1.6 1.3 −0.9 −5.7 3.82006 1.4 1.3 0.3 2.9 −0.6 4.32007 2.4 0.2 −0.3 1.3 −1.5 4.42008 2.7 2.8 5.9 2.4 0.1 3.02009 5.8 7.1 3.3 4.8 16.6 4.5
Not seasonally adjusted
2007 Q1 102.0 100.4 98.9 100.1 102.6 103.1Q2 102.8 100.3 99.1 101.5 99.2 105.0Q3 102.9 100.8 99.4 101.7 100.5 104.9Q4 101.9 99.5 100.9 101.7 93.2 104.6
2008 Q1 99.6 92.7 100.0 90.0 89.3 105.6Q2 105.9 103.7 104.4 105.6 99.5 107.9Q3 106.6 105.1 105.1 106.3 102.8 108.0Q4 108.3 108.2 110.8 110.0 101.2 108.4
2009 Q1 109.5 108.6 107.0 107.9 112.1 110.3Q2 111.4 110.5 107.9 108.8 116.2 112.2Q3 112.2 111.2 108.3 109.4 117.2 113.1Q4 112.1 110.7 111.8 108.6 113.9 113.5
2010 Q1 115.6 112.9 111.8 110.2 120.6 117.9
Percentage chang e , quar ter on corresponding quarter of previous year
2007 Q1 3.8 0.9 0.2 2.5 −0.9 5.6Q2 2.6 −0.2 −0.1 −0.6 0.1 5.1Q3 2.1 0.6 − 2.1 −1.7 3.8Q4 1.3 −0.3 −0.9 1.3 −3.2 3.1
2008 Q1 −2.4 −7.7 1.1 −10.1 −13.0 2.4Q2 3.0 3.4 5.3 4.0 0.3 2.8Q3 3.6 4.3 5.7 4.5 2.3 3.0Q4 6.3 8.7 9.8 8.2 8.6 3.6
2009 Q1 9.9 17.2 7.0 19.9 25.5 4.5Q2 5.2 6.6 3.4 3.0 16.8 4.0Q3 5.3 5.8 3.0 2.9 14.0 4.7Q4 3.5 2.3 0.9 −1.3 12.5 4.7
2010 Q1 5.6 4.0 4.5 2.1 7.6 6.9

33
02.DS Household final consumption expenditureAlcoholic beverages and tobaccoImplied deflators - seasonally adjusted 2006 = 100
Alcoholic beverages and tobacco
Alcoholic beverages
Total Total Spirits Wine Beer Tobacco
COICOP 02 02.1 02.1.1 02.1.2 02.1.3 02.2
UTJP UTOX AWPM AWPN AWPO UTOY2005 98.6 98.7 99.7 97.2 100.6 95.92006 100.0 100.0 100.0 100.0 100.0 100.02007 102.4 100.2 99.7 101.3 98.5 104.42008 105.2 103.0 105.6 103.7 98.6 107.52009 111.3 110.3 109.1 108.7 115.0 112.3
Percentage chang e , year on previous year
2005 1.2 −1.6 1.3 −0.9 −5.7 3.82006 1.4 1.3 0.3 2.9 −0.6 4.32007 2.4 0.2 −0.3 1.3 −1.5 4.42008 2.7 2.8 5.9 2.4 0.1 3.02009 5.8 7.1 3.3 4.8 16.6 4.5
Seasonally adjusted
2007 Q1 102.7 102.0 100.2 102.8 102.5 103.3Q2 102.0 99.5 99.5 100.2 98.2 104.3Q3 102.5 100.1 100.1 101.4 97.4 104.7Q4 102.3 99.2 99.1 101.0 95.9 105.3
2008 Q1 100.2 94.8 101.5 93.4 89.9 105.6Q2 105.5 103.9 105.6 105.1 99.5 107.1Q3 106.7 105.4 106.8 106.9 100.7 107.9Q4 108.6 108.1 108.8 109.2 105.1 109.2
2009 Q1 110.7 111.2 108.6 111.8 113.0 110.2Q2 110.5 109.7 108.7 107.2 115.7 111.4Q3 111.7 110.3 109.4 108.9 113.8 113.0Q4 112.4 110.1 109.6 106.8 117.7 114.4
2010 Q1 116.5 115.1 113.0 113.5 120.9 117.7
Percentage chang e , quar ter on previous quarter
2007 Q1 1.9 2.6 0.4 3.2 3.7 1.3Q2 −0.7 −2.5 −0.7 −2.5 −4.2 1.0Q3 0.5 0.6 0.6 1.2 −0.8 0.4Q4 −0.2 −0.9 −1.0 −0.4 −1.5 0.6
2008 Q1 −2.1 −4.4 2.4 −7.5 −6.3 0.3Q2 5.3 9.6 4.0 12.5 10.7 1.4Q3 1.1 1.4 1.1 1.7 1.2 0.7Q4 1.8 2.6 1.9 2.2 4.4 1.2
2009 Q1 1.9 2.9 −0.2 2.4 7.5 0.9Q2 −0.2 −1.3 0.1 −4.1 2.4 1.1Q3 1.1 0.5 0.6 1.6 −1.6 1.4Q4 0.6 −0.2 0.2 −1.9 3.4 1.2
2010 Q1 3.6 4.5 3.1 6.3 2.7 2.9
Percentage chang e , quar ter on corresponding quarter of previous year
2007 Q1 3.5 1.2 −0.1 2.9 −0.4 5.6Q2 2.2 −0.7 −0.4 −0.9 −0.7 4.9Q3 2.3 0.5 0.1 2.1 −2.1 3.9Q4 1.5 −0.2 −0.7 1.4 −2.9 3.2
2008 Q1 −2.4 −7.1 1.3 −9.1 −12.3 2.2Q2 3.4 4.4 6.1 4.9 1.3 2.7Q3 4.1 5.3 6.7 5.4 3.4 3.1Q4 6.2 9.0 9.8 8.1 9.6 3.7
2009 Q1 10.5 17.3 7.0 19.7 25.7 4.4Q2 4.7 5.6 2.9 2.0 16.3 4.0Q3 4.7 4.6 2.4 1.9 13.0 4.7Q4 3.5 1.9 0.7 −2.2 12.0 4.8
2010 Q1 5.2 3.5 4.1 1.5 7.0 6.8

34
03.CN Household final consumption expenditureClothing and footwearCurrent prices - not seasonally adjusted £ million
Clothing and footwear
Clothing Footwear
Other articlesof clothing and Cleaning,
Clothing clothing repair and hire Shoes and other Repair and hireTotal Total materials Garments accessories of clothing Total footwear of footwear
COICOP 03 03.1 03.1.1 03.1.2 03.1.3 03.1.4 03.2 03.2.1 03.2.2
ADFP ADFQ ADUQ ADUR ADUS ADUT ADFR ADUV AWTX2005 43 532 37 529 398 34 900 1 529 702 6 003 5 940 632006 45 064 38 496 452 35 529 1 749 766 6 568 6 495 732007 46 327 39 618 457 36 365 1 942 854 6 709 6 633 762008 47 473 40 546 513 37 104 1 937 992 6 927 6 850 772009 47 600 41 086 622 37 278 2 182 1 004 6 514 6 432 82
Percentage chang e , year on previous year
2005 2.8 2.8 −15.1 2.0 31.5 11.3 2.6 2.8 −8.72006 3.5 2.6 13.6 1.8 14.4 9.1 9.4 9.3 15.92007 2.8 2.9 1.1 2.4 11.0 11.5 2.1 2.1 4.12008 2.5 2.3 12.3 2.0 −0.3 16.2 3.2 3.3 1.32009 0.3 1.3 21.2 0.5 12.6 1.2 −6.0 −6.1 6.5
Not seasonally adjusted
2007 Q1 9 691 8 295 75 7 555 452 213 1 396 1 376 20Q2 11 169 9 509 120 8 722 453 214 1 660 1 642 18Q3 11 271 9 580 165 8 812 389 214 1 691 1 671 20Q4 14 196 12 234 97 11 276 648 213 1 962 1 944 18
2008 Q1 9 983 8 539 60 7 828 445 206 1 444 1 425 19Q2 11 332 9 633 98 8 834 463 238 1 699 1 682 17Q3 11 562 9 797 195 8 956 371 275 1 765 1 745 20Q4 14 596 12 577 160 11 486 658 273 2 019 1 998 21
2009 Q1 10 118 8 721 121 7 876 462 262 1 397 1 377 20Q2 11 286 9 664 174 8 748 495 247 1 622 1 602 20Q3 11 431 9 841 182 8 929 486 244 1 590 1 571 19Q4 14 765 12 860 145 11 725 739 251 1 905 1 882 23
2010 Q1 10 851 9 411 131 8 489 540 251 1 440 1 416 24
Percentage chang e , quar ter on corresponding quarter of previous year
2007 Q1 3.1 2.7 −54.8 1.7 46.8 20.3 5.3 5.0 25.0Q2 4.4 4.5 −27.7 3.7 36.9 11.5 3.8 3.8 5.9Q3 4.3 4.2 120.0 4.1 −16.2 10.9 4.6 4.6 5.3Q4 0.3 0.9 115.6 0.4 0.3 4.4 −3.2 −3.1 −14.3
2008 Q1 3.0 2.9 −20.0 3.6 −1.5 −3.3 3.4 3.6 −5.0Q2 1.5 1.3 −18.3 1.3 2.2 11.2 2.3 2.4 −5.6Q3 2.6 2.3 18.2 1.6 −4.6 28.5 4.4 4.4 −Q4 2.8 2.8 64.9 1.9 1.5 28.2 2.9 2.8 16.7
2009 Q1 1.4 2.1 101.7 0.6 3.8 27.2 −3.3 −3.4 5.3Q2 −0.4 0.3 77.6 −1.0 6.9 3.8 −4.5 −4.8 17.6Q3 −1.1 0.4 −6.7 −0.3 31.0 −11.3 −9.9 −10.0 −5.0Q4 1.2 2.3 −9.4 2.1 12.3 −8.1 −5.6 −5.8 9.5
2010 Q1 7.2 7.9 8.3 7.8 16.9 −4.2 3.1 2.8 20.0

35
03.CS Household final consumption expenditureClothing and footwearCurrent prices - seasonally adjusted £ million
Clothing and footwear
Clothing Footwear
Other articlesof clothing and Cleaning,
Clothing clothing repair and hire Shoes and other Repair and hireTotal Total materials Garments accessories of clothing Total footwear of footwear
COICOP 03 03.1 03.1.1 03.1.2 03.1.3 03.1.4 03.2 03.2.1 03.2.2
ZAKZ ZALB XYDZ ZAVJ XYEA UVGC ZAVL ATKU AWUG2005 43 532 37 529 398 34 900 1 529 702 6 003 5 940 632006 45 064 38 496 452 35 529 1 749 766 6 568 6 495 732007 46 327 39 618 457 36 365 1 942 854 6 709 6 633 762008 47 473 40 546 513 37 104 1 937 992 6 927 6 850 772009 47 600 41 086 622 37 278 2 182 1 004 6 514 6 432 82
Percentage chang e , year on previous year
2005 2.8 2.8 −15.1 2.0 31.5 11.3 2.6 2.8 −8.72006 3.5 2.6 13.6 1.8 14.4 9.1 9.4 9.3 15.92007 2.8 2.9 1.1 2.4 11.0 11.5 2.1 2.1 4.12008 2.5 2.3 12.3 2.0 −0.3 16.2 3.2 3.3 1.32009 0.3 1.3 21.2 0.5 12.6 1.2 −6.0 −6.1 6.5
Seasonally adjusted
2007 Q1 11 344 9 694 97 8 872 512 213 1 650 1 630 20Q2 11 707 10 029 107 9 194 516 212 1 678 1 660 18Q3 11 735 10 039 135 9 258 431 215 1 696 1 676 20Q4 11 541 9 856 118 9 041 483 214 1 685 1 667 18
2008 Q1 11 676 9 969 91 9 167 504 207 1 707 1 689 18Q2 11 885 10 166 101 9 311 519 235 1 719 1 702 17Q3 11 986 10 218 144 9 380 419 275 1 768 1 748 20Q4 11 926 10 193 177 9 246 495 275 1 733 1 711 22
2009 Q1 11 861 10 206 170 9 253 520 263 1 655 1 636 19Q2 11 844 10 205 165 9 253 543 244 1 639 1 619 20Q3 11 867 10 280 143 9 343 552 242 1 587 1 568 19Q4 12 028 10 395 144 9 429 567 255 1 633 1 609 24
2010 Q1 12 619 10 916 158 9 917 589 252 1 703 1 680 23
Percentage chang e , quar ter on previous quarter
2007 Q1 −0.9 − 83.0 −1.0 7.3 4.4 −5.7 −5.7 −4.8Q2 3.2 3.5 10.3 3.6 0.8 −0.5 1.7 1.8 −10.0Q3 0.2 0.1 26.2 0.7 −16.5 1.4 1.1 1.0 11.1Q4 −1.7 −1.8 −12.6 −2.3 12.1 −0.5 −0.6 −0.5 −10.0
2008 Q1 1.2 1.1 −22.9 1.4 4.3 −3.3 1.3 1.3 −Q2 1.8 2.0 11.0 1.6 3.0 13.5 0.7 0.8 −5.6Q3 0.8 0.5 42.6 0.7 −19.3 17.0 2.9 2.7 17.6Q4 −0.5 −0.2 22.9 −1.4 18.1 − −2.0 −2.1 10.0
2009 Q1 −0.5 0.1 −4.0 0.1 5.1 −4.4 −4.5 −4.4 −13.6Q2 −0.1 − −2.9 − 4.4 −7.2 −1.0 −1.0 5.3Q3 0.2 0.7 −13.3 1.0 1.7 −0.8 −3.2 −3.2 −5.0Q4 1.4 1.1 0.7 0.9 2.7 5.4 2.9 2.6 26.3
2010 Q1 4.9 5.0 9.7 5.2 3.9 −1.2 4.3 4.4 −4.2
Percentage chang e , quar ter on corresponding quarter of previous year
2007 Q1 2.6 2.2 −52.0 1.4 43.0 20.3 4.8 4.6 25.0Q2 4.4 4.5 −15.7 3.4 32.0 11.6 3.6 3.6 5.9Q3 3.4 3.3 92.9 3.6 −17.6 10.3 4.4 4.4 5.3Q4 0.8 1.7 122.6 0.9 1.3 4.9 −3.7 −3.6 −14.3
2008 Q1 2.9 2.8 −6.2 3.3 −1.6 −2.8 3.5 3.6 −10.0Q2 1.5 1.4 −5.6 1.3 0.6 10.8 2.4 2.5 −5.6Q3 2.1 1.8 6.7 1.3 −2.8 27.9 4.2 4.3 −Q4 3.3 3.4 50.0 2.3 2.5 28.5 2.8 2.6 22.2
2009 Q1 1.6 2.4 86.8 0.9 3.2 27.1 −3.0 −3.1 5.6Q2 −0.3 0.4 63.4 −0.6 4.6 3.8 −4.7 −4.9 17.6Q3 −1.0 0.6 −0.7 −0.4 31.7 −12.0 −10.2 −10.3 −5.0Q4 0.9 2.0 −18.6 2.0 14.5 −7.3 −5.8 −6.0 9.1
2010 Q1 6.4 7.0 −7.1 7.2 13.3 −4.2 2.9 2.7 21.1

36
03.KN Household final consumption expenditureClothing and footwearChained volume measures, reference year 2006 - not seasonally adjusted £ million
Clothing and footwear
Clothing Footwear
Other articlesof clothing and Cleaning,
Clothing clothing repair and hire Shoes and other Repair and hireTotal Total materials Garments accessories of clothing Total footwear of footwear
COICOP 03 03.1 03.1.1 03.1.2 03.1.3 03.1.4 03.2 03.2.1 03.2.2
ADIW ADIX ADOI ADOJ ADOK ADOL ADIY ADOM AWUP2005 43 163 37 248 402 34 539 1 564 738 5 918 5 855 632006 45 064 38 496 452 35 529 1 749 766 6 568 6 495 732007 46 727 40 101 455 36 903 1 932 811 6 626 6 550 762008 49 763 42 888 507 39 548 1 926 907 6 875 6 798 772009 52 174 45 731 603 42 083 2 149 896 6 443 6 360 83
Percentage chang e , year on previous year
2005 5.2 5.2 −16.4 4.7 29.5 5.7 5.2 5.4 −11.32006 4.4 3.4 12.4 2.9 11.8 3.8 11.0 10.9 15.92007 3.7 4.2 0.7 3.9 10.5 5.9 0.9 0.8 4.12008 6.5 6.9 11.4 7.2 −0.3 11.8 3.8 3.8 1.32009 4.8 6.6 18.9 6.4 11.6 −1.2 −6.3 −6.4 7.8
Not seasonally adjusted
2007 Q1 9 912 8 507 75 7 773 452 207 1 405 1 385 20Q2 11 107 9 485 120 8 711 450 204 1 622 1 604 18Q3 11 468 9 797 165 9 041 390 201 1 671 1 651 20Q4 14 240 12 312 95 11 378 640 199 1 928 1 910 18
2008 Q1 10 394 8 940 60 8 238 449 193 1 454 1 435 19Q2 11 710 10 041 96 9 269 456 220 1 669 1 652 17Q3 12 207 10 470 194 9 657 370 249 1 737 1 717 20Q4 15 452 13 437 157 12 384 651 245 2 015 1 994 21
2009 Q1 11 246 9 814 118 9 001 459 236 1 432 1 411 21Q2 12 267 10 661 166 9 793 482 220 1 606 1 586 20Q3 12 640 11 079 180 10 202 480 217 1 561 1 542 19Q4 16 021 14 177 139 13 087 728 223 1 844 1 821 23
2010 Q1 11 872 10 460 122 9 587 530 221 1 412 1 388 24
Percentage chang e , quar ter on corresponding quarter of previous year
2007 Q1 4.0 3.9 −54.8 3.3 43.0 14.4 4.9 4.6 25.0Q2 4.5 5.0 −27.7 4.5 35.1 5.7 1.8 1.7 5.9Q3 4.9 5.2 120.0 5.3 −16.7 4.7 3.1 3.1 5.3Q4 1.9 2.9 111.1 2.6 1.3 −0.5 −4.3 −4.2 −14.3
2008 Q1 4.9 5.1 −20.0 6.0 −0.7 −6.8 3.5 3.6 −5.0Q2 5.4 5.9 −20.0 6.4 1.3 7.8 2.9 3.0 −5.6Q3 6.4 6.9 17.6 6.8 −5.1 23.9 3.9 4.0 −Q4 8.5 9.1 65.3 8.8 1.7 23.1 4.5 4.4 16.7
2009 Q1 8.2 9.8 96.7 9.3 2.2 22.3 −1.5 −1.7 10.5Q2 4.8 6.2 72.9 5.7 5.7 − −3.8 −4.0 17.6Q3 3.5 5.8 −7.2 5.6 29.7 −12.9 −10.1 −10.2 −5.0Q4 3.7 5.5 −11.5 5.7 11.8 −9.0 −8.5 −8.7 9.5
2010 Q1 5.6 6.6 3.4 6.5 15.5 −6.4 −1.4 −1.6 14.3

37
03.KS Household final consumption expenditureClothing and footwearChained volume measures, reference year 2006 - seasonally adjusted £ million
Clothing and footwear
Clothing Footwear
Other articlesof clothing and Cleaning,
Clothing clothing repair and hire Shoes and other Repair and hireTotal Total materials Garments accessories of clothing Total footwear of footwear
COICOP 03 03.1 03.1.1 03.1.2 03.1.3 03.1.4 03.2 03.2.1 03.2.2
ZALA ZALC XYJN ZAVK XYJO UWHI ZAVM ATQV AWUY2005 43 163 37 248 402 34 539 1 564 738 5 918 5 855 632006 45 064 38 496 452 35 529 1 749 766 6 568 6 495 732007 46 727 40 101 455 36 903 1 932 811 6 626 6 550 762008 49 763 42 888 507 39 548 1 926 907 6 875 6 798 772009 52 174 45 731 603 42 083 2 149 896 6 443 6 360 83
Percentage chang e , year on previous year
2005 5.2 5.2 −16.4 4.7 29.5 5.7 5.2 5.4 −11.32006 4.4 3.4 12.4 2.9 11.8 3.8 11.0 10.9 15.92007 3.7 4.2 0.7 3.9 10.5 5.9 0.9 0.8 4.12008 6.5 6.9 11.4 7.2 −0.3 11.8 3.8 3.8 1.32009 4.8 6.6 18.9 6.4 11.6 −1.2 −6.3 −6.4 7.8
Seasonally adjusted
2007 Q1 11 447 9 809 96 8 996 510 207 1 638 1 619 19Q2 11 708 10 060 105 9 244 509 202 1 648 1 630 18Q3 11 852 10 176 135 9 408 431 202 1 676 1 655 21Q4 11 720 10 056 119 9 255 482 200 1 664 1 646 18
2008 Q1 12 015 10 321 89 9 531 507 194 1 694 1 676 18Q2 12 385 10 685 97 9 862 508 218 1 700 1 683 17Q3 12 595 10 850 144 10 040 417 249 1 745 1 724 21Q4 12 768 11 032 177 10 115 494 246 1 736 1 715 21
2009 Q1 13 016 11 349 161 10 435 516 237 1 667 1 647 20Q2 12 955 11 324 154 10 428 525 217 1 631 1 611 20Q3 13 036 11 475 143 10 571 544 217 1 561 1 541 20Q4 13 167 11 583 145 10 649 564 225 1 584 1 561 23
2010 Q1 13 624 11 985 143 11 043 577 222 1 639 1 616 23
Percentage chang e , quar ter on previous quarter
2007 Q1 0.1 1.2 81.1 0.3 8.1 3.5 −6.2 −6.2 −5.0Q2 2.3 2.6 9.4 2.8 −0.2 −2.4 0.6 0.7 −5.3Q3 1.2 1.2 28.6 1.8 −15.3 − 1.7 1.5 16.7Q4 −1.1 −1.2 −11.9 −1.6 11.8 −1.0 −0.7 −0.5 −14.3
2008 Q1 2.5 2.6 −25.2 3.0 5.2 −3.0 1.8 1.8 −Q2 3.1 3.5 9.0 3.5 0.2 12.4 0.4 0.4 −5.6Q3 1.7 1.5 48.5 1.8 −17.9 14.2 2.6 2.4 23.5Q4 1.4 1.7 22.9 0.7 18.5 −1.2 −0.5 −0.5 −
2009 Q1 1.9 2.9 −9.0 3.2 4.5 −3.7 −4.0 −4.0 −4.8Q2 −0.5 −0.2 −4.3 −0.1 1.7 −8.4 −2.2 −2.2 −Q3 0.6 1.3 −7.1 1.4 3.6 − −4.3 −4.3 −Q4 1.0 0.9 1.4 0.7 3.7 3.7 1.5 1.3 15.0
2010 Q1 3.5 3.5 −1.4 3.7 2.3 −1.3 3.5 3.5 −
Percentage chang e , quar ter on corresponding quarter of previous year
2007 Q1 3.5 3.4 −52.5 3.0 40.1 14.4 4.2 4.0 18.8Q2 4.6 5.1 −17.3 4.3 30.5 5.8 1.5 1.5 5.9Q3 4.2 4.4 92.9 5.0 −17.6 4.1 3.0 3.0 5.0Q4 2.5 3.8 124.5 3.2 2.1 − −4.7 −4.6 −10.0
2008 Q1 5.0 5.2 −7.3 5.9 −0.6 −6.3 3.4 3.5 −5.3Q2 5.8 6.2 −7.6 6.7 −0.2 7.9 3.2 3.3 −5.6Q3 6.3 6.6 6.7 6.7 −3.2 23.3 4.1 4.2 −Q4 8.9 9.7 48.7 9.3 2.5 23.0 4.3 4.2 16.7
2009 Q1 8.3 10.0 80.9 9.5 1.8 22.2 −1.6 −1.7 11.1Q2 4.6 6.0 58.8 5.7 3.3 −0.5 −4.1 −4.3 17.6Q3 3.5 5.8 −0.7 5.3 30.5 −12.9 −10.5 −10.6 −4.8Q4 3.1 5.0 −18.1 5.3 14.2 −8.5 −8.8 −9.0 9.5
2010 Q1 4.7 5.6 −11.2 5.8 11.8 −6.3 −1.7 −1.9 15.0
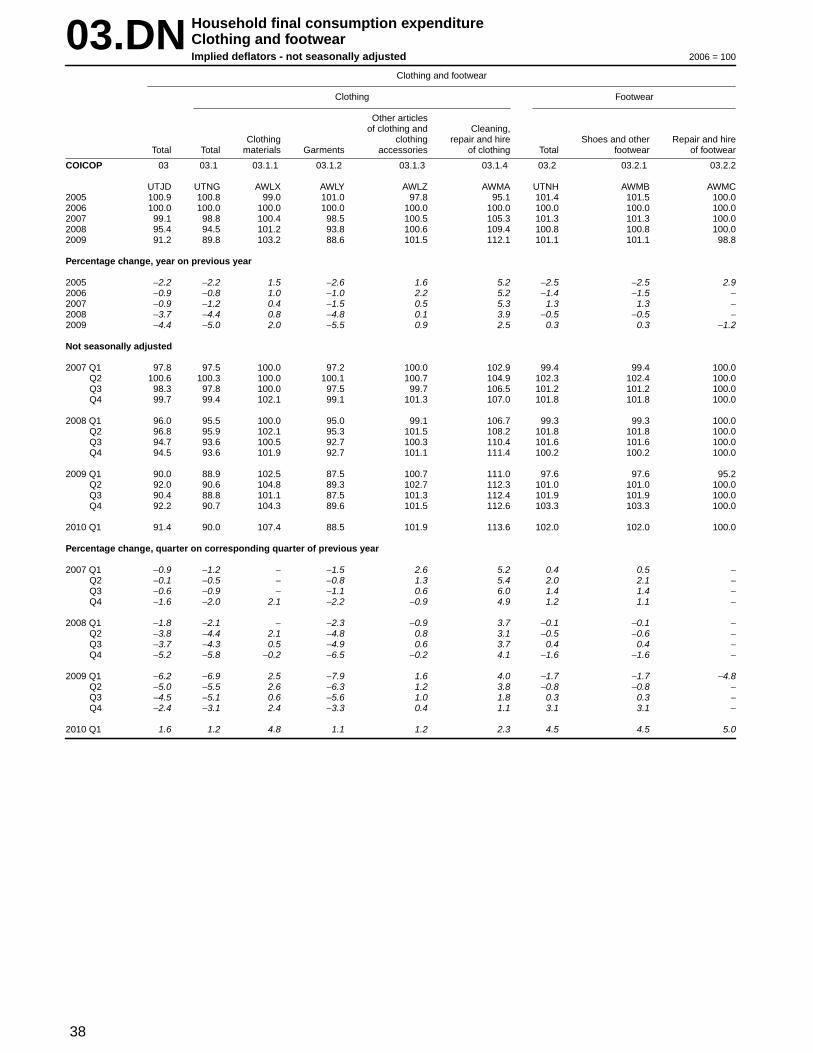
38
03.DN Household final consumption expenditureClothing and footwearImplied deflators - not seasonally adjusted 2006 = 100
Clothing and footwear
Clothing Footwear
Other articlesof clothing and Cleaning,
Clothing clothing repair and hire Shoes and other Repair and hireTotal Total materials Garments accessories of clothing Total footwear of footwear
COICOP 03 03.1 03.1.1 03.1.2 03.1.3 03.1.4 03.2 03.2.1 03.2.2
UTJD UTNG AWLX AWLY AWLZ AWMA UTNH AWMB AWMC2005 100.9 100.8 99.0 101.0 97.8 95.1 101.4 101.5 100.02006 100.0 100.0 100.0 100.0 100.0 100.0 100.0 100.0 100.02007 99.1 98.8 100.4 98.5 100.5 105.3 101.3 101.3 100.02008 95.4 94.5 101.2 93.8 100.6 109.4 100.8 100.8 100.02009 91.2 89.8 103.2 88.6 101.5 112.1 101.1 101.1 98.8
Percentage chang e , year on previous year
2005 −2.2 −2.2 1.5 −2.6 1.6 5.2 −2.5 −2.5 2.92006 −0.9 −0.8 1.0 −1.0 2.2 5.2 −1.4 −1.5 −2007 −0.9 −1.2 0.4 −1.5 0.5 5.3 1.3 1.3 −2008 −3.7 −4.4 0.8 −4.8 0.1 3.9 −0.5 −0.5 −2009 −4.4 −5.0 2.0 −5.5 0.9 2.5 0.3 0.3 −1.2
Not seasonally adjusted
2007 Q1 97.8 97.5 100.0 97.2 100.0 102.9 99.4 99.4 100.0Q2 100.6 100.3 100.0 100.1 100.7 104.9 102.3 102.4 100.0Q3 98.3 97.8 100.0 97.5 99.7 106.5 101.2 101.2 100.0Q4 99.7 99.4 102.1 99.1 101.3 107.0 101.8 101.8 100.0
2008 Q1 96.0 95.5 100.0 95.0 99.1 106.7 99.3 99.3 100.0Q2 96.8 95.9 102.1 95.3 101.5 108.2 101.8 101.8 100.0Q3 94.7 93.6 100.5 92.7 100.3 110.4 101.6 101.6 100.0Q4 94.5 93.6 101.9 92.7 101.1 111.4 100.2 100.2 100.0
2009 Q1 90.0 88.9 102.5 87.5 100.7 111.0 97.6 97.6 95.2Q2 92.0 90.6 104.8 89.3 102.7 112.3 101.0 101.0 100.0Q3 90.4 88.8 101.1 87.5 101.3 112.4 101.9 101.9 100.0Q4 92.2 90.7 104.3 89.6 101.5 112.6 103.3 103.3 100.0
2010 Q1 91.4 90.0 107.4 88.5 101.9 113.6 102.0 102.0 100.0
Percentage chang e , quar ter on corresponding quarter of previous year
2007 Q1 −0.9 −1.2 − −1.5 2.6 5.2 0.4 0.5 −Q2 −0.1 −0.5 − −0.8 1.3 5.4 2.0 2.1 −Q3 −0.6 −0.9 − −1.1 0.6 6.0 1.4 1.4 −Q4 −1.6 −2.0 2.1 −2.2 −0.9 4.9 1.2 1.1 −
2008 Q1 −1.8 −2.1 − −2.3 −0.9 3.7 −0.1 −0.1 −Q2 −3.8 −4.4 2.1 −4.8 0.8 3.1 −0.5 −0.6 −Q3 −3.7 −4.3 0.5 −4.9 0.6 3.7 0.4 0.4 −Q4 −5.2 −5.8 −0.2 −6.5 −0.2 4.1 −1.6 −1.6 −
2009 Q1 −6.2 −6.9 2.5 −7.9 1.6 4.0 −1.7 −1.7 −4.8Q2 −5.0 −5.5 2.6 −6.3 1.2 3.8 −0.8 −0.8 −Q3 −4.5 −5.1 0.6 −5.6 1.0 1.8 0.3 0.3 −Q4 −2.4 −3.1 2.4 −3.3 0.4 1.1 3.1 3.1 −
2010 Q1 1.6 1.2 4.8 1.1 1.2 2.3 4.5 4.5 5.0

39
03.DS Household final consumption expenditureClothing and footwearImplied deflators - seasonally adjusted 2006 = 100
Clothing and footwear
Clothing Footwear
Other articlesof clothing and Cleaning,
Clothing clothing repair and hire Shoes and other Repair and hireTotal Total materials Garments accessories of clothing Total footwear of footwear
COICOP 03 03.1 03.1.1 03.1.2 03.1.3 03.1.4 03.2 03.2.1 03.2.2
UTJQ UTOZ AWPP AWPQ AWPR AWPS UTPA AWPT AWPU2005 100.9 100.8 99.0 101.0 97.8 95.1 101.4 101.5 100.02006 100.0 100.0 100.0 100.0 100.0 100.0 100.0 100.0 100.02007 99.1 98.8 100.4 98.5 100.5 105.3 101.3 101.3 100.02008 95.4 94.5 101.2 93.8 100.6 109.4 100.8 100.8 100.02009 91.2 89.8 103.2 88.6 101.5 112.1 101.1 101.1 98.8
Percentage chang e , year on previous year
2005 −2.2 −2.2 1.5 −2.6 1.6 5.2 −2.5 −2.5 2.92006 −0.9 −0.8 1.0 −1.0 2.2 5.2 −1.4 −1.5 −2007 −0.9 −1.2 0.4 −1.5 0.5 5.3 1.3 1.3 −2008 −3.7 −4.4 0.8 −4.8 0.1 3.9 −0.5 −0.5 −2009 −4.4 −5.0 2.0 −5.5 0.9 2.5 0.3 0.3 −1.2
Seasonally adjusted
2007 Q1 99.1 98.8 101.0 98.6 100.4 102.9 100.7 100.7 105.3Q2 100.0 99.7 101.9 99.5 101.4 105.0 101.8 101.8 100.0Q3 99.0 98.7 100.0 98.4 100.0 106.4 101.2 101.3 95.2Q4 98.5 98.0 99.2 97.7 100.2 107.0 101.3 101.3 100.0
2008 Q1 97.2 96.6 102.2 96.2 99.4 106.7 100.8 100.8 100.0Q2 96.0 95.1 104.1 94.4 102.2 107.8 101.1 101.1 100.0Q3 95.2 94.2 100.0 93.4 100.5 110.4 101.3 101.4 95.2Q4 93.4 92.4 100.0 91.4 100.2 111.8 99.8 99.8 104.8
2009 Q1 91.1 89.9 105.6 88.7 100.8 111.0 99.3 99.3 95.0Q2 91.4 90.1 107.1 88.7 103.4 112.4 100.5 100.5 100.0Q3 91.0 89.6 100.0 88.4 101.5 111.5 101.7 101.8 95.0Q4 91.3 89.7 99.3 88.5 100.5 113.3 103.1 103.1 104.3
2010 Q1 92.6 91.1 110.5 89.8 102.1 113.5 103.9 104.0 100.0
Percentage chang e , quar ter on previous quarter
2007 Q1 −1.0 −1.2 1.0 −1.3 −0.7 0.9 0.5 0.5 0.3Q2 0.9 0.9 0.9 0.9 1.0 2.0 1.1 1.1 −5.0Q3 −1.0 −1.0 −1.9 −1.1 −1.4 1.3 −0.6 −0.5 −4.8Q4 −0.5 −0.7 −0.8 −0.7 0.2 0.6 0.1 − 5.0
2008 Q1 −1.3 −1.4 3.0 −1.5 −0.8 −0.3 −0.5 −0.5 −Q2 −1.2 −1.6 1.9 −1.9 2.8 1.0 0.3 0.3 −Q3 −0.8 −0.9 −3.9 −1.1 −1.7 2.4 0.2 0.3 −4.8Q4 −1.9 −1.9 − −2.1 −0.3 1.3 −1.5 −1.6 10.1
2009 Q1 −2.5 −2.7 5.6 −3.0 0.6 −0.7 −0.5 −0.5 −9.4Q2 0.3 0.2 1.4 − 2.6 1.3 1.2 1.2 5.3Q3 −0.4 −0.6 −6.6 −0.3 −1.8 −0.8 1.2 1.3 −5.0Q4 0.3 0.1 −0.7 0.1 −1.0 1.6 1.4 1.3 9.8
2010 Q1 1.4 1.6 11.3 1.5 1.6 0.2 0.8 0.9 −4.1
Percentage chang e , quar ter on corresponding quarter of previous year
2007 Q1 −0.9 −1.2 1.0 −1.5 2.0 5.2 0.6 0.6 5.3Q2 −0.2 −0.5 1.9 −0.7 1.1 5.5 2.0 2.0 −Q3 −0.8 −1.1 − −1.3 − 5.9 1.3 1.4 0.2Q4 −1.6 −2.0 −0.8 −2.2 −0.9 4.9 1.1 1.1 −4.8
2008 Q1 −1.9 −2.2 1.2 −2.4 −1.0 3.7 0.1 0.1 −5.0Q2 −4.0 −4.6 2.2 −5.1 0.8 2.7 −0.7 −0.7 −Q3 −3.8 −4.6 − −5.1 0.5 3.8 0.1 0.1 −Q4 −5.2 −5.7 0.8 −6.4 − 4.5 −1.5 −1.5 4.8
2009 Q1 −6.3 −6.9 3.3 −7.8 1.4 4.0 −1.5 −1.5 −5.0Q2 −4.8 −5.3 2.9 −6.0 1.2 4.3 −0.6 −0.6 −Q3 −4.4 −4.9 − −5.4 1.0 1.0 0.4 0.4 −0.2Q4 −2.2 −2.9 −0.7 −3.2 0.3 1.3 3.3 3.3 −0.5
2010 Q1 1.6 1.3 4.6 1.2 1.3 2.3 4.6 4.7 5.3

40
04.CN Household final consumption expenditureHousing, water, electricity, gas and other fuelsCurrent prices - not seasonally adjusted £ million
Housing, water, electr icity, gas and other fuels
Actual rentals for housing Imputed rentals for housing Maintenance and repair of the dwelling
ImputedActual rentals of
rentals paid Other actual owner-occupi- Other imputedTotal Total by tenants rentals Total ers rentals Total Materials Services
COICOP 04 04.1 04.1.1 04.1.2 04.2 04.2.1 04.2.2 04.3 04.3.1 04.3.2
ADFS ADFT ADUX ADUY ADFU CDDF ADVB ADFV ATKH AWTY2005 149 309 29 547 29 547 − 77 339 74 299 3 040 14 509 7 718 6 7912006 160 985 32 716 32 716 − 80 668 77 814 2 854 14 221 6 829 7 3922007 171 959 35 881 35 881 − 86 236 83 286 2 950 14 411 6 793 7 6182008 186 958 38 566 38 566 − 91 444 88 491 2 953 14 884 7 139 7 7452009 194 245 41 112 41 112 − 96 667 93 254 3 413 14 921 7 326 7 595
Percentage chang e , year on previous year
2005 7.3 3.1 3.1 6.2 5.5 25.7 1.9 −2.9 8.02006 7.8 10.7 10.7 4.3 4.7 −6.1 −2.0 −11.5 8.82007 6.8 9.7 9.7 6.9 7.0 3.4 1.3 −0.5 3.12008 8.7 7.5 7.5 6.0 6.2 0.1 3.3 5.1 1.72009 3.9 6.6 6.6 5.7 5.4 15.6 0.2 2.6 −1.9
Not seasonally adjusted
2007 Q1 44 672 8 772 8 772 − 21 057 20 289 768 3 714 1 625 2 089Q2 41 035 8 920 8 920 − 21 349 20 564 785 3 844 1 874 1 970Q3 40 358 9 068 9 068 − 21 801 21 057 744 3 239 1 655 1 584Q4 45 894 9 121 9 121 − 22 029 21 376 653 3 614 1 639 1 975
2008 Q1 46 546 9 265 9 265 − 22 143 21 492 651 3 484 1 683 1 801Q2 43 856 9 444 9 444 − 22 409 21 713 696 3 792 1 936 1 856Q3 44 114 9 718 9 718 − 23 070 22 297 773 3 845 1 784 2 061Q4 52 442 10 139 10 139 − 23 822 22 989 833 3 763 1 736 2 027
2009 Q1 52 400 10 128 10 128 − 23 847 23 001 846 3 821 1 727 2 094Q2 46 225 10 245 10 245 − 23 902 23 082 820 3 896 1 985 1 911Q3 44 963 10 320 10 320 − 24 169 23 327 842 3 523 1 805 1 718Q4 50 657 10 419 10 419 − 24 749 23 844 905 3 681 1 809 1 872
2010 Q1 54 306 10 709 10 709 − 25 662 24 803 859 3 889 1 820 2 069
Percentage chang e , quar ter on corresponding quarter of previous year
2007 Q1 9.3 9.6 9.6 6.6 6.1 21.3 14.9 7.3 21.6Q2 6.5 10.7 10.7 7.3 6.8 22.3 7.3 −0.3 15.8Q3 5.6 11.3 11.3 8.0 8.4 −3.0 −13.0 −4.7 −20.2Q4 5.8 7.2 7.2 5.7 6.7 −19.6 −1.9 −3.5 −0.6
2008 Q1 4.2 5.6 5.6 5.2 5.9 −15.2 −6.2 3.6 −13.8Q2 6.9 5.9 5.9 5.0 5.6 −11.3 −1.4 3.3 −5.8Q3 9.3 7.2 7.2 5.8 5.9 3.9 18.7 7.8 30.1Q4 14.3 11.2 11.2 8.1 7.5 27.6 4.1 5.9 2.6
2009 Q1 12.6 9.3 9.3 7.7 7.0 30.0 9.7 2.6 16.3Q2 5.4 8.5 8.5 6.7 6.3 17.8 2.7 2.5 3.0Q3 1.9 6.2 6.2 4.8 4.6 8.9 −8.4 1.2 −16.6Q4 −3.4 2.8 2.8 3.9 3.7 8.6 −2.2 4.2 −7.6
2010 Q1 3.6 5.7 5.7 7.6 7.8 1.5 1.8 5.4 −1.2

41
04.CN Household final consumption expenditureHousing, water, electricity, gas and other fuelsCurrent prices - not seasonally adjustedcontinued £ million
Housing, water, electr icity, gas and other fuels (continued)
Water and miscellaneous services Electricity, gas and other fuels
Refuse Sewerage OtherTotal Water supply collection collection ser vices Total Electricity Gas Liquid fuels Solid fuels Heat energy
COICOP 04.4 04.4.1 04.4.2 04.4.3 04.4.4 04.5 04.5.1 04.5.2 04.5.3 04.5.4 04.5.5
ADFW ADVE UUOX ADV G UUOY ADFX CDDL ADVI ADVJ ADVK ADVL2005 6 428 2 991 103 3 334 − 21 486 9 815 10 698 739 234 −2006 6 899 3 220 146 3 533 − 26 481 11 834 13 356 1 066 225 −2007 7 637 3 631 106 3 900 − 27 794 11 937 14 596 1 033 228 −2008 8 059 3 858 117 4 084 − 34 005 14 412 17 901 1 446 246 −2009 8 049 3 792 107 4 150 − 33 496 14 462 17 601 1 128 305 −
Percentage chang e , year on previous year
2005 11.3 8.1 13.2 14.4 22.0 13.8 34.9 −1.6 −23.52006 7.3 7.7 41.7 6.0 23.2 20.6 24.8 44.2 −3.82007 10.7 12.8 −27.4 10.4 5.0 0.9 9.3 −3.1 1.32008 5.5 6.3 10.4 4.7 22.3 20.7 22.6 40.0 7.92009 −0.1 −1.7 −8.5 1.6 −1.5 0.3 −1.7 −22.0 24.0
Not seasonally adjusted
2007 Q1 1 778 838 38 902 − 9 351 3 482 5 491 303 75 −Q2 1 922 917 27 978 − 5 000 2 587 2 188 176 49 −Q3 1 953 930 20 1 003 − 4 297 2 670 1 417 161 49 −Q4 1 984 946 21 1 017 − 9 146 3 198 5 500 393 55 −
2008 Q1 1 961 940 27 994 − 9 693 3 796 5 411 443 43 −Q2 2 070 989 33 1 048 − 6 141 3 161 2 588 347 45 −Q3 2 034 974 31 1 029 − 5 447 3 108 2 057 224 58 −Q4 1 994 955 26 1 013 − 12 724 4 347 7 845 432 100 −
2009 Q1 1 968 934 28 1 006 − 12 636 4 425 7 772 356 83 −Q2 2 026 960 24 1 042 − 6 156 3 238 2 644 202 72 −Q3 2 022 950 26 1 046 − 4 929 3 046 1 630 175 78 −Q4 2 033 948 29 1 056 − 9 775 3 753 5 555 395 72 −
2010 Q1 2 044 955 28 1 061 − 12 002 4 159 7 227 529 87 −
Percentage chang e , quar ter on corresponding quarter of previous year
2007 Q1 7.8 8.7 100.0 5.0 13.7 10.2 18.0 −10.4 10.3Q2 10.3 12.8 −20.6 9.2 −4.7 −2.8 −4.3 −28.7 −7.5Q3 11.5 14.0 −55.6 12.6 −2.4 3.0 −10.0 −13.0 −3.9Q4 13.0 15.4 −56.2 14.7 6.2 −6.5 13.6 32.8 3.8
2008 Q1 10.3 12.2 −28.9 10.2 3.7 9.0 −1.5 46.2 −42.7Q2 7.7 7.9 22.2 7.2 22.8 22.2 18.3 97.2 −8.2Q3 4.1 4.7 55.0 2.6 26.8 16.4 45.2 39.1 18.4Q4 0.5 1.0 23.8 −0.4 39.1 35.9 42.6 9.9 81.8
2009 Q1 0.4 −0.6 3.7 1.2 30.4 16.6 43.6 −19.6 93.0Q2 −2.1 −2.9 −27.3 −0.6 0.2 2.4 2.2 −41.8 60.0Q3 −0.6 −2.5 −16.1 1.7 −9.5 −2.0 −20.8 −21.9 34.5Q4 2.0 −0.7 11.5 4.2 −23.2 −13.7 −29.2 −8.6 −28.0
2010 Q1 3.9 2.2 − 5.5 −5.0 −6.0 −7.0 48.6 4.8

42
04.CS Household final consumption expenditureHousing, water, electricity, gas and other fuelsCurrent prices - seasonally adjusted £ million
Housing, water, electr icity, gas and other fuels
Actual rentals for housing Imputed rentals for housing Maintenance and repair of the dwelling
ImputedActual rentals of
rentals paid Other actual owner-occupi- Other imputedTotal Total by tenants rentals Total ers rentals Total Materials Services
COICOP 04 04.1 04.1.1 04.1.2 04.2 04.2.1 04.2.2 04.3 04.3.1 04.3.2
ZAVN ZAVP BMBT UVGD GBFJ CCSS GBFM ZAVR ATOB AWUH2005 149 309 29 547 29 547 − 77 339 74 299 3 040 14 509 7 718 6 7912006 160 985 32 716 32 716 − 80 668 77 814 2 854 14 221 6 829 7 3922007 171 959 35 881 35 881 − 86 236 83 286 2 950 14 411 6 793 7 6182008 186 958 38 566 38 566 − 91 444 88 491 2 953 14 884 7 139 7 7452009 194 245 41 112 41 112 − 96 667 93 254 3 413 14 921 7 326 7 595
Percentage chang e , year on previous year
2005 7.3 3.1 3.1 6.2 5.5 25.7 1.9 −2.9 8.02006 7.8 10.7 10.7 4.3 4.7 −6.1 −2.0 −11.5 8.82007 6.8 9.7 9.7 6.9 7.0 3.4 1.3 −0.5 3.12008 8.7 7.5 7.5 6.0 6.2 0.1 3.3 5.1 1.72009 3.9 6.6 6.6 5.7 5.4 15.6 0.2 2.6 −1.9
Seasonally adjusted
2007 Q1 42 245 8 772 8 772 − 21 057 20 289 768 3 770 1 713 2 057Q2 42 484 8 920 8 920 − 21 349 20 564 785 3 752 1 710 2 042Q3 43 237 9 068 9 068 − 21 801 21 057 744 3 215 1 665 1 550Q4 43 993 9 121 9 121 − 22 029 21 376 653 3 674 1 705 1 969
2008 Q1 44 020 9 265 9 265 − 22 143 21 492 651 3 536 1 763 1 773Q2 45 658 9 444 9 444 − 22 409 21 713 696 3 686 1 767 1 919Q3 47 940 9 718 9 718 − 23 070 22 297 773 3 829 1 801 2 028Q4 49 340 10 139 10 139 − 23 822 22 989 833 3 833 1 808 2 025
2009 Q1 48 915 10 128 10 128 − 23 847 23 001 846 3 862 1 805 2 057Q2 48 265 10 245 10 245 − 23 902 23 082 820 3 785 1 813 1 972Q3 48 396 10 320 10 320 − 24 169 23 327 842 3 521 1 828 1 693Q4 48 669 10 419 10 419 − 24 749 23 844 905 3 753 1 880 1 873
2010 Q1 51 032 10 709 10 709 − 25 662 24 803 859 3 913 1 902 2 011
Percentage chang e , quar ter on previous quarter
2007 Q1 1.3 3.1 3.1 1.0 1.3 −5.4 0.8 −3.0 4.3Q2 0.6 1.7 1.7 1.4 1.4 2.2 −0.5 −0.2 −0.7Q3 1.8 1.7 1.7 2.1 2.4 −5.2 −14.3 −2.6 −24.1Q4 1.7 0.6 0.6 1.0 1.5 −12.2 14.3 2.4 27.0
2008 Q1 0.1 1.6 1.6 0.5 0.5 −0.3 −3.8 3.4 −10.0Q2 3.7 1.9 1.9 1.2 1.0 6.9 4.2 0.2 8.2Q3 5.0 2.9 2.9 2.9 2.7 11.1 3.9 1.9 5.7Q4 2.9 4.3 4.3 3.3 3.1 7.8 0.1 0.4 −0.1
2009 Q1 −0.9 −0.1 −0.1 0.1 0.1 1.6 0.8 −0.2 1.6Q2 −1.3 1.2 1.2 0.2 0.4 −3.1 −2.0 0.4 −4.1Q3 0.3 0.7 0.7 1.1 1.1 2.7 −7.0 0.8 −14.1Q4 0.6 1.0 1.0 2.4 2.2 7.5 6.6 2.8 10.6
2010 Q1 4.9 2.8 2.8 3.7 4.0 −5.1 4.3 1.2 7.4
Percentage chang e , quar ter on corresponding quarter of previous year
2007 Q1 9.5 9.6 9.6 6.6 6.1 21.3 14.7 7.1 22.0Q2 6.9 10.7 10.7 7.3 6.8 22.3 7.0 −0.6 14.5Q3 5.5 11.3 11.3 8.0 8.4 −3.0 −12.9 −4.4 −20.5Q4 5.5 7.2 7.2 5.7 6.7 −19.6 −1.7 −3.5 −0.2
2008 Q1 4.2 5.6 5.6 5.2 5.9 −15.2 −6.2 2.9 −13.8Q2 7.5 5.9 5.9 5.0 5.6 −11.3 −1.8 3.3 −6.0Q3 10.9 7.2 7.2 5.8 5.9 3.9 19.1 8.2 30.8Q4 12.2 11.2 11.2 8.1 7.5 27.6 4.3 6.0 2.8
2009 Q1 11.1 9.3 9.3 7.7 7.0 30.0 9.2 2.4 16.0Q2 5.7 8.5 8.5 6.7 6.3 17.8 2.7 2.6 2.8Q3 1.0 6.2 6.2 4.8 4.6 8.9 −8.0 1.5 −16.5Q4 −1.4 2.8 2.8 3.9 3.7 8.6 −2.1 4.0 −7.5
2010 Q1 4.3 5.7 5.7 7.6 7.8 1.5 1.3 5.4 −2.2
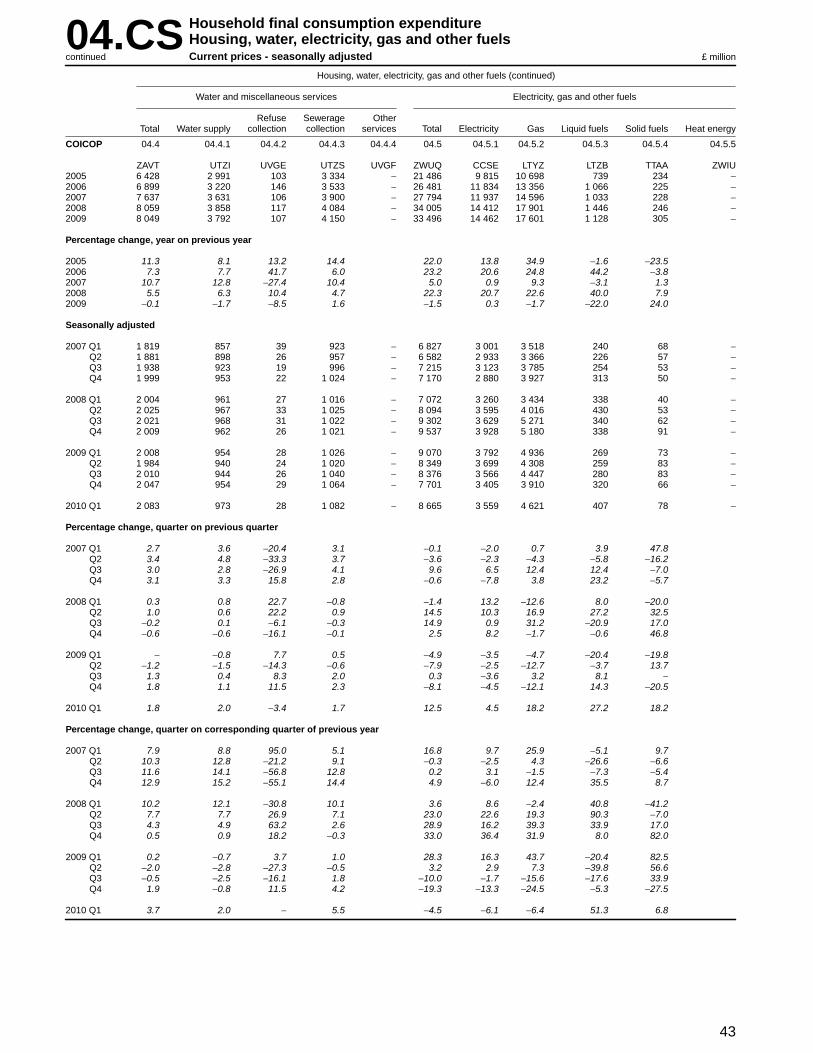
43
04.CS Household final consumption expenditureHousing, water, electricity, gas and other fuelsCurrent prices - seasonally adjustedcontinued £ million
Housing, water, electr icity, gas and other fuels (continued)
Water and miscellaneous services Electricity, gas and other fuels
Refuse Sewerage OtherTotal Water supply collection collection ser vices Total Electricity Gas Liquid fuels Solid fuels Heat energy
COICOP 04.4 04.4.1 04.4.2 04.4.3 04.4.4 04.5 04.5.1 04.5.2 04.5.3 04.5.4 04.5.5
ZAVT UTZI UVGE UTZS UVGF ZWUQ CCSE LTYZ LTZB TTAA ZWIU2005 6 428 2 991 103 3 334 − 21 486 9 815 10 698 739 234 −2006 6 899 3 220 146 3 533 − 26 481 11 834 13 356 1 066 225 −2007 7 637 3 631 106 3 900 − 27 794 11 937 14 596 1 033 228 −2008 8 059 3 858 117 4 084 − 34 005 14 412 17 901 1 446 246 −2009 8 049 3 792 107 4 150 − 33 496 14 462 17 601 1 128 305 −
Percentage chang e , year on previous year
2005 11.3 8.1 13.2 14.4 22.0 13.8 34.9 −1.6 −23.52006 7.3 7.7 41.7 6.0 23.2 20.6 24.8 44.2 −3.82007 10.7 12.8 −27.4 10.4 5.0 0.9 9.3 −3.1 1.32008 5.5 6.3 10.4 4.7 22.3 20.7 22.6 40.0 7.92009 −0.1 −1.7 −8.5 1.6 −1.5 0.3 −1.7 −22.0 24.0
Seasonally adjusted
2007 Q1 1 819 857 39 923 − 6 827 3 001 3 518 240 68 −Q2 1 881 898 26 957 − 6 582 2 933 3 366 226 57 −Q3 1 938 923 19 996 − 7 215 3 123 3 785 254 53 −Q4 1 999 953 22 1 024 − 7 170 2 880 3 927 313 50 −
2008 Q1 2 004 961 27 1 016 − 7 072 3 260 3 434 338 40 −Q2 2 025 967 33 1 025 − 8 094 3 595 4 016 430 53 −Q3 2 021 968 31 1 022 − 9 302 3 629 5 271 340 62 −Q4 2 009 962 26 1 021 − 9 537 3 928 5 180 338 91 −
2009 Q1 2 008 954 28 1 026 − 9 070 3 792 4 936 269 73 −Q2 1 984 940 24 1 020 − 8 349 3 699 4 308 259 83 −Q3 2 010 944 26 1 040 − 8 376 3 566 4 447 280 83 −Q4 2 047 954 29 1 064 − 7 701 3 405 3 910 320 66 −
2010 Q1 2 083 973 28 1 082 − 8 665 3 559 4 621 407 78 −
Percentage chang e , quar ter on previous quarter
2007 Q1 2.7 3.6 −20.4 3.1 −0.1 −2.0 0.7 3.9 47.8Q2 3.4 4.8 −33.3 3.7 −3.6 −2.3 −4.3 −5.8 −16.2Q3 3.0 2.8 −26.9 4.1 9.6 6.5 12.4 12.4 −7.0Q4 3.1 3.3 15.8 2.8 −0.6 −7.8 3.8 23.2 −5.7
2008 Q1 0.3 0.8 22.7 −0.8 −1.4 13.2 −12.6 8.0 −20.0Q2 1.0 0.6 22.2 0.9 14.5 10.3 16.9 27.2 32.5Q3 −0.2 0.1 −6.1 −0.3 14.9 0.9 31.2 −20.9 17.0Q4 −0.6 −0.6 −16.1 −0.1 2.5 8.2 −1.7 −0.6 46.8
2009 Q1 − −0.8 7.7 0.5 −4.9 −3.5 −4.7 −20.4 −19.8Q2 −1.2 −1.5 −14.3 −0.6 −7.9 −2.5 −12.7 −3.7 13.7Q3 1.3 0.4 8.3 2.0 0.3 −3.6 3.2 8.1 −Q4 1.8 1.1 11.5 2.3 −8.1 −4.5 −12.1 14.3 −20.5
2010 Q1 1.8 2.0 −3.4 1.7 12.5 4.5 18.2 27.2 18.2
Percentage chang e , quar ter on corresponding quarter of previous year
2007 Q1 7.9 8.8 95.0 5.1 16.8 9.7 25.9 −5.1 9.7Q2 10.3 12.8 −21.2 9.1 −0.3 −2.5 4.3 −26.6 −6.6Q3 11.6 14.1 −56.8 12.8 0.2 3.1 −1.5 −7.3 −5.4Q4 12.9 15.2 −55.1 14.4 4.9 −6.0 12.4 35.5 8.7
2008 Q1 10.2 12.1 −30.8 10.1 3.6 8.6 −2.4 40.8 −41.2Q2 7.7 7.7 26.9 7.1 23.0 22.6 19.3 90.3 −7.0Q3 4.3 4.9 63.2 2.6 28.9 16.2 39.3 33.9 17.0Q4 0.5 0.9 18.2 −0.3 33.0 36.4 31.9 8.0 82.0
2009 Q1 0.2 −0.7 3.7 1.0 28.3 16.3 43.7 −20.4 82.5Q2 −2.0 −2.8 −27.3 −0.5 3.2 2.9 7.3 −39.8 56.6Q3 −0.5 −2.5 −16.1 1.8 −10.0 −1.7 −15.6 −17.6 33.9Q4 1.9 −0.8 11.5 4.2 −19.3 −13.3 −24.5 −5.3 −27.5
2010 Q1 3.7 2.0 − 5.5 −4.5 −6.1 −6.4 51.3 6.8
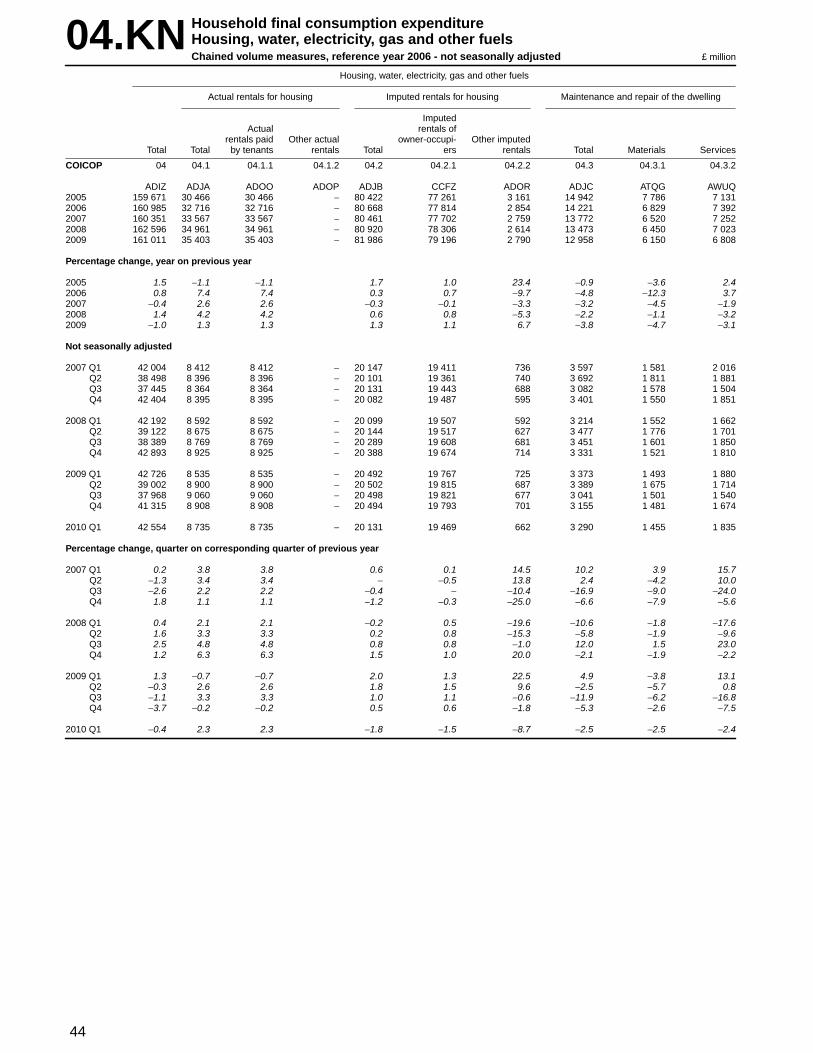
44
04.KN Household final consumption expenditureHousing, water, electricity, gas and other fuelsChained volume measures, reference year 2006 - not seasonally adjusted £ million
Housing, water, electr icity, gas and other fuels
Actual rentals for housing Imputed rentals for housing Maintenance and repair of the dwelling
ImputedActual rentals of
rentals paid Other actual owner-occupi- Other imputedTotal Total by tenants rentals Total ers rentals Total Materials Services
COICOP 04 04.1 04.1.1 04.1.2 04.2 04.2.1 04.2.2 04.3 04.3.1 04.3.2
ADIZ ADJA ADOO ADOP ADJB CCFZ ADOR ADJC ATQG AWUQ2005 159 671 30 466 30 466 − 80 422 77 261 3 161 14 942 7 786 7 1312006 160 985 32 716 32 716 − 80 668 77 814 2 854 14 221 6 829 7 3922007 160 351 33 567 33 567 − 80 461 77 702 2 759 13 772 6 520 7 2522008 162 596 34 961 34 961 − 80 920 78 306 2 614 13 473 6 450 7 0232009 161 011 35 403 35 403 − 81 986 79 196 2 790 12 958 6 150 6 808
Percentage chang e , year on previous year
2005 1.5 −1.1 −1.1 1.7 1.0 23.4 −0.9 −3.6 2.42006 0.8 7.4 7.4 0.3 0.7 −9.7 −4.8 −12.3 3.72007 −0.4 2.6 2.6 −0.3 −0.1 −3.3 −3.2 −4.5 −1.92008 1.4 4.2 4.2 0.6 0.8 −5.3 −2.2 −1.1 −3.22009 −1.0 1.3 1.3 1.3 1.1 6.7 −3.8 −4.7 −3.1
Not seasonally adjusted
2007 Q1 42 004 8 412 8 412 − 20 147 19 411 736 3 597 1 581 2 016Q2 38 498 8 396 8 396 − 20 101 19 361 740 3 692 1 811 1 881Q3 37 445 8 364 8 364 − 20 131 19 443 688 3 082 1 578 1 504Q4 42 404 8 395 8 395 − 20 082 19 487 595 3 401 1 550 1 851
2008 Q1 42 192 8 592 8 592 − 20 099 19 507 592 3 214 1 552 1 662Q2 39 122 8 675 8 675 − 20 144 19 517 627 3 477 1 776 1 701Q3 38 389 8 769 8 769 − 20 289 19 608 681 3 451 1 601 1 850Q4 42 893 8 925 8 925 − 20 388 19 674 714 3 331 1 521 1 810
2009 Q1 42 726 8 535 8 535 − 20 492 19 767 725 3 373 1 493 1 880Q2 39 002 8 900 8 900 − 20 502 19 815 687 3 389 1 675 1 714Q3 37 968 9 060 9 060 − 20 498 19 821 677 3 041 1 501 1 540Q4 41 315 8 908 8 908 − 20 494 19 793 701 3 155 1 481 1 674
2010 Q1 42 554 8 735 8 735 − 20 131 19 469 662 3 290 1 455 1 835
Percentage chang e , quar ter on corresponding quarter of previous year
2007 Q1 0.2 3.8 3.8 0.6 0.1 14.5 10.2 3.9 15.7Q2 −1.3 3.4 3.4 − −0.5 13.8 2.4 −4.2 10.0Q3 −2.6 2.2 2.2 −0.4 − −10.4 −16.9 −9.0 −24.0Q4 1.8 1.1 1.1 −1.2 −0.3 −25.0 −6.6 −7.9 −5.6
2008 Q1 0.4 2.1 2.1 −0.2 0.5 −19.6 −10.6 −1.8 −17.6Q2 1.6 3.3 3.3 0.2 0.8 −15.3 −5.8 −1.9 −9.6Q3 2.5 4.8 4.8 0.8 0.8 −1.0 12.0 1.5 23.0Q4 1.2 6.3 6.3 1.5 1.0 20.0 −2.1 −1.9 −2.2
2009 Q1 1.3 −0.7 −0.7 2.0 1.3 22.5 4.9 −3.8 13.1Q2 −0.3 2.6 2.6 1.8 1.5 9.6 −2.5 −5.7 0.8Q3 −1.1 3.3 3.3 1.0 1.1 −0.6 −11.9 −6.2 −16.8Q4 −3.7 −0.2 −0.2 0.5 0.6 −1.8 −5.3 −2.6 −7.5
2010 Q1 −0.4 2.3 2.3 −1.8 −1.5 −8.7 −2.5 −2.5 −2.4

45
04.KN Household final consumption expenditureHousing, water, electricity, gas and other fuelsChained volume measures, reference year 2006 - not seasonally adjustedcontinued £ million
Housing, water, electr icity, gas and other fuels (continued)
Water and miscellaneous services Electricity, gas and other fuels
Refuse Sewerage OtherTotal Water supply collection collection ser vices Total Electricity Gas Liquid fuels Solid fuels Heat energy
COICOP 04.4 04.4.1 04.4.2 04.4.3 04.4.4 04.5 04.5.1 04.5.2 04.5.3 04.5.4 04.5.5
ADJD ADOU UVUC ADOW UVUD ADJE CCGF ADOZ ADPA ADPB ADPC2005 6 866 3 196 110 3 559 − 26 719 11 855 13 762 871 251 −2006 6 899 3 220 146 3 533 − 26 481 11 834 13 356 1 066 225 −2007 7 185 3 415 102 3 668 − 25 366 10 989 13 194 970 213 −2008 7 124 3 409 106 3 609 − 26 118 11 494 13 438 992 194 −2009 6 769 3 187 93 3 489 − 23 895 10 992 11 664 1 024 215 −
Percentage chang e , year on previous year
2005 1.4 −1.7 8.9 4.0 7.6 2.8 17.4 −26.0 −29.32006 0.5 0.8 32.7 −0.7 −0.9 −0.2 −3.0 22.4 −10.42007 4.1 6.1 −30.1 3.8 −4.2 −7.1 −1.2 −9.0 −5.32008 −0.8 −0.2 3.9 −1.6 3.0 4.6 1.8 2.3 −8.92009 −5.0 −6.5 −12.3 −3.3 −8.5 −4.4 −13.2 3.2 10.8
Not seasonally adjusted
2007 Q1 1 754 827 37 890 − 8 094 3 110 4 589 324 71 −Q2 1 782 850 26 906 − 4 527 2 358 1 949 173 47 −Q3 1 811 862 19 930 − 4 057 2 508 1 350 153 46 −Q4 1 838 876 20 942 − 8 688 3 013 5 306 320 49 −
2008 Q1 1 817 871 25 921 − 8 470 3 325 4 782 323 40 −Q2 1 801 860 30 911 − 5 025 2 626 2 159 201 39 −Q3 1 770 847 28 895 − 4 110 2 426 1 508 129 47 −Q4 1 736 831 23 882 − 8 513 3 117 4 989 339 68 −
2009 Q1 1 713 813 25 875 − 8 613 3 187 5 024 344 58 −Q2 1 685 798 21 866 − 4 526 2 502 1 780 193 51 −Q3 1 682 789 23 870 − 3 687 2 372 1 102 157 56 −Q4 1 689 787 24 878 − 7 069 2 931 3 758 330 50 −
2010 Q1 1 699 793 24 882 − 8 699 3 249 4 985 402 63 −
Percentage chang e , quar ter on corresponding quarter of previous year
2007 Q1 2.2 3.0 85.0 −0.4 −12.3 −11.8 −14.2 −7.2 2.9Q2 3.5 5.9 −23.5 2.5 −14.7 −12.4 −15.2 −28.8 −11.3Q3 4.7 7.1 −57.8 5.8 −4.6 0.5 −9.5 −8.9 −11.5Q4 6.1 8.3 −57.4 7.5 12.9 −3.5 25.7 4.6 −3.9
2008 Q1 3.6 5.3 −32.4 3.5 4.6 6.9 4.2 −0.3 −43.7Q2 1.1 1.2 15.4 0.6 11.0 11.4 10.8 16.2 −17.0Q3 −2.3 −1.7 47.4 −3.8 1.3 −3.3 11.7 −15.7 2.2Q4 −5.5 −5.1 15.0 −6.4 −2.0 3.5 −6.0 5.9 38.8
2009 Q1 −5.7 −6.7 − −5.0 1.7 −4.2 5.1 6.5 45.0Q2 −6.4 −7.2 −30.0 −4.9 −9.9 −4.7 −17.6 −4.0 30.8Q3 −5.0 −6.8 −17.9 −2.8 −10.3 −2.2 −26.9 21.7 19.1Q4 −2.7 −5.3 4.3 −0.5 −17.0 −6.0 −24.7 −2.7 −26.5
2010 Q1 −0.8 −2.5 −4.0 0.8 1.0 1.9 −0.8 16.9 8.6
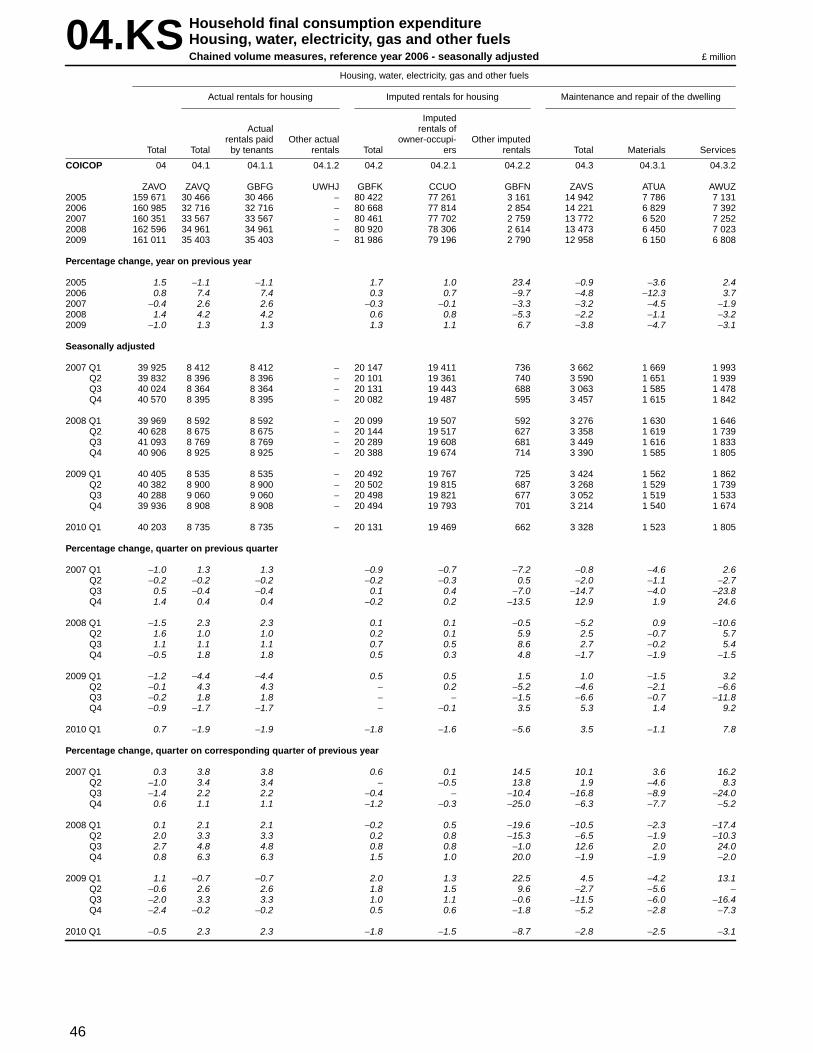
46
04.KS Household final consumption expenditureHousing, water, electricity, gas and other fuelsChained volume measures, reference year 2006 - seasonally adjusted £ million
Housing, water, electr icity, gas and other fuels
Actual rentals for housing Imputed rentals for housing Maintenance and repair of the dwelling
ImputedActual rentals of
rentals paid Other actual owner-occupi- Other imputedTotal Total by tenants rentals Total ers rentals Total Materials Services
COICOP 04 04.1 04.1.1 04.1.2 04.2 04.2.1 04.2.2 04.3 04.3.1 04.3.2
ZAVO ZAVQ GBFG UWHJ GBFK CCUO GBFN ZAVS ATUA AWUZ2005 159 671 30 466 30 466 − 80 422 77 261 3 161 14 942 7 786 7 1312006 160 985 32 716 32 716 − 80 668 77 814 2 854 14 221 6 829 7 3922007 160 351 33 567 33 567 − 80 461 77 702 2 759 13 772 6 520 7 2522008 162 596 34 961 34 961 − 80 920 78 306 2 614 13 473 6 450 7 0232009 161 011 35 403 35 403 − 81 986 79 196 2 790 12 958 6 150 6 808
Percentage chang e , year on previous year
2005 1.5 −1.1 −1.1 1.7 1.0 23.4 −0.9 −3.6 2.42006 0.8 7.4 7.4 0.3 0.7 −9.7 −4.8 −12.3 3.72007 −0.4 2.6 2.6 −0.3 −0.1 −3.3 −3.2 −4.5 −1.92008 1.4 4.2 4.2 0.6 0.8 −5.3 −2.2 −1.1 −3.22009 −1.0 1.3 1.3 1.3 1.1 6.7 −3.8 −4.7 −3.1
Seasonally adjusted
2007 Q1 39 925 8 412 8 412 − 20 147 19 411 736 3 662 1 669 1 993Q2 39 832 8 396 8 396 − 20 101 19 361 740 3 590 1 651 1 939Q3 40 024 8 364 8 364 − 20 131 19 443 688 3 063 1 585 1 478Q4 40 570 8 395 8 395 − 20 082 19 487 595 3 457 1 615 1 842
2008 Q1 39 969 8 592 8 592 − 20 099 19 507 592 3 276 1 630 1 646Q2 40 628 8 675 8 675 − 20 144 19 517 627 3 358 1 619 1 739Q3 41 093 8 769 8 769 − 20 289 19 608 681 3 449 1 616 1 833Q4 40 906 8 925 8 925 − 20 388 19 674 714 3 390 1 585 1 805
2009 Q1 40 405 8 535 8 535 − 20 492 19 767 725 3 424 1 562 1 862Q2 40 382 8 900 8 900 − 20 502 19 815 687 3 268 1 529 1 739Q3 40 288 9 060 9 060 − 20 498 19 821 677 3 052 1 519 1 533Q4 39 936 8 908 8 908 − 20 494 19 793 701 3 214 1 540 1 674
2010 Q1 40 203 8 735 8 735 − 20 131 19 469 662 3 328 1 523 1 805
Percentage chang e , quar ter on previous quarter
2007 Q1 −1.0 1.3 1.3 −0.9 −0.7 −7.2 −0.8 −4.6 2.6Q2 −0.2 −0.2 −0.2 −0.2 −0.3 0.5 −2.0 −1.1 −2.7Q3 0.5 −0.4 −0.4 0.1 0.4 −7.0 −14.7 −4.0 −23.8Q4 1.4 0.4 0.4 −0.2 0.2 −13.5 12.9 1.9 24.6
2008 Q1 −1.5 2.3 2.3 0.1 0.1 −0.5 −5.2 0.9 −10.6Q2 1.6 1.0 1.0 0.2 0.1 5.9 2.5 −0.7 5.7Q3 1.1 1.1 1.1 0.7 0.5 8.6 2.7 −0.2 5.4Q4 −0.5 1.8 1.8 0.5 0.3 4.8 −1.7 −1.9 −1.5
2009 Q1 −1.2 −4.4 −4.4 0.5 0.5 1.5 1.0 −1.5 3.2Q2 −0.1 4.3 4.3 − 0.2 −5.2 −4.6 −2.1 −6.6Q3 −0.2 1.8 1.8 − − −1.5 −6.6 −0.7 −11.8Q4 −0.9 −1.7 −1.7 − −0.1 3.5 5.3 1.4 9.2
2010 Q1 0.7 −1.9 −1.9 −1.8 −1.6 −5.6 3.5 −1.1 7.8
Percentage chang e , quar ter on corresponding quarter of previous year
2007 Q1 0.3 3.8 3.8 0.6 0.1 14.5 10.1 3.6 16.2Q2 −1.0 3.4 3.4 − −0.5 13.8 1.9 −4.6 8.3Q3 −1.4 2.2 2.2 −0.4 − −10.4 −16.8 −8.9 −24.0Q4 0.6 1.1 1.1 −1.2 −0.3 −25.0 −6.3 −7.7 −5.2
2008 Q1 0.1 2.1 2.1 −0.2 0.5 −19.6 −10.5 −2.3 −17.4Q2 2.0 3.3 3.3 0.2 0.8 −15.3 −6.5 −1.9 −10.3Q3 2.7 4.8 4.8 0.8 0.8 −1.0 12.6 2.0 24.0Q4 0.8 6.3 6.3 1.5 1.0 20.0 −1.9 −1.9 −2.0
2009 Q1 1.1 −0.7 −0.7 2.0 1.3 22.5 4.5 −4.2 13.1Q2 −0.6 2.6 2.6 1.8 1.5 9.6 −2.7 −5.6 −Q3 −2.0 3.3 3.3 1.0 1.1 −0.6 −11.5 −6.0 −16.4Q4 −2.4 −0.2 −0.2 0.5 0.6 −1.8 −5.2 −2.8 −7.3
2010 Q1 −0.5 2.3 2.3 −1.8 −1.5 −8.7 −2.8 −2.5 −3.1

47
04.KS Household final consumption expenditureHousing, water, electricity, gas and other fuelsChained volume measures, reference year 2006 - seasonally adjustedcontinued £ million
Housing, water, electr icity, gas and other fuels (continued)
Water and miscellaneous services Electricity, gas and other fuels
Refuse Sewerage OtherTotal Water supply collection collection ser vices Total Electricity Gas Liquid fuels Solid fuels Heat energy
COICOP 04.4 04.4.1 04.4.2 04.4.3 04.4.4 04.5 04.5.1 04.5.2 04.5.3 04.5.4 04.5.5
ZAVU UTZN UWHK UTZX UWHL ZWUR CCUA LTZA LTZC TTAB ZWIV2005 6 866 3 196 110 3 559 − 26 719 11 855 13 762 871 251 −2006 6 899 3 220 146 3 533 − 26 481 11 834 13 356 1 066 225 −2007 7 185 3 415 102 3 668 − 25 366 10 989 13 194 970 213 −2008 7 124 3 409 106 3 609 − 26 118 11 494 13 438 992 194 −2009 6 769 3 187 93 3 489 − 23 895 10 992 11 664 1 024 215 −
Percentage chang e , year on previous year
2005 1.4 −1.7 8.9 4.0 7.6 2.8 17.4 −26.0 −29.32006 0.5 0.8 32.7 −0.7 −0.9 −0.2 −3.0 22.4 −10.42007 4.1 6.1 −30.1 3.8 −4.2 −7.1 −1.2 −9.0 −5.32008 −0.8 −0.2 3.9 −1.6 3.0 4.6 1.8 2.3 −8.92009 −5.0 −6.5 −12.3 −3.3 −8.5 −4.4 −13.2 3.2 10.8
Seasonally adjusted
2007 Q1 1 755 827 38 890 − 5 949 2 701 2 940 243 65 −Q2 1 782 850 26 906 − 5 963 2 662 3 025 223 53 −Q3 1 810 862 18 930 − 6 656 2 902 3 454 250 50 −Q4 1 838 876 20 942 − 6 798 2 724 3 775 254 45 −
2008 Q1 1 817 871 25 921 − 6 185 2 887 3 018 244 36 −Q2 1 801 860 30 911 − 6 650 2 967 3 372 266 45 −Q3 1 770 847 28 895 − 6 816 2 808 3 745 213 50 −Q4 1 736 831 23 882 − 6 467 2 832 3 303 269 63 −
2009 Q1 1 713 813 25 875 − 6 241 2 758 3 179 253 51 −Q2 1 685 798 21 866 − 6 027 2 824 2 890 255 58 −Q3 1 682 789 23 870 − 5 996 2 743 2 939 256 58 −Q4 1 689 787 24 878 − 5 631 2 667 2 656 260 48 −
2010 Q1 1 699 793 24 882 − 6 310 2 806 3 156 293 55 −
Percentage chang e , quar ter on previous quarter
2007 Q1 1.3 2.2 −19.1 1.6 −4.7 −3.8 −6.8 3.4 44.4Q2 1.5 2.8 −31.6 1.8 0.2 −1.4 2.9 −8.2 −18.5Q3 1.6 1.4 −30.8 2.6 11.6 9.0 14.2 12.1 −5.7Q4 1.5 1.6 11.1 1.3 2.1 −6.1 9.3 1.6 −10.0
2008 Q1 −1.1 −0.6 25.0 −2.2 −9.0 6.0 −20.1 −3.9 −20.0Q2 −0.9 −1.3 20.0 −1.1 7.5 2.8 11.7 9.0 25.0Q3 −1.7 −1.5 −6.7 −1.8 2.5 −5.4 11.1 −19.9 11.1Q4 −1.9 −1.9 −17.9 −1.5 −5.1 0.9 −11.8 26.3 26.0
2009 Q1 −1.3 −2.2 8.7 −0.8 −3.5 −2.6 −3.8 −5.9 −19.0Q2 −1.6 −1.8 −16.0 −1.0 −3.4 2.4 −9.1 0.8 13.7Q3 −0.2 −1.1 9.5 0.5 −0.5 −2.9 1.7 0.4 −Q4 0.4 −0.3 4.3 0.9 −6.1 −2.8 −9.6 1.6 −17.2
2010 Q1 0.6 0.8 − 0.5 12.1 5.2 18.8 12.7 14.6
Percentage chang e , quar ter on corresponding quarter of previous year
2007 Q1 2.2 3.0 81.0 −0.4 −10.6 −12.3 −9.4 −5.8 3.2Q2 3.5 5.9 −23.5 2.5 −12.5 −12.7 −10.7 −28.3 −11.7Q3 4.7 7.1 −59.1 5.8 −1.7 0.1 −3.2 −4.6 −12.3Q4 6.1 8.3 −57.4 7.5 8.9 −3.0 19.6 8.1 −
2008 Q1 3.5 5.3 −34.2 3.5 4.0 6.9 2.7 0.4 −44.6Q2 1.1 1.2 15.4 0.6 11.5 11.5 11.5 19.3 −15.1Q3 −2.2 −1.7 55.6 −3.8 2.4 −3.2 8.4 −14.8 −Q4 −5.5 −5.1 15.0 −6.4 −4.9 4.0 −12.5 5.9 40.0
2009 Q1 −5.7 −6.7 − −5.0 0.9 −4.5 5.3 3.7 41.7Q2 −6.4 −7.2 −30.0 −4.9 −9.4 −4.8 −14.3 −4.1 28.9Q3 −5.0 −6.8 −17.9 −2.8 −12.0 −2.3 −21.5 20.2 16.0Q4 −2.7 −5.3 4.3 −0.5 −12.9 −5.8 −19.6 −3.3 −23.8
2010 Q1 −0.8 −2.5 −4.0 0.8 1.1 1.7 −0.7 15.8 7.8

48
04.DN Household final consumption expenditureHousing, water, electricity, gas and other fuelsImplied deflators - not seasonally adjusted 2006 = 100
Housing, water, electr icity, gas and other fuels
Actual rentals for housing Imputed rentals for housing Maintenance and repair of the dwelling
ImputedActual rentals of
rentals paid Other actual owner-occupi- Other imputedTotal Total by tenants rentals Total ers rentals Total Materials Services
COICOP 04 04.1 04.1.1 04.1.2 04.2 04.2.1 04.2.2 04.3 04.3.1 04.3.2
UTJE UTNI AWMD UTNJ AWMF AWMG UTNK AWMH AWMI2005 93.5 97.0 97.0 96.2 96.2 96.2 97.1 99.1 95.22006 100.0 100.0 100.0 100.0 100.0 100.0 100.0 100.0 100.02007 107.2 106.9 106.9 107.2 107.2 106.9 104.6 104.2 105.02008 115.0 110.3 110.3 113.0 113.0 113.0 110.5 110.7 110.32009 120.6 116.1 116.1 117.9 117.8 122.3 115.1 119.1 111.6
Percentage chang e , year on previous year
2005 5.6 4.3 4.3 4.3 4.5 1.9 2.9 0.7 5.42006 7.0 3.1 3.1 4.0 4.0 4.0 3.0 0.9 5.02007 7.2 6.9 6.9 7.2 7.2 6.9 4.6 4.2 5.02008 7.3 3.2 3.2 5.4 5.4 5.7 5.6 6.2 5.02009 4.9 5.3 5.3 4.3 4.2 8.2 4.2 7.6 1.2
Not seasonally adjusted
2007 Q1 106.4 104.3 104.3 104.5 104.5 104.3 103.3 102.8 103.6Q2 106.6 106.2 106.2 106.2 106.2 106.1 104.1 103.5 104.7Q3 107.8 108.4 108.4 108.3 108.3 108.1 105.1 104.9 105.3Q4 108.2 108.6 108.6 109.7 109.7 109.7 106.3 105.7 106.7
2008 Q1 110.3 107.8 107.8 110.2 110.2 110.0 108.4 108.4 108.4Q2 112.1 108.9 108.9 111.2 111.3 111.0 109.1 109.0 109.1Q3 114.9 110.8 110.8 113.7 113.7 113.5 111.4 111.4 111.4Q4 122.3 113.6 113.6 116.8 116.8 116.7 113.0 114.1 112.0
2009 Q1 122.6 118.7 118.7 116.4 116.4 116.7 113.3 115.7 111.4Q2 118.5 115.1 115.1 116.6 116.5 119.4 115.0 118.5 111.5Q3 118.4 113.9 113.9 117.9 117.7 124.4 115.9 120.3 111.6Q4 122.6 117.0 117.0 120.8 120.5 129.1 116.7 122.1 111.8
2010 Q1 127.6 122.6 122.6 127.5 127.4 129.8 118.2 125.1 112.8
Percentage chang e , quar ter on corresponding quarter of previous year
2007 Q1 9.1 5.6 5.6 6.0 6.0 6.0 4.2 3.3 5.1Q2 7.9 7.1 7.1 7.3 7.3 7.4 4.8 4.0 5.2Q3 8.5 8.9 8.9 8.4 8.4 8.2 4.8 4.8 4.9Q4 3.8 6.0 6.0 7.0 7.0 7.1 5.0 4.8 5.3
2008 Q1 3.7 3.4 3.4 5.5 5.5 5.5 4.9 5.4 4.6Q2 5.2 2.5 2.5 4.7 4.8 4.6 4.8 5.3 4.2Q3 6.6 2.2 2.2 5.0 5.0 5.0 6.0 6.2 5.8Q4 13.0 4.6 4.6 6.5 6.5 6.4 6.3 7.9 5.0
2009 Q1 11.2 10.1 10.1 5.6 5.6 6.1 4.5 6.7 2.8Q2 5.7 5.7 5.7 4.9 4.7 7.6 5.4 8.7 2.2Q3 3.0 2.8 2.8 3.7 3.5 9.6 4.0 8.0 0.2Q4 0.2 3.0 3.0 3.4 3.2 10.6 3.3 7.0 −0.2
2010 Q1 4.1 3.3 3.3 9.5 9.5 11.2 4.3 8.1 1.3
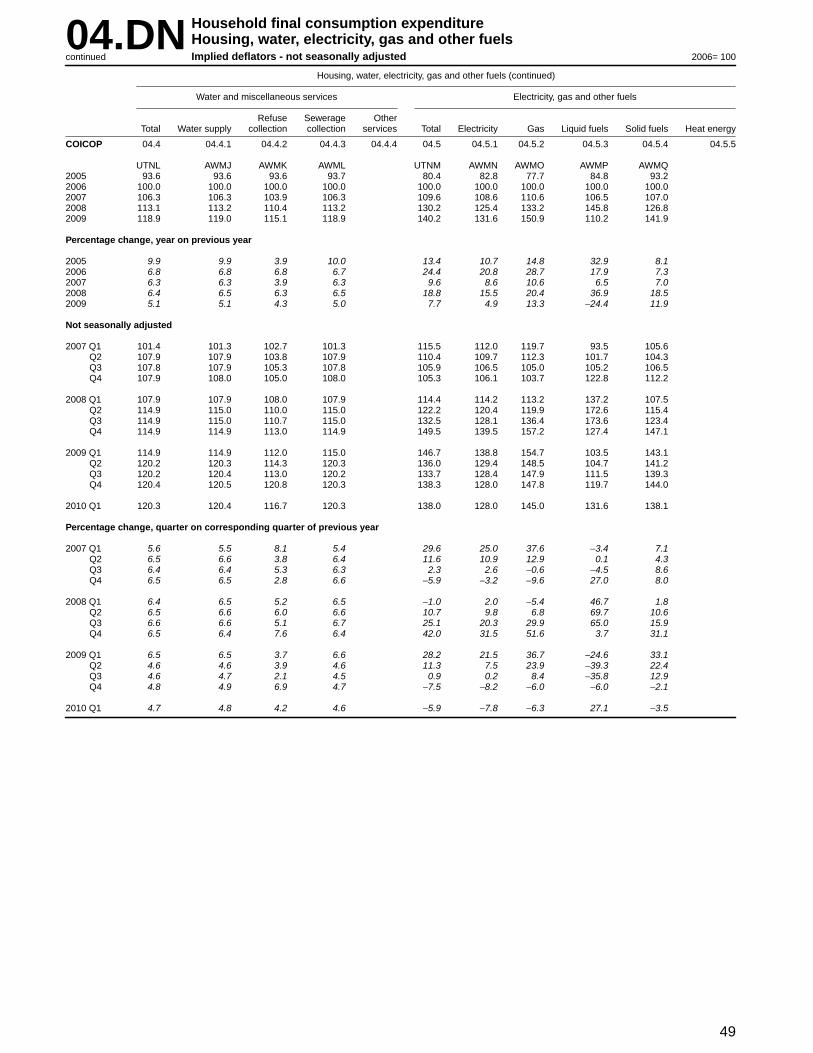
49
04.DN Household final consumption expenditureHousing, water, electricity, gas and other fuelsImplied deflators - not seasonally adjustedcontinued 2006= 100
Housing, water, electr icity, gas and other fuels (continued)
Water and miscellaneous services Electricity, gas and other fuels
Refuse Sewerage OtherTotal Water supply collection collection ser vices Total Electricity Gas Liquid fuels Solid fuels Heat energy
COICOP 04.4 04.4.1 04.4.2 04.4.3 04.4.4 04.5 04.5.1 04.5.2 04.5.3 04.5.4 04.5.5
UTNL AWMJ AWMK AWML UTNM AWMN AWMO AWMP AWMQ2005 93.6 93.6 93.6 93.7 80.4 82.8 77.7 84.8 93.22006 100.0 100.0 100.0 100.0 100.0 100.0 100.0 100.0 100.02007 106.3 106.3 103.9 106.3 109.6 108.6 110.6 106.5 107.02008 113.1 113.2 110.4 113.2 130.2 125.4 133.2 145.8 126.82009 118.9 119.0 115.1 118.9 140.2 131.6 150.9 110.2 141.9
Percentage chang e , year on previous year
2005 9.9 9.9 3.9 10.0 13.4 10.7 14.8 32.9 8.12006 6.8 6.8 6.8 6.7 24.4 20.8 28.7 17.9 7.32007 6.3 6.3 3.9 6.3 9.6 8.6 10.6 6.5 7.02008 6.4 6.5 6.3 6.5 18.8 15.5 20.4 36.9 18.52009 5.1 5.1 4.3 5.0 7.7 4.9 13.3 −24.4 11.9
Not seasonally adjusted
2007 Q1 101.4 101.3 102.7 101.3 115.5 112.0 119.7 93.5 105.6Q2 107.9 107.9 103.8 107.9 110.4 109.7 112.3 101.7 104.3Q3 107.8 107.9 105.3 107.8 105.9 106.5 105.0 105.2 106.5Q4 107.9 108.0 105.0 108.0 105.3 106.1 103.7 122.8 112.2
2008 Q1 107.9 107.9 108.0 107.9 114.4 114.2 113.2 137.2 107.5Q2 114.9 115.0 110.0 115.0 122.2 120.4 119.9 172.6 115.4Q3 114.9 115.0 110.7 115.0 132.5 128.1 136.4 173.6 123.4Q4 114.9 114.9 113.0 114.9 149.5 139.5 157.2 127.4 147.1
2009 Q1 114.9 114.9 112.0 115.0 146.7 138.8 154.7 103.5 143.1Q2 120.2 120.3 114.3 120.3 136.0 129.4 148.5 104.7 141.2Q3 120.2 120.4 113.0 120.2 133.7 128.4 147.9 111.5 139.3Q4 120.4 120.5 120.8 120.3 138.3 128.0 147.8 119.7 144.0
2010 Q1 120.3 120.4 116.7 120.3 138.0 128.0 145.0 131.6 138.1
Percentage chang e , quar ter on corresponding quarter of previous year
2007 Q1 5.6 5.5 8.1 5.4 29.6 25.0 37.6 −3.4 7.1Q2 6.5 6.6 3.8 6.4 11.6 10.9 12.9 0.1 4.3Q3 6.4 6.4 5.3 6.3 2.3 2.6 −0.6 −4.5 8.6Q4 6.5 6.5 2.8 6.6 −5.9 −3.2 −9.6 27.0 8.0
2008 Q1 6.4 6.5 5.2 6.5 −1.0 2.0 −5.4 46.7 1.8Q2 6.5 6.6 6.0 6.6 10.7 9.8 6.8 69.7 10.6Q3 6.6 6.6 5.1 6.7 25.1 20.3 29.9 65.0 15.9Q4 6.5 6.4 7.6 6.4 42.0 31.5 51.6 3.7 31.1
2009 Q1 6.5 6.5 3.7 6.6 28.2 21.5 36.7 −24.6 33.1Q2 4.6 4.6 3.9 4.6 11.3 7.5 23.9 −39.3 22.4Q3 4.6 4.7 2.1 4.5 0.9 0.2 8.4 −35.8 12.9Q4 4.8 4.9 6.9 4.7 −7.5 −8.2 −6.0 −6.0 −2.1
2010 Q1 4.7 4.8 4.2 4.6 −5.9 −7.8 −6.3 27.1 −3.5

50
04.DS Household final consumption expenditureHousing, water, electricity, gas and other fuelsImplied deflators - seasonally adjusted 2006 = 100
Housing, water, electr icity, gas and other fuels
Actual rentals for housing Imputed rentals for housing Maintenance and repair of the dwelling
ImputedActual rentals of
rentals paid Other actual owner-occupi- Other imputedTotal Total by tenants rentals Total ers rentals Total Materials Services
COICOP 04 04.1 04.1.1 04.1.2 04.2 04.2.1 04.2.2 04.3 04.3.1 04.3.2
UTJR UTPB AWPV UTPC AWPX AWPY UTPD AWPZ AWQA2005 93.5 97.0 97.0 96.2 96.2 96.2 97.1 99.1 95.22006 100.0 100.0 100.0 100.0 100.0 100.0 100.0 100.0 100.02007 107.2 106.9 106.9 107.2 107.2 106.9 104.6 104.2 105.02008 115.0 110.3 110.3 113.0 113.0 113.0 110.5 110.7 110.32009 120.6 116.1 116.1 117.9 117.8 122.3 115.1 119.1 111.6
Percentage chang e , year on previous year
2005 5.6 4.3 4.3 4.3 4.5 1.9 2.9 0.7 5.42006 7.0 3.1 3.1 4.0 4.0 4.0 3.0 0.9 5.02007 7.2 6.9 6.9 7.2 7.2 6.9 4.6 4.2 5.02008 7.3 3.2 3.2 5.4 5.4 5.7 5.6 6.2 5.02009 4.9 5.3 5.3 4.3 4.2 8.2 4.2 7.6 1.2
Seasonally adjusted
2007 Q1 105.8 104.3 104.3 104.5 104.5 104.3 102.9 102.6 103.2Q2 106.7 106.2 106.2 106.2 106.2 106.1 104.5 103.6 105.3Q3 108.0 108.4 108.4 108.3 108.3 108.1 105.0 105.0 104.9Q4 108.4 108.6 108.6 109.7 109.7 109.7 106.3 105.6 106.9
2008 Q1 110.1 107.8 107.8 110.2 110.2 110.0 107.9 108.2 107.7Q2 112.4 108.9 108.9 111.2 111.3 111.0 109.8 109.1 110.4Q3 116.7 110.8 110.8 113.7 113.7 113.5 111.0 111.4 110.6Q4 120.6 113.6 113.6 116.8 116.8 116.7 113.1 114.1 112.2
2009 Q1 121.1 118.7 118.7 116.4 116.4 116.7 112.8 115.6 110.5Q2 119.5 115.1 115.1 116.6 116.5 119.4 115.8 118.6 113.4Q3 120.1 113.9 113.9 117.9 117.7 124.4 115.4 120.3 110.4Q4 121.9 117.0 117.0 120.8 120.5 129.1 116.8 122.1 111.9
2010 Q1 126.9 122.6 122.6 127.5 127.4 129.8 117.6 124.9 111.4
Percentage chang e , quar ter on previous quarter
2007 Q1 2.4 1.8 1.8 2.0 2.0 1.9 1.6 1.6 1.7Q2 0.9 1.8 1.8 1.6 1.6 1.7 1.6 1.0 2.0Q3 1.2 2.1 2.1 2.0 2.0 1.9 0.5 1.4 −0.4Q4 0.4 0.2 0.2 1.3 1.3 1.5 1.2 0.6 1.9
2008 Q1 1.6 −0.7 −0.7 0.5 0.5 0.3 1.5 2.5 0.7Q2 2.1 1.0 1.0 0.9 1.0 0.9 1.8 0.8 2.5Q3 3.8 1.7 1.7 2.2 2.2 2.3 1.1 2.1 0.2Q4 3.3 2.5 2.5 2.7 2.7 2.8 1.9 2.4 1.4
2009 Q1 0.4 4.5 4.5 −0.3 −0.3 − −0.3 1.3 −1.5Q2 −1.3 −3.0 −3.0 0.2 0.1 2.3 2.7 2.6 2.6Q3 0.5 −1.0 −1.0 1.1 1.0 4.2 −0.3 1.4 −2.6Q4 1.5 2.7 2.7 2.5 2.4 3.8 1.2 1.5 1.4
2010 Q1 4.1 4.8 4.8 5.5 5.7 0.5 0.7 2.3 −0.4
Percentage chang e , quar ter on corresponding quarter of previous year
2007 Q1 9.2 5.6 5.6 6.0 6.0 6.0 4.1 3.3 5.0Q2 8.0 7.1 7.1 7.3 7.3 7.4 5.0 4.1 5.6Q3 6.9 8.9 8.9 8.4 8.4 8.2 4.7 4.8 4.6Q4 4.9 6.0 6.0 7.0 7.0 7.1 4.9 4.6 5.3
2008 Q1 4.1 3.4 3.4 5.5 5.5 5.5 4.9 5.5 4.4Q2 5.3 2.5 2.5 4.7 4.8 4.6 5.1 5.3 4.8Q3 8.1 2.2 2.2 5.0 5.0 5.0 5.7 6.1 5.4Q4 11.3 4.6 4.6 6.5 6.5 6.4 6.4 8.0 5.0
2009 Q1 10.0 10.1 10.1 5.6 5.6 6.1 4.5 6.8 2.6Q2 6.3 5.7 5.7 4.9 4.7 7.6 5.5 8.7 2.7Q3 2.9 2.8 2.8 3.7 3.5 9.6 4.0 8.0 −0.2Q4 1.1 3.0 3.0 3.4 3.2 10.6 3.3 7.0 −0.3
2010 Q1 4.8 3.3 3.3 9.5 9.5 11.2 4.3 8.0 0.8
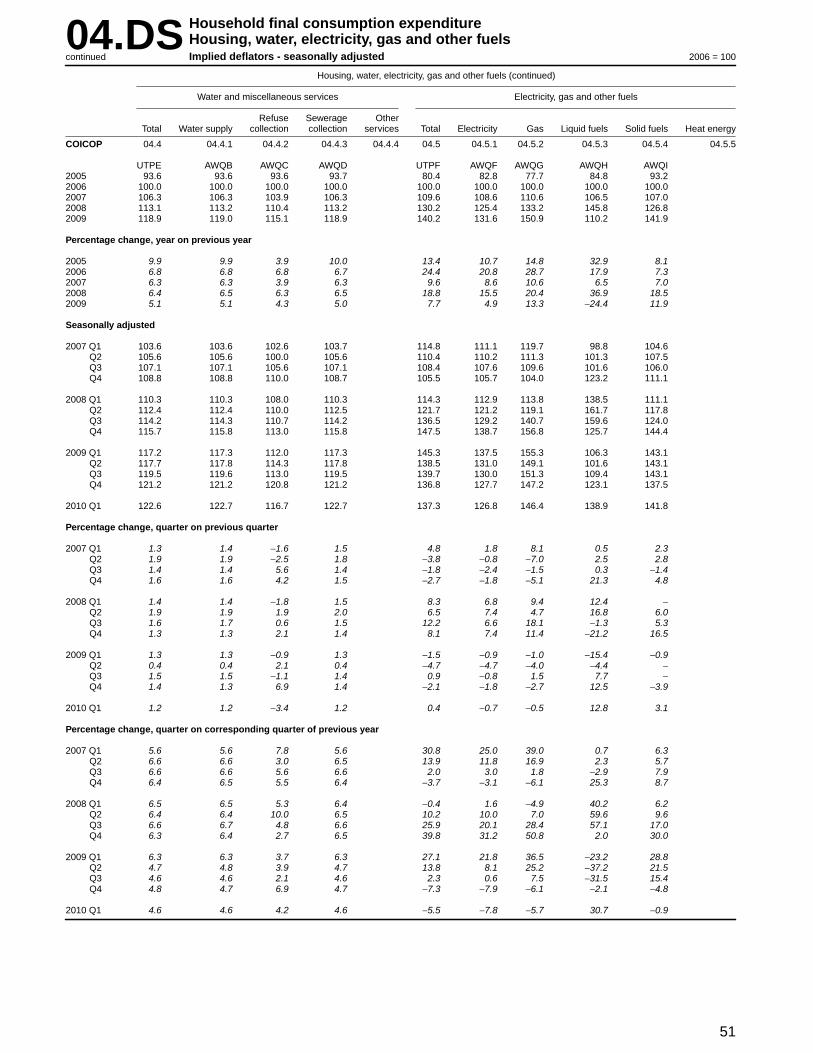
51
04.DS Household final consumption expenditureHousing, water, electricity, gas and other fuelsImplied deflators - seasonally adjustedcontinued 2006 = 100
Housing, water, electr icity, gas and other fuels (continued)
Water and miscellaneous services Electricity, gas and other fuels
Refuse Sewerage OtherTotal Water supply collection collection ser vices Total Electricity Gas Liquid fuels Solid fuels Heat energy
COICOP 04.4 04.4.1 04.4.2 04.4.3 04.4.4 04.5 04.5.1 04.5.2 04.5.3 04.5.4 04.5.5
UTPE AWQB AWQC AWQD UTPF AWQF AWQG AWQH AWQI2005 93.6 93.6 93.6 93.7 80.4 82.8 77.7 84.8 93.22006 100.0 100.0 100.0 100.0 100.0 100.0 100.0 100.0 100.02007 106.3 106.3 103.9 106.3 109.6 108.6 110.6 106.5 107.02008 113.1 113.2 110.4 113.2 130.2 125.4 133.2 145.8 126.82009 118.9 119.0 115.1 118.9 140.2 131.6 150.9 110.2 141.9
Percentage chang e , year on previous year
2005 9.9 9.9 3.9 10.0 13.4 10.7 14.8 32.9 8.12006 6.8 6.8 6.8 6.7 24.4 20.8 28.7 17.9 7.32007 6.3 6.3 3.9 6.3 9.6 8.6 10.6 6.5 7.02008 6.4 6.5 6.3 6.5 18.8 15.5 20.4 36.9 18.52009 5.1 5.1 4.3 5.0 7.7 4.9 13.3 −24.4 11.9
Seasonally adjusted
2007 Q1 103.6 103.6 102.6 103.7 114.8 111.1 119.7 98.8 104.6Q2 105.6 105.6 100.0 105.6 110.4 110.2 111.3 101.3 107.5Q3 107.1 107.1 105.6 107.1 108.4 107.6 109.6 101.6 106.0Q4 108.8 108.8 110.0 108.7 105.5 105.7 104.0 123.2 111.1
2008 Q1 110.3 110.3 108.0 110.3 114.3 112.9 113.8 138.5 111.1Q2 112.4 112.4 110.0 112.5 121.7 121.2 119.1 161.7 117.8Q3 114.2 114.3 110.7 114.2 136.5 129.2 140.7 159.6 124.0Q4 115.7 115.8 113.0 115.8 147.5 138.7 156.8 125.7 144.4
2009 Q1 117.2 117.3 112.0 117.3 145.3 137.5 155.3 106.3 143.1Q2 117.7 117.8 114.3 117.8 138.5 131.0 149.1 101.6 143.1Q3 119.5 119.6 113.0 119.5 139.7 130.0 151.3 109.4 143.1Q4 121.2 121.2 120.8 121.2 136.8 127.7 147.2 123.1 137.5
2010 Q1 122.6 122.7 116.7 122.7 137.3 126.8 146.4 138.9 141.8
Percentage chang e , quar ter on previous quarter
2007 Q1 1.3 1.4 −1.6 1.5 4.8 1.8 8.1 0.5 2.3Q2 1.9 1.9 −2.5 1.8 −3.8 −0.8 −7.0 2.5 2.8Q3 1.4 1.4 5.6 1.4 −1.8 −2.4 −1.5 0.3 −1.4Q4 1.6 1.6 4.2 1.5 −2.7 −1.8 −5.1 21.3 4.8
2008 Q1 1.4 1.4 −1.8 1.5 8.3 6.8 9.4 12.4 −Q2 1.9 1.9 1.9 2.0 6.5 7.4 4.7 16.8 6.0Q3 1.6 1.7 0.6 1.5 12.2 6.6 18.1 −1.3 5.3Q4 1.3 1.3 2.1 1.4 8.1 7.4 11.4 −21.2 16.5
2009 Q1 1.3 1.3 −0.9 1.3 −1.5 −0.9 −1.0 −15.4 −0.9Q2 0.4 0.4 2.1 0.4 −4.7 −4.7 −4.0 −4.4 −Q3 1.5 1.5 −1.1 1.4 0.9 −0.8 1.5 7.7 −Q4 1.4 1.3 6.9 1.4 −2.1 −1.8 −2.7 12.5 −3.9
2010 Q1 1.2 1.2 −3.4 1.2 0.4 −0.7 −0.5 12.8 3.1
Percentage chang e , quar ter on corresponding quarter of previous year
2007 Q1 5.6 5.6 7.8 5.6 30.8 25.0 39.0 0.7 6.3Q2 6.6 6.6 3.0 6.5 13.9 11.8 16.9 2.3 5.7Q3 6.6 6.6 5.6 6.6 2.0 3.0 1.8 −2.9 7.9Q4 6.4 6.5 5.5 6.4 −3.7 −3.1 −6.1 25.3 8.7
2008 Q1 6.5 6.5 5.3 6.4 −0.4 1.6 −4.9 40.2 6.2Q2 6.4 6.4 10.0 6.5 10.2 10.0 7.0 59.6 9.6Q3 6.6 6.7 4.8 6.6 25.9 20.1 28.4 57.1 17.0Q4 6.3 6.4 2.7 6.5 39.8 31.2 50.8 2.0 30.0
2009 Q1 6.3 6.3 3.7 6.3 27.1 21.8 36.5 −23.2 28.8Q2 4.7 4.8 3.9 4.7 13.8 8.1 25.2 −37.2 21.5Q3 4.6 4.6 2.1 4.6 2.3 0.6 7.5 −31.5 15.4Q4 4.8 4.7 6.9 4.7 −7.3 −7.9 −6.1 −2.1 −4.8
2010 Q1 4.6 4.6 4.2 4.6 −5.5 −7.8 −5.7 30.7 −0.9

52
05.CN Household final consumption expenditureFurnishings, household equipment and routine maintenance of the houseCurrent prices - not seasonally adjusted £ million
Fur nishings, household equipment and routine maintenance of the house
Fur niture and furnishings, car pets and other floorcoverings Household appliances
Repair offur niture, Small
Car pets and furnishings Major electr ic Repair ofFur niture and other floor and floor Household household household household
Total Total furnishings coverings coverings textiles Total appliances appliances appliances
COICOP 05 05.1 05.1.1 05.1.2 05.1.3 05.2 05.3 05.3.1 05.3.2 05.3.3
ADFY ADFZ ADVM ADVN ADVO ADGG ADGL ADVP ADVQ ADVR2005 44 475 16 816 12 635 4 124 57 5 248 6 414 5 115 748 5512006 45 613 17 256 12 940 4 265 51 5 433 6 472 5 074 856 5422007 46 806 18 040 13 284 4 720 36 6 013 6 310 4 962 787 5612008 46 723 17 597 13 158 4 396 43 6 095 6 440 5 290 673 4772009 43 836 16 595 12 601 3 941 53 5 830 6 121 4 917 738 466
Percentage chang e , year on previous year
2005 2.3 0.1 −0.3 0.3 111.1 −3.8 5.1 8.9 −10.7 −3.52006 2.6 2.6 2.4 3.4 −10.5 3.5 0.9 −0.8 14.4 −1.62007 2.6 4.5 2.7 10.7 −29.4 10.7 −2.5 −2.2 −8.1 3.52008 −0.2 −2.5 −0.9 −6.9 19.4 1.4 2.1 6.6 −14.5 −15.02009 −6.2 −5.7 −4.2 −10.4 23.3 −4.3 −5.0 −7.1 9.7 −2.3
Not seasonally adjusted
2007 Q1 10 826 4 297 3 180 1 109 8 1 385 1 501 1 087 239 175Q2 11 577 4 400 3 250 1 141 9 1 434 1 494 1 235 122 137Q3 11 557 4 508 3 293 1 204 11 1 408 1 444 1 191 134 119Q4 12 846 4 835 3 561 1 266 8 1 786 1 871 1 449 292 130
2008 Q1 11 281 4 456 3 266 1 185 5 1 443 1 611 1 301 186 124Q2 11 518 4 359 3 238 1 116 5 1 480 1 417 1 218 99 100Q3 11 492 4 253 3 163 1 074 16 1 489 1 490 1 249 136 105Q4 12 432 4 529 3 491 1 021 17 1 683 1 922 1 522 252 148
2009 Q1 10 441 3 903 2 939 955 9 1 381 1 547 1 254 173 120Q2 10 628 3 964 2 993 960 11 1 372 1 356 1 103 152 101Q3 10 759 4 158 3 134 1 010 14 1 401 1 431 1 178 143 110Q4 12 008 4 570 3 535 1 016 19 1 676 1 787 1 382 270 135
2010 Q1 10 799 4 051 3 077 958 16 1 374 1 576 1 293 159 124
Percentage chang e , quar ter on corresponding quarter of previous year
2007 Q1 −0.2 1.9 0.6 6.7 −57.9 6.0 −4.3 −9.3 −0.4 34.6Q2 2.5 6.8 5.9 10.0 −35.7 9.5 1.7 3.1 −13.5 5.4Q3 4.2 7.7 6.0 12.9 10.0 8.8 −5.1 2.2 −43.7 −Q4 3.7 2.2 −1.1 12.7 − 17.3 −2.2 −4.2 23.2 −20.2
2008 Q1 4.2 3.7 2.7 6.9 −37.5 4.2 7.3 19.7 −22.2 −29.1Q2 −0.5 −0.9 −0.4 −2.2 −44.4 3.2 −5.2 −1.4 −18.9 −27.0Q3 −0.6 −5.7 −3.9 −10.8 45.5 5.8 3.2 4.9 1.5 −11.8Q4 −3.2 −6.3 −2.0 −19.4 112.5 −5.8 2.7 5.0 −13.7 13.8
2009 Q1 −7.4 −12.4 −10.0 −19.4 80.0 −4.3 −4.0 −3.6 −7.0 −3.2Q2 −7.7 −9.1 −7.6 −14.0 120.0 −7.3 −4.3 −9.4 53.5 1.0Q3 −6.4 −2.2 −0.9 −6.0 −12.5 −5.9 −4.0 −5.7 5.1 4.8Q4 −3.4 0.9 1.3 −0.5 11.8 −0.4 −7.0 −9.2 7.1 −8.8
2010 Q1 3.4 3.8 4.7 0.3 77.8 −0.5 1.9 3.1 −8.1 3.3

53
05.CN Household final consumption expenditureFurnishings, household equipment and routine maintenance of the houseCurrent prices - not seasonally adjustedcontinued £ million
Fur nishings, household equipment and routine maintenance of the house (continued)
Tools and equipment Routine maintenance
Small tools and Domestic servicesMajor tools and miscellaneous Non-durable and household
Household utensils Total equipment accessor ies Total household goods services
COICOP 05.4 05.5 05.5.1 05.5.2 05.6 05.6.1 05.6.2
ADGM ADGN ADVS ADVT ADGO ADVU ADVV2005 4 415 4 244 489 3 755 7 338 3 805 3 5332006 4 473 4 723 597 4 126 7 256 4 007 3 2492007 4 344 5 225 703 4 522 6 874 4 006 2 8682008 4 341 5 042 768 4 274 7 208 4 157 3 0512009 3 776 4 342 482 3 860 7 172 4 344 2 828
Percentage chang e , year on previous year
2005 10.1 2.5 12.4 1.3 5.2 1.5 9.42006 1.3 11.3 22.1 9.9 −1.1 5.3 −8.02007 −2.9 10.6 17.8 9.6 −5.3 − −11.72008 −0.1 −3.5 9.2 −5.5 4.9 3.8 6.42009 −13.0 −13.9 −37.2 −9.7 −0.5 4.5 −7.3
Not seasonally adjusted
2007 Q1 956 1 185 121 1 064 1 502 1 000 502Q2 1 070 1 402 226 1 176 1 777 983 794Q3 1 062 1 240 140 1 100 1 895 1 029 866Q4 1 256 1 398 216 1 182 1 700 994 706
2008 Q1 1 032 1 217 204 1 013 1 522 1 015 507Q2 1 076 1 337 180 1 157 1 849 1 039 810Q3 1 033 1 224 194 1 030 2 003 1 061 942Q4 1 200 1 264 190 1 074 1 834 1 042 792
2009 Q1 877 1 097 111 986 1 636 1 044 592Q2 905 1 106 142 964 1 925 1 117 808Q3 896 1 009 116 893 1 864 1 092 772Q4 1 098 1 130 113 1 017 1 747 1 091 656
2010 Q1 889 1 048 104 944 1 861 1 052 809
Percentage chang e , quar ter on corresponding quarter of previous year
2007 Q1 −16.4 15.6 14.2 15.8 −5.1 5.6 −21.1Q2 −7.4 12.8 55.9 7.1 −11.0 −1.7 −20.3Q3 2.3 4.6 −14.6 7.6 1.4 −2.3 6.3Q4 10.5 10.2 18.7 8.7 −6.0 −1.3 −12.0
2008 Q1 7.9 2.7 68.6 −4.8 1.3 1.5 1.0Q2 0.6 −4.6 −20.4 −1.6 4.1 5.7 2.0Q3 −2.7 −1.3 38.6 −6.4 5.7 3.1 8.8Q4 −4.5 −9.6 −12.0 −9.1 7.9 4.8 12.2
2009 Q1 −15.0 −9.9 −45.6 −2.7 7.5 2.9 16.8Q2 −15.9 −17.3 −21.1 −16.7 4.1 7.5 −0.2Q3 −13.3 −17.6 −40.2 −13.3 −6.9 2.9 −18.0Q4 −8.5 −10.6 −40.5 −5.3 −4.7 4.7 −17.2
2010 Q1 1.4 −4.5 −6.3 −4.3 13.8 0.8 36.7

54
05.CS Household final consumption expenditureFurnishings, household equipment and routine maintenance of the houseCurrent prices - seasonally adjusted £ million
Fur nishings, household equipment and routine maintenance of the house
Fur niture and furnishings, car pets and other floorcoverings Household appliances
Repair offur niture, Small
Car pets and furnishings Major electr ic Repair ofFur niture and other floor and floor Household household household household
Total Total furnishings coverings coverings textiles Total appliances appliances appliances
COICOP 05 05.1 05.1.1 05.1.2 05.1.3 05.2 05.3 05.3.1 05.3.2 05.3.3
ZAVV ZAVX ATMA ATME UVGG ATMF ZAVZ XYEB XYEC UVGH2005 44 475 16 816 12 635 4 124 57 5 248 6 414 5 115 748 5512006 45 613 17 256 12 940 4 265 51 5 433 6 472 5 074 856 5422007 46 806 18 040 13 284 4 720 36 6 013 6 310 4 962 787 5612008 46 723 17 597 13 158 4 396 43 6 095 6 440 5 290 673 4772009 43 836 16 595 12 601 3 941 53 5 830 6 121 4 917 738 466
Percentage chang e , year on previous year
2005 2.3 0.1 −0.3 0.3 111.1 −3.8 5.1 8.9 −10.7 −3.52006 2.6 2.6 2.4 3.4 −10.5 3.5 0.9 −0.8 14.4 −1.62007 2.6 4.5 2.7 10.7 −29.4 10.7 −2.5 −2.2 −8.1 3.52008 −0.2 −2.5 −0.9 −6.9 19.4 1.4 2.1 6.6 −14.5 −15.02009 −6.2 −5.7 −4.2 −10.4 23.3 −4.3 −5.0 −7.1 9.7 −2.3
Seasonally adjusted
2007 Q1 11 411 4 409 3 255 1 146 8 1 457 1 521 1 119 239 163Q2 11 827 4 540 3 369 1 162 9 1 507 1 640 1 319 171 150Q3 11 790 4 603 3 404 1 188 11 1 474 1 584 1 281 168 135Q4 11 778 4 488 3 256 1 224 8 1 575 1 565 1 243 209 113
2008 Q1 11 923 4 596 3 362 1 229 5 1 510 1 633 1 322 194 117Q2 11 776 4 480 3 344 1 131 5 1 550 1 566 1 311 142 113Q3 11 651 4 324 3 257 1 051 16 1 552 1 608 1 324 166 118Q4 11 373 4 197 3 195 985 17 1 483 1 633 1 333 171 129
2009 Q1 10 963 4 048 3 044 994 10 1 447 1 556 1 263 179 114Q2 10 844 4 074 3 091 971 12 1 438 1 527 1 194 219 114Q3 10 959 4 230 3 228 989 13 1 462 1 525 1 238 166 121Q4 11 070 4 243 3 238 987 18 1 483 1 513 1 222 174 117
2010 Q1 11 182 4 232 3 207 1 009 16 1 446 1 568 1 297 153 118
Percentage chang e , quar ter on previous quarter
2007 Q1 1.0 0.3 −1.4 5.6 − 9.1 −4.3 −12.7 48.4 11.6Q2 3.6 3.0 3.5 1.4 12.5 3.4 7.8 17.9 −28.5 −8.0Q3 −0.3 1.4 1.0 2.2 22.2 −2.2 −3.4 −2.9 −1.8 −10.0Q4 −0.1 −2.5 −4.3 3.0 −27.3 6.9 −1.2 −3.0 24.4 −16.3
2008 Q1 1.2 2.4 3.3 0.4 −37.5 −4.1 4.3 6.4 −7.2 3.5Q2 −1.2 −2.5 −0.5 −8.0 − 2.6 −4.1 −0.8 −26.8 −3.4Q3 −1.1 −3.5 −2.6 −7.1 220.0 0.1 2.7 1.0 16.9 4.4Q4 −2.4 −2.9 −1.9 −6.3 6.2 −4.4 1.6 0.7 3.0 9.3
2009 Q1 −3.6 −3.6 −4.7 0.9 −41.2 −2.4 −4.7 −5.3 4.7 −11.6Q2 −1.1 0.6 1.5 −2.3 20.0 −0.6 −1.9 −5.5 22.3 −Q3 1.1 3.8 4.4 1.9 8.3 1.7 −0.1 3.7 −24.2 6.1Q4 1.0 0.3 0.3 −0.2 38.5 1.4 −0.8 −1.3 4.8 −3.3
2010 Q1 1.0 −0.3 −1.0 2.2 −11.1 −2.5 3.6 6.1 −12.1 0.9
Percentage chang e , quar ter on corresponding quarter of previous year
2007 Q1 0.1 2.6 1.2 7.8 −57.9 6.5 −5.2 −10.6 3.9 32.5Q2 3.3 6.4 5.4 9.8 −35.7 9.4 2.8 3.8 −8.1 7.9Q3 2.8 7.2 5.5 12.2 10.0 9.0 −5.8 0.9 −39.8 0.7Q4 4.3 2.1 −1.4 12.8 − 18.0 −1.5 −3.0 29.8 −22.6
2008 Q1 4.5 4.2 3.3 7.2 −37.5 3.6 7.4 18.1 −18.8 −28.2Q2 −0.4 −1.3 −0.7 −2.7 −44.4 2.9 −4.5 −0.6 −17.0 −24.7Q3 −1.2 −6.1 −4.3 −11.5 45.5 5.3 1.5 3.4 −1.2 −12.6Q4 −3.4 −6.5 −1.9 −19.5 112.5 −5.8 4.3 7.2 −18.2 14.2
2009 Q1 −8.1 −11.9 −9.5 −19.1 100.0 −4.2 −4.7 −4.5 −7.7 −2.6Q2 −7.9 −9.1 −7.6 −14.1 140.0 −7.2 −2.5 −8.9 54.2 0.9Q3 −5.9 −2.2 −0.9 −5.9 −18.8 −5.8 −5.2 −6.5 − 2.5Q4 −2.7 1.1 1.3 0.2 5.9 − −7.3 −8.3 1.8 −9.3
2010 Q1 2.0 4.5 5.4 1.5 60.0 −0.1 0.8 2.7 −14.5 3.5
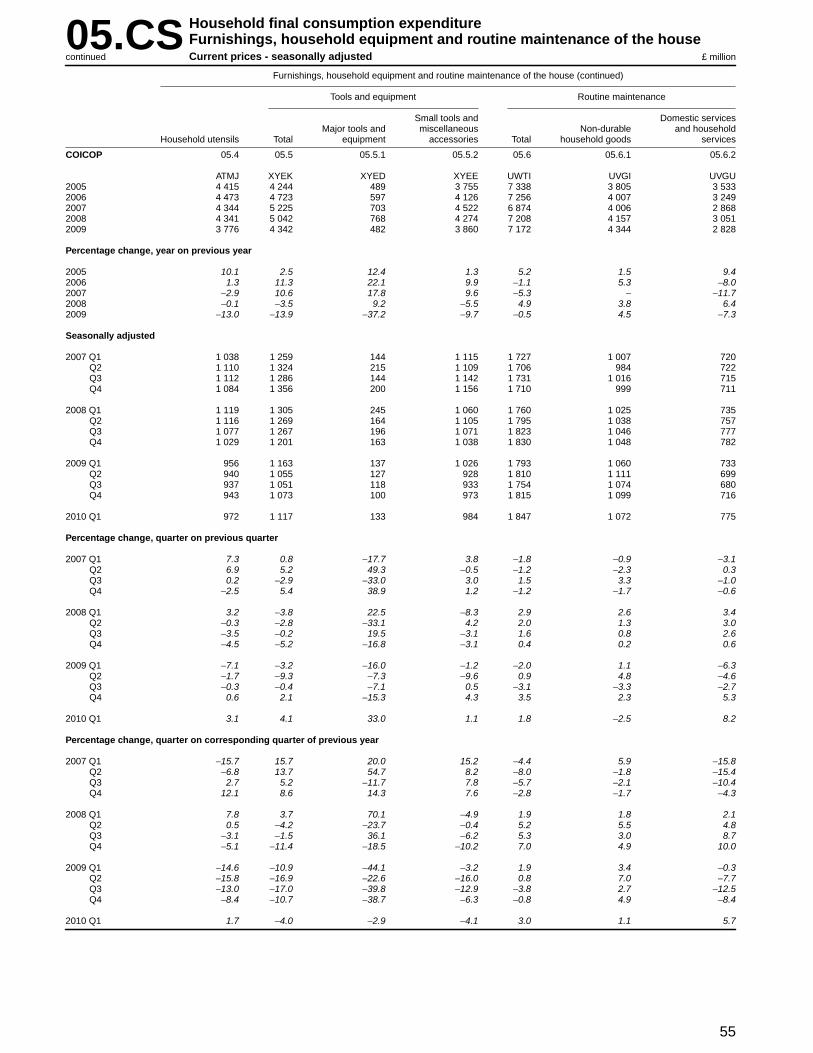
55
05.CS Household final consumption expenditureFurnishings, household equipment and routine maintenance of the houseCurrent prices - seasonally adjustedcontinued £ million
Fur nishings, household equipment and routine maintenance of the house (continued)
Tools and equipment Routine maintenance
Small tools and Domestic servicesMajor tools and miscellaneous Non-durable and household
Household utensils Total equipment accessor ies Total household goods services
COICOP 05.4 05.5 05.5.1 05.5.2 05.6 05.6.1 05.6.2
ATMJ XYEK XYED XYEE UWTI UVGI UVGU2005 4 415 4 244 489 3 755 7 338 3 805 3 5332006 4 473 4 723 597 4 126 7 256 4 007 3 2492007 4 344 5 225 703 4 522 6 874 4 006 2 8682008 4 341 5 042 768 4 274 7 208 4 157 3 0512009 3 776 4 342 482 3 860 7 172 4 344 2 828
Percentage chang e , year on previous year
2005 10.1 2.5 12.4 1.3 5.2 1.5 9.42006 1.3 11.3 22.1 9.9 −1.1 5.3 −8.02007 −2.9 10.6 17.8 9.6 −5.3 − −11.72008 −0.1 −3.5 9.2 −5.5 4.9 3.8 6.42009 −13.0 −13.9 −37.2 −9.7 −0.5 4.5 −7.3
Seasonally adjusted
2007 Q1 1 038 1 259 144 1 115 1 727 1 007 720Q2 1 110 1 324 215 1 109 1 706 984 722Q3 1 112 1 286 144 1 142 1 731 1 016 715Q4 1 084 1 356 200 1 156 1 710 999 711
2008 Q1 1 119 1 305 245 1 060 1 760 1 025 735Q2 1 116 1 269 164 1 105 1 795 1 038 757Q3 1 077 1 267 196 1 071 1 823 1 046 777Q4 1 029 1 201 163 1 038 1 830 1 048 782
2009 Q1 956 1 163 137 1 026 1 793 1 060 733Q2 940 1 055 127 928 1 810 1 111 699Q3 937 1 051 118 933 1 754 1 074 680Q4 943 1 073 100 973 1 815 1 099 716
2010 Q1 972 1 117 133 984 1 847 1 072 775
Percentage chang e , quar ter on previous quarter
2007 Q1 7.3 0.8 −17.7 3.8 −1.8 −0.9 −3.1Q2 6.9 5.2 49.3 −0.5 −1.2 −2.3 0.3Q3 0.2 −2.9 −33.0 3.0 1.5 3.3 −1.0Q4 −2.5 5.4 38.9 1.2 −1.2 −1.7 −0.6
2008 Q1 3.2 −3.8 22.5 −8.3 2.9 2.6 3.4Q2 −0.3 −2.8 −33.1 4.2 2.0 1.3 3.0Q3 −3.5 −0.2 19.5 −3.1 1.6 0.8 2.6Q4 −4.5 −5.2 −16.8 −3.1 0.4 0.2 0.6
2009 Q1 −7.1 −3.2 −16.0 −1.2 −2.0 1.1 −6.3Q2 −1.7 −9.3 −7.3 −9.6 0.9 4.8 −4.6Q3 −0.3 −0.4 −7.1 0.5 −3.1 −3.3 −2.7Q4 0.6 2.1 −15.3 4.3 3.5 2.3 5.3
2010 Q1 3.1 4.1 33.0 1.1 1.8 −2.5 8.2
Percentage chang e , quar ter on corresponding quarter of previous year
2007 Q1 −15.7 15.7 20.0 15.2 −4.4 5.9 −15.8Q2 −6.8 13.7 54.7 8.2 −8.0 −1.8 −15.4Q3 2.7 5.2 −11.7 7.8 −5.7 −2.1 −10.4Q4 12.1 8.6 14.3 7.6 −2.8 −1.7 −4.3
2008 Q1 7.8 3.7 70.1 −4.9 1.9 1.8 2.1Q2 0.5 −4.2 −23.7 −0.4 5.2 5.5 4.8Q3 −3.1 −1.5 36.1 −6.2 5.3 3.0 8.7Q4 −5.1 −11.4 −18.5 −10.2 7.0 4.9 10.0
2009 Q1 −14.6 −10.9 −44.1 −3.2 1.9 3.4 −0.3Q2 −15.8 −16.9 −22.6 −16.0 0.8 7.0 −7.7Q3 −13.0 −17.0 −39.8 −12.9 −3.8 2.7 −12.5Q4 −8.4 −10.7 −38.7 −6.3 −0.8 4.9 −8.4
2010 Q1 1.7 −4.0 −2.9 −4.1 3.0 1.1 5.7

56
05.KN Household final consumption expenditureFurnishings, household equipment and routine maintenance of the houseChained volume measures, reference year 2006 - not seasonally adjusted £ million
Fur nishings, household equipment and routine maintenance of the house
Fur niture and furnishings, car pets and other floorcoverings Household appliances
Repair offur niture, Small
Car pets and furnishings Major electr ic Repair ofFur niture and other floor and floor Household household household household
Total Total furnishings coverings coverings textiles Total appliances appliances appliances
COICOP 05 05.1 05.1.1 05.1.2 05.1.3 05.2 05.3 05.3.1 05.3.2 05.3.3
ADJF ADJG ADPD ADPE ADPF ADJH ADJI ADPG ADPH ADPI2005 44 911 17 203 12 925 4 221 57 5 138 6 253 4 964 728 5612006 45 613 17 256 12 940 4 265 51 5 433 6 472 5 074 856 5422007 45 586 17 368 12 729 4 603 36 6 067 6 156 4 837 769 5502008 44 164 16 084 12 036 4 007 41 6 165 6 214 5 118 654 4422009 39 733 14 570 11 064 3 459 47 5 740 5 522 4 431 665 426
Percentage chang e , year on previous year
2005 1.7 −2.7 −3.1 −2.1 103.6 −1.6 6.7 11.3 −9.1 −7.62006 1.6 0.3 0.1 1.0 −10.5 5.7 3.5 2.2 17.6 −3.42007 −0.1 0.6 −1.6 7.9 −29.4 11.7 −4.9 −4.7 −10.2 1.52008 −3.1 −7.4 −5.4 −12.9 13.9 1.6 0.9 5.8 −15.0 −19.62009 −10.0 −9.4 −8.1 −13.7 14.6 −6.9 −11.1 −13.4 1.7 −3.6
Not seasonally adjusted
2007 Q1 10 716 4 224 3 106 1 110 8 1 406 1 506 1 092 241 173Q2 11 185 4 171 3 049 1 113 9 1 438 1 459 1 205 119 135Q3 11 310 4 400 3 223 1 166 11 1 423 1 409 1 161 131 117Q4 12 375 4 573 3 351 1 214 8 1 800 1 782 1 379 278 125
2008 Q1 10 897 4 250 3 117 1 128 5 1 456 1 563 1 265 182 116Q2 10 827 3 912 2 900 1 007 5 1 493 1 371 1 181 96 94Q3 10 819 3 884 2 910 959 15 1 512 1 431 1 202 131 98Q4 11 621 4 038 3 109 913 16 1 704 1 849 1 470 245 134
2009 Q1 9 726 3 539 2 687 844 8 1 395 1 447 1 174 162 111Q2 9 618 3 472 2 625 837 10 1 343 1 234 1 003 138 93Q3 9 741 3 670 2 756 901 13 1 378 1 283 1 053 129 101Q4 10 648 3 889 2 996 877 16 1 624 1 558 1 201 236 121
2010 Q1 9 554 3 473 2 648 811 14 1 330 1 364 1 115 137 112
Percentage chang e , quar ter on corresponding quarter of previous year
2007 Q1 −2.5 −1.8 −3.8 5.3 −57.9 7.2 −4.4 −9.2 −0.8 33.1Q2 −1.2 0.7 −1.5 7.8 −35.7 10.7 −2.4 −1.3 −17.4 3.8Q3 1.9 4.3 2.6 9.2 10.0 9.2 −5.1 2.4 −43.5 −1.7Q4 1.4 −0.5 −3.6 9.3 − 18.4 −7.0 −9.1 17.3 −23.3
2008 Q1 1.7 0.6 0.4 1.6 −37.5 3.6 3.8 15.8 −24.5 −32.9Q2 −3.2 −6.2 −4.9 −9.5 −44.4 3.8 −6.0 −2.0 −19.3 −30.4Q3 −4.3 −11.7 −9.7 −17.8 36.4 6.3 1.6 3.5 − −16.2Q4 −6.1 −11.7 −7.2 −24.8 100.0 −5.3 3.8 6.6 −11.9 7.2
2009 Q1 −10.7 −16.7 −13.8 −25.2 60.0 −4.2 −7.4 −7.2 −11.0 −4.3Q2 −11.2 −11.2 −9.5 −16.9 100.0 −10.0 −10.0 −15.1 43.8 −1.1Q3 −10.0 −5.5 −5.3 −6.0 −13.3 −8.9 −10.3 −12.4 −1.5 3.1Q4 −8.4 −3.7 −3.6 −3.9 − −4.7 −15.7 −18.3 −3.7 −9.7
2010 Q1 −1.8 −1.9 −1.5 −3.9 75.0 −4.7 −5.7 −5.0 −15.4 0.9

57
05.KN Household final consumption expenditureFurnishings, household equipment and routine maintenance of the houseChained volume measures, reference year 2006 - not seasonally adjustedcontinued £ million
Fur nishings, household equipment and routine maintenance of the house (continued)
Tools and equipment Routine maintenance
Small tools and Domestic servicesMajor tools and miscellaneous Non-durable and household
Household utensils Total equipment accessor ies Total household goods services
COICOP 05.4 05.5 05.5.1 05.5.2 05.6 05.6.1 05.6.2
ADJJ ADJK ADPJ ADPK ADJL ADPL ADPM2005 4 405 4 309 498 3 811 7 640 3 936 3 7082006 4 473 4 723 597 4 126 7 256 4 007 3 2492007 4 214 5 133 690 4 443 6 648 3 925 2 7232008 4 098 4 883 742 4 141 6 720 3 955 2 7652009 3 424 4 135 460 3 675 6 342 3 833 2 509
Percentage chang e , year on previous year
2005 12.5 4.2 21.2 2.3 2.5 1.5 3.62006 1.5 9.6 19.9 8.3 −5.0 1.8 −12.42007 −5.8 8.7 15.6 7.7 −8.4 −2.0 −16.22008 −2.8 −4.9 7.5 −6.8 1.1 0.8 1.52009 −16.4 −15.3 −38.0 −11.3 −5.6 −3.1 −9.3
Not seasonally adjusted
2007 Q1 947 1 166 119 1 047 1 467 983 484Q2 1 031 1 372 221 1 151 1 714 957 757Q3 1 033 1 218 139 1 079 1 827 1 009 818Q4 1 203 1 377 211 1 166 1 640 976 664
2008 Q1 983 1 181 197 984 1 464 994 470Q2 1 013 1 294 174 1 120 1 744 1 003 741Q3 972 1 186 188 998 1 834 985 849Q4 1 130 1 222 183 1 039 1 678 973 705
2009 Q1 825 1 055 105 950 1 465 939 526Q2 821 1 049 136 913 1 699 981 718Q3 813 963 112 851 1 634 949 685Q4 965 1 068 107 961 1 544 964 580
2010 Q1 779 978 97 881 1 630 921 709
Percentage chang e , quar ter on corresponding quarter of previous year
2007 Q1 −17.9 13.3 11.2 13.6 −8.7 2.5 −25.1Q2 −10.0 9.7 53.5 4.0 −14.3 −4.2 −24.5Q3 −1.4 2.7 −15.2 5.6 −2.0 −4.1 0.7Q4 6.9 9.5 15.9 8.5 −8.2 −2.1 −15.8
2008 Q1 3.8 1.3 65.5 −6.0 −0.2 1.1 −2.9Q2 −1.7 −5.7 −21.3 −2.7 1.8 4.8 −2.1Q3 −5.9 −2.6 35.3 −7.5 0.4 −2.4 3.8Q4 −6.1 −11.3 −13.3 −10.9 2.3 −0.3 6.2
2009 Q1 −16.1 −10.7 −46.7 −3.5 0.1 −5.5 11.9Q2 −19.0 −18.9 −21.8 −18.5 −2.6 −2.2 −3.1Q3 −16.4 −18.8 −40.4 −14.7 −10.9 −3.7 −19.3Q4 −14.6 −12.6 −41.5 −7.5 −8.0 −0.9 −17.7
2010 Q1 −5.6 −7.3 −7.6 −7.3 11.3 −1.9 34.8

58
05.KS Household final consumption expenditureFurnishings, household equipment and routine maintenance of the houseChained volume measures, reference year 2006 - seasonally adjusted £ million
Fur nishings, household equipment and routine maintenance of the house
Fur niture and furnishings, car pets and other floorcoverings Household appliances
Repair offur niture, Small
Car pets and furnishings Major electr ic Repair ofFur niture and other floor and floor Household household household household
Total Total furnishings coverings coverings textiles Total appliances appliances appliances
COICOP 05 05.1 05.1.1 05.1.2 05.1.3 05.2 05.3 05.3.1 05.3.2 05.3.3
ZAVW ZAVY ATQX ATRD UWHM ATRF ZAWA XYJP XYJQ UWHN2005 44 911 17 203 12 925 4 221 57 5 138 6 253 4 964 728 5612006 45 613 17 256 12 940 4 265 51 5 433 6 472 5 074 856 5422007 45 586 17 368 12 729 4 603 36 6 067 6 156 4 837 769 5502008 44 164 16 084 12 036 4 007 41 6 165 6 214 5 118 654 4422009 39 733 14 570 11 064 3 459 47 5 740 5 522 4 431 665 426
Percentage chang e , year on previous year
2005 1.7 −2.7 −3.1 −2.1 103.6 −1.6 6.7 11.3 −9.1 −7.62006 1.6 0.3 0.1 1.0 −10.5 5.7 3.5 2.2 17.6 −3.42007 −0.1 0.6 −1.6 7.9 −29.4 11.7 −4.9 −4.7 −10.2 1.52008 −3.1 −7.4 −5.4 −12.9 13.9 1.6 0.9 5.8 −15.0 −19.62009 −10.0 −9.4 −8.1 −13.7 14.6 −6.9 −11.1 −13.4 1.7 −3.6
Seasonally adjusted
2007 Q1 11 233 4 292 3 147 1 137 8 1 469 1 523 1 119 241 163Q2 11 478 4 346 3 194 1 143 9 1 521 1 593 1 279 167 147Q3 11 485 4 443 3 285 1 147 11 1 484 1 547 1 253 163 131Q4 11 390 4 287 3 103 1 176 8 1 593 1 493 1 186 198 109
2008 Q1 11 452 4 339 3 175 1 159 5 1 515 1 585 1 284 190 111Q2 11 128 4 067 3 032 1 030 5 1 573 1 507 1 264 138 105Q3 10 929 3 900 2 951 934 15 1 572 1 547 1 278 160 109Q4 10 655 3 778 2 878 884 16 1 505 1 575 1 292 166 117
2009 Q1 10 170 3 635 2 753 873 9 1 454 1 457 1 182 168 107Q2 9 870 3 611 2 745 856 10 1 416 1 384 1 081 199 104Q3 9 866 3 683 2 793 878 12 1 432 1 366 1 108 147 111Q4 9 827 3 641 2 773 852 16 1 438 1 315 1 060 151 104
2010 Q1 9 845 3 594 2 729 850 15 1 392 1 356 1 117 131 108
Percentage chang e , quar ter on previous quarter
2007 Q1 0.5 −0.5 −2.4 5.3 14.3 9.5 −4.6 −13.2 48.8 12.4Q2 2.2 1.3 1.5 0.5 12.5 3.5 4.6 14.3 −30.7 −9.8Q3 0.1 2.2 2.8 0.3 22.2 −2.4 −2.9 −2.0 −2.4 −10.9Q4 −0.8 −3.5 −5.5 2.5 −27.3 7.3 −3.5 −5.3 21.5 −16.8
2008 Q1 0.5 1.2 2.3 −1.4 −37.5 −4.9 6.2 8.3 −4.0 1.8Q2 −2.8 −6.3 −4.5 −11.1 − 3.8 −4.9 −1.6 −27.4 −5.4Q3 −1.8 −4.1 −2.7 −9.3 200.0 −0.1 2.7 1.1 15.9 3.8Q4 −2.5 −3.1 −2.5 −5.4 6.7 −4.3 1.8 1.1 3.8 7.3
2009 Q1 −4.6 −3.8 −4.3 −1.2 −43.8 −3.4 −7.5 −8.5 1.2 −8.5Q2 −2.9 −0.7 −0.3 −1.9 11.1 −2.6 −5.0 −8.5 18.5 −2.8Q3 − 2.0 1.7 2.6 20.0 1.1 −1.3 2.5 −26.1 6.7Q4 −0.4 −1.1 −0.7 −3.0 33.3 0.4 −3.7 −4.3 2.7 −6.3
2010 Q1 0.2 −1.3 −1.6 −0.2 −6.2 −3.2 3.1 5.4 −13.2 3.8
Percentage chang e , quar ter on corresponding quarter of previous year
2007 Q1 −2.1 −1.1 −3.2 6.7 −60.0 7.9 −5.3 −10.5 3.0 31.5Q2 −0.5 0.5 −1.7 7.7 −35.7 10.6 −1.7 −0.9 −12.6 5.8Q3 0.5 3.8 2.2 8.4 10.0 9.5 −6.1 0.7 −39.4 −2.2Q4 1.9 −0.6 −3.8 8.9 14.3 18.8 −6.5 −8.0 22.2 −24.8
2008 Q1 1.9 1.1 0.9 1.9 −37.5 3.1 4.1 14.7 −21.2 −31.9Q2 −3.0 −6.4 −5.1 −9.9 −44.4 3.4 −5.4 −1.2 −17.4 −28.6Q3 −4.8 −12.2 −10.2 −18.6 36.4 5.9 − 2.0 −1.8 −16.8Q4 −6.5 −11.9 −7.3 −24.8 100.0 −5.5 5.5 8.9 −16.2 7.3
2009 Q1 −11.2 −16.2 −13.3 −24.7 80.0 −4.0 −8.1 −7.9 −11.6 −3.6Q2 −11.3 −11.2 −9.5 −16.9 100.0 −10.0 −8.2 −14.5 44.2 −1.0Q3 −9.7 −5.6 −5.4 −6.0 −20.0 −8.9 −11.7 −13.3 −8.1 1.8Q4 −7.8 −3.6 −3.6 −3.6 − −4.5 −16.5 −18.0 −9.0 −11.1
2010 Q1 −3.2 −1.1 −0.9 −2.6 66.7 −4.3 −6.9 −5.5 −22.0 0.9
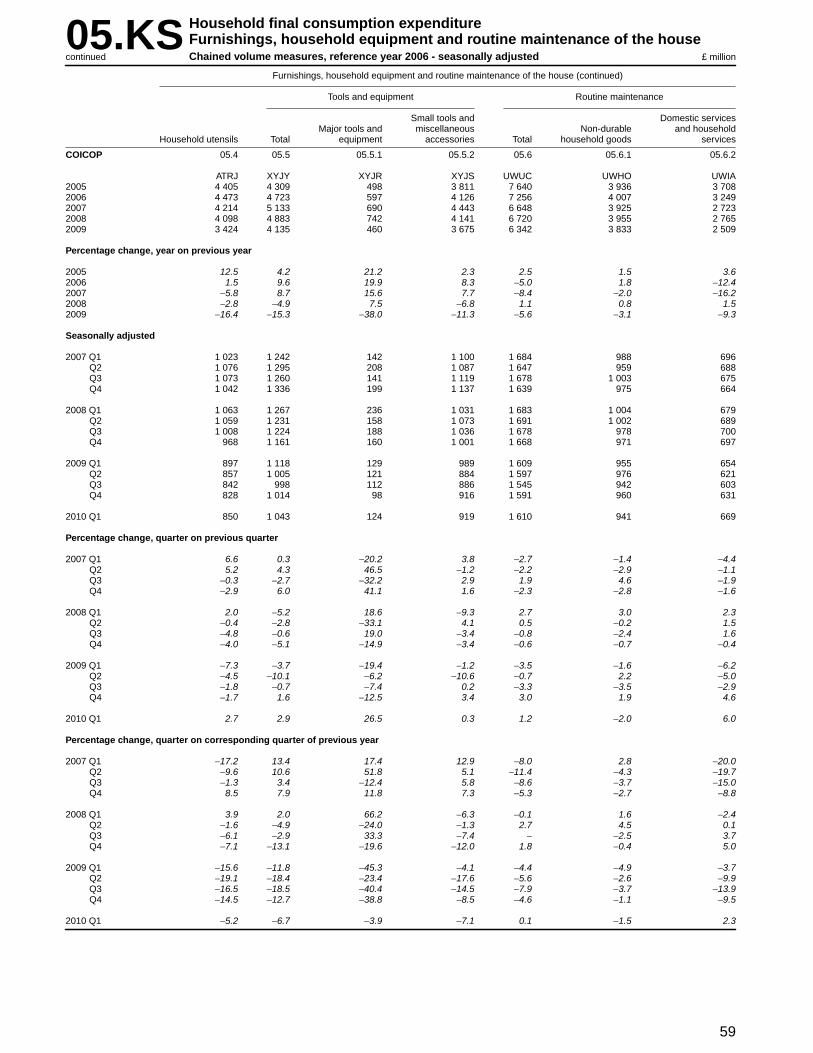
59
05.KS Household final consumption expenditureFurnishings, household equipment and routine maintenance of the houseChained volume measures, reference year 2006 - seasonally adjustedcontinued £ million
Fur nishings, household equipment and routine maintenance of the house (continued)
Tools and equipment Routine maintenance
Small tools and Domestic servicesMajor tools and miscellaneous Non-durable and household
Household utensils Total equipment accessor ies Total household goods services
COICOP 05.4 05.5 05.5.1 05.5.2 05.6 05.6.1 05.6.2
ATRJ XYJY XYJR XYJS UWUC UWHO UWIA2005 4 405 4 309 498 3 811 7 640 3 936 3 7082006 4 473 4 723 597 4 126 7 256 4 007 3 2492007 4 214 5 133 690 4 443 6 648 3 925 2 7232008 4 098 4 883 742 4 141 6 720 3 955 2 7652009 3 424 4 135 460 3 675 6 342 3 833 2 509
Percentage chang e , year on previous year
2005 12.5 4.2 21.2 2.3 2.5 1.5 3.62006 1.5 9.6 19.9 8.3 −5.0 1.8 −12.42007 −5.8 8.7 15.6 7.7 −8.4 −2.0 −16.22008 −2.8 −4.9 7.5 −6.8 1.1 0.8 1.52009 −16.4 −15.3 −38.0 −11.3 −5.6 −3.1 −9.3
Seasonally adjusted
2007 Q1 1 023 1 242 142 1 100 1 684 988 696Q2 1 076 1 295 208 1 087 1 647 959 688Q3 1 073 1 260 141 1 119 1 678 1 003 675Q4 1 042 1 336 199 1 137 1 639 975 664
2008 Q1 1 063 1 267 236 1 031 1 683 1 004 679Q2 1 059 1 231 158 1 073 1 691 1 002 689Q3 1 008 1 224 188 1 036 1 678 978 700Q4 968 1 161 160 1 001 1 668 971 697
2009 Q1 897 1 118 129 989 1 609 955 654Q2 857 1 005 121 884 1 597 976 621Q3 842 998 112 886 1 545 942 603Q4 828 1 014 98 916 1 591 960 631
2010 Q1 850 1 043 124 919 1 610 941 669
Percentage chang e , quar ter on previous quarter
2007 Q1 6.6 0.3 −20.2 3.8 −2.7 −1.4 −4.4Q2 5.2 4.3 46.5 −1.2 −2.2 −2.9 −1.1Q3 −0.3 −2.7 −32.2 2.9 1.9 4.6 −1.9Q4 −2.9 6.0 41.1 1.6 −2.3 −2.8 −1.6
2008 Q1 2.0 −5.2 18.6 −9.3 2.7 3.0 2.3Q2 −0.4 −2.8 −33.1 4.1 0.5 −0.2 1.5Q3 −4.8 −0.6 19.0 −3.4 −0.8 −2.4 1.6Q4 −4.0 −5.1 −14.9 −3.4 −0.6 −0.7 −0.4
2009 Q1 −7.3 −3.7 −19.4 −1.2 −3.5 −1.6 −6.2Q2 −4.5 −10.1 −6.2 −10.6 −0.7 2.2 −5.0Q3 −1.8 −0.7 −7.4 0.2 −3.3 −3.5 −2.9Q4 −1.7 1.6 −12.5 3.4 3.0 1.9 4.6
2010 Q1 2.7 2.9 26.5 0.3 1.2 −2.0 6.0
Percentage chang e , quar ter on corresponding quarter of previous year
2007 Q1 −17.2 13.4 17.4 12.9 −8.0 2.8 −20.0Q2 −9.6 10.6 51.8 5.1 −11.4 −4.3 −19.7Q3 −1.3 3.4 −12.4 5.8 −8.6 −3.7 −15.0Q4 8.5 7.9 11.8 7.3 −5.3 −2.7 −8.8
2008 Q1 3.9 2.0 66.2 −6.3 −0.1 1.6 −2.4Q2 −1.6 −4.9 −24.0 −1.3 2.7 4.5 0.1Q3 −6.1 −2.9 33.3 −7.4 − −2.5 3.7Q4 −7.1 −13.1 −19.6 −12.0 1.8 −0.4 5.0
2009 Q1 −15.6 −11.8 −45.3 −4.1 −4.4 −4.9 −3.7Q2 −19.1 −18.4 −23.4 −17.6 −5.6 −2.6 −9.9Q3 −16.5 −18.5 −40.4 −14.5 −7.9 −3.7 −13.9Q4 −14.5 −12.7 −38.8 −8.5 −4.6 −1.1 −9.5
2010 Q1 −5.2 −6.7 −3.9 −7.1 0.1 −1.5 2.3
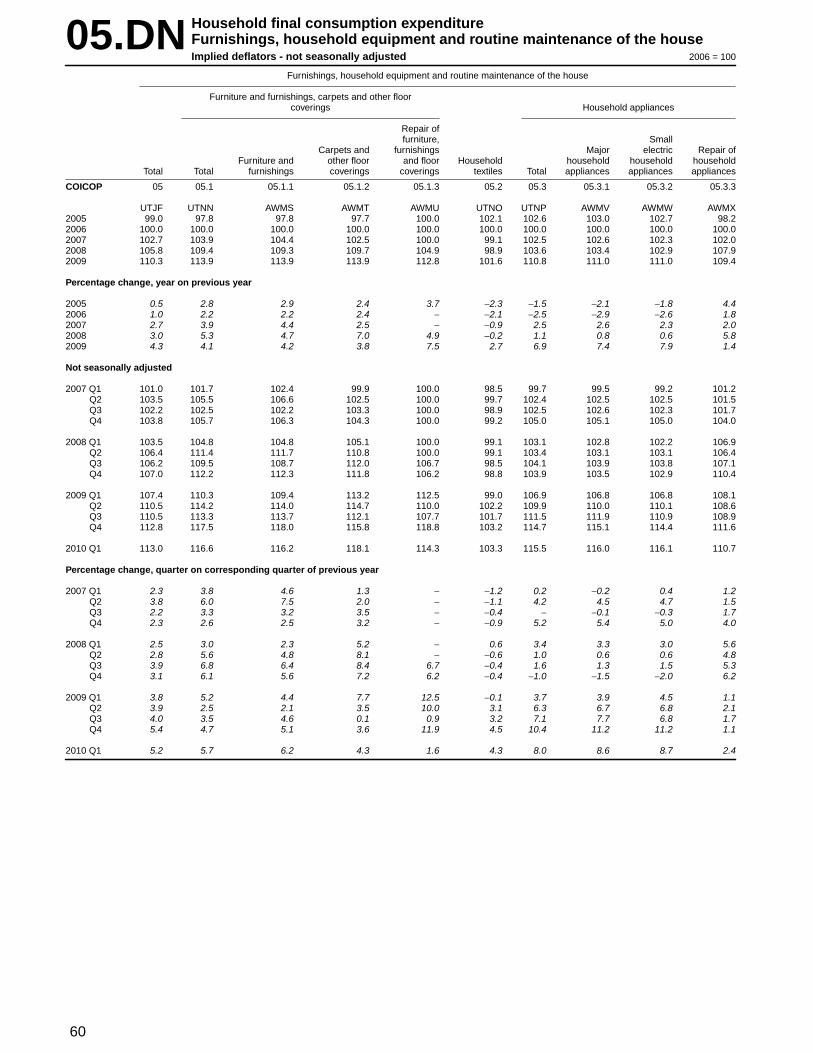
60
05.DN Household final consumption expenditureFurnishings, household equipment and routine maintenance of the houseImplied deflators - not seasonally adjusted 2006 = 100
Fur nishings, household equipment and routine maintenance of the house
Fur niture and furnishings, car pets and other floorcoverings Household appliances
Repair offur niture, Small
Car pets and furnishings Major electr ic Repair ofFur niture and other floor and floor Household household household household
Total Total furnishings coverings coverings textiles Total appliances appliances appliances
COICOP 05 05.1 05.1.1 05.1.2 05.1.3 05.2 05.3 05.3.1 05.3.2 05.3.3
UTJF UTNN AWMS AWMT AWMU UTNO UTNP AWMV AWMW AWMX2005 99.0 97.8 97.8 97.7 100.0 102.1 102.6 103.0 102.7 98.22006 100.0 100.0 100.0 100.0 100.0 100.0 100.0 100.0 100.0 100.02007 102.7 103.9 104.4 102.5 100.0 99.1 102.5 102.6 102.3 102.02008 105.8 109.4 109.3 109.7 104.9 98.9 103.6 103.4 102.9 107.92009 110.3 113.9 113.9 113.9 112.8 101.6 110.8 111.0 111.0 109.4
Percentage chang e , year on previous year
2005 0.5 2.8 2.9 2.4 3.7 −2.3 −1.5 −2.1 −1.8 4.42006 1.0 2.2 2.2 2.4 − −2.1 −2.5 −2.9 −2.6 1.82007 2.7 3.9 4.4 2.5 − −0.9 2.5 2.6 2.3 2.02008 3.0 5.3 4.7 7.0 4.9 −0.2 1.1 0.8 0.6 5.82009 4.3 4.1 4.2 3.8 7.5 2.7 6.9 7.4 7.9 1.4
Not seasonally adjusted
2007 Q1 101.0 101.7 102.4 99.9 100.0 98.5 99.7 99.5 99.2 101.2Q2 103.5 105.5 106.6 102.5 100.0 99.7 102.4 102.5 102.5 101.5Q3 102.2 102.5 102.2 103.3 100.0 98.9 102.5 102.6 102.3 101.7Q4 103.8 105.7 106.3 104.3 100.0 99.2 105.0 105.1 105.0 104.0
2008 Q1 103.5 104.8 104.8 105.1 100.0 99.1 103.1 102.8 102.2 106.9Q2 106.4 111.4 111.7 110.8 100.0 99.1 103.4 103.1 103.1 106.4Q3 106.2 109.5 108.7 112.0 106.7 98.5 104.1 103.9 103.8 107.1Q4 107.0 112.2 112.3 111.8 106.2 98.8 103.9 103.5 102.9 110.4
2009 Q1 107.4 110.3 109.4 113.2 112.5 99.0 106.9 106.8 106.8 108.1Q2 110.5 114.2 114.0 114.7 110.0 102.2 109.9 110.0 110.1 108.6Q3 110.5 113.3 113.7 112.1 107.7 101.7 111.5 111.9 110.9 108.9Q4 112.8 117.5 118.0 115.8 118.8 103.2 114.7 115.1 114.4 111.6
2010 Q1 113.0 116.6 116.2 118.1 114.3 103.3 115.5 116.0 116.1 110.7
Percentage chang e , quar ter on corresponding quarter of previous year
2007 Q1 2.3 3.8 4.6 1.3 − −1.2 0.2 −0.2 0.4 1.2Q2 3.8 6.0 7.5 2.0 − −1.1 4.2 4.5 4.7 1.5Q3 2.2 3.3 3.2 3.5 − −0.4 − −0.1 −0.3 1.7Q4 2.3 2.6 2.5 3.2 − −0.9 5.2 5.4 5.0 4.0
2008 Q1 2.5 3.0 2.3 5.2 − 0.6 3.4 3.3 3.0 5.6Q2 2.8 5.6 4.8 8.1 − −0.6 1.0 0.6 0.6 4.8Q3 3.9 6.8 6.4 8.4 6.7 −0.4 1.6 1.3 1.5 5.3Q4 3.1 6.1 5.6 7.2 6.2 −0.4 −1.0 −1.5 −2.0 6.2
2009 Q1 3.8 5.2 4.4 7.7 12.5 −0.1 3.7 3.9 4.5 1.1Q2 3.9 2.5 2.1 3.5 10.0 3.1 6.3 6.7 6.8 2.1Q3 4.0 3.5 4.6 0.1 0.9 3.2 7.1 7.7 6.8 1.7Q4 5.4 4.7 5.1 3.6 11.9 4.5 10.4 11.2 11.2 1.1
2010 Q1 5.2 5.7 6.2 4.3 1.6 4.3 8.0 8.6 8.7 2.4

61
05.DN Household final consumption expenditureFurnishings, household equipment and routine maintenance of the houseImplied deflators - not seasonally adjustedcontinued 2006 = 100
Fur nishings, household equipment and routine maintenance of the house (continued)
Tools and equipment Routine maintenance
Small tools and Domestic servicesMajor tools and miscellaneous Non-durable and household
Household utensils Total equipment accessor ies Total household goods services
COICOP 05.4 05.5 05.5.1 05.5.2 05.6 05.6.1 05.6.2
UTNQ UTNR AWMY AWMZ UTNS AWNA AWNB2005 100.2 98.5 98.2 98.5 96.0 96.7 95.32006 100.0 100.0 100.0 100.0 100.0 100.0 100.02007 103.1 101.8 101.9 101.8 103.4 102.1 105.32008 105.9 103.3 103.5 103.2 107.3 105.1 110.32009 110.3 105.0 104.8 105.0 113.1 113.3 112.7
Percentage chang e , year on previous year
2005 −2.1 −1.7 −7.2 −0.9 2.6 − 5.72006 −0.2 1.5 1.8 1.5 4.2 3.4 4.92007 3.1 1.8 1.9 1.8 3.4 2.1 5.32008 2.7 1.5 1.6 1.4 3.8 2.9 4.72009 4.2 1.6 1.3 1.7 5.4 7.8 2.2
Not seasonally adjusted
2007 Q1 101.0 101.6 101.7 101.6 102.4 101.7 103.7Q2 103.8 102.2 102.3 102.2 103.7 102.7 104.9Q3 102.8 101.8 100.7 101.9 103.7 102.0 105.9Q4 104.4 101.5 102.4 101.4 103.7 101.8 106.3
2008 Q1 105.0 103.0 103.6 102.9 104.0 102.1 107.9Q2 106.2 103.3 103.4 103.3 106.0 103.6 109.3Q3 106.3 103.2 103.2 103.2 109.2 107.7 111.0Q4 106.2 103.4 103.8 103.4 109.3 107.1 112.3
2009 Q1 106.3 104.0 105.7 103.8 111.7 111.2 112.5Q2 110.2 105.4 104.4 105.6 113.3 113.9 112.5Q3 110.2 104.8 103.6 104.9 114.1 115.1 112.7Q4 113.8 105.8 105.6 105.8 113.1 113.2 113.1
2010 Q1 114.1 107.2 107.2 107.2 114.2 114.2 114.1
Percentage chang e , quar ter on corresponding quarter of previous year
2007 Q1 2.0 2.0 2.6 1.9 3.9 3.0 5.3Q2 3.0 2.8 1.6 3.0 3.9 2.6 5.5Q3 3.8 1.8 0.7 1.9 3.5 1.9 5.5Q4 3.3 0.5 2.4 0.3 2.4 0.8 4.6
2008 Q1 4.0 1.4 1.9 1.3 1.6 0.4 4.1Q2 2.3 1.1 1.1 1.1 2.2 0.9 4.2Q3 3.4 1.4 2.5 1.3 5.3 5.6 4.8Q4 1.7 1.9 1.4 2.0 5.4 5.2 5.6
2009 Q1 1.2 1.0 2.0 0.9 7.4 8.9 4.3Q2 3.8 2.0 1.0 2.2 6.9 9.9 2.9Q3 3.7 1.6 0.4 1.6 4.5 6.9 1.5Q4 7.2 2.3 1.7 2.3 3.5 5.7 0.7
2010 Q1 7.3 3.1 1.4 3.3 2.2 2.7 1.4

62
05.DS Household final consumption expenditureFurnishings, household equipment and routine maintenance of the houseImplied deflators - seasonally adjusted 2006 = 100
Fur nishings, household equipment and routine maintenance of the house
Fur niture and furnishings, car pets and other floorcoverings Household appliances
Repair offur niture, Small
Car pets and furnishings Major electr ic Repair ofFur niture and other floor and floor Household household household household
Total Total furnishings coverings coverings textiles Total appliances appliances appliances
COICOP 05 05.1 05.1.1 05.1.2 05.1.3 05.2 05.3 05.3.1 05.3.2 05.3.3
UTJS UTPG AWQK AWQL AWQM UTPH UTPI AWQN AWQO AWQP2005 99.0 97.8 97.8 97.7 100.0 102.1 102.6 103.0 102.7 98.22006 100.0 100.0 100.0 100.0 100.0 100.0 100.0 100.0 100.0 100.02007 102.7 103.9 104.4 102.5 100.0 99.1 102.5 102.6 102.3 102.02008 105.8 109.4 109.3 109.7 104.9 98.9 103.6 103.4 102.9 107.92009 110.3 113.9 113.9 113.9 112.8 101.6 110.8 111.0 111.0 109.4
Percentage chang e , year on previous year
2005 0.5 2.8 2.9 2.4 3.7 −2.3 −1.5 −2.1 −1.8 4.42006 1.0 2.2 2.2 2.4 − −2.1 −2.5 −2.9 −2.6 1.82007 2.7 3.9 4.4 2.5 − −0.9 2.5 2.6 2.3 2.02008 3.0 5.3 4.7 7.0 4.9 −0.2 1.1 0.8 0.6 5.82009 4.3 4.1 4.2 3.8 7.5 2.7 6.9 7.4 7.9 1.4
Seasonally adjusted
2007 Q1 101.6 102.7 103.4 100.8 100.0 99.2 99.9 100.0 99.2 100.0Q2 103.0 104.5 105.5 101.7 100.0 99.1 103.0 103.1 102.4 102.0Q3 102.7 103.6 103.6 103.6 100.0 99.3 102.4 102.2 103.1 103.1Q4 103.4 104.7 104.9 104.1 100.0 98.9 104.8 104.8 105.6 103.7
2008 Q1 104.1 105.9 105.9 106.0 100.0 99.7 103.0 103.0 102.1 105.4Q2 105.8 110.2 110.3 109.8 100.0 98.5 103.9 103.7 102.9 107.6Q3 106.6 110.9 110.4 112.5 106.7 98.7 103.9 103.6 103.8 108.3Q4 106.7 111.1 111.0 111.4 106.2 98.5 103.7 103.2 103.0 110.3
2009 Q1 107.8 111.4 110.6 113.9 111.1 99.5 106.8 106.9 106.5 106.5Q2 109.9 112.8 112.6 113.4 120.0 101.6 110.3 110.5 110.1 109.6Q3 111.1 114.9 115.6 112.6 108.3 102.1 111.6 111.7 112.9 109.0Q4 112.6 116.5 116.8 115.8 112.5 103.1 115.1 115.3 115.2 112.5
2010 Q1 113.6 117.8 117.5 118.7 106.7 103.9 115.6 116.1 116.8 109.3
Percentage chang e , quar ter on previous quarter
2007 Q1 0.6 0.8 1.0 0.3 −12.5 −0.4 0.3 0.5 −0.2 −0.7Q2 1.4 1.8 2.0 0.9 − −0.1 3.1 3.1 3.2 2.0Q3 −0.3 −0.9 −1.8 1.9 − 0.2 −0.6 −0.9 0.7 1.1Q4 0.7 1.1 1.3 0.5 − −0.4 2.3 2.5 2.4 0.6
2008 Q1 0.7 1.1 1.0 1.8 − 0.8 −1.7 −1.7 −3.3 1.6Q2 1.6 4.1 4.2 3.6 − −1.2 0.9 0.7 0.8 2.1Q3 0.8 0.6 0.1 2.5 6.7 0.2 − −0.1 0.9 0.7Q4 0.1 0.2 0.5 −1.0 −0.5 −0.2 −0.2 −0.4 −0.8 1.8
2009 Q1 1.0 0.3 −0.4 2.2 4.6 1.0 3.0 3.6 3.4 −3.4Q2 1.9 1.3 1.8 −0.4 8.0 2.1 3.3 3.4 3.4 2.9Q3 1.1 1.9 2.7 −0.7 −9.7 0.5 1.2 1.1 2.5 −0.5Q4 1.4 1.4 1.0 2.8 3.9 1.0 3.1 3.2 2.0 3.2
2010 Q1 0.9 1.1 0.6 2.5 −5.2 0.8 0.4 0.7 1.4 −2.8
Percentage chang e , quar ter on corresponding quarter of previous year
2007 Q1 2.2 3.6 4.6 1.1 5.3 −1.2 0.1 −0.2 0.9 0.8Q2 3.8 5.9 7.3 2.0 − −1.1 4.6 4.7 5.1 2.0Q3 2.3 3.3 3.2 3.5 − −0.5 0.3 0.2 −0.6 3.1Q4 2.4 2.7 2.4 3.6 −12.5 −0.7 5.2 5.3 6.2 3.0
2008 Q1 2.5 3.1 2.4 5.2 − 0.5 3.1 3.0 2.9 5.4Q2 2.7 5.5 4.5 8.0 − −0.6 0.9 0.6 0.5 5.5Q3 3.8 7.0 6.6 8.6 6.7 −0.6 1.5 1.4 0.7 5.0Q4 3.2 6.1 5.8 7.0 6.2 −0.4 −1.0 −1.5 −2.5 6.4
2009 Q1 3.6 5.2 4.4 7.5 11.1 −0.2 3.7 3.8 4.3 1.0Q2 3.9 2.4 2.1 3.3 20.0 3.1 6.2 6.6 7.0 1.9Q3 4.2 3.6 4.7 0.1 1.5 3.4 7.4 7.8 8.8 0.6Q4 5.5 4.9 5.2 3.9 5.9 4.7 11.0 11.7 11.8 2.0
2010 Q1 5.4 5.7 6.2 4.2 −4.0 4.4 8.2 8.6 9.7 2.6
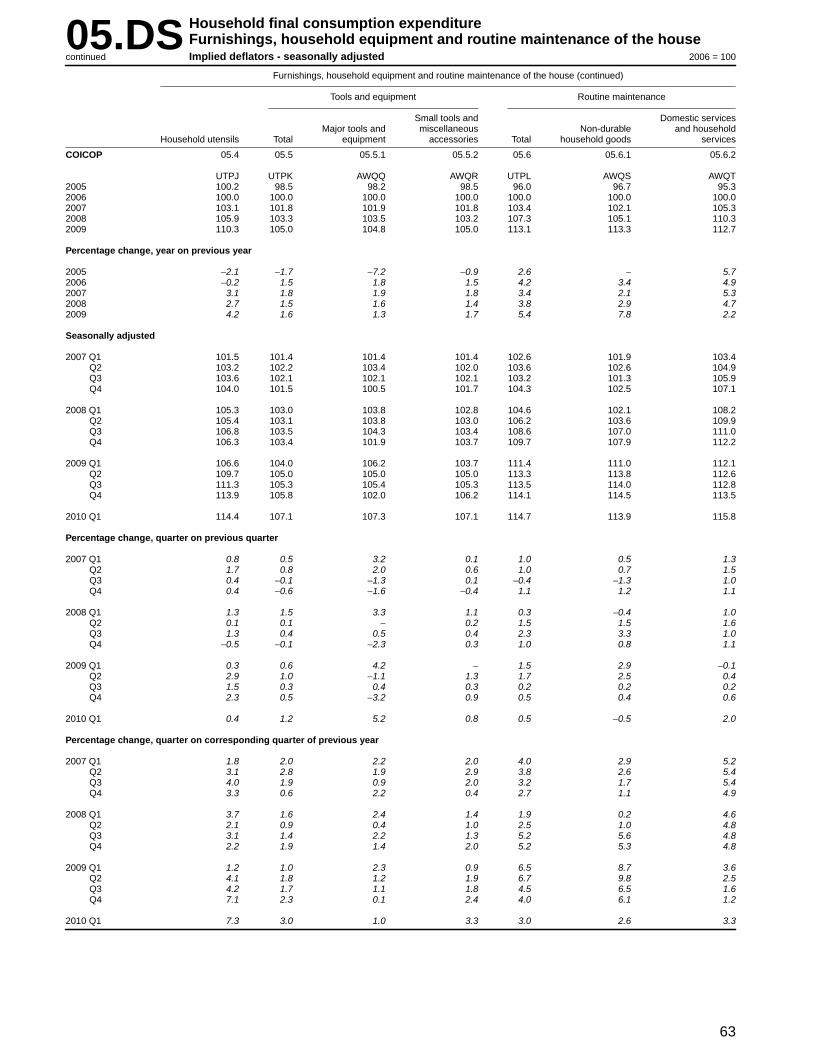
63
05.DS Household final consumption expenditureFurnishings, household equipment and routine maintenance of the houseImplied deflators - seasonally adjustedcontinued 2006 = 100
Fur nishings, household equipment and routine maintenance of the house (continued)
Tools and equipment Routine maintenance
Small tools and Domestic servicesMajor tools and miscellaneous Non-durable and household
Household utensils Total equipment accessor ies Total household goods services
COICOP 05.4 05.5 05.5.1 05.5.2 05.6 05.6.1 05.6.2
UTPJ UTPK AWQQ AWQR UTPL AWQS AWQT2005 100.2 98.5 98.2 98.5 96.0 96.7 95.32006 100.0 100.0 100.0 100.0 100.0 100.0 100.02007 103.1 101.8 101.9 101.8 103.4 102.1 105.32008 105.9 103.3 103.5 103.2 107.3 105.1 110.32009 110.3 105.0 104.8 105.0 113.1 113.3 112.7
Percentage chang e , year on previous year
2005 −2.1 −1.7 −7.2 −0.9 2.6 − 5.72006 −0.2 1.5 1.8 1.5 4.2 3.4 4.92007 3.1 1.8 1.9 1.8 3.4 2.1 5.32008 2.7 1.5 1.6 1.4 3.8 2.9 4.72009 4.2 1.6 1.3 1.7 5.4 7.8 2.2
Seasonally adjusted
2007 Q1 101.5 101.4 101.4 101.4 102.6 101.9 103.4Q2 103.2 102.2 103.4 102.0 103.6 102.6 104.9Q3 103.6 102.1 102.1 102.1 103.2 101.3 105.9Q4 104.0 101.5 100.5 101.7 104.3 102.5 107.1
2008 Q1 105.3 103.0 103.8 102.8 104.6 102.1 108.2Q2 105.4 103.1 103.8 103.0 106.2 103.6 109.9Q3 106.8 103.5 104.3 103.4 108.6 107.0 111.0Q4 106.3 103.4 101.9 103.7 109.7 107.9 112.2
2009 Q1 106.6 104.0 106.2 103.7 111.4 111.0 112.1Q2 109.7 105.0 105.0 105.0 113.3 113.8 112.6Q3 111.3 105.3 105.4 105.3 113.5 114.0 112.8Q4 113.9 105.8 102.0 106.2 114.1 114.5 113.5
2010 Q1 114.4 107.1 107.3 107.1 114.7 113.9 115.8
Percentage chang e , quar ter on previous quarter
2007 Q1 0.8 0.5 3.2 0.1 1.0 0.5 1.3Q2 1.7 0.8 2.0 0.6 1.0 0.7 1.5Q3 0.4 −0.1 −1.3 0.1 −0.4 −1.3 1.0Q4 0.4 −0.6 −1.6 −0.4 1.1 1.2 1.1
2008 Q1 1.3 1.5 3.3 1.1 0.3 −0.4 1.0Q2 0.1 0.1 − 0.2 1.5 1.5 1.6Q3 1.3 0.4 0.5 0.4 2.3 3.3 1.0Q4 −0.5 −0.1 −2.3 0.3 1.0 0.8 1.1
2009 Q1 0.3 0.6 4.2 − 1.5 2.9 −0.1Q2 2.9 1.0 −1.1 1.3 1.7 2.5 0.4Q3 1.5 0.3 0.4 0.3 0.2 0.2 0.2Q4 2.3 0.5 −3.2 0.9 0.5 0.4 0.6
2010 Q1 0.4 1.2 5.2 0.8 0.5 −0.5 2.0
Percentage chang e , quar ter on corresponding quarter of previous year
2007 Q1 1.8 2.0 2.2 2.0 4.0 2.9 5.2Q2 3.1 2.8 1.9 2.9 3.8 2.6 5.4Q3 4.0 1.9 0.9 2.0 3.2 1.7 5.4Q4 3.3 0.6 2.2 0.4 2.7 1.1 4.9
2008 Q1 3.7 1.6 2.4 1.4 1.9 0.2 4.6Q2 2.1 0.9 0.4 1.0 2.5 1.0 4.8Q3 3.1 1.4 2.2 1.3 5.2 5.6 4.8Q4 2.2 1.9 1.4 2.0 5.2 5.3 4.8
2009 Q1 1.2 1.0 2.3 0.9 6.5 8.7 3.6Q2 4.1 1.8 1.2 1.9 6.7 9.8 2.5Q3 4.2 1.7 1.1 1.8 4.5 6.5 1.6Q4 7.1 2.3 0.1 2.4 4.0 6.1 1.2
2010 Q1 7.3 3.0 1.0 3.3 3.0 2.6 3.3

64
06.CN Household final consumption expenditureHealthCurrent prices - not seasonally adjusted £ million
Health
Medical goods Out-patient services
TherapeuticPhar maceutic- Other medical appliances Medical Dental Paramedical Hospital
Total Total al products products and equipment Total services services services services
COICOP 06 06.1 06.1.1 06.1.2 06.1.3 06.2 06.2.1 06.2.2 06.2.3 06.3
ADGP ADGQ UTXM UUPU UUPV ADGR ADVW ADVX UTME ADGS2005 12 183 6 770 3 864 506 2 400 2 909 1 038 1 371 500 2 5042006 13 502 7 275 4 116 453 2 706 3 483 1 138 1 719 626 2 7442007 14 130 7 610 4 173 495 2 942 3 809 1 259 2 051 499 2 7112008 14 209 7 800 4 399 504 2 897 3 462 1 072 1 829 561 2 9472009 14 259 7 967 4 349 560 3 058 3 180 973 1 673 534 3 112
Percentage chang e , year on previous year
2005 2.5 −0.1 2.5 2.0 −4.5 5.9 3.0 3.2 22.0 6.22006 10.8 7.5 6.5 −10.5 12.8 19.7 9.6 25.4 25.2 9.62007 4.7 4.6 1.4 9.3 8.7 9.4 10.6 19.3 −20.3 −1.22008 0.6 2.5 5.4 1.8 −1.5 −9.1 −14.9 −10.8 12.4 8.72009 0.4 2.1 −1.1 11.1 5.6 −8.1 −9.2 −8.5 −4.8 5.6
Not seasonally adjusted
2007 Q1 3 420 1 773 987 116 670 957 312 513 132 690Q2 3 493 1 813 992 116 705 1 006 323 554 129 674Q3 3 488 1 876 1 004 120 752 938 313 501 124 674Q4 3 729 2 148 1 190 143 815 908 311 483 114 673
2008 Q1 3 597 2 008 1 095 128 785 888 314 450 124 701Q2 3 611 1 992 1 106 131 755 892 297 467 128 727Q3 3 480 1 846 1 037 128 681 881 252 484 145 753Q4 3 521 1 954 1 161 117 676 801 209 428 164 766
2009 Q1 3 509 1 894 986 127 781 832 252 433 147 783Q2 3 613 2 023 1 062 156 805 806 247 421 138 784Q3 3 532 1 974 1 100 134 740 781 237 415 129 777Q4 3 605 2 076 1 201 143 732 761 237 404 120 768
2010 Q1 3 464 1 961 1 070 131 760 727 224 379 124 776
Percentage chang e , quar ter on corresponding quarter of previous year
2007 Q1 7.6 4.1 5.8 16.0 − 17.9 6.5 47.8 −23.3 4.2Q2 5.0 0.2 −1.2 −4.9 3.2 20.9 14.1 43.9 −21.3 −1.7Q3 4.1 4.5 −0.1 15.4 9.5 9.7 19.5 13.3 −17.9 −3.7Q4 2.2 9.2 1.4 12.6 22.4 −7.7 3.7 −11.4 −18.0 −3.3
2008 Q1 5.2 13.3 10.9 10.3 17.2 −7.2 0.6 −12.3 −6.1 1.6Q2 3.4 9.9 11.5 12.9 7.1 −11.3 −8.0 −15.7 −0.8 7.9Q3 −0.2 −1.6 3.3 6.7 −9.4 −6.1 −19.5 −3.4 16.9 11.7Q4 −5.6 −9.0 −2.4 −18.2 −17.1 −11.8 −32.8 −11.4 43.9 13.8
2009 Q1 −2.4 −5.7 −10.0 −0.8 −0.5 −6.3 −19.7 −3.8 18.5 11.7Q2 0.1 1.6 −4.0 19.1 6.6 −9.6 −16.8 −9.9 7.8 7.8Q3 1.5 6.9 6.1 4.7 8.7 −11.4 −6.0 −14.3 −11.0 3.2Q4 2.4 6.2 3.4 22.2 8.3 −5.0 13.4 −5.6 −26.8 0.3
2010 Q1 −1.3 3.5 8.5 3.1 −2.7 −12.6 −11.1 −12.5 −15.6 −0.9

65
06.CS Household final consumption expenditureHealthCurrent prices - seasonally adjusted £ million
Health
Medical goods Out-patient services
TherapeuticPhar maceutic- Other medical appliances Medical Dental Paramedical Hospital
Total Total al products products and equipment Total services services services services
COICOP 06 06.1 06.1.1 06.1.2 06.1.3 06.2 06.2.1 06.2.2 06.2.3 06.3
ZAWB ZAWD UTXN UVGV UVGW ZAWF ZAWH ZAWJ UTMF UTYD2005 12 183 6 770 3 864 506 2 400 2 909 1 038 1 371 500 2 5042006 13 502 7 275 4 116 453 2 706 3 483 1 138 1 719 626 2 7442007 14 130 7 610 4 173 495 2 942 3 809 1 259 2 051 499 2 7112008 14 209 7 800 4 399 504 2 897 3 462 1 072 1 829 561 2 9472009 14 259 7 967 4 349 560 3 058 3 180 973 1 673 534 3 112
Percentage chang e , year on previous year
2005 2.5 −0.1 2.5 2.0 −4.5 5.9 3.0 3.2 22.0 6.22006 10.8 7.5 6.5 −10.5 12.8 19.7 9.6 25.4 25.2 9.62007 4.7 4.6 1.4 9.3 8.7 9.4 10.6 19.3 −20.3 −1.22008 0.6 2.5 5.4 1.8 −1.5 −9.1 −14.9 −10.8 12.4 8.72009 0.4 2.1 −1.1 11.1 5.6 −8.1 −9.2 −8.5 −4.8 5.6
Seasonally adjusted
2007 Q1 3 473 1 828 1 042 118 668 955 301 523 131 690Q2 3 507 1 831 1 016 117 698 1 002 321 552 129 674Q3 3 532 1 913 1 033 127 753 947 326 498 123 672Q4 3 618 2 038 1 082 133 823 905 311 478 116 675
2008 Q1 3 655 2 065 1 156 132 777 889 311 455 123 701Q2 3 616 2 003 1 128 129 746 886 292 466 128 727Q3 3 516 1 879 1 059 133 687 887 259 484 144 750Q4 3 422 1 853 1 056 110 687 800 210 424 166 769
2009 Q1 3 552 1 941 1 039 133 769 828 247 435 146 783Q2 3 613 2 030 1 086 151 793 799 240 421 138 784Q3 3 580 2 015 1 126 138 751 792 246 418 128 773Q4 3 514 1 981 1 098 138 745 761 240 399 122 772
2010 Q1 3 509 2 008 1 126 137 745 725 220 381 124 776
Percentage chang e , quar ter on previous quarter
2007 Q1 −1.6 −1.3 −2.4 3.5 −0.4 −2.2 3.4 −3.9 −7.1 −1.3Q2 1.0 0.2 −2.5 −0.8 4.5 4.9 6.6 5.5 −1.5 −2.3Q3 0.7 4.5 1.7 8.5 7.9 −5.5 1.6 −9.8 −4.7 −0.3Q4 2.4 6.5 4.7 4.7 9.3 −4.4 −4.6 −4.0 −5.7 0.4
2008 Q1 1.0 1.3 6.8 −0.8 −5.6 −1.8 − −4.8 6.0 3.9Q2 −1.1 −3.0 −2.4 −2.3 −4.0 −0.3 −6.1 2.4 4.1 3.7Q3 −2.8 −6.2 −6.1 3.1 −7.9 0.1 −11.3 3.9 12.5 3.2Q4 −2.7 −1.4 −0.3 −17.3 − −9.8 −18.9 −12.4 15.3 2.5
2009 Q1 3.8 4.7 −1.6 20.9 11.9 3.5 17.6 2.6 −12.0 1.8Q2 1.7 4.6 4.5 13.5 3.1 −3.5 −2.8 −3.2 −5.5 0.1Q3 −0.9 −0.7 3.7 −8.6 −5.3 −0.9 2.5 −0.7 −7.2 −1.4Q4 −1.8 −1.7 −2.5 − −0.8 −3.9 −2.4 −4.5 −4.7 −0.1
2010 Q1 −0.1 1.4 2.6 −0.7 − −4.7 −8.3 −4.5 1.6 0.5
Percentage chang e , quar ter on corresponding quarter of previous year
2007 Q1 7.4 4.0 6.0 16.8 −0.7 17.3 3.4 48.6 −23.4 4.2Q2 4.6 −0.3 −1.6 −7.1 2.9 20.4 13.0 43.8 −21.3 −1.7Q3 4.3 4.6 − 13.4 10.1 10.0 19.9 13.4 −18.0 −3.6Q4 2.6 10.0 1.3 16.7 22.7 −7.3 6.9 −12.1 −17.7 −3.4
2008 Q1 5.2 13.0 10.9 11.9 16.3 −6.9 3.3 −13.0 −6.1 1.6Q2 3.1 9.4 11.0 10.3 6.9 −11.6 −9.0 −15.6 −0.8 7.9Q3 −0.5 −1.8 2.5 4.7 −8.8 −6.3 −20.6 −2.8 17.1 11.6Q4 −5.4 −9.1 −2.4 −17.3 −16.5 −11.6 −32.5 −11.3 43.1 13.9
2009 Q1 −2.8 −6.0 −10.1 0.8 −1.0 −6.9 −20.6 −4.4 18.7 11.7Q2 −0.1 1.3 −3.7 17.1 6.3 −9.8 −17.8 −9.7 7.8 7.8Q3 1.8 7.2 6.3 3.8 9.3 −10.7 −5.0 −13.6 −11.1 3.1Q4 2.7 6.9 4.0 25.5 8.4 −4.9 14.3 −5.9 −26.5 0.4
2010 Q1 −1.2 3.5 8.4 3.0 −3.1 −12.4 −10.9 −12.4 −15.1 −0.9
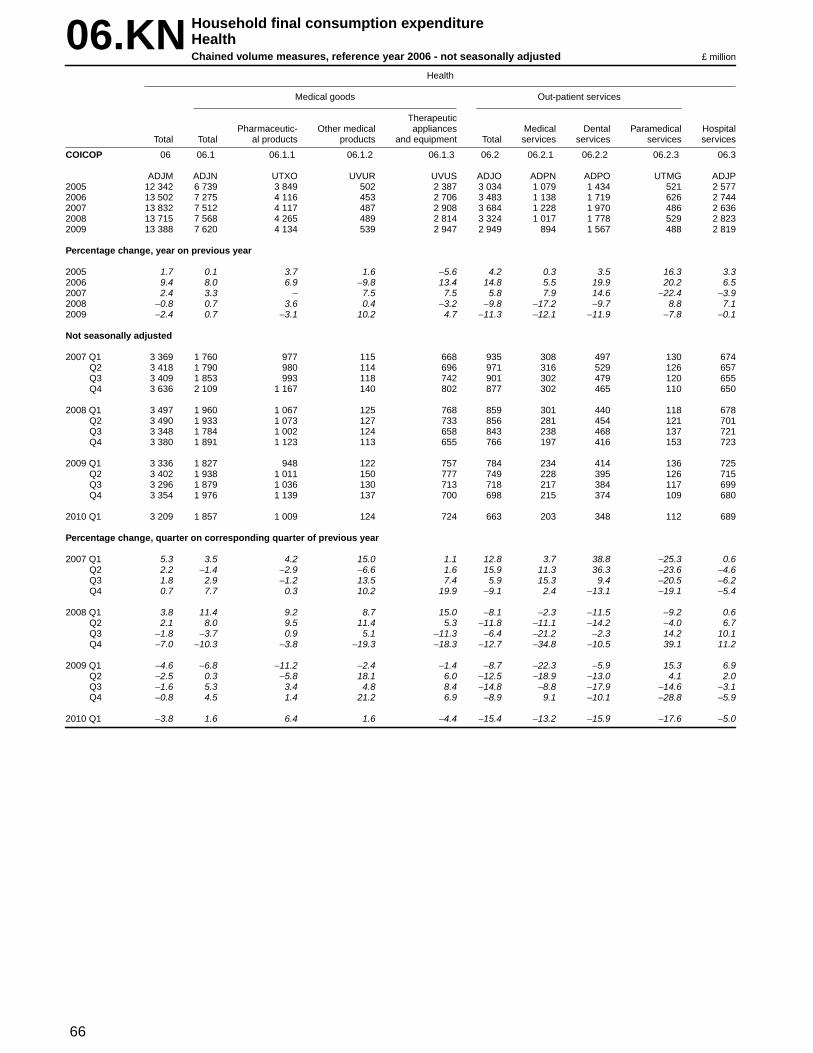
66
06.KN Household final consumption expenditureHealthChained volume measures, reference year 2006 - not seasonally adjusted £ million
Health
Medical goods Out-patient services
TherapeuticPhar maceutic- Other medical appliances Medical Dental Paramedical Hospital
Total Total al products products and equipment Total services services services services
COICOP 06 06.1 06.1.1 06.1.2 06.1.3 06.2 06.2.1 06.2.2 06.2.3 06.3
ADJM ADJN UTXO UVUR UVUS ADJO ADPN ADPO UTMG ADJP2005 12 342 6 739 3 849 502 2 387 3 034 1 079 1 434 521 2 5772006 13 502 7 275 4 116 453 2 706 3 483 1 138 1 719 626 2 7442007 13 832 7 512 4 117 487 2 908 3 684 1 228 1 970 486 2 6362008 13 715 7 568 4 265 489 2 814 3 324 1 017 1 778 529 2 8232009 13 388 7 620 4 134 539 2 947 2 949 894 1 567 488 2 819
Percentage chang e , year on previous year
2005 1.7 0.1 3.7 1.6 −5.6 4.2 0.3 3.5 16.3 3.32006 9.4 8.0 6.9 −9.8 13.4 14.8 5.5 19.9 20.2 6.52007 2.4 3.3 − 7.5 7.5 5.8 7.9 14.6 −22.4 −3.92008 −0.8 0.7 3.6 0.4 −3.2 −9.8 −17.2 −9.7 8.8 7.12009 −2.4 0.7 −3.1 10.2 4.7 −11.3 −12.1 −11.9 −7.8 −0.1
Not seasonally adjusted
2007 Q1 3 369 1 760 977 115 668 935 308 497 130 674Q2 3 418 1 790 980 114 696 971 316 529 126 657Q3 3 409 1 853 993 118 742 901 302 479 120 655Q4 3 636 2 109 1 167 140 802 877 302 465 110 650
2008 Q1 3 497 1 960 1 067 125 768 859 301 440 118 678Q2 3 490 1 933 1 073 127 733 856 281 454 121 701Q3 3 348 1 784 1 002 124 658 843 238 468 137 721Q4 3 380 1 891 1 123 113 655 766 197 416 153 723
2009 Q1 3 336 1 827 948 122 757 784 234 414 136 725Q2 3 402 1 938 1 011 150 777 749 228 395 126 715Q3 3 296 1 879 1 036 130 713 718 217 384 117 699Q4 3 354 1 976 1 139 137 700 698 215 374 109 680
2010 Q1 3 209 1 857 1 009 124 724 663 203 348 112 689
Percentage chang e , quar ter on corresponding quarter of previous year
2007 Q1 5.3 3.5 4.2 15.0 1.1 12.8 3.7 38.8 −25.3 0.6Q2 2.2 −1.4 −2.9 −6.6 1.6 15.9 11.3 36.3 −23.6 −4.6Q3 1.8 2.9 −1.2 13.5 7.4 5.9 15.3 9.4 −20.5 −6.2Q4 0.7 7.7 0.3 10.2 19.9 −9.1 2.4 −13.1 −19.1 −5.4
2008 Q1 3.8 11.4 9.2 8.7 15.0 −8.1 −2.3 −11.5 −9.2 0.6Q2 2.1 8.0 9.5 11.4 5.3 −11.8 −11.1 −14.2 −4.0 6.7Q3 −1.8 −3.7 0.9 5.1 −11.3 −6.4 −21.2 −2.3 14.2 10.1Q4 −7.0 −10.3 −3.8 −19.3 −18.3 −12.7 −34.8 −10.5 39.1 11.2
2009 Q1 −4.6 −6.8 −11.2 −2.4 −1.4 −8.7 −22.3 −5.9 15.3 6.9Q2 −2.5 0.3 −5.8 18.1 6.0 −12.5 −18.9 −13.0 4.1 2.0Q3 −1.6 5.3 3.4 4.8 8.4 −14.8 −8.8 −17.9 −14.6 −3.1Q4 −0.8 4.5 1.4 21.2 6.9 −8.9 9.1 −10.1 −28.8 −5.9
2010 Q1 −3.8 1.6 6.4 1.6 −4.4 −15.4 −13.2 −15.9 −17.6 −5.0
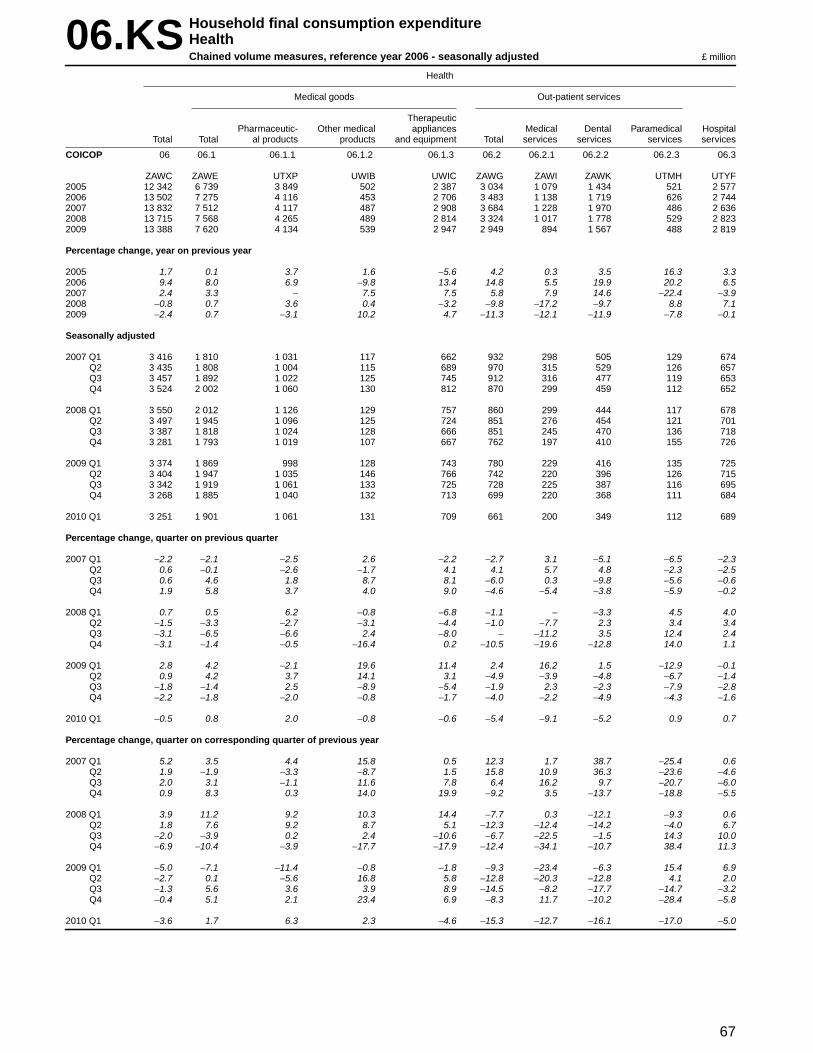
67
06.KS Household final consumption expenditureHealthChained volume measures, reference year 2006 - seasonally adjusted £ million
Health
Medical goods Out-patient services
TherapeuticPhar maceutic- Other medical appliances Medical Dental Paramedical Hospital
Total Total al products products and equipment Total services services services services
COICOP 06 06.1 06.1.1 06.1.2 06.1.3 06.2 06.2.1 06.2.2 06.2.3 06.3
ZAWC ZAWE UTXP UWIB UWIC ZAWG ZAWI ZAWK UTMH UTYF2005 12 342 6 739 3 849 502 2 387 3 034 1 079 1 434 521 2 5772006 13 502 7 275 4 116 453 2 706 3 483 1 138 1 719 626 2 7442007 13 832 7 512 4 117 487 2 908 3 684 1 228 1 970 486 2 6362008 13 715 7 568 4 265 489 2 814 3 324 1 017 1 778 529 2 8232009 13 388 7 620 4 134 539 2 947 2 949 894 1 567 488 2 819
Percentage chang e , year on previous year
2005 1.7 0.1 3.7 1.6 −5.6 4.2 0.3 3.5 16.3 3.32006 9.4 8.0 6.9 −9.8 13.4 14.8 5.5 19.9 20.2 6.52007 2.4 3.3 − 7.5 7.5 5.8 7.9 14.6 −22.4 −3.92008 −0.8 0.7 3.6 0.4 −3.2 −9.8 −17.2 −9.7 8.8 7.12009 −2.4 0.7 −3.1 10.2 4.7 −11.3 −12.1 −11.9 −7.8 −0.1
Seasonally adjusted
2007 Q1 3 416 1 810 1 031 117 662 932 298 505 129 674Q2 3 435 1 808 1 004 115 689 970 315 529 126 657Q3 3 457 1 892 1 022 125 745 912 316 477 119 653Q4 3 524 2 002 1 060 130 812 870 299 459 112 652
2008 Q1 3 550 2 012 1 126 129 757 860 299 444 117 678Q2 3 497 1 945 1 096 125 724 851 276 454 121 701Q3 3 387 1 818 1 024 128 666 851 245 470 136 718Q4 3 281 1 793 1 019 107 667 762 197 410 155 726
2009 Q1 3 374 1 869 998 128 743 780 229 416 135 725Q2 3 404 1 947 1 035 146 766 742 220 396 126 715Q3 3 342 1 919 1 061 133 725 728 225 387 116 695Q4 3 268 1 885 1 040 132 713 699 220 368 111 684
2010 Q1 3 251 1 901 1 061 131 709 661 200 349 112 689
Percentage chang e , quar ter on previous quarter
2007 Q1 −2.2 −2.1 −2.5 2.6 −2.2 −2.7 3.1 −5.1 −6.5 −2.3Q2 0.6 −0.1 −2.6 −1.7 4.1 4.1 5.7 4.8 −2.3 −2.5Q3 0.6 4.6 1.8 8.7 8.1 −6.0 0.3 −9.8 −5.6 −0.6Q4 1.9 5.8 3.7 4.0 9.0 −4.6 −5.4 −3.8 −5.9 −0.2
2008 Q1 0.7 0.5 6.2 −0.8 −6.8 −1.1 − −3.3 4.5 4.0Q2 −1.5 −3.3 −2.7 −3.1 −4.4 −1.0 −7.7 2.3 3.4 3.4Q3 −3.1 −6.5 −6.6 2.4 −8.0 − −11.2 3.5 12.4 2.4Q4 −3.1 −1.4 −0.5 −16.4 0.2 −10.5 −19.6 −12.8 14.0 1.1
2009 Q1 2.8 4.2 −2.1 19.6 11.4 2.4 16.2 1.5 −12.9 −0.1Q2 0.9 4.2 3.7 14.1 3.1 −4.9 −3.9 −4.8 −6.7 −1.4Q3 −1.8 −1.4 2.5 −8.9 −5.4 −1.9 2.3 −2.3 −7.9 −2.8Q4 −2.2 −1.8 −2.0 −0.8 −1.7 −4.0 −2.2 −4.9 −4.3 −1.6
2010 Q1 −0.5 0.8 2.0 −0.8 −0.6 −5.4 −9.1 −5.2 0.9 0.7
Percentage chang e , quar ter on corresponding quarter of previous year
2007 Q1 5.2 3.5 4.4 15.8 0.5 12.3 1.7 38.7 −25.4 0.6Q2 1.9 −1.9 −3.3 −8.7 1.5 15.8 10.9 36.3 −23.6 −4.6Q3 2.0 3.1 −1.1 11.6 7.8 6.4 16.2 9.7 −20.7 −6.0Q4 0.9 8.3 0.3 14.0 19.9 −9.2 3.5 −13.7 −18.8 −5.5
2008 Q1 3.9 11.2 9.2 10.3 14.4 −7.7 0.3 −12.1 −9.3 0.6Q2 1.8 7.6 9.2 8.7 5.1 −12.3 −12.4 −14.2 −4.0 6.7Q3 −2.0 −3.9 0.2 2.4 −10.6 −6.7 −22.5 −1.5 14.3 10.0Q4 −6.9 −10.4 −3.9 −17.7 −17.9 −12.4 −34.1 −10.7 38.4 11.3
2009 Q1 −5.0 −7.1 −11.4 −0.8 −1.8 −9.3 −23.4 −6.3 15.4 6.9Q2 −2.7 0.1 −5.6 16.8 5.8 −12.8 −20.3 −12.8 4.1 2.0Q3 −1.3 5.6 3.6 3.9 8.9 −14.5 −8.2 −17.7 −14.7 −3.2Q4 −0.4 5.1 2.1 23.4 6.9 −8.3 11.7 −10.2 −28.4 −5.8
2010 Q1 −3.6 1.7 6.3 2.3 −4.6 −15.3 −12.7 −16.1 −17.0 −5.0

68
06.DN Household final consumption expenditureHealthImplied deflators - not seasonally adjusted 2006 = 100
Health
Medical goods Out-patient services
TherapeuticPhar maceutic- Other medical appliances Medical Dental Paramedical Hospital
Total Total al products products and equipment Total services services services services
COICOP 06 06.1 06.1.1 06.1.2 06.1.3 06.2 06.2.1 06.2.2 06.2.3 06.3
UTJG UTNT AWNC AWND AWNE UTNU AWNF AWNG AWNH UTNV2005 98.7 100.5 100.4 100.8 100.5 95.9 96.2 95.6 96.0 97.22006 100.0 100.0 100.0 100.0 100.0 100.0 100.0 100.0 100.0 100.02007 102.2 101.3 101.4 101.6 101.2 103.4 102.5 104.1 102.7 102.82008 103.6 103.1 103.1 103.1 102.9 104.2 105.4 102.9 106.0 104.42009 106.5 104.6 105.2 103.9 103.8 107.8 108.8 106.8 109.4 110.4
Percentage chang e , year on previous year
2005 0.8 −0.1 −1.1 0.4 1.1 1.7 2.7 −0.3 4.9 2.92006 1.3 −0.5 −0.4 −0.8 −0.5 4.3 4.0 4.6 4.2 2.92007 2.2 1.3 1.4 1.6 1.2 3.4 2.5 4.1 2.7 2.82008 1.4 1.8 1.7 1.5 1.7 0.8 2.8 −1.2 3.2 1.62009 2.8 1.5 2.0 0.8 0.9 3.5 3.2 3.8 3.2 5.7
Not seasonally adjusted
2007 Q1 101.5 100.7 101.0 100.9 100.3 102.4 101.3 103.2 101.5 102.4Q2 102.2 101.3 101.2 101.8 101.3 103.6 102.2 104.7 102.4 102.6Q3 102.3 101.2 101.1 101.7 101.3 104.1 103.6 104.6 103.3 102.9Q4 102.6 101.8 102.0 102.1 101.6 103.5 103.0 103.9 103.6 103.5
2008 Q1 102.9 102.4 102.6 102.4 102.2 103.4 104.3 102.3 105.1 103.4Q2 103.5 103.1 103.1 103.1 103.0 104.2 105.7 102.9 105.8 103.7Q3 103.9 103.5 103.5 103.2 103.5 104.5 105.9 103.4 105.8 104.4Q4 104.2 103.3 103.4 103.5 103.2 104.6 106.1 102.9 107.2 105.9
2009 Q1 105.2 103.7 104.0 104.1 103.2 106.1 107.7 104.6 108.1 108.0Q2 106.2 104.4 105.0 104.0 103.6 107.6 108.3 106.6 109.5 109.7Q3 107.2 105.1 106.2 103.1 103.8 108.8 109.2 108.1 110.3 111.2Q4 107.5 105.1 105.4 104.4 104.6 109.0 110.2 108.0 110.1 112.9
2010 Q1 107.9 105.6 106.0 105.6 105.0 109.7 110.3 108.9 110.7 112.6
Percentage chang e , quar ter on corresponding quarter of previous year
2007 Q1 2.2 0.5 1.5 0.9 −1.1 4.6 2.6 6.5 2.6 3.6Q2 2.7 1.7 1.7 1.8 1.6 4.3 2.6 5.5 3.0 3.0Q3 2.2 1.4 1.1 1.7 1.9 3.6 3.6 3.7 3.3 2.6Q4 1.6 1.4 1.1 2.1 2.0 1.5 1.3 2.0 1.4 2.2
2008 Q1 1.4 1.7 1.6 1.5 1.9 1.0 3.0 −0.9 3.5 1.0Q2 1.3 1.8 1.9 1.3 1.7 0.6 3.4 −1.7 3.3 1.1Q3 1.6 2.3 2.4 1.5 2.2 0.4 2.2 −1.1 2.4 1.5Q4 1.6 1.5 1.4 1.4 1.6 1.1 3.0 −1.0 3.5 2.3
2009 Q1 2.2 1.3 1.4 1.7 1.0 2.6 3.3 2.2 2.9 4.4Q2 2.6 1.3 1.8 0.9 0.6 3.3 2.5 3.6 3.5 5.8Q3 3.2 1.5 2.6 −0.1 0.3 4.1 3.1 4.5 4.3 6.5Q4 3.2 1.7 1.9 0.9 1.4 4.2 3.9 5.0 2.7 6.6
2010 Q1 2.6 1.8 1.9 1.4 1.7 3.4 2.4 4.1 2.4 4.3
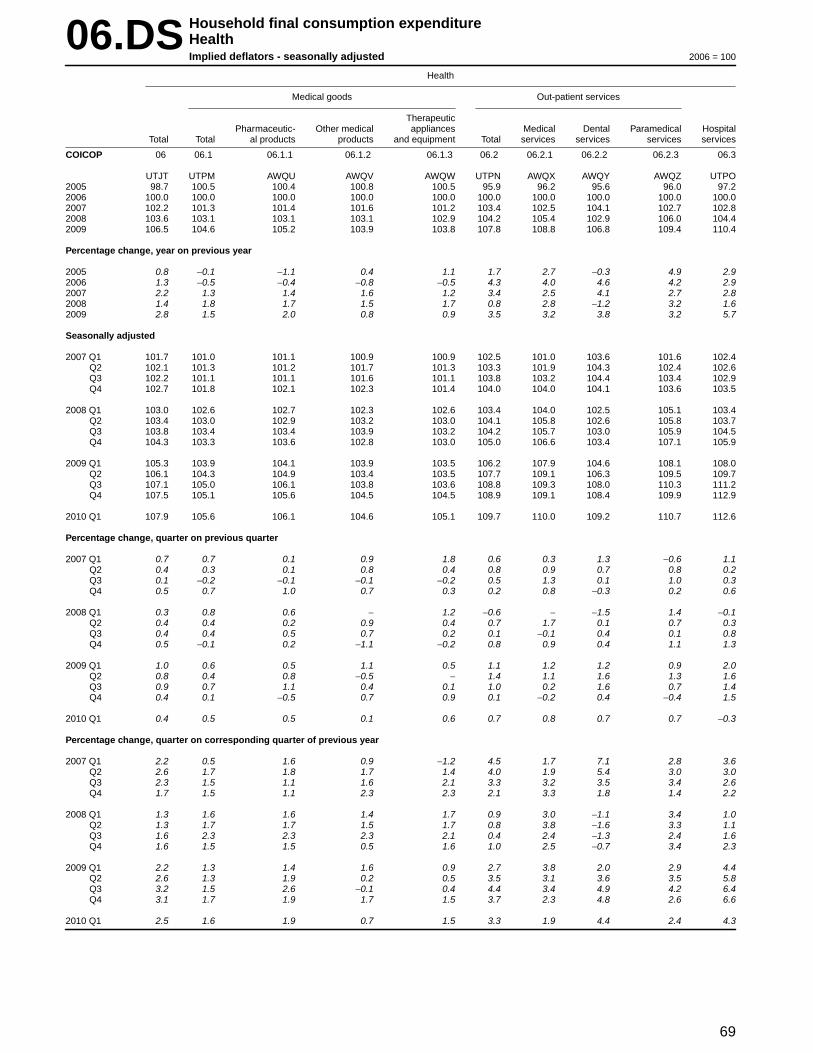
69
06.DS Household final consumption expenditureHealthImplied deflators - seasonally adjusted 2006 = 100
Health
Medical goods Out-patient services
TherapeuticPhar maceutic- Other medical appliances Medical Dental Paramedical Hospital
Total Total al products products and equipment Total services services services services
COICOP 06 06.1 06.1.1 06.1.2 06.1.3 06.2 06.2.1 06.2.2 06.2.3 06.3
UTJT UTPM AWQU AWQV AWQW UTPN AWQX AWQY AWQZ UTPO2005 98.7 100.5 100.4 100.8 100.5 95.9 96.2 95.6 96.0 97.22006 100.0 100.0 100.0 100.0 100.0 100.0 100.0 100.0 100.0 100.02007 102.2 101.3 101.4 101.6 101.2 103.4 102.5 104.1 102.7 102.82008 103.6 103.1 103.1 103.1 102.9 104.2 105.4 102.9 106.0 104.42009 106.5 104.6 105.2 103.9 103.8 107.8 108.8 106.8 109.4 110.4
Percentage chang e , year on previous year
2005 0.8 −0.1 −1.1 0.4 1.1 1.7 2.7 −0.3 4.9 2.92006 1.3 −0.5 −0.4 −0.8 −0.5 4.3 4.0 4.6 4.2 2.92007 2.2 1.3 1.4 1.6 1.2 3.4 2.5 4.1 2.7 2.82008 1.4 1.8 1.7 1.5 1.7 0.8 2.8 −1.2 3.2 1.62009 2.8 1.5 2.0 0.8 0.9 3.5 3.2 3.8 3.2 5.7
Seasonally adjusted
2007 Q1 101.7 101.0 101.1 100.9 100.9 102.5 101.0 103.6 101.6 102.4Q2 102.1 101.3 101.2 101.7 101.3 103.3 101.9 104.3 102.4 102.6Q3 102.2 101.1 101.1 101.6 101.1 103.8 103.2 104.4 103.4 102.9Q4 102.7 101.8 102.1 102.3 101.4 104.0 104.0 104.1 103.6 103.5
2008 Q1 103.0 102.6 102.7 102.3 102.6 103.4 104.0 102.5 105.1 103.4Q2 103.4 103.0 102.9 103.2 103.0 104.1 105.8 102.6 105.8 103.7Q3 103.8 103.4 103.4 103.9 103.2 104.2 105.7 103.0 105.9 104.5Q4 104.3 103.3 103.6 102.8 103.0 105.0 106.6 103.4 107.1 105.9
2009 Q1 105.3 103.9 104.1 103.9 103.5 106.2 107.9 104.6 108.1 108.0Q2 106.1 104.3 104.9 103.4 103.5 107.7 109.1 106.3 109.5 109.7Q3 107.1 105.0 106.1 103.8 103.6 108.8 109.3 108.0 110.3 111.2Q4 107.5 105.1 105.6 104.5 104.5 108.9 109.1 108.4 109.9 112.9
2010 Q1 107.9 105.6 106.1 104.6 105.1 109.7 110.0 109.2 110.7 112.6
Percentage chang e , quar ter on previous quarter
2007 Q1 0.7 0.7 0.1 0.9 1.8 0.6 0.3 1.3 −0.6 1.1Q2 0.4 0.3 0.1 0.8 0.4 0.8 0.9 0.7 0.8 0.2Q3 0.1 −0.2 −0.1 −0.1 −0.2 0.5 1.3 0.1 1.0 0.3Q4 0.5 0.7 1.0 0.7 0.3 0.2 0.8 −0.3 0.2 0.6
2008 Q1 0.3 0.8 0.6 − 1.2 −0.6 − −1.5 1.4 −0.1Q2 0.4 0.4 0.2 0.9 0.4 0.7 1.7 0.1 0.7 0.3Q3 0.4 0.4 0.5 0.7 0.2 0.1 −0.1 0.4 0.1 0.8Q4 0.5 −0.1 0.2 −1.1 −0.2 0.8 0.9 0.4 1.1 1.3
2009 Q1 1.0 0.6 0.5 1.1 0.5 1.1 1.2 1.2 0.9 2.0Q2 0.8 0.4 0.8 −0.5 − 1.4 1.1 1.6 1.3 1.6Q3 0.9 0.7 1.1 0.4 0.1 1.0 0.2 1.6 0.7 1.4Q4 0.4 0.1 −0.5 0.7 0.9 0.1 −0.2 0.4 −0.4 1.5
2010 Q1 0.4 0.5 0.5 0.1 0.6 0.7 0.8 0.7 0.7 −0.3
Percentage chang e , quar ter on corresponding quarter of previous year
2007 Q1 2.2 0.5 1.6 0.9 −1.2 4.5 1.7 7.1 2.8 3.6Q2 2.6 1.7 1.8 1.7 1.4 4.0 1.9 5.4 3.0 3.0Q3 2.3 1.5 1.1 1.6 2.1 3.3 3.2 3.5 3.4 2.6Q4 1.7 1.5 1.1 2.3 2.3 2.1 3.3 1.8 1.4 2.2
2008 Q1 1.3 1.6 1.6 1.4 1.7 0.9 3.0 −1.1 3.4 1.0Q2 1.3 1.7 1.7 1.5 1.7 0.8 3.8 −1.6 3.3 1.1Q3 1.6 2.3 2.3 2.3 2.1 0.4 2.4 −1.3 2.4 1.6Q4 1.6 1.5 1.5 0.5 1.6 1.0 2.5 −0.7 3.4 2.3
2009 Q1 2.2 1.3 1.4 1.6 0.9 2.7 3.8 2.0 2.9 4.4Q2 2.6 1.3 1.9 0.2 0.5 3.5 3.1 3.6 3.5 5.8Q3 3.2 1.5 2.6 −0.1 0.4 4.4 3.4 4.9 4.2 6.4Q4 3.1 1.7 1.9 1.7 1.5 3.7 2.3 4.8 2.6 6.6
2010 Q1 2.5 1.6 1.9 0.7 1.5 3.3 1.9 4.4 2.4 4.3

70
07.CN Household final consumption expenditureTranspor tCurrent prices - not seasonally adjusted £ million
Tr anspor t
Purchase of vehicles Operation of vehicles
Vehicle fuels VehicleMotor vehicle and maintenance Other vehicle
Total Total Motor cars Motor cycles Bicycles Total spares lubr icants and repair ser vices
COICOP 07 07.1 07.1.1 07.1.2 07.1.3 07.2 07.2.1 07.2.2 07.2.3 07.2.4
ADGT ADGU ADVZ ADWA ADWB ADGV AWTV CDDY AWTZ ADWG2005 116 186 38 562 36 721 731 1 110 48 685 3 789 24 729 15 319 4 8482006 119 979 38 810 37 033 682 1 095 50 486 3 768 25 918 15 541 5 2592007 129 780 42 047 40 143 770 1 134 53 689 3 754 28 432 15 762 5 7412008 132 534 39 722 37 674 780 1 268 57 155 4 182 30 611 16 093 6 2692009 124 814 36 873 34 735 708 1 430 54 724 4 248 26 782 17 790 5 904
Percentage chang e , year on previous year
2005 6.1 0.3 − 7.3 4.8 10.4 14.0 9.5 11.1 10.62006 3.3 0.6 0.8 −6.7 −1.4 3.7 −0.6 4.8 1.4 8.52007 8.2 8.3 8.4 12.9 3.6 6.3 −0.4 9.7 1.4 9.22008 2.1 −5.5 −6.2 1.3 11.8 6.5 11.4 7.7 2.1 9.22009 −5.8 −7.2 −7.8 −9.2 12.8 −4.3 1.6 −12.5 10.5 −5.8
Not seasonally adjusted
2007 Q1 30 704 11 603 11 162 170 271 12 653 888 6 377 4 043 1 345Q2 32 226 10 121 9 589 251 281 13 155 876 6 908 4 046 1 325Q3 36 037 11 616 11 131 223 262 13 996 923 7 533 3 960 1 580Q4 30 813 8 707 8 261 126 320 13 885 1 067 7 614 3 713 1 491
2008 Q1 34 455 12 764 12 293 182 289 14 242 1 011 7 921 3 760 1 550Q2 33 958 10 081 9 529 243 309 14 525 871 8 238 3 830 1 586Q3 36 155 10 479 9 962 219 298 14 797 1 046 7 939 4 143 1 669Q4 27 966 6 398 5 890 136 372 13 591 1 254 6 513 4 360 1 464
2009 Q1 28 707 9 437 8 932 168 337 12 554 975 5 762 4 330 1 487Q2 30 819 8 430 7 840 236 354 13 622 1 019 6 735 4 425 1 443Q3 34 635 10 002 9 480 191 331 14 303 1 076 7 135 4 564 1 528Q4 30 653 9 004 8 483 113 408 14 245 1 178 7 150 4 471 1 446
2010 Q1 32 232 11 681 11 210 127 344 14 093 987 7 250 4 302 1 554
Percentage chang e , quar ter on corresponding quarter of previous year
2007 Q1 5.2 4.8 4.7 17.2 3.8 3.9 2.2 2.5 5.4 7.4Q2 7.7 5.6 5.6 8.7 2.9 4.4 1.4 4.3 4.8 5.8Q3 8.1 10.3 10.4 14.4 3.1 6.0 −6.5 9.8 0.9 10.3Q4 11.8 14.1 14.6 13.5 4.2 11.0 1.8 22.5 −5.3 12.7
2008 Q1 12.2 10.0 10.1 7.1 6.6 12.6 13.9 24.2 −7.0 15.2Q2 5.4 −0.4 −0.6 −3.2 10.0 10.4 −0.6 19.3 −5.3 19.7Q3 0.3 −9.8 −10.5 −1.8 13.7 5.7 13.3 5.4 4.6 5.6Q4 −9.2 −26.5 −28.7 7.9 16.3 −2.1 17.5 −14.5 17.4 −1.8
2009 Q1 −16.7 −26.1 −27.3 −7.7 16.6 −11.9 −3.6 −27.3 15.2 −4.1Q2 −9.2 −16.4 −17.7 −2.9 14.6 −6.2 17.0 −18.2 15.5 −9.0Q3 −4.2 −4.6 −4.8 −12.8 11.1 −3.3 2.9 −10.1 10.2 −8.4Q4 9.6 40.7 44.0 −16.9 9.7 4.8 −6.1 9.8 2.5 −1.2
2010 Q1 12.3 23.8 25.5 −24.4 2.1 12.3 1.2 25.8 −0.6 4.5

71
07.CN Household final consumption expenditureTranspor tCurrent prices - not seasonally adjustedcontinued £ million
Tr anspor t (continued)
Tr anspor t ser vices
Seas and inlandTotal Railways Road Air waterways Other
COICOP 07.3 07.3.1 07.3.2 07.3.3 07.3.4 07.3.6
ADGW AWUA ADWI AWUB AWUC AWUD2005 28 939 4 830 7 886 12 357 2 491 1 3752006 30 683 4 972 8 350 13 015 2 804 1 5422007 34 044 5 901 8 788 14 439 3 336 1 5802008 35 657 6 406 9 081 15 177 3 703 1 2902009 33 217 6 349 8 503 12 702 4 482 1 181
Percentage chang e , year on previous year
2005 7.4 5.3 8.2 8.0 4.2 11.32006 6.0 2.9 5.9 5.3 12.6 12.12007 11.0 18.7 5.2 10.9 19.0 2.52008 4.7 8.6 3.3 5.1 11.0 −18.42009 −6.8 −0.9 −6.4 −16.3 21.0 −8.4
Not seasonally adjusted
2007 Q1 6 448 1 334 1 829 2 797 161 327Q2 8 950 1 443 2 205 3 835 1 112 355Q3 10 425 1 527 2 354 4 523 1 495 526Q4 8 221 1 597 2 400 3 284 568 372
2008 Q1 7 449 1 594 2 007 3 329 198 321Q2 9 352 1 642 2 306 3 667 1 391 346Q3 10 879 1 595 2 418 4 881 1 650 335Q4 7 977 1 575 2 350 3 300 464 288
2009 Q1 6 716 1 567 1 904 2 869 143 233Q2 8 767 1 560 2 120 3 201 1 603 283Q3 10 330 1 586 2 232 4 010 2 112 390Q4 7 404 1 636 2 247 2 622 624 275
2010 Q1 6 458 1 597 1 921 2 456 225 259
Percentage chang e , quar ter on corresponding quarter of previous year
2007 Q1 8.7 9.1 3.2 11.8 29.8 4.5Q2 15.7 18.5 5.0 25.2 15.0 −8.3Q3 8.7 23.9 6.1 3.8 15.3 7.8Q4 10.8 22.9 6.3 6.3 36.5 5.1
2008 Q1 15.5 19.5 9.7 19.0 23.0 −1.8Q2 4.5 13.8 4.6 −4.4 25.1 −2.5Q3 4.4 4.5 2.7 7.9 10.4 −36.3Q4 −3.0 −1.4 −2.1 0.5 −18.3 −22.6
2009 Q1 −9.8 −1.7 −5.1 −13.8 −27.8 −27.4Q2 −6.3 −5.0 −8.1 −12.7 15.2 −18.2Q3 −5.0 −0.6 −7.7 −17.8 28.0 16.4Q4 −7.2 3.9 −4.4 −20.5 34.5 −4.5
2010 Q1 −3.8 1.9 0.9 −14.4 57.3 11.2
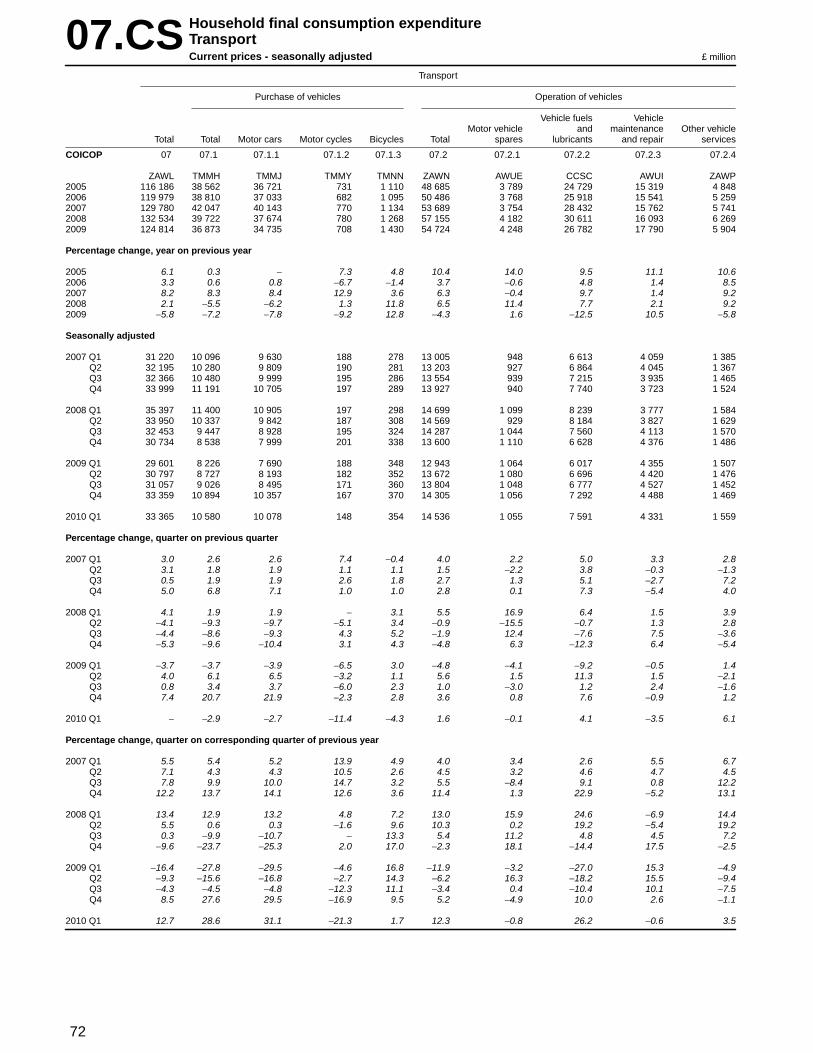
72
07.CS Household final consumption expenditureTranspor tCurrent prices - seasonally adjusted £ million
Tr anspor t
Purchase of vehicles Operation of vehicles
Vehicle fuels VehicleMotor vehicle and maintenance Other vehicle
Total Total Motor cars Motor cycles Bicycles Total spares lubr icants and repair ser vices
COICOP 07 07.1 07.1.1 07.1.2 07.1.3 07.2 07.2.1 07.2.2 07.2.3 07.2.4
ZAWL TMMH TMMJ TMMY TMNN ZAWN AWUE CCSC AWUI ZAWP2005 116 186 38 562 36 721 731 1 110 48 685 3 789 24 729 15 319 4 8482006 119 979 38 810 37 033 682 1 095 50 486 3 768 25 918 15 541 5 2592007 129 780 42 047 40 143 770 1 134 53 689 3 754 28 432 15 762 5 7412008 132 534 39 722 37 674 780 1 268 57 155 4 182 30 611 16 093 6 2692009 124 814 36 873 34 735 708 1 430 54 724 4 248 26 782 17 790 5 904
Percentage chang e , year on previous year
2005 6.1 0.3 − 7.3 4.8 10.4 14.0 9.5 11.1 10.62006 3.3 0.6 0.8 −6.7 −1.4 3.7 −0.6 4.8 1.4 8.52007 8.2 8.3 8.4 12.9 3.6 6.3 −0.4 9.7 1.4 9.22008 2.1 −5.5 −6.2 1.3 11.8 6.5 11.4 7.7 2.1 9.22009 −5.8 −7.2 −7.8 −9.2 12.8 −4.3 1.6 −12.5 10.5 −5.8
Seasonally adjusted
2007 Q1 31 220 10 096 9 630 188 278 13 005 948 6 613 4 059 1 385Q2 32 195 10 280 9 809 190 281 13 203 927 6 864 4 045 1 367Q3 32 366 10 480 9 999 195 286 13 554 939 7 215 3 935 1 465Q4 33 999 11 191 10 705 197 289 13 927 940 7 740 3 723 1 524
2008 Q1 35 397 11 400 10 905 197 298 14 699 1 099 8 239 3 777 1 584Q2 33 950 10 337 9 842 187 308 14 569 929 8 184 3 827 1 629Q3 32 453 9 447 8 928 195 324 14 287 1 044 7 560 4 113 1 570Q4 30 734 8 538 7 999 201 338 13 600 1 110 6 628 4 376 1 486
2009 Q1 29 601 8 226 7 690 188 348 12 943 1 064 6 017 4 355 1 507Q2 30 797 8 727 8 193 182 352 13 672 1 080 6 696 4 420 1 476Q3 31 057 9 026 8 495 171 360 13 804 1 048 6 777 4 527 1 452Q4 33 359 10 894 10 357 167 370 14 305 1 056 7 292 4 488 1 469
2010 Q1 33 365 10 580 10 078 148 354 14 536 1 055 7 591 4 331 1 559
Percentage chang e , quar ter on previous quarter
2007 Q1 3.0 2.6 2.6 7.4 −0.4 4.0 2.2 5.0 3.3 2.8Q2 3.1 1.8 1.9 1.1 1.1 1.5 −2.2 3.8 −0.3 −1.3Q3 0.5 1.9 1.9 2.6 1.8 2.7 1.3 5.1 −2.7 7.2Q4 5.0 6.8 7.1 1.0 1.0 2.8 0.1 7.3 −5.4 4.0
2008 Q1 4.1 1.9 1.9 − 3.1 5.5 16.9 6.4 1.5 3.9Q2 −4.1 −9.3 −9.7 −5.1 3.4 −0.9 −15.5 −0.7 1.3 2.8Q3 −4.4 −8.6 −9.3 4.3 5.2 −1.9 12.4 −7.6 7.5 −3.6Q4 −5.3 −9.6 −10.4 3.1 4.3 −4.8 6.3 −12.3 6.4 −5.4
2009 Q1 −3.7 −3.7 −3.9 −6.5 3.0 −4.8 −4.1 −9.2 −0.5 1.4Q2 4.0 6.1 6.5 −3.2 1.1 5.6 1.5 11.3 1.5 −2.1Q3 0.8 3.4 3.7 −6.0 2.3 1.0 −3.0 1.2 2.4 −1.6Q4 7.4 20.7 21.9 −2.3 2.8 3.6 0.8 7.6 −0.9 1.2
2010 Q1 − −2.9 −2.7 −11.4 −4.3 1.6 −0.1 4.1 −3.5 6.1
Percentage chang e , quar ter on corresponding quarter of previous year
2007 Q1 5.5 5.4 5.2 13.9 4.9 4.0 3.4 2.6 5.5 6.7Q2 7.1 4.3 4.3 10.5 2.6 4.5 3.2 4.6 4.7 4.5Q3 7.8 9.9 10.0 14.7 3.2 5.5 −8.4 9.1 0.8 12.2Q4 12.2 13.7 14.1 12.6 3.6 11.4 1.3 22.9 −5.2 13.1
2008 Q1 13.4 12.9 13.2 4.8 7.2 13.0 15.9 24.6 −6.9 14.4Q2 5.5 0.6 0.3 −1.6 9.6 10.3 0.2 19.2 −5.4 19.2Q3 0.3 −9.9 −10.7 − 13.3 5.4 11.2 4.8 4.5 7.2Q4 −9.6 −23.7 −25.3 2.0 17.0 −2.3 18.1 −14.4 17.5 −2.5
2009 Q1 −16.4 −27.8 −29.5 −4.6 16.8 −11.9 −3.2 −27.0 15.3 −4.9Q2 −9.3 −15.6 −16.8 −2.7 14.3 −6.2 16.3 −18.2 15.5 −9.4Q3 −4.3 −4.5 −4.8 −12.3 11.1 −3.4 0.4 −10.4 10.1 −7.5Q4 8.5 27.6 29.5 −16.9 9.5 5.2 −4.9 10.0 2.6 −1.1
2010 Q1 12.7 28.6 31.1 −21.3 1.7 12.3 −0.8 26.2 −0.6 3.5

73
07.CS Household final consumption expenditureTranspor tCurrent prices - seasonally adjustedcontinued £ million
Tr anspor t (continued)
Tr anspor t ser vices
Seas and inlandTotal Railways Road Air waterways Other
COICOP 07.3 07.3.1 07.3.2 07.3.3 07.3.4 07.3.6
ZAWR AWUJ ZAWT AWUK AWUL AWUM2005 28 939 4 830 7 886 12 357 2 491 1 3752006 30 683 4 972 8 350 13 015 2 804 1 5422007 34 044 5 901 8 788 14 439 3 336 1 5802008 35 657 6 406 9 081 15 177 3 703 1 2902009 33 217 6 349 8 503 12 702 4 482 1 181
Percentage chang e , year on previous year
2005 7.4 5.3 8.2 8.0 4.2 11.32006 6.0 2.9 5.9 5.3 12.6 12.12007 11.0 18.7 5.2 10.9 19.0 2.52008 4.7 8.6 3.3 5.1 11.0 −18.42009 −6.8 −0.9 −6.4 −16.3 21.0 −8.4
Seasonally adjusted
2007 Q1 8 119 1 344 2 097 3 437 855 386Q2 8 712 1 441 2 191 3 922 793 365Q3 8 332 1 532 2 231 3 388 769 412Q4 8 881 1 584 2 269 3 692 919 417
2008 Q1 9 298 1 602 2 299 4 050 978 369Q2 9 044 1 640 2 293 3 741 1 027 343Q3 8 719 1 599 2 276 3 656 933 255Q4 8 596 1 565 2 213 3 730 765 323
2009 Q1 8 432 1 575 2 169 3 455 962 271Q2 8 398 1 558 2 114 3 251 1 182 293Q3 8 227 1 589 2 100 3 003 1 228 307Q4 8 160 1 627 2 120 2 993 1 110 310
2010 Q1 8 249 1 605 2 186 2 984 1 162 312
Percentage chang e , quar ter on previous quarter
2007 Q1 2.0 4.5 −1.3 − 18.4 −1.8Q2 7.3 7.2 4.5 14.1 −7.3 −5.4Q3 −4.4 6.3 1.8 −13.6 −3.0 12.9Q4 6.6 3.4 1.7 9.0 19.5 1.2
2008 Q1 4.7 1.1 1.3 9.7 6.4 −11.5Q2 −2.7 2.4 −0.3 −7.6 5.0 −7.0Q3 −3.6 −2.5 −0.7 −2.3 −9.2 −25.7Q4 −1.4 −2.1 −2.8 2.0 −18.0 26.7
2009 Q1 −1.9 0.6 −2.0 −7.4 25.8 −16.1Q2 −0.4 −1.1 −2.5 −5.9 22.9 8.1Q3 −2.0 2.0 −0.7 −7.6 3.9 4.8Q4 −0.8 2.4 1.0 −0.3 −9.6 1.0
2010 Q1 1.1 −1.4 3.1 −0.3 4.7 0.6
Percentage chang e , quar ter on corresponding quarter of previous year
2007 Q1 8.2 8.7 3.4 10.2 13.5 4.9Q2 14.8 18.4 4.9 23.1 12.8 −8.1Q3 9.3 24.2 5.8 3.5 22.8 7.3Q4 11.5 23.2 6.8 7.4 27.3 6.1
2008 Q1 14.5 19.2 9.6 17.8 14.4 −4.4Q2 3.8 13.8 4.7 −4.6 29.5 −6.0Q3 4.6 4.4 2.0 7.9 21.3 −38.1Q4 −3.2 −1.2 −2.5 1.0 −16.8 −22.5
2009 Q1 −9.3 −1.7 −5.7 −14.7 −1.6 −26.6Q2 −7.1 −5.0 −7.8 −13.1 15.1 −14.6Q3 −5.6 −0.6 −7.7 −17.9 31.6 20.4Q4 −5.1 4.0 −4.2 −19.8 45.1 −4.0
2010 Q1 −2.2 1.9 0.8 −13.6 20.8 15.1
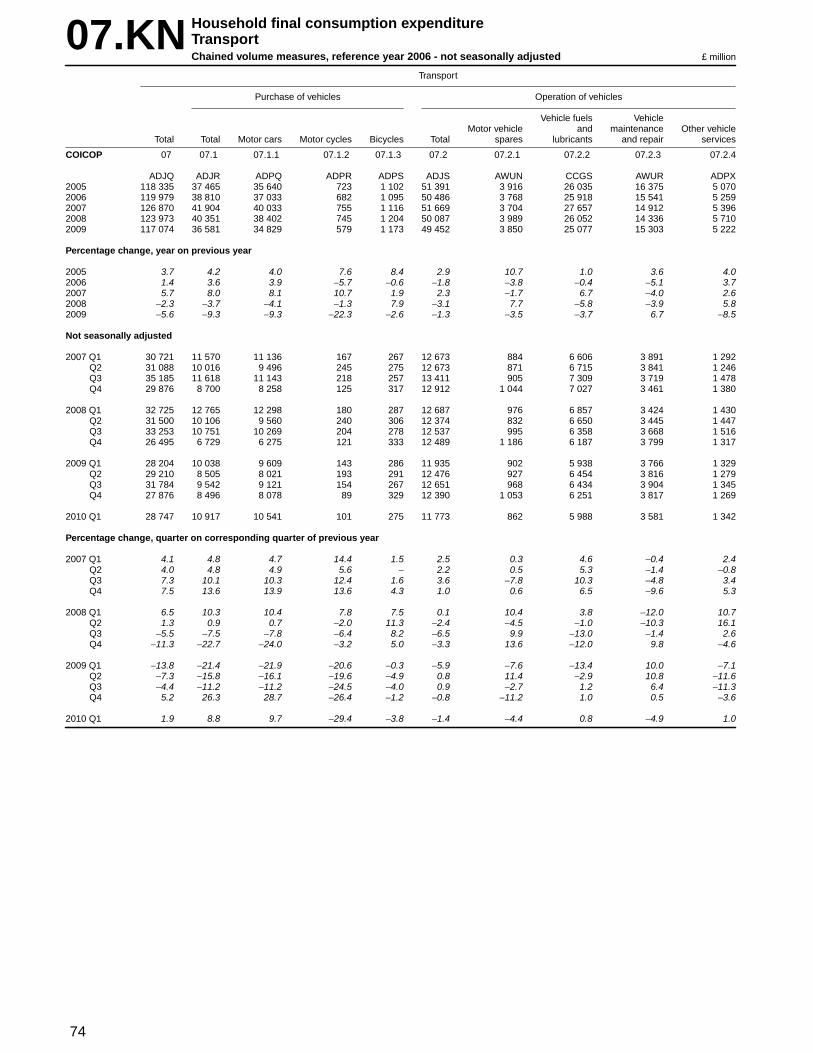
74
07.KN Household final consumption expenditureTranspor tChained volume measures, reference year 2006 - not seasonally adjusted £ million
Tr anspor t
Purchase of vehicles Operation of vehicles
Vehicle fuels VehicleMotor vehicle and maintenance Other vehicle
Total Total Motor cars Motor cycles Bicycles Total spares lubr icants and repair ser vices
COICOP 07 07.1 07.1.1 07.1.2 07.1.3 07.2 07.2.1 07.2.2 07.2.3 07.2.4
ADJQ ADJR ADPQ ADPR ADPS ADJS AWUN CCGS AWUR ADPX2005 118 335 37 465 35 640 723 1 102 51 391 3 916 26 035 16 375 5 0702006 119 979 38 810 37 033 682 1 095 50 486 3 768 25 918 15 541 5 2592007 126 870 41 904 40 033 755 1 116 51 669 3 704 27 657 14 912 5 3962008 123 973 40 351 38 402 745 1 204 50 087 3 989 26 052 14 336 5 7102009 117 074 36 581 34 829 579 1 173 49 452 3 850 25 077 15 303 5 222
Percentage chang e , year on previous year
2005 3.7 4.2 4.0 7.6 8.4 2.9 10.7 1.0 3.6 4.02006 1.4 3.6 3.9 −5.7 −0.6 −1.8 −3.8 −0.4 −5.1 3.72007 5.7 8.0 8.1 10.7 1.9 2.3 −1.7 6.7 −4.0 2.62008 −2.3 −3.7 −4.1 −1.3 7.9 −3.1 7.7 −5.8 −3.9 5.82009 −5.6 −9.3 −9.3 −22.3 −2.6 −1.3 −3.5 −3.7 6.7 −8.5
Not seasonally adjusted
2007 Q1 30 721 11 570 11 136 167 267 12 673 884 6 606 3 891 1 292Q2 31 088 10 016 9 496 245 275 12 673 871 6 715 3 841 1 246Q3 35 185 11 618 11 143 218 257 13 411 905 7 309 3 719 1 478Q4 29 876 8 700 8 258 125 317 12 912 1 044 7 027 3 461 1 380
2008 Q1 32 725 12 765 12 298 180 287 12 687 976 6 857 3 424 1 430Q2 31 500 10 106 9 560 240 306 12 374 832 6 650 3 445 1 447Q3 33 253 10 751 10 269 204 278 12 537 995 6 358 3 668 1 516Q4 26 495 6 729 6 275 121 333 12 489 1 186 6 187 3 799 1 317
2009 Q1 28 204 10 038 9 609 143 286 11 935 902 5 938 3 766 1 329Q2 29 210 8 505 8 021 193 291 12 476 927 6 454 3 816 1 279Q3 31 784 9 542 9 121 154 267 12 651 968 6 434 3 904 1 345Q4 27 876 8 496 8 078 89 329 12 390 1 053 6 251 3 817 1 269
2010 Q1 28 747 10 917 10 541 101 275 11 773 862 5 988 3 581 1 342
Percentage chang e , quar ter on corresponding quarter of previous year
2007 Q1 4.1 4.8 4.7 14.4 1.5 2.5 0.3 4.6 −0.4 2.4Q2 4.0 4.8 4.9 5.6 − 2.2 0.5 5.3 −1.4 −0.8Q3 7.3 10.1 10.3 12.4 1.6 3.6 −7.8 10.3 −4.8 3.4Q4 7.5 13.6 13.9 13.6 4.3 1.0 0.6 6.5 −9.6 5.3
2008 Q1 6.5 10.3 10.4 7.8 7.5 0.1 10.4 3.8 −12.0 10.7Q2 1.3 0.9 0.7 −2.0 11.3 −2.4 −4.5 −1.0 −10.3 16.1Q3 −5.5 −7.5 −7.8 −6.4 8.2 −6.5 9.9 −13.0 −1.4 2.6Q4 −11.3 −22.7 −24.0 −3.2 5.0 −3.3 13.6 −12.0 9.8 −4.6
2009 Q1 −13.8 −21.4 −21.9 −20.6 −0.3 −5.9 −7.6 −13.4 10.0 −7.1Q2 −7.3 −15.8 −16.1 −19.6 −4.9 0.8 11.4 −2.9 10.8 −11.6Q3 −4.4 −11.2 −11.2 −24.5 −4.0 0.9 −2.7 1.2 6.4 −11.3Q4 5.2 26.3 28.7 −26.4 −1.2 −0.8 −11.2 1.0 0.5 −3.6
2010 Q1 1.9 8.8 9.7 −29.4 −3.8 −1.4 −4.4 0.8 −4.9 1.0

75
07.KN Household final consumption expenditureTranspor tChained volume measures, reference year 2006 - not seasonally adjustedcontinued £ million
Tr anspor t (continued)
Tr anspor t ser vices
Seas and inlandTotal Railways Road Air waterways Other
COICOP 07.3 07.3.1 07.3.2 07.3.3 07.3.4 07.3.6
ADJT AWUS ADPZ AWUT AWUU AWUV2005 29 592 5 043 8 151 12 439 2 502 1 4662006 30 683 4 972 8 350 13 015 2 804 1 5422007 33 297 5 668 8 386 14 559 3 244 1 4402008 33 535 5 883 8 306 14 524 3 546 1 2762009 31 041 5 696 7 379 12 805 4 118 1 043
Percentage chang e , year on previous year
2005 4.2 0.5 1.7 6.4 7.8 6.22006 3.7 −1.4 2.4 4.6 12.1 5.22007 8.5 14.0 0.4 11.9 15.7 −6.62008 0.7 3.8 −1.0 −0.2 9.3 −11.42009 −7.4 −3.2 −11.2 −11.8 16.1 −18.3
Not seasonally adjusted
2007 Q1 6 478 1 293 1 771 2 954 166 294Q2 8 399 1 365 2 112 3 506 1 099 317Q3 10 156 1 474 2 233 4 544 1 420 485Q4 8 264 1 536 2 270 3 555 559 344
2008 Q1 7 273 1 479 1 875 3 453 193 273Q2 9 020 1 506 2 126 3 683 1 356 349Q3 9 965 1 477 2 196 4 348 1 550 394Q4 7 277 1 421 2 109 3 040 447 260
2009 Q1 6 231 1 395 1 668 2 839 133 196Q2 8 229 1 400 1 837 3 230 1 497 265Q3 9 591 1 452 1 929 3 956 1 915 339Q4 6 990 1 449 1 945 2 780 573 243
2010 Q1 6 057 1 379 1 630 2 650 202 196
Percentage chang e , quar ter on corresponding quarter of previous year
2007 Q1 6.0 6.8 1.9 7.4 27.7 −3.0Q2 5.6 11.0 −0.6 9.0 11.7 −20.9Q3 10.1 19.3 − 14.1 12.2 −Q4 11.8 18.6 0.7 16.0 31.8 −2.5
2008 Q1 12.3 14.4 5.9 16.9 16.3 −7.1Q2 7.4 10.3 0.7 5.0 23.4 10.1Q3 −1.9 0.2 −1.7 −4.3 9.2 −18.8Q4 −11.9 −7.5 −7.1 −14.5 −20.0 −24.4
2009 Q1 −14.3 −5.7 −11.0 −17.8 −31.1 −28.2Q2 −8.8 −7.0 −13.6 −12.3 10.4 −24.1Q3 −3.8 −1.7 −12.2 −9.0 23.5 −14.0Q4 −3.9 2.0 −7.8 −8.6 28.2 −6.5
2010 Q1 −2.8 −1.1 −2.3 −6.7 51.9 −
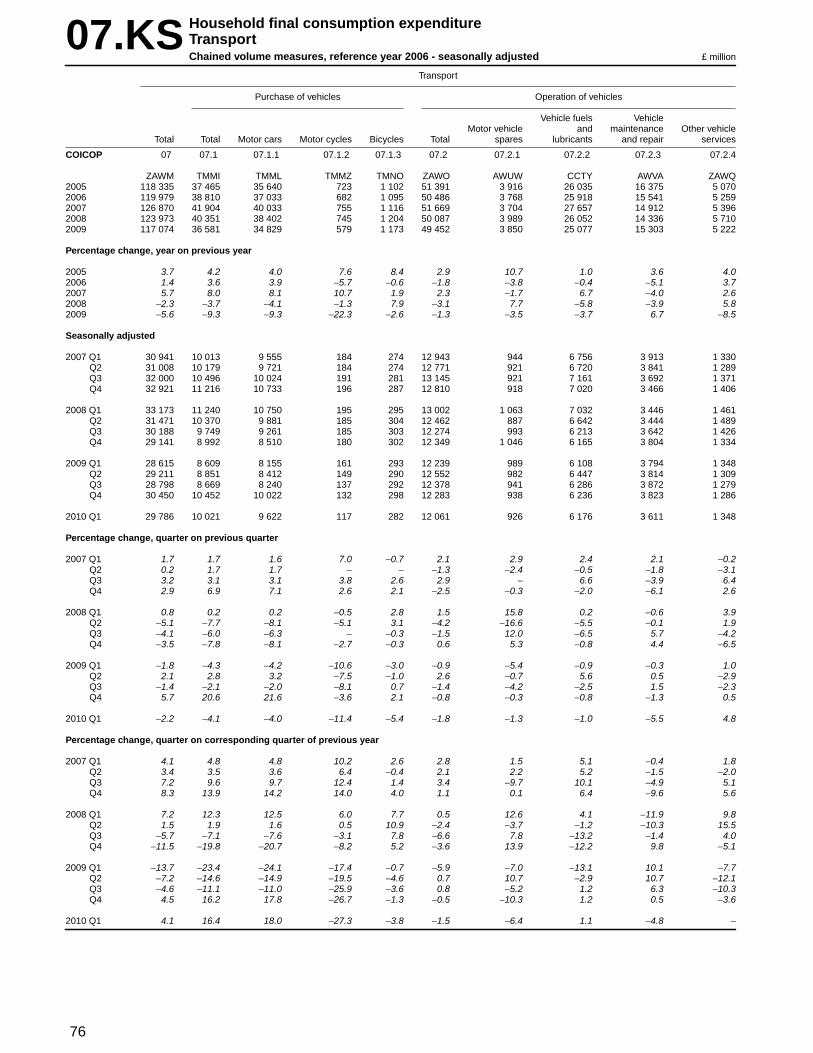
76
07.KS Household final consumption expenditureTranspor tChained volume measures, reference year 2006 - seasonally adjusted £ million
Tr anspor t
Purchase of vehicles Operation of vehicles
Vehicle fuels VehicleMotor vehicle and maintenance Other vehicle
Total Total Motor cars Motor cycles Bicycles Total spares lubr icants and repair ser vices
COICOP 07 07.1 07.1.1 07.1.2 07.1.3 07.2 07.2.1 07.2.2 07.2.3 07.2.4
ZAWM TMMI TMML TMMZ TMNO ZAWO AWUW CCTY AWVA ZAWQ2005 118 335 37 465 35 640 723 1 102 51 391 3 916 26 035 16 375 5 0702006 119 979 38 810 37 033 682 1 095 50 486 3 768 25 918 15 541 5 2592007 126 870 41 904 40 033 755 1 116 51 669 3 704 27 657 14 912 5 3962008 123 973 40 351 38 402 745 1 204 50 087 3 989 26 052 14 336 5 7102009 117 074 36 581 34 829 579 1 173 49 452 3 850 25 077 15 303 5 222
Percentage chang e , year on previous year
2005 3.7 4.2 4.0 7.6 8.4 2.9 10.7 1.0 3.6 4.02006 1.4 3.6 3.9 −5.7 −0.6 −1.8 −3.8 −0.4 −5.1 3.72007 5.7 8.0 8.1 10.7 1.9 2.3 −1.7 6.7 −4.0 2.62008 −2.3 −3.7 −4.1 −1.3 7.9 −3.1 7.7 −5.8 −3.9 5.82009 −5.6 −9.3 −9.3 −22.3 −2.6 −1.3 −3.5 −3.7 6.7 −8.5
Seasonally adjusted
2007 Q1 30 941 10 013 9 555 184 274 12 943 944 6 756 3 913 1 330Q2 31 008 10 179 9 721 184 274 12 771 921 6 720 3 841 1 289Q3 32 000 10 496 10 024 191 281 13 145 921 7 161 3 692 1 371Q4 32 921 11 216 10 733 196 287 12 810 918 7 020 3 466 1 406
2008 Q1 33 173 11 240 10 750 195 295 13 002 1 063 7 032 3 446 1 461Q2 31 471 10 370 9 881 185 304 12 462 887 6 642 3 444 1 489Q3 30 188 9 749 9 261 185 303 12 274 993 6 213 3 642 1 426Q4 29 141 8 992 8 510 180 302 12 349 1 046 6 165 3 804 1 334
2009 Q1 28 615 8 609 8 155 161 293 12 239 989 6 108 3 794 1 348Q2 29 211 8 851 8 412 149 290 12 552 982 6 447 3 814 1 309Q3 28 798 8 669 8 240 137 292 12 378 941 6 286 3 872 1 279Q4 30 450 10 452 10 022 132 298 12 283 938 6 236 3 823 1 286
2010 Q1 29 786 10 021 9 622 117 282 12 061 926 6 176 3 611 1 348
Percentage chang e , quar ter on previous quarter
2007 Q1 1.7 1.7 1.6 7.0 −0.7 2.1 2.9 2.4 2.1 −0.2Q2 0.2 1.7 1.7 − − −1.3 −2.4 −0.5 −1.8 −3.1Q3 3.2 3.1 3.1 3.8 2.6 2.9 − 6.6 −3.9 6.4Q4 2.9 6.9 7.1 2.6 2.1 −2.5 −0.3 −2.0 −6.1 2.6
2008 Q1 0.8 0.2 0.2 −0.5 2.8 1.5 15.8 0.2 −0.6 3.9Q2 −5.1 −7.7 −8.1 −5.1 3.1 −4.2 −16.6 −5.5 −0.1 1.9Q3 −4.1 −6.0 −6.3 − −0.3 −1.5 12.0 −6.5 5.7 −4.2Q4 −3.5 −7.8 −8.1 −2.7 −0.3 0.6 5.3 −0.8 4.4 −6.5
2009 Q1 −1.8 −4.3 −4.2 −10.6 −3.0 −0.9 −5.4 −0.9 −0.3 1.0Q2 2.1 2.8 3.2 −7.5 −1.0 2.6 −0.7 5.6 0.5 −2.9Q3 −1.4 −2.1 −2.0 −8.1 0.7 −1.4 −4.2 −2.5 1.5 −2.3Q4 5.7 20.6 21.6 −3.6 2.1 −0.8 −0.3 −0.8 −1.3 0.5
2010 Q1 −2.2 −4.1 −4.0 −11.4 −5.4 −1.8 −1.3 −1.0 −5.5 4.8
Percentage chang e , quar ter on corresponding quarter of previous year
2007 Q1 4.1 4.8 4.8 10.2 2.6 2.8 1.5 5.1 −0.4 1.8Q2 3.4 3.5 3.6 6.4 −0.4 2.1 2.2 5.2 −1.5 −2.0Q3 7.2 9.6 9.7 12.4 1.4 3.4 −9.7 10.1 −4.9 5.1Q4 8.3 13.9 14.2 14.0 4.0 1.1 0.1 6.4 −9.6 5.6
2008 Q1 7.2 12.3 12.5 6.0 7.7 0.5 12.6 4.1 −11.9 9.8Q2 1.5 1.9 1.6 0.5 10.9 −2.4 −3.7 −1.2 −10.3 15.5Q3 −5.7 −7.1 −7.6 −3.1 7.8 −6.6 7.8 −13.2 −1.4 4.0Q4 −11.5 −19.8 −20.7 −8.2 5.2 −3.6 13.9 −12.2 9.8 −5.1
2009 Q1 −13.7 −23.4 −24.1 −17.4 −0.7 −5.9 −7.0 −13.1 10.1 −7.7Q2 −7.2 −14.6 −14.9 −19.5 −4.6 0.7 10.7 −2.9 10.7 −12.1Q3 −4.6 −11.1 −11.0 −25.9 −3.6 0.8 −5.2 1.2 6.3 −10.3Q4 4.5 16.2 17.8 −26.7 −1.3 −0.5 −10.3 1.2 0.5 −3.6
2010 Q1 4.1 16.4 18.0 −27.3 −3.8 −1.5 −6.4 1.1 −4.8 −

77
07.KS Household final consumption expenditureTranspor tChained volume measures, reference year 2006 - seasonally adjustedcontinued £ million
Tr anspor t (continued)
Tr anspor t ser vices
Seas and inlandTotal Railways Road Air waterways Other
COICOP 07.3 07.3.1 07.3.2 07.3.3 07.3.4 07.3.6
ZAWS AWVB ZAWU AWVC AWVD AWVE2005 29 592 5 043 8 151 12 439 2 502 1 4662006 30 683 4 972 8 350 13 015 2 804 1 5422007 33 297 5 668 8 386 14 559 3 244 1 4402008 33 535 5 883 8 306 14 524 3 546 1 2762009 31 041 5 696 7 379 12 805 4 118 1 043
Percentage chang e , year on previous year
2005 4.2 0.5 1.7 6.4 7.8 6.22006 3.7 −1.4 2.4 4.6 12.1 5.22007 8.5 14.0 0.4 11.9 15.7 −6.62008 0.7 3.8 −1.0 −0.2 9.3 −11.42009 −7.4 −3.2 −11.2 −11.8 16.1 −18.3
Seasonally adjusted
2007 Q1 7 985 1 326 2 050 3 407 827 375Q2 8 058 1 366 2 094 3 511 770 317Q3 8 359 1 462 2 112 3 654 754 377Q4 8 895 1 514 2 130 3 987 893 371
2008 Q1 8 931 1 511 2 164 3 978 926 352Q2 8 639 1 508 2 110 3 689 989 343Q3 8 165 1 461 2 063 3 450 893 298Q4 7 800 1 403 1 969 3 407 738 283
2009 Q1 7 767 1 427 1 912 3 279 894 255Q2 7 808 1 403 1 830 3 236 1 075 264Q3 7 751 1 432 1 812 3 134 1 112 261Q4 7 715 1 434 1 825 3 156 1 037 263
2010 Q1 7 704 1 411 1 861 3 106 1 070 256
Percentage chang e , quar ter on previous quarter
2007 Q1 1.2 4.2 −2.8 −0.2 15.5 −0.3Q2 0.9 3.0 2.1 3.1 −6.9 −15.5Q3 3.7 7.0 0.9 4.1 −2.1 18.9Q4 6.4 3.6 0.9 9.1 18.4 −1.6
2008 Q1 0.4 −0.2 1.6 −0.2 3.7 −5.1Q2 −3.3 −0.2 −2.5 −7.3 6.8 −2.6Q3 −5.5 −3.1 −2.2 −6.5 −9.7 −13.1Q4 −4.5 −4.0 −4.6 −1.2 −17.4 −5.0
2009 Q1 −0.4 1.7 −2.9 −3.8 21.1 −9.9Q2 0.5 −1.7 −4.3 −1.3 20.2 3.5Q3 −0.7 2.1 −1.0 −3.2 3.4 −1.1Q4 −0.5 0.1 0.7 0.7 −6.7 0.8
2010 Q1 −0.1 −1.6 2.0 −1.6 3.2 −2.7
Percentage chang e , quar ter on corresponding quarter of previous year
2007 Q1 5.4 6.7 2.1 6.8 10.6 −1.8Q2 5.3 11.0 −0.9 9.7 8.5 −20.9Q3 10.5 19.3 −0.4 13.8 19.7 −1.6Q4 12.8 18.9 1.0 16.8 24.7 −1.3
2008 Q1 11.8 14.0 5.6 16.8 12.0 −6.1Q2 7.2 10.4 0.8 5.1 28.4 8.2Q3 −2.3 −0.1 −2.3 −5.6 18.4 −21.0Q4 −12.3 −7.3 −7.6 −14.5 −17.4 −23.7
2009 Q1 −13.0 −5.6 −11.6 −17.6 −3.5 −27.6Q2 −9.6 −7.0 −13.3 −12.3 8.7 −23.0Q3 −5.1 −2.0 −12.2 −9.2 24.5 −12.4Q4 −1.1 2.2 −7.3 −7.4 40.5 −7.1
2010 Q1 −0.8 −1.1 −2.7 −5.3 19.7 0.4

78
07.DN Household final consumption expenditureTranspor tImplied deflators - not seasonally adjusted 2006 = 100
Tr anspor t
Purchase of vehicles Operation of vehicles
Vehicle fuels VehicleMotor vehicle and maintenance Other vehicle
Total Total Motor cars Motor cycles Bicycles Total spares lubr icants and repair ser vices
COICOP 07 07.1 07.1.1 07.1.2 07.1.3 07.2 07.2.1 07.2.2 07.2.3 07.2.4
UTJH UTNW AWNI AWNJ AWNK UTNX AWNL AWNM AWNN AWNO2005 98.2 102.9 103.0 101.1 100.7 94.7 96.8 95.0 93.6 95.62006 100.0 100.0 100.0 100.0 100.0 100.0 100.0 100.0 100.0 100.02007 102.3 100.3 100.3 102.0 101.6 103.9 101.3 102.8 105.7 106.42008 106.9 98.4 98.1 104.7 105.3 114.1 104.8 117.5 112.3 109.82009 106.6 100.8 99.7 122.3 121.9 110.7 110.3 106.8 116.3 113.1
Percentage chang e , year on previous year
2005 2.4 −3.8 −3.8 −0.2 −3.3 7.4 3.0 8.4 7.3 6.32006 1.8 −2.8 −2.9 −1.1 −0.7 5.6 3.3 5.3 6.8 4.62007 2.3 0.3 0.3 2.0 1.6 3.9 1.3 2.8 5.7 6.42008 4.5 −1.9 −2.2 2.6 3.6 9.8 3.5 14.3 6.2 3.22009 −0.3 2.4 1.6 16.8 15.8 −3.0 5.2 −9.1 3.6 3.0
Not seasonally adjusted
2007 Q1 99.9 100.3 100.2 101.8 101.5 99.8 100.5 96.5 103.9 104.1Q2 103.7 101.0 101.0 102.4 102.2 103.8 100.6 102.9 105.3 106.3Q3 102.4 100.0 99.9 102.3 101.9 104.4 102.0 103.1 106.5 106.9Q4 103.1 100.1 100.0 100.8 100.9 107.5 102.2 108.4 107.3 108.0
2008 Q1 105.3 100.0 100.0 101.1 100.7 112.3 103.6 115.5 109.8 108.4Q2 107.8 99.8 99.7 101.3 101.0 117.4 104.7 123.9 111.2 109.6Q3 108.7 97.5 97.0 107.4 107.2 118.0 105.1 124.9 112.9 110.1Q4 105.6 95.1 93.9 112.4 111.7 108.8 105.7 105.3 114.8 111.2
2009 Q1 101.8 94.0 93.0 117.5 117.8 105.2 108.1 97.0 115.0 111.9Q2 105.5 99.1 97.7 122.3 121.6 109.2 109.9 104.4 116.0 112.8Q3 109.0 104.8 103.9 124.0 124.0 113.1 111.2 110.9 116.9 113.6Q4 110.0 106.0 105.0 127.0 124.0 115.0 111.9 114.4 117.1 113.9
2010 Q1 112.1 107.0 106.3 125.7 125.1 119.7 114.5 121.1 120.1 115.8
Percentage chang e , quar ter on corresponding quarter of previous year
2007 Q1 1.0 0.1 −0.1 2.5 2.3 1.3 1.9 −2.0 5.8 4.9Q2 3.6 0.7 0.7 2.8 2.9 2.2 0.9 −0.9 6.3 6.6Q3 0.8 0.2 0.1 1.8 1.5 2.4 1.5 −0.4 6.1 6.8Q4 4.0 0.5 0.5 −0.1 −0.1 9.8 1.2 15.1 4.8 7.0
2008 Q1 5.4 −0.3 −0.2 −0.7 −0.8 12.5 3.1 19.7 5.7 4.1Q2 4.0 −1.2 −1.3 −1.1 −1.2 13.1 4.1 20.4 5.6 3.1Q3 6.2 −2.5 −2.9 5.0 5.2 13.0 3.0 21.1 6.0 3.0Q4 2.4 −5.0 −6.1 11.5 10.7 1.2 3.4 −2.9 7.0 3.0
2009 Q1 −3.3 −6.0 −7.0 16.2 17.0 −6.3 4.3 −16.0 4.7 3.2Q2 −2.1 −0.7 −2.0 20.7 20.4 −7.0 5.0 −15.7 4.3 2.9Q3 0.3 7.5 7.1 15.5 15.7 −4.2 5.8 −11.2 3.5 3.2Q4 4.2 11.5 11.8 13.0 11.0 5.7 5.9 8.6 2.0 2.4
2010 Q1 10.1 13.8 14.3 7.0 6.2 13.8 5.9 24.8 4.4 3.5
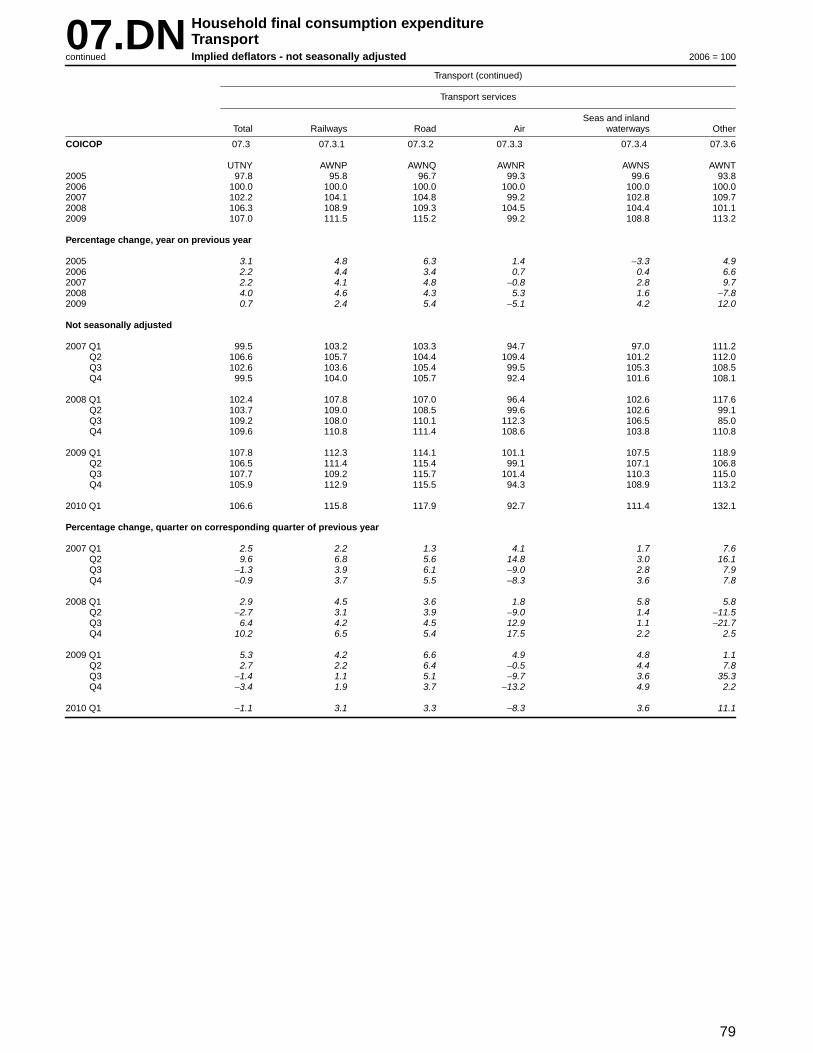
79
07.DN Household final consumption expenditureTranspor tImplied deflators - not seasonally adjustedcontinued 2006 = 100
Tr anspor t (continued)
Tr anspor t ser vices
Seas and inlandTotal Railways Road Air waterways Other
COICOP 07.3 07.3.1 07.3.2 07.3.3 07.3.4 07.3.6
UTNY AWNP AWNQ AWNR AWNS AWNT2005 97.8 95.8 96.7 99.3 99.6 93.82006 100.0 100.0 100.0 100.0 100.0 100.02007 102.2 104.1 104.8 99.2 102.8 109.72008 106.3 108.9 109.3 104.5 104.4 101.12009 107.0 111.5 115.2 99.2 108.8 113.2
Percentage chang e , year on previous year
2005 3.1 4.8 6.3 1.4 −3.3 4.92006 2.2 4.4 3.4 0.7 0.4 6.62007 2.2 4.1 4.8 −0.8 2.8 9.72008 4.0 4.6 4.3 5.3 1.6 −7.82009 0.7 2.4 5.4 −5.1 4.2 12.0
Not seasonally adjusted
2007 Q1 99.5 103.2 103.3 94.7 97.0 111.2Q2 106.6 105.7 104.4 109.4 101.2 112.0Q3 102.6 103.6 105.4 99.5 105.3 108.5Q4 99.5 104.0 105.7 92.4 101.6 108.1
2008 Q1 102.4 107.8 107.0 96.4 102.6 117.6Q2 103.7 109.0 108.5 99.6 102.6 99.1Q3 109.2 108.0 110.1 112.3 106.5 85.0Q4 109.6 110.8 111.4 108.6 103.8 110.8
2009 Q1 107.8 112.3 114.1 101.1 107.5 118.9Q2 106.5 111.4 115.4 99.1 107.1 106.8Q3 107.7 109.2 115.7 101.4 110.3 115.0Q4 105.9 112.9 115.5 94.3 108.9 113.2
2010 Q1 106.6 115.8 117.9 92.7 111.4 132.1
Percentage chang e , quar ter on corresponding quarter of previous year
2007 Q1 2.5 2.2 1.3 4.1 1.7 7.6Q2 9.6 6.8 5.6 14.8 3.0 16.1Q3 −1.3 3.9 6.1 −9.0 2.8 7.9Q4 −0.9 3.7 5.5 −8.3 3.6 7.8
2008 Q1 2.9 4.5 3.6 1.8 5.8 5.8Q2 −2.7 3.1 3.9 −9.0 1.4 −11.5Q3 6.4 4.2 4.5 12.9 1.1 −21.7Q4 10.2 6.5 5.4 17.5 2.2 2.5
2009 Q1 5.3 4.2 6.6 4.9 4.8 1.1Q2 2.7 2.2 6.4 −0.5 4.4 7.8Q3 −1.4 1.1 5.1 −9.7 3.6 35.3Q4 −3.4 1.9 3.7 −13.2 4.9 2.2
2010 Q1 −1.1 3.1 3.3 −8.3 3.6 11.1

80
07.DS Household final consumption expenditureTranspor tImplied deflators - seasonally adjusted 2006 = 100
Tr anspor t
Purchase of vehicles Operation of vehicles
Vehicle fuels VehicleMotor vehicle and maintenance Other vehicle
Total Total Motor cars Motor cycles Bicycles Total spares lubr icants and repair ser vices
COICOP 07 07.1 07.1.1 07.1.2 07.1.3 07.2 07.2.1 07.2.2 07.2.3 07.2.4
UTJU UTPP AWRA AWRB AWRC UTPQ AWRD AWRE AWRF AWRG2005 98.2 102.9 103.0 101.1 100.7 94.7 96.8 95.0 93.6 95.62006 100.0 100.0 100.0 100.0 100.0 100.0 100.0 100.0 100.0 100.02007 102.3 100.3 100.3 102.0 101.6 103.9 101.3 102.8 105.7 106.42008 106.9 98.4 98.1 104.7 105.3 114.1 104.8 117.5 112.3 109.82009 106.6 100.8 99.7 122.3 121.9 110.7 110.3 106.8 116.3 113.1
Percentage chang e , year on previous year
2005 2.4 −3.8 −3.8 −0.2 −3.3 7.4 3.0 8.4 7.3 6.32006 1.8 −2.8 −2.9 −1.1 −0.7 5.6 3.3 5.3 6.8 4.62007 2.3 0.3 0.3 2.0 1.6 3.9 1.3 2.8 5.7 6.42008 4.5 −1.9 −2.2 2.6 3.6 9.8 3.5 14.3 6.2 3.22009 −0.3 2.4 1.6 16.8 15.8 −3.0 5.2 −9.1 3.6 3.0
Seasonally adjusted
2007 Q1 100.9 100.8 100.8 102.2 101.5 100.5 100.4 97.9 103.7 104.1Q2 103.8 101.0 100.9 103.3 102.6 103.4 100.7 102.1 105.3 106.1Q3 101.1 99.8 99.8 102.1 101.8 103.1 102.0 100.8 106.6 106.9Q4 103.3 99.8 99.7 100.5 100.7 108.7 102.4 110.3 107.4 108.4
2008 Q1 106.7 101.4 101.4 101.0 101.0 113.1 103.4 117.2 109.6 108.4Q2 107.9 99.7 99.6 101.1 101.3 116.9 104.7 123.2 111.1 109.4Q3 107.5 96.9 96.4 105.4 106.9 116.4 105.1 121.7 112.9 110.1Q4 105.5 95.0 94.0 111.7 111.9 110.1 106.1 107.5 115.0 111.4
2009 Q1 103.4 95.6 94.3 116.8 118.8 105.8 107.6 98.5 114.8 111.8Q2 105.4 98.6 97.4 122.1 121.4 108.9 110.0 103.9 115.9 112.8Q3 107.8 104.1 103.1 124.8 123.3 111.5 111.4 107.8 116.9 113.5Q4 109.6 104.2 103.3 126.5 124.2 116.5 112.6 116.9 117.4 114.2
2010 Q1 112.0 105.6 104.7 126.5 125.5 120.5 113.9 122.9 119.9 115.7
Percentage chang e , quar ter on previous quarter
2007 Q1 1.2 0.9 1.0 0.5 0.4 1.9 −0.8 2.5 1.2 3.0Q2 2.9 0.2 0.1 1.1 1.1 2.9 0.3 4.3 1.5 1.9Q3 −2.6 −1.2 −1.1 −1.2 −0.8 −0.3 1.3 −1.3 1.2 0.8Q4 2.2 − −0.1 −1.6 −1.1 5.4 0.4 9.4 0.8 1.4
2008 Q1 3.3 1.6 1.7 0.5 0.3 4.0 1.0 6.3 2.0 −Q2 1.1 −1.7 −1.8 0.1 0.3 3.4 1.3 5.1 1.4 0.9Q3 −0.4 −2.8 −3.2 4.3 5.5 −0.4 0.4 −1.2 1.6 0.6Q4 −1.9 −2.0 −2.5 6.0 4.7 −5.4 1.0 −11.7 1.9 1.2
2009 Q1 −2.0 0.6 0.3 4.6 6.2 −3.9 1.4 −8.4 −0.2 0.4Q2 1.9 3.1 3.3 4.5 2.2 2.9 2.2 5.5 1.0 0.9Q3 2.3 5.6 5.9 2.2 1.6 2.4 1.3 3.8 0.9 0.6Q4 1.7 0.1 0.2 1.4 0.7 4.5 1.1 8.4 0.4 0.6
2010 Q1 2.2 1.3 1.4 − 1.0 3.4 1.2 5.1 2.1 1.3
Percentage chang e , quar ter on corresponding quarter of previous year
2007 Q1 1.3 0.5 0.4 3.4 2.2 1.2 1.8 −2.4 5.9 4.8Q2 3.6 0.8 0.6 3.9 3.0 2.4 1.0 −0.6 6.3 6.6Q3 0.6 0.3 0.3 2.1 1.8 2.1 1.5 −0.8 6.0 6.8Q4 3.6 −0.1 −0.1 −1.2 −0.4 10.2 1.2 15.5 4.8 7.2
2008 Q1 5.7 0.6 0.6 −1.2 −0.5 12.5 3.0 19.7 5.7 4.1Q2 3.9 −1.3 −1.3 −2.1 −1.3 13.1 4.0 20.7 5.5 3.1Q3 6.3 −2.9 −3.4 3.2 5.0 12.9 3.0 20.7 5.9 3.0Q4 2.1 −4.8 −5.7 11.1 11.1 1.3 3.6 −2.5 7.1 2.8
2009 Q1 −3.1 −5.7 −7.0 15.6 17.6 −6.5 4.1 −16.0 4.7 3.1Q2 −2.3 −1.1 −2.2 20.8 19.8 −6.8 5.1 −15.7 4.3 3.1Q3 0.3 7.4 7.0 18.4 15.3 −4.2 6.0 −11.4 3.5 3.1Q4 3.9 9.7 9.9 13.2 11.0 5.8 6.1 8.7 2.1 2.5
2010 Q1 8.3 10.5 11.0 8.3 5.6 13.9 5.9 24.8 4.4 3.5
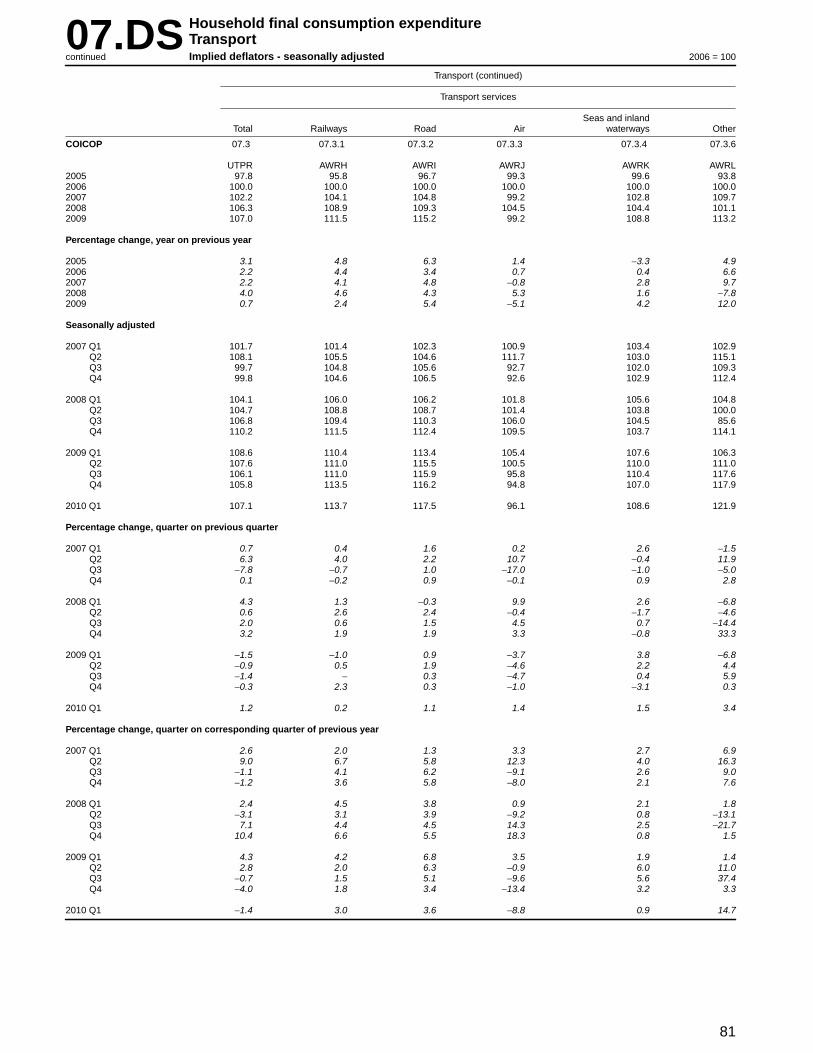
81
07.DS Household final consumption expenditureTranspor tImplied deflators - seasonally adjustedcontinued 2006 = 100
Tr anspor t (continued)
Tr anspor t ser vices
Seas and inlandTotal Railways Road Air waterways Other
COICOP 07.3 07.3.1 07.3.2 07.3.3 07.3.4 07.3.6
UTPR AWRH AWRI AWRJ AWRK AWRL2005 97.8 95.8 96.7 99.3 99.6 93.82006 100.0 100.0 100.0 100.0 100.0 100.02007 102.2 104.1 104.8 99.2 102.8 109.72008 106.3 108.9 109.3 104.5 104.4 101.12009 107.0 111.5 115.2 99.2 108.8 113.2
Percentage chang e , year on previous year
2005 3.1 4.8 6.3 1.4 −3.3 4.92006 2.2 4.4 3.4 0.7 0.4 6.62007 2.2 4.1 4.8 −0.8 2.8 9.72008 4.0 4.6 4.3 5.3 1.6 −7.82009 0.7 2.4 5.4 −5.1 4.2 12.0
Seasonally adjusted
2007 Q1 101.7 101.4 102.3 100.9 103.4 102.9Q2 108.1 105.5 104.6 111.7 103.0 115.1Q3 99.7 104.8 105.6 92.7 102.0 109.3Q4 99.8 104.6 106.5 92.6 102.9 112.4
2008 Q1 104.1 106.0 106.2 101.8 105.6 104.8Q2 104.7 108.8 108.7 101.4 103.8 100.0Q3 106.8 109.4 110.3 106.0 104.5 85.6Q4 110.2 111.5 112.4 109.5 103.7 114.1
2009 Q1 108.6 110.4 113.4 105.4 107.6 106.3Q2 107.6 111.0 115.5 100.5 110.0 111.0Q3 106.1 111.0 115.9 95.8 110.4 117.6Q4 105.8 113.5 116.2 94.8 107.0 117.9
2010 Q1 107.1 113.7 117.5 96.1 108.6 121.9
Percentage chang e , quar ter on previous quarter
2007 Q1 0.7 0.4 1.6 0.2 2.6 −1.5Q2 6.3 4.0 2.2 10.7 −0.4 11.9Q3 −7.8 −0.7 1.0 −17.0 −1.0 −5.0Q4 0.1 −0.2 0.9 −0.1 0.9 2.8
2008 Q1 4.3 1.3 −0.3 9.9 2.6 −6.8Q2 0.6 2.6 2.4 −0.4 −1.7 −4.6Q3 2.0 0.6 1.5 4.5 0.7 −14.4Q4 3.2 1.9 1.9 3.3 −0.8 33.3
2009 Q1 −1.5 −1.0 0.9 −3.7 3.8 −6.8Q2 −0.9 0.5 1.9 −4.6 2.2 4.4Q3 −1.4 − 0.3 −4.7 0.4 5.9Q4 −0.3 2.3 0.3 −1.0 −3.1 0.3
2010 Q1 1.2 0.2 1.1 1.4 1.5 3.4
Percentage chang e , quar ter on corresponding quarter of previous year
2007 Q1 2.6 2.0 1.3 3.3 2.7 6.9Q2 9.0 6.7 5.8 12.3 4.0 16.3Q3 −1.1 4.1 6.2 −9.1 2.6 9.0Q4 −1.2 3.6 5.8 −8.0 2.1 7.6
2008 Q1 2.4 4.5 3.8 0.9 2.1 1.8Q2 −3.1 3.1 3.9 −9.2 0.8 −13.1Q3 7.1 4.4 4.5 14.3 2.5 −21.7Q4 10.4 6.6 5.5 18.3 0.8 1.5
2009 Q1 4.3 4.2 6.8 3.5 1.9 1.4Q2 2.8 2.0 6.3 −0.9 6.0 11.0Q3 −0.7 1.5 5.1 −9.6 5.6 37.4Q4 −4.0 1.8 3.4 −13.4 3.2 3.3
2010 Q1 −1.4 3.0 3.6 −8.8 0.9 14.7

82
08.CN Household final consumption expenditureCommunicationCurrent prices - not seasonally adjusted £ million
Communication
Total Postal services Telephone and telefax equipment Telephone and telefax services
COICOP 08 08.1 08.2 08.3
ADGX CDEF ADWO ADWP2005 17 939 1 016 950 15 9732006 18 115 1 020 973 16 1222007 18 471 1 037 967 16 4672008 18 340 1 027 983 16 3302009 18 686 1 087 1 043 16 556
Percentage chang e , year on previous year
2005 4.2 5.7 6.7 4.02006 1.0 0.4 2.4 0.92007 2.0 1.7 −0.6 2.12008 −0.7 −1.0 1.7 −0.82009 1.9 5.8 6.1 1.4
Not seasonally adjusted
2007 Q1 4 553 228 240 4 085Q2 4 467 204 226 4 037Q3 4 536 180 230 4 126Q4 4 915 425 271 4 219
2008 Q1 4 583 223 235 4 125Q2 4 523 183 223 4 117Q3 4 467 176 239 4 052Q4 4 767 445 286 4 036
2009 Q1 4 548 247 251 4 050Q2 4 633 202 245 4 186Q3 4 568 215 255 4 098Q4 4 937 423 292 4 222
2010 Q1 4 722 204 241 4 277
Percentage chang e , quar ter on corresponding quarter of previous year
2007 Q1 −0.4 −8.4 2.1 −0.1Q2 0.2 10.3 −0.9 −0.2Q3 3.5 −4.3 −2.1 4.2Q4 4.6 6.8 −1.5 4.7
2008 Q1 0.7 −2.2 −2.1 1.0Q2 1.3 −10.3 −1.3 2.0Q3 −1.5 −2.2 3.9 −1.8Q4 −3.0 4.7 5.5 −4.3
2009 Q1 −0.8 10.8 6.8 −1.8Q2 2.4 10.4 9.9 1.7Q3 2.3 22.2 6.7 1.1Q4 3.6 −4.9 2.1 4.6
2010 Q1 3.8 −17.4 −4.0 5.6

83
08.CS Household final consumption expenditureCommunicationCurrent prices - seasonally adjusted £ million
Communication
Total Postal services Telephone and telefax equipment Telephone and telefax services
COICOP 08 08.1 08.2 08.3
ZAWV CCVS ATMR ZAWX2005 17 939 1 016 950 15 9732006 18 115 1 020 973 16 1222007 18 471 1 037 967 16 4672008 18 340 1 027 983 16 3302009 18 686 1 087 1 043 16 556
Percentage chang e , year on previous year
2005 4.2 5.7 6.7 4.02006 1.0 0.4 2.4 0.92007 2.0 1.7 −0.6 2.12008 −0.7 −1.0 1.7 −0.82009 1.9 5.8 6.1 1.4
Seasonally adjusted
2007 Q1 4 588 264 249 4 075Q2 4 542 278 239 4 025Q3 4 638 245 239 4 154Q4 4 703 250 240 4 213
2008 Q1 4 627 259 246 4 122Q2 4 595 256 239 4 100Q3 4 571 243 247 4 081Q4 4 547 269 251 4 027
2009 Q1 4 592 277 261 4 054Q2 4 701 272 265 4 164Q3 4 678 287 265 4 126Q4 4 715 251 252 4 212
2010 Q1 4 783 243 253 4 287
Percentage chang e , quar ter on previous quarter
2007 Q1 1.9 15.3 1.6 1.2Q2 −1.0 5.3 −4.0 −1.2Q3 2.1 −11.9 − 3.2Q4 1.4 2.0 0.4 1.4
2008 Q1 −1.6 3.6 2.5 −2.2Q2 −0.7 −1.2 −2.8 −0.5Q3 −0.5 −5.1 3.3 −0.5Q4 −0.5 10.7 1.6 −1.3
2009 Q1 1.0 3.0 4.0 0.7Q2 2.4 −1.8 1.5 2.7Q3 −0.5 5.5 − −0.9Q4 0.8 −12.5 −4.9 2.1
2010 Q1 1.4 −3.2 0.4 1.8
Percentage chang e , quar ter on corresponding quarter of previous year
2007 Q1 −0.2 −6.7 2.5 −Q2 0.3 10.8 −0.4 −0.3Q3 3.4 −4.7 −2.4 4.3Q4 4.5 9.2 −2.0 4.6
2008 Q1 0.9 −1.9 −1.2 1.2Q2 1.2 −7.9 − 1.9Q3 −1.4 −0.8 3.3 −1.8Q4 −3.3 7.6 4.6 −4.4
2009 Q1 −0.8 6.9 6.1 −1.6Q2 2.3 6.2 10.9 1.6Q3 2.3 18.1 7.3 1.1Q4 3.7 −6.7 0.4 4.6
2010 Q1 4.2 −12.3 −3.1 5.7
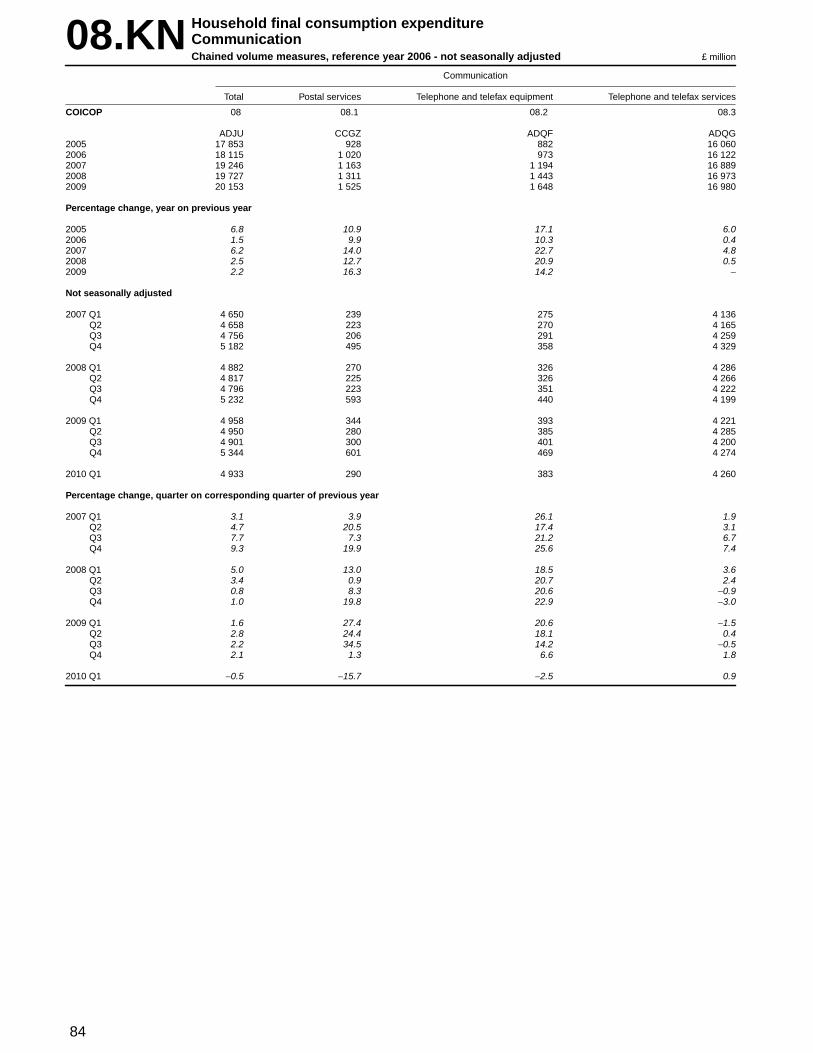
84
08.KN Household final consumption expenditureCommunicationChained volume measures, reference year 2006 - not seasonally adjusted £ million
Communication
Total Postal services Telephone and telefax equipment Telephone and telefax services
COICOP 08 08.1 08.2 08.3
ADJU CCGZ ADQF ADQG2005 17 853 928 882 16 0602006 18 115 1 020 973 16 1222007 19 246 1 163 1 194 16 8892008 19 727 1 311 1 443 16 9732009 20 153 1 525 1 648 16 980
Percentage chang e , year on previous year
2005 6.8 10.9 17.1 6.02006 1.5 9.9 10.3 0.42007 6.2 14.0 22.7 4.82008 2.5 12.7 20.9 0.52009 2.2 16.3 14.2 −
Not seasonally adjusted
2007 Q1 4 650 239 275 4 136Q2 4 658 223 270 4 165Q3 4 756 206 291 4 259Q4 5 182 495 358 4 329
2008 Q1 4 882 270 326 4 286Q2 4 817 225 326 4 266Q3 4 796 223 351 4 222Q4 5 232 593 440 4 199
2009 Q1 4 958 344 393 4 221Q2 4 950 280 385 4 285Q3 4 901 300 401 4 200Q4 5 344 601 469 4 274
2010 Q1 4 933 290 383 4 260
Percentage chang e , quar ter on corresponding quarter of previous year
2007 Q1 3.1 3.9 26.1 1.9Q2 4.7 20.5 17.4 3.1Q3 7.7 7.3 21.2 6.7Q4 9.3 19.9 25.6 7.4
2008 Q1 5.0 13.0 18.5 3.6Q2 3.4 0.9 20.7 2.4Q3 0.8 8.3 20.6 −0.9Q4 1.0 19.8 22.9 −3.0
2009 Q1 1.6 27.4 20.6 −1.5Q2 2.8 24.4 18.1 0.4Q3 2.2 34.5 14.2 −0.5Q4 2.1 1.3 6.6 1.8
2010 Q1 −0.5 −15.7 −2.5 0.9

85
08.KS Household final consumption expenditureCommunicationChained volume measures, reference year 2006 - seasonally adjusted £ million
Communication
Total Postal services Telephone and telefax equipment Telephone and telefax services
COICOP 08 08.1 08.2 08.3
ZAWW CCVM ATRR ZAWY2005 17 853 928 882 16 0602006 18 115 1 020 973 16 1222007 19 246 1 163 1 194 16 8892008 19 727 1 311 1 443 16 9732009 20 153 1 525 1 648 16 980
Percentage chang e , year on previous year
2005 6.8 10.9 17.1 6.02006 1.5 9.9 10.3 0.42007 6.2 14.0 22.7 4.82008 2.5 12.7 20.9 0.52009 2.2 16.3 14.2 −
Seasonally adjusted
2007 Q1 4 687 276 283 4 128Q2 4 758 306 289 4 163Q3 4 861 283 304 4 274Q4 4 940 298 318 4 324
2008 Q1 4 936 315 337 4 284Q2 4 929 320 350 4 259Q3 4 920 315 365 4 240Q4 4 942 361 391 4 190
2009 Q1 5 018 386 407 4 225Q2 5 064 378 413 4 273Q3 5 040 404 418 4 218Q4 5 031 357 410 4 264
2010 Q1 5 012 343 400 4 269
Percentage chang e , quar ter on previous quarter
2007 Q1 3.6 13.6 10.1 2.6Q2 1.5 10.9 2.1 0.8Q3 2.2 −7.5 5.2 2.7Q4 1.6 5.3 4.6 1.2
2008 Q1 −0.1 5.7 6.0 −0.9Q2 −0.1 1.6 3.9 −0.6Q3 −0.2 −1.6 4.3 −0.4Q4 0.4 14.6 7.1 −1.2
2009 Q1 1.5 6.9 4.1 0.8Q2 0.9 −2.1 1.5 1.1Q3 −0.5 6.9 1.2 −1.3Q4 −0.2 −11.6 −1.9 1.1
2010 Q1 −0.4 −3.9 −2.4 0.1
Percentage chang e , quar ter on corresponding quarter of previous year
2007 Q1 3.5 6.6 28.1 2.0Q2 4.8 20.9 18.0 3.0Q3 7.5 6.8 21.6 6.7Q4 9.2 22.6 23.7 7.4
2008 Q1 5.3 14.1 19.1 3.8Q2 3.6 4.6 21.1 2.3Q3 1.2 11.3 20.1 −0.8Q4 − 21.1 23.0 −3.1
2009 Q1 1.7 22.5 20.8 −1.4Q2 2.7 18.1 18.0 0.3Q3 2.4 28.3 14.5 −0.5Q4 1.8 −1.1 4.9 1.8
2010 Q1 −0.1 −11.1 −1.7 1.0

86
08.DN Household final consumption expenditureCommunicationImplied deflators - not seasonally adjusted 2006 = 100
Communication
Total Postal services Telephone and telefax equipment Telephone and telefax services
COICOP 08 08.1 08.2 08.3
UTJI UTNZ UTOA UTOB2005 100.5 109.5 107.7 99.52006 100.0 100.0 100.0 100.02007 96.0 89.2 81.0 97.52008 93.0 78.3 68.1 96.22009 92.7 71.3 63.3 97.5
Percentage chang e , year on previous year
2005 −2.4 −4.6 −8.9 −1.92006 −0.5 −8.7 −7.1 0.52007 −4.0 −10.8 −19.0 −2.52008 −3.1 −12.2 −15.9 −1.32009 −0.3 −8.9 −7.0 1.4
Not seasonally adjusted
2007 Q1 97.9 95.4 87.3 98.8Q2 95.9 91.5 83.7 96.9Q3 95.4 87.4 79.0 96.9Q4 94.8 85.9 75.7 97.5
2008 Q1 93.9 82.6 72.1 96.2Q2 93.9 81.3 68.4 96.5Q3 93.1 78.9 68.1 96.0Q4 91.1 75.0 65.0 96.1
2009 Q1 91.7 71.8 63.9 95.9Q2 93.6 72.1 63.6 97.7Q3 93.2 71.7 63.6 97.6Q4 92.4 70.4 62.3 98.8
2010 Q1 95.7 70.3 62.9 100.4
Percentage chang e , quar ter on corresponding quarter of previous year
2007 Q1 −3.5 −11.9 −19.0 −1.9Q2 −4.3 −8.5 −15.5 −3.2Q3 −3.8 −10.7 −19.3 −2.3Q4 −4.4 −10.9 −21.6 −2.5
2008 Q1 −4.1 −13.4 −17.4 −2.6Q2 −2.1 −11.1 −18.3 −0.4Q3 −2.4 −9.7 −13.8 −0.9Q4 −3.9 −12.7 −14.1 −1.4
2009 Q1 −2.3 −13.1 −11.4 −0.3Q2 −0.3 −11.3 −7.0 1.2Q3 0.1 −9.1 −6.6 1.7Q4 1.4 −6.1 −4.2 2.8
2010 Q1 4.4 −2.1 −1.6 4.7
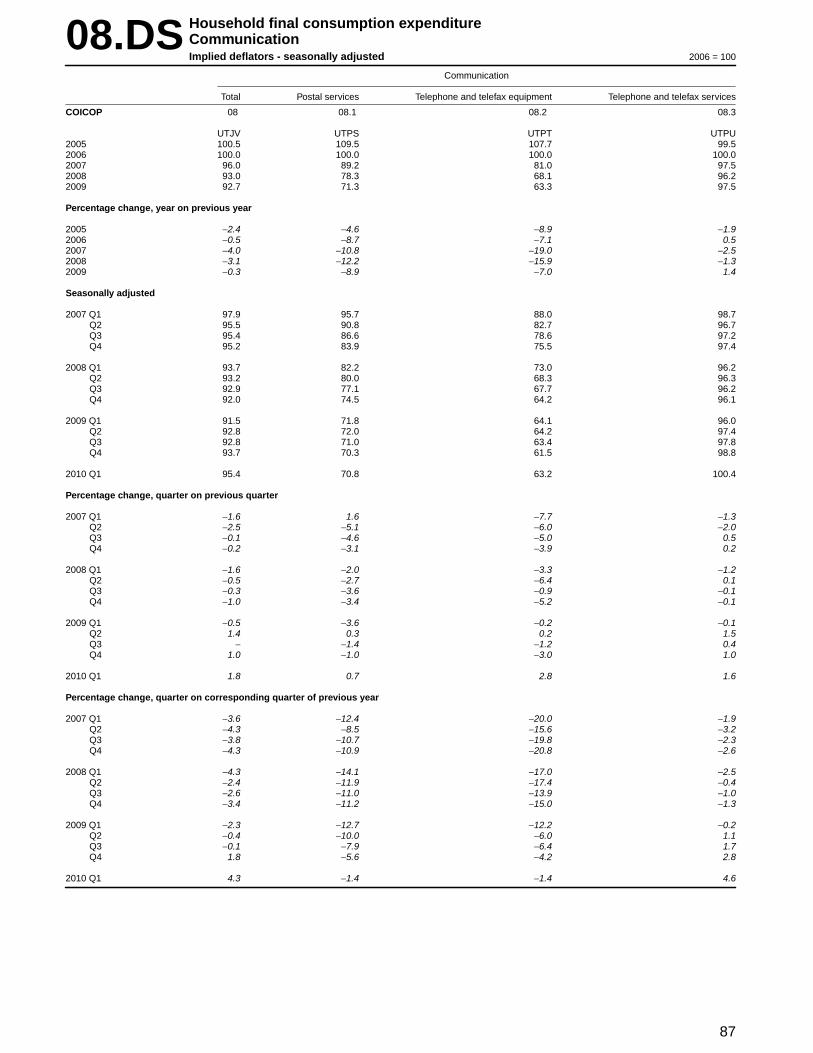
87
08.DS Household final consumption expenditureCommunicationImplied deflators - seasonally adjusted 2006 = 100
Communication
Total Postal services Telephone and telefax equipment Telephone and telefax services
COICOP 08 08.1 08.2 08.3
UTJV UTPS UTPT UTPU2005 100.5 109.5 107.7 99.52006 100.0 100.0 100.0 100.02007 96.0 89.2 81.0 97.52008 93.0 78.3 68.1 96.22009 92.7 71.3 63.3 97.5
Percentage chang e , year on previous year
2005 −2.4 −4.6 −8.9 −1.92006 −0.5 −8.7 −7.1 0.52007 −4.0 −10.8 −19.0 −2.52008 −3.1 −12.2 −15.9 −1.32009 −0.3 −8.9 −7.0 1.4
Seasonally adjusted
2007 Q1 97.9 95.7 88.0 98.7Q2 95.5 90.8 82.7 96.7Q3 95.4 86.6 78.6 97.2Q4 95.2 83.9 75.5 97.4
2008 Q1 93.7 82.2 73.0 96.2Q2 93.2 80.0 68.3 96.3Q3 92.9 77.1 67.7 96.2Q4 92.0 74.5 64.2 96.1
2009 Q1 91.5 71.8 64.1 96.0Q2 92.8 72.0 64.2 97.4Q3 92.8 71.0 63.4 97.8Q4 93.7 70.3 61.5 98.8
2010 Q1 95.4 70.8 63.2 100.4
Percentage chang e , quar ter on previous quarter
2007 Q1 −1.6 1.6 −7.7 −1.3Q2 −2.5 −5.1 −6.0 −2.0Q3 −0.1 −4.6 −5.0 0.5Q4 −0.2 −3.1 −3.9 0.2
2008 Q1 −1.6 −2.0 −3.3 −1.2Q2 −0.5 −2.7 −6.4 0.1Q3 −0.3 −3.6 −0.9 −0.1Q4 −1.0 −3.4 −5.2 −0.1
2009 Q1 −0.5 −3.6 −0.2 −0.1Q2 1.4 0.3 0.2 1.5Q3 − −1.4 −1.2 0.4Q4 1.0 −1.0 −3.0 1.0
2010 Q1 1.8 0.7 2.8 1.6
Percentage chang e , quar ter on corresponding quarter of previous year
2007 Q1 −3.6 −12.4 −20.0 −1.9Q2 −4.3 −8.5 −15.6 −3.2Q3 −3.8 −10.7 −19.8 −2.3Q4 −4.3 −10.9 −20.8 −2.6
2008 Q1 −4.3 −14.1 −17.0 −2.5Q2 −2.4 −11.9 −17.4 −0.4Q3 −2.6 −11.0 −13.9 −1.0Q4 −3.4 −11.2 −15.0 −1.3
2009 Q1 −2.3 −12.7 −12.2 −0.2Q2 −0.4 −10.0 −6.0 1.1Q3 −0.1 −7.9 −6.4 1.7Q4 1.8 −5.6 −4.2 2.8
2010 Q1 4.3 −1.4 −1.4 4.6

88
09.CN Household final consumption expenditureRecreation and cultureCurrent prices - not seasonally adjusted £ million
Recreation and culture
Audio-visual, photo and infor mation processing Other major durables
Musicalinstr uments
Repairs of Major and major MaintenancePhotographic Infor mation audio visual durables for durables for of other
Audio visual and optical processing Recording etc outdoor indoor majorTotal Total equipment equipment equipment media equipment Total recreation recreation durables
COICOP 09 09.1 09.1.1 09.1.2 09.1.3 09.1.4 09.1.5 09.2 09.2.1 09.2.2 09.2.3
ADGY ADGZ ADWQ ADWR ADWS ADWT ADWU ADHL ADWV ADWW ADWX2005 90 130 20 919 5 107 4 207 4 907 6 542 156 5 835 5 496 237 1022006 93 795 21 249 5 635 4 232 5 164 6 121 97 6 254 5 848 361 452007 96 742 20 618 5 946 3 413 5 619 5 547 93 6 379 6 060 255 642008 99 089 21 203 5 267 4 339 5 656 5 887 54 7 003 6 790 109 1042009 99 083 21 426 5 304 4 546 5 855 5 559 162 7 033 6 737 203 93
Percentage chang e , year on previous year
2005 1.9 1.7 10.3 11.3 −4.6 −4.8 13.0 8.4 7.2 35.4 32.52006 4.1 1.6 10.3 0.6 5.2 −6.4 −37.8 7.2 6.4 52.3 −55.92007 3.1 −3.0 5.5 −19.4 8.8 −9.4 −4.1 2.0 3.6 −29.4 42.22008 2.4 2.8 −11.4 27.1 0.7 6.1 −41.9 9.8 12.0 −57.3 62.52009 − 1.1 0.7 4.8 3.5 −5.6 200.0 0.4 −0.8 86.2 −10.6
Not seasonally adjusted
2007 Q1 22 939 4 914 1 381 856 1 342 1 309 26 1 672 1 602 56 14Q2 23 881 4 451 1 244 809 1 199 1 175 24 1 680 1 590 73 17Q3 23 262 4 615 1 341 772 1 271 1 209 22 1 558 1 496 45 17Q4 26 660 6 638 1 980 976 1 807 1 854 21 1 469 1 372 81 16
2008 Q1 23 332 4 743 1 261 869 1 312 1 287 14 1 833 1 796 18 19Q2 24 207 4 421 1 083 955 1 198 1 173 12 1 839 1 797 20 22Q3 24 124 4 771 1 143 1 046 1 306 1 264 12 1 735 1 692 13 30Q4 27 426 7 268 1 780 1 469 1 840 2 163 16 1 596 1 505 58 33
2009 Q1 23 394 4 810 1 161 974 1 308 1 347 20 1 875 1 834 17 24Q2 24 244 4 476 1 058 1 082 1 190 1 112 34 1 837 1 808 8 21Q3 23 694 4 807 1 194 1 076 1 357 1 130 50 1 728 1 663 45 20Q4 27 751 7 333 1 891 1 414 2 000 1 970 58 1 593 1 432 133 28
2010 Q1 23 344 4 913 1 179 1 111 1 368 1 209 46 1 860 1 812 23 25
Percentage chang e , quar ter on corresponding quarter of previous year
2007 Q1 6.1 −1.9 5.1 −13.5 10.5 −10.6 4.0 1.1 0.2 27.3 27.3Q2 2.7 −5.1 5.9 −16.4 6.5 −16.0 9.1 −0.8 1.5 −37.6 70.0Q3 2.3 −3.4 9.2 −22.6 6.2 −9.0 −4.3 2.0 1.8 −2.2 54.5Q4 1.8 −2.1 3.2 −23.5 11.1 −3.9 −22.2 6.4 13.1 −47.4 23.1
2008 Q1 1.7 −3.5 −8.7 1.5 −2.2 −1.7 −46.2 9.6 12.1 −67.9 35.7Q2 1.4 −0.7 −12.9 18.0 −0.1 −0.2 −50.0 9.5 13.0 −72.6 29.4Q3 3.7 3.4 −14.8 35.5 2.8 4.5 −45.5 11.4 13.1 −71.1 76.5Q4 2.9 9.5 −10.1 50.5 1.8 16.7 −23.8 8.6 9.7 −28.4 106.2
2009 Q1 0.3 1.4 −7.9 12.1 −0.3 4.7 42.9 2.3 2.1 −5.6 26.3Q2 0.2 1.2 −2.3 13.3 −0.7 −5.2 183.3 −0.1 0.6 −60.0 −4.5Q3 −1.8 0.8 4.5 2.9 3.9 −10.6 316.7 −0.4 −1.7 246.2 −33.3Q4 1.2 0.9 6.2 −3.7 8.7 −8.9 262.5 −0.2 −4.9 129.3 −15.2
2010 Q1 −0.2 2.1 1.6 14.1 4.6 −10.2 130.0 −0.8 −1.2 35.3 4.2

89
09.CN Household final consumption expenditureRecreation and cultureCurrent prices - not seasonally adjustedcontinued £ million
Recreation and culture (continued)
Other recreational goods, gardens and pets Recreational and cultural services Newspapers, books & stationery
Equipme- Recreat- Station-nt for Gardens, Veter in- ional Newspap- Miscell- er y and
Games, spor t, plants Pets and ar y and and ers and aneous drawingtoys and camping and related other spor ting Cultural Games of periodi- printed materia- Package
Total hobbies etc flowers products ser vices Total services services chance Total Books cals matter ls holidays1
COICOP 09.3 09.3.1 09.3.2 09.3.3 09.3.4 09.3.5 09.4 09.4.1 09.4.2 09.4.3 09.5 09.5.1 09.5.2 09.5.3 09.5.4 09.6
ADHZ ADWY ADWZ AWTW ADXB ADXC ADIA ADXD ADXE CDEM ADIC CDEO CDEP ADXI ADXJ ADID2005 24 144 13 879 2 134 3 311 2 664 2 156 27 365 5 769 12 663 8 933 11 867 3 398 4 414 1 431 2 624 −2006 25 267 14 401 2 608 3 354 2 831 2 073 28 731 6 405 13 639 8 687 12 294 3 332 4 485 1 559 2 918 −2007 27 134 15 710 2 584 3 597 2 709 2 534 30 097 6 584 14 114 9 399 12 514 3 497 4 512 1 597 2 908 −2008 28 773 16 573 2 567 3 806 2 875 2 952 30 229 5 936 14 366 9 927 11 881 3 265 4 226 1 559 2 831 −2009 28 291 16 673 2 511 3 609 3 020 2 478 30 582 6 010 15 860 8 712 11 751 3 128 4 041 1 724 2 858 −
Percentage chang e , year on previous year
2005 −0.3 −3.1 −5.7 −2.7 7.5 22.8 3.0 10.6 3.7 −2.3 1.4 1.3 −3.4 −2.3 13.12006 4.7 3.8 22.2 1.3 6.3 −3.8 5.0 11.0 7.7 −2.8 3.6 −1.9 1.6 8.9 11.22007 7.4 9.1 −0.9 7.2 −4.3 22.2 4.8 2.8 3.5 8.2 1.8 5.0 0.6 2.4 −0.32008 6.0 5.5 −0.7 5.8 6.1 16.5 0.4 −9.8 1.8 5.6 −5.1 −6.6 −6.3 −2.4 −2.62009 −1.7 0.6 −2.2 −5.2 5.0 −16.1 1.2 1.2 10.4 −12.2 −1.1 −4.2 −4.4 10.6 1.0
Not seasonally adjusted
2007 Q1 6 079 3 353 558 913 657 598 7 345 1 878 3 278 2 189 2 929 777 1 149 304 699 −Q2 7 034 3 828 646 1 285 666 609 7 855 1 923 3 709 2 223 2 861 658 1 140 410 653 −Q3 6 319 3 663 605 705 665 681 7 844 1 468 3 777 2 599 2 926 765 1 124 273 764 −Q4 7 702 4 866 775 694 721 646 7 053 1 315 3 350 2 388 3 798 1 297 1 099 610 792 −
2008 Q1 6 401 3 420 573 955 716 737 7 588 1 595 3 368 2 625 2 767 688 1 102 343 634 −Q2 7 403 3 957 643 1 384 715 704 7 797 1 667 3 617 2 513 2 747 656 1 071 342 678 −Q3 6 901 3 952 645 804 715 785 7 883 1 460 3 917 2 506 2 834 749 1 048 309 728 −Q4 8 068 5 244 706 663 729 726 6 961 1 214 3 464 2 283 3 533 1 172 1 005 565 791 −
2009 Q1 6 562 3 703 528 923 728 680 7 398 1 568 3 647 2 183 2 749 666 1 042 383 658 −Q2 7 193 3 892 663 1 281 741 616 8 051 1 696 4 120 2 235 2 687 598 1 018 431 640 −Q3 6 597 3 897 614 730 755 601 7 832 1 460 4 194 2 178 2 730 675 1 003 283 769 −Q4 7 939 5 181 706 675 796 581 7 301 1 286 3 899 2 116 3 585 1 189 978 627 791 −
2010 Q1 6 449 3 608 534 904 795 608 7 475 1 561 3 791 2 123 2 647 623 995 354 675 −
Percentage chang e , quar ter on corresponding quarter of previous year
2007 Q1 9.5 8.0 18.2 21.1 −7.5 16.3 10.4 15.4 8.4 9.2 6.6 13.1 5.5 0.3 4.5Q2 7.4 11.8 −2.0 3.5 −8.6 21.8 4.2 3.9 2.9 6.6 2.8 −0.5 2.4 10.8 2.2Q3 5.8 8.9 −9.3 −1.3 −6.1 31.2 3.5 −4.7 2.8 9.8 1.5 7.6 −0.9 −5.5 2.0Q4 7.1 7.9 −4.3 7.6 5.4 19.6 1.5 −5.3 0.5 7.1 −2.1 1.9 −4.4 2.2 −8.0
2008 Q1 5.3 2.0 2.7 4.6 9.0 23.2 3.3 −15.1 2.7 19.9 −5.5 −11.5 −4.1 12.8 −9.3Q2 5.2 3.4 −0.5 7.7 7.4 15.6 −0.7 −13.3 −2.5 13.0 −4.0 −0.3 −6.1 −16.6 3.8Q3 9.2 7.9 6.6 14.0 7.5 15.3 0.5 −0.5 3.7 −3.6 −3.1 −2.1 −6.8 13.2 −4.7Q4 4.8 7.8 −8.9 −4.5 1.1 12.4 −1.3 −7.7 3.4 −4.4 −7.0 −9.6 −8.6 −7.4 −0.1
2009 Q1 2.5 8.3 −7.9 −3.4 1.7 −7.7 −2.5 −1.7 8.3 −16.8 −0.7 −3.2 −5.4 11.7 3.8Q2 −2.8 −1.6 3.1 −7.4 3.6 −12.5 3.3 1.7 13.9 −11.1 −2.2 −8.8 −4.9 26.0 −5.6Q3 −4.4 −1.4 −4.8 −9.2 5.6 −23.4 −0.6 − 7.1 −13.1 −3.7 −9.9 −4.3 −8.4 5.6Q4 −1.6 −1.2 − 1.8 9.2 −20.0 4.9 5.9 12.6 −7.3 1.5 1.5 −2.7 11.0 −
2010 Q1 −1.7 −2.6 1.1 −2.1 9.2 −10.6 1.0 −0.4 3.9 −2.7 −3.7 −6.5 −4.5 −7.6 2.6
1 Package holidays data are dispersed between components (transpor t etc)

90
09.CS Household final consumption expenditureRecreation and cultureCurrent prices - seasonally adjusted £ million
Recreation and culture
Audio-visual, photo and infor mation processing Other major durables
Musicalinstr uments
Repairs of Major and major MaintenancePhotographic Infor mation audio visual durables for durables for of other
Audio visual and optical processing Recording etc outdoor indoor majorTotal Total equipment equipment equipment media equipment Total recreation recreation durables
COICOP 09 09.1 09.1.1 09.1.2 09.1.3 09.1.4 09.1.5 09.2 09.2.1 09.2.2 09.2.3
ZAWZ ZAXB ATMV ATMZ ATND ATNH UVJI ZAXD TMNA XYEF UVJJ2005 90 130 20 919 5 107 4 207 4 907 6 542 156 5 835 5 496 237 1022006 93 795 21 249 5 635 4 232 5 164 6 121 97 6 254 5 848 361 452007 96 742 20 618 5 946 3 413 5 619 5 547 93 6 379 6 060 255 642008 99 089 21 203 5 267 4 339 5 656 5 887 54 7 003 6 790 109 1042009 99 083 21 426 5 304 4 546 5 855 5 559 162 7 033 6 737 203 93
Percentage chang e , year on previous year
2005 1.9 1.7 10.3 11.3 −4.6 −4.8 13.0 8.4 7.2 35.4 32.52006 4.1 1.6 10.3 0.6 5.2 −6.4 −37.8 7.2 6.4 52.3 −55.92007 3.1 −3.0 5.5 −19.4 8.8 −9.4 −4.1 2.0 3.6 −29.4 42.22008 2.4 2.8 −11.4 27.1 0.7 6.1 −41.9 9.8 12.0 −57.3 62.52009 − 1.1 0.7 4.8 3.5 −5.6 200.0 0.4 −0.8 86.2 −10.6
Seasonally adjusted
2007 Q1 24 165 5 175 1 450 916 1 394 1 389 26 1 585 1 478 93 14Q2 24 239 5 239 1 513 867 1 418 1 416 25 1 572 1 486 69 17Q3 24 277 5 169 1 520 822 1 407 1 398 22 1 576 1 499 60 17Q4 24 061 5 035 1 463 808 1 400 1 344 20 1 646 1 597 33 16
2008 Q1 24 597 5 087 1 352 955 1 369 1 397 14 1 696 1 653 24 19Q2 24 568 5 205 1 328 1 014 1 416 1 435 12 1 728 1 681 24 23Q3 25 235 5 349 1 290 1 117 1 443 1 487 12 1 771 1 714 27 30Q4 24 689 5 562 1 297 1 253 1 428 1 568 16 1 808 1 742 34 32
2009 Q1 24 716 5 173 1 271 1 055 1 368 1 458 21 1 767 1 697 46 24Q2 24 653 5 267 1 309 1 136 1 421 1 365 36 1 747 1 688 37 22Q3 24 803 5 403 1 355 1 153 1 509 1 336 50 1 758 1 680 58 20Q4 24 911 5 583 1 369 1 202 1 557 1 400 55 1 761 1 672 62 27
2010 Q1 24 667 5 302 1 306 1 195 1 444 1 309 48 1 757 1 673 59 25
Percentage chang e , quar ter on previous quarter
2007 Q1 2.1 −0.4 − −13.1 10.1 −0.7 − 4.8 5.0 2.2 7.7Q2 0.3 1.2 4.3 −5.3 1.7 1.9 −3.8 −0.8 0.5 −25.8 21.4Q3 0.2 −1.3 0.5 −5.2 −0.8 −1.3 −12.0 0.3 0.9 −13.0 −Q4 −0.9 −2.6 −3.8 −1.7 −0.5 −3.9 −9.1 4.4 6.5 −45.0 −5.9
2008 Q1 2.2 1.0 −7.6 18.2 −2.2 3.9 −30.0 3.0 3.5 −27.3 18.8Q2 −0.1 2.3 −1.8 6.2 3.4 2.7 −14.3 1.9 1.7 − 21.1Q3 2.7 2.8 −2.9 10.2 1.9 3.6 − 2.5 2.0 12.5 30.4Q4 −2.2 4.0 0.5 12.2 −1.0 5.4 33.3 2.1 1.6 25.9 6.7
2009 Q1 0.1 −7.0 −2.0 −15.8 −4.2 −7.0 31.2 −2.3 −2.6 35.3 −25.0Q2 −0.3 1.8 3.0 7.7 3.9 −6.4 71.4 −1.1 −0.5 −19.6 −8.3Q3 0.6 2.6 3.5 1.5 6.2 −2.1 38.9 0.6 −0.5 56.8 −9.1Q4 0.4 3.3 1.0 4.2 3.2 4.8 10.0 0.2 −0.5 6.9 35.0
2010 Q1 −1.0 −5.0 −4.6 −0.6 −7.3 −6.5 −12.7 −0.2 0.1 −4.8 −7.4
Percentage chang e , quar ter on corresponding quarter of previous year
2007 Q1 6.2 −1.5 5.6 −12.4 11.0 −10.5 4.0 1.1 −0.7 34.8 27.3Q2 2.7 −4.7 6.7 −18.4 7.3 −15.2 8.7 −1.6 0.4 −36.1 70.0Q3 2.2 −2.6 9.0 −23.1 6.6 −6.9 −4.3 − 1.8 −35.5 54.5Q4 1.7 −3.1 0.9 −23.3 10.6 −3.9 −23.1 8.9 13.4 −63.7 23.1
2008 Q1 1.8 −1.7 −6.8 4.3 −1.8 0.6 −46.2 7.0 11.8 −74.2 35.7Q2 1.4 −0.6 −12.2 17.0 −0.1 1.3 −52.0 9.9 13.1 −65.2 35.3Q3 3.9 3.5 −15.1 35.9 2.6 6.4 −45.5 12.4 14.3 −55.0 76.5Q4 2.6 10.5 −11.3 55.1 2.0 16.7 −20.0 9.8 9.1 3.0 100.0
2009 Q1 0.5 1.7 −6.0 10.5 −0.1 4.4 50.0 4.2 2.7 91.7 26.3Q2 0.3 1.2 −1.4 12.0 0.4 −4.9 200.0 1.1 0.4 54.2 −4.3Q3 −1.7 1.0 5.0 3.2 4.6 −10.2 316.7 −0.7 −2.0 114.8 −33.3Q4 0.9 0.4 5.6 −4.1 9.0 −10.7 243.8 −2.6 −4.0 82.4 −15.6
2010 Q1 −0.2 2.5 2.8 13.3 5.6 −10.2 128.6 −0.6 −1.4 28.3 4.2

91
09.CS Household final consumption expenditureRecreation and cultureCurrent prices - seasonally adjustedcontinued £ million
Recreation and culture (continued)
Other recreational goods, gardens and pets Recreational and cultural services Newspapers, books & stationery
Equipme- Recreat- Station-nt for Gardens, Veter in- ional Newspap- Miscell- er y and
Games, spor t, plants Pets and ar y and and ers and aneous drawingtoys and camping and related other spor ting Cultural Games of periodi- printed materia- Package
Total hobbies etc flowers products ser vices Total services services chance Total Books cals matter ls holidays1
COICOP 09.3 09.3.1 09.3.2 09.3.3 09.3.4 09.3.5 09.4 09.4.1 09.4.2 09.4.3 09.5 09.5.1 09.5.2 09.5.3 09.5.4 09.6
ZAXF ATNL XYEG AWUF UVJK UVJX ZAXH ZAXJ ZAXL CCQZ ZAXN CDZP CDZX XYEH XYEI ZAXP2005 24 144 13 879 2 134 3 311 2 664 2 156 27 365 5 769 12 663 8 933 11 867 3 398 4 414 1 431 2 624 −2006 25 267 14 401 2 608 3 354 2 831 2 073 28 731 6 405 13 639 8 687 12 294 3 332 4 485 1 559 2 918 −2007 27 134 15 710 2 584 3 597 2 709 2 534 30 097 6 584 14 114 9 399 12 514 3 497 4 512 1 597 2 908 −2008 28 773 16 573 2 567 3 806 2 875 2 952 30 229 5 936 14 366 9 927 11 881 3 265 4 226 1 559 2 831 −2009 28 291 16 673 2 511 3 609 3 020 2 478 30 582 6 010 15 860 8 712 11 751 3 128 4 041 1 724 2 858 −
Percentage chang e , year on previous year
2005 −0.3 −3.1 −5.7 −2.7 7.5 22.8 3.0 10.6 3.7 −2.3 1.4 1.3 −3.4 −2.3 13.12006 4.7 3.8 22.2 1.3 6.3 −3.8 5.0 11.0 7.7 −2.8 3.6 −1.9 1.6 8.9 11.22007 7.4 9.1 −0.9 7.2 −4.3 22.2 4.8 2.8 3.5 8.2 1.8 5.0 0.6 2.4 −0.32008 6.0 5.5 −0.7 5.8 6.1 16.5 0.4 −9.8 1.8 5.6 −5.1 −6.6 −6.3 −2.4 −2.62009 −1.7 0.6 −2.2 −5.2 5.0 −16.1 1.2 1.2 10.4 −12.2 −1.1 −4.2 −4.4 10.6 1.0
Seasonally adjusted
2007 Q1 6 668 3 835 668 914 658 593 7 559 1 810 3 508 2 241 3 178 933 1 143 358 744 −Q2 6 834 4 039 637 874 665 619 7 445 1 693 3 569 2 183 3 149 847 1 139 431 732 −Q3 6 764 3 939 621 873 670 661 7 666 1 523 3 564 2 579 3 102 856 1 125 391 730 −Q4 6 868 3 897 658 936 716 661 7 427 1 558 3 473 2 396 3 085 861 1 105 417 702 −
2008 Q1 7 015 3 932 681 953 717 732 7 810 1 526 3 607 2 677 2 989 827 1 095 392 675 −Q2 7 208 4 188 634 953 716 717 7 405 1 470 3 469 2 466 3 022 845 1 071 349 757 −Q3 7 386 4 247 653 1 005 721 760 7 706 1 516 3 693 2 497 3 023 846 1 048 436 693 −Q4 7 164 4 206 599 895 721 743 7 308 1 424 3 597 2 287 2 847 747 1 012 382 706 −
2009 Q1 7 176 4 228 617 927 728 676 7 625 1 503 3 905 2 217 2 975 802 1 034 437 702 −Q2 7 040 4 130 653 887 742 628 7 636 1 499 3 944 2 193 2 963 785 1 018 445 715 −Q3 7 048 4 189 624 894 761 580 7 677 1 511 3 989 2 177 2 917 773 1 002 409 733 −Q4 7 027 4 126 617 901 789 594 7 644 1 497 4 022 2 125 2 896 768 987 433 708 −
2010 Q1 7 023 4 101 613 908 795 606 7 719 1 505 4 060 2 154 2 866 756 988 404 718 −
Percentage chang e , quar ter on previous quarter
2007 Q1 3.7 5.4 −2.2 4.7 −3.2 7.2 2.7 10.2 0.8 0.2 0.2 10.9 −0.8 −13.3 −2.7Q2 2.5 5.3 −4.6 −4.4 1.1 4.4 −1.5 −6.5 1.7 −2.6 −0.9 −9.2 −0.3 20.4 −1.6Q3 −1.0 −2.5 −2.5 −0.1 0.8 6.8 3.0 −10.0 −0.1 18.1 −1.5 1.1 −1.2 −9.3 −0.3Q4 1.5 −1.1 6.0 7.2 6.9 − −3.1 2.3 −2.6 −7.1 −0.5 0.6 −1.8 6.6 −3.8
2008 Q1 2.1 0.9 3.5 1.8 0.1 10.7 5.2 −2.1 3.9 11.7 −3.1 −3.9 −0.9 −6.0 −3.8Q2 2.8 6.5 −6.9 − −0.1 −2.0 −5.2 −3.7 −3.8 −7.9 1.1 2.2 −2.2 −11.0 12.1Q3 2.5 1.4 3.0 5.5 0.7 6.0 4.1 3.1 6.5 1.3 − 0.1 −2.1 24.9 −8.5Q4 −3.0 −1.0 −8.3 −10.9 − −2.2 −5.2 −6.1 −2.6 −8.4 −5.8 −11.7 −3.4 −12.4 1.9
2009 Q1 0.2 0.5 3.0 3.6 1.0 −9.0 4.3 5.5 8.6 −3.1 4.5 7.4 2.2 14.4 −0.6Q2 −1.9 −2.3 5.8 −4.3 1.9 −7.1 0.1 −0.3 1.0 −1.1 −0.4 −2.1 −1.5 1.8 1.9Q3 0.1 1.4 −4.4 0.8 2.6 −7.6 0.5 0.8 1.1 −0.7 −1.6 −1.5 −1.6 −8.1 2.5Q4 −0.3 −1.5 −1.1 0.8 3.7 2.4 −0.4 −0.9 0.8 −2.4 −0.7 −0.6 −1.5 5.9 −3.4
2010 Q1 −0.1 −0.6 −0.6 0.8 0.8 2.0 1.0 0.5 0.9 1.4 −1.0 −1.6 0.1 −6.7 1.4
Percentage chang e , quar ter on corresponding quarter of previous year
2007 Q1 9.3 8.6 13.4 19.9 −7.3 16.3 10.5 14.8 9.2 9.2 6.0 10.5 5.4 0.8 4.1Q2 8.0 12.1 −2.3 4.0 −8.8 22.6 4.6 5.1 3.2 6.4 2.7 − 2.4 11.9 1.5Q3 5.6 8.6 −9.2 −0.7 −5.9 30.9 3.4 −3.4 2.1 9.9 1.4 7.0 −1.1 −3.7 1.8Q4 6.8 7.1 −3.7 7.2 5.3 19.5 0.9 −5.1 −0.2 7.1 −2.7 2.4 −4.1 1.0 −8.2
2008 Q1 5.2 2.5 1.9 4.3 9.0 23.4 3.3 −15.7 2.8 19.5 −5.9 −11.4 −4.2 9.5 −9.3Q2 5.5 3.7 −0.5 9.0 7.7 15.8 −0.5 −13.2 −2.8 13.0 −4.0 −0.2 −6.0 −19.0 3.4Q3 9.2 7.8 5.2 15.1 7.6 15.0 0.5 −0.5 3.6 −3.2 −2.5 −1.2 −6.8 11.5 −5.1Q4 4.3 7.9 −9.0 −4.4 0.7 12.4 −1.6 −8.6 3.6 −4.5 −7.7 −13.2 −8.4 −8.4 0.6
2009 Q1 2.3 7.5 −9.4 −2.7 1.5 −7.7 −2.4 −1.5 8.3 −17.2 −0.5 −3.0 −5.6 11.5 4.0Q2 −2.3 −1.4 3.0 −6.9 3.6 −12.4 3.1 2.0 13.7 −11.1 −2.0 −7.1 −4.9 27.5 −5.5Q3 −4.6 −1.4 −4.4 −11.0 5.5 −23.7 −0.4 −0.3 8.0 −12.8 −3.5 −8.6 −4.4 −6.2 5.8Q4 −1.9 −1.9 3.0 0.7 9.4 −20.1 4.6 5.1 11.8 −7.1 1.7 2.8 −2.5 13.4 0.3
2010 Q1 −2.1 −3.0 −0.6 −2.0 9.2 −10.4 1.2 0.1 4.0 −2.8 −3.7 −5.7 −4.4 −7.6 2.3
1 Package holidays data are dispersed between components (transpor t etc)

92
09.KN Household final consumption expenditureRecreation and cultureChained volume measures, reference year 2006 - not seasonally adjusted £ million
Recreation and culture
Audio-visual, photo and infor mation processing Other major durables
Musicalinstr uments
Repairs of Major and major MaintenancePhotographic Infor mation audio visual durables for durables for of other
Audio visual and optical processing Recording etc outdoor indoor majorTotal Total equipment equipment equipment media equipment Total recreation recreation durables
COICOP 09 09.1 09.1.1 09.1.2 09.1.3 09.1.4 09.1.5 09.2 09.2.1 09.2.2 09.2.3
ADJV ADJW ADQH ADQI ADQJ ADQK ADQL ADJX ADQM ADQN ADQO2005 88 977 18 590 4 559 3 293 4 265 6 498 162 5 863 5 519 237 1122006 93 795 21 249 5 635 4 232 5 164 6 121 97 6 254 5 848 361 452007 98 241 23 769 6 664 4 498 7 046 5 472 89 6 384 6 067 256 612008 104 415 29 599 6 690 7 634 9 200 6 025 50 6 930 6 729 109 922009 106 886 34 412 7 120 10 017 10 959 6 168 148 6 724 6 452 195 77
Percentage chang e , year on previous year
2005 4.4 16.7 25.2 37.9 19.1 −2.1 5.2 7.2 6.0 35.4 27.32006 5.4 14.3 23.6 28.5 21.1 −5.8 −40.1 6.7 6.0 52.3 −59.82007 4.7 11.9 18.3 6.3 36.4 −10.6 −8.2 2.1 3.7 −29.1 35.62008 6.3 24.5 0.4 69.7 30.6 10.1 −43.8 8.6 10.9 −57.4 50.82009 2.4 16.3 6.4 31.2 19.1 2.4 196.0 −3.0 −4.1 78.9 −16.3
Not seasonally adjusted
2007 Q1 23 033 5 205 1 440 988 1 452 1 300 25 1 664 1 594 56 14Q2 24 014 4 985 1 377 997 1 446 1 142 23 1 671 1 582 73 16Q3 23 721 5 494 1 540 1 072 1 663 1 198 21 1 573 1 512 45 16Q4 27 473 8 085 2 307 1 441 2 485 1 832 20 1 476 1 379 82 15
2008 Q1 24 081 6 140 1 537 1 361 1 940 1 289 13 1 826 1 791 18 17Q2 25 009 6 021 1 351 1 580 1 917 1 163 10 1 828 1 788 20 20Q3 25 256 6 752 1 455 1 854 2 140 1 292 11 1 715 1 675 13 27Q4 30 069 10 686 2 347 2 839 3 203 2 281 16 1 561 1 475 58 28
2009 Q1 25 149 7 509 1 558 2 008 2 397 1 528 18 1 821 1 783 17 21Q2 25 667 7 161 1 380 2 338 2 178 1 234 31 1 759 1 734 8 17Q3 25 328 7 830 1 592 2 425 2 517 1 250 46 1 641 1 582 43 16Q4 30 742 11 912 2 590 3 246 3 867 2 156 53 1 503 1 353 127 23
2010 Q1 24 954 8 205 1 651 2 615 2 575 1 323 41 1 723 1 681 22 20
Percentage chang e , quar ter on corresponding quarter of previous year
2007 Q1 6.2 8.9 14.3 6.8 27.9 −9.8 −3.8 −0.8 −1.7 27.3 27.3Q2 3.5 6.2 16.4 2.0 29.0 −17.7 4.5 −1.3 1.0 −37.6 60.0Q3 4.7 13.2 22.9 5.6 38.6 −11.5 −8.7 3.8 3.7 −2.2 45.5Q4 4.7 16.8 19.0 9.6 45.5 −5.5 −23.1 7.8 14.7 −46.8 15.4
2008 Q1 4.5 18.0 6.7 37.8 33.6 −0.8 −48.0 9.7 12.4 −67.9 21.4Q2 4.1 20.8 −1.9 58.5 32.6 1.8 −56.5 9.4 13.0 −72.6 25.0Q3 6.5 22.9 −5.5 72.9 28.7 7.8 −47.6 9.0 10.8 −71.1 68.8Q4 9.4 32.2 1.7 97.0 28.9 24.5 −20.0 5.8 7.0 −29.3 86.7
2009 Q1 4.4 22.3 1.4 47.5 23.6 18.5 38.5 −0.3 −0.4 −5.6 23.5Q2 2.6 18.9 2.1 48.0 13.6 6.1 210.0 −3.8 −3.0 −60.0 −15.0Q3 0.3 16.0 9.4 30.8 17.6 −3.3 318.2 −4.3 −5.6 230.8 −40.7Q4 2.2 11.5 10.4 14.3 20.7 −5.5 231.2 −3.7 −8.3 119.0 −17.9
2010 Q1 −0.8 9.3 6.0 30.2 7.4 −13.4 127.8 −5.4 −5.7 29.4 −4.8

93
09.KN Household final consumption expenditureRecreation and cultureChained volume measures, reference year 2006 - not seasonally adjustedcontinued £ million
Recreation and culture (continued)
Other recreational goods, gardens and pets Recreational and cultural services Newspapers, books & stationery
Equipme- Recreat- Station-nt for Gardens, Veter in- ional Newspap- Miscell- er y and
Games, spor t, plants Pets and ar y and and ers and aneous drawingtoys and camping and related other spor ting Cultural Games of periodi- printed materia- Package
Total hobbies etc flowers products ser vices Total services services chance Total Books cals matter ls holidays1
COICOP 09.3 09.3.1 09.3.2 09.3.3 09.3.4 09.3.5 09.4 09.4.1 09.4.2 09.4.3 09.5 09.5.1 09.5.2 09.5.3 09.5.4 09.6
ADJY ADQP ADQQ AWUO ADQS ADQT ADJZ ADQU ADQV CCHG ADKM CCHI CCHJ ADQZ ADSI ADMI2005 23 810 13 403 2 122 3 315 2 743 2 247 28 680 6 068 13 325 9 280 12 299 3 564 4 699 1 435 2 624 −2006 25 267 14 401 2 608 3 354 2 831 2 073 28 731 6 405 13 639 8 687 12 294 3 332 4 485 1 559 2 918 −2007 27 027 15 851 2 540 3 555 2 658 2 423 28 835 6 279 13 531 9 025 12 226 3 343 4 356 1 602 2 925 −2008 28 533 17 065 2 448 3 671 2 653 2 696 28 270 5 326 13 602 9 342 11 083 2 905 3 891 1 518 2 769 −2009 27 348 16 826 2 320 3 404 2 589 2 209 27 874 5 196 14 663 8 015 10 528 2 760 3 559 1 578 2 631 −
Percentage chang e , year on previous year
2005 0.7 −1.0 −2.3 −2.4 5.5 17.4 −0.7 6.0 −0.3 −5.2 0.6 −0.3 −4.8 −2.7 14.62006 6.1 7.4 22.9 1.2 3.2 −7.7 0.2 5.6 2.4 −6.4 − −6.5 −4.6 8.6 11.22007 7.0 10.1 −2.6 6.0 −6.1 16.9 0.4 −2.0 −0.8 3.9 −0.6 0.3 −2.9 2.8 0.22008 5.6 7.7 −3.6 3.3 −0.2 11.3 −2.0 −15.2 0.5 3.5 −9.3 −13.1 −10.7 −5.2 −5.32009 −4.2 −1.4 −5.2 −7.3 −2.4 −18.1 −1.4 −2.4 7.8 −14.2 −5.0 −5.0 −8.5 4.0 −5.0
Not seasonally adjusted
2007 Q1 6 048 3 364 555 895 654 580 7 221 1 832 3 234 2 155 2 895 768 1 122 304 701 −Q2 7 035 3 888 633 1 274 655 585 7 511 1 854 3 534 2 123 2 812 639 1 108 409 656 −Q3 6 327 3 726 594 702 657 648 7 486 1 388 3 611 2 487 2 841 712 1 084 275 770 −Q4 7 617 4 873 758 684 692 610 6 617 1 205 3 152 2 260 3 678 1 224 1 042 614 798 −
2008 Q1 6 347 3 497 567 921 679 683 7 165 1 461 3 207 2 497 2 603 607 1 029 339 628 −Q2 7 309 4 042 616 1 334 671 646 7 295 1 506 3 426 2 363 2 556 566 986 336 668 −Q3 6 833 4 087 605 779 649 713 7 331 1 299 3 690 2 342 2 625 654 962 300 709 −Q4 8 044 5 439 660 637 654 654 6 479 1 060 3 279 2 140 3 299 1 078 914 543 764 −
2009 Q1 6 434 3 798 511 881 635 609 6 906 1 371 3 477 2 058 2 479 570 924 362 623 −Q2 7 004 3 987 613 1 218 635 551 7 326 1 473 3 798 2 055 2 417 535 896 396 590 −Q3 6 327 3 906 555 685 646 535 7 103 1 257 3 855 1 991 2 427 582 878 260 707 −Q4 7 583 5 135 641 620 673 514 6 539 1 095 3 533 1 911 3 205 1 073 861 560 711 −
2010 Q1 6 083 3 596 492 806 664 525 6 646 1 332 3 413 1 901 2 297 537 860 309 591 −
Percentage chang e , quar ter on corresponding quarter of previous year
2007 Q1 10.0 11.1 15.6 20.0 −9.3 11.3 5.2 10.4 3.2 4.0 4.1 10.2 0.7 −0.7 5.1Q2 7.7 14.3 −3.9 2.3 −9.9 16.1 −0.1 −0.2 −1.5 2.2 0.6 −4.8 −1.0 11.1 2.8Q3 5.5 9.5 −10.1 −2.0 −6.7 25.6 −0.5 −9.3 −1.0 6.0 −1.1 0.7 −3.7 −4.8 2.5Q4 5.1 6.7 −6.2 5.7 1.9 14.7 −2.9 −11.3 −3.6 3.2 −4.3 −2.6 −7.5 3.0 −7.4
2008 Q1 4.9 4.0 2.2 2.9 3.8 17.8 −0.8 −20.3 −0.8 15.9 −10.1 −21.0 −8.3 11.5 −10.4Q2 3.9 4.0 −2.7 4.7 2.4 10.4 −2.9 −18.8 −3.1 11.3 −9.1 −11.4 −11.0 −17.8 1.8Q3 8.0 9.7 1.9 11.0 −1.2 10.0 −2.1 −6.4 2.2 −5.8 −7.6 −8.1 −11.3 9.1 −7.9Q4 5.6 11.6 −12.9 −6.9 −5.5 7.2 −2.1 −12.0 4.0 −5.3 −10.3 −11.9 −12.3 −11.6 −4.3
2009 Q1 1.4 8.6 −9.9 −4.3 −6.5 −10.8 −3.6 −6.2 8.4 −17.6 −4.8 −6.1 −10.2 6.8 −0.8Q2 −4.2 −1.4 −0.5 −8.7 −5.4 −14.7 0.4 −2.2 10.9 −13.0 −5.4 −5.5 −9.1 17.9 −11.7Q3 −7.4 −4.4 −8.3 −12.1 −0.5 −25.0 −3.1 −3.2 4.5 −15.0 −7.5 −11.0 −8.7 −13.3 −0.3Q4 −5.7 −5.6 −2.9 −2.7 2.9 −21.4 0.9 3.3 7.7 −10.7 −2.8 −0.5 −5.8 3.1 −6.9
2010 Q1 −5.5 −5.3 −3.7 −8.5 4.6 −13.8 −3.8 −2.8 −1.8 −7.6 −7.3 −5.8 −6.9 −14.6 −5.1
1 Package holidays data are dispersed between components (transpor t etc)

94
09.KS Household final consumption expenditureRecreation and cultureChained volume measures, reference year 2006 - seasonally adjusted £ million
Recreation and culture
Audio-visual, photo and infor mation processing Other major durables
Musicalinstr uments
Repairs of Major and major MaintenancePhotographic Infor mation audio visual durables for durables for of other
Audio visual and optical processing Recording etc outdoor indoor majorTotal Total equipment equipment equipment media equipment Total recreation recreation durables
COICOP 09 09.1 09.1.1 09.1.2 09.1.3 09.1.4 09.1.5 09.2 09.2.1 09.2.2 09.2.3
ZAXA ZAXC ATRV ATRZ ATSD ATSH UWKO ZAXE TMNB XYJT UWKP2005 88 977 18 590 4 559 3 293 4 265 6 498 162 5 863 5 519 237 1122006 93 795 21 249 5 635 4 232 5 164 6 121 97 6 254 5 848 361 452007 98 241 23 769 6 664 4 498 7 046 5 472 89 6 384 6 067 256 612008 104 415 29 599 6 690 7 634 9 200 6 025 50 6 930 6 729 109 922009 106 886 34 412 7 120 10 017 10 959 6 168 148 6 724 6 452 195 77
Percentage chang e , year on previous year
2005 4.4 16.7 25.2 37.9 19.1 −2.1 5.2 7.2 6.0 35.4 27.32006 5.4 14.3 23.6 28.5 21.1 −5.8 −40.1 6.7 6.0 52.3 −59.82007 4.7 11.9 18.3 6.3 36.4 −10.6 −8.2 2.1 3.7 −29.1 35.62008 6.3 24.5 0.4 69.7 30.6 10.1 −43.8 8.6 10.9 −57.4 50.82009 2.4 16.3 6.4 31.2 19.1 2.4 196.0 −3.0 −4.1 78.9 −16.3
Seasonally adjusted
2007 Q1 24 209 5 465 1 515 1 034 1 530 1 361 25 1 574 1 467 93 14Q2 24 533 5 884 1 679 1 083 1 712 1 386 24 1 563 1 478 69 16Q3 24 883 6 195 1 752 1 173 1 862 1 387 21 1 580 1 505 59 16Q4 24 616 6 225 1 718 1 208 1 942 1 338 19 1 667 1 617 35 15
2008 Q1 25 388 6 560 1 646 1 469 2 043 1 389 13 1 688 1 647 24 17Q2 25 730 7 100 1 669 1 714 2 265 1 441 11 1 719 1 674 24 21Q3 26 650 7 615 1 656 2 027 2 386 1 535 11 1 746 1 693 26 27Q4 26 647 8 324 1 719 2 424 2 506 1 660 15 1 777 1 715 35 27
2009 Q1 26 565 7 999 1 692 2 135 2 517 1 636 19 1 720 1 653 46 21Q2 26 573 8 378 1 728 2 501 2 596 1 520 33 1 674 1 621 35 18Q3 26 786 8 814 1 823 2 636 2 821 1 488 46 1 665 1 594 55 16Q4 26 962 9 221 1 877 2 745 3 025 1 524 50 1 665 1 584 59 22
2010 Q1 26 330 8 742 1 808 2 765 2 714 1 412 43 1 627 1 551 56 20
Percentage chang e , quar ter on previous quarter
2007 Q1 2.3 2.1 3.1 −5.7 14.1 −3.7 − 4.7 4.9 2.2 7.7Q2 1.3 7.7 10.8 4.7 11.9 1.8 −4.0 −0.7 0.7 −25.8 14.3Q3 1.4 5.3 4.3 8.3 8.8 0.1 −12.5 1.1 1.8 −14.5 −Q4 −1.1 0.5 −1.9 3.0 4.3 −3.5 −9.5 5.5 7.4 −40.7 −6.2
2008 Q1 3.1 5.4 −4.2 21.6 5.2 3.8 −31.6 1.3 1.9 −31.4 13.3Q2 1.3 8.2 1.4 16.7 10.9 3.7 −15.4 1.8 1.6 − 23.5Q3 3.6 7.3 −0.8 18.3 5.3 6.5 − 1.6 1.1 8.3 28.6Q4 − 9.3 3.8 19.6 5.0 8.1 36.4 1.8 1.3 34.6 −
2009 Q1 −0.3 −3.9 −1.6 −11.9 0.4 −1.4 26.7 −3.2 −3.6 31.4 −22.2Q2 − 4.7 2.1 17.1 3.1 −7.1 73.7 −2.7 −1.9 −23.9 −14.3Q3 0.8 5.2 5.5 5.4 8.7 −2.1 39.4 −0.5 −1.7 57.1 −11.1Q4 0.7 4.6 3.0 4.1 7.2 2.4 8.7 − −0.6 7.3 37.5
2010 Q1 −2.3 −5.2 −3.7 0.7 −10.3 −7.3 −14.0 −2.3 −2.1 −5.1 −9.1
Percentage chang e , quar ter on corresponding quarter of previous year
2007 Q1 6.7 9.3 14.6 7.8 29.2 −10.0 −3.8 −0.9 −2.7 34.8 27.3Q2 3.7 7.2 17.8 1.1 30.7 −17.0 4.3 −2.4 −0.3 −36.1 60.0Q3 4.5 14.6 23.6 6.1 40.1 −9.1 −8.7 1.2 3.2 −36.6 45.5Q4 4.0 16.3 16.9 10.2 44.8 −5.3 −24.0 10.9 15.6 −61.5 15.4
2008 Q1 4.9 20.0 8.6 42.1 33.5 2.1 −48.0 7.2 12.3 −74.2 21.4Q2 4.9 20.7 −0.6 58.3 32.3 4.0 −54.2 10.0 13.3 −65.2 31.2Q3 7.1 22.9 −5.5 72.8 28.1 10.7 −47.6 10.5 12.5 −55.9 68.8Q4 8.3 33.7 0.1 100.7 29.0 24.1 −21.1 6.6 6.1 − 80.0
2009 Q1 4.6 21.9 2.8 45.3 23.2 17.8 46.2 1.9 0.4 91.7 23.5Q2 3.3 18.0 3.5 45.9 14.6 5.5 200.0 −2.6 −3.2 45.8 −14.3Q3 0.5 15.7 10.1 30.0 18.2 −3.1 318.2 −4.6 −5.8 111.5 −40.7Q4 1.2 10.8 9.2 13.2 20.7 −8.2 233.3 −6.3 −7.6 68.6 −18.5
2010 Q1 −0.9 9.3 6.9 29.5 7.8 −13.7 126.3 −5.4 −6.2 21.7 −4.8

95
09.KS Household final consumption expenditureRecreation and cultureChained volume measures, reference year 2006 - seasonally adjustedcontinued £ million
Recreation and culture (continued)
Other recreational goods, gardens and pets Recreational and cultural services Newspapers, books & stationery
Equipme- Recreat- Station-nt for Gardens, Veter in- ional Newspap- Miscell- er y and
Games, spor t, plants Pets and ar y and and ers and aneous drawingtoys and camping and related other spor ting Cultural Games of periodi- printed materia- Package
Total hobbies etc flowers products ser vices Total services services chance Total Books cals matter ls holidays1
COICOP 09.3 09.3.1 09.3.2 09.3.3 09.3.4 09.3.5 09.4 09.4.1 09.4.2 09.4.3 09.5 09.5.1 09.5.2 09.5.3 09.5.4 09.6
ZAXG ATSL XYJU AWUX UWKQ UWLD ZAXI ZAXK ZAXM CCVA ZAXO CDZQ CDZY XYJV XYJW ZAXQ2005 23 810 13 403 2 122 3 315 2 743 2 247 28 680 6 068 13 325 9 279 12 299 3 564 4 699 1 435 2 624 −2006 25 267 14 401 2 608 3 354 2 831 2 073 28 731 6 405 13 639 8 687 12 294 3 332 4 485 1 559 2 918 −2007 27 027 15 851 2 540 3 555 2 658 2 423 28 835 6 279 13 531 9 025 12 226 3 343 4 356 1 602 2 925 −2008 28 533 17 065 2 448 3 671 2 653 2 696 28 270 5 326 13 602 9 342 11 083 2 905 3 891 1 518 2 769 −2009 27 348 16 826 2 320 3 404 2 589 2 209 27 874 5 196 14 663 8 015 10 528 2 760 3 559 1 578 2 631 −
Percentage chang e , year on previous year
2005 0.7 −1.0 −2.3 −2.4 5.5 17.4 −0.7 6.0 −0.3 −5.2 0.6 −0.3 −4.8 −2.7 14.62006 6.1 7.4 22.9 1.2 3.2 −7.7 0.2 5.6 2.4 −6.4 − −6.5 −4.6 8.6 11.22007 7.0 10.1 −2.6 6.0 −6.1 16.9 0.4 −2.0 −0.8 3.9 −0.6 0.3 −2.9 2.8 0.22008 5.6 7.7 −3.6 3.3 −0.2 11.3 −2.0 −15.2 0.5 3.5 −9.3 −13.1 −10.7 −5.2 −5.32009 −4.2 −1.4 −5.2 −7.3 −2.4 −18.1 −1.4 −2.4 7.8 −14.2 −5.0 −5.0 −8.5 4.0 −5.0
Seasonally adjusted
2007 Q1 6 643 3 851 656 904 655 577 7 375 1 757 3 419 2 199 3 152 929 1 117 360 746 −Q2 6 841 4 096 626 868 656 595 7 147 1 635 3 421 2 091 3 098 818 1 109 433 738 −Q3 6 749 3 985 612 863 660 629 7 339 1 445 3 425 2 469 3 020 809 1 084 392 735 −Q4 6 794 3 919 646 920 687 622 6 974 1 442 3 266 2 266 2 956 787 1 046 417 706 −
2008 Q1 6 973 4 025 662 927 680 679 7 335 1 391 3 406 2 538 2 832 748 1 024 391 669 −Q2 7 135 4 278 608 918 673 658 6 956 1 329 3 304 2 323 2 820 740 988 344 748 −Q3 7 305 4 379 616 967 652 691 7 177 1 351 3 492 2 334 2 807 752 961 420 674 −Q4 7 120 4 383 562 859 648 668 6 802 1 255 3 400 2 147 2 624 665 918 363 678 −
2009 Q1 7 055 4 332 584 895 636 608 7 082 1 307 3 690 2 085 2 709 708 919 416 666 −Q2 6 867 4 221 604 844 637 561 6 983 1 300 3 662 2 021 2 671 703 898 409 661 −Q3 6 746 4 175 569 837 649 516 6 960 1 303 3 667 1 990 2 601 680 877 372 672 −Q4 6 680 4 098 563 828 667 524 6 849 1 286 3 644 1 919 2 547 669 865 381 632 −
2010 Q1 6 636 4 072 553 821 665 525 6 814 1 278 3 613 1 923 2 511 671 856 355 629 −
Percentage chang e , quar ter on previous quarter
2007 Q1 2.5 3.9 −4.0 3.6 −3.0 6.5 2.0 8.4 0.2 0.2 1.1 14.3 −1.1 −12.0 −2.6Q2 3.0 6.4 −4.6 −4.0 0.2 3.1 −3.1 −6.9 0.1 −4.9 −1.7 −11.9 −0.7 20.3 −1.1Q3 −1.3 −2.7 −2.2 −0.6 0.6 5.7 2.7 −11.6 0.1 18.1 −2.5 −1.1 −2.3 −9.5 −0.4Q4 0.7 −1.7 5.6 6.6 4.1 −1.1 −5.0 −0.2 −4.6 −8.2 −2.1 −2.7 −3.5 6.4 −3.9
2008 Q1 2.6 2.7 2.5 0.8 −1.0 9.2 5.2 −3.5 4.3 12.0 −4.2 −5.0 −2.1 −6.2 −5.2Q2 2.3 6.3 −8.2 −1.0 −1.0 −3.1 −5.2 −4.5 −3.0 −8.5 −0.4 −1.1 −3.5 −12.0 11.8Q3 2.4 2.4 1.3 5.3 −3.1 5.0 3.2 1.7 5.7 0.5 −0.5 1.6 −2.7 22.1 −9.9Q4 −2.5 0.1 −8.8 −11.2 −0.6 −3.3 −5.2 −7.1 −2.6 −8.0 −6.5 −11.6 −4.5 −13.6 0.6
2009 Q1 −0.9 −1.2 3.9 4.2 −1.9 −9.0 4.1 4.1 8.5 −2.9 3.2 6.5 0.1 14.6 −1.8Q2 −2.7 −2.6 3.4 −5.7 0.2 −7.7 −1.4 −0.5 −0.8 −3.1 −1.4 −0.7 −2.3 −1.7 −0.8Q3 −1.8 −1.1 −5.8 −0.8 1.9 −8.0 −0.3 0.2 0.1 −1.5 −2.6 −3.3 −2.3 −9.0 1.7Q4 −1.0 −1.8 −1.1 −1.1 2.8 1.6 −1.6 −1.3 −0.6 −3.6 −2.1 −1.6 −1.4 2.4 −6.0
2010 Q1 −0.7 −0.6 −1.8 −0.8 −0.3 0.2 −0.5 −0.6 −0.9 0.2 −1.4 0.3 −1.0 −6.8 −0.5
Percentage chang e , quar ter on corresponding quarter of previous year
2007 Q1 9.9 11.5 11.0 18.8 −9.2 11.4 5.3 10.1 4.0 3.8 3.5 7.5 0.7 −0.3 4.8Q2 8.2 14.3 −4.3 3.0 −10.0 16.7 0.2 1.0 −1.3 2.0 0.7 −3.9 −0.9 12.5 2.2Q3 5.1 9.0 −10.0 −1.6 −6.5 25.0 −0.4 −7.9 −1.4 6.2 −1.1 0.6 −3.9 −3.0 2.4Q4 4.9 5.8 −5.4 5.4 1.8 14.8 −3.5 −11.0 −4.3 3.2 −5.2 −3.2 −7.4 2.0 −7.8
2008 Q1 5.0 4.5 0.9 2.5 3.8 17.7 −0.5 −20.8 −0.4 15.4 −10.2 −19.5 −8.3 8.6 −10.3Q2 4.3 4.4 −2.9 5.8 2.6 10.6 −2.7 −18.7 −3.4 11.1 −9.0 −9.5 −10.9 −20.6 1.4Q3 8.2 9.9 0.7 12.1 −1.2 9.9 −2.2 −6.5 2.0 −5.5 −7.1 −7.0 −11.3 7.1 −8.3Q4 4.8 11.8 −13.0 −6.6 −5.7 7.4 −2.5 −13.0 4.1 −5.3 −11.2 −15.5 −12.2 −12.9 −4.0
2009 Q1 1.2 7.6 −11.8 −3.5 −6.5 −10.5 −3.4 −6.0 8.3 −17.8 −4.3 −5.3 −10.3 6.4 −0.4Q2 −3.8 −1.3 −0.7 −8.1 −5.3 −14.7 0.4 −2.2 10.8 −13.0 −5.3 −5.0 −9.1 18.9 −11.6Q3 −7.7 −4.7 −7.6 −13.4 −0.5 −25.3 −3.0 −3.6 5.0 −14.7 −7.3 −9.6 −8.7 −11.4 −0.3Q4 −6.2 −6.5 0.2 −3.6 2.9 −21.6 0.7 2.5 7.2 −10.6 −2.9 0.6 −5.8 5.0 −6.8
2010 Q1 −5.9 −6.0 −5.3 −8.3 4.6 −13.7 −3.8 −2.2 −2.1 −7.8 −7.3 −5.2 −6.9 −14.7 −5.6
1 Package holidays data are dispersed between components (transpor t etc)
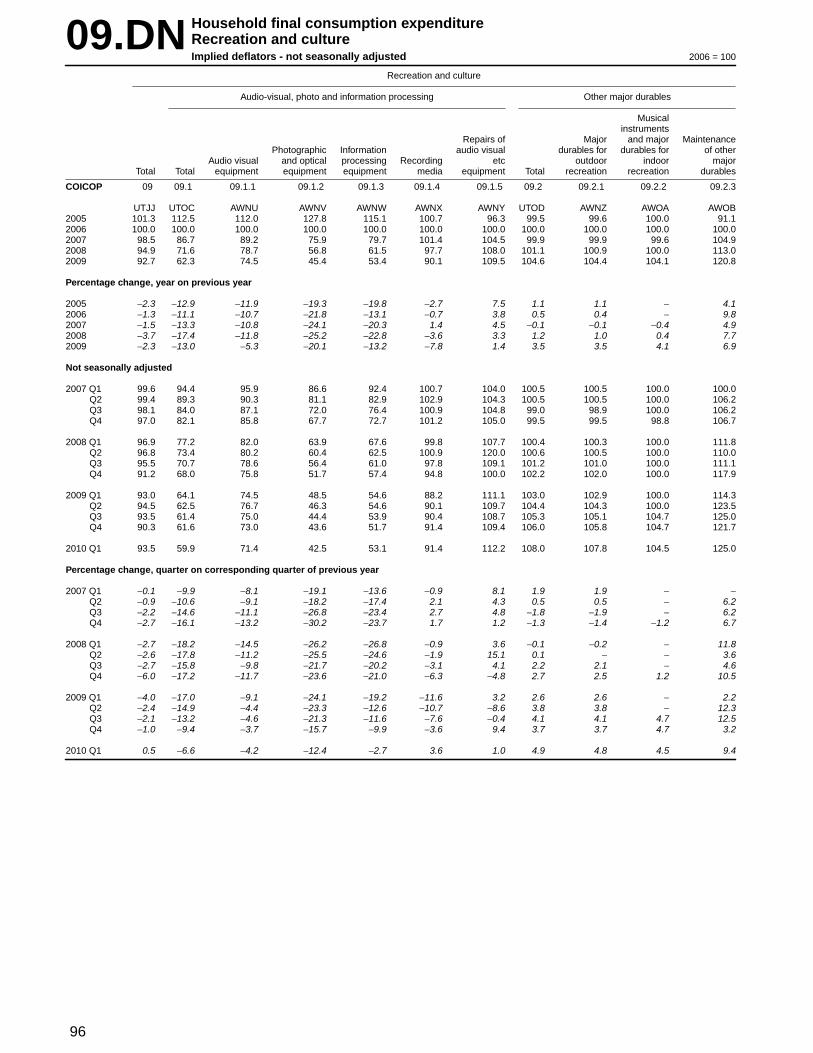
96
09.DN Household final consumption expenditureRecreation and cultureImplied deflators - not seasonally adjusted 2006 = 100
Recreation and culture
Audio-visual, photo and infor mation processing Other major durables
Musicalinstr uments
Repairs of Major and major MaintenancePhotographic Infor mation audio visual durables for durables for of other
Audio visual and optical processing Recording etc outdoor indoor majorTotal Total equipment equipment equipment media equipment Total recreation recreation durables
COICOP 09 09.1 09.1.1 09.1.2 09.1.3 09.1.4 09.1.5 09.2 09.2.1 09.2.2 09.2.3
UTJJ UTOC AWNU AWNV AWNW AWNX AWNY UTOD AWNZ AWOA AWOB2005 101.3 112.5 112.0 127.8 115.1 100.7 96.3 99.5 99.6 100.0 91.12006 100.0 100.0 100.0 100.0 100.0 100.0 100.0 100.0 100.0 100.0 100.02007 98.5 86.7 89.2 75.9 79.7 101.4 104.5 99.9 99.9 99.6 104.92008 94.9 71.6 78.7 56.8 61.5 97.7 108.0 101.1 100.9 100.0 113.02009 92.7 62.3 74.5 45.4 53.4 90.1 109.5 104.6 104.4 104.1 120.8
Percentage chang e , year on previous year
2005 −2.3 −12.9 −11.9 −19.3 −19.8 −2.7 7.5 1.1 1.1 − 4.12006 −1.3 −11.1 −10.7 −21.8 −13.1 −0.7 3.8 0.5 0.4 − 9.82007 −1.5 −13.3 −10.8 −24.1 −20.3 1.4 4.5 −0.1 −0.1 −0.4 4.92008 −3.7 −17.4 −11.8 −25.2 −22.8 −3.6 3.3 1.2 1.0 0.4 7.72009 −2.3 −13.0 −5.3 −20.1 −13.2 −7.8 1.4 3.5 3.5 4.1 6.9
Not seasonally adjusted
2007 Q1 99.6 94.4 95.9 86.6 92.4 100.7 104.0 100.5 100.5 100.0 100.0Q2 99.4 89.3 90.3 81.1 82.9 102.9 104.3 100.5 100.5 100.0 106.2Q3 98.1 84.0 87.1 72.0 76.4 100.9 104.8 99.0 98.9 100.0 106.2Q4 97.0 82.1 85.8 67.7 72.7 101.2 105.0 99.5 99.5 98.8 106.7
2008 Q1 96.9 77.2 82.0 63.9 67.6 99.8 107.7 100.4 100.3 100.0 111.8Q2 96.8 73.4 80.2 60.4 62.5 100.9 120.0 100.6 100.5 100.0 110.0Q3 95.5 70.7 78.6 56.4 61.0 97.8 109.1 101.2 101.0 100.0 111.1Q4 91.2 68.0 75.8 51.7 57.4 94.8 100.0 102.2 102.0 100.0 117.9
2009 Q1 93.0 64.1 74.5 48.5 54.6 88.2 111.1 103.0 102.9 100.0 114.3Q2 94.5 62.5 76.7 46.3 54.6 90.1 109.7 104.4 104.3 100.0 123.5Q3 93.5 61.4 75.0 44.4 53.9 90.4 108.7 105.3 105.1 104.7 125.0Q4 90.3 61.6 73.0 43.6 51.7 91.4 109.4 106.0 105.8 104.7 121.7
2010 Q1 93.5 59.9 71.4 42.5 53.1 91.4 112.2 108.0 107.8 104.5 125.0
Percentage chang e , quar ter on corresponding quarter of previous year
2007 Q1 −0.1 −9.9 −8.1 −19.1 −13.6 −0.9 8.1 1.9 1.9 − −Q2 −0.9 −10.6 −9.1 −18.2 −17.4 2.1 4.3 0.5 0.5 − 6.2Q3 −2.2 −14.6 −11.1 −26.8 −23.4 2.7 4.8 −1.8 −1.9 − 6.2Q4 −2.7 −16.1 −13.2 −30.2 −23.7 1.7 1.2 −1.3 −1.4 −1.2 6.7
2008 Q1 −2.7 −18.2 −14.5 −26.2 −26.8 −0.9 3.6 −0.1 −0.2 − 11.8Q2 −2.6 −17.8 −11.2 −25.5 −24.6 −1.9 15.1 0.1 − − 3.6Q3 −2.7 −15.8 −9.8 −21.7 −20.2 −3.1 4.1 2.2 2.1 − 4.6Q4 −6.0 −17.2 −11.7 −23.6 −21.0 −6.3 −4.8 2.7 2.5 1.2 10.5
2009 Q1 −4.0 −17.0 −9.1 −24.1 −19.2 −11.6 3.2 2.6 2.6 − 2.2Q2 −2.4 −14.9 −4.4 −23.3 −12.6 −10.7 −8.6 3.8 3.8 − 12.3Q3 −2.1 −13.2 −4.6 −21.3 −11.6 −7.6 −0.4 4.1 4.1 4.7 12.5Q4 −1.0 −9.4 −3.7 −15.7 −9.9 −3.6 9.4 3.7 3.7 4.7 3.2
2010 Q1 0.5 −6.6 −4.2 −12.4 −2.7 3.6 1.0 4.9 4.8 4.5 9.4

97
09.DN Household final consumption expenditureRecreation and cultureImplied deflators - not seasonally adjustedcontinued 2006 = 100
Recreation and culture (continued)
Other recreational goods, gardens and pets Recreational and cultural services Newspapers, books & stationery
Equipme- Recreat- Station-nt for Gardens, Veter in- ional Newspap- Miscell- er y and
Games, spor t, plants Pets and ar y and and ers and aneous drawingtoys and camping and related other spor ting Cultural Games of periodi- printed materia- Package
Total hobbies etc flowers products ser vices Total services services chance Total Books cals matter ls holidays1
COICOP 09.3 09.3.1 09.3.2 09.3.3 09.3.4 09.3.5 09.4 09.4.1 09.4.2 09.4.3 09.5 09.5.1 09.5.2 09.5.3 09.5.4 09.6
UTOE AWOC AWOD AWOE AWOF AWOG UTOF AWOH AWOI AWOJ UTOG AWOK AWOL CJ72 AWON2005 101.4 103.6 100.6 99.9 97.1 96.0 95.4 95.1 95.0 96.3 96.5 95.3 93.9 99.7 100.02006 100.0 100.0 100.0 100.0 100.0 100.0 100.0 100.0 100.0 100.0 100.0 100.0 100.0 100.0 100.02007 100.4 99.1 101.7 101.2 101.9 104.6 104.4 104.9 104.3 104.1 102.4 104.6 103.6 99.7 99.42008 100.8 97.1 104.9 103.7 108.4 109.5 106.9 111.5 105.6 106.3 107.2 112.4 108.6 102.7 102.22009 103.4 99.1 108.2 106.0 116.6 112.2 109.7 115.7 108.2 108.7 111.6 113.3 113.5 109.3 108.6
Percentage chang e , year on previous year
2005 −1.0 −2.1 −3.5 −0.4 1.9 4.7 3.7 4.4 3.9 3.1 0.8 1.6 1.4 0.4 −1.32006 −1.4 −3.5 −0.6 0.1 3.0 4.2 4.8 5.2 5.3 3.8 3.6 4.9 6.5 0.3 −2007 0.4 −0.9 1.7 1.2 1.9 4.6 4.4 4.9 4.3 4.1 2.4 4.6 3.6 −0.3 −0.62008 0.4 −2.0 3.1 2.5 6.4 4.7 2.4 6.3 1.2 2.1 4.7 7.5 4.8 3.0 2.82009 2.6 2.1 3.1 2.2 7.6 2.5 2.6 3.8 2.5 2.3 4.1 0.8 4.5 6.4 6.3
Not seasonally adjusted
2007 Q1 100.5 99.7 100.5 102.0 100.5 103.1 101.7 102.5 101.4 101.6 101.2 101.2 102.4 100.0 99.7Q2 100.0 98.5 102.1 100.9 101.7 104.1 104.6 103.7 105.0 104.7 101.7 103.0 102.9 100.2 99.5Q3 99.9 98.3 101.9 100.4 101.2 105.1 104.8 105.8 104.6 104.5 103.0 107.4 103.7 99.3 99.2Q4 101.1 99.9 102.2 101.5 104.2 105.9 106.6 109.1 106.3 105.7 103.3 106.0 105.5 99.3 99.2
2008 Q1 100.9 97.8 101.1 103.7 105.4 107.9 105.9 109.2 105.0 105.1 106.3 113.3 107.1 101.2 101.0Q2 101.3 97.9 104.4 103.7 106.6 109.0 106.9 110.7 105.6 106.3 107.5 115.9 108.6 101.8 101.5Q3 101.0 96.7 106.6 103.2 110.2 110.1 107.5 112.4 106.2 107.0 108.0 114.5 108.9 103.0 102.7Q4 100.3 96.4 107.0 104.1 111.5 111.0 107.4 114.5 105.6 106.7 107.1 108.7 110.0 104.1 103.5
2009 Q1 102.0 97.5 103.3 104.8 114.6 111.7 107.1 114.4 104.9 106.1 110.9 116.8 112.8 105.8 105.6Q2 102.7 97.6 108.2 105.2 116.7 111.8 109.9 115.1 108.5 108.8 111.2 111.8 113.6 108.8 108.5Q3 104.3 99.8 110.6 106.6 116.9 112.3 110.3 116.1 108.8 109.4 112.5 116.0 114.2 108.8 108.8Q4 104.7 100.9 110.1 108.9 118.3 113.0 111.7 117.4 110.4 110.7 111.9 110.8 113.6 112.0 111.3
2010 Q1 106.0 100.3 108.5 112.2 119.7 115.8 112.5 117.2 111.1 111.7 115.2 116.0 115.7 114.6 114.2
Percentage chang e , quar ter on corresponding quarter of previous year
2007 Q1 −0.6 −2.7 2.2 0.9 2.0 4.5 4.8 4.5 5.0 5.1 2.4 2.6 4.7 1.0 −0.6Q2 −0.3 −2.1 2.1 1.2 1.4 4.9 4.3 4.1 4.5 4.3 2.1 4.6 3.4 −0.3 −0.7Q3 0.3 −0.5 1.0 0.7 0.6 4.5 4.1 5.2 3.9 3.6 2.6 6.8 3.0 −0.7 −0.5Q4 1.9 1.2 2.0 1.8 3.5 4.3 4.5 6.8 4.2 3.8 2.4 4.6 3.4 −0.9 −0.7
2008 Q1 0.4 −1.9 0.6 1.7 4.9 4.7 4.1 6.5 3.6 3.4 5.0 12.0 4.6 1.2 1.3Q2 1.3 −0.6 2.3 2.8 4.8 4.7 2.2 6.8 0.6 1.5 5.7 12.5 5.5 1.6 2.0Q3 1.1 −1.6 4.6 2.8 8.9 4.8 2.6 6.2 1.5 2.4 4.9 6.6 5.0 3.7 3.5Q4 −0.8 −3.5 4.7 2.6 7.0 4.8 0.8 4.9 −0.7 0.9 3.7 2.5 4.3 4.8 4.3
2009 Q1 1.1 −0.3 2.2 1.1 8.7 3.5 1.1 4.8 −0.1 1.0 4.3 3.1 5.3 4.5 4.6Q2 1.4 −0.3 3.6 1.4 9.5 2.6 2.8 4.0 2.7 2.4 3.4 −3.5 4.6 6.9 6.9Q3 3.3 3.2 3.8 3.3 6.1 2.0 2.6 3.3 2.4 2.2 4.2 1.3 4.9 5.6 5.9Q4 4.4 4.7 2.9 4.6 6.1 1.8 4.0 2.5 4.5 3.7 4.5 1.9 3.3 7.6 7.5
2010 Q1 3.9 2.9 5.0 7.1 4.5 3.7 5.0 2.4 5.9 5.3 3.9 −0.7 2.6 8.3 8.1
1 Package holidays data are dispersed between components (transpor t etc)

98
09.DS Household final consumption expenditureRecreation and cultureImplied deflators - seasonally adjusted 2006 = 100
Recreation and culture
Audio-visual, photo and infor mation processing Other major durables
Musicalinstr uments
Repairs of Major and major MaintenancePhotographic Infor mation audio visual durables for durables for of other
Audio visual and optical processing Recording etc outdoor indoor majorTotal Total equipment equipment equipment media equipment Total recreation recreation durables
COICOP 09 09.1 09.1.1 09.1.2 09.1.3 09.1.4 09.1.5 09.2 09.2.1 09.2.2 09.2.3
UTJW UTPV AWRM AWRN AWRO AWRP AWRQ UTPW AWRR AWRS AWRT2005 101.3 112.5 112.0 127.8 115.1 100.7 96.3 99.5 99.6 100.0 91.12006 100.0 100.0 100.0 100.0 100.0 100.0 100.0 100.0 100.0 100.0 100.02007 98.5 86.7 89.2 75.9 79.7 101.4 104.5 99.9 99.9 99.6 104.92008 94.9 71.6 78.7 56.8 61.5 97.7 108.0 101.1 100.9 100.0 113.02009 92.7 62.3 74.5 45.4 53.4 90.1 109.5 104.6 104.4 104.1 120.8
Percentage chang e , year on previous year
2005 −2.3 −12.9 −11.9 −19.3 −19.8 −2.7 7.5 1.1 1.1 − 4.12006 −1.3 −11.1 −10.7 −21.8 −13.1 −0.7 3.8 0.5 0.4 − 9.82007 −1.5 −13.3 −10.8 −24.1 −20.3 1.4 4.5 −0.1 −0.1 −0.4 4.92008 −3.7 −17.4 −11.8 −25.2 −22.8 −3.6 3.3 1.2 1.0 0.4 7.72009 −2.3 −13.0 −5.3 −20.1 −13.2 −7.8 1.4 3.5 3.5 4.1 6.9
Seasonally adjusted
2007 Q1 99.8 94.7 95.7 88.6 91.1 102.1 104.0 100.7 100.7 100.0 100.0Q2 98.8 89.0 90.1 80.1 82.8 102.2 104.2 100.6 100.5 100.0 106.2Q3 97.6 83.4 86.8 70.1 75.6 100.8 104.8 99.7 99.6 101.7 106.2Q4 97.7 80.9 85.2 66.9 72.1 100.4 105.3 98.7 98.8 94.3 106.7
2008 Q1 96.9 77.5 82.1 65.0 67.0 100.6 107.7 100.5 100.4 100.0 111.8Q2 95.5 73.3 79.6 59.2 62.5 99.6 109.1 100.5 100.4 100.0 109.5Q3 94.7 70.2 77.9 55.1 60.5 96.9 109.1 101.4 101.2 103.8 111.1Q4 92.7 66.8 75.5 51.7 57.0 94.5 106.7 101.7 101.6 97.1 118.5
2009 Q1 93.0 64.7 75.1 49.4 54.4 89.1 110.5 102.7 102.7 100.0 114.3Q2 92.8 62.9 75.8 45.4 54.7 89.8 109.1 104.4 104.1 105.7 122.2Q3 92.6 61.3 74.3 43.7 53.5 89.8 108.7 105.6 105.4 105.5 125.0Q4 92.4 60.5 72.9 43.8 51.5 91.9 110.0 105.8 105.6 105.1 122.7
2010 Q1 93.7 60.6 72.2 43.2 53.2 92.7 111.6 108.0 107.9 105.4 125.0
Percentage chang e , quar ter on previous quarter
2007 Q1 −0.2 −2.5 −2.9 −7.9 −3.5 3.1 − 0.1 0.1 − −Q2 −1.0 −6.0 −5.9 −9.6 −9.1 0.1 0.2 −0.1 −0.2 − 6.2Q3 −1.2 −6.3 −3.7 −12.5 −8.7 −1.4 0.6 −0.9 −0.9 1.7 −Q4 0.1 −3.0 −1.8 −4.6 −4.6 −0.4 0.5 −1.0 −0.8 −7.3 0.5
2008 Q1 −0.8 −4.2 −3.6 −2.8 −7.1 0.2 2.3 1.8 1.6 6.0 4.8Q2 −1.4 −5.4 −3.0 −8.9 −6.7 −1.0 1.3 − − − −2.1Q3 −0.8 −4.2 −2.1 −6.9 −3.2 −2.7 − 0.9 0.8 3.8 1.5Q4 −2.1 −4.8 −3.1 −6.2 −5.8 −2.5 −2.2 0.3 0.4 −6.5 6.7
2009 Q1 0.3 −3.1 −0.5 −4.4 −4.6 −5.7 3.6 1.0 1.1 3.0 −3.5Q2 −0.2 −2.8 0.9 −8.1 0.6 0.8 −1.3 1.7 1.4 5.7 6.9Q3 −0.2 −2.5 −2.0 −3.7 −2.2 − −0.4 1.1 1.2 −0.2 2.3Q4 −0.2 −1.3 −1.9 0.2 −3.7 2.3 1.2 0.2 0.2 −0.4 −1.8
2010 Q1 1.4 0.2 −1.0 −1.4 3.3 0.9 1.5 2.1 2.2 0.3 1.9
Percentage chang e , quar ter on corresponding quarter of previous year
2007 Q1 −0.6 −9.8 −7.9 −18.8 −14.1 −0.5 8.1 2.0 2.0 − −Q2 −1.0 −11.1 −9.4 −19.3 −17.9 2.3 4.2 0.8 0.7 − 6.2Q3 −2.2 −15.1 −11.7 −27.5 −23.9 2.4 4.8 −1.2 −1.4 1.7 6.2Q4 −2.3 −16.7 −13.6 −30.5 −23.6 1.4 1.3 −1.9 −1.8 −5.7 6.7
2008 Q1 −2.9 −18.2 −14.2 −26.6 −26.5 −1.5 3.6 −0.2 −0.3 − 11.8Q2 −3.3 −17.6 −11.7 −26.1 −24.5 −2.5 4.7 −0.1 −0.1 − 3.1Q3 −3.0 −15.8 −10.3 −21.4 −20.0 −3.9 4.1 1.7 1.6 2.1 4.6Q4 −5.1 −17.4 −11.4 −22.7 −20.9 −5.9 1.3 3.0 2.8 3.0 11.1
2009 Q1 −4.0 −16.5 −8.5 −24.0 −18.8 −11.4 2.6 2.2 2.3 − 2.2Q2 −2.8 −14.2 −4.8 −23.3 −12.5 −9.8 − 3.9 3.7 5.7 11.6Q3 −2.2 −12.7 −4.6 −20.7 −11.6 −7.3 −0.4 4.1 4.2 1.6 12.5Q4 −0.3 −9.4 −3.4 −15.3 −9.6 −2.8 3.1 4.0 3.9 8.2 3.5
2010 Q1 0.8 −6.3 −3.9 −12.6 −2.2 4.0 1.0 5.2 5.1 5.4 9.4
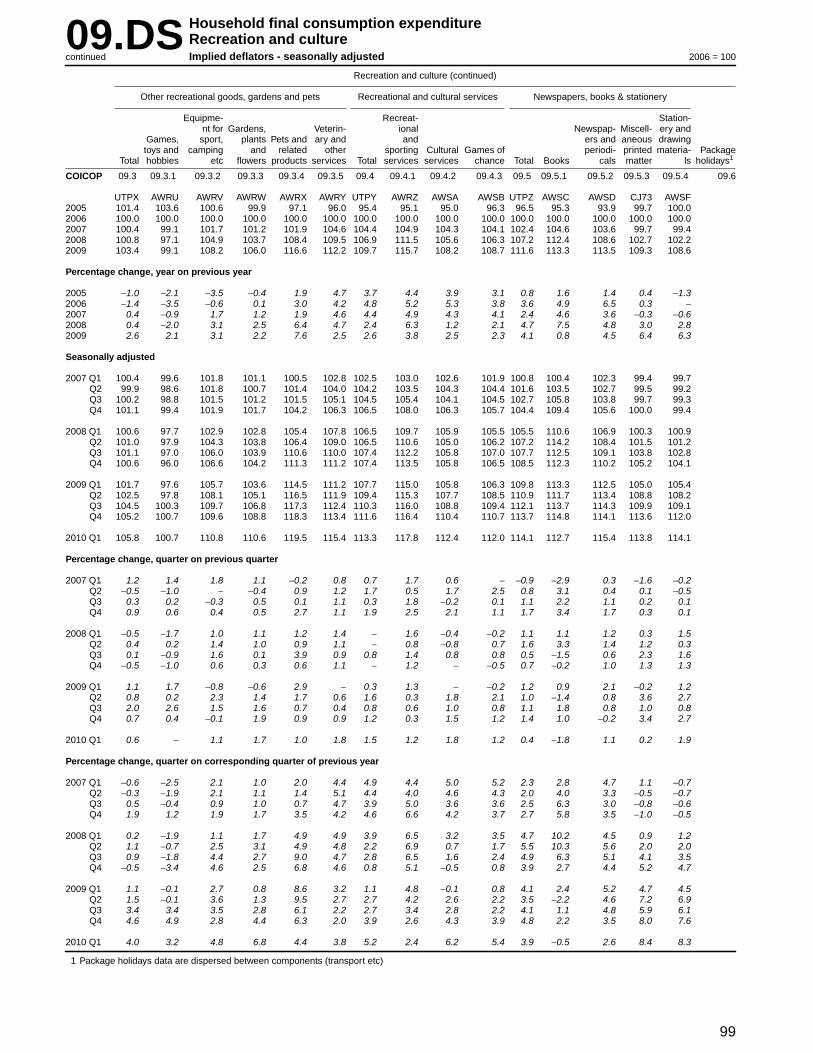
99
09.DS Household final consumption expenditureRecreation and cultureImplied deflators - seasonally adjustedcontinued 2006 = 100
Recreation and culture (continued)
Other recreational goods, gardens and pets Recreational and cultural services Newspapers, books & stationery
Equipme- Recreat- Station-nt for Gardens, Veter in- ional Newspap- Miscell- er y and
Games, spor t, plants Pets and ar y and and ers and aneous drawingtoys and camping and related other spor ting Cultural Games of periodi- printed materia- Package
Total hobbies etc flowers products ser vices Total services services chance Total Books cals matter ls holidays1
COICOP 09.3 09.3.1 09.3.2 09.3.3 09.3.4 09.3.5 09.4 09.4.1 09.4.2 09.4.3 09.5 09.5.1 09.5.2 09.5.3 09.5.4 09.6
UTPX AWRU AWRV AWRW AWRX AWRY UTPY AWRZ AWSA AWSB UTPZ AWSC AWSD CJ73 AWSF2005 101.4 103.6 100.6 99.9 97.1 96.0 95.4 95.1 95.0 96.3 96.5 95.3 93.9 99.7 100.02006 100.0 100.0 100.0 100.0 100.0 100.0 100.0 100.0 100.0 100.0 100.0 100.0 100.0 100.0 100.02007 100.4 99.1 101.7 101.2 101.9 104.6 104.4 104.9 104.3 104.1 102.4 104.6 103.6 99.7 99.42008 100.8 97.1 104.9 103.7 108.4 109.5 106.9 111.5 105.6 106.3 107.2 112.4 108.6 102.7 102.22009 103.4 99.1 108.2 106.0 116.6 112.2 109.7 115.7 108.2 108.7 111.6 113.3 113.5 109.3 108.6
Percentage chang e , year on previous year
2005 −1.0 −2.1 −3.5 −0.4 1.9 4.7 3.7 4.4 3.9 3.1 0.8 1.6 1.4 0.4 −1.32006 −1.4 −3.5 −0.6 0.1 3.0 4.2 4.8 5.2 5.3 3.8 3.6 4.9 6.5 0.3 −2007 0.4 −0.9 1.7 1.2 1.9 4.6 4.4 4.9 4.3 4.1 2.4 4.6 3.6 −0.3 −0.62008 0.4 −2.0 3.1 2.5 6.4 4.7 2.4 6.3 1.2 2.1 4.7 7.5 4.8 3.0 2.82009 2.6 2.1 3.1 2.2 7.6 2.5 2.6 3.8 2.5 2.3 4.1 0.8 4.5 6.4 6.3
Seasonally adjusted
2007 Q1 100.4 99.6 101.8 101.1 100.5 102.8 102.5 103.0 102.6 101.9 100.8 100.4 102.3 99.4 99.7Q2 99.9 98.6 101.8 100.7 101.4 104.0 104.2 103.5 104.3 104.4 101.6 103.5 102.7 99.5 99.2Q3 100.2 98.8 101.5 101.2 101.5 105.1 104.5 105.4 104.1 104.5 102.7 105.8 103.8 99.7 99.3Q4 101.1 99.4 101.9 101.7 104.2 106.3 106.5 108.0 106.3 105.7 104.4 109.4 105.6 100.0 99.4
2008 Q1 100.6 97.7 102.9 102.8 105.4 107.8 106.5 109.7 105.9 105.5 105.5 110.6 106.9 100.3 100.9Q2 101.0 97.9 104.3 103.8 106.4 109.0 106.5 110.6 105.0 106.2 107.2 114.2 108.4 101.5 101.2Q3 101.1 97.0 106.0 103.9 110.6 110.0 107.4 112.2 105.8 107.0 107.7 112.5 109.1 103.8 102.8Q4 100.6 96.0 106.6 104.2 111.3 111.2 107.4 113.5 105.8 106.5 108.5 112.3 110.2 105.2 104.1
2009 Q1 101.7 97.6 105.7 103.6 114.5 111.2 107.7 115.0 105.8 106.3 109.8 113.3 112.5 105.0 105.4Q2 102.5 97.8 108.1 105.1 116.5 111.9 109.4 115.3 107.7 108.5 110.9 111.7 113.4 108.8 108.2Q3 104.5 100.3 109.7 106.8 117.3 112.4 110.3 116.0 108.8 109.4 112.1 113.7 114.3 109.9 109.1Q4 105.2 100.7 109.6 108.8 118.3 113.4 111.6 116.4 110.4 110.7 113.7 114.8 114.1 113.6 112.0
2010 Q1 105.8 100.7 110.8 110.6 119.5 115.4 113.3 117.8 112.4 112.0 114.1 112.7 115.4 113.8 114.1
Percentage chang e , quar ter on previous quarter
2007 Q1 1.2 1.4 1.8 1.1 −0.2 0.8 0.7 1.7 0.6 − −0.9 −2.9 0.3 −1.6 −0.2Q2 −0.5 −1.0 − −0.4 0.9 1.2 1.7 0.5 1.7 2.5 0.8 3.1 0.4 0.1 −0.5Q3 0.3 0.2 −0.3 0.5 0.1 1.1 0.3 1.8 −0.2 0.1 1.1 2.2 1.1 0.2 0.1Q4 0.9 0.6 0.4 0.5 2.7 1.1 1.9 2.5 2.1 1.1 1.7 3.4 1.7 0.3 0.1
2008 Q1 −0.5 −1.7 1.0 1.1 1.2 1.4 − 1.6 −0.4 −0.2 1.1 1.1 1.2 0.3 1.5Q2 0.4 0.2 1.4 1.0 0.9 1.1 − 0.8 −0.8 0.7 1.6 3.3 1.4 1.2 0.3Q3 0.1 −0.9 1.6 0.1 3.9 0.9 0.8 1.4 0.8 0.8 0.5 −1.5 0.6 2.3 1.6Q4 −0.5 −1.0 0.6 0.3 0.6 1.1 − 1.2 − −0.5 0.7 −0.2 1.0 1.3 1.3
2009 Q1 1.1 1.7 −0.8 −0.6 2.9 − 0.3 1.3 − −0.2 1.2 0.9 2.1 −0.2 1.2Q2 0.8 0.2 2.3 1.4 1.7 0.6 1.6 0.3 1.8 2.1 1.0 −1.4 0.8 3.6 2.7Q3 2.0 2.6 1.5 1.6 0.7 0.4 0.8 0.6 1.0 0.8 1.1 1.8 0.8 1.0 0.8Q4 0.7 0.4 −0.1 1.9 0.9 0.9 1.2 0.3 1.5 1.2 1.4 1.0 −0.2 3.4 2.7
2010 Q1 0.6 − 1.1 1.7 1.0 1.8 1.5 1.2 1.8 1.2 0.4 −1.8 1.1 0.2 1.9
Percentage chang e , quar ter on corresponding quarter of previous year
2007 Q1 −0.6 −2.5 2.1 1.0 2.0 4.4 4.9 4.4 5.0 5.2 2.3 2.8 4.7 1.1 −0.7Q2 −0.3 −1.9 2.1 1.1 1.4 5.1 4.4 4.0 4.6 4.3 2.0 4.0 3.3 −0.5 −0.7Q3 0.5 −0.4 0.9 1.0 0.7 4.7 3.9 5.0 3.6 3.6 2.5 6.3 3.0 −0.8 −0.6Q4 1.9 1.2 1.9 1.7 3.5 4.2 4.6 6.6 4.2 3.7 2.7 5.8 3.5 −1.0 −0.5
2008 Q1 0.2 −1.9 1.1 1.7 4.9 4.9 3.9 6.5 3.2 3.5 4.7 10.2 4.5 0.9 1.2Q2 1.1 −0.7 2.5 3.1 4.9 4.8 2.2 6.9 0.7 1.7 5.5 10.3 5.6 2.0 2.0Q3 0.9 −1.8 4.4 2.7 9.0 4.7 2.8 6.5 1.6 2.4 4.9 6.3 5.1 4.1 3.5Q4 −0.5 −3.4 4.6 2.5 6.8 4.6 0.8 5.1 −0.5 0.8 3.9 2.7 4.4 5.2 4.7
2009 Q1 1.1 −0.1 2.7 0.8 8.6 3.2 1.1 4.8 −0.1 0.8 4.1 2.4 5.2 4.7 4.5Q2 1.5 −0.1 3.6 1.3 9.5 2.7 2.7 4.2 2.6 2.2 3.5 −2.2 4.6 7.2 6.9Q3 3.4 3.4 3.5 2.8 6.1 2.2 2.7 3.4 2.8 2.2 4.1 1.1 4.8 5.9 6.1Q4 4.6 4.9 2.8 4.4 6.3 2.0 3.9 2.6 4.3 3.9 4.8 2.2 3.5 8.0 7.6
2010 Q1 4.0 3.2 4.8 6.8 4.4 3.8 5.2 2.4 6.2 5.4 3.9 −0.5 2.6 8.4 8.3
1 Package holidays data are dispersed between components (transpor t etc)
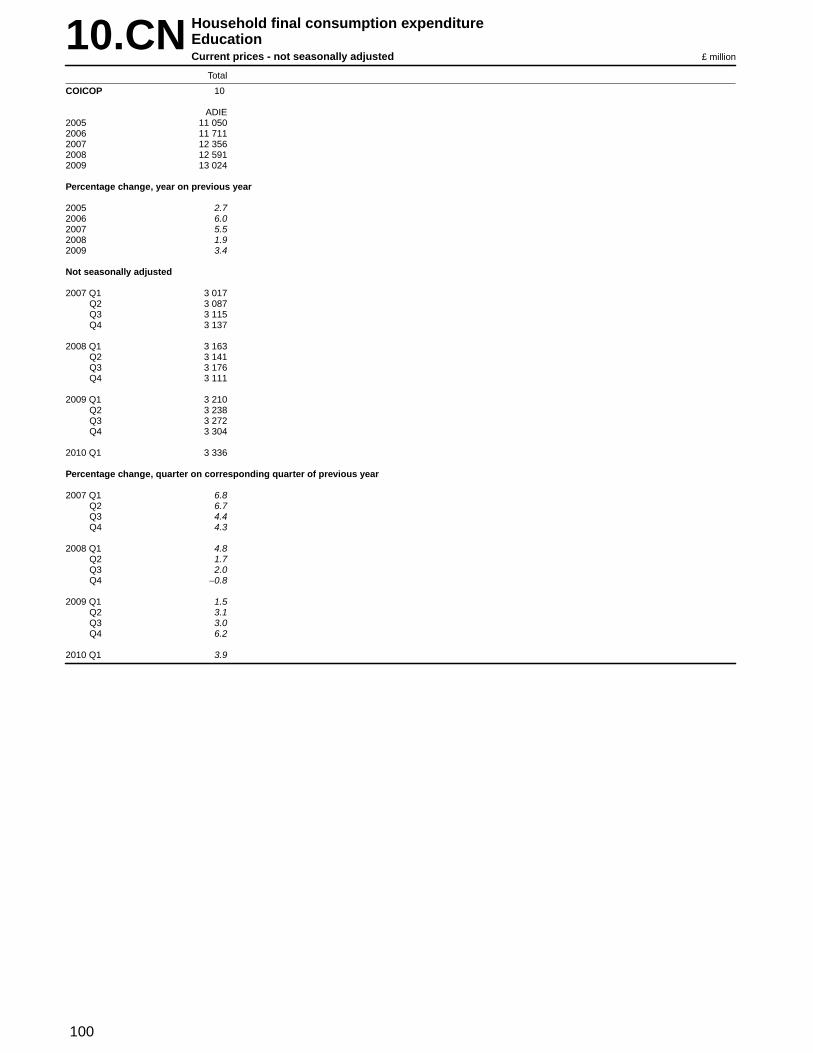
100
10.CN Household final consumption expenditureEducationCurrent prices - not seasonally adjusted £ million
Total
COICOP 10
ADIE2005 11 0502006 11 7112007 12 3562008 12 5912009 13 024
Percentage chang e , year on previous year
2005 2.72006 6.02007 5.52008 1.92009 3.4
Not seasonally adjusted
2007 Q1 3 017Q2 3 087Q3 3 115Q4 3 137
2008 Q1 3 163Q2 3 141Q3 3 176Q4 3 111
2009 Q1 3 210Q2 3 238Q3 3 272Q4 3 304
2010 Q1 3 336
Percentage chang e , quar ter on corresponding quarter of previous year
2007 Q1 6.8Q2 6.7Q3 4.4Q4 4.3
2008 Q1 4.8Q2 1.7Q3 2.0Q4 −0.8
2009 Q1 1.5Q2 3.1Q3 3.0Q4 6.2
2010 Q1 3.9
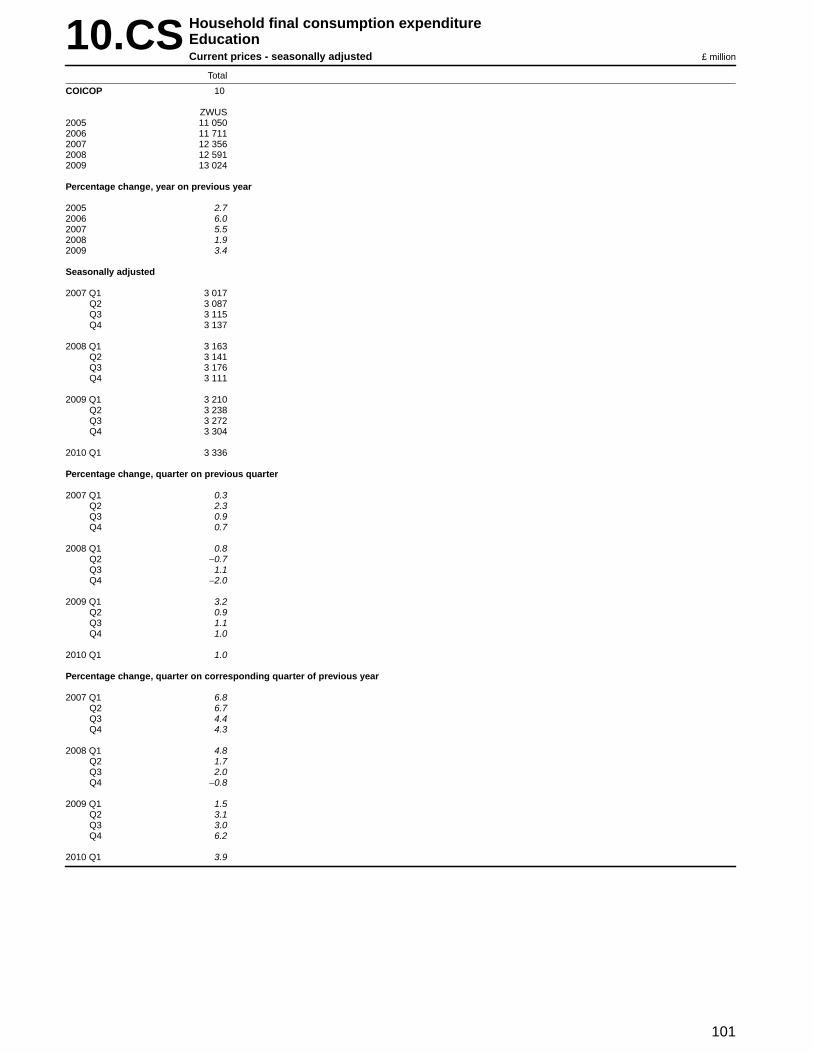
101
10.CS Household final consumption expenditureEducationCurrent prices - seasonally adjusted £ million
Total
COICOP 10
ZWUS2005 11 0502006 11 7112007 12 3562008 12 5912009 13 024
Percentage chang e , year on previous year
2005 2.72006 6.02007 5.52008 1.92009 3.4
Seasonally adjusted
2007 Q1 3 017Q2 3 087Q3 3 115Q4 3 137
2008 Q1 3 163Q2 3 141Q3 3 176Q4 3 111
2009 Q1 3 210Q2 3 238Q3 3 272Q4 3 304
2010 Q1 3 336
Percentage chang e , quar ter on previous quarter
2007 Q1 0.3Q2 2.3Q3 0.9Q4 0.7
2008 Q1 0.8Q2 −0.7Q3 1.1Q4 −2.0
2009 Q1 3.2Q2 0.9Q3 1.1Q4 1.0
2010 Q1 1.0
Percentage chang e , quar ter on corresponding quarter of previous year
2007 Q1 6.8Q2 6.7Q3 4.4Q4 4.3
2008 Q1 4.8Q2 1.7Q3 2.0Q4 −0.8
2009 Q1 1.5Q2 3.1Q3 3.0Q4 6.2
2010 Q1 3.9

102
10.KN Household final consumption expenditureEducationChained volume measures, reference year 2006 - not seasonally adjusted £ million
Total
COICOP 10
ADMJ2005 11 6702006 11 7112007 11 5022008 10 9712009 10 716
Percentage chang e , year on previous year
2005 −2.12006 0.42007 −1.82008 −4.62009 −2.3
Not seasonally adjusted
2007 Q1 2 869Q2 2 935Q3 2 919Q4 2 779
2008 Q1 2 801Q2 2 777Q3 2 787Q4 2 606
2009 Q1 2 686Q2 2 709Q3 2 709Q4 2 612
2010 Q1 2 646
Percentage chang e , quar ter on corresponding quarter of previous year
2007 Q1 −0.7Q2 −0.8Q3 −3.0Q4 −2.7
2008 Q1 −2.4Q2 −5.4Q3 −4.5Q4 −6.2
2009 Q1 −4.1Q2 −2.4Q3 −2.8Q4 0.2
2010 Q1 −1.5

103
10.KS Household final consumption expenditureEducationChained volume measures, reference year 2006 - seasonally adjusted £ million
Total
COICOP 10
ZWUT2005 11 6702006 11 7112007 11 5022008 10 9712009 10 716
Percentage chang e , year on previous year
2005 −2.12006 0.42007 −1.82008 −4.62009 −2.3
Seasonally adjusted
2007 Q1 2 869Q2 2 935Q3 2 919Q4 2 779
2008 Q1 2 802Q2 2 777Q3 2 787Q4 2 605
2009 Q1 2 686Q2 2 709Q3 2 709Q4 2 612
2010 Q1 2 646
Percentage chang e , quar ter on previous quarter
2007 Q1 0.5Q2 2.3Q3 −0.5Q4 −4.8
2008 Q1 0.8Q2 −0.9Q3 0.4Q4 −6.5
2009 Q1 3.1Q2 0.9Q3 −Q4 −3.6
2010 Q1 1.3
Percentage chang e , quar ter on corresponding quarter of previous year
2007 Q1 −0.7Q2 −0.8Q3 −3.0Q4 −2.7
2008 Q1 −2.3Q2 −5.4Q3 −4.5Q4 −6.3
2009 Q1 −4.1Q2 −2.4Q3 −2.8Q4 0.3
2010 Q1 −1.5
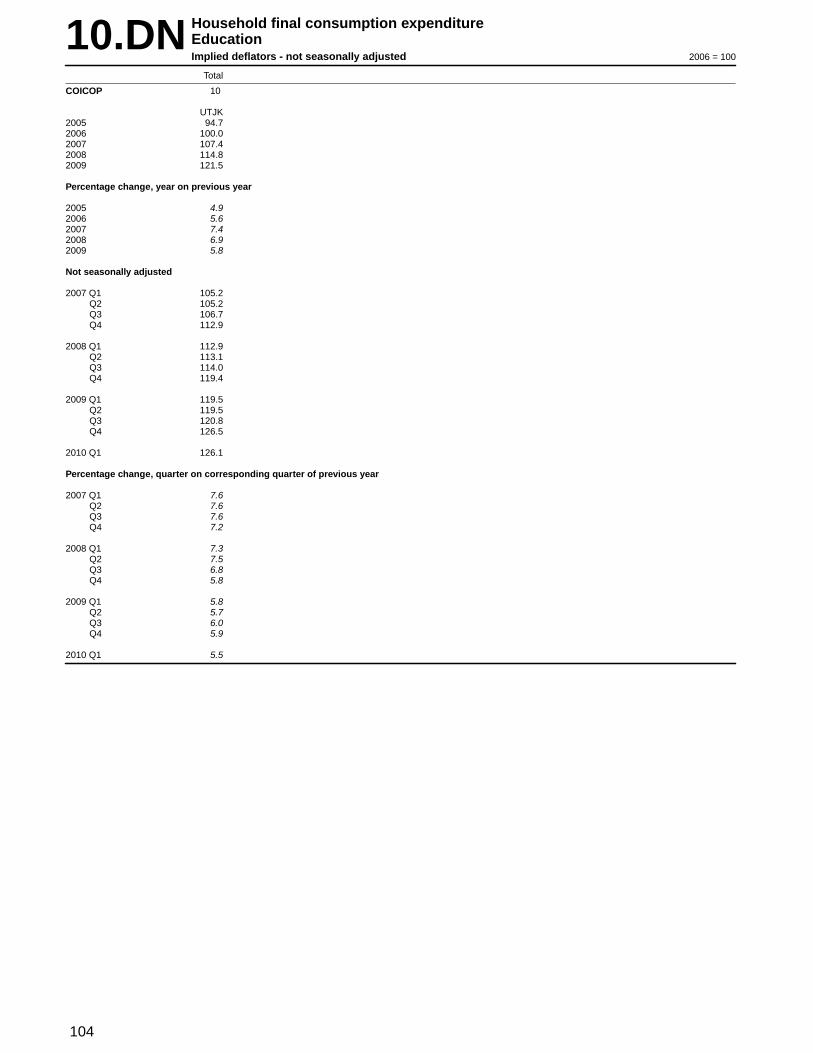
104
10.DN Household final consumption expenditureEducationImplied deflators - not seasonally adjusted 2006 = 100
Total
COICOP 10
UTJK2005 94.72006 100.02007 107.42008 114.82009 121.5
Percentage chang e , year on previous year
2005 4.92006 5.62007 7.42008 6.92009 5.8
Not seasonally adjusted
2007 Q1 105.2Q2 105.2Q3 106.7Q4 112.9
2008 Q1 112.9Q2 113.1Q3 114.0Q4 119.4
2009 Q1 119.5Q2 119.5Q3 120.8Q4 126.5
2010 Q1 126.1
Percentage chang e , quar ter on corresponding quarter of previous year
2007 Q1 7.6Q2 7.6Q3 7.6Q4 7.2
2008 Q1 7.3Q2 7.5Q3 6.8Q4 5.8
2009 Q1 5.8Q2 5.7Q3 6.0Q4 5.9
2010 Q1 5.5
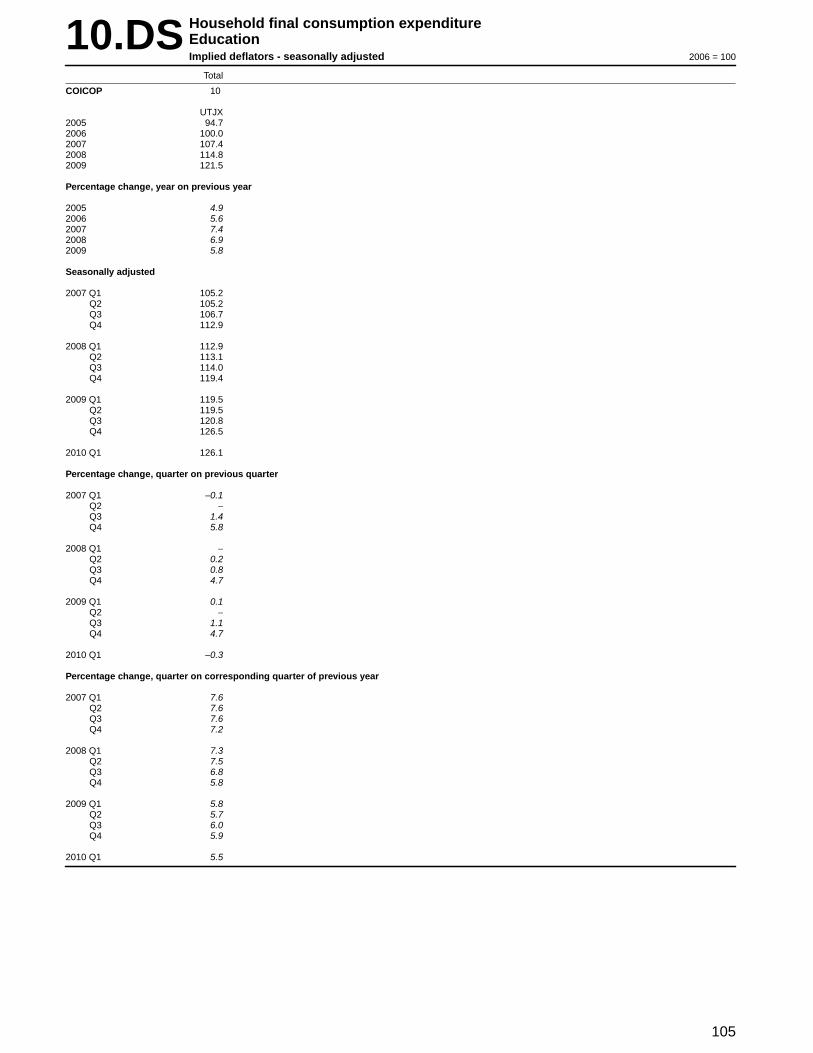
105
10.DS Household final consumption expenditureEducationImplied deflators - seasonally adjusted 2006 = 100
Total
COICOP 10
UTJX2005 94.72006 100.02007 107.42008 114.82009 121.5
Percentage chang e , year on previous year
2005 4.92006 5.62007 7.42008 6.92009 5.8
Seasonally adjusted
2007 Q1 105.2Q2 105.2Q3 106.7Q4 112.9
2008 Q1 112.9Q2 113.1Q3 114.0Q4 119.4
2009 Q1 119.5Q2 119.5Q3 120.8Q4 126.5
2010 Q1 126.1
Percentage chang e , quar ter on previous quarter
2007 Q1 −0.1Q2 −Q3 1.4Q4 5.8
2008 Q1 −Q2 0.2Q3 0.8Q4 4.7
2009 Q1 0.1Q2 −Q3 1.1Q4 4.7
2010 Q1 −0.3
Percentage chang e , quar ter on corresponding quarter of previous year
2007 Q1 7.6Q2 7.6Q3 7.6Q4 7.2
2008 Q1 7.3Q2 7.5Q3 6.8Q4 5.8
2009 Q1 5.8Q2 5.7Q3 6.0Q4 5.9
2010 Q1 5.5

106
11.CN Household final consumption expenditureRestaurants and hotelsCurrent prices - not seasonally adjusted £ million
Restaurants and hotels
Cater ing ser vices
Total Total Restaurants, cafes etc Canteens Accommodation ser vices
COICOP 11 11.1 11.1.1 11.1.2 11.2
ADIF ADIG ADXO ADXP ADIH2005 85 473 74 642 66 595 8 047 10 8312006 87 812 76 072 68 074 7 998 11 7402007 90 729 78 121 70 170 7 951 12 6082008 91 933 78 798 70 785 8 013 13 1352009 88 563 75 841 68 102 7 739 12 722
Percentage chang e , year on previous year
2005 3.1 2.7 3.1 −0.4 6.02006 2.7 1.9 2.2 −0.6 8.42007 3.3 2.7 3.1 −0.6 7.42008 1.3 0.9 0.9 0.8 4.22009 −3.7 −3.8 −3.8 −3.4 −3.1
Not seasonally adjusted
2007 Q1 19 903 17 728 15 609 2 119 2 175Q2 23 201 20 016 17 984 2 032 3 185Q3 24 472 20 032 18 368 1 664 4 440Q4 23 153 20 345 18 209 2 136 2 808
2008 Q1 20 407 18 110 16 156 1 954 2 297Q2 23 464 20 238 18 163 2 075 3 226Q3 25 043 20 411 18 617 1 794 4 632Q4 23 019 20 039 17 849 2 190 2 980
2009 Q1 19 674 17 433 15 517 1 916 2 241Q2 22 278 19 148 17 241 1 907 3 130Q3 24 029 19 606 17 862 1 744 4 423Q4 22 582 19 654 17 482 2 172 2 928
2010 Q1 19 681 17 548 15 627 1 921 2 133
Percentage chang e , quar ter on corresponding quarter of previous year
2007 Q1 4.9 4.0 4.5 0.1 12.7Q2 4.7 3.7 4.0 1.3 11.1Q3 1.7 0.9 1.4 −4.3 5.9Q4 2.4 2.4 2.7 −0.1 2.2
2008 Q1 2.5 2.2 3.5 −7.8 5.6Q2 1.1 1.1 1.0 2.1 1.3Q3 2.3 1.9 1.4 7.8 4.3Q4 −0.6 −1.5 −2.0 2.5 6.1
2009 Q1 −3.6 −3.7 −4.0 −1.9 −2.4Q2 −5.1 −5.4 −5.1 −8.1 −3.0Q3 −4.0 −3.9 −4.1 −2.8 −4.5Q4 −1.9 −1.9 −2.1 −0.8 −1.7
2010 Q1 − 0.7 0.7 0.3 −4.8

107
11.CS Household final consumption expenditureRestaurants and hotelsCurrent prices - seasonally adjusted £ million
Restaurants and hotels
Cater ing ser vices
Total Total Restaurants, cafes etc Canteens Accommodation ser vices
COICOP 11 11.1 11.1.1 11.1.2 11.2
ZAXR ZAXT ZAXV ZAYB ZAYD2005 85 473 74 642 66 595 8 047 10 8312006 87 812 76 072 68 074 7 998 11 7402007 90 729 78 121 70 170 7 951 12 6082008 91 933 78 798 70 785 8 013 13 1352009 88 563 75 841 68 102 7 739 12 722
Percentage chang e , year on previous year
2005 3.1 2.7 3.1 −0.4 6.02006 2.7 1.9 2.2 −0.6 8.42007 3.3 2.7 3.1 −0.6 7.42008 1.3 0.9 0.9 0.8 4.22009 −3.7 −3.8 −3.8 −3.4 −3.1
Seasonally adjusted
2007 Q1 22 508 19 343 17 278 2 065 3 165Q2 22 888 19 640 17 615 2 025 3 248Q3 22 559 19 407 17 512 1 895 3 152Q4 22 774 19 731 17 765 1 966 3 043
2008 Q1 23 096 19 761 17 843 1 918 3 335Q2 23 159 19 874 17 805 2 069 3 285Q3 22 954 19 699 17 671 2 028 3 255Q4 22 724 19 464 17 466 1 998 3 260
2009 Q1 22 298 19 026 17 131 1 895 3 272Q2 21 982 18 834 16 928 1 906 3 148Q3 22 018 18 889 16 927 1 962 3 129Q4 22 265 19 092 17 116 1 976 3 173
2010 Q1 22 330 19 191 17 277 1 914 3 139
Percentage chang e , quar ter on previous quarter
2007 Q1 1.2 0.4 − 4.1 6.1Q2 1.7 1.5 2.0 −1.9 2.6Q3 −1.4 −1.2 −0.6 −6.4 −3.0Q4 1.0 1.7 1.4 3.7 −3.5
2008 Q1 1.4 0.2 0.4 −2.4 9.6Q2 0.3 0.6 −0.2 7.9 −1.5Q3 −0.9 −0.9 −0.8 −2.0 −0.9Q4 −1.0 −1.2 −1.2 −1.5 0.2
2009 Q1 −1.9 −2.3 −1.9 −5.2 0.4Q2 −1.4 −1.0 −1.2 0.6 −3.8Q3 0.2 0.3 − 2.9 −0.6Q4 1.1 1.1 1.1 0.7 1.4
2010 Q1 0.3 0.5 0.9 −3.1 −1.1
Percentage chang e , quar ter on corresponding quarter of previous year
2007 Q1 5.3 4.0 4.4 0.7 14.0Q2 4.7 3.9 4.1 1.9 10.1Q3 1.0 0.5 1.1 −4.1 4.0Q4 2.4 2.4 2.8 −0.9 2.0
2008 Q1 2.6 2.2 3.3 −7.1 5.4Q2 1.2 1.2 1.1 2.2 1.1Q3 1.8 1.5 0.9 7.0 3.3Q4 −0.2 −1.4 −1.7 1.6 7.1
2009 Q1 −3.5 −3.7 −4.0 −1.2 −1.9Q2 −5.1 −5.2 −4.9 −7.9 −4.2Q3 −4.1 −4.1 −4.2 −3.3 −3.9Q4 −2.0 −1.9 −2.0 −1.1 −2.7
2010 Q1 0.1 0.9 0.9 1.0 −4.1

108
11.KN Household final consumption expenditureRestaurants and hotelsChained volume measures, reference year 2006 - not seasonally adjusted £ million
Restaurants and hotels
Cater ing ser vices
Total Total Restaurants, cafes etc Canteens Accommodation ser vices
COICOP 11 11.1 11.1.1 11.1.2 11.2
ADMK ADML ADSR ADYF ADMM2005 88 686 77 312 69 049 8 262 11 3682006 87 812 76 072 68 074 7 998 11 7402007 87 577 75 399 67 788 7 611 12 1782008 85 249 72 864 65 500 7 364 12 3852009 80 174 68 147 61 124 7 023 12 027
Percentage chang e , year on previous year
2005 −0.5 −0.7 −0.3 −3.7 0.72006 −1.0 −1.6 −1.4 −3.2 3.32007 −0.3 −0.9 −0.4 −4.8 3.72008 −2.7 −3.4 −3.4 −3.2 1.72009 −6.0 −6.5 −6.7 −4.6 −2.9
Not seasonally adjusted
2007 Q1 19 504 17 366 15 303 2 063 2 138Q2 22 479 19 391 17 437 1 954 3 088Q3 23 533 19 267 17 684 1 583 4 266Q4 22 061 19 375 17 364 2 011 2 686
2008 Q1 19 247 17 047 15 228 1 819 2 200Q2 21 812 18 757 16 845 1 912 3 055Q3 23 093 18 754 17 114 1 640 4 339Q4 21 097 18 306 16 313 1 993 2 791
2009 Q1 17 975 15 855 14 103 1 752 2 120Q2 20 178 17 227 15 489 1 738 2 951Q3 21 725 17 552 15 972 1 580 4 173Q4 20 296 17 513 15 560 1 953 2 783
2010 Q1 17 511 15 474 13 756 1 718 2 037
Percentage chang e , quar ter on corresponding quarter of previous year
2007 Q1 1.2 0.4 0.9 −3.4 9.2Q2 1.1 0.2 0.5 −2.9 7.0Q3 −1.7 −2.6 −2.0 −9.0 2.2Q4 −1.3 −1.3 −0.9 −4.7 −1.3
2008 Q1 −1.3 −1.8 −0.5 −11.8 2.9Q2 −3.0 −3.3 −3.4 −2.1 −1.1Q3 −1.9 −2.7 −3.2 3.6 1.7Q4 −4.4 −5.5 −6.1 −0.9 3.9
2009 Q1 −6.6 −7.0 −7.4 −3.7 −3.6Q2 −7.5 −8.2 −8.0 −9.1 −3.4Q3 −5.9 −6.4 −6.7 −3.7 −3.8Q4 −3.8 −4.3 −4.6 −2.0 −0.3
2010 Q1 −2.6 −2.4 −2.5 −1.9 −3.9

109
11.KS Household final consumption expenditureRestaurants and hotelsChained volume measures, reference year 2006 - seasonally adjusted £ million
Restaurants and hotels
Cater ing ser vices
Total Total Restaurants, cafes etc Canteens Accommodation ser vices
COICOP 11 11.1 11.1.1 11.1.2 11.2
ZAXS ZAXU ZAXW ZAYC ZAYE2005 88 686 77 312 69 049 8 262 11 3682006 87 812 76 072 68 074 7 998 11 7402007 87 577 75 399 67 788 7 611 12 1782008 85 249 72 864 65 500 7 364 12 3852009 80 174 68 147 61 124 7 023 12 027
Percentage chang e , year on previous year
2005 −0.5 −0.7 −0.3 −3.7 0.72006 −1.0 −1.6 −1.4 −3.2 3.32007 −0.3 −0.9 −0.4 −4.8 3.72008 −2.7 −3.4 −3.4 −3.2 1.72009 −6.0 −6.5 −6.7 −4.6 −2.9
Seasonally adjusted
2007 Q1 22 024 18 937 16 926 2 011 3 087Q2 22 217 19 070 17 123 1 947 3 147Q3 21 684 18 656 16 856 1 800 3 028Q4 21 652 18 736 16 883 1 853 2 916
2008 Q1 21 765 18 591 16 805 1 786 3 174Q2 21 543 18 441 16 537 1 904 3 102Q3 21 156 18 101 16 248 1 853 3 055Q4 20 785 17 731 15 910 1 821 3 054
2009 Q1 20 367 17 287 15 555 1 732 3 080Q2 19 927 16 961 15 227 1 734 2 966Q3 19 866 16 905 15 128 1 777 2 961Q4 20 014 16 994 15 214 1 780 3 020
2010 Q1 19 877 16 893 15 182 1 711 2 984
Percentage chang e , quar ter on previous quarter
2007 Q1 0.4 −0.2 −0.6 2.6 4.5Q2 0.9 0.7 1.2 −3.2 1.9Q3 −2.4 −2.2 −1.6 −7.6 −3.8Q4 −0.1 0.4 0.2 2.9 −3.7
2008 Q1 0.5 −0.8 −0.5 −3.6 8.8Q2 −1.0 −0.8 −1.6 6.6 −2.3Q3 −1.8 −1.8 −1.7 −2.7 −1.5Q4 −1.8 −2.0 −2.1 −1.7 −
2009 Q1 −2.0 −2.5 −2.2 −4.9 0.9Q2 −2.2 −1.9 −2.1 0.1 −3.7Q3 −0.3 −0.3 −0.7 2.5 −0.2Q4 0.7 0.5 0.6 0.2 2.0
2010 Q1 −0.7 −0.6 −0.2 −3.9 −1.2
Percentage chang e , quar ter on corresponding quarter of previous year
2007 Q1 1.7 0.4 0.8 −2.8 10.3Q2 1.0 0.2 0.5 −2.5 6.0Q3 −2.4 −2.8 −2.2 −8.8 0.3Q4 −1.3 −1.3 −0.8 −5.5 −1.3
2008 Q1 −1.2 −1.8 −0.7 −11.2 2.8Q2 −3.0 −3.3 −3.4 −2.2 −1.4Q3 −2.4 −3.0 −3.6 2.9 0.9Q4 −4.0 −5.4 −5.8 −1.7 4.7
2009 Q1 −6.4 −7.0 −7.4 −3.0 −3.0Q2 −7.5 −8.0 −7.9 −8.9 −4.4Q3 −6.1 −6.6 −6.9 −4.1 −3.1Q4 −3.7 −4.2 −4.4 −2.3 −1.1
2010 Q1 −2.4 −2.3 −2.4 −1.2 −3.1
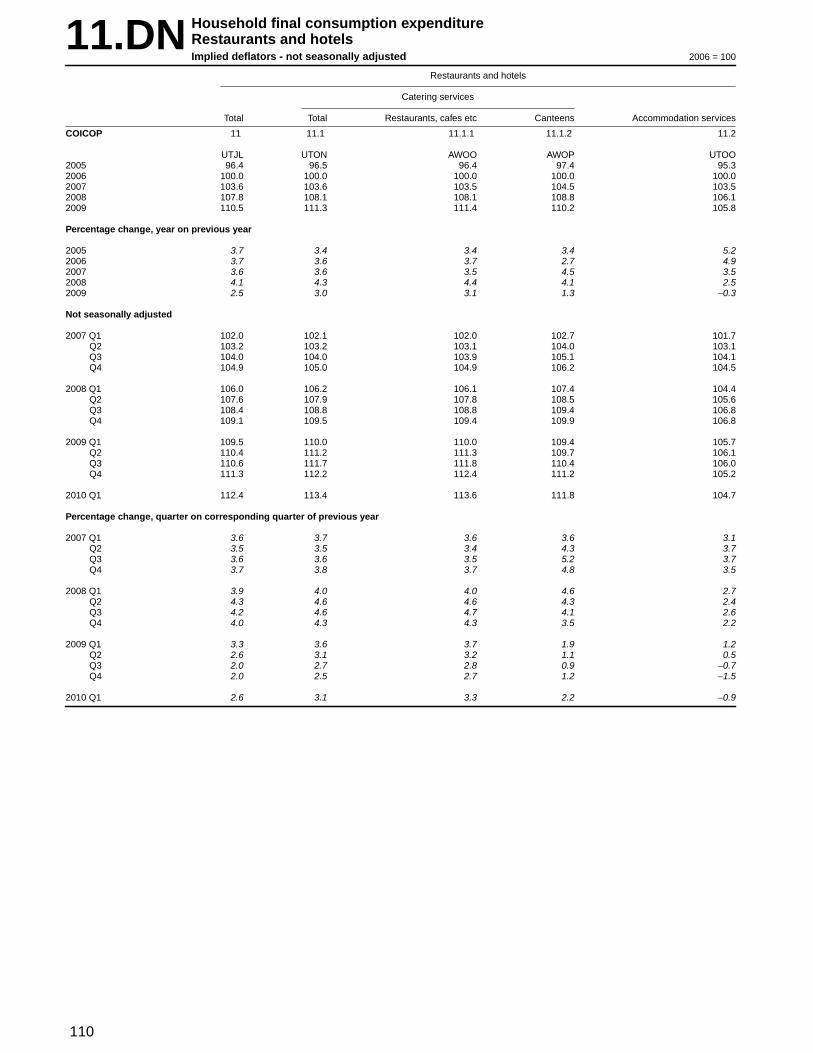
110
11.DN Household final consumption expenditureRestaurants and hotelsImplied deflators - not seasonally adjusted 2006 = 100
Restaurants and hotels
Cater ing ser vices
Total Total Restaurants, cafes etc Canteens Accommodation ser vices
COICOP 11 11.1 11.1.1 11.1.2 11.2
UTJL UTON AWOO AWOP UTOO2005 96.4 96.5 96.4 97.4 95.32006 100.0 100.0 100.0 100.0 100.02007 103.6 103.6 103.5 104.5 103.52008 107.8 108.1 108.1 108.8 106.12009 110.5 111.3 111.4 110.2 105.8
Percentage chang e , year on previous year
2005 3.7 3.4 3.4 3.4 5.22006 3.7 3.6 3.7 2.7 4.92007 3.6 3.6 3.5 4.5 3.52008 4.1 4.3 4.4 4.1 2.52009 2.5 3.0 3.1 1.3 −0.3
Not seasonally adjusted
2007 Q1 102.0 102.1 102.0 102.7 101.7Q2 103.2 103.2 103.1 104.0 103.1Q3 104.0 104.0 103.9 105.1 104.1Q4 104.9 105.0 104.9 106.2 104.5
2008 Q1 106.0 106.2 106.1 107.4 104.4Q2 107.6 107.9 107.8 108.5 105.6Q3 108.4 108.8 108.8 109.4 106.8Q4 109.1 109.5 109.4 109.9 106.8
2009 Q1 109.5 110.0 110.0 109.4 105.7Q2 110.4 111.2 111.3 109.7 106.1Q3 110.6 111.7 111.8 110.4 106.0Q4 111.3 112.2 112.4 111.2 105.2
2010 Q1 112.4 113.4 113.6 111.8 104.7
Percentage chang e , quar ter on corresponding quarter of previous year
2007 Q1 3.6 3.7 3.6 3.6 3.1Q2 3.5 3.5 3.4 4.3 3.7Q3 3.6 3.6 3.5 5.2 3.7Q4 3.7 3.8 3.7 4.8 3.5
2008 Q1 3.9 4.0 4.0 4.6 2.7Q2 4.3 4.6 4.6 4.3 2.4Q3 4.2 4.6 4.7 4.1 2.6Q4 4.0 4.3 4.3 3.5 2.2
2009 Q1 3.3 3.6 3.7 1.9 1.2Q2 2.6 3.1 3.2 1.1 0.5Q3 2.0 2.7 2.8 0.9 −0.7Q4 2.0 2.5 2.7 1.2 −1.5
2010 Q1 2.6 3.1 3.3 2.2 −0.9

111
11.DS Household final consumption expenditureRestaurants and hotelsImplied deflators - seasonally adjusted 2006 = 100
Restaurants and hotels
Cater ing ser vices
Total Total Restaurants, cafes etc Canteens Accommodation ser vices
COICOP 11 11.1 11.1.1 11.1.2 11.2
UTJY UTQG AWSG AWSH UTQH2005 96.4 96.5 96.4 97.4 95.32006 100.0 100.0 100.0 100.0 100.02007 103.6 103.6 103.5 104.5 103.52008 107.8 108.1 108.1 108.8 106.12009 110.5 111.3 111.4 110.2 105.8
Percentage chang e , year on previous year
2005 3.7 3.4 3.4 3.4 5.22006 3.7 3.6 3.7 2.7 4.92007 3.6 3.6 3.5 4.5 3.52008 4.1 4.3 4.4 4.1 2.52009 2.5 3.0 3.1 1.3 −0.3
Seasonally adjusted
2007 Q1 102.2 102.1 102.1 102.7 102.5Q2 103.0 103.0 102.9 104.0 103.2Q3 104.0 104.0 103.9 105.3 104.1Q4 105.2 105.3 105.2 106.1 104.4
2008 Q1 106.1 106.3 106.2 107.4 105.1Q2 107.5 107.8 107.7 108.7 105.9Q3 108.5 108.8 108.8 109.4 106.5Q4 109.3 109.8 109.8 109.7 106.7
2009 Q1 109.5 110.1 110.1 109.4 106.2Q2 110.3 111.0 111.2 109.9 106.1Q3 110.8 111.7 111.9 110.4 105.7Q4 111.2 112.3 112.5 111.0 105.1
2010 Q1 112.3 113.6 113.8 111.9 105.2
Percentage chang e , quar ter on previous quarter
2007 Q1 0.8 0.6 0.6 1.5 1.6Q2 0.8 0.9 0.8 1.3 0.7Q3 1.0 1.0 1.0 1.3 0.9Q4 1.2 1.3 1.3 0.8 0.3
2008 Q1 0.9 0.9 1.0 1.2 0.7Q2 1.3 1.4 1.4 1.2 0.8Q3 0.9 0.9 1.0 0.6 0.6Q4 0.7 0.9 0.9 0.3 0.2
2009 Q1 0.2 0.3 0.3 −0.3 −0.5Q2 0.7 0.8 1.0 0.5 −0.1Q3 0.5 0.6 0.6 0.5 −0.4Q4 0.4 0.5 0.5 0.5 −0.6
2010 Q1 1.0 1.2 1.2 0.8 0.1
Percentage chang e , quar ter on corresponding quarter of previous year
2007 Q1 3.5 3.5 3.5 3.5 3.3Q2 3.6 3.6 3.6 4.4 3.8Q3 3.5 3.5 3.3 5.2 3.7Q4 3.7 3.7 3.6 4.8 3.5
2008 Q1 3.8 4.1 4.0 4.6 2.5Q2 4.4 4.7 4.7 4.5 2.6Q3 4.3 4.6 4.7 3.9 2.3Q4 3.9 4.3 4.4 3.4 2.2
2009 Q1 3.2 3.6 3.7 1.9 1.0Q2 2.6 3.0 3.2 1.1 0.2Q3 2.1 2.7 2.8 0.9 −0.8Q4 1.7 2.3 2.5 1.2 −1.5
2010 Q1 2.6 3.2 3.4 2.3 −0.9

112
12.CN Household final consumption expenditureMiscellaneous goods and servicesCurrent prices - not seasonally adjusted £ million
Miscellaneous goods and services
Personal care Personal effects
Hairdressingsalons and
personal Electric Other products Jeweller y,grooming appliances for for personal clocks and Other personal Social
Total Total establishments personal care care Total watches effects protection
COICOP 12 12.1 12.1.1 12.1.2 12.1.3 12.3 12.3.1 12.3.2 12.4
ADII ADIJ CDEV ADXR ADXS ADIK ADXU ADXV ADIL2005 105 913 19 392 4 870 1 256 13 266 6 656 4 622 2 034 9 1312006 112 718 20 330 5 065 1 028 14 237 7 495 5 096 2 399 9 9622007 118 266 21 352 5 273 1 007 15 072 7 060 4 693 2 367 10 8682008 118 235 21 804 5 500 894 15 410 6 693 4 433 2 260 11 3912009 104 621 20 840 5 370 1 090 14 380 7 595 5 300 2 295 10 883
Percentage chang e , year on previous year
2005 7.4 1.6 3.2 −10.2 2.3 −2.7 −4.0 0.5 3.72006 6.4 4.8 4.0 −18.2 7.3 12.6 10.3 17.9 9.12007 4.9 5.0 4.1 −2.0 5.9 −5.8 −7.9 −1.3 9.12008 − 2.1 4.3 −11.2 2.2 −5.2 −5.5 −4.5 4.82009 −11.5 −4.4 −2.4 21.9 −6.7 13.5 19.6 1.5 −4.5
Not seasonally adjusted
2007 Q1 28 184 4 602 1 282 220 3 100 1 500 1 029 471 2 752Q2 28 637 4 881 1 303 193 3 385 1 771 1 197 574 2 730Q3 29 186 5 034 1 337 202 3 495 1 655 1 074 581 2 659Q4 32 259 6 835 1 351 392 5 092 2 134 1 393 741 2 727
2008 Q1 29 630 4 900 1 414 111 3 375 1 486 989 497 3 239Q2 29 615 5 197 1 394 164 3 639 1 656 1 099 557 2 955Q3 28 976 5 053 1 374 156 3 523 1 581 1 033 548 2 644Q4 30 014 6 654 1 318 463 4 873 1 970 1 312 658 2 553
2009 Q1 25 728 4 713 1 364 146 3 203 1 529 1 051 478 2 797Q2 24 458 4 935 1 380 224 3 331 1 775 1 222 553 2 710Q3 25 452 4 816 1 333 254 3 229 1 749 1 198 551 2 622Q4 28 983 6 376 1 293 466 4 617 2 542 1 829 713 2 754
2010 Q1 25 724 4 773 1 339 157 3 277 1 753 1 231 522 3 092
Percentage chang e , quar ter on corresponding quarter of previous year
2007 Q1 4.2 2.6 3.0 21.5 1.4 −4.6 −5.5 −2.7 7.2Q2 4.3 1.7 2.4 −13.8 2.5 −2.8 −4.0 −0.2 8.2Q3 7.0 4.9 4.7 18.1 4.3 −7.7 −11.9 1.0 6.5Q4 4.2 9.4 6.4 −13.3 12.5 −7.5 −9.6 −3.1 14.9
2008 Q1 5.1 6.5 10.3 −49.5 8.9 −0.9 −3.9 5.5 17.7Q2 3.4 6.5 7.0 −15.0 7.5 −6.5 −8.2 −3.0 8.2Q3 −0.7 0.4 2.8 −22.8 0.8 −4.5 −3.8 −5.7 −0.6Q4 −7.0 −2.6 −2.4 18.1 −4.3 −7.7 −5.8 −11.2 −6.4
2009 Q1 −13.2 −3.8 −3.5 31.5 −5.1 2.9 6.3 −3.8 −13.6Q2 −17.4 −5.0 −1.0 36.6 −8.5 7.2 11.2 −0.7 −8.3Q3 −12.2 −4.7 −3.0 62.8 −8.3 10.6 16.0 0.5 −0.8Q4 −3.4 −4.2 −1.9 0.6 −5.3 29.0 39.4 8.4 7.9
2010 Q1 − 1.3 −1.8 7.5 2.3 14.7 17.1 9.2 10.5

113
12.CN Household final consumption expenditureMiscellaneous goods and servicesCurrent prices - not seasonally adjustedcontinued £ million
Miscellaneous goods and services (continued)
Insurance Financial ser vices
OtherLife Dwelling Health financial Other
Total insurance insurance insurance Transpor t Other Total FISIM1 ser vices ser vices
COICOP 12.5 12.5.1 12.5.2 12.5.3 12.5.4 12.5.5 12.6 12.6.1 12.6.2 12.7
ADIM ADXW ADXX ADXY ADXZ ADYA ADIN C68S ADYC ADIO2005 26 397 18 365 3 681 1 435 2 916 − 36 794 21 019 15 775 7 5432006 26 740 17 950 4 023 1 571 3 196 − 40 765 22 900 17 865 7 4262007 28 535 21 082 3 300 1 354 2 799 − 42 581 24 017 18 564 7 8702008 28 254 19 632 3 997 1 640 2 985 − 41 916 23 011 18 905 8 1772009 25 190 18 156 3 355 1 447 2 232 − 32 174 14 796 17 378 7 939
Percentage chang e , year on previous year
2005 5.1 12.2 −2.2 −0.1 −17.9 15.5 8.8 26.0 9.52006 1.3 −2.3 9.3 9.5 9.6 10.8 8.9 13.2 −1.62007 6.7 17.4 −18.0 −13.8 −12.4 4.5 4.9 3.9 6.02008 −1.0 −6.9 21.1 21.1 6.6 −1.6 −4.2 1.8 3.92009 −10.8 −7.5 −16.1 −11.8 −25.2 −23.2 −35.7 −8.1 −2.9
Not seasonally adjusted
2007 Q1 6 891 5 031 748 342 770 − 10 474 5 905 4 569 1 965Q2 6 559 4 643 918 334 664 − 10 743 5 991 4 752 1 953Q3 6 903 5 167 799 321 616 − 10 982 6 432 4 550 1 953Q4 8 182 6 241 835 357 749 − 10 382 5 689 4 693 1 999
2008 Q1 7 202 5 089 929 370 814 − 10 803 6 193 4 610 2 000Q2 6 831 4 358 1 203 425 845 − 10 960 6 041 4 919 2 016Q3 6 788 4 715 931 412 730 − 10 848 6 059 4 789 2 062Q4 7 433 5 470 934 433 596 − 9 305 4 718 4 587 2 099
2009 Q1 6 641 4 784 853 381 623 − 8 075 3 901 4 174 1 973Q2 5 329 3 592 860 347 530 − 7 741 3 476 4 265 1 968Q3 6 206 4 356 933 362 555 − 8 087 3 744 4 343 1 972Q4 7 014 5 424 709 357 524 − 8 271 3 675 4 596 2 026
2010 Q1 6 099 4 591 628 325 555 − 8 038 3 506 4 532 1 969
Percentage chang e , quar ter on corresponding quarter of previous year
2007 Q1 4.4 12.6 −28.8 −7.6 8.1 5.4 6.8 3.7 4.4Q2 2.7 17.4 −26.6 −17.3 −14.7 6.5 9.3 3.0 7.0Q3 12.8 21.5 6.8 −11.8 −18.4 7.6 9.4 5.3 4.9Q4 7.2 18.4 −14.2 −17.6 −21.2 −1.5 −5.4 3.8 7.8
2008 Q1 4.5 1.2 24.2 8.2 5.7 3.1 4.9 0.9 1.8Q2 4.1 −6.1 31.0 27.2 27.3 2.0 0.8 3.5 3.2Q3 −1.7 −8.7 16.5 28.3 18.5 −1.2 −5.8 5.3 5.6Q4 −9.2 −12.4 11.9 21.3 −20.4 −10.4 −17.1 −2.3 5.0
2009 Q1 −7.8 −6.0 −8.2 3.0 −23.5 −25.3 −37.0 −9.5 −1.3Q2 −22.0 −17.6 −28.5 −18.4 −37.3 −29.4 −42.5 −13.3 −2.4Q3 −8.6 −7.6 0.2 −12.1 −24.0 −25.5 −38.2 −9.3 −4.4Q4 −5.6 −0.8 −24.1 −17.6 −12.1 −11.1 −22.1 0.2 −3.5
2010 Q1 −8.2 −4.0 −26.4 −14.7 −10.9 −0.5 −10.1 8.6 −0.2
1 Financial intermediation services indirectly measured.

114
12.CS Household final consumption expenditureMiscellaneous goods and servicesCurrent prices - seasonally adjusted £ million
Miscellaneous goods and services
Personal care Personal effects
Hairdressingsalons and
personal Electric Other products Jeweller y,grooming appliances for for personal clocks and Other personal Social
Total Total establishments personal care care Total watches effects protection
COICOP 12 12.1 12.1.1 12.1.2 12.1.3 12.3 12.3.1 12.3.2 12.4
ZAYF ZAYH CCRE XYEJ ATNP ZAYJ ZAYL ATNX ZAYN2005 105 913 19 392 4 870 1 256 13 266 6 656 4 622 2 034 9 1312006 112 718 20 330 5 065 1 028 14 237 7 495 5 096 2 399 9 9622007 118 266 21 352 5 273 1 007 15 072 7 060 4 693 2 367 10 8682008 118 235 21 804 5 500 894 15 410 6 693 4 433 2 260 11 3912009 104 621 20 840 5 370 1 090 14 380 7 595 5 300 2 295 10 883
Percentage chang e , year on previous year
2005 7.4 1.6 3.2 −10.2 2.3 −2.7 −4.0 0.5 3.72006 6.4 4.8 4.0 −18.2 7.3 12.6 10.3 17.9 9.12007 4.9 5.0 4.1 −2.0 5.9 −5.8 −7.9 −1.3 9.12008 − 2.1 4.3 −11.2 2.2 −5.2 −5.5 −4.5 4.82009 −11.5 −4.4 −2.4 21.9 −6.7 13.5 19.6 1.5 −4.5
Seasonally adjusted
2007 Q1 29 010 5 170 1 279 300 3 591 1 739 1 180 559 2 575Q2 29 369 5 179 1 295 230 3 654 1 815 1 218 597 2 673Q3 29 994 5 380 1 335 249 3 796 1 762 1 159 603 2 757Q4 29 893 5 623 1 364 228 4 031 1 744 1 136 608 2 863
2008 Q1 30 343 5 465 1 412 176 3 877 1 710 1 125 585 3 011Q2 30 341 5 506 1 384 213 3 909 1 693 1 118 575 2 921Q3 29 855 5 393 1 369 210 3 814 1 680 1 113 567 2 785Q4 27 696 5 440 1 335 295 3 810 1 610 1 077 533 2 674
2009 Q1 26 570 5 260 1 363 232 3 665 1 783 1 214 569 2 635Q2 25 162 5 218 1 369 276 3 573 1 850 1 277 573 2 670Q3 26 359 5 142 1 327 316 3 499 1 888 1 316 572 2 741Q4 26 530 5 220 1 311 266 3 643 2 074 1 493 581 2 837
2010 Q1 26 568 5 337 1 339 260 3 738 2 053 1 432 621 2 877
Percentage chang e , quar ter previous quarter
2007 Q1 0.4 1.0 − 6.8 0.8 −8.4 −7.1 −11.0 3.4Q2 1.2 0.2 1.3 −23.3 1.8 4.4 3.2 6.8 3.8Q3 2.1 3.9 3.1 8.3 3.9 −2.9 −4.8 1.0 3.1Q4 −0.3 4.5 2.2 −8.4 6.2 −1.0 −2.0 0.8 3.8
2008 Q1 1.5 −2.8 3.5 −22.8 −3.8 −1.9 −1.0 −3.8 5.2Q2 − 0.8 −2.0 21.0 0.8 −1.0 −0.6 −1.7 −3.0Q3 −1.6 −2.1 −1.1 −1.4 −2.4 −0.8 −0.4 −1.4 −4.7Q4 −7.2 0.9 −2.5 40.5 −0.1 −4.2 −3.2 −6.0 −4.0
2009 Q1 −4.1 −3.3 2.1 −21.4 −3.8 10.7 12.7 6.8 −1.5Q2 −5.3 −0.8 0.4 19.0 −2.5 3.8 5.2 0.7 1.3Q3 4.8 −1.5 −3.1 14.5 −2.1 2.1 3.1 −0.2 2.7Q4 0.6 1.5 −1.2 −15.8 4.1 9.9 13.4 1.6 3.5
2010 Q1 0.1 2.2 2.1 −2.3 2.6 −1.0 −4.1 6.9 1.4
Percentage chang e , quar ter on corresponding quarter of previous year
2007 Q1 4.0 3.6 2.9 25.5 2.4 −4.8 −5.8 −2.6 5.1Q2 5.1 1.5 2.3 −20.1 2.9 −2.8 −3.9 −0.3 8.2Q3 7.2 5.2 4.5 13.2 4.9 −7.5 −11.3 0.8 8.0Q4 3.5 9.8 6.6 −18.9 13.2 −8.1 −10.6 −3.2 14.9
2008 Q1 4.6 5.7 10.4 −41.3 8.0 −1.7 −4.7 4.7 16.9Q2 3.3 6.3 6.9 −7.4 7.0 −6.7 −8.2 −3.7 9.3Q3 −0.5 0.2 2.5 −15.7 0.5 −4.7 −4.0 −6.0 1.0Q4 −7.3 −3.3 −2.1 29.4 −5.5 −7.7 −5.2 −12.3 −6.6
2009 Q1 −12.4 −3.8 −3.5 31.8 −5.5 4.3 7.9 −2.7 −12.5Q2 −17.1 −5.2 −1.1 29.6 −8.6 9.3 14.2 −0.3 −8.6Q3 −11.7 −4.7 −3.1 50.5 −8.3 12.4 18.2 0.9 −1.6Q4 −4.2 −4.0 −1.8 −9.8 −4.4 28.8 38.6 9.0 6.1
2010 Q1 − 1.5 −1.8 12.1 2.0 15.1 18.0 9.1 9.2

115
12.CS Household final consumption expenditureMiscellaneous goods and servicesCurrent prices - seasonally adjustedcontinued £ million
Miscellaneous goods and services (continued)
Insurance Financial ser vices
OtherLife Dwelling Health financial Other
Total insurance insurance insurance Transpor t Other Total FISIM1 ser vices ser vices
COICOP 12.5 12.5.1 12.5.2 12.5.3 12.5.4 12.5.5 12.6 12.6.1 12.6.2 12.7
ZAYP UTYG ZAYR ZAYT ZAYV ZAYX ZAYZ C68W ZAZB ZAZD2005 26 397 18 365 3 681 1 435 2 916 − 36 794 21 019 15 775 7 5432006 26 740 17 950 4 023 1 571 3 196 − 40 765 22 900 17 865 7 4262007 28 535 21 082 3 300 1 354 2 799 − 42 581 24 017 18 564 7 8702008 28 254 19 632 3 997 1 640 2 985 − 41 916 23 011 18 905 8 1772009 25 190 18 156 3 355 1 447 2 232 − 32 174 14 796 17 378 7 939
Percentage chang e , year on previous year
2005 5.1 12.2 −2.2 −0.1 −17.9 15.5 8.8 26.0 9.52006 1.3 −2.3 9.3 9.5 9.6 10.8 8.9 13.2 −1.62007 6.7 17.4 −18.0 −13.8 −12.4 4.5 4.9 3.9 6.02008 −1.0 −6.9 21.1 21.1 6.6 −1.6 −4.2 1.8 3.92009 −10.8 −7.5 −16.1 −11.8 −25.2 −23.2 −35.7 −8.1 −2.9
Seasonally adjusted
2007 Q1 7 076 5 081 833 359 803 − 10 464 5 905 4 559 1 986Q2 7 014 5 248 766 335 665 − 10 707 5 991 4 716 1 981Q3 7 106 5 296 845 330 635 − 11 015 6 432 4 583 1 974Q4 7 339 5 457 856 330 696 − 10 395 5 689 4 706 1 929
2008 Q1 7 354 5 105 1 015 386 848 − 10 800 6 193 4 607 2 003Q2 7 259 4 972 1 019 424 844 − 10 926 6 041 4 885 2 036Q3 7 029 4 866 994 421 748 − 10 870 6 059 4 811 2 098Q4 6 612 4 689 969 409 545 − 9 320 4 718 4 602 2 040
2009 Q1 6 840 4 826 959 397 658 − 8 061 3 901 4 160 1 991Q2 5 720 4 157 692 345 526 − 7 711 3 476 4 235 1 993Q3 6 450 4 512 982 374 582 − 8 113 3 744 4 369 2 025Q4 6 180 4 661 722 331 466 − 8 289 3 675 4 614 1 930
2010 Q1 6 332 4 621 790 338 583 − 8 025 3 506 4 519 1 944
Percentage chang e , quar ter on previous quarter
2007 Q1 0.9 7.7 −17.3 −11.4 −9.4 −0.8 −1.8 0.5 9.6Q2 −0.9 3.3 −8.0 −6.7 −17.2 2.3 1.5 3.4 −0.3Q3 1.3 0.9 10.3 −1.5 −4.5 2.9 7.4 −2.8 −0.4Q4 3.3 3.0 1.3 − 9.6 −5.6 −11.6 2.7 −2.3
2008 Q1 0.2 −6.5 18.6 17.0 21.8 3.9 8.9 −2.1 3.8Q2 −1.3 −2.6 0.4 9.8 −0.5 1.2 −2.5 6.0 1.6Q3 −3.2 −2.1 −2.5 −0.7 −11.4 −0.5 0.3 −1.5 3.0Q4 −5.9 −3.6 −2.5 −2.9 −27.1 −14.3 −22.1 −4.3 −2.8
2009 Q1 3.4 2.9 −1.0 −2.9 20.7 −13.5 −17.3 −9.6 −2.4Q2 −16.4 −13.9 −27.8 −13.1 −20.1 −4.3 −10.9 1.8 0.1Q3 12.8 8.5 41.9 8.4 10.6 5.2 7.7 3.2 1.6Q4 −4.2 3.3 −26.5 −11.5 −19.9 2.2 −1.8 5.6 −4.7
2010 Q1 2.5 −0.9 9.4 2.1 25.1 −3.2 −4.6 −2.1 0.7
Percentage chang e , quar ter on corresponding quarter of previous year
2007 Q1 3.9 12.7 −28.4 −7.5 6.6 5.5 6.8 3.7 4.2Q2 6.5 20.1 −26.5 −16.7 −14.2 6.5 9.3 3.0 5.9Q3 12.3 21.6 4.2 −12.2 −18.8 7.6 9.4 5.2 7.4Q4 4.6 15.7 −15.0 −18.5 −21.4 −1.4 −5.4 3.8 6.5
2008 Q1 3.9 0.5 21.8 7.5 5.6 3.2 4.9 1.1 0.9Q2 3.5 −5.3 33.0 26.6 26.9 2.0 0.8 3.6 2.8Q3 −1.1 −8.1 17.6 27.6 17.8 −1.3 −5.8 5.0 6.3Q4 −9.9 −14.1 13.2 23.9 −21.7 −10.3 −17.1 −2.2 5.8
2009 Q1 −7.0 −5.5 −5.5 2.8 −22.4 −25.4 −37.0 −9.7 −0.6Q2 −21.2 −16.4 −32.1 −18.6 −37.7 −29.4 −42.5 −13.3 −2.1Q3 −8.2 −7.3 −1.2 −11.2 −22.2 −25.4 −38.2 −9.2 −3.5Q4 −6.5 −0.6 −25.5 −19.1 −14.5 −11.1 −22.1 0.3 −5.4
2010 Q1 −7.4 −4.2 −17.6 −14.9 −11.4 −0.4 −10.1 8.6 −2.4
1 Financial intermediation services indirectly measured.
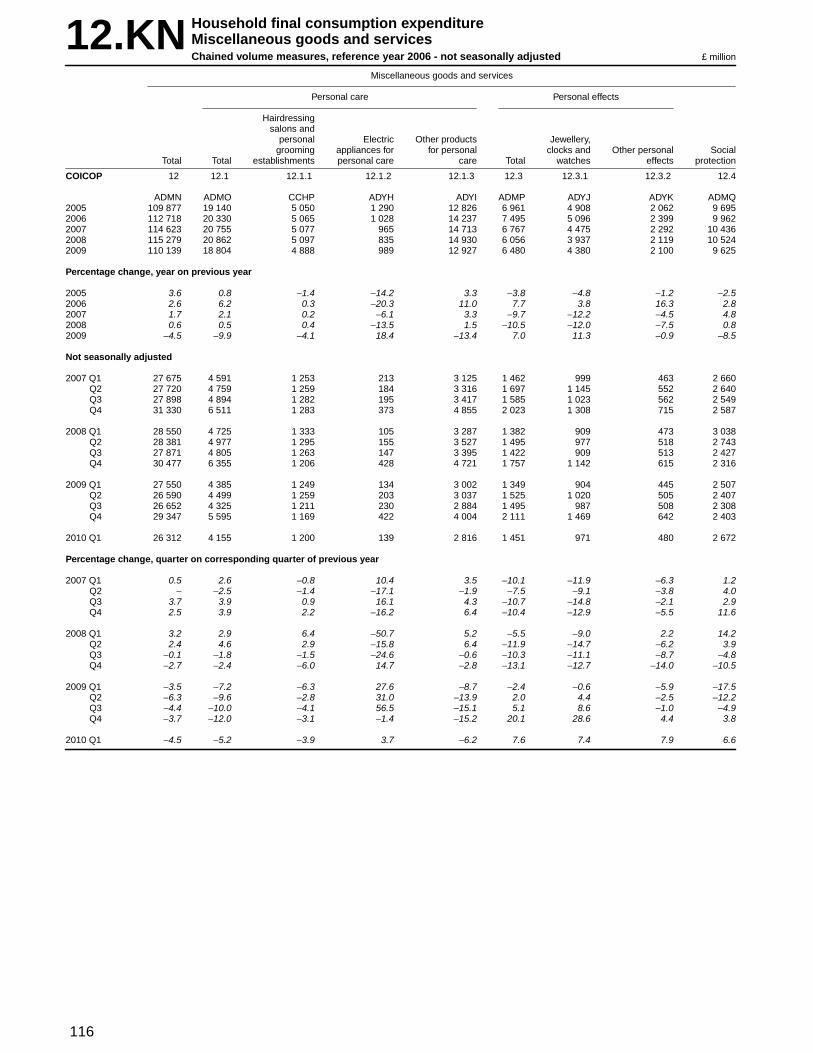
116
12.KN Household final consumption expenditureMiscellaneous goods and servicesChained volume measures, reference year 2006 - not seasonally adjusted £ million
Miscellaneous goods and services
Personal care Personal effects
Hairdressingsalons and
personal Electric Other products Jeweller y,grooming appliances for for personal clocks and Other personal Social
Total Total establishments personal care care Total watches effects protection
COICOP 12 12.1 12.1.1 12.1.2 12.1.3 12.3 12.3.1 12.3.2 12.4
ADMN ADMO CCHP ADYH ADYI ADMP ADYJ ADYK ADMQ2005 109 877 19 140 5 050 1 290 12 826 6 961 4 908 2 062 9 6952006 112 718 20 330 5 065 1 028 14 237 7 495 5 096 2 399 9 9622007 114 623 20 755 5 077 965 14 713 6 767 4 475 2 292 10 4362008 115 279 20 862 5 097 835 14 930 6 056 3 937 2 119 10 5242009 110 139 18 804 4 888 989 12 927 6 480 4 380 2 100 9 625
Percentage chang e , year on previous year
2005 3.6 0.8 −1.4 −14.2 3.3 −3.8 −4.8 −1.2 −2.52006 2.6 6.2 0.3 −20.3 11.0 7.7 3.8 16.3 2.82007 1.7 2.1 0.2 −6.1 3.3 −9.7 −12.2 −4.5 4.82008 0.6 0.5 0.4 −13.5 1.5 −10.5 −12.0 −7.5 0.82009 −4.5 −9.9 −4.1 18.4 −13.4 7.0 11.3 −0.9 −8.5
Not seasonally adjusted
2007 Q1 27 675 4 591 1 253 213 3 125 1 462 999 463 2 660Q2 27 720 4 759 1 259 184 3 316 1 697 1 145 552 2 640Q3 27 898 4 894 1 282 195 3 417 1 585 1 023 562 2 549Q4 31 330 6 511 1 283 373 4 855 2 023 1 308 715 2 587
2008 Q1 28 550 4 725 1 333 105 3 287 1 382 909 473 3 038Q2 28 381 4 977 1 295 155 3 527 1 495 977 518 2 743Q3 27 871 4 805 1 263 147 3 395 1 422 909 513 2 427Q4 30 477 6 355 1 206 428 4 721 1 757 1 142 615 2 316
2009 Q1 27 550 4 385 1 249 134 3 002 1 349 904 445 2 507Q2 26 590 4 499 1 259 203 3 037 1 525 1 020 505 2 407Q3 26 652 4 325 1 211 230 2 884 1 495 987 508 2 308Q4 29 347 5 595 1 169 422 4 004 2 111 1 469 642 2 403
2010 Q1 26 312 4 155 1 200 139 2 816 1 451 971 480 2 672
Percentage chang e , quar ter on corresponding quarter of previous year
2007 Q1 0.5 2.6 −0.8 10.4 3.5 −10.1 −11.9 −6.3 1.2Q2 − −2.5 −1.4 −17.1 −1.9 −7.5 −9.1 −3.8 4.0Q3 3.7 3.9 0.9 16.1 4.3 −10.7 −14.8 −2.1 2.9Q4 2.5 3.9 2.2 −16.2 6.4 −10.4 −12.9 −5.5 11.6
2008 Q1 3.2 2.9 6.4 −50.7 5.2 −5.5 −9.0 2.2 14.2Q2 2.4 4.6 2.9 −15.8 6.4 −11.9 −14.7 −6.2 3.9Q3 −0.1 −1.8 −1.5 −24.6 −0.6 −10.3 −11.1 −8.7 −4.8Q4 −2.7 −2.4 −6.0 14.7 −2.8 −13.1 −12.7 −14.0 −10.5
2009 Q1 −3.5 −7.2 −6.3 27.6 −8.7 −2.4 −0.6 −5.9 −17.5Q2 −6.3 −9.6 −2.8 31.0 −13.9 2.0 4.4 −2.5 −12.2Q3 −4.4 −10.0 −4.1 56.5 −15.1 5.1 8.6 −1.0 −4.9Q4 −3.7 −12.0 −3.1 −1.4 −15.2 20.1 28.6 4.4 3.8
2010 Q1 −4.5 −5.2 −3.9 3.7 −6.2 7.6 7.4 7.9 6.6

117
12.KN Household final consumption expenditureMiscellaneous goods and servicesChained volume measures, reference year 2006 - not seasonally adjustedcontinued £ million
Miscellaneous goods and services (continued)
Insurance Financial ser vices
OtherLife Dwelling Health financial Other
Total insurance insurance insurance Transpor t Other Total FISIM1 ser vices ser vices
COICOP 12.5 12.5.1 12.5.2 12.5.3 12.5.4 12.5.5 12.6 12.6.1 12.6.2 12.7
ADMR ADYL ADYO ADYN ADYM ADYP ADMS C692 ADYR ADMT2005 27 418 19 074 3 819 1 489 3 035 − 38 540 22 206 16 345 8 1622006 26 740 17 950 4 023 1 571 3 196 − 40 765 22 900 17 865 7 4262007 27 786 20 526 3 212 1 320 2 728 − 41 434 23 568 17 866 7 4452008 26 574 18 465 3 753 1 545 2 811 − 44 031 24 652 19 379 7 2322009 25 193 18 725 3 083 1 330 2 055 − 43 189 24 273 18 916 6 848
Percentage chang e , year on previous year
2005 0.4 7.2 −6.6 −4.6 −21.5 11.7 6.8 19.4 3.12006 −2.5 −5.9 5.3 5.5 5.3 5.8 3.1 9.3 −9.02007 3.9 14.4 −20.2 −16.0 −14.6 1.6 2.9 − 0.32008 −4.4 −10.0 16.8 17.0 3.0 6.3 4.6 8.5 −2.92009 −5.2 1.4 −17.9 −13.9 −26.9 −1.9 −1.5 −2.4 −5.3
Not seasonally adjusted
2007 Q1 6 806 4 967 739 339 761 − 10 268 5 817 4 451 1 888Q2 6 398 4 530 894 326 648 − 10 352 5 844 4 508 1 874Q3 6 704 5 019 775 312 598 − 10 320 5 902 4 418 1 846Q4 7 878 6 010 804 343 721 − 10 494 6 005 4 489 1 837
2008 Q1 6 853 4 842 882 353 776 − 10 752 6 072 4 680 1 800Q2 6 403 4 086 1 125 399 793 − 10 970 6 189 4 781 1 793Q3 6 362 4 418 874 386 684 − 11 037 6 215 4 822 1 818Q4 6 956 5 119 872 407 558 − 11 272 6 176 5 096 1 821
2009 Q1 6 606 4 866 801 356 583 − 11 004 6 116 4 888 1 699Q2 5 594 4 007 785 317 485 − 10 853 6 112 4 741 1 712Q3 6 140 4 448 852 332 508 − 10 676 6 049 4 627 1 708Q4 6 853 5 404 645 325 479 − 10 656 5 996 4 660 1 729
2010 Q1 5 924 4 574 559 292 499 − 10 466 5 901 4 565 1 644
Percentage chang e , quar ter on corresponding quarter of previous year
2007 Q1 1.7 9.7 −30.7 −9.1 5.5 0.9 2.5 −1.2 −2.5Q2 0.8 15.3 −28.0 −18.9 −16.4 0.8 2.5 −1.4 1.7Q3 9.6 18.1 3.9 −14.3 −20.8 3.3 2.8 4.0 −0.1Q4 3.8 14.7 −17.0 −20.6 −23.7 1.6 3.8 −1.1 2.2
2008 Q1 0.7 −2.5 19.4 4.1 2.0 4.7 4.4 5.1 −4.7Q2 0.1 −9.8 25.8 22.4 22.4 6.0 5.9 6.1 −4.3Q3 −5.1 −12.0 12.8 23.7 14.4 6.9 5.3 9.1 −1.5Q4 −11.7 −14.8 8.5 18.7 −22.6 7.4 2.8 13.5 −0.9
2009 Q1 −3.6 0.5 −9.2 0.8 −24.9 2.3 0.7 4.4 −5.6Q2 −12.6 −1.9 −30.2 −20.6 −38.8 −1.1 −1.2 −0.8 −4.5Q3 −3.5 0.7 −2.5 −14.0 −25.7 −3.3 −2.7 −4.0 −6.1Q4 −1.5 5.6 −26.0 −20.1 −14.2 −5.5 −2.9 −8.6 −5.1
2010 Q1 −10.3 −6.0 −30.2 −18.0 −14.4 −4.9 −3.5 −6.6 −3.2
1 Financial intermediation services indirectly measured.

118
12.KS Household final consumption expenditureMiscellaneous goods and servicesChained volume measures, reference year 2006 - seasonally adjusted £ million
Miscellaneous goods and services
Personal care Personal effects
Hairdressingsalons and
personal Electric Other products Jeweller y,grooming appliances for for personal clocks and Other personal Social
Total Total establishments personal care care Total watches effects protection
COICOP 12 12.1 12.1.1 12.1.2 12.1.3 12.3 12.3.1 12.3.2 12.4
ZAYG ZAYI CCVZ XYJX ATSP ZAYK ZAYM ATSX ZAYO2005 109 877 19 140 5 050 1 290 12 826 6 961 4 908 2 062 9 6952006 112 718 20 330 5 065 1 028 14 237 7 495 5 096 2 399 9 9622007 114 623 20 755 5 077 965 14 713 6 767 4 475 2 292 10 4362008 115 279 20 862 5 097 835 14 930 6 056 3 937 2 119 10 5242009 110 139 18 804 4 888 989 12 927 6 480 4 380 2 100 9 625
Percentage chang e , year on previous year
2005 3.6 0.8 −1.4 −14.2 3.3 −3.8 −4.8 −1.2 −2.52006 2.6 6.2 0.3 −20.3 11.0 7.7 3.8 16.3 2.82007 1.7 2.1 0.2 −6.1 3.3 −9.7 −12.2 −4.5 4.82008 0.6 0.5 0.4 −13.5 1.5 −10.5 −12.0 −7.5 0.82009 −4.5 −9.9 −4.1 18.4 −13.4 7.0 11.3 −0.9 −8.5
Seasonally adjusted
2007 Q1 28 430 5 165 1 249 295 3 621 1 691 1 143 548 2 493Q2 28 527 5 040 1 253 220 3 567 1 744 1 167 577 2 586Q3 28 675 5 237 1 281 237 3 719 1 681 1 100 581 2 643Q4 28 991 5 313 1 294 213 3 806 1 651 1 065 586 2 714
2008 Q1 29 166 5 288 1 329 169 3 790 1 589 1 033 556 2 827Q2 29 213 5 286 1 287 201 3 798 1 533 995 538 2 713Q3 28 702 5 150 1 260 195 3 695 1 504 975 529 2 557Q4 28 198 5 138 1 221 270 3 647 1 430 934 496 2 427
2009 Q1 28 227 4 917 1 247 217 3 453 1 568 1 042 526 2 363Q2 27 457 4 758 1 250 251 3 257 1 591 1 065 526 2 372Q3 27 429 4 610 1 207 284 3 119 1 599 1 076 523 2 413Q4 27 026 4 519 1 184 237 3 098 1 722 1 197 525 2 477
2010 Q1 26 954 4 661 1 199 236 3 226 1 698 1 129 569 2 488
Percentage chang e , quar ter on previous quarter
2007 Q1 −0.1 1.1 −1.1 9.3 1.2 −8.8 −7.4 −11.5 2.4Q2 0.3 −2.4 0.3 −25.4 −1.5 3.1 2.1 5.3 3.7Q3 0.5 3.9 2.2 7.7 4.3 −3.6 −5.7 0.7 2.2Q4 1.1 1.5 1.0 −10.1 2.3 −1.8 −3.2 0.9 2.7
2008 Q1 0.6 −0.5 2.7 −20.7 −0.4 −3.8 −3.0 −5.1 4.2Q2 0.2 − −3.2 18.9 0.2 −3.5 −3.7 −3.2 −4.0Q3 −1.7 −2.6 −2.1 −3.0 −2.7 −1.9 −2.0 −1.7 −5.8Q4 −1.8 −0.2 −3.1 38.5 −1.3 −4.9 −4.2 −6.2 −5.1
2009 Q1 0.1 −4.3 2.1 −19.6 −5.3 9.7 11.6 6.0 −2.6Q2 −2.7 −3.2 0.2 15.7 −5.7 1.5 2.2 − 0.4Q3 −0.1 −3.1 −3.4 13.1 −4.2 0.5 1.0 −0.6 1.7Q4 −1.5 −2.0 −1.9 −16.5 −0.7 7.7 11.2 0.4 2.7
2010 Q1 −0.3 3.1 1.3 −0.4 4.1 −1.4 −5.7 8.4 0.4
Percentage chang e , quar ter on corresponding quarter of previous year
2007 Q1 0.3 3.5 −0.8 13.9 4.3 −10.1 −12.0 −6.2 −0.7Q2 0.7 −2.9 −1.5 −23.3 −1.8 −7.4 −9.0 −4.0 4.1Q3 3.9 3.9 0.8 11.8 4.6 −10.4 −14.1 −2.4 4.3Q4 1.9 4.0 2.5 −21.1 6.4 −10.9 −13.7 −5.3 11.5
2008 Q1 2.6 2.4 6.4 −42.7 4.7 −6.0 −9.6 1.5 13.4Q2 2.4 4.9 2.7 −8.6 6.5 −12.1 −14.7 −6.8 4.9Q3 0.1 −1.7 −1.6 −17.7 −0.6 −10.5 −11.4 −9.0 −3.3Q4 −2.7 −3.3 −5.6 26.8 −4.2 −13.4 −12.3 −15.4 −10.6
2009 Q1 −3.2 −7.0 −6.2 28.4 −8.9 −1.3 0.9 −5.4 −16.4Q2 −6.0 −10.0 −2.9 24.9 −14.2 3.8 7.0 −2.2 −12.6Q3 −4.4 −10.5 −4.2 45.6 −15.6 6.3 10.4 −1.1 −5.6Q4 −4.2 −12.0 −3.0 −12.2 −15.1 20.4 28.2 5.8 2.1
2010 Q1 −4.5 −5.2 −3.8 8.8 −6.6 8.3 8.3 8.2 5.3
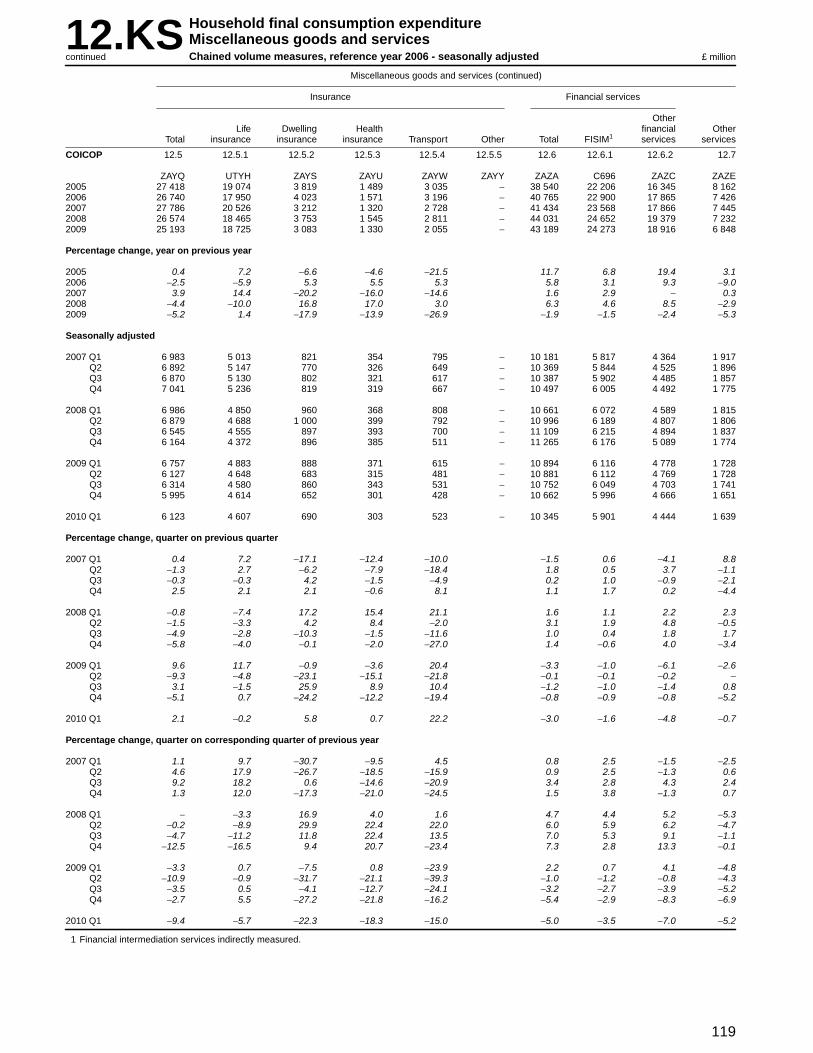
119
12.KS Household final consumption expenditureMiscellaneous goods and servicesChained volume measures, reference year 2006 - seasonally adjustedcontinued £ million
Miscellaneous goods and services (continued)
Insurance Financial ser vices
OtherLife Dwelling Health financial Other
Total insurance insurance insurance Transpor t Other Total FISIM1 ser vices ser vices
COICOP 12.5 12.5.1 12.5.2 12.5.3 12.5.4 12.5.5 12.6 12.6.1 12.6.2 12.7
ZAYQ UTYH ZAYS ZAYU ZAYW ZAYY ZAZA C696 ZAZC ZAZE2005 27 418 19 074 3 819 1 489 3 035 − 38 540 22 206 16 345 8 1622006 26 740 17 950 4 023 1 571 3 196 − 40 765 22 900 17 865 7 4262007 27 786 20 526 3 212 1 320 2 728 − 41 434 23 568 17 866 7 4452008 26 574 18 465 3 753 1 545 2 811 − 44 031 24 652 19 379 7 2322009 25 193 18 725 3 083 1 330 2 055 − 43 189 24 273 18 916 6 848
Percentage chang e , year on previous year
2005 0.4 7.2 −6.6 −4.6 −21.5 11.7 6.8 19.4 3.12006 −2.5 −5.9 5.3 5.5 5.3 5.8 3.1 9.3 −9.02007 3.9 14.4 −20.2 −16.0 −14.6 1.6 2.9 − 0.32008 −4.4 −10.0 16.8 17.0 3.0 6.3 4.6 8.5 −2.92009 −5.2 1.4 −17.9 −13.9 −26.9 −1.9 −1.5 −2.4 −5.3
Seasonally adjusted
2007 Q1 6 983 5 013 821 354 795 − 10 181 5 817 4 364 1 917Q2 6 892 5 147 770 326 649 − 10 369 5 844 4 525 1 896Q3 6 870 5 130 802 321 617 − 10 387 5 902 4 485 1 857Q4 7 041 5 236 819 319 667 − 10 497 6 005 4 492 1 775
2008 Q1 6 986 4 850 960 368 808 − 10 661 6 072 4 589 1 815Q2 6 879 4 688 1 000 399 792 − 10 996 6 189 4 807 1 806Q3 6 545 4 555 897 393 700 − 11 109 6 215 4 894 1 837Q4 6 164 4 372 896 385 511 − 11 265 6 176 5 089 1 774
2009 Q1 6 757 4 883 888 371 615 − 10 894 6 116 4 778 1 728Q2 6 127 4 648 683 315 481 − 10 881 6 112 4 769 1 728Q3 6 314 4 580 860 343 531 − 10 752 6 049 4 703 1 741Q4 5 995 4 614 652 301 428 − 10 662 5 996 4 666 1 651
2010 Q1 6 123 4 607 690 303 523 − 10 345 5 901 4 444 1 639
Percentage chang e , quar ter on previous quarter
2007 Q1 0.4 7.2 −17.1 −12.4 −10.0 −1.5 0.6 −4.1 8.8Q2 −1.3 2.7 −6.2 −7.9 −18.4 1.8 0.5 3.7 −1.1Q3 −0.3 −0.3 4.2 −1.5 −4.9 0.2 1.0 −0.9 −2.1Q4 2.5 2.1 2.1 −0.6 8.1 1.1 1.7 0.2 −4.4
2008 Q1 −0.8 −7.4 17.2 15.4 21.1 1.6 1.1 2.2 2.3Q2 −1.5 −3.3 4.2 8.4 −2.0 3.1 1.9 4.8 −0.5Q3 −4.9 −2.8 −10.3 −1.5 −11.6 1.0 0.4 1.8 1.7Q4 −5.8 −4.0 −0.1 −2.0 −27.0 1.4 −0.6 4.0 −3.4
2009 Q1 9.6 11.7 −0.9 −3.6 20.4 −3.3 −1.0 −6.1 −2.6Q2 −9.3 −4.8 −23.1 −15.1 −21.8 −0.1 −0.1 −0.2 −Q3 3.1 −1.5 25.9 8.9 10.4 −1.2 −1.0 −1.4 0.8Q4 −5.1 0.7 −24.2 −12.2 −19.4 −0.8 −0.9 −0.8 −5.2
2010 Q1 2.1 −0.2 5.8 0.7 22.2 −3.0 −1.6 −4.8 −0.7
Percentage chang e , quar ter on corresponding quarter of previous year
2007 Q1 1.1 9.7 −30.7 −9.5 4.5 0.8 2.5 −1.5 −2.5Q2 4.6 17.9 −26.7 −18.5 −15.9 0.9 2.5 −1.3 0.6Q3 9.2 18.2 0.6 −14.6 −20.9 3.4 2.8 4.3 2.4Q4 1.3 12.0 −17.3 −21.0 −24.5 1.5 3.8 −1.3 0.7
2008 Q1 − −3.3 16.9 4.0 1.6 4.7 4.4 5.2 −5.3Q2 −0.2 −8.9 29.9 22.4 22.0 6.0 5.9 6.2 −4.7Q3 −4.7 −11.2 11.8 22.4 13.5 7.0 5.3 9.1 −1.1Q4 −12.5 −16.5 9.4 20.7 −23.4 7.3 2.8 13.3 −0.1
2009 Q1 −3.3 0.7 −7.5 0.8 −23.9 2.2 0.7 4.1 −4.8Q2 −10.9 −0.9 −31.7 −21.1 −39.3 −1.0 −1.2 −0.8 −4.3Q3 −3.5 0.5 −4.1 −12.7 −24.1 −3.2 −2.7 −3.9 −5.2Q4 −2.7 5.5 −27.2 −21.8 −16.2 −5.4 −2.9 −8.3 −6.9
2010 Q1 −9.4 −5.7 −22.3 −18.3 −15.0 −5.0 −3.5 −7.0 −5.2
1 Financial intermediation services indirectly measured.

120
12.DN Household final consumption expenditureMiscellaneous goods and servicesImplied deflators - not seasonally adjusted 2006 = 100
Miscellaneous goods and services
Personal care Personal effects
Hairdressingsalons and
personal Electric Other products Jeweller y,grooming appliances for for personal clocks and Other personal Social
Total Total establishments personal care care Total watches effects protection
COICOP 12 12.1 12.1.1 12.1.2 12.1.3 12.3 12.3.1 12.3.2 12.4
UTJM UTOP AWOQ AWOR AWOS UTOQ AWOT AWOU UTOR2005 96.4 101.3 96.4 97.4 103.4 95.6 94.2 98.6 94.22006 100.0 100.0 100.0 100.0 100.0 100.0 100.0 100.0 100.02007 103.2 102.9 103.9 104.4 102.4 104.3 104.9 103.3 104.12008 102.6 104.5 107.9 107.1 103.2 110.5 112.6 106.7 108.22009 95.0 110.8 109.9 110.2 111.2 117.2 121.0 109.3 113.1
Percentage chang e , year on previous year
2005 3.8 0.8 4.7 4.7 −1.0 1.2 0.9 1.8 6.32006 3.7 −1.3 3.7 2.7 −3.3 4.6 6.2 1.4 6.22007 3.2 2.9 3.9 4.4 2.4 4.3 4.9 3.3 4.12008 −0.6 1.6 3.8 2.6 0.8 5.9 7.3 3.3 3.92009 −7.4 6.0 1.9 2.9 7.8 6.1 7.5 2.4 4.5
Not seasonally adjusted
2007 Q1 101.8 100.2 102.3 103.3 99.2 102.6 103.0 101.7 103.5Q2 103.3 102.6 103.5 104.9 102.1 104.4 104.5 104.0 103.4Q3 104.6 102.9 104.3 103.6 102.3 104.4 105.0 103.4 104.3Q4 103.0 105.0 105.3 105.1 104.9 105.5 106.5 103.6 105.4
2008 Q1 103.8 103.7 106.1 105.7 102.7 107.5 108.8 105.1 106.6Q2 104.3 104.4 107.6 105.8 103.2 110.8 112.5 107.5 107.7Q3 104.0 105.2 108.8 106.1 103.8 111.2 113.6 106.8 108.9Q4 98.5 104.7 109.3 108.2 103.2 112.1 114.9 107.0 110.2
2009 Q1 93.4 107.5 109.2 109.0 106.7 113.3 116.3 107.4 111.6Q2 92.0 109.7 109.6 110.3 109.7 116.4 119.8 109.5 112.6Q3 95.5 111.4 110.1 110.4 112.0 117.0 121.4 108.5 113.6Q4 98.8 114.0 110.6 110.4 115.3 120.4 124.5 111.1 114.6
2010 Q1 97.8 114.9 111.6 112.9 116.4 120.8 126.8 108.8 115.7
Percentage chang e , quar ter on corresponding quarter of previous year
2007 Q1 3.7 − 3.8 10.1 −2.1 6.1 7.3 3.8 5.9Q2 4.3 4.3 3.8 4.0 4.5 5.1 5.6 3.8 4.0Q3 3.2 1.0 3.7 1.8 −0.1 3.3 3.4 3.2 3.5Q4 1.8 5.4 4.1 3.4 5.7 3.3 3.7 2.5 3.0
2008 Q1 2.0 3.5 3.7 2.3 3.5 4.8 5.6 3.3 3.0Q2 1.0 1.8 4.0 0.9 1.1 6.1 7.7 3.4 4.2Q3 −0.6 2.2 4.3 2.4 1.5 6.5 8.2 3.3 4.4Q4 −4.4 −0.3 3.8 2.9 −1.6 6.3 7.9 3.3 4.6
2009 Q1 −10.0 3.7 2.9 3.1 3.9 5.4 6.9 2.2 4.7Q2 −11.8 5.1 1.9 4.3 6.3 5.1 6.5 1.9 4.5Q3 −8.2 5.9 1.2 4.1 7.9 5.2 6.9 1.6 4.3Q4 0.3 8.9 1.2 2.0 11.7 7.4 8.4 3.8 4.0
2010 Q1 4.7 6.9 2.2 3.6 9.1 6.6 9.0 1.3 3.7

121
12.DN Household final consumption expenditureMiscellaneous goods and servicesImplied deflators - not seasonally adjustedcontinued 2006 = 100
Miscellaneous goods and services (continued)
Insurance Financial ser vices
OtherLife Dwelling Health financial Other
Total insurance insurance insurance Transpor t Other Total FISIM1 ser vices ser vices
COICOP 12.5 12.5.1 12.5.2 12.5.3 12.5.4 12.5.5 12.6 12.6.1 12.6.2 12.7
UTOS AWOV AWOW AWOX AWOY UTOT C69I AWPA UTOU2005 96.3 96.3 96.4 96.4 96.1 95.5 94.7 96.5 92.42006 100.0 100.0 100.0 100.0 100.0 100.0 100.0 100.0 100.02007 102.7 102.7 102.7 102.6 102.6 102.8 101.9 103.9 105.72008 106.3 106.3 106.5 106.1 106.2 95.2 93.3 97.6 113.12009 100.0 97.0 108.8 108.8 108.6 74.5 61.0 91.9 115.9
Percentage chang e , year on previous year
2005 4.7 4.7 4.7 4.7 4.6 3.5 1.9 5.6 6.22006 3.8 3.8 3.7 3.7 4.1 4.7 5.6 3.6 8.22007 2.7 2.7 2.7 2.6 2.6 2.8 1.9 3.9 5.72008 3.5 3.5 3.7 3.4 3.5 −7.4 −8.4 −6.1 7.02009 −5.9 −8.7 2.2 2.5 2.3 −21.7 −34.6 −5.8 2.5
Not seasonally adjusted
2007 Q1 101.2 101.3 101.2 100.9 101.2 102.0 101.5 102.7 104.1Q2 102.5 102.5 102.7 102.5 102.5 103.8 102.5 105.4 104.2Q3 103.0 102.9 103.1 102.9 103.0 106.4 109.0 103.0 105.8Q4 103.9 103.8 103.9 104.1 103.9 98.9 94.7 104.5 108.8
2008 Q1 105.1 105.1 105.3 104.8 104.9 100.5 102.0 98.5 111.1Q2 106.7 106.7 106.9 106.5 106.6 99.9 97.6 102.9 112.4Q3 106.7 106.7 106.5 106.7 106.7 98.3 97.5 99.3 113.4Q4 106.9 106.9 107.1 106.4 106.8 82.5 76.4 90.0 115.3
2009 Q1 100.5 98.3 106.5 107.0 106.9 73.4 63.8 85.4 116.1Q2 95.3 89.6 109.6 109.5 109.3 71.3 56.9 90.0 115.0Q3 101.1 97.9 109.5 109.0 109.3 75.7 61.9 93.9 115.5Q4 102.3 100.4 109.9 109.8 109.4 77.6 61.3 98.6 117.2
2010 Q1 103.0 100.4 112.3 111.3 111.2 76.8 59.4 99.3 119.8
Percentage chang e , quar ter on corresponding quarter of previous year
2007 Q1 2.5 2.6 2.7 1.7 2.4 4.5 4.2 5.0 7.1Q2 1.9 1.8 1.9 2.0 2.1 5.6 6.7 4.5 5.1Q3 2.9 2.8 2.8 2.9 3.0 4.2 6.4 1.2 5.0Q4 3.4 3.2 3.5 3.9 3.3 −3.0 −8.9 4.8 5.4
2008 Q1 3.9 3.8 4.1 3.9 3.7 −1.5 0.5 −4.1 6.7Q2 4.1 4.1 4.1 3.9 4.0 −3.8 −4.8 −2.4 7.9Q3 3.6 3.7 3.3 3.7 3.6 −7.6 −10.6 −3.6 7.2Q4 2.9 3.0 3.1 2.2 2.8 −16.6 −19.3 −13.9 6.0
2009 Q1 −4.4 −6.5 1.1 2.1 1.9 −27.0 −37.5 −13.3 4.5Q2 −10.7 −16.0 2.5 2.8 2.5 −28.6 −41.7 −12.5 2.3Q3 −5.2 −8.2 2.8 2.2 2.4 −23.0 −36.5 −5.4 1.9Q4 −4.3 −6.1 2.6 3.2 2.4 −5.9 −19.8 9.6 1.6
2010 Q1 2.5 2.1 5.4 4.0 4.0 4.6 −6.9 16.3 3.2
1 Financial intermediation services indirectly measured.

122
12.DS Household final consumption expenditureMiscellaneous goods and servicesImplied deflators - seasonally adjusted 2006 = 100
Miscellaneous goods and services
Personal care Personal effects
Hairdressingsalons and
personal Electric Other products Jeweller y,grooming appliances for for personal clocks and Other personal Social
Total Total establishments personal care care Total watches effects protection
COICOP 12 12.1 12.1.1 12.1.2 12.1.3 12.3 12.3.1 12.3.2 12.4
UTJZ UTQI AWSI AWSJ AWSK UTQJ AWSL AWSM UTQK2005 96.4 101.3 96.4 97.4 103.4 95.6 94.2 98.6 94.22006 100.0 100.0 100.0 100.0 100.0 100.0 100.0 100.0 100.02007 103.2 102.9 103.9 104.4 102.4 104.3 104.9 103.3 104.12008 102.6 104.5 107.9 107.1 103.2 110.5 112.6 106.7 108.22009 95.0 110.8 109.9 110.2 111.2 117.2 121.0 109.3 113.1
Percentage chang e , year on previous year
2005 3.8 0.8 4.7 4.7 −1.0 1.2 0.9 1.8 6.32006 3.7 −1.3 3.7 2.7 −3.3 4.6 6.2 1.4 6.22007 3.2 2.9 3.9 4.4 2.4 4.3 4.9 3.3 4.12008 −0.6 1.6 3.8 2.6 0.8 5.9 7.3 3.3 3.92009 −7.4 6.0 1.9 2.9 7.8 6.1 7.5 2.4 4.5
Seasonally adjusted
2007 Q1 102.0 100.1 102.4 101.7 99.2 102.8 103.2 102.0 103.3Q2 103.0 102.8 103.4 104.5 102.4 104.1 104.4 103.5 103.4Q3 104.6 102.7 104.2 105.1 102.1 104.8 105.4 103.8 104.3Q4 103.1 105.8 105.4 107.0 105.9 105.6 106.7 103.8 105.5
2008 Q1 104.0 103.3 106.2 104.1 102.3 107.6 108.9 105.2 106.5Q2 103.9 104.2 107.5 106.0 102.9 110.4 112.4 106.9 107.7Q3 104.0 104.7 108.7 107.7 103.2 111.7 114.2 107.2 108.9Q4 98.2 105.9 109.3 109.3 104.5 112.6 115.3 107.5 110.2
2009 Q1 94.1 107.0 109.3 106.9 106.1 113.7 116.5 108.2 111.5Q2 91.6 109.7 109.5 110.0 109.7 116.3 119.9 108.9 112.6Q3 96.1 111.5 109.9 111.3 112.2 118.1 122.3 109.4 113.6Q4 98.2 115.5 110.7 112.2 117.6 120.4 124.7 110.7 114.5
2010 Q1 98.6 114.5 111.7 110.2 115.9 120.9 126.8 109.1 115.6
Percentage chang e , quar ter on previous quarter
2007 Q1 0.5 −0.1 1.1 −2.3 −0.3 0.4 0.3 0.5 1.0Q2 1.0 2.7 1.0 2.8 3.2 1.3 1.2 1.5 0.1Q3 1.6 −0.1 0.8 0.6 −0.3 0.7 1.0 0.3 0.9Q4 −1.4 3.0 1.2 1.8 3.7 0.8 1.2 − 1.2
2008 Q1 0.9 −2.4 0.8 −2.7 −3.4 1.9 2.1 1.3 0.9Q2 −0.1 0.9 1.2 1.8 0.6 2.6 3.2 1.6 1.1Q3 0.1 0.5 1.1 1.6 0.3 1.2 1.6 0.3 1.1Q4 −5.6 1.1 0.6 1.5 1.3 0.8 1.0 0.3 1.2
2009 Q1 −4.2 1.0 − −2.2 1.5 1.0 1.0 0.7 1.2Q2 −2.7 2.5 0.2 2.9 3.4 2.3 2.9 0.6 1.0Q3 4.9 1.6 0.4 1.2 2.3 1.5 2.0 0.5 0.9Q4 2.2 3.6 0.7 0.8 4.8 1.9 2.0 1.2 0.8
2010 Q1 0.4 −0.9 0.9 −1.8 −1.4 0.4 1.7 −1.4 1.0
Percentage chang e , quar ter on corresponding quarter of previous year
2007 Q1 3.7 0.1 3.7 10.2 −1.8 6.0 7.1 3.8 5.8Q2 4.4 4.6 3.9 4.2 4.8 4.9 5.6 3.8 4.0Q3 3.2 1.2 3.7 1.3 0.3 3.3 3.3 3.3 3.5Q4 1.6 5.6 4.0 2.8 6.4 3.1 3.7 2.3 3.1
2008 Q1 2.0 3.2 3.7 2.4 3.1 4.7 5.5 3.1 3.1Q2 0.9 1.4 4.0 1.4 0.5 6.1 7.7 3.3 4.2Q3 −0.6 1.9 4.3 2.5 1.1 6.6 8.3 3.3 4.4Q4 −4.8 0.1 3.7 2.1 −1.3 6.6 8.1 3.6 4.5
2009 Q1 −9.5 3.6 2.9 2.7 3.7 5.7 7.0 2.9 4.7Q2 −11.8 5.3 1.9 3.8 6.6 5.3 6.7 1.9 4.5Q3 −7.6 6.5 1.1 3.3 8.7 5.7 7.1 2.1 4.3Q4 − 9.1 1.3 2.7 12.5 6.9 8.2 3.0 3.9
2010 Q1 4.8 7.0 2.2 3.1 9.2 6.3 8.8 0.8 3.7

123
12.DS Household final consumption expenditureMiscellaneous goods and servicesImplied deflators - seasonally adjustedcontinued 2006 = 100
Miscellaneous goods and services (continued)
Insurance Financial ser vices
OtherLife Dwelling Health financial Other
Total insurance insurance insurance Transpor t Other Total FISIM1 ser vices ser vices
COICOP 12.5 12.5.1 12.5.2 12.5.3 12.5.4 12.5.5 12.6 12.6.1 12.6.2 12.7
UTQL AWSN AWSO AWSP AWSQ UTQM C69M AWSS UTQN2005 96.3 96.3 96.4 96.4 96.1 95.5 94.7 96.5 92.42006 100.0 100.0 100.0 100.0 100.0 100.0 100.0 100.0 100.02007 102.7 102.7 102.7 102.6 102.6 102.8 101.9 103.9 105.72008 106.3 106.3 106.5 106.1 106.2 95.2 93.3 97.6 113.12009 100.0 97.0 108.8 108.8 108.6 74.5 61.0 91.9 115.9
Percentage chang e , year on previous year
2005 4.7 4.7 4.7 4.7 4.6 3.5 1.9 5.6 6.22006 3.8 3.8 3.7 3.7 4.1 4.7 5.6 3.6 8.22007 2.7 2.7 2.7 2.6 2.6 2.8 1.9 3.9 5.72008 3.5 3.5 3.7 3.4 3.5 −7.4 −8.4 −6.1 7.02009 −5.9 −8.7 2.2 2.5 2.3 −21.7 −34.6 −5.8 2.5
Seasonally adjusted
2007 Q1 101.3 101.4 101.5 101.4 101.0 102.8 101.5 104.5 103.6Q2 101.8 102.0 99.5 102.8 102.5 103.3 102.5 104.2 104.5Q3 103.4 103.2 105.4 102.8 102.9 106.0 109.0 102.2 106.3Q4 104.2 104.2 104.5 103.4 104.3 99.0 94.7 104.8 108.7
2008 Q1 105.3 105.3 105.7 104.9 105.0 101.3 102.0 100.4 110.4Q2 105.5 106.1 101.9 106.3 106.6 99.4 97.6 101.6 112.7Q3 107.4 106.8 110.8 107.1 106.9 97.8 97.5 98.3 114.2Q4 107.3 107.3 108.1 106.2 106.7 82.7 76.4 90.4 115.0
2009 Q1 101.2 98.8 108.0 107.0 107.0 74.0 63.8 87.1 115.2Q2 93.4 89.4 101.3 109.5 109.4 70.9 56.9 88.8 115.3Q3 102.2 98.5 114.2 109.0 109.6 75.5 61.9 92.9 116.3Q4 103.1 101.0 110.7 110.0 108.9 77.7 61.3 98.9 116.9
2010 Q1 103.4 100.3 114.5 111.6 111.5 77.6 59.4 101.7 118.6
Percentage chang e , quar ter on previous quarter
2007 Q1 0.4 0.5 −0.2 1.2 0.7 0.8 −2.3 4.8 0.8Q2 0.5 0.6 −2.0 1.4 1.5 0.5 1.0 −0.3 0.9Q3 1.6 1.2 5.9 − 0.4 2.6 6.3 −1.9 1.7Q4 0.8 1.0 −0.9 0.6 1.4 −6.6 −13.1 2.5 2.3
2008 Q1 1.1 1.1 1.1 1.5 0.7 2.3 7.7 −4.2 1.6Q2 0.2 0.8 −3.6 1.3 1.5 −1.9 −4.3 1.2 2.1Q3 1.8 0.7 8.7 0.8 0.3 −1.6 −0.1 −3.2 1.3Q4 −0.1 0.5 −2.4 −0.8 −0.2 −15.4 −21.6 −8.0 0.7
2009 Q1 −5.7 −7.9 −0.1 0.8 0.3 −10.5 −16.5 −3.7 0.2Q2 −7.7 −9.5 −6.2 2.3 2.2 −4.2 −10.8 2.0 0.1Q3 9.4 10.2 12.7 −0.5 0.2 6.5 8.8 4.6 0.9Q4 0.9 2.5 −3.1 0.9 −0.6 2.9 −1.0 6.5 0.5
2010 Q1 0.3 −0.7 3.4 1.5 2.4 −0.1 −3.1 2.8 1.5
Percentage chang e , quar ter on corresponding quarter of previous year
2007 Q1 2.7 2.8 3.5 2.2 2.1 4.7 4.2 5.3 6.9Q2 1.8 1.9 0.4 2.3 2.1 5.6 6.7 4.3 5.2Q3 2.9 2.9 3.5 2.8 2.6 4.0 6.4 0.9 4.8Q4 3.3 3.3 2.8 3.2 4.0 −2.9 −8.9 5.1 5.7
2008 Q1 3.9 3.8 4.1 3.5 4.0 −1.5 0.5 −3.9 6.6Q2 3.6 4.0 2.4 3.4 4.0 −3.8 −4.8 −2.5 7.8Q3 3.9 3.5 5.1 4.2 3.9 −7.7 −10.6 −3.8 7.4Q4 3.0 3.0 3.4 2.7 2.3 −16.5 −19.3 −13.7 5.8
2009 Q1 −3.9 −6.2 2.2 2.0 1.9 −26.9 −37.5 −13.2 4.3Q2 −11.5 −15.7 −0.6 3.0 2.6 −28.7 −41.7 −12.6 2.3Q3 −4.8 −7.8 3.1 1.8 2.5 −22.8 −36.5 −5.5 1.8Q4 −3.9 −5.9 2.4 3.6 2.1 −6.0 −19.8 9.4 1.7
2010 Q1 2.2 1.5 6.0 4.3 4.2 4.9 −6.9 16.8 3.0
1 Financial intermediation services indirectly measured.

124
TOUR.CN Household final consumption expenditureUK and foreign tourist expenditureCurrent prices - not seasonally adjusted £ million
UK and foreign tourist expenditure
Net tourism Foreign tourist expenditure UK tour ist expenditure abroad
ABTE CDFD ABTA2005 11 959 −17 069 29 0282006 11 387 −19 002 30 3892007 12 209 −19 492 31 7012008 13 487 −19 798 33 2852009 9 613 −19 483 29 096
Percentage chang e , year on previous year
2005 9.3 5.42006 11.3 4.72007 2.6 4.32008 1.6 5.02009 −1.6 −12.6
Not seasonally adjusted
2007 Q1 2 354 −3 727 6 081Q2 3 486 −4 455 7 941Q3 4 842 −6 569 11 411Q4 1 527 −4 741 6 268
2008 Q1 2 995 −3 880 6 875Q2 3 405 −4 871 8 276Q3 5 533 −6 504 12 037Q4 1 554 −4 543 6 097
2009 Q1 2 239 −3 775 6 014Q2 2 598 −4 670 7 268Q3 3 931 −6 471 10 402Q4 845 −4 567 5 412
2010 Q1 1 688 −3 605 5 293
Percentage chang e , quar ter on corresponding quarter of previous year
2007 Q1 8.0 4.1Q2 −2.3 1.5Q3 2.6 7.6Q4 3.3 2.4
2008 Q1 4.1 13.1Q2 9.3 4.2Q3 −1.0 5.5Q4 −4.2 −2.7
2009 Q1 −2.7 −12.5Q2 −4.1 −12.2Q3 −0.5 −13.6Q4 0.5 −11.2
2010 Q1 −4.5 −12.0

125
TOUR.CS Household final consumption expenditureUK and foreign tourist expenditureCurrent prices - seasonally adjusted £ million
UK and foreign tourist expenditure
Net tourism Foreign tourist expenditure UK tour ist expenditure abroad
ABTF CCVV ABTB2005 11 959 −17 069 29 0282006 11 387 −19 002 30 3892007 12 209 −19 492 31 7012008 13 487 −19 798 33 2852009 9 613 −19 483 29 096
Percentage chang e , year on previous year
2005 9.3 5.42006 11.3 4.72007 2.6 4.32008 1.6 5.02009 −1.6 −12.6
Seasonally adjusted
2007 Q1 2 728 −4 944 7 672Q2 3 270 −4 638 7 908Q3 3 012 −4 959 7 971Q4 3 199 −4 951 8 150
2008 Q1 3 754 −5 067 8 821Q2 3 129 −5 072 8 201Q3 3 502 −4 873 8 375Q4 3 102 −4 786 7 888
2009 Q1 2 670 −4 918 7 588Q2 2 446 −4 872 7 318Q3 2 311 −4 860 7 171Q4 2 186 −4 833 7 019
2010 Q1 1 995 −4 697 6 692
Percentage chang e , quar ter on previous quarter
2007 Q1 2.6 −2.5Q2 −6.2 3.1Q3 6.9 0.8Q4 −0.2 2.2
2008 Q1 2.3 8.2Q2 0.1 −7.0Q3 −3.9 2.1Q4 −1.8 −5.8
2009 Q1 2.8 −3.8Q2 −0.9 −3.6Q3 −0.2 −2.0Q4 −0.6 −2.1
2010 Q1 −2.8 −4.7
Percentage chang e , quar ter on corresponding quarter of previous year
2007 Q1 7.9 3.4Q2 −2.8 2.3Q3 2.6 8.1Q4 2.8 3.6
2008 Q1 2.5 15.0Q2 9.4 3.7Q3 −1.7 5.1Q4 −3.3 −3.2
2009 Q1 −2.9 −14.0Q2 −3.9 −10.8Q3 −0.3 −14.4Q4 1.0 −11.0
2010 Q1 −4.5 −11.8
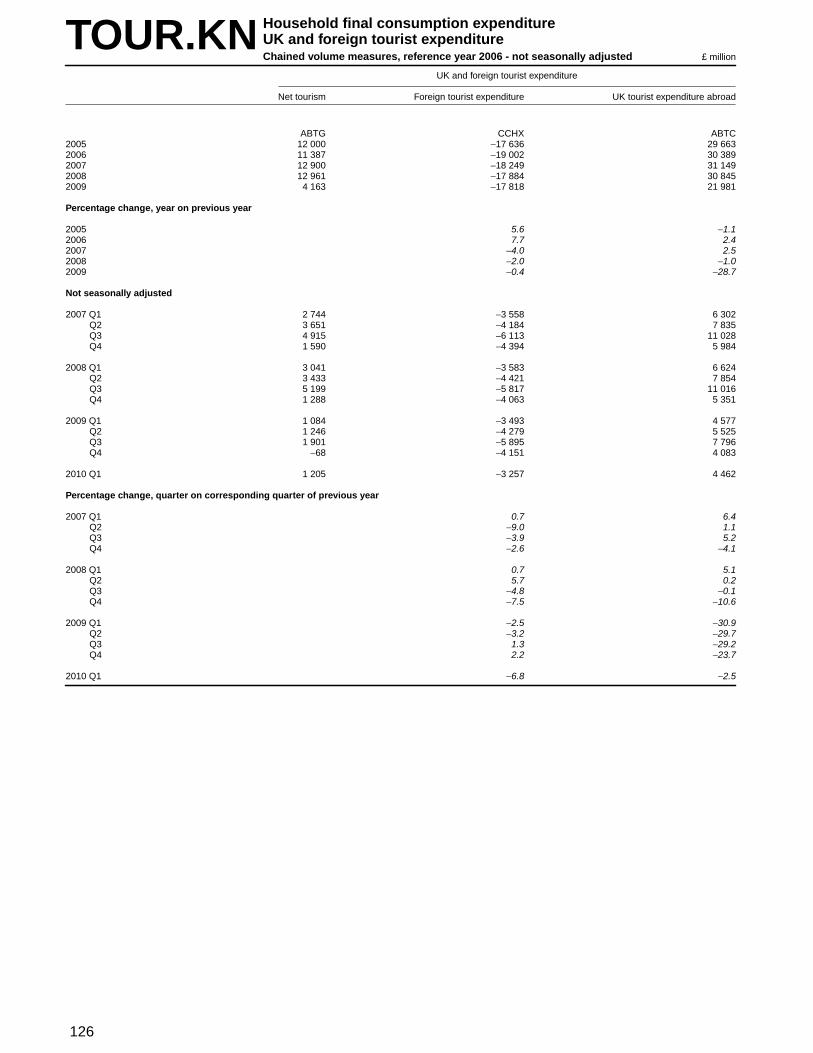
126
TOUR.KN Household final consumption expenditureUK and foreign tourist expenditureChained volume measures, reference year 2006 - not seasonally adjusted £ million
UK and foreign tourist expenditure
Net tourism Foreign tourist expenditure UK tour ist expenditure abroad
ABTG CCHX ABTC2005 12 000 −17 636 29 6632006 11 387 −19 002 30 3892007 12 900 −18 249 31 1492008 12 961 −17 884 30 8452009 4 163 −17 818 21 981
Percentage chang e , year on previous year
2005 5.6 −1.12006 7.7 2.42007 −4.0 2.52008 −2.0 −1.02009 −0.4 −28.7
Not seasonally adjusted
2007 Q1 2 744 −3 558 6 302Q2 3 651 −4 184 7 835Q3 4 915 −6 113 11 028Q4 1 590 −4 394 5 984
2008 Q1 3 041 −3 583 6 624Q2 3 433 −4 421 7 854Q3 5 199 −5 817 11 016Q4 1 288 −4 063 5 351
2009 Q1 1 084 −3 493 4 577Q2 1 246 −4 279 5 525Q3 1 901 −5 895 7 796Q4 −68 −4 151 4 083
2010 Q1 1 205 −3 257 4 462
Percentage chang e , quar ter on corresponding quarter of previous year
2007 Q1 0.7 6.4Q2 −9.0 1.1Q3 −3.9 5.2Q4 −2.6 −4.1
2008 Q1 0.7 5.1Q2 5.7 0.2Q3 −4.8 −0.1Q4 −7.5 −10.6
2009 Q1 −2.5 −30.9Q2 −3.2 −29.7Q3 1.3 −29.2Q4 2.2 −23.7
2010 Q1 −6.8 −2.5
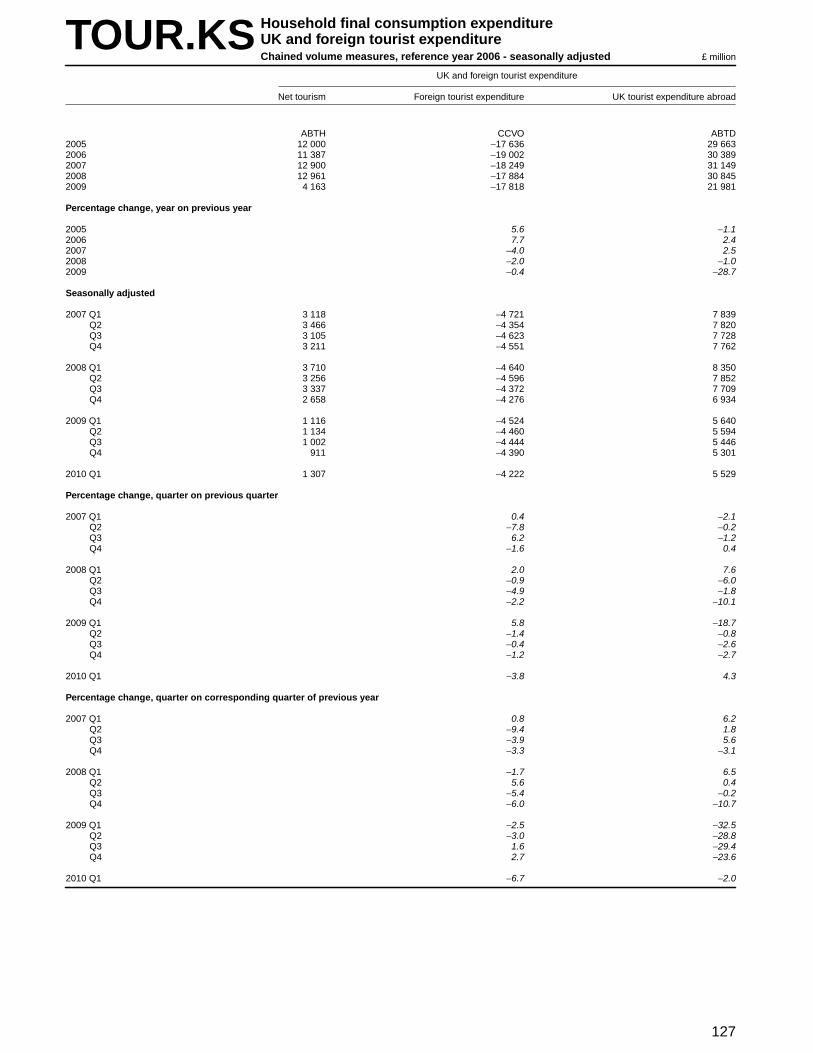
127
TOUR.KS Household final consumption expenditureUK and foreign tourist expenditureChained volume measures, reference year 2006 - seasonally adjusted £ million
UK and foreign tourist expenditure
Net tourism Foreign tourist expenditure UK tour ist expenditure abroad
ABTH CCVO ABTD2005 12 000 −17 636 29 6632006 11 387 −19 002 30 3892007 12 900 −18 249 31 1492008 12 961 −17 884 30 8452009 4 163 −17 818 21 981
Percentage chang e , year on previous year
2005 5.6 −1.12006 7.7 2.42007 −4.0 2.52008 −2.0 −1.02009 −0.4 −28.7
Seasonally adjusted
2007 Q1 3 118 −4 721 7 839Q2 3 466 −4 354 7 820Q3 3 105 −4 623 7 728Q4 3 211 −4 551 7 762
2008 Q1 3 710 −4 640 8 350Q2 3 256 −4 596 7 852Q3 3 337 −4 372 7 709Q4 2 658 −4 276 6 934
2009 Q1 1 116 −4 524 5 640Q2 1 134 −4 460 5 594Q3 1 002 −4 444 5 446Q4 911 −4 390 5 301
2010 Q1 1 307 −4 222 5 529
Percentage chang e , quar ter on previous quarter
2007 Q1 0.4 −2.1Q2 −7.8 −0.2Q3 6.2 −1.2Q4 −1.6 0.4
2008 Q1 2.0 7.6Q2 −0.9 −6.0Q3 −4.9 −1.8Q4 −2.2 −10.1
2009 Q1 5.8 −18.7Q2 −1.4 −0.8Q3 −0.4 −2.6Q4 −1.2 −2.7
2010 Q1 −3.8 4.3
Percentage chang e , quar ter on corresponding quarter of previous year
2007 Q1 0.8 6.2Q2 −9.4 1.8Q3 −3.9 5.6Q4 −3.3 −3.1
2008 Q1 −1.7 6.5Q2 5.6 0.4Q3 −5.4 −0.2Q4 −6.0 −10.7
2009 Q1 −2.5 −32.5Q2 −3.0 −28.8Q3 1.6 −29.4Q4 2.7 −23.6
2010 Q1 −6.7 −2.0

128
TOUR.DN Household final consumption expenditureUK and foreign tourist expenditureImplied deflators - not seasonally adjusted 2006 = 100
UK and foreign tourist expenditure
Net tourism Foreign tourist expenditure UK tour ist expenditure abroad
GDPB GDPE2005 96.8 97.92006 100.0 100.02007 106.8 101.82008 110.7 107.92009 109.3 132.4
Percentage chang e , year on previous year
2005 3.5 6.62006 3.3 2.12007 6.8 1.82008 3.7 6.02009 −1.3 22.7
Not seasonally adjusted
2007 Q1 104.7 96.5Q2 106.5 101.4Q3 107.5 103.5Q4 107.9 104.7
2008 Q1 108.3 103.8Q2 110.2 105.4Q3 111.8 109.3Q4 111.8 113.9
2009 Q1 108.1 131.4Q2 109.1 131.5Q3 109.8 133.4Q4 110.0 132.5
2010 Q1 110.7 118.6
Percentage chang e , quar ter on corresponding quarter of previous year
2007 Q1 7.2 −2.1Q2 7.4 0.4Q3 6.9 2.3Q4 6.0 6.7
2008 Q1 3.4 7.6Q2 3.5 3.9Q3 4.0 5.6Q4 3.6 8.8
2009 Q1 −0.2 26.6Q2 −1.0 24.8Q3 −1.8 22.0Q4 −1.6 16.3
2010 Q1 2.4 −9.7
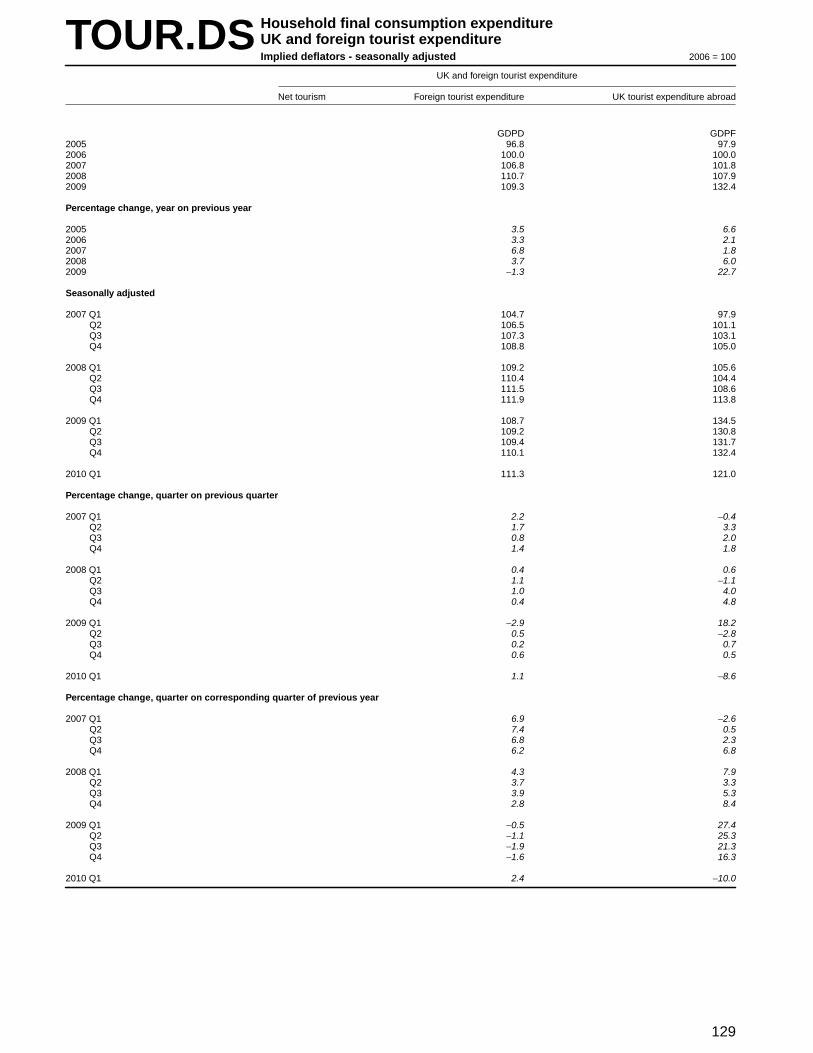
129
TOUR.DS Household final consumption expenditureUK and foreign tourist expenditureImplied deflators - seasonally adjusted 2006 = 100
UK and foreign tourist expenditure
Net tourism Foreign tourist expenditure UK tour ist expenditure abroad
GDPD GDPF2005 96.8 97.92006 100.0 100.02007 106.8 101.82008 110.7 107.92009 109.3 132.4
Percentage chang e , year on previous year
2005 3.5 6.62006 3.3 2.12007 6.8 1.82008 3.7 6.02009 −1.3 22.7
Seasonally adjusted
2007 Q1 104.7 97.9Q2 106.5 101.1Q3 107.3 103.1Q4 108.8 105.0
2008 Q1 109.2 105.6Q2 110.4 104.4Q3 111.5 108.6Q4 111.9 113.8
2009 Q1 108.7 134.5Q2 109.2 130.8Q3 109.4 131.7Q4 110.1 132.4
2010 Q1 111.3 121.0
Percentage chang e , quar ter on previous quarter
2007 Q1 2.2 −0.4Q2 1.7 3.3Q3 0.8 2.0Q4 1.4 1.8
2008 Q1 0.4 0.6Q2 1.1 −1.1Q3 1.0 4.0Q4 0.4 4.8
2009 Q1 −2.9 18.2Q2 0.5 −2.8Q3 0.2 0.7Q4 0.6 0.5
2010 Q1 1.1 −8.6
Percentage chang e , quar ter on corresponding quarter of previous year
2007 Q1 6.9 −2.6Q2 7.4 0.5Q3 6.8 2.3Q4 6.2 6.8
2008 Q1 4.3 7.9Q2 3.7 3.3Q3 3.9 5.3Q4 2.8 8.4
2009 Q1 −0.5 27.4Q2 −1.1 25.3Q3 −1.9 21.3Q4 −1.6 16.3
2010 Q1 2.4 −10.0

130
0GS.CN Household final consumption expenditureGoods and services summaryCurrent prices - not seasonally adjusted £ million
UK NATIONAL1
UK DOMESTIC2
Goods
Semi- Non-Net Durable durable durable
Total tourism Total Total goods goods goods Ser vices
COICOP 0 D SD ND S
ABPB ABTE ABQI UTIE UTIA UTIQ UTII UTIM2005 784 140 11 959 772 181 367 616 88 851 89 965 188 800 404 5652006 819 610 11 387 808 223 383 808 91 701 92 770 199 337 424 4152007 861 695 12 209 849 486 400 779 95 611 95 529 209 639 448 7072008 892 194 13 487 878 707 417 225 93 808 97 415 226 002 461 4822009 872 914 9 613 863 301 411 933 90 860 96 222 224 851 451 368
Percentage chang e , year on previous year
2005 4.6 4.6 3.1 1.6 0.9 5.0 6.12006 4.5 4.7 4.4 3.2 3.1 5.6 4.92007 5.1 5.1 4.4 4.3 3.0 5.2 5.72008 3.5 3.4 4.1 −1.9 2.0 7.8 2.82009 −2.2 −1.8 −1.3 −3.1 −1.2 −0.5 −2.2
Not seasonally adjusted
2007 Q1 204 820 2 354 202 466 96 627 24 276 20 678 51 673 105 839Q2 211 955 3 486 208 469 95 730 23 016 22 689 50 025 112 739Q3 217 466 4 842 212 624 96 050 24 425 22 689 48 936 116 574Q4 227 454 1 527 225 927 112 372 23 894 29 473 59 005 113 555
2008 Q1 215 829 2 995 212 834 102 461 25 985 21 019 55 457 110 373Q2 220 254 3 405 216 849 100 906 22 963 22 910 55 033 115 943Q3 225 323 5 533 219 790 99 325 23 312 23 315 52 698 120 465Q4 230 788 1 554 229 234 114 533 21 548 30 171 62 814 114 701
2009 Q1 211 363 2 239 209 124 100 717 22 073 21 096 57 548 108 407Q2 212 783 2 598 210 185 97 895 21 046 22 473 54 376 112 290Q3 218 088 3 931 214 157 97 402 22 968 22 698 51 736 116 755Q4 230 680 845 229 835 115 919 24 773 29 955 61 191 113 916
2010 Q1 218 580 1 688 216 892 106 133 24 838 21 582 59 713 110 759
Percentage chang e , quar ter on corresponding quarter of previous year
2007 Q1 5.4 5.5 4.4 2.3 3.0 6.0 6.5Q2 5.0 5.0 3.2 3.9 3.1 2.8 6.6Q3 5.1 4.9 3.9 5.7 3.2 3.4 5.8Q4 5.0 5.0 5.9 5.2 2.7 8.0 4.1
2008 Q1 5.4 5.1 6.0 7.0 1.6 7.3 4.3Q2 3.9 4.0 5.4 −0.2 1.0 10.0 2.8Q3 3.6 3.4 3.4 −4.6 2.8 7.7 3.3Q4 1.5 1.5 1.9 −9.8 2.4 6.5 1.0
2009 Q1 −2.1 −1.7 −1.7 −15.1 0.4 3.8 −1.8Q2 −3.4 −3.1 −3.0 −8.3 −1.9 −1.2 −3.2Q3 −3.2 −2.6 −1.9 −1.5 −2.6 −1.8 −3.1Q4 − 0.3 1.2 15.0 −0.7 −2.6 −0.7
2010 Q1 3.4 3.7 5.4 12.5 2.3 3.8 2.2
1 Final consumption expenditure by UK households in the UK & abroad2 Final consumption expenditure in the UK by UK & foreign households

131
0GS.CS Household final consumption expenditureGoods and services summaryCurrent prices - seasonally adjusted £ million
UK NATIONAL1
UK DOMESTIC2
Goods
Semi- Non-Net Durable durable durable
Total tourism Total Total goods goods goods Ser vices
COICOP 0 D SD ND S
ABJQ ABTF ZAKV UTIF UTIB UTIR UTIJ UTIN2005 784 140 11 959 772 181 367 616 88 851 89 965 188 800 404 5652006 819 610 11 387 808 223 383 808 91 701 92 770 199 337 424 4152007 861 695 12 209 849 486 400 779 95 611 95 529 209 639 448 7072008 892 194 13 487 878 707 417 225 93 808 97 415 226 002 461 4822009 872 914 9 613 863 301 411 933 90 860 96 222 224 851 451 368
Percentage chang e , year on previous year
2005 4.6 4.6 3.1 1.6 0.9 5.0 6.12006 4.5 4.7 4.4 3.2 3.1 5.6 4.92007 5.1 5.1 4.4 4.3 3.0 5.2 5.72008 3.5 3.4 4.1 −1.9 2.0 7.8 2.82009 −2.2 −1.8 −1.3 −3.1 −1.2 −0.5 −2.2
Seasonally adjusted
2007 Q1 211 190 2 728 208 462 97 846 23 188 23 592 51 066 110 616Q2 214 762 3 270 211 492 99 233 23 853 24 067 51 313 112 259Q3 216 318 3 012 213 306 100 799 23 956 24 001 52 842 112 507Q4 219 425 3 199 216 226 102 901 24 614 23 869 54 418 113 325
2008 Q1 223 065 3 754 219 311 103 961 25 059 24 031 54 871 115 350Q2 223 348 3 129 220 219 104 810 23 853 24 365 56 592 115 409Q3 224 803 3 502 221 301 105 074 22 913 24 611 57 550 116 227Q4 220 978 3 102 217 876 103 380 21 983 24 408 56 989 114 496
2009 Q1 217 439 2 670 214 769 101 564 21 345 24 157 56 062 113 205Q2 216 161 2 446 213 715 102 145 22 036 23 967 56 142 111 570Q3 217 821 2 311 215 510 102 730 22 686 23 962 56 082 112 780Q4 221 493 2 186 219 307 105 494 24 793 24 136 56 565 113 813
2010 Q1 224 997 1 995 223 002 107 575 24 333 24 614 58 628 115 427
Percentage chang e , quar ter on previous quarter
2007 Q1 1.2 1.4 1.2 0.2 1.9 1.4 1.6Q2 1.7 1.5 1.4 2.9 2.0 0.5 1.5Q3 0.7 0.9 1.6 0.4 −0.3 3.0 0.2Q4 1.4 1.4 2.1 2.7 −0.5 3.0 0.7
2008 Q1 1.7 1.4 1.0 1.8 0.7 0.8 1.8Q2 0.1 0.4 0.8 −4.8 1.4 3.1 0.1Q3 0.7 0.5 0.3 −3.9 1.0 1.7 0.7Q4 −1.7 −1.5 −1.6 −4.1 −0.8 −1.0 −1.5
2009 Q1 −1.6 −1.4 −1.8 −2.9 −1.0 −1.6 −1.1Q2 −0.6 −0.5 0.6 3.2 −0.8 0.1 −1.4Q3 0.8 0.8 0.6 2.9 − −0.1 1.1Q4 1.7 1.8 2.7 9.3 0.7 0.9 0.9
2010 Q1 1.6 1.7 2.0 −1.9 2.0 3.6 1.4
Percentage chang e , quar ter on corresponding quarter of previous year
2007 Q1 5.4 5.5 4.5 2.4 3.0 6.1 6.4Q2 5.2 5.1 3.1 3.3 3.1 3.1 6.8Q3 4.8 4.7 3.6 4.9 2.7 3.5 5.6Q4 5.2 5.2 6.4 6.4 3.1 8.0 4.1
2008 Q1 5.6 5.2 6.2 8.1 1.9 7.5 4.3Q2 4.0 4.1 5.6 − 1.2 10.3 2.8Q3 3.9 3.7 4.2 −4.4 2.5 8.9 3.3Q4 0.7 0.8 0.5 −10.7 2.3 4.7 1.0
2009 Q1 −2.5 −2.1 −2.3 −14.8 0.5 2.2 −1.9Q2 −3.2 −3.0 −2.5 −7.6 −1.6 −0.8 −3.3Q3 −3.1 −2.6 −2.2 −1.0 −2.6 −2.6 −3.0Q4 0.2 0.7 2.0 12.8 −1.1 −0.7 −0.6
2010 Q1 3.5 3.8 5.9 14.0 1.9 4.6 2.0
1 Final consumption expenditure by UK households in the UK & abroad2 Final consumption expenditure in the UK by UK & foreign households

132
0GS.KN Household final consumption expenditureGoods and services summaryChained volume measures, reference year 2006 - not seasonally adjusted £ million
UK NATIONAL1
UK DOMESTIC2
Goods
Semi- Non-Net Durable durable durable
Total tourism Total Total goods goods goods Ser vices
COICOP 0 D SD ND S
ABPF ABTG ABQJ UTIG UTIC UTIS UTIK UTIO2005 805 273 12 000 793 253 372 253 85 777 89 258 197 538 421 1002006 819 610 11 387 808 223 383 808 91 701 92 770 199 337 424 4152007 837 417 12 900 824 517 394 629 97 871 95 500 201 258 429 8882008 842 174 12 961 829 213 399 564 100 810 99 223 199 531 429 6492009 813 167 4 163 809 004 390 484 99 713 99 712 191 059 418 520
Percentage chang e , year on previous year
2005 2.3 2.5 3.0 6.3 2.7 1.6 1.92006 1.8 1.9 3.1 6.9 3.9 0.9 0.82007 2.2 2.0 2.8 6.7 2.9 1.0 1.32008 0.6 0.6 1.3 3.0 3.9 −0.9 −0.12009 −3.4 −2.4 −2.3 −1.1 0.5 −4.2 −2.6
Not seasonally adjusted
2007 Q1 201 165 2 744 198 421 95 294 24 469 20 873 49 952 103 127Q2 205 501 3 651 201 850 93 843 23 190 22 533 48 120 108 007Q3 211 017 4 915 206 102 95 289 25 195 22 805 47 289 110 813Q4 219 734 1 590 218 144 110 203 25 017 29 289 55 897 107 941
2008 Q1 206 683 3 041 203 642 99 618 27 122 21 301 51 195 104 024Q2 207 874 3 433 204 441 96 179 24 060 23 087 49 032 108 262Q3 211 032 5 199 205 833 94 744 25 065 23 844 45 835 111 089Q4 216 585 1 288 215 297 109 023 24 563 30 991 53 469 106 274
2009 Q1 198 033 1 084 196 949 95 560 24 665 22 209 48 686 101 389Q2 199 264 1 246 198 018 92 964 22 926 23 246 46 792 105 054Q3 202 425 1 901 200 524 92 564 24 624 23 574 44 366 107 960Q4 213 445 −68 213 513 109 396 27 498 30 683 51 215 104 117
2010 Q1 197 148 1 205 195 943 97 079 26 210 22 183 48 686 98 864
Percentage chang e , quar ter on corresponding quarter of previous year
2007 Q1 2.0 1.8 1.8 3.2 3.5 0.3 2.0Q2 1.4 1.2 1.0 4.6 2.9 −1.6 1.3Q3 2.5 2.2 3.2 9.1 2.8 0.6 1.2Q4 2.8 2.8 5.1 10.0 2.7 4.3 0.7
2008 Q1 2.7 2.6 4.5 10.8 2.1 2.5 0.9Q2 1.2 1.3 2.5 3.8 2.5 1.9 0.2Q3 − −0.1 −0.6 −0.5 4.6 −3.1 0.2Q4 −1.4 −1.3 −1.1 −1.8 5.8 −4.3 −1.5
2009 Q1 −4.2 −3.3 −4.1 −9.1 4.3 −4.9 −2.5Q2 −4.1 −3.1 −3.3 −4.7 0.7 −4.6 −3.0Q3 −4.1 −2.6 −2.3 −1.8 −1.1 −3.2 −2.8Q4 −1.4 −0.8 0.3 11.9 −1.0 −4.2 −2.0
2010 Q1 −0.4 −0.5 1.6 6.3 −0.1 − −2.5
1 Final consumption expenditure by UK households in the UK & abroad2 Final consumption expenditure in the UK by UK & foreign households

133
0GS.KS Household final consumption expenditureGoods and services summaryChained volume measures, reference year 2006 - seasonally adjusted £ million
UK NATIONAL1
UK DOMESTIC2
Goods
Semi- Non-Net Durable durable durable
Total tourism Total Total goods goods goods Ser vices
COICOP 0 D SD ND S
ABJR ABTH ZAKW UTIH UTID UTIT UTIL UTIP2005 805 273 12 000 793 253 372 253 85 777 89 258 197 538 421 1002006 819 610 11 387 808 223 383 808 91 701 92 770 199 337 424 4152007 837 417 12 900 824 517 394 629 97 871 95 500 201 258 429 8882008 842 174 12 961 829 213 399 564 100 810 99 223 199 531 429 6492009 813 167 4 163 809 004 390 484 99 713 99 712 191 059 418 520
Percentage chang e , year on previous year
2005 2.3 2.5 3.0 6.3 2.7 1.6 1.92006 1.8 1.9 3.1 6.9 3.9 0.9 0.82007 2.2 2.0 2.8 6.7 2.9 1.0 1.32008 0.6 0.6 1.3 3.0 3.9 −0.9 −0.12009 −3.4 −2.4 −2.3 −1.1 0.5 −4.2 −2.6
Seasonally adjusted
2007 Q1 207 128 3 118 204 010 96 492 23 285 23 638 49 569 107 518Q2 208 687 3 466 205 221 97 575 24 169 23 983 49 423 107 646Q3 210 053 3 105 206 948 99 797 24 822 24 000 50 975 107 151Q4 211 549 3 211 208 338 100 765 25 595 23 879 51 291 107 573
2008 Q1 213 214 3 710 209 504 101 010 26 050 24 214 50 746 108 494Q2 211 525 3 256 208 269 100 386 25 269 24 686 50 431 107 883Q3 210 330 3 337 206 993 99 571 24 894 25 100 49 577 107 422Q4 207 105 2 658 204 447 98 597 24 597 25 223 48 777 105 850
2009 Q1 203 894 1 116 202 778 97 165 23 781 25 259 48 125 105 613Q2 203 052 1 134 201 918 97 290 24 379 24 881 48 030 104 628Q3 202 485 1 002 201 483 97 049 24 708 24 766 47 575 104 434Q4 203 736 911 202 825 98 980 26 845 24 806 47 329 103 845
2010 Q1 203 474 1 307 202 167 99 209 25 973 25 110 48 126 102 958
Percentage chang e , quar ter on previous quarter
2007 Q1 0.5 0.6 0.5 0.4 2.1 −0.1 0.6Q2 0.8 0.6 1.1 3.8 1.5 −0.3 0.1Q3 0.7 0.8 2.3 2.7 0.1 3.1 −0.5Q4 0.7 0.7 1.0 3.1 −0.5 0.6 0.4
2008 Q1 0.8 0.6 0.2 1.8 1.4 −1.1 0.9Q2 −0.8 −0.6 −0.6 −3.0 1.9 −0.6 −0.6Q3 −0.6 −0.6 −0.8 −1.5 1.7 −1.7 −0.4Q4 −1.5 −1.2 −1.0 −1.2 0.5 −1.6 −1.5
2009 Q1 −1.6 −0.8 −1.5 −3.3 0.1 −1.3 −0.2Q2 −0.4 −0.4 0.1 2.5 −1.5 −0.2 −0.9Q3 −0.3 −0.2 −0.2 1.3 −0.5 −0.9 −0.2Q4 0.6 0.7 2.0 8.6 0.2 −0.5 −0.6
2010 Q1 −0.1 −0.3 0.2 −3.2 1.2 1.7 −0.9
Percentage chang e , quar ter on corresponding quarter of previous year
2007 Q1 2.1 2.0 2.0 3.7 3.4 0.5 2.0Q2 1.5 1.3 0.9 4.3 2.8 −1.4 1.6Q3 2.4 2.1 3.4 8.5 2.5 1.4 1.0Q4 2.6 2.7 5.0 10.4 3.1 3.3 0.6
2008 Q1 2.9 2.7 4.7 11.9 2.4 2.4 0.9Q2 1.4 1.5 2.9 4.6 2.9 2.0 0.2Q3 0.1 − −0.2 0.3 4.6 −2.7 0.3Q4 −2.1 −1.9 −2.2 −3.9 5.6 −4.9 −1.6
2009 Q1 −4.4 −3.2 −3.8 −8.7 4.3 −5.2 −2.7Q2 −4.0 −3.0 −3.1 −3.5 0.8 −4.8 −3.0Q3 −3.7 −2.7 −2.5 −0.7 −1.3 −4.0 −2.8Q4 −1.6 −0.8 0.4 9.1 −1.7 −3.0 −1.9
2010 Q1 −0.2 −0.3 2.1 9.2 −0.6 − −2.5
1 Final consumption expenditure by UK households in the UK & abroad2 Final consumption expenditure in the UK by UK & foreign households

134
0GS.DN Household final consumption expenditureGoods and services summaryImplied deflators - not seasonally adjusted 2006 = 100
UK NATIONAL1
UK DOMESTIC2
Goods
Semi- Non-Net Durable durable durable
Total tourism Total Total goods goods goods Ser vices
COICOP 0 D SD ND S
ABQU UTJA UTKU UTKS UTLA UTKW UTKY2005 97.4 97.3 98.8 103.6 100.8 95.6 96.12006 100.0 100.0 100.0 100.0 100.0 100.0 100.02007 102.9 103.0 101.6 97.7 100.0 104.2 104.42008 105.9 106.0 104.4 93.1 98.2 113.3 107.42009 107.3 106.7 105.5 91.1 96.5 117.7 107.8
Percentage chang e , year on previous year
2005 2.3 2.1 0.1 −4.3 −1.8 3.4 4.12006 2.7 2.8 1.2 −3.5 −0.8 4.6 4.12007 2.9 3.0 1.6 −2.3 − 4.2 4.42008 2.9 2.9 2.8 −4.7 −1.8 8.7 2.92009 1.3 0.7 1.1 −2.1 −1.7 3.9 0.4
Not seasonally adjusted
2007 Q1 101.8 102.0 101.4 99.2 99.1 103.4 102.6Q2 103.1 103.3 102.0 99.2 100.7 104.0 104.4Q3 103.1 103.2 100.8 96.9 99.5 103.5 105.2Q4 103.5 103.6 102.0 95.5 100.6 105.6 105.2
2008 Q1 104.4 104.5 102.9 95.8 98.7 108.3 106.1Q2 106.0 106.1 104.9 95.4 99.2 112.2 107.1Q3 106.8 106.8 104.8 93.0 97.8 115.0 108.4Q4 106.6 106.5 105.1 87.7 97.4 117.5 107.9
2009 Q1 106.7 106.2 105.4 89.5 95.0 118.2 106.9Q2 106.8 106.1 105.3 91.8 96.7 116.2 106.9Q3 107.7 106.8 105.2 93.3 96.3 116.6 108.1Q4 108.1 107.6 106.0 90.1 97.6 119.5 109.4
2010 Q1 110.9 110.7 109.3 94.8 97.3 122.6 112.0
Percentage chang e , quar ter on corresponding quarter of previous year
2007 Q1 3.4 3.6 2.6 −0.9 −0.4 5.6 4.4Q2 3.5 3.8 2.2 −0.7 0.2 4.5 5.2Q3 2.6 2.8 0.8 −3.2 0.4 2.9 4.6Q4 2.2 2.2 0.9 −4.4 − 3.6 3.4
2008 Q1 2.6 2.5 1.5 −3.4 −0.4 4.7 3.4Q2 2.8 2.7 2.8 −3.8 −1.5 7.9 2.6Q3 3.6 3.5 4.0 −4.0 −1.7 11.1 3.0Q4 3.0 2.8 3.0 −8.2 −3.2 11.3 2.6
2009 Q1 2.2 1.6 2.4 −6.6 −3.7 9.1 0.8Q2 0.8 − 0.4 −3.8 −2.5 3.6 −0.2Q3 0.8 − 0.4 0.3 −1.5 1.4 −0.3Q4 1.4 1.0 0.9 2.7 0.2 1.7 1.4
2010 Q1 3.9 4.2 3.7 5.9 2.4 3.7 4.8
1 Final consumption expenditure by UK households in the UK & abroad2 Final consumption expenditure in the UK by UK & foreign households

135
0GS.DS Household final consumption expenditureGoods and services summaryImplied deflators - seasonally adjusted 2006 = 100
UK NATIONAL1
UK DOMESTIC2
Goods
Semi- Non-Net Durable durable durable
Total tourism Total Total goods goods goods Ser vices
COICOP 0 D SD ND S
ABJS UTJN UTKV UTKT UTLB UTKX UTKZ2005 97.4 97.3 98.8 103.6 100.8 95.6 96.12006 100.0 100.0 100.0 100.0 100.0 100.0 100.02007 102.9 103.0 101.6 97.7 100.0 104.2 104.42008 105.9 106.0 104.4 93.1 98.2 113.3 107.42009 107.3 106.7 105.5 91.1 96.5 117.7 107.8
Percentage chang e , year on previous year
2005 2.3 2.1 0.1 −4.3 −1.8 3.4 4.12006 2.7 2.8 1.2 −3.5 −0.8 4.6 4.12007 2.9 3.0 1.6 −2.3 − 4.2 4.42008 2.9 2.9 2.8 −4.7 −1.8 8.7 2.92009 1.3 0.7 1.1 −2.1 −1.7 3.9 0.4
Seasonally adjusted
2007 Q1 102.0 102.2 101.4 99.6 99.8 103.0 102.9Q2 102.9 103.1 101.7 98.7 100.4 103.8 104.3Q3 103.0 103.1 101.0 96.5 100.0 103.7 105.0Q4 103.7 103.8 102.1 96.2 100.0 106.1 105.3
2008 Q1 104.6 104.7 102.9 96.2 99.2 108.1 106.3Q2 105.6 105.7 104.4 94.4 98.7 112.2 107.0Q3 106.9 106.9 105.5 92.0 98.1 116.1 108.2Q4 106.7 106.6 104.9 89.4 96.8 116.8 108.2
2009 Q1 106.6 105.9 104.5 89.8 95.6 116.5 107.2Q2 106.5 105.8 105.0 90.4 96.3 116.9 106.6Q3 107.6 107.0 105.9 91.8 96.8 117.9 108.0Q4 108.7 108.1 106.6 92.4 97.3 119.5 109.6
2010 Q1 110.6 110.3 108.4 93.7 98.0 121.8 112.1
Percentage chang e , quar ter on previous quarter
2007 Q1 0.8 0.9 0.7 −0.2 −0.2 1.5 1.0Q2 0.9 0.9 0.3 −0.9 0.6 0.8 1.4Q3 0.1 − −0.7 −2.2 −0.4 −0.1 0.7Q4 0.7 0.7 1.1 −0.3 − 2.3 0.3
2008 Q1 0.9 0.9 0.8 − −0.8 1.9 0.9Q2 1.0 1.0 1.5 −1.9 −0.5 3.8 0.7Q3 1.2 1.1 1.1 −2.5 −0.6 3.5 1.1Q4 −0.2 −0.3 −0.6 −2.8 −1.3 0.6 −
2009 Q1 −0.1 −0.7 −0.4 0.4 −1.2 −0.3 −0.9Q2 −0.1 −0.1 0.5 0.7 0.7 0.3 −0.6Q3 1.0 1.1 0.9 1.5 0.5 0.9 1.3Q4 1.0 1.0 0.7 0.7 0.5 1.4 1.5
2010 Q1 1.7 2.0 1.7 1.4 0.7 1.9 2.3
Percentage chang e , quar ter on corresponding quarter of previous year
2007 Q1 3.2 3.4 2.4 −1.2 −0.4 5.5 4.4Q2 3.5 3.8 2.2 −0.9 0.3 4.6 5.2Q3 2.4 2.5 0.2 −3.3 0.3 2.1 4.6Q4 2.5 2.5 1.4 −3.6 − 4.5 3.3
2008 Q1 2.5 2.4 1.5 −3.4 −0.6 5.0 3.3Q2 2.6 2.5 2.7 −4.4 −1.7 8.1 2.6Q3 3.8 3.7 4.5 −4.7 −1.9 12.0 3.0Q4 2.9 2.7 2.7 −7.1 −3.2 10.1 2.8
2009 Q1 1.9 1.1 1.6 −6.7 −3.6 7.8 0.8Q2 0.9 0.1 0.6 −4.2 −2.4 4.2 −0.4Q3 0.7 0.1 0.4 −0.2 −1.3 1.6 −0.2Q4 1.9 1.4 1.6 3.4 0.5 2.3 1.3
2010 Q1 3.8 4.2 3.7 4.3 2.5 4.5 4.6
1 Final consumption expenditure by UK households in the UK & abroad2 Final consumption expenditure in the UK by UK & foreign households

136
TG.CN Household final consumption expenditureTotal goodsCurrent prices - not seasonally adjusted £ million
Fur nish-ing &
Alcohol Clothing house- Recreat-Food & & & hold Trans- Communi- ion & Miscell-
Total drink tobacco footwear Housing goods Health por t cation culture aneous
COICOP TG 01 02 03 04 05 06 07 08 09 12
UTIE ABZV ADFL LLIP LLIQ LLIR LLIS LLIT LLIU LLIV LLIW2005 367 616 67 138 28 853 42 767 32 195 40 334 6 770 67 080 950 60 351 21 1782006 383 808 69 643 29 286 44 225 36 530 41 771 7 275 68 496 973 62 849 22 7602007 400 779 74 133 29 787 45 397 38 218 43 341 7 610 74 233 967 63 954 23 1392008 417 225 80 316 30 306 46 404 45 002 43 152 7 800 74 515 983 65 750 22 9972009 411 933 83 439 31 131 46 514 44 614 40 489 7 967 67 903 1 043 65 768 23 065
Percentage chang e , year on previous year
2005 3.1 3.0 1.0 2.7 13.7 1.7 −0.1 4.2 6.7 0.7 −0.12006 4.4 3.7 1.5 3.4 13.5 3.6 7.5 2.1 2.4 4.1 7.52007 4.4 6.4 1.7 2.7 4.6 3.8 4.6 8.4 −0.6 1.8 1.72008 4.1 8.3 1.7 2.2 17.8 −0.4 2.5 0.4 1.7 2.8 −0.62009 −1.3 3.9 2.7 0.2 −0.9 −6.2 2.1 −8.9 6.1 − 0.3
Not seasonally adjusted
2007 Q1 96 627 17 616 6 941 9 458 11 814 10 141 1 773 18 868 240 14 956 4 820Q2 95 730 18 422 7 274 10 937 7 791 10 637 1 813 17 905 226 15 376 5 349Q3 96 050 17 975 7 367 11 037 6 882 10 561 1 876 20 072 230 14 698 5 352Q4 112 372 20 120 8 205 13 965 11 731 12 002 2 148 17 388 271 18 924 7 618
2008 Q1 102 461 19 072 6 785 9 758 12 316 10 645 2 008 21 696 235 14 974 4 972Q2 100 906 20 159 7 465 11 077 9 066 10 603 1 992 19 190 223 15 672 5 459Q3 99 325 19 693 7 508 11 267 8 205 10 429 1 846 19 464 239 15 414 5 260Q4 114 533 21 392 8 548 14 302 15 415 11 475 1 954 14 165 286 19 690 7 306
2009 Q1 100 717 20 234 7 161 9 836 15 297 9 720 1 894 16 174 251 15 272 4 878Q2 97 895 21 098 7 665 11 019 9 101 9 708 2 023 16 184 245 15 522 5 330Q3 97 402 20 140 7 682 11 168 7 684 9 863 1 974 18 213 255 15 191 5 232Q4 115 919 21 967 8 623 14 491 12 532 11 198 2 076 17 332 292 19 783 7 625
2010 Q1 106 133 20 883 7 550 10 576 14 777 9 850 1 961 19 918 241 15 190 5 187
Percentage chang e , quar ter on corresponding quarter of previous year
2007 Q1 4.4 5.5 2.9 2.7 12.4 0.8 4.1 3.9 2.1 3.8 0.2Q2 3.2 6.5 0.2 4.3 −1.9 4.8 0.2 4.9 −0.9 1.3 −Q3 3.9 5.1 1.2 4.1 −1.0 4.1 4.5 9.2 −2.1 0.7 0.7Q4 5.9 8.5 2.6 0.3 5.4 5.2 9.2 16.7 −1.5 1.5 4.6
2008 Q1 6.0 8.3 −2.2 3.2 4.2 5.0 13.3 15.0 −2.1 0.1 3.2Q2 5.4 9.4 2.6 1.3 16.4 −0.3 9.9 7.2 −1.3 1.9 2.1Q3 3.4 9.6 1.9 2.1 19.2 −1.2 −1.6 −3.0 3.9 4.9 −1.7Q4 1.9 6.3 4.2 2.4 31.4 −4.4 −9.0 −18.5 5.5 4.0 −4.1
2009 Q1 −1.7 6.1 5.5 0.8 24.2 −8.7 −5.7 −25.5 6.8 2.0 −1.9Q2 −3.0 4.7 2.7 −0.5 0.4 −8.4 1.6 −15.7 9.9 −1.0 −2.4Q3 −1.9 2.3 2.3 −0.9 −6.3 −5.4 6.9 −6.4 6.7 −1.4 −0.5Q4 1.2 2.7 0.9 1.3 −18.7 −2.4 6.2 22.4 2.1 0.5 4.4
2010 Q1 5.4 3.2 5.4 7.5 −3.4 1.3 3.5 23.1 −4.0 −0.5 6.3
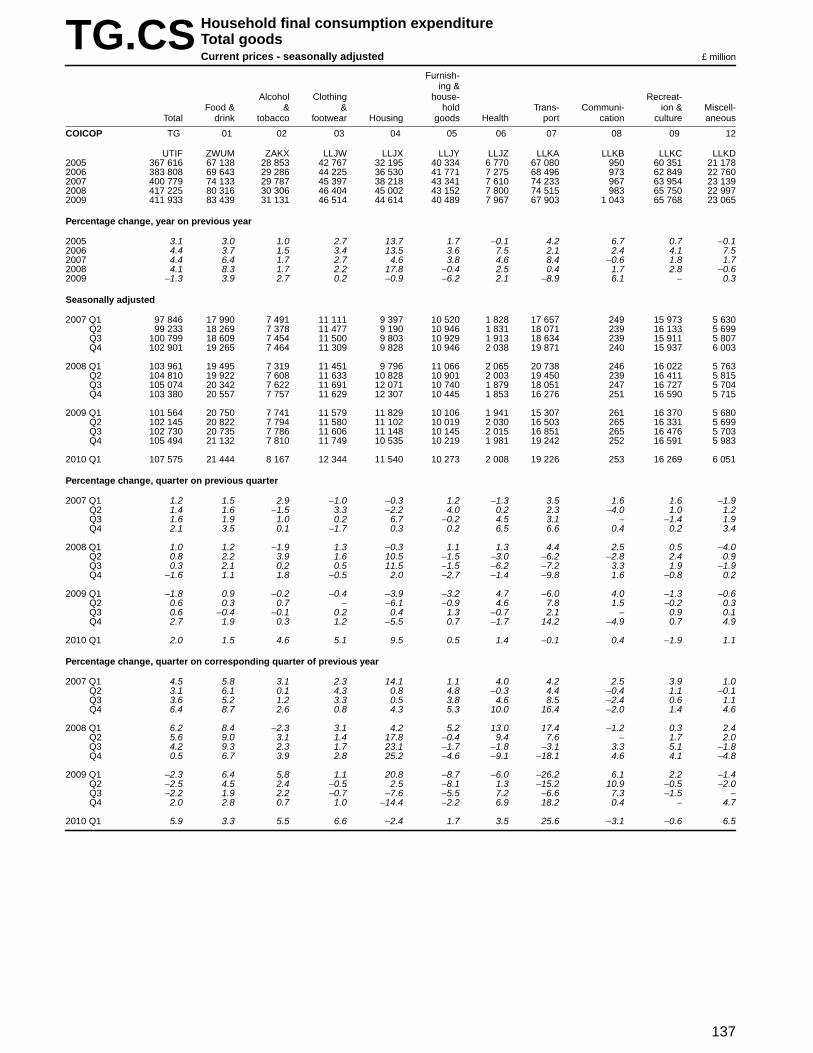
137
TG.CS Household final consumption expenditureTotal goodsCurrent prices - seasonally adjusted £ million
Fur nish-ing &
Alcohol Clothing house- Recreat-Food & & & hold Trans- Communi- ion & Miscell-
Total drink tobacco footwear Housing goods Health por t cation culture aneous
COICOP TG 01 02 03 04 05 06 07 08 09 12
UTIF ZWUM ZAKX LLJW LLJX LLJY LLJZ LLKA LLKB LLKC LLKD2005 367 616 67 138 28 853 42 767 32 195 40 334 6 770 67 080 950 60 351 21 1782006 383 808 69 643 29 286 44 225 36 530 41 771 7 275 68 496 973 62 849 22 7602007 400 779 74 133 29 787 45 397 38 218 43 341 7 610 74 233 967 63 954 23 1392008 417 225 80 316 30 306 46 404 45 002 43 152 7 800 74 515 983 65 750 22 9972009 411 933 83 439 31 131 46 514 44 614 40 489 7 967 67 903 1 043 65 768 23 065
Percentage chang e , year on previous year
2005 3.1 3.0 1.0 2.7 13.7 1.7 −0.1 4.2 6.7 0.7 −0.12006 4.4 3.7 1.5 3.4 13.5 3.6 7.5 2.1 2.4 4.1 7.52007 4.4 6.4 1.7 2.7 4.6 3.8 4.6 8.4 −0.6 1.8 1.72008 4.1 8.3 1.7 2.2 17.8 −0.4 2.5 0.4 1.7 2.8 −0.62009 −1.3 3.9 2.7 0.2 −0.9 −6.2 2.1 −8.9 6.1 − 0.3
Seasonally adjusted
2007 Q1 97 846 17 990 7 491 11 111 9 397 10 520 1 828 17 657 249 15 973 5 630Q2 99 233 18 269 7 378 11 477 9 190 10 946 1 831 18 071 239 16 133 5 699Q3 100 799 18 609 7 454 11 500 9 803 10 929 1 913 18 634 239 15 911 5 807Q4 102 901 19 265 7 464 11 309 9 828 10 946 2 038 19 871 240 15 937 6 003
2008 Q1 103 961 19 495 7 319 11 451 9 796 11 066 2 065 20 738 246 16 022 5 763Q2 104 810 19 922 7 608 11 633 10 828 10 901 2 003 19 450 239 16 411 5 815Q3 105 074 20 342 7 622 11 691 12 071 10 740 1 879 18 051 247 16 727 5 704Q4 103 380 20 557 7 757 11 629 12 307 10 445 1 853 16 276 251 16 590 5 715
2009 Q1 101 564 20 750 7 741 11 579 11 829 10 106 1 941 15 307 261 16 370 5 680Q2 102 145 20 822 7 794 11 580 11 102 10 019 2 030 16 503 265 16 331 5 699Q3 102 730 20 735 7 786 11 606 11 148 10 145 2 015 16 851 265 16 476 5 703Q4 105 494 21 132 7 810 11 749 10 535 10 219 1 981 19 242 252 16 591 5 983
2010 Q1 107 575 21 444 8 167 12 344 11 540 10 273 2 008 19 226 253 16 269 6 051
Percentage chang e , quar ter on previous quarter
2007 Q1 1.2 1.5 2.9 −1.0 −0.3 1.2 −1.3 3.5 1.6 1.6 −1.9Q2 1.4 1.6 −1.5 3.3 −2.2 4.0 0.2 2.3 −4.0 1.0 1.2Q3 1.6 1.9 1.0 0.2 6.7 −0.2 4.5 3.1 − −1.4 1.9Q4 2.1 3.5 0.1 −1.7 0.3 0.2 6.5 6.6 0.4 0.2 3.4
2008 Q1 1.0 1.2 −1.9 1.3 −0.3 1.1 1.3 4.4 2.5 0.5 −4.0Q2 0.8 2.2 3.9 1.6 10.5 −1.5 −3.0 −6.2 −2.8 2.4 0.9Q3 0.3 2.1 0.2 0.5 11.5 −1.5 −6.2 −7.2 3.3 1.9 −1.9Q4 −1.6 1.1 1.8 −0.5 2.0 −2.7 −1.4 −9.8 1.6 −0.8 0.2
2009 Q1 −1.8 0.9 −0.2 −0.4 −3.9 −3.2 4.7 −6.0 4.0 −1.3 −0.6Q2 0.6 0.3 0.7 − −6.1 −0.9 4.6 7.8 1.5 −0.2 0.3Q3 0.6 −0.4 −0.1 0.2 0.4 1.3 −0.7 2.1 − 0.9 0.1Q4 2.7 1.9 0.3 1.2 −5.5 0.7 −1.7 14.2 −4.9 0.7 4.9
2010 Q1 2.0 1.5 4.6 5.1 9.5 0.5 1.4 −0.1 0.4 −1.9 1.1
Percentage chang e , quar ter on corresponding quarter of previous year
2007 Q1 4.5 5.8 3.1 2.3 14.1 1.1 4.0 4.2 2.5 3.9 1.0Q2 3.1 6.1 0.1 4.3 0.8 4.8 −0.3 4.4 −0.4 1.1 −0.1Q3 3.6 5.2 1.2 3.3 0.5 3.8 4.6 8.5 −2.4 0.6 1.1Q4 6.4 8.7 2.6 0.8 4.3 5.3 10.0 16.4 −2.0 1.4 4.6
2008 Q1 6.2 8.4 −2.3 3.1 4.2 5.2 13.0 17.4 −1.2 0.3 2.4Q2 5.6 9.0 3.1 1.4 17.8 −0.4 9.4 7.6 − 1.7 2.0Q3 4.2 9.3 2.3 1.7 23.1 −1.7 −1.8 −3.1 3.3 5.1 −1.8Q4 0.5 6.7 3.9 2.8 25.2 −4.6 −9.1 −18.1 4.6 4.1 −4.8
2009 Q1 −2.3 6.4 5.8 1.1 20.8 −8.7 −6.0 −26.2 6.1 2.2 −1.4Q2 −2.5 4.5 2.4 −0.5 2.5 −8.1 1.3 −15.2 10.9 −0.5 −2.0Q3 −2.2 1.9 2.2 −0.7 −7.6 −5.5 7.2 −6.6 7.3 −1.5 −Q4 2.0 2.8 0.7 1.0 −14.4 −2.2 6.9 18.2 0.4 − 4.7
2010 Q1 5.9 3.3 5.5 6.6 −2.4 1.7 3.5 25.6 −3.1 −0.6 6.5

138
TG.KN Household final consumption expenditureTotal goodsChained volume measures, reference year 2006 - not seasonally adjusted £ million
Fur nish-ing &
Alcohol Clothing house- Recreat-Food & & & hold Trans- Communi- ion & Miscell-
Total drink tobacco footwear Housing goods Health por t cation culture aneous
COICOP TG 01 02 03 04 05 06 07 08 09 12
UTIG ADIP ADIS LLMK LLML LLMM LLMN LLMO LLMP LLMQ LLMR2005 372 253 68 714 29 271 42 362 37 868 40 604 6 739 67 337 883 57 920 21 0682006 383 808 69 643 29 286 44 225 36 530 41 771 7 275 68 496 973 62 849 22 7602007 394 629 70 865 29 097 45 840 35 301 42 277 7 512 73 265 1 194 66 833 22 4452008 399 564 70 563 28 798 48 779 35 977 40 916 7 568 70 392 1 443 73 307 21 8212009 390 484 69 590 27 966 51 195 33 232 36 751 7 620 65 508 1 648 76 578 20 396
Percentage chang e , year on previous year
2005 3.0 1.5 −0.2 5.2 3.5 1.6 0.1 3.5 17.3 6.2 −0.12006 3.1 1.4 0.1 4.4 −3.5 2.9 8.0 1.7 10.2 8.5 8.02007 2.8 1.8 −0.6 3.7 −3.4 1.2 3.3 7.0 22.7 6.3 −1.42008 1.3 −0.4 −1.0 6.4 1.9 −3.2 0.7 −3.9 20.9 9.7 −2.82009 −2.3 −1.4 −2.9 5.0 −7.6 −10.2 0.7 −6.9 14.2 4.5 −6.5
Not seasonally adjusted
2007 Q1 95 294 17 160 6 808 9 685 10 502 10 051 1 760 19 060 275 15 193 4 800Q2 93 843 17 670 7 078 10 885 7 188 10 284 1 790 17 602 270 15 879 5 197Q3 95 289 17 302 7 156 11 247 6 497 10 364 1 853 19 832 291 15 550 5 197Q4 110 203 18 733 8 055 14 023 11 114 11 578 2 109 16 771 358 20 211 7 251
2008 Q1 99 618 17 565 6 811 10 182 10 893 10 306 1 960 20 598 326 16 203 4 774Q2 96 179 17 945 7 051 11 473 7 661 9 987 1 933 17 588 326 17 038 5 177Q3 94 744 16 970 7 044 11 938 6 558 9 857 1 784 18 104 351 17 174 4 964Q4 109 023 18 083 7 892 15 186 10 865 10 766 1 891 14 102 440 22 892 6 906
2009 Q1 95 560 16 853 6 540 10 989 10 919 9 081 1 827 16 878 393 17 595 4 485Q2 92 964 17 542 6 883 12 027 6 999 8 797 1 938 15 886 385 17 742 4 765Q3 92 564 16 932 6 848 12 404 5 977 8 942 1 879 16 944 401 17 628 4 609Q4 109 396 18 263 7 695 15 775 9 337 9 931 1 976 15 800 469 23 613 6 537
2010 Q1 97 079 17 122 6 529 11 627 10 947 8 719 1 857 17 767 383 17 722 4 406
Percentage chang e , quar ter on corresponding quarter of previous year
2007 Q1 1.8 0.9 −0.8 3.8 −7.5 −1.3 3.5 4.6 26.1 6.8 −0.8Q2 1.0 1.1 −2.3 4.5 −11.2 1.0 −1.4 4.8 17.4 4.8 −4.4Q3 3.2 1.7 −1.0 4.9 −6.3 2.1 2.9 8.9 21.2 6.1 −0.4Q4 5.1 3.3 1.3 1.9 9.5 3.0 7.7 9.8 25.6 7.4 −0.3
2008 Q1 4.5 2.4 − 5.1 3.7 2.5 11.4 8.1 18.5 6.6 −0.5Q2 2.5 1.6 −0.4 5.4 6.6 −2.9 8.0 −0.1 20.7 7.3 −0.4Q3 −0.6 −1.9 −1.6 6.1 0.9 −4.9 −3.7 −8.7 20.6 10.4 −4.5Q4 −1.1 −3.5 −2.0 8.3 −2.2 −7.0 −10.3 −15.9 22.9 13.3 −4.8
2009 Q1 −4.1 −4.1 −4.0 7.9 0.2 −11.9 −6.8 −18.1 20.6 8.6 −6.1Q2 −3.3 −2.2 −2.4 4.8 −8.6 −11.9 0.3 −9.7 18.1 4.1 −8.0Q3 −2.3 −0.2 −2.8 3.9 −8.9 −9.3 5.3 −6.4 14.2 2.6 −7.2Q4 0.3 1.0 −2.5 3.9 −14.1 −7.8 4.5 12.0 6.6 3.1 −5.3
2010 Q1 1.6 1.6 −0.2 5.8 0.3 −4.0 1.6 5.3 −2.5 0.7 −1.8

139
TG.KS Household final consumption expenditureTotal goodsChained volume measures, reference year 2006 - seasonally adjusted £ million
Fur nish-ing &
Alcohol Clothing house- Recreat-Food & & & hold Trans- Communi- ion & Miscell-
Total drink tobacco footwear Housing goods Health por t cation culture aneous
COICOP TG 01 02 03 04 05 06 07 08 09 12
UTIH ZWUN ZAKY LLLD LLLE LLLF LLLG LLLH LLLI LLLJ LLLK2005 372 253 68 714 29 271 42 362 37 868 40 604 6 739 67 337 883 57 920 21 0682006 383 808 69 643 29 286 44 225 36 530 41 771 7 275 68 496 973 62 849 22 7602007 394 629 70 865 29 097 45 840 35 301 42 277 7 512 73 265 1 194 66 833 22 4452008 399 564 70 563 28 798 48 779 35 977 40 916 7 568 70 392 1 443 73 307 21 8212009 390 484 69 590 27 966 51 195 33 232 36 751 7 620 65 508 1 648 76 578 20 396
Percentage chang e , year on previous year
2005 3.0 1.5 −0.2 5.2 3.5 1.6 0.1 3.5 17.3 6.2 −0.12006 3.1 1.4 0.1 4.4 −3.5 2.9 8.0 1.7 10.2 8.5 8.02007 2.8 1.8 −0.6 3.7 −3.4 1.2 3.3 7.0 22.7 6.3 −1.42008 1.3 −0.4 −1.0 6.4 1.9 −3.2 0.7 −3.9 20.9 9.7 −2.82009 −2.3 −1.4 −2.9 5.0 −7.6 −10.2 0.7 −6.9 14.2 4.5 −6.5
Seasonally adjusted
2007 Q1 96 492 17 537 7 292 11 221 8 445 10 366 1 810 17 713 283 16 218 5 607Q2 97 575 17 555 7 235 11 488 8 464 10 634 1 808 17 820 289 16 751 5 531Q3 99 797 17 835 7 273 11 629 9 103 10 668 1 892 18 578 304 16 878 5 637Q4 100 765 17 938 7 297 11 502 9 289 10 609 2 002 19 154 318 16 986 5 670
2008 Q1 101 010 17 985 7 303 11 803 8 686 10 657 2 012 19 335 337 17 344 5 548Q2 100 386 17 759 7 209 12 150 9 129 10 329 1 945 17 899 350 18 084 5 532Q3 99 571 17 440 7 146 12 325 9 279 10 105 1 818 16 955 365 18 744 5 394Q4 98 597 17 379 7 140 12 501 8 883 9 825 1 793 16 203 391 19 135 5 347
2009 Q1 97 165 17 341 6 994 12 759 8 616 9 400 1 869 15 706 407 18 835 5 238Q2 97 290 17 315 7 051 12 718 8 354 9 135 1 947 16 280 413 18 978 5 099Q3 97 049 17 352 6 971 12 799 8 304 9 140 1 919 15 896 418 19 248 5 002Q4 98 980 17 582 6 950 12 919 7 958 9 076 1 885 17 626 410 19 517 5 057
2010 Q1 99 209 17 627 7 012 13 379 8 626 9 053 1 901 17 123 400 18 928 5 160
Percentage chang e , quar ter on previous quarter
2007 Q1 0.5 1.0 1.0 − −4.3 0.7 −2.1 2.1 10.1 2.3 −1.7Q2 1.1 0.1 −0.8 2.4 0.2 2.6 −0.1 0.6 2.1 3.3 −1.4Q3 2.3 1.6 0.5 1.2 7.5 0.3 4.6 4.3 5.2 0.8 1.9Q4 1.0 0.6 0.3 −1.1 2.0 −0.6 5.8 3.1 4.6 0.6 0.6
2008 Q1 0.2 0.3 0.1 2.6 −6.5 0.5 0.5 0.9 6.0 2.1 −2.2Q2 −0.6 −1.3 −1.3 2.9 5.1 −3.1 −3.3 −7.4 3.9 4.3 −0.3Q3 −0.8 −1.8 −0.9 1.4 1.6 −2.2 −6.5 −5.3 4.3 3.6 −2.5Q4 −1.0 −0.3 −0.1 1.4 −4.3 −2.8 −1.4 −4.4 7.1 2.1 −0.9
2009 Q1 −1.5 −0.2 −2.0 2.1 −3.0 −4.3 4.2 −3.1 4.1 −1.6 −2.0Q2 0.1 −0.1 0.8 −0.3 −3.0 −2.8 4.2 3.7 1.5 0.8 −2.7Q3 −0.2 0.2 −1.1 0.6 −0.6 0.1 −1.4 −2.4 1.2 1.4 −1.9Q4 2.0 1.3 −0.3 0.9 −4.2 −0.7 −1.8 10.9 −1.9 1.4 1.1
2010 Q1 0.2 0.3 0.9 3.6 8.4 −0.3 0.8 −2.9 −2.4 −3.0 2.0
Percentage chang e , quar ter on corresponding quarter of previous year
2007 Q1 2.0 1.2 −0.5 3.3 −6.7 −0.9 3.5 4.7 28.1 7.2 −0.1Q2 0.9 0.7 −2.1 4.5 −9.4 1.0 −1.9 4.0 18.0 5.0 −4.7Q3 3.4 1.8 −1.1 4.2 −2.3 1.7 3.1 8.7 21.6 6.1 −0.1Q4 5.0 3.3 1.1 2.5 5.3 3.1 8.3 10.4 23.7 7.1 −0.6
2008 Q1 4.7 2.6 0.2 5.2 2.9 2.8 11.2 9.2 19.1 6.9 −1.1Q2 2.9 1.2 −0.4 5.8 7.9 −2.9 7.6 0.4 21.1 8.0 −Q3 −0.2 −2.2 −1.7 6.0 1.9 −5.3 −3.9 −8.7 20.1 11.1 −4.3Q4 −2.2 −3.1 −2.2 8.7 −4.4 −7.4 −10.4 −15.4 23.0 12.7 −5.7
2009 Q1 −3.8 −3.6 −4.2 8.1 −0.8 −11.8 −7.1 −18.8 20.8 8.6 −5.6Q2 −3.1 −2.5 −2.2 4.7 −8.5 −11.6 0.1 −9.0 18.0 4.9 −7.8Q3 −2.5 −0.5 −2.4 3.8 −10.5 −9.5 5.6 −6.2 14.5 2.7 −7.3Q4 0.4 1.2 −2.7 3.3 −10.4 −7.6 5.1 8.8 4.9 2.0 −5.4
2010 Q1 2.1 1.6 0.3 4.9 0.1 −3.7 1.7 9.0 −1.7 0.5 −1.5

140
TG.DN Household final consumption expenditureTotal goodsImplied deflators - not seasonally adjusted 2006 = 100
Fur nish-ing &
Alcohol Clothing house- Recreat-Food & & & hold Trans- Communi- ion & Miscell-
Total drink tobacco footwear Housing goods Health por t cation culture aneous
COICOP TG 01 02 03 04 05 06 07 08 09 12
UTKU UTJB UTJC LLNR LLNS LLNT LLNU LLNV LLNW LLNX LLNY2005 98.8 97.7 98.6 101.0 85.0 99.3 100.5 99.6 107.6 104.2 100.52006 100.0 100.0 100.0 100.0 100.0 100.0 100.0 100.0 100.0 100.0 100.02007 101.6 104.6 102.4 99.0 108.3 102.5 101.3 101.3 81.0 95.7 103.12008 104.4 113.8 105.2 95.1 125.1 105.5 103.1 105.9 68.1 89.7 105.42009 105.5 119.9 111.3 90.9 134.3 110.2 104.6 103.7 63.3 85.9 113.1
Percentage chang e , year on previous year
2005 0.1 1.5 1.2 −2.3 9.8 0.1 −0.1 0.7 −9.0 −5.2 −2006 1.2 2.4 1.4 −1.0 17.6 0.7 −0.5 0.4 −7.1 −4.0 −0.52007 1.6 4.6 2.4 −1.0 8.3 2.5 1.3 1.3 −19.0 −4.3 3.12008 2.8 8.8 2.7 −3.9 15.5 2.9 1.8 4.5 −15.9 −6.3 2.22009 1.1 5.4 5.8 −4.4 7.4 4.5 1.5 −2.1 −7.0 −4.2 7.3
Not seasonally adjusted
2007 Q1 101.4 102.7 102.0 97.7 112.5 100.9 100.7 99.0 87.3 98.4 100.4Q2 102.0 104.3 102.8 100.5 108.4 103.4 101.3 101.7 83.7 96.8 102.9Q3 100.8 103.9 102.9 98.1 105.9 101.9 101.2 101.2 79.0 94.5 103.0Q4 102.0 107.4 101.9 99.6 105.6 103.7 101.8 103.7 75.7 93.6 105.1
2008 Q1 102.9 108.6 99.6 95.8 113.1 103.3 102.4 105.3 72.1 92.4 104.1Q2 104.9 112.3 105.9 96.5 118.3 106.2 103.1 109.1 68.4 92.0 105.4Q3 104.8 116.0 106.6 94.4 125.1 105.8 103.5 107.5 68.1 89.8 106.0Q4 105.1 118.3 108.3 94.2 141.9 106.6 103.3 100.4 65.0 86.0 105.8
2009 Q1 105.4 120.1 109.5 89.5 140.1 107.0 103.7 95.8 63.9 86.8 108.8Q2 105.3 120.3 111.4 91.6 130.0 110.4 104.4 101.9 63.6 87.5 111.9Q3 105.2 118.9 112.2 90.0 128.6 110.3 105.1 107.5 63.6 86.2 113.5Q4 106.0 120.3 112.1 91.9 134.2 112.8 105.1 109.7 62.3 83.8 116.6
2010 Q1 109.3 122.0 115.6 91.0 135.0 113.0 105.6 112.1 62.9 85.7 117.7
Percentage chang e , quar ter on corresponding quarter of previous year
2007 Q1 2.6 4.6 3.8 −1.0 21.5 2.2 0.5 −0.6 −19.0 −2.9 0.9Q2 2.2 5.4 2.6 −0.2 10.5 3.7 1.7 − −15.5 −3.4 4.6Q3 0.8 3.4 2.1 −0.7 5.6 2.0 1.4 0.3 −19.3 −5.1 1.1Q4 0.9 5.1 1.3 −1.6 −3.6 2.2 1.4 6.4 −21.6 −5.5 4.9
2008 Q1 1.5 5.7 −2.4 −1.9 0.5 2.4 1.7 6.4 −17.4 −6.1 3.7Q2 2.8 7.7 3.0 −4.0 9.1 2.7 1.8 7.3 −18.3 −5.0 2.4Q3 4.0 11.6 3.6 −3.8 18.1 3.8 2.3 6.2 −13.8 −5.0 2.9Q4 3.0 10.1 6.3 −5.4 34.4 2.8 1.5 −3.2 −14.1 −8.1 0.7
2009 Q1 2.4 10.6 9.9 −6.6 23.9 3.6 1.3 −9.0 −11.4 −6.1 4.5Q2 0.4 7.1 5.2 −5.1 9.9 4.0 1.3 −6.6 −7.0 −4.9 6.2Q3 0.4 2.5 5.3 −4.7 2.8 4.3 1.5 − −6.6 −4.0 7.1Q4 0.9 1.7 3.5 −2.4 −5.4 5.8 1.7 9.3 −4.2 −2.6 10.2
2010 Q1 3.7 1.6 5.6 1.7 −3.6 5.6 1.8 17.0 −1.6 −1.3 8.2
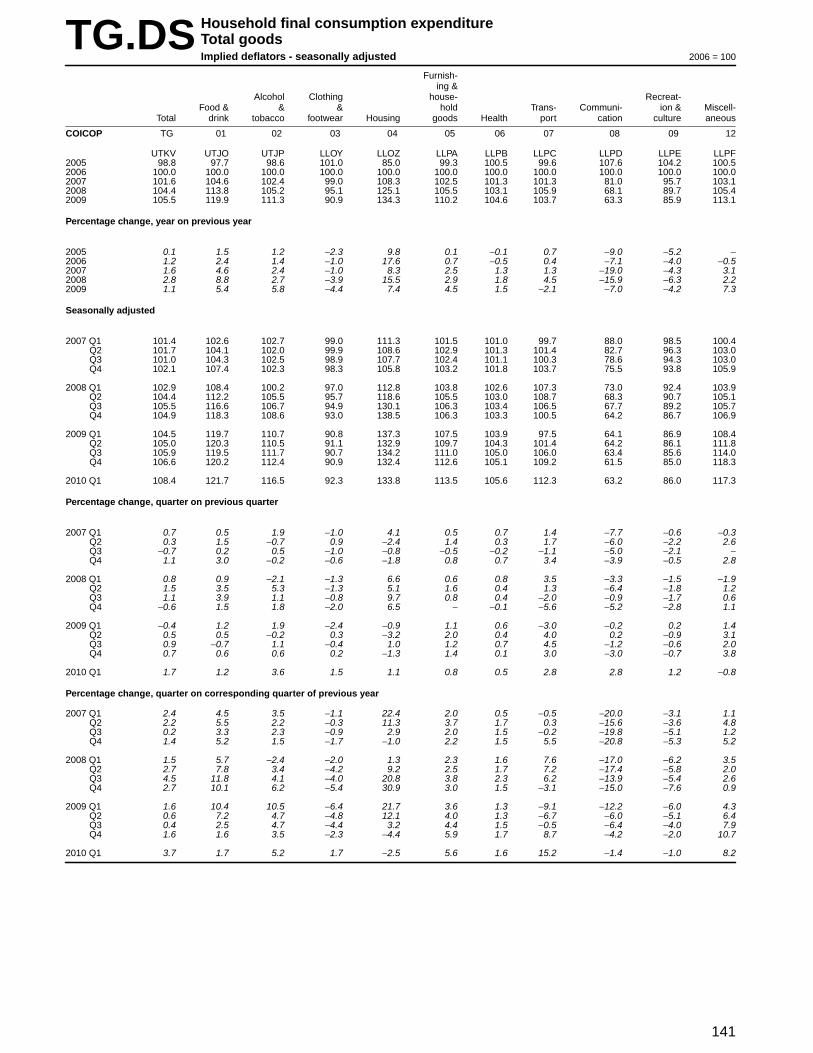
141
TG.DS Household final consumption expenditureTotal goodsImplied deflators - seasonally adjusted 2006 = 100
Fur nish-ing &
Alcohol Clothing house- Recreat-Food & & & hold Trans- Communi- ion & Miscell-
Total drink tobacco footwear Housing goods Health por t cation culture aneous
COICOP TG 01 02 03 04 05 06 07 08 09 12
UTKV UTJO UTJP LLOY LLOZ LLPA LLPB LLPC LLPD LLPE LLPF2005 98.8 97.7 98.6 101.0 85.0 99.3 100.5 99.6 107.6 104.2 100.52006 100.0 100.0 100.0 100.0 100.0 100.0 100.0 100.0 100.0 100.0 100.02007 101.6 104.6 102.4 99.0 108.3 102.5 101.3 101.3 81.0 95.7 103.12008 104.4 113.8 105.2 95.1 125.1 105.5 103.1 105.9 68.1 89.7 105.42009 105.5 119.9 111.3 90.9 134.3 110.2 104.6 103.7 63.3 85.9 113.1
Percentage chang e , year on previous year
2005 0.1 1.5 1.2 −2.3 9.8 0.1 −0.1 0.7 −9.0 −5.2 −2006 1.2 2.4 1.4 −1.0 17.6 0.7 −0.5 0.4 −7.1 −4.0 −0.52007 1.6 4.6 2.4 −1.0 8.3 2.5 1.3 1.3 −19.0 −4.3 3.12008 2.8 8.8 2.7 −3.9 15.5 2.9 1.8 4.5 −15.9 −6.3 2.22009 1.1 5.4 5.8 −4.4 7.4 4.5 1.5 −2.1 −7.0 −4.2 7.3
Seasonally adjusted
2007 Q1 101.4 102.6 102.7 99.0 111.3 101.5 101.0 99.7 88.0 98.5 100.4Q2 101.7 104.1 102.0 99.9 108.6 102.9 101.3 101.4 82.7 96.3 103.0Q3 101.0 104.3 102.5 98.9 107.7 102.4 101.1 100.3 78.6 94.3 103.0Q4 102.1 107.4 102.3 98.3 105.8 103.2 101.8 103.7 75.5 93.8 105.9
2008 Q1 102.9 108.4 100.2 97.0 112.8 103.8 102.6 107.3 73.0 92.4 103.9Q2 104.4 112.2 105.5 95.7 118.6 105.5 103.0 108.7 68.3 90.7 105.1Q3 105.5 116.6 106.7 94.9 130.1 106.3 103.4 106.5 67.7 89.2 105.7Q4 104.9 118.3 108.6 93.0 138.5 106.3 103.3 100.5 64.2 86.7 106.9
2009 Q1 104.5 119.7 110.7 90.8 137.3 107.5 103.9 97.5 64.1 86.9 108.4Q2 105.0 120.3 110.5 91.1 132.9 109.7 104.3 101.4 64.2 86.1 111.8Q3 105.9 119.5 111.7 90.7 134.2 111.0 105.0 106.0 63.4 85.6 114.0Q4 106.6 120.2 112.4 90.9 132.4 112.6 105.1 109.2 61.5 85.0 118.3
2010 Q1 108.4 121.7 116.5 92.3 133.8 113.5 105.6 112.3 63.2 86.0 117.3
Percentage chang e , quar ter on previous quarter
2007 Q1 0.7 0.5 1.9 −1.0 4.1 0.5 0.7 1.4 −7.7 −0.6 −0.3Q2 0.3 1.5 −0.7 0.9 −2.4 1.4 0.3 1.7 −6.0 −2.2 2.6Q3 −0.7 0.2 0.5 −1.0 −0.8 −0.5 −0.2 −1.1 −5.0 −2.1 −Q4 1.1 3.0 −0.2 −0.6 −1.8 0.8 0.7 3.4 −3.9 −0.5 2.8
2008 Q1 0.8 0.9 −2.1 −1.3 6.6 0.6 0.8 3.5 −3.3 −1.5 −1.9Q2 1.5 3.5 5.3 −1.3 5.1 1.6 0.4 1.3 −6.4 −1.8 1.2Q3 1.1 3.9 1.1 −0.8 9.7 0.8 0.4 −2.0 −0.9 −1.7 0.6Q4 −0.6 1.5 1.8 −2.0 6.5 − −0.1 −5.6 −5.2 −2.8 1.1
2009 Q1 −0.4 1.2 1.9 −2.4 −0.9 1.1 0.6 −3.0 −0.2 0.2 1.4Q2 0.5 0.5 −0.2 0.3 −3.2 2.0 0.4 4.0 0.2 −0.9 3.1Q3 0.9 −0.7 1.1 −0.4 1.0 1.2 0.7 4.5 −1.2 −0.6 2.0Q4 0.7 0.6 0.6 0.2 −1.3 1.4 0.1 3.0 −3.0 −0.7 3.8
2010 Q1 1.7 1.2 3.6 1.5 1.1 0.8 0.5 2.8 2.8 1.2 −0.8
Percentage chang e , quar ter on corresponding quarter of previous year
2007 Q1 2.4 4.5 3.5 −1.1 22.4 2.0 0.5 −0.5 −20.0 −3.1 1.1Q2 2.2 5.5 2.2 −0.3 11.3 3.7 1.7 0.3 −15.6 −3.6 4.8Q3 0.2 3.3 2.3 −0.9 2.9 2.0 1.5 −0.2 −19.8 −5.1 1.2Q4 1.4 5.2 1.5 −1.7 −1.0 2.2 1.5 5.5 −20.8 −5.3 5.2
2008 Q1 1.5 5.7 −2.4 −2.0 1.3 2.3 1.6 7.6 −17.0 −6.2 3.5Q2 2.7 7.8 3.4 −4.2 9.2 2.5 1.7 7.2 −17.4 −5.8 2.0Q3 4.5 11.8 4.1 −4.0 20.8 3.8 2.3 6.2 −13.9 −5.4 2.6Q4 2.7 10.1 6.2 −5.4 30.9 3.0 1.5 −3.1 −15.0 −7.6 0.9
2009 Q1 1.6 10.4 10.5 −6.4 21.7 3.6 1.3 −9.1 −12.2 −6.0 4.3Q2 0.6 7.2 4.7 −4.8 12.1 4.0 1.3 −6.7 −6.0 −5.1 6.4Q3 0.4 2.5 4.7 −4.4 3.2 4.4 1.5 −0.5 −6.4 −4.0 7.9Q4 1.6 1.6 3.5 −2.3 −4.4 5.9 1.7 8.7 −4.2 −2.0 10.7
2010 Q1 3.7 1.7 5.2 1.7 −2.5 5.6 1.6 15.2 −1.4 −1.0 8.2

142
DG.CN Household final consumption expenditureDurable goodsCurrent prices - not seasonally adjusted £ million
Fur nishing & household goods Health Transpor t
Therapeut- Purchase of vehiclesFur niture Car pets & ic
& other Major Major appliancesfur nishin- floor household tools & & Motor
Total Total gs coverings appliances equipment Total equipment Total Total Motor cars cycles Bicycles
COICOP D 05 05.1.1 05.1.2 05.3.1 05.5.1 06 06.1.3 07 07.1 07.1.1 07.1.2 07.1.3
UTIA LLIJ ADVM ADVN ADVP ADVS LLIK UUPV LLIL ADGU ADVZ ADWA ADWB2005 88 851 22 363 12 635 4 124 5 115 489 2 400 2 400 38 562 38 562 36 721 731 1 1102006 91 701 22 876 12 940 4 265 5 074 597 2 706 2 706 38 810 38 810 37 033 682 1 0952007 95 611 23 669 13 284 4 720 4 962 703 2 942 2 942 42 047 42 047 40 143 770 1 1342008 93 808 23 612 13 158 4 396 5 290 768 2 897 2 897 39 722 39 722 37 674 780 1 2682009 90 860 21 941 12 601 3 941 4 917 482 3 058 3 058 36 873 36 873 34 735 708 1 430
Percentage chang e , year on previous year
2005 1.6 2.1 −0.3 0.3 8.9 12.4 −4.5 −4.5 0.3 0.3 − 7.3 4.82006 3.2 2.3 2.4 3.4 −0.8 22.1 12.8 12.8 0.6 0.6 0.8 −6.7 −1.42007 4.3 3.5 2.7 10.7 −2.2 17.8 8.7 8.7 8.3 8.3 8.4 12.9 3.62008 −1.9 −0.2 −0.9 −6.9 6.6 9.2 −1.5 −1.5 −5.5 −5.5 −6.2 1.3 11.82009 −3.1 −7.1 −4.2 −10.4 −7.1 −37.2 5.6 5.6 −7.2 −7.2 −7.8 −9.2 12.8
Not seasonally adjusted
2007 Q1 24 276 5 497 3 180 1 109 1 087 121 670 670 11 603 11 603 11 162 170 271Q2 23 016 5 852 3 250 1 141 1 235 226 705 705 10 121 10 121 9 589 251 281Q3 24 425 5 828 3 293 1 204 1 191 140 752 752 11 616 11 616 11 131 223 262Q4 23 894 6 492 3 561 1 266 1 449 216 815 815 8 707 8 707 8 261 126 320
2008 Q1 25 985 5 956 3 266 1 185 1 301 204 785 785 12 764 12 764 12 293 182 289Q2 22 963 5 752 3 238 1 116 1 218 180 755 755 10 081 10 081 9 529 243 309Q3 23 312 5 680 3 163 1 074 1 249 194 681 681 10 479 10 479 9 962 219 298Q4 21 548 6 224 3 491 1 021 1 522 190 676 676 6 398 6 398 5 890 136 372
2009 Q1 22 073 5 259 2 939 955 1 254 111 781 781 9 437 9 437 8 932 168 337Q2 21 046 5 198 2 993 960 1 103 142 805 805 8 430 8 430 7 840 236 354Q3 22 968 5 438 3 134 1 010 1 178 116 740 740 10 002 10 002 9 480 191 331Q4 24 773 6 046 3 535 1 016 1 382 113 732 732 9 004 9 004 8 483 113 408
2010 Q1 24 838 5 432 3 077 958 1 293 104 760 760 11 681 11 681 11 210 127 344
Percentage chang e , quar ter on corresponding quarter of previous year
2007 Q1 2.3 −0.1 0.6 6.7 −9.3 14.2 − − 4.8 4.8 4.7 17.2 3.8Q2 3.9 7.4 5.9 10.0 3.1 55.9 3.2 3.2 5.6 5.6 5.6 8.7 2.9Q3 5.7 5.9 6.0 12.9 2.2 −14.6 9.5 9.5 10.3 10.3 10.4 14.4 3.1Q4 5.2 1.1 −1.1 12.7 −4.2 18.7 22.4 22.4 14.1 14.1 14.6 13.5 4.2
2008 Q1 7.0 8.4 2.7 6.9 19.7 68.6 17.2 17.2 10.0 10.0 10.1 7.1 6.6Q2 −0.2 −1.7 −0.4 −2.2 −1.4 −20.4 7.1 7.1 −0.4 −0.4 −0.6 −3.2 10.0Q3 −4.6 −2.5 −3.9 −10.8 4.9 38.6 −9.4 −9.4 −9.8 −9.8 −10.5 −1.8 13.7Q4 −9.8 −4.1 −2.0 −19.4 5.0 −12.0 −17.1 −17.1 −26.5 −26.5 −28.7 7.9 16.3
2009 Q1 −15.1 −11.7 −10.0 −19.4 −3.6 −45.6 −0.5 −0.5 −26.1 −26.1 −27.3 −7.7 16.6Q2 −8.3 −9.6 −7.6 −14.0 −9.4 −21.1 6.6 6.6 −16.4 −16.4 −17.7 −2.9 14.6Q3 −1.5 −4.3 −0.9 −6.0 −5.7 −40.2 8.7 8.7 −4.6 −4.6 −4.8 −12.8 11.1Q4 15.0 −2.9 1.3 −0.5 −9.2 −40.5 8.3 8.3 40.7 40.7 44.0 −16.9 9.7
2010 Q1 12.5 3.3 4.7 0.3 3.1 −6.3 −2.7 −2.7 23.8 23.8 25.5 −24.4 2.1

143
DG.CN Household final consumption expenditureDurable goodsCurrent prices - not seasonally adjustedcontinued £ million
Communication Recreation and culture Miscellaneous
Musicalinstr uments &
Photo & Major majorTelephone & cinema equip Infor mation durables for durables for Jeweller y,
telefax Audio visual & optical processing outdoor indoor clocks &Total equipment Total equipment instr uments equipment recreation recreation Total watches
COICOP 08 08.2 09 09.1.1 09.1.2 09.1.3 09.2.1 09.2.2 12 12.3.1
LLIM ADWO LLIN ADWQ ADWR ADWS ADWV ADWW LLIO ADXU2005 950 950 19 954 5 107 4 207 4 907 5 496 237 4 622 4 6222006 973 973 21 240 5 635 4 232 5 164 5 848 361 5 096 5 0962007 967 967 21 293 5 946 3 413 5 619 6 060 255 4 693 4 6932008 983 983 22 161 5 267 4 339 5 656 6 790 109 4 433 4 4332009 1 043 1 043 22 645 5 304 4 546 5 855 6 737 203 5 300 5 300
Percentage chang e , year on previous year
2005 6.7 6.7 5.8 10.3 11.3 −4.6 7.2 35.4 −4.0 −4.02006 2.4 2.4 6.4 10.3 0.6 5.2 6.4 52.3 10.3 10.32007 −0.6 −0.6 0.2 5.5 −19.4 8.8 3.6 −29.4 −7.9 −7.92008 1.7 1.7 4.1 −11.4 27.1 0.7 12.0 −57.3 −5.5 −5.52009 6.1 6.1 2.2 0.7 4.8 3.5 −0.8 86.2 19.6 19.6
Not seasonally adjusted
2007 Q1 240 240 5 237 1 381 856 1 342 1 602 56 1 029 1 029Q2 226 226 4 915 1 244 809 1 199 1 590 73 1 197 1 197Q3 230 230 4 925 1 341 772 1 271 1 496 45 1 074 1 074Q4 271 271 6 216 1 980 976 1 807 1 372 81 1 393 1 393
2008 Q1 235 235 5 256 1 261 869 1 312 1 796 18 989 989Q2 223 223 5 053 1 083 955 1 198 1 797 20 1 099 1 099Q3 239 239 5 200 1 143 1 046 1 306 1 692 13 1 033 1 033Q4 286 286 6 652 1 780 1 469 1 840 1 505 58 1 312 1 312
2009 Q1 251 251 5 294 1 161 974 1 308 1 834 17 1 051 1 051Q2 245 245 5 146 1 058 1 082 1 190 1 808 8 1 222 1 222Q3 255 255 5 335 1 194 1 076 1 357 1 663 45 1 198 1 198Q4 292 292 6 870 1 891 1 414 2 000 1 432 133 1 829 1 829
2010 Q1 241 241 5 493 1 179 1 111 1 368 1 812 23 1 231 1 231
Percentage chang e , quar ter on corresponding quarter of previous year
2007 Q1 2.1 2.1 1.5 5.1 −13.5 10.5 0.2 27.3 −5.5 −5.5Q2 −0.9 −0.9 −0.7 5.9 −16.4 6.5 1.5 −37.6 −4.0 −4.0Q3 −2.1 −2.1 −0.3 9.2 −22.6 6.2 1.8 −2.2 −11.9 −11.9Q4 −1.5 −1.5 0.5 3.2 −23.5 11.1 13.1 −47.4 −9.6 −9.6
2008 Q1 −2.1 −2.1 0.4 −8.7 1.5 −2.2 12.1 −67.9 −3.9 −3.9Q2 −1.3 −1.3 2.8 −12.9 18.0 −0.1 13.0 −72.6 −8.2 −8.2Q3 3.9 3.9 5.6 −14.8 35.5 2.8 13.1 −71.1 −3.8 −3.8Q4 5.5 5.5 7.0 −10.1 50.5 1.8 9.7 −28.4 −5.8 −5.8
2009 Q1 6.8 6.8 0.7 −7.9 12.1 −0.3 2.1 −5.6 6.3 6.3Q2 9.9 9.9 1.8 −2.3 13.3 −0.7 0.6 −60.0 11.2 11.2Q3 6.7 6.7 2.6 4.5 2.9 3.9 −1.7 246.2 16.0 16.0Q4 2.1 2.1 3.3 6.2 −3.7 8.7 −4.9 129.3 39.4 39.4
2010 Q1 −4.0 −4.0 3.8 1.6 14.1 4.6 −1.2 35.3 17.1 17.1

144
DG.CS Household final consumption expenditureDurable goodsCurrent prices - seasonally adjusted £ million
Fur nishing & household goods Health Transpor t
Therapeut- Purchase of vehiclesFur niture Car pets & ic
& other Major Major appliancesfur nishin- floor household tools & & Motor
Total Total gs coverings appliances equipment Total equipment Total Total Motor cars cycles Bicycles
COICOP D 05 05.1.1 05.1.2 05.3.1 05.5.1 06 06.1.3 07 07.1 07.1.1 07.1.2 07.1.3
UTIB LLJQ ATMA ATME XYEB XYED LLJR UVGW LLJS TMMH TMMJ TMMY TMNN2005 88 851 22 363 12 635 4 124 5 115 489 2 400 2 400 38 562 38 562 36 721 731 1 1102006 91 701 22 876 12 940 4 265 5 074 597 2 706 2 706 38 810 38 810 37 033 682 1 0952007 95 611 23 669 13 284 4 720 4 962 703 2 942 2 942 42 047 42 047 40 143 770 1 1342008 93 808 23 612 13 158 4 396 5 290 768 2 897 2 897 39 722 39 722 37 674 780 1 2682009 90 860 21 941 12 601 3 941 4 917 482 3 058 3 058 36 873 36 873 34 735 708 1 430
Percentage chang e , year on previous year
2005 1.6 2.1 −0.3 0.3 8.9 12.4 −4.5 −4.5 0.3 0.3 − 7.3 4.82006 3.2 2.3 2.4 3.4 −0.8 22.1 12.8 12.8 0.6 0.6 0.8 −6.7 −1.42007 4.3 3.5 2.7 10.7 −2.2 17.8 8.7 8.7 8.3 8.3 8.4 12.9 3.62008 −1.9 −0.2 −0.9 −6.9 6.6 9.2 −1.5 −1.5 −5.5 −5.5 −6.2 1.3 11.82009 −3.1 −7.1 −4.2 −10.4 −7.1 −37.2 5.6 5.6 −7.2 −7.2 −7.8 −9.2 12.8
Seasonally adjusted
2007 Q1 23 188 5 664 3 255 1 146 1 119 144 668 668 10 096 10 096 9 630 188 278Q2 23 853 6 065 3 369 1 162 1 319 215 698 698 10 280 10 280 9 809 190 281Q3 23 956 6 017 3 404 1 188 1 281 144 753 753 10 480 10 480 9 999 195 286Q4 24 614 5 923 3 256 1 224 1 243 200 823 823 11 191 11 191 10 705 197 289
2008 Q1 25 059 6 158 3 362 1 229 1 322 245 777 777 11 400 11 400 10 905 197 298Q2 23 853 5 950 3 344 1 131 1 311 164 746 746 10 337 10 337 9 842 187 308Q3 22 913 5 828 3 257 1 051 1 324 196 687 687 9 447 9 447 8 928 195 324Q4 21 983 5 676 3 195 985 1 333 163 687 687 8 538 8 538 7 999 201 338
2009 Q1 21 345 5 438 3 044 994 1 263 137 769 769 8 226 8 226 7 690 188 348Q2 22 036 5 383 3 091 971 1 194 127 793 793 8 727 8 727 8 193 182 352Q3 22 686 5 573 3 228 989 1 238 118 751 751 9 026 9 026 8 495 171 360Q4 24 793 5 547 3 238 987 1 222 100 745 745 10 894 10 894 10 357 167 370
2010 Q1 24 333 5 646 3 207 1 009 1 297 133 745 745 10 580 10 580 10 078 148 354
Percentage chang e , quar ter on previous quarter
2007 Q1 0.2 −3.1 −1.4 5.6 −12.7 −17.7 −0.4 −0.4 2.6 2.6 2.6 7.4 −0.4Q2 2.9 7.1 3.5 1.4 17.9 49.3 4.5 4.5 1.8 1.8 1.9 1.1 1.1Q3 0.4 −0.8 1.0 2.2 −2.9 −33.0 7.9 7.9 1.9 1.9 1.9 2.6 1.8Q4 2.7 −1.6 −4.3 3.0 −3.0 38.9 9.3 9.3 6.8 6.8 7.1 1.0 1.0
2008 Q1 1.8 4.0 3.3 0.4 6.4 22.5 −5.6 −5.6 1.9 1.9 1.9 − 3.1Q2 −4.8 −3.4 −0.5 −8.0 −0.8 −33.1 −4.0 −4.0 −9.3 −9.3 −9.7 −5.1 3.4Q3 −3.9 −2.1 −2.6 −7.1 1.0 19.5 −7.9 −7.9 −8.6 −8.6 −9.3 4.3 5.2Q4 −4.1 −2.6 −1.9 −6.3 0.7 −16.8 − − −9.6 −9.6 −10.4 3.1 4.3
2009 Q1 −2.9 −4.2 −4.7 0.9 −5.3 −16.0 11.9 11.9 −3.7 −3.7 −3.9 −6.5 3.0Q2 3.2 −1.0 1.5 −2.3 −5.5 −7.3 3.1 3.1 6.1 6.1 6.5 −3.2 1.1Q3 2.9 3.5 4.4 1.9 3.7 −7.1 −5.3 −5.3 3.4 3.4 3.7 −6.0 2.3Q4 9.3 −0.5 0.3 −0.2 −1.3 −15.3 −0.8 −0.8 20.7 20.7 21.9 −2.3 2.8
2010 Q1 −1.9 1.8 −1.0 2.2 6.1 33.0 − − −2.9 −2.9 −2.7 −11.4 −4.3
Percentage chang e , quar ter on corresponding quarter of previous year
2007 Q1 2.4 0.2 1.2 7.8 −10.6 20.0 −0.7 −0.7 5.4 5.4 5.2 13.9 4.9Q2 3.3 7.1 5.4 9.8 3.8 54.7 2.9 2.9 4.3 4.3 4.3 10.5 2.6Q3 4.9 5.2 5.5 12.2 0.9 −11.7 10.1 10.1 9.9 9.9 10.0 14.7 3.2Q4 6.4 1.4 −1.4 12.8 −3.0 14.3 22.7 22.7 13.7 13.7 14.1 12.6 3.6
2008 Q1 8.1 8.7 3.3 7.2 18.1 70.1 16.3 16.3 12.9 12.9 13.2 4.8 7.2Q2 − −1.9 −0.7 −2.7 −0.6 −23.7 6.9 6.9 0.6 0.6 0.3 −1.6 9.6Q3 −4.4 −3.1 −4.3 −11.5 3.4 36.1 −8.8 −8.8 −9.9 −9.9 −10.7 − 13.3Q4 −10.7 −4.2 −1.9 −19.5 7.2 −18.5 −16.5 −16.5 −23.7 −23.7 −25.3 2.0 17.0
2009 Q1 −14.8 −11.7 −9.5 −19.1 −4.5 −44.1 −1.0 −1.0 −27.8 −27.8 −29.5 −4.6 16.8Q2 −7.6 −9.5 −7.6 −14.1 −8.9 −22.6 6.3 6.3 −15.6 −15.6 −16.8 −2.7 14.3Q3 −1.0 −4.4 −0.9 −5.9 −6.5 −39.8 9.3 9.3 −4.5 −4.5 −4.8 −12.3 11.1Q4 12.8 −2.3 1.3 0.2 −8.3 −38.7 8.4 8.4 27.6 27.6 29.5 −16.9 9.5
2010 Q1 14.0 3.8 5.4 1.5 2.7 −2.9 −3.1 −3.1 28.6 28.6 31.1 −21.3 1.7

145
DG.CS Household final consumption expenditureDurable goodsCurrent prices - seasonally adjustedcontinued £ million
Communication Recreation and culture Miscellaneous
Musicalinstr uments &
Photo & Major majorTelephone & cinema equip Infor mation durables for durables for Jeweller y,
telefax Audio visual & optical processing outdoor indoor clocks &Total equipment Total equipment instr uments equipment recreation recreation Total watches
COICOP 08 08.2 09 09.1.1 09.1.2 09.1.3 09.2.1 09.2.2 12 12.3.1
LLJT ATMR LLJU ATMV ATMZ ATND TMNA XYEF LLJV ZAYL2005 950 950 19 954 5 107 4 207 4 907 5 496 237 4 622 4 6222006 973 973 21 240 5 635 4 232 5 164 5 848 361 5 096 5 0962007 967 967 21 293 5 946 3 413 5 619 6 060 255 4 693 4 6932008 983 983 22 161 5 267 4 339 5 656 6 790 109 4 433 4 4332009 1 043 1 043 22 645 5 304 4 546 5 855 6 737 203 5 300 5 300
Percentage chang e , year on previous year
2005 6.7 6.7 5.8 10.3 11.3 −4.6 7.2 35.4 −4.0 −4.02006 2.4 2.4 6.4 10.3 0.6 5.2 6.4 52.3 10.3 10.32007 −0.6 −0.6 0.2 5.5 −19.4 8.8 3.6 −29.4 −7.9 −7.92008 1.7 1.7 4.1 −11.4 27.1 0.7 12.0 −57.3 −5.5 −5.52009 6.1 6.1 2.2 0.7 4.8 3.5 −0.8 86.2 19.6 19.6
Seasonally adjusted
2007 Q1 249 249 5 331 1 450 916 1 394 1 478 93 1 180 1 180Q2 239 239 5 353 1 513 867 1 418 1 486 69 1 218 1 218Q3 239 239 5 308 1 520 822 1 407 1 499 60 1 159 1 159Q4 240 240 5 301 1 463 808 1 400 1 597 33 1 136 1 136
2008 Q1 246 246 5 353 1 352 955 1 369 1 653 24 1 125 1 125Q2 239 239 5 463 1 328 1 014 1 416 1 681 24 1 118 1 118Q3 247 247 5 591 1 290 1 117 1 443 1 714 27 1 113 1 113Q4 251 251 5 754 1 297 1 253 1 428 1 742 34 1 077 1 077
2009 Q1 261 261 5 437 1 271 1 055 1 368 1 697 46 1 214 1 214Q2 265 265 5 591 1 309 1 136 1 421 1 688 37 1 277 1 277Q3 265 265 5 755 1 355 1 153 1 509 1 680 58 1 316 1 316Q4 252 252 5 862 1 369 1 202 1 557 1 672 62 1 493 1 493
2010 Q1 253 253 5 677 1 306 1 195 1 444 1 673 59 1 432 1 432
Percentage chang e , quar ter on previous quarter
2007 Q1 1.6 1.6 1.2 − −13.1 10.1 5.0 2.2 −7.1 −7.1Q2 −4.0 −4.0 0.4 4.3 −5.3 1.7 0.5 −25.8 3.2 3.2Q3 − − −0.8 0.5 −5.2 −0.8 0.9 −13.0 −4.8 −4.8Q4 0.4 0.4 −0.1 −3.8 −1.7 −0.5 6.5 −45.0 −2.0 −2.0
2008 Q1 2.5 2.5 1.0 −7.6 18.2 −2.2 3.5 −27.3 −1.0 −1.0Q2 −2.8 −2.8 2.1 −1.8 6.2 3.4 1.7 − −0.6 −0.6Q3 3.3 3.3 2.3 −2.9 10.2 1.9 2.0 12.5 −0.4 −0.4Q4 1.6 1.6 2.9 0.5 12.2 −1.0 1.6 25.9 −3.2 −3.2
2009 Q1 4.0 4.0 −5.5 −2.0 −15.8 −4.2 −2.6 35.3 12.7 12.7Q2 1.5 1.5 2.8 3.0 7.7 3.9 −0.5 −19.6 5.2 5.2Q3 − − 2.9 3.5 1.5 6.2 −0.5 56.8 3.1 3.1Q4 −4.9 −4.9 1.9 1.0 4.2 3.2 −0.5 6.9 13.4 13.4
2010 Q1 0.4 0.4 −3.2 −4.6 −0.6 −7.3 0.1 −4.8 −4.1 −4.1
Percentage chang e , quar ter on corresponding quarter of previous year
2007 Q1 2.5 2.5 1.9 5.6 −12.4 11.0 −0.7 34.8 −5.8 −5.8Q2 −0.4 −0.4 −0.7 6.7 −18.4 7.3 0.4 −36.1 −3.9 −3.9Q3 −2.4 −2.4 −0.7 9.0 −23.1 6.6 1.8 −35.5 −11.3 −11.3Q4 −2.0 −2.0 0.6 0.9 −23.3 10.6 13.4 −63.7 −10.6 −10.6
2008 Q1 −1.2 −1.2 0.4 −6.8 4.3 −1.8 11.8 −74.2 −4.7 −4.7Q2 − − 2.1 −12.2 17.0 −0.1 13.1 −65.2 −8.2 −8.2Q3 3.3 3.3 5.3 −15.1 35.9 2.6 14.3 −55.0 −4.0 −4.0Q4 4.6 4.6 8.5 −11.3 55.1 2.0 9.1 3.0 −5.2 −5.2
2009 Q1 6.1 6.1 1.6 −6.0 10.5 −0.1 2.7 91.7 7.9 7.9Q2 10.9 10.9 2.3 −1.4 12.0 0.4 0.4 54.2 14.2 14.2Q3 7.3 7.3 2.9 5.0 3.2 4.6 −2.0 114.8 18.2 18.2Q4 0.4 0.4 1.9 5.6 −4.1 9.0 −4.0 82.4 38.6 38.6
2010 Q1 −3.1 −3.1 4.4 2.8 13.3 5.6 −1.4 28.3 18.0 18.0
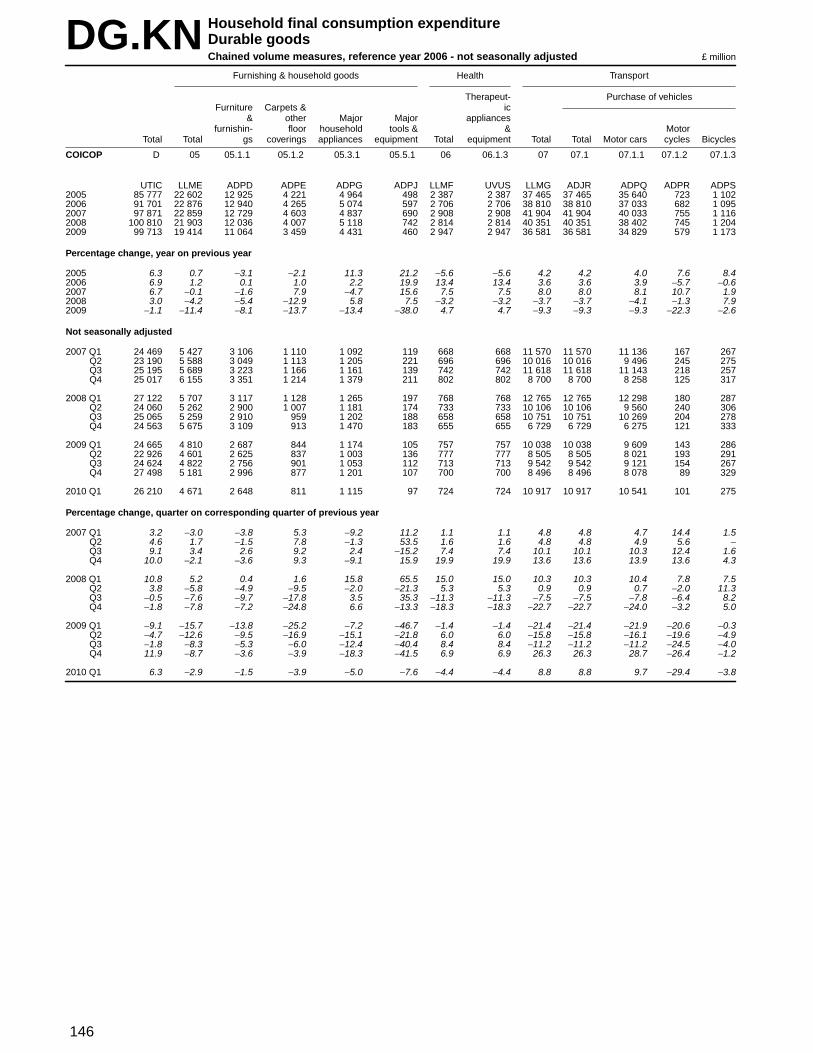
146
DG.KN Household final consumption expenditureDurable goodsChained volume measures, reference year 2006 - not seasonally adjusted £ million
Fur nishing & household goods Health Transpor t
Therapeut- Purchase of vehiclesFur niture Car pets & ic
& other Major Major appliancesfur nishin- floor household tools & & Motor
Total Total gs coverings appliances equipment Total equipment Total Total Motor cars cycles Bicycles
COICOP D 05 05.1.1 05.1.2 05.3.1 05.5.1 06 06.1.3 07 07.1 07.1.1 07.1.2 07.1.3
UTIC LLME ADPD ADPE ADPG ADPJ LLMF UVUS LLMG ADJR ADPQ ADPR ADPS2005 85 777 22 602 12 925 4 221 4 964 498 2 387 2 387 37 465 37 465 35 640 723 1 1022006 91 701 22 876 12 940 4 265 5 074 597 2 706 2 706 38 810 38 810 37 033 682 1 0952007 97 871 22 859 12 729 4 603 4 837 690 2 908 2 908 41 904 41 904 40 033 755 1 1162008 100 810 21 903 12 036 4 007 5 118 742 2 814 2 814 40 351 40 351 38 402 745 1 2042009 99 713 19 414 11 064 3 459 4 431 460 2 947 2 947 36 581 36 581 34 829 579 1 173
Percentage chang e , year on previous year
2005 6.3 0.7 −3.1 −2.1 11.3 21.2 −5.6 −5.6 4.2 4.2 4.0 7.6 8.42006 6.9 1.2 0.1 1.0 2.2 19.9 13.4 13.4 3.6 3.6 3.9 −5.7 −0.62007 6.7 −0.1 −1.6 7.9 −4.7 15.6 7.5 7.5 8.0 8.0 8.1 10.7 1.92008 3.0 −4.2 −5.4 −12.9 5.8 7.5 −3.2 −3.2 −3.7 −3.7 −4.1 −1.3 7.92009 −1.1 −11.4 −8.1 −13.7 −13.4 −38.0 4.7 4.7 −9.3 −9.3 −9.3 −22.3 −2.6
Not seasonally adjusted
2007 Q1 24 469 5 427 3 106 1 110 1 092 119 668 668 11 570 11 570 11 136 167 267Q2 23 190 5 588 3 049 1 113 1 205 221 696 696 10 016 10 016 9 496 245 275Q3 25 195 5 689 3 223 1 166 1 161 139 742 742 11 618 11 618 11 143 218 257Q4 25 017 6 155 3 351 1 214 1 379 211 802 802 8 700 8 700 8 258 125 317
2008 Q1 27 122 5 707 3 117 1 128 1 265 197 768 768 12 765 12 765 12 298 180 287Q2 24 060 5 262 2 900 1 007 1 181 174 733 733 10 106 10 106 9 560 240 306Q3 25 065 5 259 2 910 959 1 202 188 658 658 10 751 10 751 10 269 204 278Q4 24 563 5 675 3 109 913 1 470 183 655 655 6 729 6 729 6 275 121 333
2009 Q1 24 665 4 810 2 687 844 1 174 105 757 757 10 038 10 038 9 609 143 286Q2 22 926 4 601 2 625 837 1 003 136 777 777 8 505 8 505 8 021 193 291Q3 24 624 4 822 2 756 901 1 053 112 713 713 9 542 9 542 9 121 154 267Q4 27 498 5 181 2 996 877 1 201 107 700 700 8 496 8 496 8 078 89 329
2010 Q1 26 210 4 671 2 648 811 1 115 97 724 724 10 917 10 917 10 541 101 275
Percentage chang e , quar ter on corresponding quarter of previous year
2007 Q1 3.2 −3.0 −3.8 5.3 −9.2 11.2 1.1 1.1 4.8 4.8 4.7 14.4 1.5Q2 4.6 1.7 −1.5 7.8 −1.3 53.5 1.6 1.6 4.8 4.8 4.9 5.6 −Q3 9.1 3.4 2.6 9.2 2.4 −15.2 7.4 7.4 10.1 10.1 10.3 12.4 1.6Q4 10.0 −2.1 −3.6 9.3 −9.1 15.9 19.9 19.9 13.6 13.6 13.9 13.6 4.3
2008 Q1 10.8 5.2 0.4 1.6 15.8 65.5 15.0 15.0 10.3 10.3 10.4 7.8 7.5Q2 3.8 −5.8 −4.9 −9.5 −2.0 −21.3 5.3 5.3 0.9 0.9 0.7 −2.0 11.3Q3 −0.5 −7.6 −9.7 −17.8 3.5 35.3 −11.3 −11.3 −7.5 −7.5 −7.8 −6.4 8.2Q4 −1.8 −7.8 −7.2 −24.8 6.6 −13.3 −18.3 −18.3 −22.7 −22.7 −24.0 −3.2 5.0
2009 Q1 −9.1 −15.7 −13.8 −25.2 −7.2 −46.7 −1.4 −1.4 −21.4 −21.4 −21.9 −20.6 −0.3Q2 −4.7 −12.6 −9.5 −16.9 −15.1 −21.8 6.0 6.0 −15.8 −15.8 −16.1 −19.6 −4.9Q3 −1.8 −8.3 −5.3 −6.0 −12.4 −40.4 8.4 8.4 −11.2 −11.2 −11.2 −24.5 −4.0Q4 11.9 −8.7 −3.6 −3.9 −18.3 −41.5 6.9 6.9 26.3 26.3 28.7 −26.4 −1.2
2010 Q1 6.3 −2.9 −1.5 −3.9 −5.0 −7.6 −4.4 −4.4 8.8 8.8 9.7 −29.4 −3.8
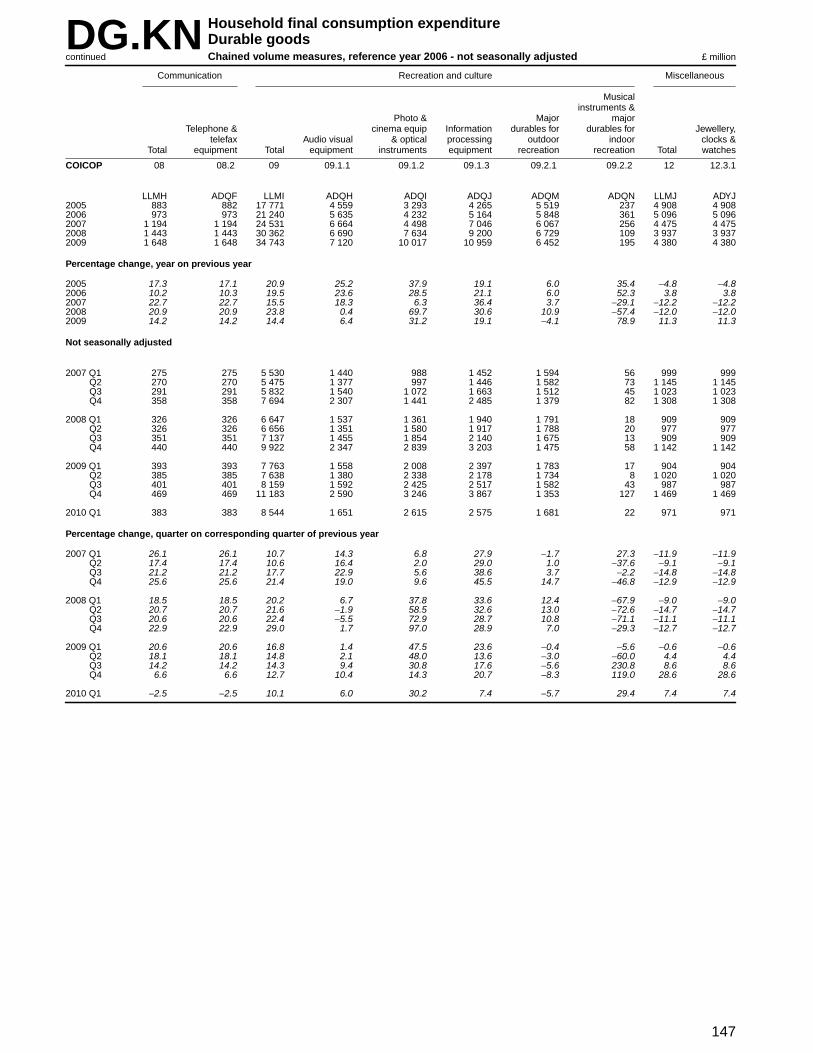
147
DG.KN Household final consumption expenditureDurable goodsChained volume measures, reference year 2006 - not seasonally adjustedcontinued £ million
Communication Recreation and culture Miscellaneous
Musicalinstr uments &
Photo & Major majorTelephone & cinema equip Infor mation durables for durables for Jeweller y,
telefax Audio visual & optical processing outdoor indoor clocks &Total equipment Total equipment instr uments equipment recreation recreation Total watches
COICOP 08 08.2 09 09.1.1 09.1.2 09.1.3 09.2.1 09.2.2 12 12.3.1
LLMH ADQF LLMI ADQH ADQI ADQJ ADQM ADQN LLMJ ADYJ2005 883 882 17 771 4 559 3 293 4 265 5 519 237 4 908 4 9082006 973 973 21 240 5 635 4 232 5 164 5 848 361 5 096 5 0962007 1 194 1 194 24 531 6 664 4 498 7 046 6 067 256 4 475 4 4752008 1 443 1 443 30 362 6 690 7 634 9 200 6 729 109 3 937 3 9372009 1 648 1 648 34 743 7 120 10 017 10 959 6 452 195 4 380 4 380
Percentage chang e , year on previous year
2005 17.3 17.1 20.9 25.2 37.9 19.1 6.0 35.4 −4.8 −4.82006 10.2 10.3 19.5 23.6 28.5 21.1 6.0 52.3 3.8 3.82007 22.7 22.7 15.5 18.3 6.3 36.4 3.7 −29.1 −12.2 −12.22008 20.9 20.9 23.8 0.4 69.7 30.6 10.9 −57.4 −12.0 −12.02009 14.2 14.2 14.4 6.4 31.2 19.1 −4.1 78.9 11.3 11.3
Not seasonally adjusted
2007 Q1 275 275 5 530 1 440 988 1 452 1 594 56 999 999Q2 270 270 5 475 1 377 997 1 446 1 582 73 1 145 1 145Q3 291 291 5 832 1 540 1 072 1 663 1 512 45 1 023 1 023Q4 358 358 7 694 2 307 1 441 2 485 1 379 82 1 308 1 308
2008 Q1 326 326 6 647 1 537 1 361 1 940 1 791 18 909 909Q2 326 326 6 656 1 351 1 580 1 917 1 788 20 977 977Q3 351 351 7 137 1 455 1 854 2 140 1 675 13 909 909Q4 440 440 9 922 2 347 2 839 3 203 1 475 58 1 142 1 142
2009 Q1 393 393 7 763 1 558 2 008 2 397 1 783 17 904 904Q2 385 385 7 638 1 380 2 338 2 178 1 734 8 1 020 1 020Q3 401 401 8 159 1 592 2 425 2 517 1 582 43 987 987Q4 469 469 11 183 2 590 3 246 3 867 1 353 127 1 469 1 469
2010 Q1 383 383 8 544 1 651 2 615 2 575 1 681 22 971 971
Percentage chang e , quar ter on corresponding quarter of previous year
2007 Q1 26.1 26.1 10.7 14.3 6.8 27.9 −1.7 27.3 −11.9 −11.9Q2 17.4 17.4 10.6 16.4 2.0 29.0 1.0 −37.6 −9.1 −9.1Q3 21.2 21.2 17.7 22.9 5.6 38.6 3.7 −2.2 −14.8 −14.8Q4 25.6 25.6 21.4 19.0 9.6 45.5 14.7 −46.8 −12.9 −12.9
2008 Q1 18.5 18.5 20.2 6.7 37.8 33.6 12.4 −67.9 −9.0 −9.0Q2 20.7 20.7 21.6 −1.9 58.5 32.6 13.0 −72.6 −14.7 −14.7Q3 20.6 20.6 22.4 −5.5 72.9 28.7 10.8 −71.1 −11.1 −11.1Q4 22.9 22.9 29.0 1.7 97.0 28.9 7.0 −29.3 −12.7 −12.7
2009 Q1 20.6 20.6 16.8 1.4 47.5 23.6 −0.4 −5.6 −0.6 −0.6Q2 18.1 18.1 14.8 2.1 48.0 13.6 −3.0 −60.0 4.4 4.4Q3 14.2 14.2 14.3 9.4 30.8 17.6 −5.6 230.8 8.6 8.6Q4 6.6 6.6 12.7 10.4 14.3 20.7 −8.3 119.0 28.6 28.6
2010 Q1 −2.5 −2.5 10.1 6.0 30.2 7.4 −5.7 29.4 7.4 7.4

148
DG.KS Household final consumption expenditureDurable goodsChained volume measures, reference year 2006 - seasonally adjusted £ million
Fur nishing & household goods Health Transpor t
Therapeut- Purchase of vehiclesFur niture Car pets & ic
& other Major Major appliancesfur nishin- floor household tools & & Motor
Total Total gs coverings appliances equipment Total equipment Total Total Motor cars cycles Bicycles
COICOP D 05 05.1.1 05.1.2 05.3.1 05.5.1 06 06.1.3 07 07.1 07.1.1 07.1.2 07.1.3
UTID LLKX ATQX ATRD XYJP XYJR LLKY UWIC LLKZ TMMI TMML TMMZ TMNO2005 85 777 22 602 12 925 4 221 4 964 498 2 387 2 387 37 465 37 465 35 640 723 1 1022006 91 701 22 876 12 940 4 265 5 074 597 2 706 2 706 38 810 38 810 37 033 682 1 0952007 97 871 22 859 12 729 4 603 4 837 690 2 908 2 908 41 904 41 904 40 033 755 1 1162008 100 810 21 903 12 036 4 007 5 118 742 2 814 2 814 40 351 40 351 38 402 745 1 2042009 99 713 19 414 11 064 3 459 4 431 460 2 947 2 947 36 581 36 581 34 829 579 1 173
Percentage chang e , year on previous year
2005 6.3 0.7 −3.1 −2.1 11.3 21.2 −5.6 −5.6 4.2 4.2 4.0 7.6 8.42006 6.9 1.2 0.1 1.0 2.2 19.9 13.4 13.4 3.6 3.6 3.9 −5.7 −0.62007 6.7 −0.1 −1.6 7.9 −4.7 15.6 7.5 7.5 8.0 8.0 8.1 10.7 1.92008 3.0 −4.2 −5.4 −12.9 5.8 7.5 −3.2 −3.2 −3.7 −3.7 −4.1 −1.3 7.92009 −1.1 −11.4 −8.1 −13.7 −13.4 −38.0 4.7 4.7 −9.3 −9.3 −9.3 −22.3 −2.6
Seasonally adjusted
2007 Q1 23 285 5 545 3 147 1 137 1 119 142 662 662 10 013 10 013 9 555 184 274Q2 24 169 5 824 3 194 1 143 1 279 208 689 689 10 179 10 179 9 721 184 274Q3 24 822 5 826 3 285 1 147 1 253 141 745 745 10 496 10 496 10 024 191 281Q4 25 595 5 664 3 103 1 176 1 186 199 812 812 11 216 11 216 10 733 196 287
2008 Q1 26 050 5 854 3 175 1 159 1 284 236 757 757 11 240 11 240 10 750 195 295Q2 25 269 5 484 3 032 1 030 1 264 158 724 724 10 370 10 370 9 881 185 304Q3 24 894 5 351 2 951 934 1 278 188 666 666 9 749 9 749 9 261 185 303Q4 24 597 5 214 2 878 884 1 292 160 667 667 8 992 8 992 8 510 180 302
2009 Q1 23 781 4 937 2 753 873 1 182 129 743 743 8 609 8 609 8 155 161 293Q2 24 379 4 803 2 745 856 1 081 121 766 766 8 851 8 851 8 412 149 290Q3 24 708 4 891 2 793 878 1 108 112 725 725 8 669 8 669 8 240 137 292Q4 26 845 4 783 2 773 852 1 060 98 713 713 10 452 10 452 10 022 132 298
2010 Q1 25 973 4 820 2 729 850 1 117 124 709 709 10 021 10 021 9 622 117 282
Percentage chang e , quar ter on previous quarter
2007 Q1 0.4 −4.0 −2.4 5.3 −13.2 −20.2 −2.2 −2.2 1.7 1.7 1.6 7.0 −0.7Q2 3.8 5.0 1.5 0.5 14.3 46.5 4.1 4.1 1.7 1.7 1.7 − −Q3 2.7 − 2.8 0.3 −2.0 −32.2 8.1 8.1 3.1 3.1 3.1 3.8 2.6Q4 3.1 −2.8 −5.5 2.5 −5.3 41.1 9.0 9.0 6.9 6.9 7.1 2.6 2.1
2008 Q1 1.8 3.4 2.3 −1.4 8.3 18.6 −6.8 −6.8 0.2 0.2 0.2 −0.5 2.8Q2 −3.0 −6.3 −4.5 −11.1 −1.6 −33.1 −4.4 −4.4 −7.7 −7.7 −8.1 −5.1 3.1Q3 −1.5 −2.4 −2.7 −9.3 1.1 19.0 −8.0 −8.0 −6.0 −6.0 −6.3 − −0.3Q4 −1.2 −2.6 −2.5 −5.4 1.1 −14.9 0.2 0.2 −7.8 −7.8 −8.1 −2.7 −0.3
2009 Q1 −3.3 −5.3 −4.3 −1.2 −8.5 −19.4 11.4 11.4 −4.3 −4.3 −4.2 −10.6 −3.0Q2 2.5 −2.7 −0.3 −1.9 −8.5 −6.2 3.1 3.1 2.8 2.8 3.2 −7.5 −1.0Q3 1.3 1.8 1.7 2.6 2.5 −7.4 −5.4 −5.4 −2.1 −2.1 −2.0 −8.1 0.7Q4 8.6 −2.2 −0.7 −3.0 −4.3 −12.5 −1.7 −1.7 20.6 20.6 21.6 −3.6 2.1
2010 Q1 −3.2 0.8 −1.6 −0.2 5.4 26.5 −0.6 −0.6 −4.1 −4.1 −4.0 −11.4 −5.4
Percentage chang e , quar ter on corresponding quarter of previous year
2007 Q1 3.7 −2.5 −3.2 6.7 −10.5 17.4 0.5 0.5 4.8 4.8 4.8 10.2 2.6Q2 4.3 1.5 −1.7 7.7 −0.9 51.8 1.5 1.5 3.5 3.5 3.6 6.4 −0.4Q3 8.5 2.6 2.2 8.4 0.7 −12.4 7.8 7.8 9.6 9.6 9.7 12.4 1.4Q4 10.4 −1.9 −3.8 8.9 −8.0 11.8 19.9 19.9 13.9 13.9 14.2 14.0 4.0
2008 Q1 11.9 5.6 0.9 1.9 14.7 66.2 14.4 14.4 12.3 12.3 12.5 6.0 7.7Q2 4.6 −5.8 −5.1 −9.9 −1.2 −24.0 5.1 5.1 1.9 1.9 1.6 0.5 10.9Q3 0.3 −8.2 −10.2 −18.6 2.0 33.3 −10.6 −10.6 −7.1 −7.1 −7.6 −3.1 7.8Q4 −3.9 −7.9 −7.3 −24.8 8.9 −19.6 −17.9 −17.9 −19.8 −19.8 −20.7 −8.2 5.2
2009 Q1 −8.7 −15.7 −13.3 −24.7 −7.9 −45.3 −1.8 −1.8 −23.4 −23.4 −24.1 −17.4 −0.7Q2 −3.5 −12.4 −9.5 −16.9 −14.5 −23.4 5.8 5.8 −14.6 −14.6 −14.9 −19.5 −4.6Q3 −0.7 −8.6 −5.4 −6.0 −13.3 −40.4 8.9 8.9 −11.1 −11.1 −11.0 −25.9 −3.6Q4 9.1 −8.3 −3.6 −3.6 −18.0 −38.8 6.9 6.9 16.2 16.2 17.8 −26.7 −1.3
2010 Q1 9.2 −2.4 −0.9 −2.6 −5.5 −3.9 −4.6 −4.6 16.4 16.4 18.0 −27.3 −3.8
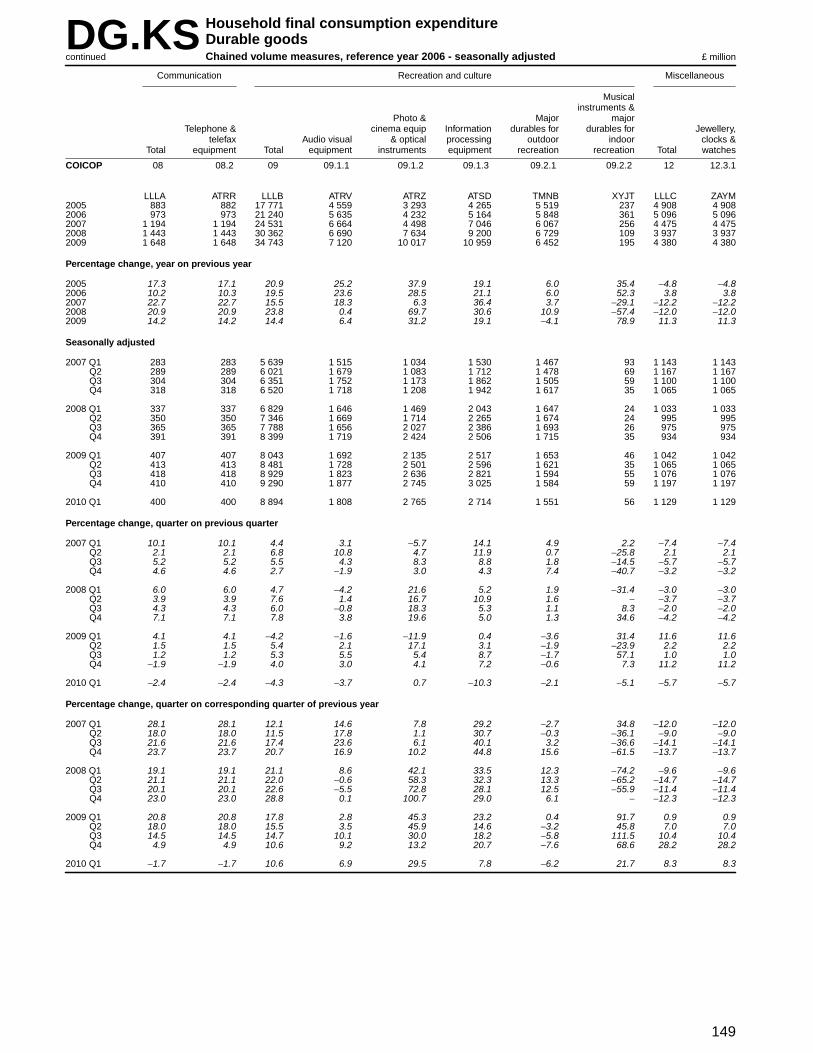
149
DG.KS Household final consumption expenditureDurable goodsChained volume measures, reference year 2006 - seasonally adjustedcontinued £ million
Communication Recreation and culture Miscellaneous
Musicalinstr uments &
Photo & Major majorTelephone & cinema equip Infor mation durables for durables for Jeweller y,
telefax Audio visual & optical processing outdoor indoor clocks &Total equipment Total equipment instr uments equipment recreation recreation Total watches
COICOP 08 08.2 09 09.1.1 09.1.2 09.1.3 09.2.1 09.2.2 12 12.3.1
LLLA ATRR LLLB ATRV ATRZ ATSD TMNB XYJT LLLC ZAYM2005 883 882 17 771 4 559 3 293 4 265 5 519 237 4 908 4 9082006 973 973 21 240 5 635 4 232 5 164 5 848 361 5 096 5 0962007 1 194 1 194 24 531 6 664 4 498 7 046 6 067 256 4 475 4 4752008 1 443 1 443 30 362 6 690 7 634 9 200 6 729 109 3 937 3 9372009 1 648 1 648 34 743 7 120 10 017 10 959 6 452 195 4 380 4 380
Percentage chang e , year on previous year
2005 17.3 17.1 20.9 25.2 37.9 19.1 6.0 35.4 −4.8 −4.82006 10.2 10.3 19.5 23.6 28.5 21.1 6.0 52.3 3.8 3.82007 22.7 22.7 15.5 18.3 6.3 36.4 3.7 −29.1 −12.2 −12.22008 20.9 20.9 23.8 0.4 69.7 30.6 10.9 −57.4 −12.0 −12.02009 14.2 14.2 14.4 6.4 31.2 19.1 −4.1 78.9 11.3 11.3
Seasonally adjusted
2007 Q1 283 283 5 639 1 515 1 034 1 530 1 467 93 1 143 1 143Q2 289 289 6 021 1 679 1 083 1 712 1 478 69 1 167 1 167Q3 304 304 6 351 1 752 1 173 1 862 1 505 59 1 100 1 100Q4 318 318 6 520 1 718 1 208 1 942 1 617 35 1 065 1 065
2008 Q1 337 337 6 829 1 646 1 469 2 043 1 647 24 1 033 1 033Q2 350 350 7 346 1 669 1 714 2 265 1 674 24 995 995Q3 365 365 7 788 1 656 2 027 2 386 1 693 26 975 975Q4 391 391 8 399 1 719 2 424 2 506 1 715 35 934 934
2009 Q1 407 407 8 043 1 692 2 135 2 517 1 653 46 1 042 1 042Q2 413 413 8 481 1 728 2 501 2 596 1 621 35 1 065 1 065Q3 418 418 8 929 1 823 2 636 2 821 1 594 55 1 076 1 076Q4 410 410 9 290 1 877 2 745 3 025 1 584 59 1 197 1 197
2010 Q1 400 400 8 894 1 808 2 765 2 714 1 551 56 1 129 1 129
Percentage chang e , quar ter on previous quarter
2007 Q1 10.1 10.1 4.4 3.1 −5.7 14.1 4.9 2.2 −7.4 −7.4Q2 2.1 2.1 6.8 10.8 4.7 11.9 0.7 −25.8 2.1 2.1Q3 5.2 5.2 5.5 4.3 8.3 8.8 1.8 −14.5 −5.7 −5.7Q4 4.6 4.6 2.7 −1.9 3.0 4.3 7.4 −40.7 −3.2 −3.2
2008 Q1 6.0 6.0 4.7 −4.2 21.6 5.2 1.9 −31.4 −3.0 −3.0Q2 3.9 3.9 7.6 1.4 16.7 10.9 1.6 − −3.7 −3.7Q3 4.3 4.3 6.0 −0.8 18.3 5.3 1.1 8.3 −2.0 −2.0Q4 7.1 7.1 7.8 3.8 19.6 5.0 1.3 34.6 −4.2 −4.2
2009 Q1 4.1 4.1 −4.2 −1.6 −11.9 0.4 −3.6 31.4 11.6 11.6Q2 1.5 1.5 5.4 2.1 17.1 3.1 −1.9 −23.9 2.2 2.2Q3 1.2 1.2 5.3 5.5 5.4 8.7 −1.7 57.1 1.0 1.0Q4 −1.9 −1.9 4.0 3.0 4.1 7.2 −0.6 7.3 11.2 11.2
2010 Q1 −2.4 −2.4 −4.3 −3.7 0.7 −10.3 −2.1 −5.1 −5.7 −5.7
Percentage chang e , quar ter on corresponding quarter of previous year
2007 Q1 28.1 28.1 12.1 14.6 7.8 29.2 −2.7 34.8 −12.0 −12.0Q2 18.0 18.0 11.5 17.8 1.1 30.7 −0.3 −36.1 −9.0 −9.0Q3 21.6 21.6 17.4 23.6 6.1 40.1 3.2 −36.6 −14.1 −14.1Q4 23.7 23.7 20.7 16.9 10.2 44.8 15.6 −61.5 −13.7 −13.7
2008 Q1 19.1 19.1 21.1 8.6 42.1 33.5 12.3 −74.2 −9.6 −9.6Q2 21.1 21.1 22.0 −0.6 58.3 32.3 13.3 −65.2 −14.7 −14.7Q3 20.1 20.1 22.6 −5.5 72.8 28.1 12.5 −55.9 −11.4 −11.4Q4 23.0 23.0 28.8 0.1 100.7 29.0 6.1 − −12.3 −12.3
2009 Q1 20.8 20.8 17.8 2.8 45.3 23.2 0.4 91.7 0.9 0.9Q2 18.0 18.0 15.5 3.5 45.9 14.6 −3.2 45.8 7.0 7.0Q3 14.5 14.5 14.7 10.1 30.0 18.2 −5.8 111.5 10.4 10.4Q4 4.9 4.9 10.6 9.2 13.2 20.7 −7.6 68.6 28.2 28.2
2010 Q1 −1.7 −1.7 10.6 6.9 29.5 7.8 −6.2 21.7 8.3 8.3

150
DG.DN Household final consumption expenditureDurable goodsImplied deflators - not seasonally adjusted 2006 = 100
Fur nishing & household goods Health Transpor t
Therapeut- Purchase of vehiclesFur niture Car pets & ic
& other Major Major appliancesfur nishin- floor household tools & & Motor
Total Total gs coverings appliances equipment Total equipment Total Total Motor cars cycles Bicycles
COICOP D 05 05.1.1 05.1.2 05.3.1 05.5.1 06 06.1.3 07 07.1 07.1.1 07.1.2 07.1.3
UTKS LLNL AWMS AWMT AWMV AWMY LLNM AWNE LLNN UTNW AWNI AWNJ AWNK2005 103.6 98.9 97.8 97.7 103.0 98.2 100.5 100.5 102.9 102.9 103.0 101.1 100.72006 100.0 100.0 100.0 100.0 100.0 100.0 100.0 100.0 100.0 100.0 100.0 100.0 100.02007 97.7 103.5 104.4 102.5 102.6 101.9 101.2 101.2 100.3 100.3 100.3 102.0 101.62008 93.1 107.8 109.3 109.7 103.4 103.5 102.9 102.9 98.4 98.4 98.1 104.7 105.32009 91.1 113.0 113.9 113.9 111.0 104.8 103.8 103.8 100.8 100.8 99.7 122.3 121.9
Percentage chang e , year on previous year
2005 −4.3 1.3 2.9 2.4 −2.1 −7.2 1.2 1.1 −3.8 −3.8 −3.8 −0.2 −3.32006 −3.5 1.1 2.2 2.4 −2.9 1.8 −0.5 −0.5 −2.8 −2.8 −2.9 −1.1 −0.72007 −2.3 3.5 4.4 2.5 2.6 1.9 1.2 1.2 0.3 0.3 0.3 2.0 1.62008 −4.7 4.2 4.7 7.0 0.8 1.6 1.7 1.7 −1.9 −1.9 −2.2 2.6 3.62009 −2.1 4.8 4.2 3.8 7.4 1.3 0.9 0.9 2.4 2.4 1.6 16.8 15.8
Not seasonally adjusted
2007 Q1 99.2 101.3 102.4 99.9 99.5 101.7 100.3 100.3 100.3 100.3 100.2 101.8 101.5Q2 99.2 104.7 106.6 102.5 102.5 102.3 101.3 101.3 101.0 101.0 101.0 102.4 102.2Q3 96.9 102.4 102.2 103.3 102.6 100.7 101.3 101.3 100.0 100.0 99.9 102.3 101.9Q4 95.5 105.5 106.3 104.3 105.1 102.4 101.6 101.6 100.1 100.1 100.0 100.8 100.9
2008 Q1 95.8 104.4 104.8 105.1 102.8 103.6 102.2 102.2 100.0 100.0 100.0 101.1 100.7Q2 95.4 109.3 111.7 110.8 103.1 103.4 103.0 103.0 99.8 99.8 99.7 101.3 101.0Q3 93.0 108.0 108.7 112.0 103.9 103.2 103.5 103.5 97.5 97.5 97.0 107.4 107.2Q4 87.7 109.7 112.3 111.8 103.5 103.8 103.2 103.2 95.1 95.1 93.9 112.4 111.7
2009 Q1 89.5 109.3 109.4 113.2 106.8 105.7 103.2 103.2 94.0 94.0 93.0 117.5 117.8Q2 91.8 113.0 114.0 114.7 110.0 104.4 103.6 103.6 99.1 99.1 97.7 122.3 121.6Q3 93.3 112.8 113.7 112.1 111.9 103.6 103.8 103.8 104.8 104.8 103.9 124.0 124.0Q4 90.1 116.7 118.0 115.8 115.1 105.6 104.6 104.6 106.0 106.0 105.0 127.0 124.0
2010 Q1 94.8 116.3 116.2 118.1 116.0 107.2 105.0 105.0 107.0 107.0 106.3 125.7 125.1
Percentage chang e , quar ter on corresponding quarter of previous year
2007 Q1 −0.9 2.9 4.6 1.3 −0.2 2.6 −1.1 −1.1 0.1 0.1 −0.1 2.5 2.3Q2 −0.7 5.5 7.5 2.0 4.5 1.6 1.6 1.6 0.7 0.7 0.7 2.8 2.9Q3 −3.2 2.4 3.2 3.5 −0.1 0.7 1.9 1.9 0.2 0.2 0.1 1.8 1.5Q4 −4.4 3.3 2.5 3.2 5.4 2.4 2.0 2.0 0.5 0.5 0.5 −0.1 −0.1
2008 Q1 −3.4 3.1 2.3 5.2 3.3 1.9 1.9 1.9 −0.3 −0.3 −0.2 −0.7 −0.8Q2 −3.8 4.4 4.8 8.1 0.6 1.1 1.7 1.7 −1.2 −1.2 −1.3 −1.1 −1.2Q3 −4.0 5.5 6.4 8.4 1.3 2.5 2.2 2.2 −2.5 −2.5 −2.9 5.0 5.2Q4 −8.2 4.0 5.6 7.2 −1.5 1.4 1.6 1.6 −5.0 −5.0 −6.1 11.5 10.7
2009 Q1 −6.6 4.7 4.4 7.7 3.9 2.0 1.0 1.0 −6.0 −6.0 −7.0 16.2 17.0Q2 −3.8 3.4 2.1 3.5 6.7 1.0 0.6 0.6 −0.7 −0.7 −2.0 20.7 20.4Q3 0.3 4.4 4.6 0.1 7.7 0.4 0.3 0.3 7.5 7.5 7.1 15.5 15.7Q4 2.7 6.4 5.1 3.6 11.2 1.7 1.4 1.4 11.5 11.5 11.8 13.0 11.0
2010 Q1 5.9 6.4 6.2 4.3 8.6 1.4 1.7 1.7 13.8 13.8 14.3 7.0 6.2

151
DG.DN Household final consumption expenditureDurable goodsImplied deflators - not seasonally adjustedcontinued 2006 = 100
Communication Recreation and culture Miscellaneous
Musicalinstr uments &
Photo & Major majorTelephone & cinema equip Infor mation durables for durables for Jeweller y,
telefax Audio visual & optical processing outdoor indoor clocks &Total equipment Total equipment instr uments equipment recreation recreation Total watches
COICOP 08 08.2 09 09.1.1 09.1.2 09.1.3 09.2.1 09.2.2 12 12.3.1
LLNO UTOA LLNP AWNU AWNV AWNW AWNZ AWOA LLNQ AWOT2005 107.6 107.7 112.3 112.0 127.8 115.1 99.6 100.0 94.2 94.22006 100.0 100.0 100.0 100.0 100.0 100.0 100.0 100.0 100.0 100.02007 81.0 81.0 86.8 89.2 75.9 79.7 99.9 99.6 104.9 104.92008 68.1 68.1 73.0 78.7 56.8 61.5 100.9 100.0 112.6 112.62009 63.3 63.3 65.2 74.5 45.4 53.4 104.4 104.1 121.0 121.0
Percentage chang e , year on previous year
2005 −9.0 −8.9 −12.5 −11.9 −19.3 −19.8 1.1 − 0.9 0.92006 −7.1 −7.1 −11.0 −10.7 −21.8 −13.1 0.4 − 6.2 6.22007 −19.0 −19.0 −13.2 −10.8 −24.1 −20.3 −0.1 −0.4 4.9 4.92008 −15.9 −15.9 −15.9 −11.8 −25.2 −22.8 1.0 0.4 7.3 7.32009 −7.0 −7.0 −10.7 −5.3 −20.1 −13.2 3.5 4.1 7.5 7.5
Not seasonally adjusted
2007 Q1 87.3 87.3 94.7 95.9 86.6 92.4 100.5 100.0 103.0 103.0Q2 83.7 83.7 89.8 90.3 81.1 82.9 100.5 100.0 104.5 104.5Q3 79.0 79.0 84.4 87.1 72.0 76.4 98.9 100.0 105.0 105.0Q4 75.7 75.7 80.8 85.8 67.7 72.7 99.5 98.8 106.5 106.5
2008 Q1 72.1 72.1 79.1 82.0 63.9 67.6 100.3 100.0 108.8 108.8Q2 68.4 68.4 75.9 80.2 60.4 62.5 100.5 100.0 112.5 112.5Q3 68.1 68.1 72.9 78.6 56.4 61.0 101.0 100.0 113.6 113.6Q4 65.0 65.0 67.0 75.8 51.7 57.4 102.0 100.0 114.9 114.9
2009 Q1 63.9 63.9 68.2 74.5 48.5 54.6 102.9 100.0 116.3 116.3Q2 63.6 63.6 67.4 76.7 46.3 54.6 104.3 100.0 119.8 119.8Q3 63.6 63.6 65.4 75.0 44.4 53.9 105.1 104.7 121.4 121.4Q4 62.3 62.3 61.4 73.0 43.6 51.7 105.8 104.7 124.5 124.5
2010 Q1 62.9 62.9 64.3 71.4 42.5 53.1 107.8 104.5 126.8 126.8
Percentage chang e , quar ter on corresponding quarter of previous year
2007 Q1 −19.0 −19.0 −8.3 −8.1 −19.1 −13.6 1.9 − 7.3 7.3Q2 −15.5 −15.5 −10.2 −9.1 −18.2 −17.4 0.5 − 5.6 5.6Q3 −19.3 −19.3 −15.3 −11.1 −26.8 −23.4 −1.9 − 3.4 3.4Q4 −21.6 −21.6 −17.2 −13.2 −30.2 −23.7 −1.4 −1.2 3.7 3.7
2008 Q1 −17.4 −17.4 −16.5 −14.5 −26.2 −26.8 −0.2 − 5.6 5.6Q2 −18.3 −18.3 −15.5 −11.2 −25.5 −24.6 − − 7.7 7.7Q3 −13.8 −13.8 −13.6 −9.8 −21.7 −20.2 2.1 − 8.2 8.2Q4 −14.1 −14.1 −17.1 −11.7 −23.6 −21.0 2.5 1.2 7.9 7.9
2009 Q1 −11.4 −11.4 −13.8 −9.1 −24.1 −19.2 2.6 − 6.9 6.9Q2 −7.0 −7.0 −11.2 −4.4 −23.3 −12.6 3.8 − 6.5 6.5Q3 −6.6 −6.6 −10.3 −4.6 −21.3 −11.6 4.1 4.7 6.9 6.9Q4 −4.2 −4.2 −8.4 −3.7 −15.7 −9.9 3.7 4.7 8.4 8.4
2010 Q1 −1.6 −1.6 −5.7 −4.2 −12.4 −2.7 4.8 4.5 9.0 9.0

152
DG.DS Household final consumption expenditureDurable goodsImplied deflators - seasonally adjusted 2006 = 100
Fur nishing & household goods Health Transpor t
Therapeut- Purchase of vehiclesFur niture Car pets & ic
& other Major Major appliancesfur nishin- floor household tools & & Motor
Total Total gs coverings appliances equipment Total equipment Total Total Motor cars cycles Bicycles
COICOP D 05 05.1.1 05.1.2 05.3.1 05.5.1 06 06.1.3 07 07.1 07.1.1 07.1.2 07.1.3
UTKT LLOS AWQK AWQL AWQN AWQQ LLOT AWQW LLOU UTPP AWRA AWRB AWRC2005 103.6 98.9 97.8 97.7 103.0 98.2 100.5 100.5 102.9 102.9 103.0 101.1 100.72006 100.0 100.0 100.0 100.0 100.0 100.0 100.0 100.0 100.0 100.0 100.0 100.0 100.02007 97.7 103.5 104.4 102.5 102.6 101.9 101.2 101.2 100.3 100.3 100.3 102.0 101.62008 93.1 107.8 109.3 109.7 103.4 103.5 102.9 102.9 98.4 98.4 98.1 104.7 105.32009 91.1 113.0 113.9 113.9 111.0 104.8 103.8 103.8 100.8 100.8 99.7 122.3 121.9
Percentage chang e , year on previous year
2005 −4.3 1.3 2.9 2.4 −2.1 −7.2 1.2 1.1 −3.8 −3.8 −3.8 −0.2 −3.32006 −3.5 1.1 2.2 2.4 −2.9 1.8 −0.5 −0.5 −2.8 −2.8 −2.9 −1.1 −0.72007 −2.3 3.5 4.4 2.5 2.6 1.9 1.2 1.2 0.3 0.3 0.3 2.0 1.62008 −4.7 4.2 4.7 7.0 0.8 1.6 1.7 1.7 −1.9 −1.9 −2.2 2.6 3.62009 −2.1 4.8 4.2 3.8 7.4 1.3 0.9 0.9 2.4 2.4 1.6 16.8 15.8
Seasonally adjusted
2007 Q1 99.6 102.1 103.4 100.8 100.0 101.4 100.9 100.9 100.8 100.8 100.8 102.2 101.5Q2 98.7 104.1 105.5 101.7 103.1 103.4 101.3 101.3 101.0 101.0 100.9 103.3 102.6Q3 96.5 103.3 103.6 103.6 102.2 102.1 101.1 101.1 99.8 99.8 99.8 102.1 101.8Q4 96.2 104.6 104.9 104.1 104.8 100.5 101.4 101.4 99.8 99.8 99.7 100.5 100.7
2008 Q1 96.2 105.2 105.9 106.0 103.0 103.8 102.6 102.6 101.4 101.4 101.4 101.0 101.0Q2 94.4 108.5 110.3 109.8 103.7 103.8 103.0 103.0 99.7 99.7 99.6 101.1 101.3Q3 92.0 108.9 110.4 112.5 103.6 104.3 103.2 103.2 96.9 96.9 96.4 105.4 106.9Q4 89.4 108.9 111.0 111.4 103.2 101.9 103.0 103.0 95.0 95.0 94.0 111.7 111.9
2009 Q1 89.8 110.1 110.6 113.9 106.9 106.2 103.5 103.5 95.6 95.6 94.3 116.8 118.8Q2 90.4 112.1 112.6 113.4 110.5 105.0 103.5 103.5 98.6 98.6 97.4 122.1 121.4Q3 91.8 113.9 115.6 112.6 111.7 105.4 103.6 103.6 104.1 104.1 103.1 124.8 123.3Q4 92.4 116.0 116.8 115.8 115.3 102.0 104.5 104.5 104.2 104.2 103.3 126.5 124.2
2010 Q1 93.7 117.1 117.5 118.7 116.1 107.3 105.1 105.1 105.6 105.6 104.7 126.5 125.5
Percentage chang e , quar ter on previous quarter
2007 Q1 −0.2 0.9 1.0 0.3 0.5 3.2 1.8 1.8 0.9 0.9 1.0 0.5 0.4Q2 −0.9 2.0 2.0 0.9 3.1 2.0 0.4 0.4 0.2 0.2 0.1 1.1 1.1Q3 −2.2 −0.8 −1.8 1.9 −0.9 −1.3 −0.2 −0.2 −1.2 −1.2 −1.1 −1.2 −0.8Q4 −0.3 1.3 1.3 0.5 2.5 −1.6 0.3 0.3 − − −0.1 −1.6 −1.1
2008 Q1 − 0.6 1.0 1.8 −1.7 3.3 1.2 1.2 1.6 1.6 1.7 0.5 0.3Q2 −1.9 3.1 4.2 3.6 0.7 − 0.4 0.4 −1.7 −1.7 −1.8 0.1 0.3Q3 −2.5 0.4 0.1 2.5 −0.1 0.5 0.2 0.2 −2.8 −2.8 −3.2 4.3 5.5Q4 −2.8 − 0.5 −1.0 −0.4 −2.3 −0.2 −0.2 −2.0 −2.0 −2.5 6.0 4.7
2009 Q1 0.4 1.1 −0.4 2.2 3.6 4.2 0.5 0.5 0.6 0.6 0.3 4.6 6.2Q2 0.7 1.8 1.8 −0.4 3.4 −1.1 − − 3.1 3.1 3.3 4.5 2.2Q3 1.5 1.6 2.7 −0.7 1.1 0.4 0.1 0.1 5.6 5.6 5.9 2.2 1.6Q4 0.7 1.8 1.0 2.8 3.2 −3.2 0.9 0.9 0.1 0.1 0.2 1.4 0.7
2010 Q1 1.4 0.9 0.6 2.5 0.7 5.2 0.6 0.6 1.3 1.3 1.4 − 1.0
Percentage chang e , quar ter on corresponding quarter of previous year
2007 Q1 −1.2 2.7 4.6 1.1 −0.2 2.2 −1.2 −1.2 0.5 0.5 0.4 3.4 2.2Q2 −0.9 5.5 7.3 2.0 4.7 1.9 1.4 1.4 0.8 0.8 0.6 3.9 3.0Q3 −3.3 2.6 3.2 3.5 0.2 0.9 2.1 2.1 0.3 0.3 0.3 2.1 1.8Q4 −3.6 3.4 2.4 3.6 5.3 2.2 2.3 2.3 −0.1 −0.1 −0.1 −1.2 −0.4
2008 Q1 −3.4 3.0 2.4 5.2 3.0 2.4 1.7 1.7 0.6 0.6 0.6 −1.2 −0.5Q2 −4.4 4.2 4.5 8.0 0.6 0.4 1.7 1.7 −1.3 −1.3 −1.3 −2.1 −1.3Q3 −4.7 5.4 6.6 8.6 1.4 2.2 2.1 2.1 −2.9 −2.9 −3.4 3.2 5.0Q4 −7.1 4.1 5.8 7.0 −1.5 1.4 1.6 1.6 −4.8 −4.8 −5.7 11.1 11.1
2009 Q1 −6.7 4.7 4.4 7.5 3.8 2.3 0.9 0.9 −5.7 −5.7 −7.0 15.6 17.6Q2 −4.2 3.3 2.1 3.3 6.6 1.2 0.5 0.5 −1.1 −1.1 −2.2 20.8 19.8Q3 −0.2 4.6 4.7 0.1 7.8 1.1 0.4 0.4 7.4 7.4 7.0 18.4 15.3Q4 3.4 6.5 5.2 3.9 11.7 0.1 1.5 1.5 9.7 9.7 9.9 13.2 11.0
2010 Q1 4.3 6.4 6.2 4.2 8.6 1.0 1.5 1.5 10.5 10.5 11.0 8.3 5.6

153
DG.DS Household final consumption expenditureDurable goodsImplied deflators - seasonally adjustedcontinued 2006 = 100
Communication Recreation and culture Miscellaneous
Musicalinstr uments &
Photo & Major majorTelephone & cinema equip Infor mation durables for durables for Jeweller y,
telefax Audio visual & optical processing outdoor indoor clocks &Total equipment Total equipment instr uments equipment recreation recreation Total watches
COICOP 08 08.2 09 09.1.1 09.1.2 09.1.3 09.2.1 09.2.2 12 12.3.1
LLOV UTPT LLOW AWRM AWRN AWRO AWRR AWRS LLOX AWSL2005 107.6 107.7 112.3 112.0 127.8 115.1 99.6 100.0 94.2 94.22006 100.0 100.0 100.0 100.0 100.0 100.0 100.0 100.0 100.0 100.02007 81.0 81.0 86.8 89.2 75.9 79.7 99.9 99.6 104.9 104.92008 68.1 68.1 73.0 78.7 56.8 61.5 100.9 100.0 112.6 112.62009 63.3 63.3 65.2 74.5 45.4 53.4 104.4 104.1 121.0 121.0
Percentage chang e , year on previous year
2005 −9.0 −8.9 −12.5 −11.9 −19.3 −19.8 1.1 − 0.9 0.92006 −7.1 −7.1 −11.0 −10.7 −21.8 −13.1 0.4 − 6.2 6.22007 −19.0 −19.0 −13.2 −10.8 −24.1 −20.3 −0.1 −0.4 4.9 4.92008 −15.9 −15.9 −15.9 −11.8 −25.2 −22.8 1.0 0.4 7.3 7.32009 −7.0 −7.0 −10.7 −5.3 −20.1 −13.2 3.5 4.1 7.5 7.5
Seasonally adjusted
2007 Q1 88.0 88.0 94.5 95.7 88.6 91.1 100.7 100.0 103.2 103.2Q2 82.7 82.7 88.9 90.1 80.1 82.8 100.5 100.0 104.4 104.4Q3 78.6 78.6 83.6 86.8 70.1 75.6 99.6 101.7 105.4 105.4Q4 75.5 75.5 81.3 85.2 66.9 72.1 98.8 94.3 106.7 106.7
2008 Q1 73.0 73.0 78.4 82.1 65.0 67.0 100.4 100.0 108.9 108.9Q2 68.3 68.3 74.4 79.6 59.2 62.5 100.4 100.0 112.4 112.4Q3 67.7 67.7 71.8 77.9 55.1 60.5 101.2 103.8 114.2 114.2Q4 64.2 64.2 68.5 75.5 51.7 57.0 101.6 97.1 115.3 115.3
2009 Q1 64.1 64.1 67.6 75.1 49.4 54.4 102.7 100.0 116.5 116.5Q2 64.2 64.2 65.9 75.8 45.4 54.7 104.1 105.7 119.9 119.9Q3 63.4 63.4 64.5 74.3 43.7 53.5 105.4 105.5 122.3 122.3Q4 61.5 61.5 63.1 72.9 43.8 51.5 105.6 105.1 124.7 124.7
2010 Q1 63.2 63.2 63.8 72.2 43.2 53.2 107.9 105.4 126.8 126.8
Percentage chang e , quar ter on previous quarter
2007 Q1 −7.7 −7.7 −3.1 −2.9 −7.9 −3.5 0.1 − 0.3 0.3Q2 −6.0 −6.0 −5.9 −5.9 −9.6 −9.1 −0.2 − 1.2 1.2Q3 −5.0 −5.0 −6.0 −3.7 −12.5 −8.7 −0.9 1.7 1.0 1.0Q4 −3.9 −3.9 −2.8 −1.8 −4.6 −4.6 −0.8 −7.3 1.2 1.2
2008 Q1 −3.3 −3.3 −3.6 −3.6 −2.8 −7.1 1.6 6.0 2.1 2.1Q2 −6.4 −6.4 −5.1 −3.0 −8.9 −6.7 − − 3.2 3.2Q3 −0.9 −0.9 −3.5 −2.1 −6.9 −3.2 0.8 3.8 1.6 1.6Q4 −5.2 −5.2 −4.6 −3.1 −6.2 −5.8 0.4 −6.5 1.0 1.0
2009 Q1 −0.2 −0.2 −1.3 −0.5 −4.4 −4.6 1.1 3.0 1.0 1.0Q2 0.2 0.2 −2.5 0.9 −8.1 0.6 1.4 5.7 2.9 2.9Q3 −1.2 −1.2 −2.1 −2.0 −3.7 −2.2 1.2 −0.2 2.0 2.0Q4 −3.0 −3.0 −2.2 −1.9 0.2 −3.7 0.2 −0.4 2.0 2.0
2010 Q1 2.8 2.8 1.1 −1.0 −1.4 3.3 2.2 0.3 1.7 1.7
Percentage chang e , quar ter on corresponding quarter of previous year
2007 Q1 −20.0 −20.0 −9.1 −7.9 −18.8 −14.1 2.0 − 7.1 7.1Q2 −15.6 −15.6 −11.0 −9.4 −19.3 −17.9 0.7 − 5.6 5.6Q3 −19.8 −19.8 −15.5 −11.7 −27.5 −23.9 −1.4 1.7 3.3 3.3Q4 −20.8 −20.8 −16.6 −13.6 −30.5 −23.6 −1.8 −5.7 3.7 3.7
2008 Q1 −17.0 −17.0 −17.0 −14.2 −26.6 −26.5 −0.3 − 5.5 5.5Q2 −17.4 −17.4 −16.3 −11.7 −26.1 −24.5 −0.1 − 7.7 7.7Q3 −13.9 −13.9 −14.1 −10.3 −21.4 −20.0 1.6 2.1 8.3 8.3Q4 −15.0 −15.0 −15.7 −11.4 −22.7 −20.9 2.8 3.0 8.1 8.1
2009 Q1 −12.2 −12.2 −13.8 −8.5 −24.0 −18.8 2.3 − 7.0 7.0Q2 −6.0 −6.0 −11.4 −4.8 −23.3 −12.5 3.7 5.7 6.7 6.7Q3 −6.4 −6.4 −10.2 −4.6 −20.7 −11.6 4.2 1.6 7.1 7.1Q4 −4.2 −4.2 −7.9 −3.4 −15.3 −9.6 3.9 8.2 8.2 8.2
2010 Q1 −1.4 −1.4 −5.6 −3.9 −12.6 −2.2 5.1 5.4 8.8 8.8
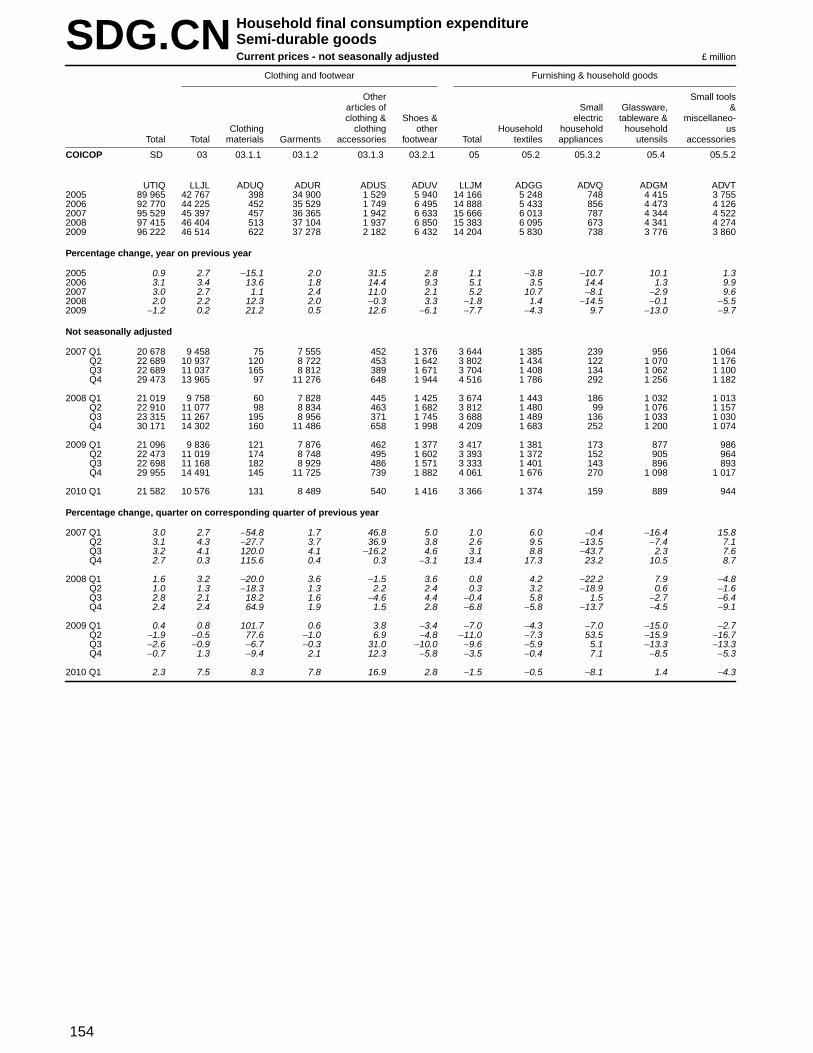
154
SDG.CN Household final consumption expenditureSemi-durable goodsCurrent prices - not seasonally adjusted £ million
Clothing and footwear Furnishing & household goods
Other Small toolsar ticles of Small Glassware, &clothing & Shoes & electr ic tableware & miscellaneo-
Clothing clothing other Household household household usTotal Total materials Garments accessories footwear Total textiles appliances utensils accessories
COICOP SD 03 03.1.1 03.1.2 03.1.3 03.2.1 05 05.2 05.3.2 05.4 05.5.2
UTIQ LLJL ADUQ ADUR ADUS ADUV LLJM ADGG ADVQ ADGM ADVT2005 89 965 42 767 398 34 900 1 529 5 940 14 166 5 248 748 4 415 3 7552006 92 770 44 225 452 35 529 1 749 6 495 14 888 5 433 856 4 473 4 1262007 95 529 45 397 457 36 365 1 942 6 633 15 666 6 013 787 4 344 4 5222008 97 415 46 404 513 37 104 1 937 6 850 15 383 6 095 673 4 341 4 2742009 96 222 46 514 622 37 278 2 182 6 432 14 204 5 830 738 3 776 3 860
Percentage chang e , year on previous year
2005 0.9 2.7 −15.1 2.0 31.5 2.8 1.1 −3.8 −10.7 10.1 1.32006 3.1 3.4 13.6 1.8 14.4 9.3 5.1 3.5 14.4 1.3 9.92007 3.0 2.7 1.1 2.4 11.0 2.1 5.2 10.7 −8.1 −2.9 9.62008 2.0 2.2 12.3 2.0 −0.3 3.3 −1.8 1.4 −14.5 −0.1 −5.52009 −1.2 0.2 21.2 0.5 12.6 −6.1 −7.7 −4.3 9.7 −13.0 −9.7
Not seasonally adjusted
2007 Q1 20 678 9 458 75 7 555 452 1 376 3 644 1 385 239 956 1 064Q2 22 689 10 937 120 8 722 453 1 642 3 802 1 434 122 1 070 1 176Q3 22 689 11 037 165 8 812 389 1 671 3 704 1 408 134 1 062 1 100Q4 29 473 13 965 97 11 276 648 1 944 4 516 1 786 292 1 256 1 182
2008 Q1 21 019 9 758 60 7 828 445 1 425 3 674 1 443 186 1 032 1 013Q2 22 910 11 077 98 8 834 463 1 682 3 812 1 480 99 1 076 1 157Q3 23 315 11 267 195 8 956 371 1 745 3 688 1 489 136 1 033 1 030Q4 30 171 14 302 160 11 486 658 1 998 4 209 1 683 252 1 200 1 074
2009 Q1 21 096 9 836 121 7 876 462 1 377 3 417 1 381 173 877 986Q2 22 473 11 019 174 8 748 495 1 602 3 393 1 372 152 905 964Q3 22 698 11 168 182 8 929 486 1 571 3 333 1 401 143 896 893Q4 29 955 14 491 145 11 725 739 1 882 4 061 1 676 270 1 098 1 017
2010 Q1 21 582 10 576 131 8 489 540 1 416 3 366 1 374 159 889 944
Percentage chang e , quar ter on corresponding quarter of previous year
2007 Q1 3.0 2.7 −54.8 1.7 46.8 5.0 1.0 6.0 −0.4 −16.4 15.8Q2 3.1 4.3 −27.7 3.7 36.9 3.8 2.6 9.5 −13.5 −7.4 7.1Q3 3.2 4.1 120.0 4.1 −16.2 4.6 3.1 8.8 −43.7 2.3 7.6Q4 2.7 0.3 115.6 0.4 0.3 −3.1 13.4 17.3 23.2 10.5 8.7
2008 Q1 1.6 3.2 −20.0 3.6 −1.5 3.6 0.8 4.2 −22.2 7.9 −4.8Q2 1.0 1.3 −18.3 1.3 2.2 2.4 0.3 3.2 −18.9 0.6 −1.6Q3 2.8 2.1 18.2 1.6 −4.6 4.4 −0.4 5.8 1.5 −2.7 −6.4Q4 2.4 2.4 64.9 1.9 1.5 2.8 −6.8 −5.8 −13.7 −4.5 −9.1
2009 Q1 0.4 0.8 101.7 0.6 3.8 −3.4 −7.0 −4.3 −7.0 −15.0 −2.7Q2 −1.9 −0.5 77.6 −1.0 6.9 −4.8 −11.0 −7.3 53.5 −15.9 −16.7Q3 −2.6 −0.9 −6.7 −0.3 31.0 −10.0 −9.6 −5.9 5.1 −13.3 −13.3Q4 −0.7 1.3 −9.4 2.1 12.3 −5.8 −3.5 −0.4 7.1 −8.5 −5.3
2010 Q1 2.3 7.5 8.3 7.8 16.9 2.8 −1.5 −0.5 −8.1 1.4 −4.3
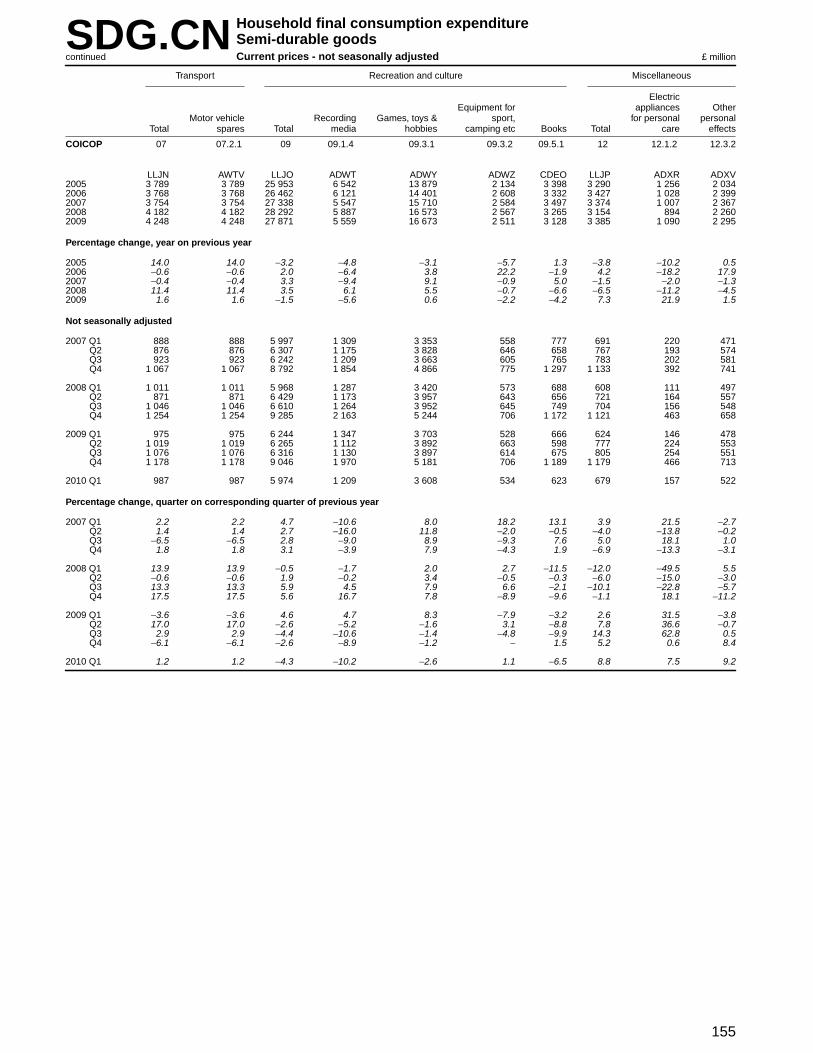
155
SDG.CN Household final consumption expenditureSemi-durable goodsCurrent prices - not seasonally adjustedcontinued £ million
Tr anspor t Recreation and culture Miscellaneous
Electr icEquipment for appliances Other
Motor vehicle Recording Games, toys & spor t, for personal personalTotal spares Total media hobbies camping etc Books Total care effects
COICOP 07 07.2.1 09 09.1.4 09.3.1 09.3.2 09.5.1 12 12.1.2 12.3.2
LLJN AWTV LLJO ADWT ADWY ADWZ CDEO LLJP ADXR ADXV2005 3 789 3 789 25 953 6 542 13 879 2 134 3 398 3 290 1 256 2 0342006 3 768 3 768 26 462 6 121 14 401 2 608 3 332 3 427 1 028 2 3992007 3 754 3 754 27 338 5 547 15 710 2 584 3 497 3 374 1 007 2 3672008 4 182 4 182 28 292 5 887 16 573 2 567 3 265 3 154 894 2 2602009 4 248 4 248 27 871 5 559 16 673 2 511 3 128 3 385 1 090 2 295
Percentage chang e , year on previous year
2005 14.0 14.0 −3.2 −4.8 −3.1 −5.7 1.3 −3.8 −10.2 0.52006 −0.6 −0.6 2.0 −6.4 3.8 22.2 −1.9 4.2 −18.2 17.92007 −0.4 −0.4 3.3 −9.4 9.1 −0.9 5.0 −1.5 −2.0 −1.32008 11.4 11.4 3.5 6.1 5.5 −0.7 −6.6 −6.5 −11.2 −4.52009 1.6 1.6 −1.5 −5.6 0.6 −2.2 −4.2 7.3 21.9 1.5
Not seasonally adjusted
2007 Q1 888 888 5 997 1 309 3 353 558 777 691 220 471Q2 876 876 6 307 1 175 3 828 646 658 767 193 574Q3 923 923 6 242 1 209 3 663 605 765 783 202 581Q4 1 067 1 067 8 792 1 854 4 866 775 1 297 1 133 392 741
2008 Q1 1 011 1 011 5 968 1 287 3 420 573 688 608 111 497Q2 871 871 6 429 1 173 3 957 643 656 721 164 557Q3 1 046 1 046 6 610 1 264 3 952 645 749 704 156 548Q4 1 254 1 254 9 285 2 163 5 244 706 1 172 1 121 463 658
2009 Q1 975 975 6 244 1 347 3 703 528 666 624 146 478Q2 1 019 1 019 6 265 1 112 3 892 663 598 777 224 553Q3 1 076 1 076 6 316 1 130 3 897 614 675 805 254 551Q4 1 178 1 178 9 046 1 970 5 181 706 1 189 1 179 466 713
2010 Q1 987 987 5 974 1 209 3 608 534 623 679 157 522
Percentage chang e , quar ter on corresponding quarter of previous year
2007 Q1 2.2 2.2 4.7 −10.6 8.0 18.2 13.1 3.9 21.5 −2.7Q2 1.4 1.4 2.7 −16.0 11.8 −2.0 −0.5 −4.0 −13.8 −0.2Q3 −6.5 −6.5 2.8 −9.0 8.9 −9.3 7.6 5.0 18.1 1.0Q4 1.8 1.8 3.1 −3.9 7.9 −4.3 1.9 −6.9 −13.3 −3.1
2008 Q1 13.9 13.9 −0.5 −1.7 2.0 2.7 −11.5 −12.0 −49.5 5.5Q2 −0.6 −0.6 1.9 −0.2 3.4 −0.5 −0.3 −6.0 −15.0 −3.0Q3 13.3 13.3 5.9 4.5 7.9 6.6 −2.1 −10.1 −22.8 −5.7Q4 17.5 17.5 5.6 16.7 7.8 −8.9 −9.6 −1.1 18.1 −11.2
2009 Q1 −3.6 −3.6 4.6 4.7 8.3 −7.9 −3.2 2.6 31.5 −3.8Q2 17.0 17.0 −2.6 −5.2 −1.6 3.1 −8.8 7.8 36.6 −0.7Q3 2.9 2.9 −4.4 −10.6 −1.4 −4.8 −9.9 14.3 62.8 0.5Q4 −6.1 −6.1 −2.6 −8.9 −1.2 − 1.5 5.2 0.6 8.4
2010 Q1 1.2 1.2 −4.3 −10.2 −2.6 1.1 −6.5 8.8 7.5 9.2

156
SDG.CS Household final consumption expenditureSemi-durable goodsCurrent prices - seasonally adjusted £ million
Clothing and footwear Furnishing & household goods
Other Small toolsar ticles of Small Glassware, &clothing & Shoes & electr ic tableware & miscellaneo-
Clothing clothing other Household household household usTotal Total materials Garments accessories footwear Total textiles appliances utensils accessories
COICOP SD 03 03.1.1 03.1.2 03.1.3 03.2.1 05 05.2 05.3.2 05.4 05.5.2
UTIR LLKS XYDZ ZAVJ XYEA ATKU LLKT ATMF XYEC ATMJ XYEE2005 89 965 42 767 398 34 900 1 529 5 940 14 166 5 248 748 4 415 3 7552006 92 770 44 225 452 35 529 1 749 6 495 14 888 5 433 856 4 473 4 1262007 95 529 45 397 457 36 365 1 942 6 633 15 666 6 013 787 4 344 4 5222008 97 415 46 404 513 37 104 1 937 6 850 15 383 6 095 673 4 341 4 2742009 96 222 46 514 622 37 278 2 182 6 432 14 204 5 830 738 3 776 3 860
Percentage chang e , year on previous year
2005 0.9 2.7 −15.1 2.0 31.5 2.8 1.1 −3.8 −10.7 10.1 1.32006 3.1 3.4 13.6 1.8 14.4 9.3 5.1 3.5 14.4 1.3 9.92007 3.0 2.7 1.1 2.4 11.0 2.1 5.2 10.7 −8.1 −2.9 9.62008 2.0 2.2 12.3 2.0 −0.3 3.3 −1.8 1.4 −14.5 −0.1 −5.52009 −1.2 0.2 21.2 0.5 12.6 −6.1 −7.7 −4.3 9.7 −13.0 −9.7
Seasonally adjusted
2007 Q1 23 592 11 111 97 8 872 512 1 630 3 849 1 457 239 1 038 1 115Q2 24 067 11 477 107 9 194 516 1 660 3 897 1 507 171 1 110 1 109Q3 24 001 11 500 135 9 258 431 1 676 3 896 1 474 168 1 112 1 142Q4 23 869 11 309 118 9 041 483 1 667 4 024 1 575 209 1 084 1 156
2008 Q1 24 031 11 451 91 9 167 504 1 689 3 883 1 510 194 1 119 1 060Q2 24 365 11 633 101 9 311 519 1 702 3 913 1 550 142 1 116 1 105Q3 24 611 11 691 144 9 380 419 1 748 3 866 1 552 166 1 077 1 071Q4 24 408 11 629 177 9 246 495 1 711 3 721 1 483 171 1 029 1 038
2009 Q1 24 157 11 579 170 9 253 520 1 636 3 608 1 447 179 956 1 026Q2 23 967 11 580 165 9 253 543 1 619 3 525 1 438 219 940 928Q3 23 962 11 606 143 9 343 552 1 568 3 498 1 462 166 937 933Q4 24 136 11 749 144 9 429 567 1 609 3 573 1 483 174 943 973
2010 Q1 24 614 12 344 158 9 917 589 1 680 3 555 1 446 153 972 984
Percentage chang e , quar ter on previous quarter
2007 Q1 1.9 −1.0 83.0 −1.0 7.3 −5.7 8.8 9.1 48.4 7.3 3.8Q2 2.0 3.3 10.3 3.6 0.8 1.8 1.2 3.4 −28.5 6.9 −0.5Q3 −0.3 0.2 26.2 0.7 −16.5 1.0 − −2.2 −1.8 0.2 3.0Q4 −0.5 −1.7 −12.6 −2.3 12.1 −0.5 3.3 6.9 24.4 −2.5 1.2
2008 Q1 0.7 1.3 −22.9 1.4 4.3 1.3 −3.5 −4.1 −7.2 3.2 −8.3Q2 1.4 1.6 11.0 1.6 3.0 0.8 0.8 2.6 −26.8 −0.3 4.2Q3 1.0 0.5 42.6 0.7 −19.3 2.7 −1.2 0.1 16.9 −3.5 −3.1Q4 −0.8 −0.5 22.9 −1.4 18.1 −2.1 −3.8 −4.4 3.0 −4.5 −3.1
2009 Q1 −1.0 −0.4 −4.0 0.1 5.1 −4.4 −3.0 −2.4 4.7 −7.1 −1.2Q2 −0.8 − −2.9 − 4.4 −1.0 −2.3 −0.6 22.3 −1.7 −9.6Q3 − 0.2 −13.3 1.0 1.7 −3.2 −0.8 1.7 −24.2 −0.3 0.5Q4 0.7 1.2 0.7 0.9 2.7 2.6 2.1 1.4 4.8 0.6 4.3
2010 Q1 2.0 5.1 9.7 5.2 3.9 4.4 −0.5 −2.5 −12.1 3.1 1.1
Percentage chang e , quar ter on corresponding quarter of previous year
2007 Q1 3.0 2.3 −52.0 1.4 43.0 4.6 1.3 6.5 3.9 −15.7 15.2Q2 3.1 4.3 −15.7 3.4 32.0 3.6 3.1 9.4 −8.1 −6.8 8.2Q3 2.7 3.3 92.9 3.6 −17.6 4.4 3.3 9.0 −39.8 2.7 7.8Q4 3.1 0.8 122.6 0.9 1.3 −3.6 13.8 18.0 29.8 12.1 7.6
2008 Q1 1.9 3.1 −6.2 3.3 −1.6 3.6 0.9 3.6 −18.8 7.8 −4.9Q2 1.2 1.4 −5.6 1.3 0.6 2.5 0.4 2.9 −17.0 0.5 −0.4Q3 2.5 1.7 6.7 1.3 −2.8 4.3 −0.8 5.3 −1.2 −3.1 −6.2Q4 2.3 2.8 50.0 2.3 2.5 2.6 −7.5 −5.8 −18.2 −5.1 −10.2
2009 Q1 0.5 1.1 86.8 0.9 3.2 −3.1 −7.1 −4.2 −7.7 −14.6 −3.2Q2 −1.6 −0.5 63.4 −0.6 4.6 −4.9 −9.9 −7.2 54.2 −15.8 −16.0Q3 −2.6 −0.7 −0.7 −0.4 31.7 −10.3 −9.5 −5.8 − −13.0 −12.9Q4 −1.1 1.0 −18.6 2.0 14.5 −6.0 −4.0 − 1.8 −8.4 −6.3
2010 Q1 1.9 6.6 −7.1 7.2 13.3 2.7 −1.5 −0.1 −14.5 1.7 −4.1
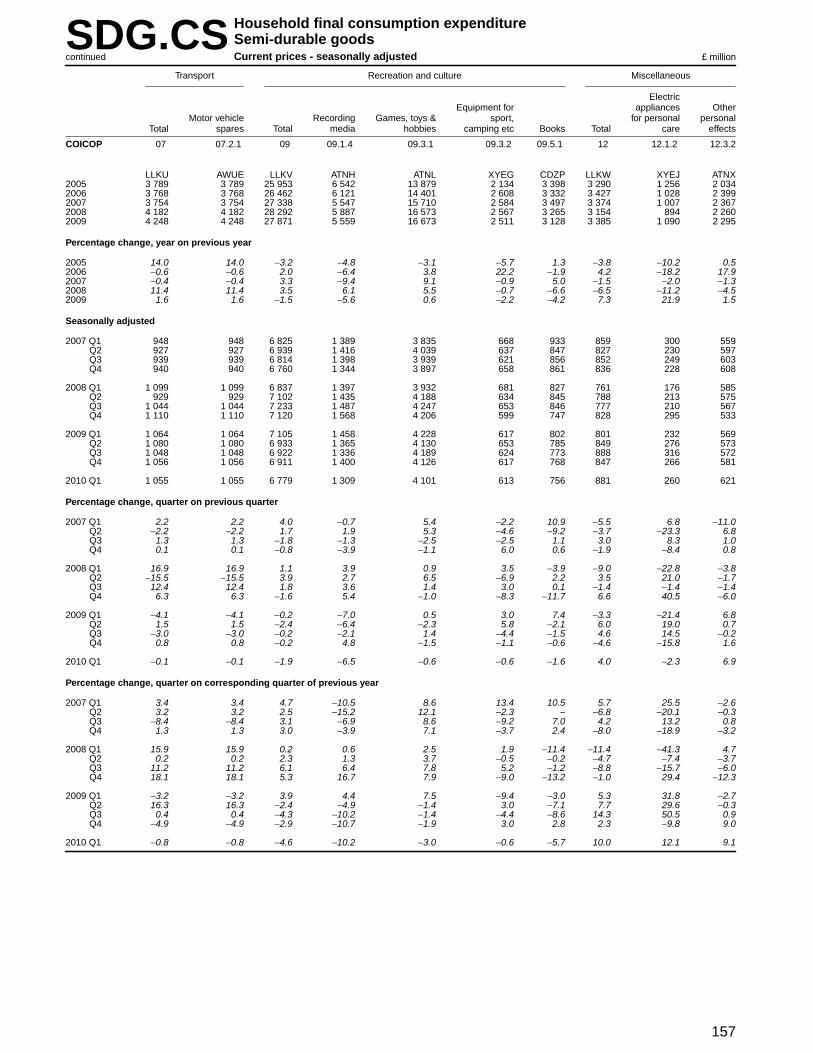
157
SDG.CS Household final consumption expenditureSemi-durable goodsCurrent prices - seasonally adjustedcontinued £ million
Tr anspor t Recreation and culture Miscellaneous
Electr icEquipment for appliances Other
Motor vehicle Recording Games, toys & spor t, for personal personalTotal spares Total media hobbies camping etc Books Total care effects
COICOP 07 07.2.1 09 09.1.4 09.3.1 09.3.2 09.5.1 12 12.1.2 12.3.2
LLKU AWUE LLKV ATNH ATNL XYEG CDZP LLKW XYEJ ATNX2005 3 789 3 789 25 953 6 542 13 879 2 134 3 398 3 290 1 256 2 0342006 3 768 3 768 26 462 6 121 14 401 2 608 3 332 3 427 1 028 2 3992007 3 754 3 754 27 338 5 547 15 710 2 584 3 497 3 374 1 007 2 3672008 4 182 4 182 28 292 5 887 16 573 2 567 3 265 3 154 894 2 2602009 4 248 4 248 27 871 5 559 16 673 2 511 3 128 3 385 1 090 2 295
Percentage chang e , year on previous year
2005 14.0 14.0 −3.2 −4.8 −3.1 −5.7 1.3 −3.8 −10.2 0.52006 −0.6 −0.6 2.0 −6.4 3.8 22.2 −1.9 4.2 −18.2 17.92007 −0.4 −0.4 3.3 −9.4 9.1 −0.9 5.0 −1.5 −2.0 −1.32008 11.4 11.4 3.5 6.1 5.5 −0.7 −6.6 −6.5 −11.2 −4.52009 1.6 1.6 −1.5 −5.6 0.6 −2.2 −4.2 7.3 21.9 1.5
Seasonally adjusted
2007 Q1 948 948 6 825 1 389 3 835 668 933 859 300 559Q2 927 927 6 939 1 416 4 039 637 847 827 230 597Q3 939 939 6 814 1 398 3 939 621 856 852 249 603Q4 940 940 6 760 1 344 3 897 658 861 836 228 608
2008 Q1 1 099 1 099 6 837 1 397 3 932 681 827 761 176 585Q2 929 929 7 102 1 435 4 188 634 845 788 213 575Q3 1 044 1 044 7 233 1 487 4 247 653 846 777 210 567Q4 1 110 1 110 7 120 1 568 4 206 599 747 828 295 533
2009 Q1 1 064 1 064 7 105 1 458 4 228 617 802 801 232 569Q2 1 080 1 080 6 933 1 365 4 130 653 785 849 276 573Q3 1 048 1 048 6 922 1 336 4 189 624 773 888 316 572Q4 1 056 1 056 6 911 1 400 4 126 617 768 847 266 581
2010 Q1 1 055 1 055 6 779 1 309 4 101 613 756 881 260 621
Percentage chang e , quar ter on previous quarter
2007 Q1 2.2 2.2 4.0 −0.7 5.4 −2.2 10.9 −5.5 6.8 −11.0Q2 −2.2 −2.2 1.7 1.9 5.3 −4.6 −9.2 −3.7 −23.3 6.8Q3 1.3 1.3 −1.8 −1.3 −2.5 −2.5 1.1 3.0 8.3 1.0Q4 0.1 0.1 −0.8 −3.9 −1.1 6.0 0.6 −1.9 −8.4 0.8
2008 Q1 16.9 16.9 1.1 3.9 0.9 3.5 −3.9 −9.0 −22.8 −3.8Q2 −15.5 −15.5 3.9 2.7 6.5 −6.9 2.2 3.5 21.0 −1.7Q3 12.4 12.4 1.8 3.6 1.4 3.0 0.1 −1.4 −1.4 −1.4Q4 6.3 6.3 −1.6 5.4 −1.0 −8.3 −11.7 6.6 40.5 −6.0
2009 Q1 −4.1 −4.1 −0.2 −7.0 0.5 3.0 7.4 −3.3 −21.4 6.8Q2 1.5 1.5 −2.4 −6.4 −2.3 5.8 −2.1 6.0 19.0 0.7Q3 −3.0 −3.0 −0.2 −2.1 1.4 −4.4 −1.5 4.6 14.5 −0.2Q4 0.8 0.8 −0.2 4.8 −1.5 −1.1 −0.6 −4.6 −15.8 1.6
2010 Q1 −0.1 −0.1 −1.9 −6.5 −0.6 −0.6 −1.6 4.0 −2.3 6.9
Percentage chang e , quar ter on corresponding quarter of previous year
2007 Q1 3.4 3.4 4.7 −10.5 8.6 13.4 10.5 5.7 25.5 −2.6Q2 3.2 3.2 2.5 −15.2 12.1 −2.3 − −6.8 −20.1 −0.3Q3 −8.4 −8.4 3.1 −6.9 8.6 −9.2 7.0 4.2 13.2 0.8Q4 1.3 1.3 3.0 −3.9 7.1 −3.7 2.4 −8.0 −18.9 −3.2
2008 Q1 15.9 15.9 0.2 0.6 2.5 1.9 −11.4 −11.4 −41.3 4.7Q2 0.2 0.2 2.3 1.3 3.7 −0.5 −0.2 −4.7 −7.4 −3.7Q3 11.2 11.2 6.1 6.4 7.8 5.2 −1.2 −8.8 −15.7 −6.0Q4 18.1 18.1 5.3 16.7 7.9 −9.0 −13.2 −1.0 29.4 −12.3
2009 Q1 −3.2 −3.2 3.9 4.4 7.5 −9.4 −3.0 5.3 31.8 −2.7Q2 16.3 16.3 −2.4 −4.9 −1.4 3.0 −7.1 7.7 29.6 −0.3Q3 0.4 0.4 −4.3 −10.2 −1.4 −4.4 −8.6 14.3 50.5 0.9Q4 −4.9 −4.9 −2.9 −10.7 −1.9 3.0 2.8 2.3 −9.8 9.0
2010 Q1 −0.8 −0.8 −4.6 −10.2 −3.0 −0.6 −5.7 10.0 12.1 9.1
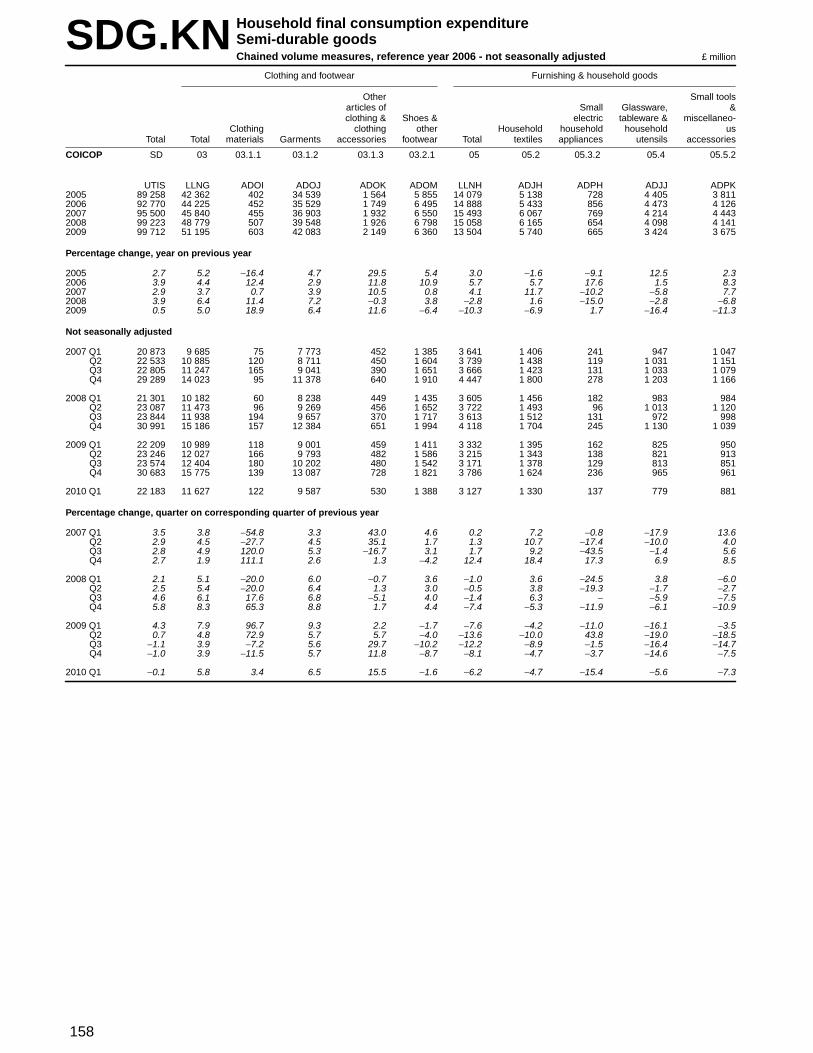
158
SDG.KN Household final consumption expenditureSemi-durable goodsChained volume measures, reference year 2006 - not seasonally adjusted £ million
Clothing and footwear Furnishing & household goods
Other Small toolsar ticles of Small Glassware, &clothing & Shoes & electr ic tableware & miscellaneo-
Clothing clothing other Household household household usTotal Total materials Garments accessories footwear Total textiles appliances utensils accessories
COICOP SD 03 03.1.1 03.1.2 03.1.3 03.2.1 05 05.2 05.3.2 05.4 05.5.2
UTIS LLNG ADOI ADOJ ADOK ADOM LLNH ADJH ADPH ADJJ ADPK2005 89 258 42 362 402 34 539 1 564 5 855 14 079 5 138 728 4 405 3 8112006 92 770 44 225 452 35 529 1 749 6 495 14 888 5 433 856 4 473 4 1262007 95 500 45 840 455 36 903 1 932 6 550 15 493 6 067 769 4 214 4 4432008 99 223 48 779 507 39 548 1 926 6 798 15 058 6 165 654 4 098 4 1412009 99 712 51 195 603 42 083 2 149 6 360 13 504 5 740 665 3 424 3 675
Percentage chang e , year on previous year
2005 2.7 5.2 −16.4 4.7 29.5 5.4 3.0 −1.6 −9.1 12.5 2.32006 3.9 4.4 12.4 2.9 11.8 10.9 5.7 5.7 17.6 1.5 8.32007 2.9 3.7 0.7 3.9 10.5 0.8 4.1 11.7 −10.2 −5.8 7.72008 3.9 6.4 11.4 7.2 −0.3 3.8 −2.8 1.6 −15.0 −2.8 −6.82009 0.5 5.0 18.9 6.4 11.6 −6.4 −10.3 −6.9 1.7 −16.4 −11.3
Not seasonally adjusted
2007 Q1 20 873 9 685 75 7 773 452 1 385 3 641 1 406 241 947 1 047Q2 22 533 10 885 120 8 711 450 1 604 3 739 1 438 119 1 031 1 151Q3 22 805 11 247 165 9 041 390 1 651 3 666 1 423 131 1 033 1 079Q4 29 289 14 023 95 11 378 640 1 910 4 447 1 800 278 1 203 1 166
2008 Q1 21 301 10 182 60 8 238 449 1 435 3 605 1 456 182 983 984Q2 23 087 11 473 96 9 269 456 1 652 3 722 1 493 96 1 013 1 120Q3 23 844 11 938 194 9 657 370 1 717 3 613 1 512 131 972 998Q4 30 991 15 186 157 12 384 651 1 994 4 118 1 704 245 1 130 1 039
2009 Q1 22 209 10 989 118 9 001 459 1 411 3 332 1 395 162 825 950Q2 23 246 12 027 166 9 793 482 1 586 3 215 1 343 138 821 913Q3 23 574 12 404 180 10 202 480 1 542 3 171 1 378 129 813 851Q4 30 683 15 775 139 13 087 728 1 821 3 786 1 624 236 965 961
2010 Q1 22 183 11 627 122 9 587 530 1 388 3 127 1 330 137 779 881
Percentage chang e , quar ter on corresponding quarter of previous year
2007 Q1 3.5 3.8 −54.8 3.3 43.0 4.6 0.2 7.2 −0.8 −17.9 13.6Q2 2.9 4.5 −27.7 4.5 35.1 1.7 1.3 10.7 −17.4 −10.0 4.0Q3 2.8 4.9 120.0 5.3 −16.7 3.1 1.7 9.2 −43.5 −1.4 5.6Q4 2.7 1.9 111.1 2.6 1.3 −4.2 12.4 18.4 17.3 6.9 8.5
2008 Q1 2.1 5.1 −20.0 6.0 −0.7 3.6 −1.0 3.6 −24.5 3.8 −6.0Q2 2.5 5.4 −20.0 6.4 1.3 3.0 −0.5 3.8 −19.3 −1.7 −2.7Q3 4.6 6.1 17.6 6.8 −5.1 4.0 −1.4 6.3 − −5.9 −7.5Q4 5.8 8.3 65.3 8.8 1.7 4.4 −7.4 −5.3 −11.9 −6.1 −10.9
2009 Q1 4.3 7.9 96.7 9.3 2.2 −1.7 −7.6 −4.2 −11.0 −16.1 −3.5Q2 0.7 4.8 72.9 5.7 5.7 −4.0 −13.6 −10.0 43.8 −19.0 −18.5Q3 −1.1 3.9 −7.2 5.6 29.7 −10.2 −12.2 −8.9 −1.5 −16.4 −14.7Q4 −1.0 3.9 −11.5 5.7 11.8 −8.7 −8.1 −4.7 −3.7 −14.6 −7.5
2010 Q1 −0.1 5.8 3.4 6.5 15.5 −1.6 −6.2 −4.7 −15.4 −5.6 −7.3

159
SDG.KN Household final consumption expenditureSemi-durable goodsChained volume measures, reference year 2006 - not seasonally adjustedcontinued £ million
Tr anspor t Recreation and culture Miscellaneous
Electr icEquipment for appliances Other
Motor vehicle Recording Games, toys & spor t, for personal personalTotal spares Total media hobbies camping etc Books Total care effects
COICOP 07 07.2.1 09 09.1.4 09.3.1 09.3.2 09.5.1 12 12.1.2 12.3.2
LLNI AWUN LLNJ ADQK ADQP ADQQ CCHI LLNK ADYH ADYK2005 3 917 3 916 25 563 6 498 13 403 2 122 3 564 3 347 1 290 2 0622006 3 768 3 768 26 462 6 121 14 401 2 608 3 332 3 427 1 028 2 3992007 3 704 3 704 27 206 5 472 15 851 2 540 3 343 3 257 965 2 2922008 3 989 3 989 28 443 6 025 17 065 2 448 2 905 2 954 835 2 1192009 3 850 3 850 28 074 6 168 16 826 2 320 2 760 3 089 989 2 100
Percentage chang e , year on previous year
2005 10.8 10.7 −1.3 −2.1 −1.0 −2.3 −0.3 −6.6 −14.2 −1.22006 −3.8 −3.8 3.5 −5.8 7.4 22.9 −6.5 2.4 −20.3 16.32007 −1.7 −1.7 2.8 −10.6 10.1 −2.6 0.3 −5.0 −6.1 −4.52008 7.7 7.7 4.5 10.1 7.7 −3.6 −13.1 −9.3 −13.5 −7.52009 −3.5 −3.5 −1.3 2.4 −1.4 −5.2 −5.0 4.6 18.4 −0.9
Not seasonally adjusted
2007 Q1 884 884 5 987 1 300 3 364 555 768 676 213 463Q2 871 871 6 302 1 142 3 888 633 639 736 184 552Q3 905 905 6 230 1 198 3 726 594 712 757 195 562Q4 1 044 1 044 8 687 1 832 4 873 758 1 224 1 088 373 715
2008 Q1 976 976 5 960 1 289 3 497 567 607 578 105 473Q2 832 832 6 387 1 163 4 042 616 566 673 155 518Q3 995 995 6 638 1 292 4 087 605 654 660 147 513Q4 1 186 1 186 9 458 2 281 5 439 660 1 078 1 043 428 615
2009 Q1 902 902 6 407 1 528 3 798 511 570 579 134 445Q2 927 927 6 369 1 234 3 987 613 535 708 203 505Q3 968 968 6 293 1 250 3 906 555 582 738 230 508Q4 1 053 1 053 9 005 2 156 5 135 641 1 073 1 064 422 642
2010 Q1 862 862 5 948 1 323 3 596 492 537 619 139 480
Percentage chang e , quar ter on corresponding quarter of previous year
2007 Q1 0.3 0.3 6.1 −9.8 11.1 15.6 10.2 −1.5 10.4 −6.3Q2 0.5 0.5 2.9 −17.7 14.3 −3.9 −4.8 −7.5 −17.1 −3.8Q3 −7.8 −7.8 1.6 −11.5 9.5 −10.1 0.7 1.9 16.1 −2.1Q4 0.6 0.6 1.4 −5.5 6.7 −6.2 −2.6 −9.5 −16.2 −5.5
2008 Q1 10.4 10.4 −0.5 −0.8 4.0 2.2 −21.0 −14.5 −50.7 2.2Q2 −4.5 −4.5 1.3 1.8 4.0 −2.7 −11.4 −8.6 −15.8 −6.2Q3 9.9 9.9 6.5 7.8 9.7 1.9 −8.1 −12.8 −24.6 −8.7Q4 13.6 13.6 8.9 24.5 11.6 −12.9 −11.9 −4.1 14.7 −14.0
2009 Q1 −7.6 −7.6 7.5 18.5 8.6 −9.9 −6.1 0.2 27.6 −5.9Q2 11.4 11.4 −0.3 6.1 −1.4 −0.5 −5.5 5.2 31.0 −2.5Q3 −2.7 −2.7 −5.2 −3.3 −4.4 −8.3 −11.0 11.8 56.5 −1.0Q4 −11.2 −11.2 −4.8 −5.5 −5.6 −2.9 −0.5 2.0 −1.4 4.4
2010 Q1 −4.4 −4.4 −7.2 −13.4 −5.3 −3.7 −5.8 6.9 3.7 7.9

160
SDG.KS Household final consumption expenditureSemi-durable goodsChained volume measures, reference year 2006 - seasonally adjusted £ million
Clothing and footwear Furnishing & household goods
Other Small toolsar ticles of Small Glassware, &clothing & Shoes & electr ic tableware & miscellaneo-
Clothing clothing other Household household household usTotal Total materials Garments accessories footwear Total textiles appliances utensils accessories
COICOP SD 03 03.1.1 03.1.2 03.1.3 03.2.1 05 05.2 05.3.2 05.4 05.5.2
UTIT LLLZ XYJN ZAVK XYJO ATQV LLMA ATRF XYJQ ATRJ XYJS2005 89 258 42 362 402 34 539 1 564 5 855 14 079 5 138 728 4 405 3 8112006 92 770 44 225 452 35 529 1 749 6 495 14 888 5 433 856 4 473 4 1262007 95 500 45 840 455 36 903 1 932 6 550 15 493 6 067 769 4 214 4 4432008 99 223 48 779 507 39 548 1 926 6 798 15 058 6 165 654 4 098 4 1412009 99 712 51 195 603 42 083 2 149 6 360 13 504 5 740 665 3 424 3 675
Percentage chang e , year on previous year
2005 2.7 5.2 −16.4 4.7 29.5 5.4 3.0 −1.6 −9.1 12.5 2.32006 3.9 4.4 12.4 2.9 11.8 10.9 5.7 5.7 17.6 1.5 8.32007 2.9 3.7 0.7 3.9 10.5 0.8 4.1 11.7 −10.2 −5.8 7.72008 3.9 6.4 11.4 7.2 −0.3 3.8 −2.8 1.6 −15.0 −2.8 −6.82009 0.5 5.0 18.9 6.4 11.6 −6.4 −10.3 −6.9 1.7 −16.4 −11.3
Seasonally adjusted
2007 Q1 23 638 11 221 96 8 996 510 1 619 3 833 1 469 241 1 023 1 100Q2 23 983 11 488 105 9 244 509 1 630 3 851 1 521 167 1 076 1 087Q3 24 000 11 629 135 9 408 431 1 655 3 839 1 484 163 1 073 1 119Q4 23 879 11 502 119 9 255 482 1 646 3 970 1 593 198 1 042 1 137
2008 Q1 24 214 11 803 89 9 531 507 1 676 3 799 1 515 190 1 063 1 031Q2 24 686 12 150 97 9 862 508 1 683 3 843 1 573 138 1 059 1 073Q3 25 100 12 325 144 10 040 417 1 724 3 776 1 572 160 1 008 1 036Q4 25 223 12 501 177 10 115 494 1 715 3 640 1 505 166 968 1 001
2009 Q1 25 259 12 759 161 10 435 516 1 647 3 508 1 454 168 897 989Q2 24 881 12 718 154 10 428 525 1 611 3 356 1 416 199 857 884Q3 24 766 12 799 143 10 571 544 1 541 3 307 1 432 147 842 886Q4 24 806 12 919 145 10 649 564 1 561 3 333 1 438 151 828 916
2010 Q1 25 110 13 379 143 11 043 577 1 616 3 292 1 392 131 850 919
Percentage chang e , quar ter on previous quarter
2007 Q1 2.1 − 81.1 0.3 8.1 −6.2 8.8 9.5 48.8 6.6 3.8Q2 1.5 2.4 9.4 2.8 −0.2 0.7 0.5 3.5 −30.7 5.2 −1.2Q3 0.1 1.2 28.6 1.8 −15.3 1.5 −0.3 −2.4 −2.4 −0.3 2.9Q4 −0.5 −1.1 −11.9 −1.6 11.8 −0.5 3.4 7.3 21.5 −2.9 1.6
2008 Q1 1.4 2.6 −25.2 3.0 5.2 1.8 −4.3 −4.9 −4.0 2.0 −9.3Q2 1.9 2.9 9.0 3.5 0.2 0.4 1.2 3.8 −27.4 −0.4 4.1Q3 1.7 1.4 48.5 1.8 −17.9 2.4 −1.7 −0.1 15.9 −4.8 −3.4Q4 0.5 1.4 22.9 0.7 18.5 −0.5 −3.6 −4.3 3.8 −4.0 −3.4
2009 Q1 0.1 2.1 −9.0 3.2 4.5 −4.0 −3.6 −3.4 1.2 −7.3 −1.2Q2 −1.5 −0.3 −4.3 −0.1 1.7 −2.2 −4.3 −2.6 18.5 −4.5 −10.6Q3 −0.5 0.6 −7.1 1.4 3.6 −4.3 −1.5 1.1 −26.1 −1.8 0.2Q4 0.2 0.9 1.4 0.7 3.7 1.3 0.8 0.4 2.7 −1.7 3.4
2010 Q1 1.2 3.6 −1.4 3.7 2.3 3.5 −1.2 −3.2 −13.2 2.7 0.3
Percentage chang e , quar ter on corresponding quarter of previous year
2007 Q1 3.4 3.3 −52.5 3.0 40.1 4.0 0.7 7.9 3.0 −17.2 12.9Q2 2.8 4.5 −17.3 4.3 30.5 1.5 1.6 10.6 −12.6 −9.6 5.1Q3 2.5 4.2 92.9 5.0 −17.6 3.0 1.8 9.5 −39.4 −1.3 5.8Q4 3.1 2.5 124.5 3.2 2.1 −4.6 12.7 18.8 22.2 8.5 7.3
2008 Q1 2.4 5.2 −7.3 5.9 −0.6 3.5 −0.9 3.1 −21.2 3.9 −6.3Q2 2.9 5.8 −7.6 6.7 −0.2 3.3 −0.2 3.4 −17.4 −1.6 −1.3Q3 4.6 6.0 6.7 6.7 −3.2 4.2 −1.6 5.9 −1.8 −6.1 −7.4Q4 5.6 8.7 48.7 9.3 2.5 4.2 −8.3 −5.5 −16.2 −7.1 −12.0
2009 Q1 4.3 8.1 80.9 9.5 1.8 −1.7 −7.7 −4.0 −11.6 −15.6 −4.1Q2 0.8 4.7 58.8 5.7 3.3 −4.3 −12.7 −10.0 44.2 −19.1 −17.6Q3 −1.3 3.8 −0.7 5.3 30.5 −10.6 −12.4 −8.9 −8.1 −16.5 −14.5Q4 −1.7 3.3 −18.1 5.3 14.2 −9.0 −8.4 −4.5 −9.0 −14.5 −8.5
2010 Q1 −0.6 4.9 −11.2 5.8 11.8 −1.9 −6.2 −4.3 −22.0 −5.2 −7.1

161
SDG.KS Household final consumption expenditureSemi-durable goodsChained volume measures, reference year 2006 - seasonally adjustedcontinued £ million
Tr anspor t Recreation and culture Miscellaneous
Electr icEquipment for appliances Other
Motor vehicle Recording Games, toys & spor t, for personal personalTotal spares Total media hobbies camping etc Books Total care effects
COICOP 07 07.2.1 09 09.1.4 09.3.1 09.3.2 09.5.1 12 12.1.2 12.3.2
LLMB AWUW LLMC ATSH ATSL XYJU CDZQ LLMD XYJX ATSX2005 3 917 3 916 25 563 6 498 13 403 2 122 3 564 3 347 1 290 2 0622006 3 768 3 768 26 462 6 121 14 401 2 608 3 332 3 427 1 028 2 3992007 3 704 3 704 27 206 5 472 15 851 2 540 3 343 3 257 965 2 2922008 3 989 3 989 28 443 6 025 17 065 2 448 2 905 2 954 835 2 1192009 3 850 3 850 28 074 6 168 16 826 2 320 2 760 3 089 989 2 100
Percentage chang e , year on previous year
2005 10.8 10.7 −1.3 −2.1 −1.0 −2.3 −0.3 −6.6 −14.2 −1.22006 −3.8 −3.8 3.5 −5.8 7.4 22.9 −6.5 2.4 −20.3 16.32007 −1.7 −1.7 2.8 −10.6 10.1 −2.6 0.3 −5.0 −6.1 −4.52008 7.7 7.7 4.5 10.1 7.7 −3.6 −13.1 −9.3 −13.5 −7.52009 −3.5 −3.5 −1.3 2.4 −1.4 −5.2 −5.0 4.6 18.4 −0.9
Seasonally adjusted
2007 Q1 944 944 6 797 1 361 3 851 656 929 843 295 548Q2 921 921 6 926 1 386 4 096 626 818 797 220 577Q3 921 921 6 793 1 387 3 985 612 809 818 237 581Q4 918 918 6 690 1 338 3 919 646 787 799 213 586
2008 Q1 1 063 1 063 6 824 1 389 4 025 662 748 725 169 556Q2 887 887 7 067 1 441 4 278 608 740 739 201 538Q3 993 993 7 282 1 535 4 379 616 752 724 195 529Q4 1 046 1 046 7 270 1 660 4 383 562 665 766 270 496
2009 Q1 989 989 7 260 1 636 4 332 584 708 743 217 526Q2 982 982 7 048 1 520 4 221 604 703 777 251 526Q3 941 941 6 912 1 488 4 175 569 680 807 284 523Q4 938 938 6 854 1 524 4 098 563 669 762 237 525
2010 Q1 926 926 6 708 1 412 4 072 553 671 805 236 569
Percentage chang e , quar ter on previous quarter
2007 Q1 2.9 2.9 2.7 −3.7 3.9 −4.0 14.3 −5.2 9.3 −11.5Q2 −2.4 −2.4 1.9 1.8 6.4 −4.6 −11.9 −5.5 −25.4 5.3Q3 − − −1.9 0.1 −2.7 −2.2 −1.1 2.6 7.7 0.7Q4 −0.3 −0.3 −1.5 −3.5 −1.7 5.6 −2.7 −2.3 −10.1 0.9
2008 Q1 15.8 15.8 2.0 3.8 2.7 2.5 −5.0 −9.3 −20.7 −5.1Q2 −16.6 −16.6 3.6 3.7 6.3 −8.2 −1.1 1.9 18.9 −3.2Q3 12.0 12.0 3.0 6.5 2.4 1.3 1.6 −2.0 −3.0 −1.7Q4 5.3 5.3 −0.2 8.1 0.1 −8.8 −11.6 5.8 38.5 −6.2
2009 Q1 −5.4 −5.4 −0.1 −1.4 −1.2 3.9 6.5 −3.0 −19.6 6.0Q2 −0.7 −0.7 −2.9 −7.1 −2.6 3.4 −0.7 4.6 15.7 −Q3 −4.2 −4.2 −1.9 −2.1 −1.1 −5.8 −3.3 3.9 13.1 −0.6Q4 −0.3 −0.3 −0.8 2.4 −1.8 −1.1 −1.6 −5.6 −16.5 0.4
2010 Q1 −1.3 −1.3 −2.1 −7.3 −0.6 −1.8 0.3 5.6 −0.4 8.4
Percentage chang e , quar ter on corresponding quarter of previous year
2007 Q1 1.5 1.5 5.9 −10.0 11.5 11.0 7.5 − 13.9 −6.2Q2 2.2 2.2 2.5 −17.0 14.3 −4.3 −3.9 −10.2 −23.3 −4.0Q3 −9.7 −9.7 1.9 −9.1 9.0 −10.0 0.6 1.4 11.8 −2.4Q4 0.1 0.1 1.1 −5.3 5.8 −5.4 −3.2 −10.1 −21.1 −5.3
2008 Q1 12.6 12.6 0.4 2.1 4.5 0.9 −19.5 −14.0 −42.7 1.5Q2 −3.7 −3.7 2.0 4.0 4.4 −2.9 −9.5 −7.3 −8.6 −6.8Q3 7.8 7.8 7.2 10.7 9.9 0.7 −7.0 −11.5 −17.7 −9.0Q4 13.9 13.9 8.7 24.1 11.8 −13.0 −15.5 −4.1 26.8 −15.4
2009 Q1 −7.0 −7.0 6.4 17.8 7.6 −11.8 −5.3 2.5 28.4 −5.4Q2 10.7 10.7 −0.3 5.5 −1.3 −0.7 −5.0 5.1 24.9 −2.2Q3 −5.2 −5.2 −5.1 −3.1 −4.7 −7.6 −9.6 11.5 45.6 −1.1Q4 −10.3 −10.3 −5.7 −8.2 −6.5 0.2 0.6 −0.5 −12.2 5.8
2010 Q1 −6.4 −6.4 −7.6 −13.7 −6.0 −5.3 −5.2 8.3 8.8 8.2

162
SDG.DN Household final consumption expenditureSemi-durable goodsImplied deflators - not seasonally adjusted 2006 = 100
Clothing and footwear Furnishing & household goods
Other Small toolsar ticles of Small Glassware, &clothing & Shoes & electr ic tableware & miscellaneo-
Clothing clothing other Household household household usTotal Total materials Garments accessories footwear Total textiles appliances utensils accessories
COICOP SD 03 03.1.1 03.1.2 03.1.3 03.2.1 05 05.2 05.3.2 05.4 05.5.2
UTLA LLON AWLX AWLY AWLZ AWMB LLOO UTNO AWMW UTNQ AWMZ2005 100.8 101.0 99.0 101.0 97.8 101.5 100.6 102.1 102.7 100.2 98.52006 100.0 100.0 100.0 100.0 100.0 100.0 100.0 100.0 100.0 100.0 100.02007 100.0 99.0 100.4 98.5 100.5 101.3 101.1 99.1 102.3 103.1 101.82008 98.2 95.1 101.2 93.8 100.6 100.8 102.2 98.9 102.9 105.9 103.22009 96.5 90.9 103.2 88.6 101.5 101.1 105.2 101.6 111.0 110.3 105.0
Percentage chang e , year on previous year
2005 −1.8 −2.3 1.5 −2.6 1.6 −2.5 −1.9 −2.3 −1.8 −2.1 −0.92006 −0.8 −1.0 1.0 −1.0 2.2 −1.5 −0.6 −2.1 −2.6 −0.2 1.52007 − −1.0 0.4 −1.5 0.5 1.3 1.1 −0.9 2.3 3.1 1.82008 −1.8 −3.9 0.8 −4.8 0.1 −0.5 1.1 −0.2 0.6 2.7 1.42009 −1.7 −4.4 2.0 −5.5 0.9 0.3 2.9 2.7 7.9 4.2 1.7
Not seasonally adjusted
2007 Q1 99.1 97.7 100.0 97.2 100.0 99.4 100.1 98.5 99.2 101.0 101.6Q2 100.7 100.5 100.0 100.1 100.7 102.4 101.7 99.7 102.5 103.8 102.2Q3 99.5 98.1 100.0 97.5 99.7 101.2 101.0 98.9 102.3 102.8 101.9Q4 100.6 99.6 102.1 99.1 101.3 101.8 101.6 99.2 105.0 104.4 101.4
2008 Q1 98.7 95.8 100.0 95.0 99.1 99.3 101.9 99.1 102.2 105.0 102.9Q2 99.2 96.5 102.1 95.3 101.5 101.8 102.4 99.1 103.1 106.2 103.3Q3 97.8 94.4 100.5 92.7 100.3 101.6 102.1 98.5 103.8 106.3 103.2Q4 97.4 94.2 101.9 92.7 101.1 100.2 102.2 98.8 102.9 106.2 103.4
2009 Q1 95.0 89.5 102.5 87.5 100.7 97.6 102.6 99.0 106.8 106.3 103.8Q2 96.7 91.6 104.8 89.3 102.7 101.0 105.5 102.2 110.1 110.2 105.6Q3 96.3 90.0 101.1 87.5 101.3 101.9 105.1 101.7 110.9 110.2 104.9Q4 97.6 91.9 104.3 89.6 101.5 103.3 107.3 103.2 114.4 113.8 105.8
2010 Q1 97.3 91.0 107.4 88.5 101.9 102.0 107.6 103.3 116.1 114.1 107.2
Percentage chang e , quar ter on corresponding quarter of previous year
2007 Q1 −0.4 −1.0 − −1.5 2.6 0.5 0.8 −1.2 0.4 2.0 1.9Q2 0.2 −0.2 − −0.8 1.3 2.1 1.4 −1.1 4.7 3.0 3.0Q3 0.4 −0.7 − −1.1 0.6 1.4 1.4 −0.4 −0.3 3.8 1.9Q4 − −1.6 2.1 −2.2 −0.9 1.1 1.0 −0.9 5.0 3.3 0.3
2008 Q1 −0.4 −1.9 − −2.3 −0.9 −0.1 1.8 0.6 3.0 4.0 1.3Q2 −1.5 −4.0 2.1 −4.8 0.8 −0.6 0.7 −0.6 0.6 2.3 1.1Q3 −1.7 −3.8 0.5 −4.9 0.6 0.4 1.1 −0.4 1.5 3.4 1.3Q4 −3.2 −5.4 −0.2 −6.5 −0.2 −1.6 0.6 −0.4 −2.0 1.7 2.0
2009 Q1 −3.7 −6.6 2.5 −7.9 1.6 −1.7 0.7 −0.1 4.5 1.2 0.9Q2 −2.5 −5.1 2.6 −6.3 1.2 −0.8 3.0 3.1 6.8 3.8 2.2Q3 −1.5 −4.7 0.6 −5.6 1.0 0.3 2.9 3.2 6.8 3.7 1.6Q4 0.2 −2.4 2.4 −3.3 0.4 3.1 5.0 4.5 11.2 7.2 2.3
2010 Q1 2.4 1.7 4.8 1.1 1.2 4.5 4.9 4.3 8.7 7.3 3.3
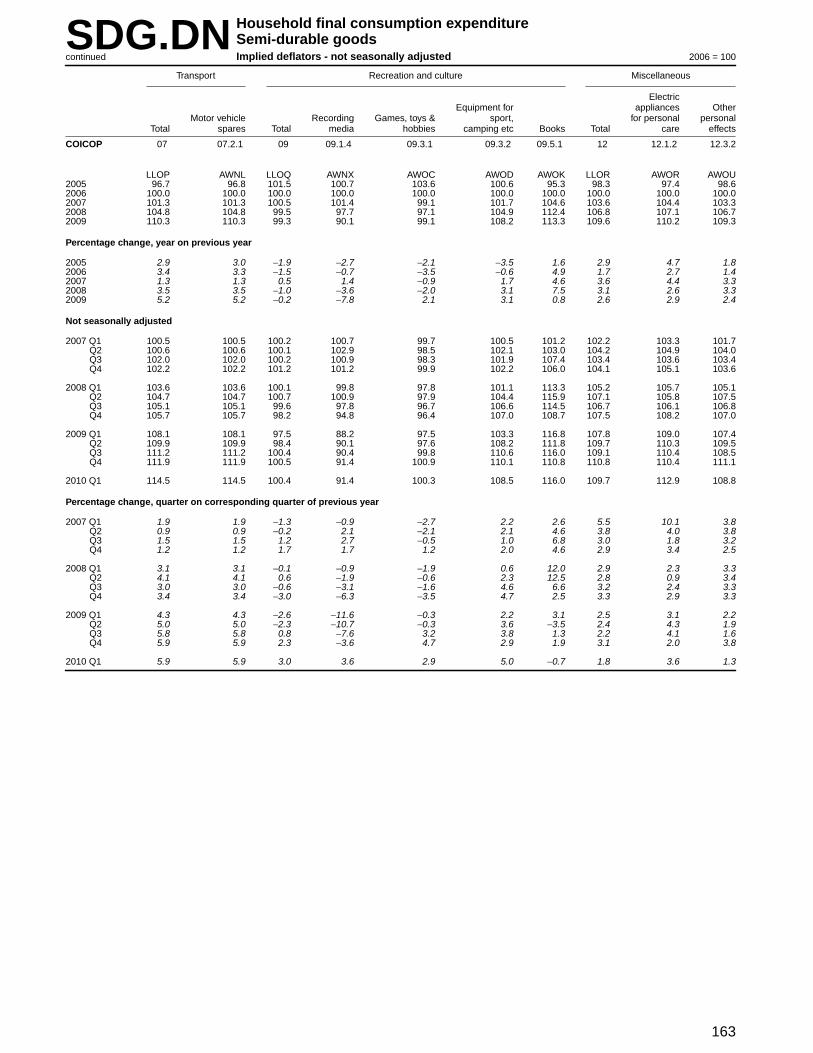
163
SDG.DN Household final consumption expenditureSemi-durable goodsImplied deflators - not seasonally adjustedcontinued 2006 = 100
Tr anspor t Recreation and culture Miscellaneous
Electr icEquipment for appliances Other
Motor vehicle Recording Games, toys & spor t, for personal personalTotal spares Total media hobbies camping etc Books Total care effects
COICOP 07 07.2.1 09 09.1.4 09.3.1 09.3.2 09.5.1 12 12.1.2 12.3.2
LLOP AWNL LLOQ AWNX AWOC AWOD AWOK LLOR AWOR AWOU2005 96.7 96.8 101.5 100.7 103.6 100.6 95.3 98.3 97.4 98.62006 100.0 100.0 100.0 100.0 100.0 100.0 100.0 100.0 100.0 100.02007 101.3 101.3 100.5 101.4 99.1 101.7 104.6 103.6 104.4 103.32008 104.8 104.8 99.5 97.7 97.1 104.9 112.4 106.8 107.1 106.72009 110.3 110.3 99.3 90.1 99.1 108.2 113.3 109.6 110.2 109.3
Percentage chang e , year on previous year
2005 2.9 3.0 −1.9 −2.7 −2.1 −3.5 1.6 2.9 4.7 1.82006 3.4 3.3 −1.5 −0.7 −3.5 −0.6 4.9 1.7 2.7 1.42007 1.3 1.3 0.5 1.4 −0.9 1.7 4.6 3.6 4.4 3.32008 3.5 3.5 −1.0 −3.6 −2.0 3.1 7.5 3.1 2.6 3.32009 5.2 5.2 −0.2 −7.8 2.1 3.1 0.8 2.6 2.9 2.4
Not seasonally adjusted
2007 Q1 100.5 100.5 100.2 100.7 99.7 100.5 101.2 102.2 103.3 101.7Q2 100.6 100.6 100.1 102.9 98.5 102.1 103.0 104.2 104.9 104.0Q3 102.0 102.0 100.2 100.9 98.3 101.9 107.4 103.4 103.6 103.4Q4 102.2 102.2 101.2 101.2 99.9 102.2 106.0 104.1 105.1 103.6
2008 Q1 103.6 103.6 100.1 99.8 97.8 101.1 113.3 105.2 105.7 105.1Q2 104.7 104.7 100.7 100.9 97.9 104.4 115.9 107.1 105.8 107.5Q3 105.1 105.1 99.6 97.8 96.7 106.6 114.5 106.7 106.1 106.8Q4 105.7 105.7 98.2 94.8 96.4 107.0 108.7 107.5 108.2 107.0
2009 Q1 108.1 108.1 97.5 88.2 97.5 103.3 116.8 107.8 109.0 107.4Q2 109.9 109.9 98.4 90.1 97.6 108.2 111.8 109.7 110.3 109.5Q3 111.2 111.2 100.4 90.4 99.8 110.6 116.0 109.1 110.4 108.5Q4 111.9 111.9 100.5 91.4 100.9 110.1 110.8 110.8 110.4 111.1
2010 Q1 114.5 114.5 100.4 91.4 100.3 108.5 116.0 109.7 112.9 108.8
Percentage chang e , quar ter on corresponding quarter of previous year
2007 Q1 1.9 1.9 −1.3 −0.9 −2.7 2.2 2.6 5.5 10.1 3.8Q2 0.9 0.9 −0.2 2.1 −2.1 2.1 4.6 3.8 4.0 3.8Q3 1.5 1.5 1.2 2.7 −0.5 1.0 6.8 3.0 1.8 3.2Q4 1.2 1.2 1.7 1.7 1.2 2.0 4.6 2.9 3.4 2.5
2008 Q1 3.1 3.1 −0.1 −0.9 −1.9 0.6 12.0 2.9 2.3 3.3Q2 4.1 4.1 0.6 −1.9 −0.6 2.3 12.5 2.8 0.9 3.4Q3 3.0 3.0 −0.6 −3.1 −1.6 4.6 6.6 3.2 2.4 3.3Q4 3.4 3.4 −3.0 −6.3 −3.5 4.7 2.5 3.3 2.9 3.3
2009 Q1 4.3 4.3 −2.6 −11.6 −0.3 2.2 3.1 2.5 3.1 2.2Q2 5.0 5.0 −2.3 −10.7 −0.3 3.6 −3.5 2.4 4.3 1.9Q3 5.8 5.8 0.8 −7.6 3.2 3.8 1.3 2.2 4.1 1.6Q4 5.9 5.9 2.3 −3.6 4.7 2.9 1.9 3.1 2.0 3.8
2010 Q1 5.9 5.9 3.0 3.6 2.9 5.0 −0.7 1.8 3.6 1.3
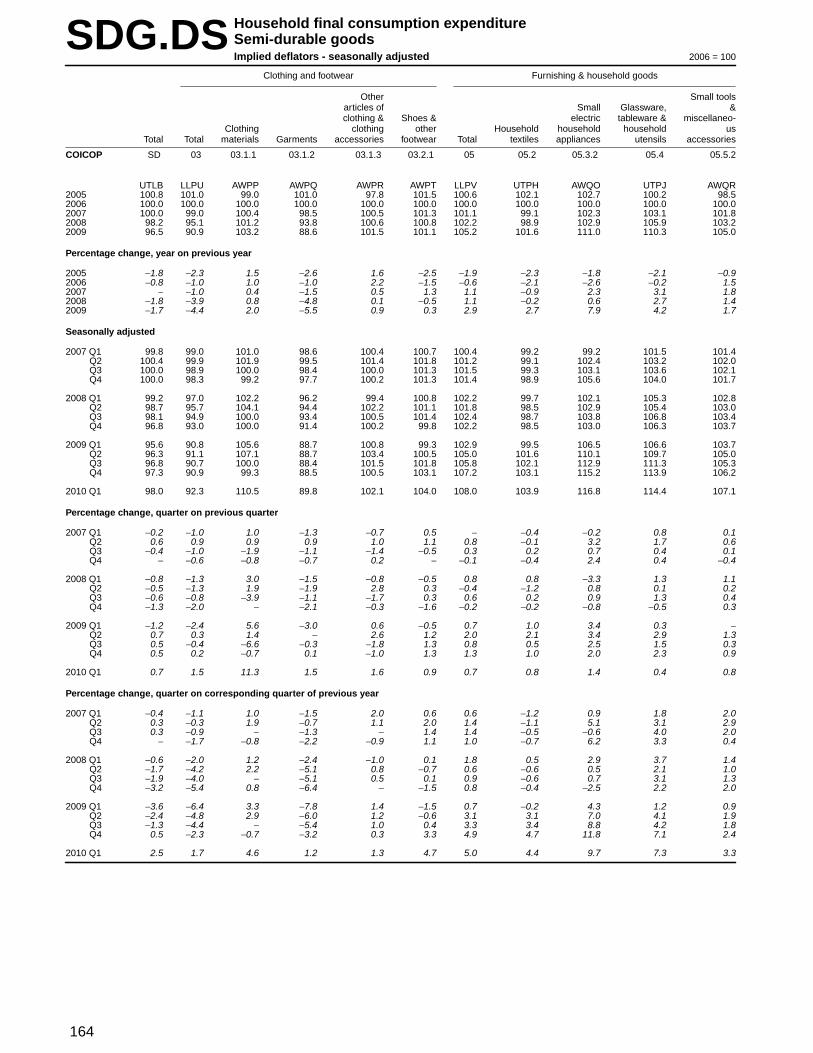
164
SDG.DS Household final consumption expenditureSemi-durable goodsImplied deflators - seasonally adjusted 2006 = 100
Clothing and footwear Furnishing & household goods
Other Small toolsar ticles of Small Glassware, &clothing & Shoes & electr ic tableware & miscellaneo-
Clothing clothing other Household household household usTotal Total materials Garments accessories footwear Total textiles appliances utensils accessories
COICOP SD 03 03.1.1 03.1.2 03.1.3 03.2.1 05 05.2 05.3.2 05.4 05.5.2
UTLB LLPU AWPP AWPQ AWPR AWPT LLPV UTPH AWQO UTPJ AWQR2005 100.8 101.0 99.0 101.0 97.8 101.5 100.6 102.1 102.7 100.2 98.52006 100.0 100.0 100.0 100.0 100.0 100.0 100.0 100.0 100.0 100.0 100.02007 100.0 99.0 100.4 98.5 100.5 101.3 101.1 99.1 102.3 103.1 101.82008 98.2 95.1 101.2 93.8 100.6 100.8 102.2 98.9 102.9 105.9 103.22009 96.5 90.9 103.2 88.6 101.5 101.1 105.2 101.6 111.0 110.3 105.0
Percentage chang e , year on previous year
2005 −1.8 −2.3 1.5 −2.6 1.6 −2.5 −1.9 −2.3 −1.8 −2.1 −0.92006 −0.8 −1.0 1.0 −1.0 2.2 −1.5 −0.6 −2.1 −2.6 −0.2 1.52007 − −1.0 0.4 −1.5 0.5 1.3 1.1 −0.9 2.3 3.1 1.82008 −1.8 −3.9 0.8 −4.8 0.1 −0.5 1.1 −0.2 0.6 2.7 1.42009 −1.7 −4.4 2.0 −5.5 0.9 0.3 2.9 2.7 7.9 4.2 1.7
Seasonally adjusted
2007 Q1 99.8 99.0 101.0 98.6 100.4 100.7 100.4 99.2 99.2 101.5 101.4Q2 100.4 99.9 101.9 99.5 101.4 101.8 101.2 99.1 102.4 103.2 102.0Q3 100.0 98.9 100.0 98.4 100.0 101.3 101.5 99.3 103.1 103.6 102.1Q4 100.0 98.3 99.2 97.7 100.2 101.3 101.4 98.9 105.6 104.0 101.7
2008 Q1 99.2 97.0 102.2 96.2 99.4 100.8 102.2 99.7 102.1 105.3 102.8Q2 98.7 95.7 104.1 94.4 102.2 101.1 101.8 98.5 102.9 105.4 103.0Q3 98.1 94.9 100.0 93.4 100.5 101.4 102.4 98.7 103.8 106.8 103.4Q4 96.8 93.0 100.0 91.4 100.2 99.8 102.2 98.5 103.0 106.3 103.7
2009 Q1 95.6 90.8 105.6 88.7 100.8 99.3 102.9 99.5 106.5 106.6 103.7Q2 96.3 91.1 107.1 88.7 103.4 100.5 105.0 101.6 110.1 109.7 105.0Q3 96.8 90.7 100.0 88.4 101.5 101.8 105.8 102.1 112.9 111.3 105.3Q4 97.3 90.9 99.3 88.5 100.5 103.1 107.2 103.1 115.2 113.9 106.2
2010 Q1 98.0 92.3 110.5 89.8 102.1 104.0 108.0 103.9 116.8 114.4 107.1
Percentage chang e , quar ter on previous quarter
2007 Q1 −0.2 −1.0 1.0 −1.3 −0.7 0.5 − −0.4 −0.2 0.8 0.1Q2 0.6 0.9 0.9 0.9 1.0 1.1 0.8 −0.1 3.2 1.7 0.6Q3 −0.4 −1.0 −1.9 −1.1 −1.4 −0.5 0.3 0.2 0.7 0.4 0.1Q4 − −0.6 −0.8 −0.7 0.2 − −0.1 −0.4 2.4 0.4 −0.4
2008 Q1 −0.8 −1.3 3.0 −1.5 −0.8 −0.5 0.8 0.8 −3.3 1.3 1.1Q2 −0.5 −1.3 1.9 −1.9 2.8 0.3 −0.4 −1.2 0.8 0.1 0.2Q3 −0.6 −0.8 −3.9 −1.1 −1.7 0.3 0.6 0.2 0.9 1.3 0.4Q4 −1.3 −2.0 − −2.1 −0.3 −1.6 −0.2 −0.2 −0.8 −0.5 0.3
2009 Q1 −1.2 −2.4 5.6 −3.0 0.6 −0.5 0.7 1.0 3.4 0.3 −Q2 0.7 0.3 1.4 − 2.6 1.2 2.0 2.1 3.4 2.9 1.3Q3 0.5 −0.4 −6.6 −0.3 −1.8 1.3 0.8 0.5 2.5 1.5 0.3Q4 0.5 0.2 −0.7 0.1 −1.0 1.3 1.3 1.0 2.0 2.3 0.9
2010 Q1 0.7 1.5 11.3 1.5 1.6 0.9 0.7 0.8 1.4 0.4 0.8
Percentage chang e , quar ter on corresponding quarter of previous year
2007 Q1 −0.4 −1.1 1.0 −1.5 2.0 0.6 0.6 −1.2 0.9 1.8 2.0Q2 0.3 −0.3 1.9 −0.7 1.1 2.0 1.4 −1.1 5.1 3.1 2.9Q3 0.3 −0.9 − −1.3 − 1.4 1.4 −0.5 −0.6 4.0 2.0Q4 − −1.7 −0.8 −2.2 −0.9 1.1 1.0 −0.7 6.2 3.3 0.4
2008 Q1 −0.6 −2.0 1.2 −2.4 −1.0 0.1 1.8 0.5 2.9 3.7 1.4Q2 −1.7 −4.2 2.2 −5.1 0.8 −0.7 0.6 −0.6 0.5 2.1 1.0Q3 −1.9 −4.0 − −5.1 0.5 0.1 0.9 −0.6 0.7 3.1 1.3Q4 −3.2 −5.4 0.8 −6.4 − −1.5 0.8 −0.4 −2.5 2.2 2.0
2009 Q1 −3.6 −6.4 3.3 −7.8 1.4 −1.5 0.7 −0.2 4.3 1.2 0.9Q2 −2.4 −4.8 2.9 −6.0 1.2 −0.6 3.1 3.1 7.0 4.1 1.9Q3 −1.3 −4.4 − −5.4 1.0 0.4 3.3 3.4 8.8 4.2 1.8Q4 0.5 −2.3 −0.7 −3.2 0.3 3.3 4.9 4.7 11.8 7.1 2.4
2010 Q1 2.5 1.7 4.6 1.2 1.3 4.7 5.0 4.4 9.7 7.3 3.3

165
SDG.DS Household final consumption expenditureSemi-durable goodsImplied deflators - seasonally adjustedcontinued 2006 = 100
Tr anspor t Recreation and culture Miscellaneous
Electr icEquipment for appliances Other
Motor vehicle Recording Games, toys & spor t, for personal personalTotal spares Total media hobbies camping etc Books Total care effects
COICOP 07 07.2.1 09 09.1.4 09.3.1 09.3.2 09.5.1 12 12.1.2 12.3.2
LLPW AWRD LLPX AWRP AWRU AWRV AWSC LLPY AWSJ AWSM2005 96.7 96.8 101.5 100.7 103.6 100.6 95.3 98.3 97.4 98.62006 100.0 100.0 100.0 100.0 100.0 100.0 100.0 100.0 100.0 100.02007 101.3 101.3 100.5 101.4 99.1 101.7 104.6 103.6 104.4 103.32008 104.8 104.8 99.5 97.7 97.1 104.9 112.4 106.8 107.1 106.72009 110.3 110.3 99.3 90.1 99.1 108.2 113.3 109.6 110.2 109.3
Percentage chang e , year on previous year
2005 2.9 3.0 −1.9 −2.7 −2.1 −3.5 1.6 2.9 4.7 1.82006 3.4 3.3 −1.5 −0.7 −3.5 −0.6 4.9 1.7 2.7 1.42007 1.3 1.3 0.5 1.4 −0.9 1.7 4.6 3.6 4.4 3.32008 3.5 3.5 −1.0 −3.6 −2.0 3.1 7.5 3.1 2.6 3.32009 5.2 5.2 −0.2 −7.8 2.1 3.1 0.8 2.6 2.9 2.4
Seasonally adjusted
2007 Q1 100.4 100.4 100.4 102.1 99.6 101.8 100.4 101.9 101.7 102.0Q2 100.7 100.7 100.2 102.2 98.6 101.8 103.5 103.8 104.5 103.5Q3 102.0 102.0 100.3 100.8 98.8 101.5 105.8 104.2 105.1 103.8Q4 102.4 102.4 101.0 100.4 99.4 101.9 109.4 104.6 107.0 103.8
2008 Q1 103.4 103.4 100.2 100.6 97.7 102.9 110.6 105.0 104.1 105.2Q2 104.7 104.7 100.5 99.6 97.9 104.3 114.2 106.6 106.0 106.9Q3 105.1 105.1 99.3 96.9 97.0 106.0 112.5 107.3 107.7 107.2Q4 106.1 106.1 97.9 94.5 96.0 106.6 112.3 108.1 109.3 107.5
2009 Q1 107.6 107.6 97.9 89.1 97.6 105.7 113.3 107.8 106.9 108.2Q2 110.0 110.0 98.4 89.8 97.8 108.1 111.7 109.3 110.0 108.9Q3 111.4 111.4 100.1 89.8 100.3 109.7 113.7 110.0 111.3 109.4Q4 112.6 112.6 100.8 91.9 100.7 109.6 114.8 111.2 112.2 110.7
2010 Q1 113.9 113.9 101.1 92.7 100.7 110.8 112.7 109.4 110.2 109.1
Percentage chang e , quar ter on previous quarter
2007 Q1 −0.8 −0.8 1.2 3.1 1.4 1.8 −2.9 −0.3 −2.3 0.5Q2 0.3 0.3 −0.2 0.1 −1.0 − 3.1 1.9 2.8 1.5Q3 1.3 1.3 0.1 −1.4 0.2 −0.3 2.2 0.4 0.6 0.3Q4 0.4 0.4 0.7 −0.4 0.6 0.4 3.4 0.4 1.8 −
2008 Q1 1.0 1.0 −0.8 0.2 −1.7 1.0 1.1 0.4 −2.7 1.3Q2 1.3 1.3 0.3 −1.0 0.2 1.4 3.3 1.5 1.8 1.6Q3 0.4 0.4 −1.2 −2.7 −0.9 1.6 −1.5 0.7 1.6 0.3Q4 1.0 1.0 −1.4 −2.5 −1.0 0.6 −0.2 0.7 1.5 0.3
2009 Q1 1.4 1.4 − −5.7 1.7 −0.8 0.9 −0.3 −2.2 0.7Q2 2.2 2.2 0.5 0.8 0.2 2.3 −1.4 1.4 2.9 0.6Q3 1.3 1.3 1.7 − 2.6 1.5 1.8 0.6 1.2 0.5Q4 1.1 1.1 0.7 2.3 0.4 −0.1 1.0 1.1 0.8 1.2
2010 Q1 1.2 1.2 0.3 0.9 − 1.1 −1.8 −1.6 −1.8 −1.4
Percentage chang e , quar ter on corresponding quarter of previous year
2007 Q1 1.8 1.8 −1.1 −0.5 −2.5 2.1 2.8 5.7 10.2 3.8Q2 1.0 1.0 − 2.3 −1.9 2.1 4.0 3.9 4.2 3.8Q3 1.5 1.5 1.2 2.4 −0.4 0.9 6.3 2.8 1.3 3.3Q4 1.2 1.2 1.8 1.4 1.2 1.9 5.8 2.3 2.8 2.3
2008 Q1 3.0 3.0 −0.2 −1.5 −1.9 1.1 10.2 3.0 2.4 3.1Q2 4.0 4.0 0.3 −2.5 −0.7 2.5 10.3 2.7 1.4 3.3Q3 3.0 3.0 −1.0 −3.9 −1.8 4.4 6.3 3.0 2.5 3.3Q4 3.6 3.6 −3.1 −5.9 −3.4 4.6 2.7 3.3 2.1 3.6
2009 Q1 4.1 4.1 −2.3 −11.4 −0.1 2.7 2.4 2.7 2.7 2.9Q2 5.1 5.1 −2.1 −9.8 −0.1 3.6 −2.2 2.5 3.8 1.9Q3 6.0 6.0 0.8 −7.3 3.4 3.5 1.1 2.5 3.3 2.1Q4 6.1 6.1 3.0 −2.8 4.9 2.8 2.2 2.9 2.7 3.0
2010 Q1 5.9 5.9 3.3 4.0 3.2 4.8 −0.5 1.5 3.1 0.8
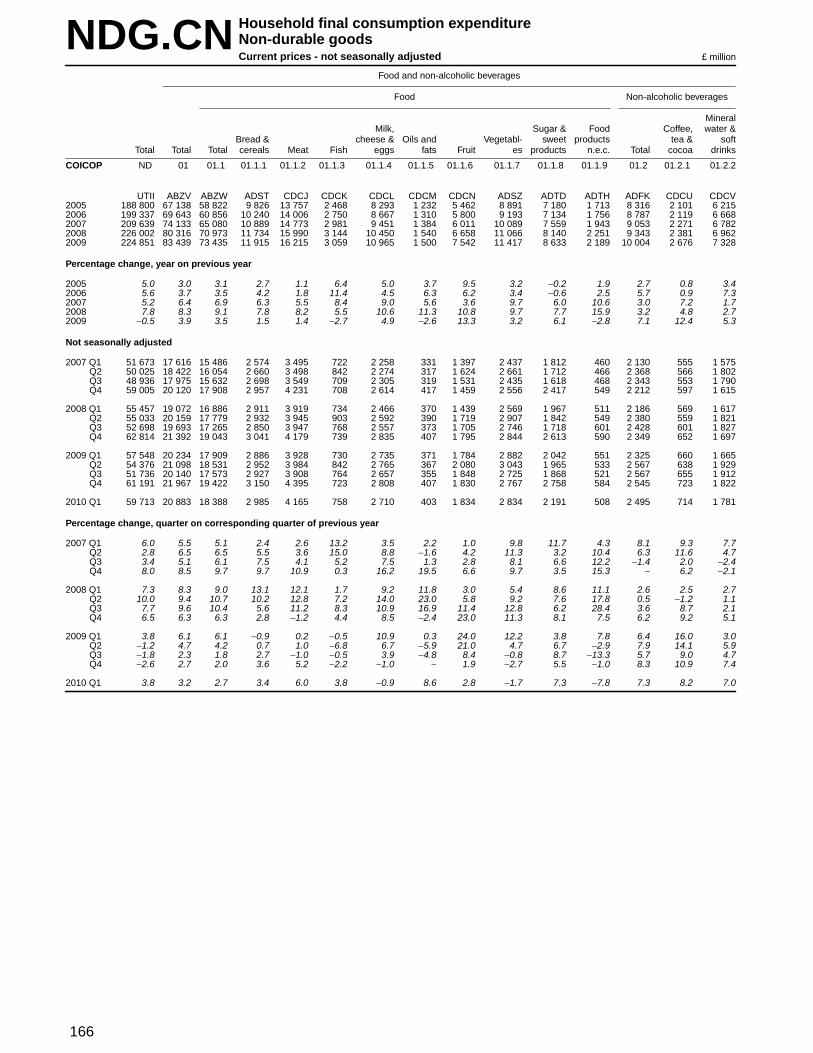
166
NDG.CN Household final consumption expenditureNon-durable goodsCurrent prices - not seasonally adjusted £ million
Food and non-alcoholic beverages
Food Non-alcoholic beverages
MineralMilk, Sugar & Food Coffee, water &
Bread & cheese & Oils and Vegetabl- sweet products tea & softTotal Total Total cereals Meat Fish eggs fats Fruit es products n.e.c. Total cocoa dr inks
COICOP ND 01 01.1 01.1.1 01.1.2 01.1.3 01.1.4 01.1.5 01.1.6 01.1.7 01.1.8 01.1.9 01.2 01.2.1 01.2.2
UTII ABZV ABZW ADST CDCJ CDCK CDCL CDCM CDCN ADSZ ADTD ADTH ADFK CDCU CDCV2005 188 800 67 138 58 822 9 826 13 757 2 468 8 293 1 232 5 462 8 891 7 180 1 713 8 316 2 101 6 2152006 199 337 69 643 60 856 10 240 14 006 2 750 8 667 1 310 5 800 9 193 7 134 1 756 8 787 2 119 6 6682007 209 639 74 133 65 080 10 889 14 773 2 981 9 451 1 384 6 011 10 089 7 559 1 943 9 053 2 271 6 7822008 226 002 80 316 70 973 11 734 15 990 3 144 10 450 1 540 6 658 11 066 8 140 2 251 9 343 2 381 6 9622009 224 851 83 439 73 435 11 915 16 215 3 059 10 965 1 500 7 542 11 417 8 633 2 189 10 004 2 676 7 328
Percentage chang e , year on previous year
2005 5.0 3.0 3.1 2.7 1.1 6.4 5.0 3.7 9.5 3.2 −0.2 1.9 2.7 0.8 3.42006 5.6 3.7 3.5 4.2 1.8 11.4 4.5 6.3 6.2 3.4 −0.6 2.5 5.7 0.9 7.32007 5.2 6.4 6.9 6.3 5.5 8.4 9.0 5.6 3.6 9.7 6.0 10.6 3.0 7.2 1.72008 7.8 8.3 9.1 7.8 8.2 5.5 10.6 11.3 10.8 9.7 7.7 15.9 3.2 4.8 2.72009 −0.5 3.9 3.5 1.5 1.4 −2.7 4.9 −2.6 13.3 3.2 6.1 −2.8 7.1 12.4 5.3
Not seasonally adjusted
2007 Q1 51 673 17 616 15 486 2 574 3 495 722 2 258 331 1 397 2 437 1 812 460 2 130 555 1 575Q2 50 025 18 422 16 054 2 660 3 498 842 2 274 317 1 624 2 661 1 712 466 2 368 566 1 802Q3 48 936 17 975 15 632 2 698 3 549 709 2 305 319 1 531 2 435 1 618 468 2 343 553 1 790Q4 59 005 20 120 17 908 2 957 4 231 708 2 614 417 1 459 2 556 2 417 549 2 212 597 1 615
2008 Q1 55 457 19 072 16 886 2 911 3 919 734 2 466 370 1 439 2 569 1 967 511 2 186 569 1 617Q2 55 033 20 159 17 779 2 932 3 945 903 2 592 390 1 719 2 907 1 842 549 2 380 559 1 821Q3 52 698 19 693 17 265 2 850 3 947 768 2 557 373 1 705 2 746 1 718 601 2 428 601 1 827Q4 62 814 21 392 19 043 3 041 4 179 739 2 835 407 1 795 2 844 2 613 590 2 349 652 1 697
2009 Q1 57 548 20 234 17 909 2 886 3 928 730 2 735 371 1 784 2 882 2 042 551 2 325 660 1 665Q2 54 376 21 098 18 531 2 952 3 984 842 2 765 367 2 080 3 043 1 965 533 2 567 638 1 929Q3 51 736 20 140 17 573 2 927 3 908 764 2 657 355 1 848 2 725 1 868 521 2 567 655 1 912Q4 61 191 21 967 19 422 3 150 4 395 723 2 808 407 1 830 2 767 2 758 584 2 545 723 1 822
2010 Q1 59 713 20 883 18 388 2 985 4 165 758 2 710 403 1 834 2 834 2 191 508 2 495 714 1 781
Percentage chang e , quar ter on corresponding quarter of previous year
2007 Q1 6.0 5.5 5.1 2.4 2.6 13.2 3.5 2.2 1.0 9.8 11.7 4.3 8.1 9.3 7.7Q2 2.8 6.5 6.5 5.5 3.6 15.0 8.8 −1.6 4.2 11.3 3.2 10.4 6.3 11.6 4.7Q3 3.4 5.1 6.1 7.5 4.1 5.2 7.5 1.3 2.8 8.1 6.6 12.2 −1.4 2.0 −2.4Q4 8.0 8.5 9.7 9.7 10.9 0.3 16.2 19.5 6.6 9.7 3.5 15.3 − 6.2 −2.1
2008 Q1 7.3 8.3 9.0 13.1 12.1 1.7 9.2 11.8 3.0 5.4 8.6 11.1 2.6 2.5 2.7Q2 10.0 9.4 10.7 10.2 12.8 7.2 14.0 23.0 5.8 9.2 7.6 17.8 0.5 −1.2 1.1Q3 7.7 9.6 10.4 5.6 11.2 8.3 10.9 16.9 11.4 12.8 6.2 28.4 3.6 8.7 2.1Q4 6.5 6.3 6.3 2.8 −1.2 4.4 8.5 −2.4 23.0 11.3 8.1 7.5 6.2 9.2 5.1
2009 Q1 3.8 6.1 6.1 −0.9 0.2 −0.5 10.9 0.3 24.0 12.2 3.8 7.8 6.4 16.0 3.0Q2 −1.2 4.7 4.2 0.7 1.0 −6.8 6.7 −5.9 21.0 4.7 6.7 −2.9 7.9 14.1 5.9Q3 −1.8 2.3 1.8 2.7 −1.0 −0.5 3.9 −4.8 8.4 −0.8 8.7 −13.3 5.7 9.0 4.7Q4 −2.6 2.7 2.0 3.6 5.2 −2.2 −1.0 − 1.9 −2.7 5.5 −1.0 8.3 10.9 7.4
2010 Q1 3.8 3.2 2.7 3.4 6.0 3.8 −0.9 8.6 2.8 −1.7 7.3 −7.8 7.3 8.2 7.0

167
NDG.CN Household final consumption expenditureNon-durable goodsCurrent prices - not seasonally adjustedcontinued £ million
Alcoholic beverages and tobacco Housing, water, electr icity, gas and other fuels
Alcoholic beverages Materials Electricity, gas & other fuelsfor the
maintena-nce &
Wine, repair ofcider & the Water Electric- Liquid Solid Heat
Total Total Spirits perry Beer Tobacco Total dwelling supply Total ity Gas fuels fuels energy
COICOP 02 02.1 02.1.1 02.1.2 02.1.3 02.2 04 04.3.1 04.4.1 04.5 04.5.1 04.5.2 04.5.3 04.5.4 04.5.5
ADFL ADFM UUHX UTHT UUMI ADFN LLIX ATKH ADVE ADFX CDDL ADVI ADVJ ADVK ADVL2005 28 853 13 476 3 713 6 488 3 275 15 377 32 195 7 718 2 991 21 486 9 815 10 698 739 234 −2006 29 286 13 637 3 675 6 543 3 419 15 649 36 530 6 829 3 220 26 481 11 834 13 356 1 066 225 −2007 29 787 14 134 3 826 6 974 3 334 15 653 38 218 6 793 3 631 27 794 11 937 14 596 1 033 228 −2008 30 306 14 656 4 114 7 108 3 434 15 650 45 002 7 139 3 858 34 005 14 412 17 901 1 446 246 −2009 31 131 14 851 4 037 7 120 3 694 16 280 44 614 7 326 3 792 33 496 14 462 17 601 1 128 305 −
Percentage chang e , year on previous year
2005 1.0 1.5 2.7 2.5 −1.7 0.5 13.7 −2.9 8.1 22.0 13.8 34.9 −1.6 −23.52006 1.5 1.2 −1.0 0.8 4.4 1.8 13.5 −11.5 7.7 23.2 20.6 24.8 44.2 −3.82007 1.7 3.6 4.1 6.6 −2.5 − 4.6 −0.5 12.8 5.0 0.9 9.3 −3.1 1.32008 1.7 3.7 7.5 1.9 3.0 − 17.8 5.1 6.3 22.3 20.7 22.6 40.0 7.92009 2.7 1.3 −1.9 0.2 7.6 4.0 −0.9 2.6 −1.7 −1.5 0.3 −1.7 −22.0 24.0
Not seasonally adjusted
2007 Q1 6 941 2 963 807 1 453 703 3 978 11 814 1 625 838 9 351 3 482 5 491 303 75 −Q2 7 274 3 370 874 1 646 850 3 904 7 791 1 874 917 5 000 2 587 2 188 176 49 −Q3 7 367 3 468 861 1 734 873 3 899 6 882 1 655 930 4 297 2 670 1 417 161 49 −Q4 8 205 4 333 1 284 2 141 908 3 872 11 731 1 639 946 9 146 3 198 5 500 393 55 −
2008 Q1 6 785 2 918 886 1 365 667 3 867 12 316 1 683 940 9 693 3 796 5 411 443 43 −Q2 7 465 3 553 958 1 724 871 3 912 9 066 1 936 989 6 141 3 161 2 588 347 45 −Q3 7 508 3 565 902 1 752 911 3 943 8 205 1 784 974 5 447 3 108 2 057 224 58 −Q4 8 548 4 620 1 368 2 267 985 3 928 15 415 1 736 955 12 724 4 347 7 845 432 100 −
2009 Q1 7 161 3 146 888 1 544 714 4 015 15 297 1 727 934 12 636 4 425 7 772 356 83 −Q2 7 665 3 598 898 1 718 982 4 067 9 101 1 985 960 6 156 3 238 2 644 202 72 −Q3 7 682 3 589 890 1 692 1 007 4 093 7 684 1 805 950 4 929 3 046 1 630 175 78 −Q4 8 623 4 518 1 361 2 166 991 4 105 12 532 1 809 948 9 775 3 753 5 555 395 72 −
2010 Q1 7 550 3 321 892 1 645 784 4 229 14 777 1 820 955 12 002 4 159 7 227 529 87 −
Percentage chang e , quar ter on corresponding quarter of previous year
2007 Q1 2.9 3.6 6.3 2.4 3.2 2.3 12.4 7.3 8.7 13.7 10.2 18.0 −10.4 10.3Q2 0.2 0.6 4.4 1.8 −5.2 −0.2 −1.9 −0.3 12.8 −4.7 −2.8 −4.3 −28.7 −7.5Q3 1.2 3.8 2.6 10.1 −5.7 −1.1 −1.0 −4.7 14.0 −2.4 3.0 −10.0 −13.0 −3.9Q4 2.6 6.0 3.5 10.8 −0.8 −0.9 5.4 −3.5 15.4 6.2 −6.5 13.6 32.8 3.8
2008 Q1 −2.2 −1.5 9.8 −6.1 −5.1 −2.8 4.2 3.6 12.2 3.7 9.0 −1.5 46.2 −42.7Q2 2.6 5.4 9.6 4.7 2.5 0.2 16.4 3.3 7.9 22.8 22.2 18.3 97.2 −8.2Q3 1.9 2.8 4.8 1.0 4.4 1.1 19.2 7.8 4.7 26.8 16.4 45.2 39.1 18.4Q4 4.2 6.6 6.5 5.9 8.5 1.4 31.4 5.9 1.0 39.1 35.9 42.6 9.9 81.8
2009 Q1 5.5 7.8 0.2 13.1 7.0 3.8 24.2 2.6 −0.6 30.4 16.6 43.6 −19.6 93.0Q2 2.7 1.3 −6.3 −0.3 12.7 4.0 0.4 2.5 −2.9 0.2 2.4 2.2 −41.8 60.0Q3 2.3 0.7 −1.3 −3.4 10.5 3.8 −6.3 1.2 −2.5 −9.5 −2.0 −20.8 −21.9 34.5Q4 0.9 −2.2 −0.5 −4.5 0.6 4.5 −18.7 4.2 −0.7 −23.2 −13.7 −29.2 −8.6 −28.0
2010 Q1 5.4 5.6 0.5 6.5 9.8 5.3 −3.4 5.4 2.2 −5.0 −6.0 −7.0 48.6 4.8
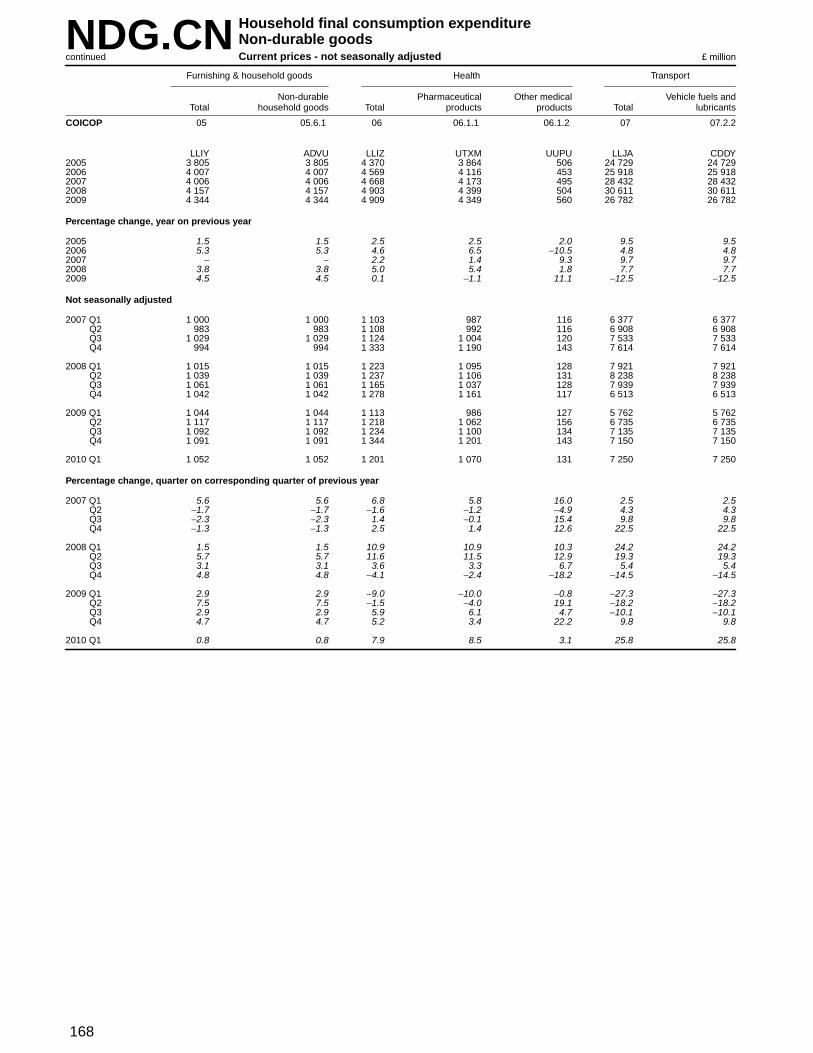
168
NDG.CN Household final consumption expenditureNon-durable goodsCurrent prices - not seasonally adjustedcontinued £ million
Fur nishing & household goods Health Transpor t
Non-durable Pharmaceutical Other medical Vehicle fuels andTotal household goods Total products products Total lubricants
COICOP 05 05.6.1 06 06.1.1 06.1.2 07 07.2.2
LLIY ADVU LLIZ UTXM UUPU LLJA CDDY2005 3 805 3 805 4 370 3 864 506 24 729 24 7292006 4 007 4 007 4 569 4 116 453 25 918 25 9182007 4 006 4 006 4 668 4 173 495 28 432 28 4322008 4 157 4 157 4 903 4 399 504 30 611 30 6112009 4 344 4 344 4 909 4 349 560 26 782 26 782
Percentage chang e , year on previous year
2005 1.5 1.5 2.5 2.5 2.0 9.5 9.52006 5.3 5.3 4.6 6.5 −10.5 4.8 4.82007 − − 2.2 1.4 9.3 9.7 9.72008 3.8 3.8 5.0 5.4 1.8 7.7 7.72009 4.5 4.5 0.1 −1.1 11.1 −12.5 −12.5
Not seasonally adjusted
2007 Q1 1 000 1 000 1 103 987 116 6 377 6 377Q2 983 983 1 108 992 116 6 908 6 908Q3 1 029 1 029 1 124 1 004 120 7 533 7 533Q4 994 994 1 333 1 190 143 7 614 7 614
2008 Q1 1 015 1 015 1 223 1 095 128 7 921 7 921Q2 1 039 1 039 1 237 1 106 131 8 238 8 238Q3 1 061 1 061 1 165 1 037 128 7 939 7 939Q4 1 042 1 042 1 278 1 161 117 6 513 6 513
2009 Q1 1 044 1 044 1 113 986 127 5 762 5 762Q2 1 117 1 117 1 218 1 062 156 6 735 6 735Q3 1 092 1 092 1 234 1 100 134 7 135 7 135Q4 1 091 1 091 1 344 1 201 143 7 150 7 150
2010 Q1 1 052 1 052 1 201 1 070 131 7 250 7 250
Percentage chang e , quar ter on corresponding quarter of previous year
2007 Q1 5.6 5.6 6.8 5.8 16.0 2.5 2.5Q2 −1.7 −1.7 −1.6 −1.2 −4.9 4.3 4.3Q3 −2.3 −2.3 1.4 −0.1 15.4 9.8 9.8Q4 −1.3 −1.3 2.5 1.4 12.6 22.5 22.5
2008 Q1 1.5 1.5 10.9 10.9 10.3 24.2 24.2Q2 5.7 5.7 11.6 11.5 12.9 19.3 19.3Q3 3.1 3.1 3.6 3.3 6.7 5.4 5.4Q4 4.8 4.8 −4.1 −2.4 −18.2 −14.5 −14.5
2009 Q1 2.9 2.9 −9.0 −10.0 −0.8 −27.3 −27.3Q2 7.5 7.5 −1.5 −4.0 19.1 −18.2 −18.2Q3 2.9 2.9 5.9 6.1 4.7 −10.1 −10.1Q4 4.7 4.7 5.2 3.4 22.2 9.8 9.8
2010 Q1 0.8 0.8 7.9 8.5 3.1 25.8 25.8

169
NDG.CN Household final consumption expenditureNon-durable goodsCurrent prices - not seasonally adjustedcontinued £ million
Recreation and culture Miscellaneous
Stationer y & Other productsGardens, plants Pets & related Newspapers & Miscellaneous drawing for personal
Total & flowers products per iodicals pr inted matter materials Total care
COICOP 09 09.3.3 09.3.4 09.5.2 09.5.3 09.5.4 12 12.1.3
LLJB AWTW ADXB CDEP ADXI ADXJ LLJC ADXS2005 14 444 3 311 2 664 4 414 1 431 2 624 13 266 13 2662006 15 147 3 354 2 831 4 485 1 559 2 918 14 237 14 2372007 15 323 3 597 2 709 4 512 1 597 2 908 15 072 15 0722008 15 297 3 806 2 875 4 226 1 559 2 831 15 410 15 4102009 15 252 3 609 3 020 4 041 1 724 2 858 14 380 14 380
Percentage chang e , year on previous year
2005 1.5 −2.7 7.5 −3.4 −2.3 13.1 2.3 2.32006 4.9 1.3 6.3 1.6 8.9 11.2 7.3 7.32007 1.2 7.2 −4.3 0.6 2.4 −0.3 5.9 5.92008 −0.2 5.8 6.1 −6.3 −2.4 −2.6 2.2 2.22009 −0.3 −5.2 5.0 −4.4 10.6 1.0 −6.7 −6.7
Not seasonally adjusted
2007 Q1 3 722 913 657 1 149 304 699 3 100 3 100Q2 4 154 1 285 666 1 140 410 653 3 385 3 385Q3 3 531 705 665 1 124 273 764 3 495 3 495Q4 3 916 694 721 1 099 610 792 5 092 5 092
2008 Q1 3 750 955 716 1 102 343 634 3 375 3 375Q2 4 190 1 384 715 1 071 342 678 3 639 3 639Q3 3 604 804 715 1 048 309 728 3 523 3 523Q4 3 753 663 729 1 005 565 791 4 873 4 873
2009 Q1 3 734 923 728 1 042 383 658 3 203 3 203Q2 4 111 1 281 741 1 018 431 640 3 331 3 331Q3 3 540 730 755 1 003 283 769 3 229 3 229Q4 3 867 675 796 978 627 791 4 617 4 617
2010 Q1 3 723 904 795 995 354 675 3 277 3 277
Percentage chang e , quar ter on corresponding quarter of previous year
2007 Q1 5.6 21.1 −7.5 5.5 0.3 4.5 1.4 1.4Q2 1.5 3.5 −8.6 2.4 10.8 2.2 2.5 2.5Q3 −1.8 −1.3 −6.1 −0.9 −5.5 2.0 4.3 4.3Q4 −0.5 7.6 5.4 −4.4 2.2 −8.0 12.5 12.5
2008 Q1 0.8 4.6 9.0 −4.1 12.8 −9.3 8.9 8.9Q2 0.9 7.7 7.4 −6.1 −16.6 3.8 7.5 7.5Q3 2.1 14.0 7.5 −6.8 13.2 −4.7 0.8 0.8Q4 −4.2 −4.5 1.1 −8.6 −7.4 −0.1 −4.3 −4.3
2009 Q1 −0.4 −3.4 1.7 −5.4 11.7 3.8 −5.1 −5.1Q2 −1.9 −7.4 3.6 −4.9 26.0 −5.6 −8.5 −8.5Q3 −1.8 −9.2 5.6 −4.3 −8.4 5.6 −8.3 −8.3Q4 3.0 1.8 9.2 −2.7 11.0 − −5.3 −5.3
2010 Q1 −0.3 −2.1 9.2 −4.5 −7.6 2.6 2.3 2.3

170
NDG.CS Household final consumption expenditureNon-durable goodsCurrent prices - seasonally adjusted £ million
Food and non-alcoholic beverages
Food Non-alcoholic beverages
MineralMilk, Sugar & Food Coffee, water &
Bread & cheese & Oils and Vegetabl- sweet products tea & softTotal Total Total cereals Meat Fish eggs fats Fruit es products n.e.c. Total cocoa dr inks
COICOP ND 01 01.1 01.1.1 01.1.2 01.1.3 01.1.4 01.1.5 01.1.6 01.1.7 01.1.8 01.1.9 01.2 01.2.1 01.2.2
UTIJ ZWUM UVAE UVAF CCRL CCRM CCRN CCRO CCRP UVDX UVER UVFB UVFC CCWH CCRW2005 188 800 67 138 58 822 9 826 13 757 2 468 8 293 1 232 5 462 8 891 7 180 1 713 8 316 2 101 6 2152006 199 337 69 643 60 856 10 240 14 006 2 750 8 667 1 310 5 800 9 193 7 134 1 756 8 787 2 119 6 6682007 209 639 74 133 65 080 10 889 14 773 2 981 9 451 1 384 6 011 10 089 7 559 1 943 9 053 2 271 6 7822008 226 002 80 316 70 973 11 734 15 990 3 144 10 450 1 540 6 658 11 066 8 140 2 251 9 343 2 381 6 9622009 224 851 83 439 73 435 11 915 16 215 3 059 10 965 1 500 7 542 11 417 8 633 2 189 10 004 2 676 7 328
Percentage chang e , year on previous year
2005 5.0 3.0 3.1 2.7 1.1 6.4 5.0 3.7 9.5 3.2 −0.2 1.9 2.7 0.8 3.42006 5.6 3.7 3.5 4.2 1.8 11.4 4.5 6.3 6.2 3.4 −0.6 2.5 5.7 0.9 7.32007 5.2 6.4 6.9 6.3 5.5 8.4 9.0 5.6 3.6 9.7 6.0 10.6 3.0 7.2 1.72008 7.8 8.3 9.1 7.8 8.2 5.5 10.6 11.3 10.8 9.7 7.7 15.9 3.2 4.8 2.72009 −0.5 3.9 3.5 1.5 1.4 −2.7 4.9 −2.6 13.3 3.2 6.1 −2.8 7.1 12.4 5.3
Seasonally adjusted
2007 Q1 51 066 17 990 15 753 2 605 3 568 739 2 244 334 1 481 2 450 1 874 458 2 237 539 1 698Q2 51 313 18 269 15 977 2 680 3 556 771 2 284 325 1 479 2 502 1 894 486 2 292 592 1 700Q3 52 842 18 609 16 334 2 761 3 669 731 2 361 338 1 504 2 538 1 932 500 2 275 578 1 697Q4 54 418 19 265 17 016 2 843 3 980 740 2 562 387 1 547 2 599 1 859 499 2 249 562 1 687
2008 Q1 54 871 19 495 17 196 2 955 3 983 765 2 458 371 1 532 2 601 2 021 510 2 299 559 1 740Q2 56 592 19 922 17 628 2 948 4 007 812 2 601 400 1 541 2 723 2 026 570 2 294 583 1 711Q3 57 550 20 342 17 976 2 904 4 071 780 2 615 392 1 687 2 854 2 037 636 2 366 623 1 743Q4 56 989 20 557 18 173 2 927 3 929 787 2 776 377 1 898 2 888 2 056 535 2 384 616 1 768
2009 Q1 56 062 20 750 18 311 2 938 4 008 768 2 733 372 1 904 2 942 2 093 553 2 439 651 1 788Q2 56 142 20 822 18 345 2 967 4 049 760 2 768 376 1 883 2 861 2 129 552 2 477 663 1 814Q3 56 082 20 735 18 216 2 986 4 018 762 2 713 369 1 833 2 815 2 171 549 2 519 678 1 841Q4 56 565 21 132 18 563 3 024 4 140 769 2 751 383 1 922 2 799 2 240 535 2 569 684 1 885
2010 Q1 58 628 21 444 18 830 3 051 4 253 808 2 718 404 1 945 2 902 2 235 514 2 614 706 1 908
Percentage chang e , quar ter on previous quarter
2007 Q1 1.4 1.5 1.8 0.4 −0.6 0.8 1.4 3.4 3.0 3.1 5.5 6.3 −0.8 1.5 −1.6Q2 0.5 1.6 1.4 2.9 −0.3 4.3 1.8 −2.7 −0.1 2.1 1.1 6.1 2.5 9.8 0.1Q3 3.0 1.9 2.2 3.0 3.2 −5.2 3.4 4.0 1.7 1.4 2.0 2.9 −0.7 −2.4 −0.2Q4 3.0 3.5 4.2 3.0 8.5 1.2 8.5 14.5 2.9 2.4 −3.8 −0.2 −1.1 −2.8 −0.6
2008 Q1 0.8 1.2 1.1 3.9 0.1 3.4 −4.1 −4.1 −1.0 0.1 8.7 2.2 2.2 −0.5 3.1Q2 3.1 2.2 2.5 −0.2 0.6 6.1 5.8 7.8 0.6 4.7 0.2 11.8 −0.2 4.3 −1.7Q3 1.7 2.1 2.0 −1.5 1.6 −3.9 0.5 −2.0 9.5 4.8 0.5 11.6 3.1 6.9 1.9Q4 −1.0 1.1 1.1 0.8 −3.5 0.9 6.2 −3.8 12.5 1.2 0.9 −15.9 0.8 −1.1 1.4
2009 Q1 −1.6 0.9 0.8 0.4 2.0 −2.4 −1.5 −1.3 0.3 1.9 1.8 3.4 2.3 5.7 1.1Q2 0.1 0.3 0.2 1.0 1.0 −1.0 1.3 1.1 −1.1 −2.8 1.7 −0.2 1.6 1.8 1.5Q3 −0.1 −0.4 −0.7 0.6 −0.8 0.3 −2.0 −1.9 −2.7 −1.6 2.0 −0.5 1.7 2.3 1.5Q4 0.9 1.9 1.9 1.3 3.0 0.9 1.4 3.8 4.9 −0.6 3.2 −2.6 2.0 0.9 2.4
2010 Q1 3.6 1.5 1.4 0.9 2.7 5.1 −1.2 5.5 1.2 3.7 −0.2 −3.9 1.8 3.2 1.2
Percentage chang e , quar ter on corresponding quarter of previous year
2007 Q1 6.1 5.8 5.5 2.6 3.2 16.6 4.0 2.8 0.7 10.6 10.6 4.8 7.7 10.2 6.9Q2 3.1 6.1 6.1 5.6 3.6 13.4 8.7 −1.2 3.3 11.2 2.4 10.2 6.1 11.3 4.4Q3 3.5 5.2 6.1 7.5 4.1 4.0 7.6 1.5 3.1 8.0 6.6 11.9 −0.8 1.9 −1.7Q4 8.0 8.7 10.0 9.6 10.9 1.0 15.8 19.8 7.6 9.4 4.6 15.8 −0.3 5.8 −2.2
2008 Q1 7.5 8.4 9.2 13.4 11.6 3.5 9.5 11.1 3.4 6.2 7.8 11.4 2.8 3.7 2.5Q2 10.3 9.0 10.3 10.0 12.7 5.3 13.9 23.1 4.2 8.8 7.0 17.3 0.1 −1.5 0.6Q3 8.9 9.3 10.1 5.2 11.0 6.7 10.8 16.0 12.2 12.5 5.4 27.2 4.0 7.8 2.7Q4 4.7 6.7 6.8 3.0 −1.3 6.4 8.4 −2.6 22.7 11.1 10.6 7.2 6.0 9.6 4.8
2009 Q1 2.2 6.4 6.5 −0.6 0.6 0.4 11.2 0.3 24.3 13.1 3.6 8.4 6.1 16.5 2.8Q2 −0.8 4.5 4.1 0.6 1.0 −6.4 6.4 −6.0 22.2 5.1 5.1 −3.2 8.0 13.7 6.0Q3 −2.6 1.9 1.3 2.8 −1.3 −2.3 3.7 −5.9 8.7 −1.4 6.6 −13.7 6.5 8.8 5.6Q4 −0.7 2.8 2.1 3.3 5.4 −2.3 −0.9 1.6 1.3 −3.1 8.9 − 7.8 11.0 6.6
2010 Q1 4.6 3.3 2.8 3.8 6.1 5.2 −0.5 8.6 2.2 −1.4 6.8 −7.1 7.2 8.4 6.7

171
NDG.CS Household final consumption expenditureNon-durable goodsCurrent prices - seasonally adjustedcontinued £ million
Alcoholic beverages and tobacco Housing, water, electr icity, gas and other fuels
Alcoholic beverages Materials Electricity, gas & other fuelsfor the
maintena-nce &
Wine, repair ofcider & the Water Electric- Liquid Solid Heat
Total Total Spirits perry Beer Tobacco Total dwelling supply Total ity Gas fuels fuels energy
COICOP 02 02.1 02.1.1 02.1.2 02.1.3 02.2 04 04.3.1 04.4.1 04.5 04.5.1 04.5.2 04.5.3 04.5.4 04.5.5
ZAKX JJDA UUIE UTHU UUPI ZWUO LLKE ATOB UTZI ZWUQ CCSE LTYZ LTZB TTAA ZWIU2005 28 853 13 476 3 713 6 488 3 275 15 377 32 195 7 718 2 991 21 486 9 815 10 698 739 234 −2006 29 286 13 637 3 675 6 543 3 419 15 649 36 530 6 829 3 220 26 481 11 834 13 356 1 066 225 −2007 29 787 14 134 3 826 6 974 3 334 15 653 38 218 6 793 3 631 27 794 11 937 14 596 1 033 228 −2008 30 306 14 656 4 114 7 108 3 434 15 650 45 002 7 139 3 858 34 005 14 412 17 901 1 446 246 −2009 31 131 14 851 4 037 7 120 3 694 16 280 44 614 7 326 3 792 33 496 14 462 17 601 1 128 305 −
Percentage chang e , year on previous year
2005 1.0 1.5 2.7 2.5 −1.7 0.5 13.7 −2.9 8.1 22.0 13.8 34.9 −1.6 −23.52006 1.5 1.2 −1.0 0.8 4.4 1.8 13.5 −11.5 7.7 23.2 20.6 24.8 44.2 −3.82007 1.7 3.6 4.1 6.6 −2.5 − 4.6 −0.5 12.8 5.0 0.9 9.3 −3.1 1.32008 1.7 3.7 7.5 1.9 3.0 − 17.8 5.1 6.3 22.3 20.7 22.6 40.0 7.92009 2.7 1.3 −1.9 0.2 7.6 4.0 −0.9 2.6 −1.7 −1.5 0.3 −1.7 −22.0 24.0
Seasonally adjusted
2007 Q1 7 491 3 508 936 1 699 873 3 983 9 397 1 713 857 6 827 3 001 3 518 240 68 −Q2 7 378 3 493 967 1 706 820 3 885 9 190 1 710 898 6 582 2 933 3 366 226 57 −Q3 7 454 3 561 963 1 786 812 3 893 9 803 1 665 923 7 215 3 123 3 785 254 53 −Q4 7 464 3 572 960 1 783 829 3 892 9 828 1 705 953 7 170 2 880 3 927 313 50 −
2008 Q1 7 319 3 452 1 025 1 600 827 3 867 9 796 1 763 961 7 072 3 260 3 434 338 40 −Q2 7 608 3 717 1 062 1 810 845 3 891 10 828 1 767 967 8 094 3 595 4 016 430 53 −Q3 7 622 3 682 1 010 1 819 853 3 940 12 071 1 801 968 9 302 3 629 5 271 340 62 −Q4 7 757 3 805 1 017 1 879 909 3 952 12 307 1 808 962 9 537 3 928 5 180 338 91 −
2009 Q1 7 741 3 727 1 027 1 807 893 4 014 11 829 1 805 954 9 070 3 792 4 936 269 73 −Q2 7 794 3 751 1 007 1 793 951 4 043 11 102 1 813 940 8 349 3 699 4 308 259 83 −Q3 7 786 3 694 1 002 1 754 938 4 092 11 148 1 828 944 8 376 3 566 4 447 280 83 −Q4 7 810 3 679 1 001 1 766 912 4 131 10 535 1 880 954 7 701 3 405 3 910 320 66 −
2010 Q1 8 167 3 942 1 035 1 925 982 4 225 11 540 1 902 973 8 665 3 559 4 621 407 78 −
Percentage chang e , quar ter on previous quarter
2007 Q1 2.9 4.7 1.2 6.5 5.1 1.5 −0.3 −3.0 3.6 −0.1 −2.0 0.7 3.9 47.8Q2 −1.5 −0.4 3.3 0.4 −6.1 −2.5 −2.2 −0.2 4.8 −3.6 −2.3 −4.3 −5.8 −16.2Q3 1.0 1.9 −0.4 4.7 −1.0 0.2 6.7 −2.6 2.8 9.6 6.5 12.4 12.4 −7.0Q4 0.1 0.3 −0.3 −0.2 2.1 − 0.3 2.4 3.3 −0.6 −7.8 3.8 23.2 −5.7
2008 Q1 −1.9 −3.4 6.8 −10.3 −0.2 −0.6 −0.3 3.4 0.8 −1.4 13.2 −12.6 8.0 −20.0Q2 3.9 7.7 3.6 13.1 2.2 0.6 10.5 0.2 0.6 14.5 10.3 16.9 27.2 32.5Q3 0.2 −0.9 −4.9 0.5 0.9 1.3 11.5 1.9 0.1 14.9 0.9 31.2 −20.9 17.0Q4 1.8 3.3 0.7 3.3 6.6 0.3 2.0 0.4 −0.6 2.5 8.2 −1.7 −0.6 46.8
2009 Q1 −0.2 −2.0 1.0 −3.8 −1.8 1.6 −3.9 −0.2 −0.8 −4.9 −3.5 −4.7 −20.4 −19.8Q2 0.7 0.6 −1.9 −0.8 6.5 0.7 −6.1 0.4 −1.5 −7.9 −2.5 −12.7 −3.7 13.7Q3 −0.1 −1.5 −0.5 −2.2 −1.4 1.2 0.4 0.8 0.4 0.3 −3.6 3.2 8.1 −Q4 0.3 −0.4 −0.1 0.7 −2.8 1.0 −5.5 2.8 1.1 −8.1 −4.5 −12.1 14.3 −20.5
2010 Q1 4.6 7.1 3.4 9.0 7.7 2.3 9.5 1.2 2.0 12.5 4.5 18.2 27.2 18.2
Percentage chang e , quar ter on corresponding quarter of previous year
2007 Q1 3.1 4.1 6.2 3.3 3.3 2.2 14.1 7.1 8.8 16.8 9.7 25.9 −5.1 9.7Q2 0.1 0.5 4.3 2.0 −6.4 −0.3 0.8 −0.6 12.8 −0.3 −2.5 4.3 −26.6 −6.6Q3 1.2 3.6 2.2 9.6 −6.3 −1.0 0.5 −4.4 14.1 0.2 3.1 −1.5 −7.3 −5.4Q4 2.6 6.6 3.8 11.7 −0.2 −0.8 4.3 −3.5 15.2 4.9 −6.0 12.4 35.5 8.7
2008 Q1 −2.3 −1.6 9.5 −5.8 −5.3 −2.9 4.2 2.9 12.1 3.6 8.6 −2.4 40.8 −41.2Q2 3.1 6.4 9.8 6.1 3.0 0.2 17.8 3.3 7.7 23.0 22.6 19.3 90.3 −7.0Q3 2.3 3.4 4.9 1.8 5.0 1.2 23.1 8.2 4.9 28.9 16.2 39.3 33.9 17.0Q4 3.9 6.5 5.9 5.4 9.7 1.5 25.2 6.0 0.9 33.0 36.4 31.9 8.0 82.0
2009 Q1 5.8 8.0 0.2 12.9 8.0 3.8 20.8 2.4 −0.7 28.3 16.3 43.7 −20.4 82.5Q2 2.4 0.9 −5.2 −0.9 12.5 3.9 2.5 2.6 −2.8 3.2 2.9 7.3 −39.8 56.6Q3 2.2 0.3 −0.8 −3.6 10.0 3.9 −7.6 1.5 −2.5 −10.0 −1.7 −15.6 −17.6 33.9Q4 0.7 −3.3 −1.6 −6.0 0.3 4.5 −14.4 4.0 −0.8 −19.3 −13.3 −24.5 −5.3 −27.5
2010 Q1 5.5 5.8 0.8 6.5 10.0 5.3 −2.4 5.4 2.0 −4.5 −6.1 −6.4 51.3 6.8

172
NDG.CS Household final consumption expenditureNon-durable goodsCurrent prices - seasonally adjustedcontinued £ million
Fur nishing & household goods Health Transpor t
Non-durable Pharmaceutical Other medical Vehicle fuels andTotal household goods Total products products Total lubricants
COICOP 05 05.6.1 06 06.1.1 06.1.2 07 07.2.2
LLKF UVGI LLKG UTXN UVGV LLKH CCSC2005 3 805 3 805 4 370 3 864 506 24 729 24 7292006 4 007 4 007 4 569 4 116 453 25 918 25 9182007 4 006 4 006 4 668 4 173 495 28 432 28 4322008 4 157 4 157 4 903 4 399 504 30 611 30 6112009 4 344 4 344 4 909 4 349 560 26 782 26 782
Percentage chang e , year on previous year
2005 1.5 1.5 2.5 2.5 2.0 9.5 9.52006 5.3 5.3 4.6 6.5 −10.5 4.8 4.82007 − − 2.2 1.4 9.3 9.7 9.72008 3.8 3.8 5.0 5.4 1.8 7.7 7.72009 4.5 4.5 0.1 −1.1 11.1 −12.5 −12.5
Seasonally adjusted
2007 Q1 1 007 1 007 1 160 1 042 118 6 613 6 613Q2 984 984 1 133 1 016 117 6 864 6 864Q3 1 016 1 016 1 160 1 033 127 7 215 7 215Q4 999 999 1 215 1 082 133 7 740 7 740
2008 Q1 1 025 1 025 1 288 1 156 132 8 239 8 239Q2 1 038 1 038 1 257 1 128 129 8 184 8 184Q3 1 046 1 046 1 192 1 059 133 7 560 7 560Q4 1 048 1 048 1 166 1 056 110 6 628 6 628
2009 Q1 1 060 1 060 1 172 1 039 133 6 017 6 017Q2 1 111 1 111 1 237 1 086 151 6 696 6 696Q3 1 074 1 074 1 264 1 126 138 6 777 6 777Q4 1 099 1 099 1 236 1 098 138 7 292 7 292
2010 Q1 1 072 1 072 1 263 1 126 137 7 591 7 591
Percentage chang e , quar ter on previous quarter
2007 Q1 −0.9 −0.9 −1.9 −2.4 3.5 5.0 5.0Q2 −2.3 −2.3 −2.3 −2.5 −0.8 3.8 3.8Q3 3.3 3.3 2.4 1.7 8.5 5.1 5.1Q4 −1.7 −1.7 4.7 4.7 4.7 7.3 7.3
2008 Q1 2.6 2.6 6.0 6.8 −0.8 6.4 6.4Q2 1.3 1.3 −2.4 −2.4 −2.3 −0.7 −0.7Q3 0.8 0.8 −5.2 −6.1 3.1 −7.6 −7.6Q4 0.2 0.2 −2.2 −0.3 −17.3 −12.3 −12.3
2009 Q1 1.1 1.1 0.5 −1.6 20.9 −9.2 −9.2Q2 4.8 4.8 5.5 4.5 13.5 11.3 11.3Q3 −3.3 −3.3 2.2 3.7 −8.6 1.2 1.2Q4 2.3 2.3 −2.2 −2.5 − 7.6 7.6
2010 Q1 −2.5 −2.5 2.2 2.6 −0.7 4.1 4.1
Percentage chang e , quar ter on corresponding quarter of previous year
2007 Q1 5.9 5.9 7.0 6.0 16.8 2.6 2.6Q2 −1.8 −1.8 −2.2 −1.6 −7.1 4.6 4.6Q3 −2.1 −2.1 1.3 − 13.4 9.1 9.1Q4 −1.7 −1.7 2.8 1.3 16.7 22.9 22.9
2008 Q1 1.8 1.8 11.0 10.9 11.9 24.6 24.6Q2 5.5 5.5 10.9 11.0 10.3 19.2 19.2Q3 3.0 3.0 2.8 2.5 4.7 4.8 4.8Q4 4.9 4.9 −4.0 −2.4 −17.3 −14.4 −14.4
2009 Q1 3.4 3.4 −9.0 −10.1 0.8 −27.0 −27.0Q2 7.0 7.0 −1.6 −3.7 17.1 −18.2 −18.2Q3 2.7 2.7 6.0 6.3 3.8 −10.4 −10.4Q4 4.9 4.9 6.0 4.0 25.5 10.0 10.0
2010 Q1 1.1 1.1 7.8 8.4 3.0 26.2 26.2

173
NDG.CS Household final consumption expenditureNon-durable goodsCurrent prices - seasonally adjustedcontinued £ million
Recreation and culture Miscellaneous
Stationer y & Other productsGardens, plants Pets & related Newspapers & Miscellaneous drawing for personal
Total & flowers products per iodicals pr inted matter materials Total care
COICOP 09 09.3.3 09.3.4 09.5.2 09.5.3 09.5.4 12 12.1.3
LLKI AWUF UVJK CDZX XYEH XYEI LLKJ ATNP2005 14 444 3 311 2 664 4 414 1 431 2 624 13 266 13 2662006 15 147 3 354 2 831 4 485 1 559 2 918 14 237 14 2372007 15 323 3 597 2 709 4 512 1 597 2 908 15 072 15 0722008 15 297 3 806 2 875 4 226 1 559 2 831 15 410 15 4102009 15 252 3 609 3 020 4 041 1 724 2 858 14 380 14 380
Percentage chang e , year on previous year
2005 1.5 −2.7 7.5 −3.4 −2.3 13.1 2.3 2.32006 4.9 1.3 6.3 1.6 8.9 11.2 7.3 7.32007 1.2 7.2 −4.3 0.6 2.4 −0.3 5.9 5.92008 −0.2 5.8 6.1 −6.3 −2.4 −2.6 2.2 2.22009 −0.3 −5.2 5.0 −4.4 10.6 1.0 −6.7 −6.7
Seasonally adjusted
2007 Q1 3 817 914 658 1 143 358 744 3 591 3 591Q2 3 841 874 665 1 139 431 732 3 654 3 654Q3 3 789 873 670 1 125 391 730 3 796 3 796Q4 3 876 936 716 1 105 417 702 4 031 4 031
2008 Q1 3 832 953 717 1 095 392 675 3 877 3 877Q2 3 846 953 716 1 071 349 757 3 909 3 909Q3 3 903 1 005 721 1 048 436 693 3 814 3 814Q4 3 716 895 721 1 012 382 706 3 810 3 810
2009 Q1 3 828 927 728 1 034 437 702 3 665 3 665Q2 3 807 887 742 1 018 445 715 3 573 3 573Q3 3 799 894 761 1 002 409 733 3 499 3 499Q4 3 818 901 789 987 433 708 3 643 3 643
2010 Q1 3 813 908 795 988 404 718 3 738 3 738
Percentage chang e , quar ter on previous quarter
2007 Q1 −1.7 4.7 −3.2 −0.8 −13.3 −2.7 0.8 0.8Q2 0.6 −4.4 1.1 −0.3 20.4 −1.6 1.8 1.8Q3 −1.4 −0.1 0.8 −1.2 −9.3 −0.3 3.9 3.9Q4 2.3 7.2 6.9 −1.8 6.6 −3.8 6.2 6.2
2008 Q1 −1.1 1.8 0.1 −0.9 −6.0 −3.8 −3.8 −3.8Q2 0.4 − −0.1 −2.2 −11.0 12.1 0.8 0.8Q3 1.5 5.5 0.7 −2.1 24.9 −8.5 −2.4 −2.4Q4 −4.8 −10.9 − −3.4 −12.4 1.9 −0.1 −0.1
2009 Q1 3.0 3.6 1.0 2.2 14.4 −0.6 −3.8 −3.8Q2 −0.5 −4.3 1.9 −1.5 1.8 1.9 −2.5 −2.5Q3 −0.2 0.8 2.6 −1.6 −8.1 2.5 −2.1 −2.1Q4 0.5 0.8 3.7 −1.5 5.9 −3.4 4.1 4.1
2010 Q1 −0.1 0.8 0.8 0.1 −6.7 1.4 2.6 2.6
Percentage chang e , quar ter on corresponding quarter of previous year
2007 Q1 5.3 19.9 −7.3 5.4 0.8 4.1 2.4 2.4Q2 1.4 4.0 −8.8 2.4 11.9 1.5 2.9 2.9Q3 −1.6 −0.7 −5.9 −1.1 −3.7 1.8 4.9 4.9Q4 −0.2 7.2 5.3 −4.1 1.0 −8.2 13.2 13.2
2008 Q1 0.4 4.3 9.0 −4.2 9.5 −9.3 8.0 8.0Q2 0.1 9.0 7.7 −6.0 −19.0 3.4 7.0 7.0Q3 3.0 15.1 7.6 −6.8 11.5 −5.1 0.5 0.5Q4 −4.1 −4.4 0.7 −8.4 −8.4 0.6 −5.5 −5.5
2009 Q1 −0.1 −2.7 1.5 −5.6 11.5 4.0 −5.5 −5.5Q2 −1.0 −6.9 3.6 −4.9 27.5 −5.5 −8.6 −8.6Q3 −2.7 −11.0 5.5 −4.4 −6.2 5.8 −8.3 −8.3Q4 2.7 0.7 9.4 −2.5 13.4 0.3 −4.4 −4.4
2010 Q1 −0.4 −2.0 9.2 −4.4 −7.6 2.3 2.0 2.0

174
NDG.KN Household final consumption expenditureNon-durable goodsChained volume measures, reference year 2006 - not seasonally adjusted £ million
Food and non-alcoholic beverages
Food Non-alcoholic beverages
MineralMilk, Sugar & Food Coffee, water &
Bread & cheese & Oils and Vegetabl- sweet products tea & softTotal Total Total cereals Meat Fish eggs fats Fruit es products n.e.c. Total cocoa dr inks
COICOP ND 01 01.1 01.1.1 01.1.2 01.1.3 01.1.4 01.1.5 01.1.6 01.1.7 01.1.8 01.1.9 01.2 01.2.1 01.2.2
UTIK ADIP ADIQ ADMV CCFG CCFH CCFI CCFJ CCFK ADNZ ADOA ADOB ADIR CCFP CCFQ2005 197 538 68 714 60 092 10 019 14 005 2 652 8 418 1 279 5 505 9 064 7 457 1 701 8 625 2 207 6 4202006 199 337 69 643 60 856 10 240 14 006 2 750 8 667 1 310 5 800 9 193 7 134 1 756 8 787 2 119 6 6682007 201 258 70 865 62 151 10 441 14 442 2 763 8 830 1 299 5 925 9 257 7 285 1 909 8 714 2 197 6 5172008 199 531 70 563 61 813 10 139 14 185 2 778 8 520 1 238 6 163 9 384 7 320 2 086 8 750 2 195 6 5552009 191 059 69 590 60 636 9 813 13 497 2 624 8 592 1 208 6 637 9 130 7 247 1 888 8 954 2 254 6 700
Percentage chang e , year on previous year
2005 1.6 1.5 1.4 1.4 1.1 2.5 2.3 5.6 7.6 0.2 −3.0 2.2 2.3 0.6 2.92006 0.9 1.4 1.3 2.2 − 3.7 3.0 2.4 5.4 1.4 −4.3 3.2 1.9 −4.0 3.92007 1.0 1.8 2.1 2.0 3.1 0.5 1.9 −0.8 2.2 0.7 2.1 8.7 −0.8 3.7 −2.32008 −0.9 −0.4 −0.5 −2.9 −1.8 0.5 −3.5 −4.7 4.0 1.4 0.5 9.3 0.4 −0.1 0.62009 −4.2 −1.4 −1.9 −3.2 −4.9 −5.5 0.8 −2.4 7.7 −2.7 −1.0 −9.5 2.3 2.7 2.2
Not seasonally adjusted
2007 Q1 49 952 17 160 15 079 2 525 3 419 681 2 215 323 1 405 2 275 1 780 456 2 081 538 1 543Q2 48 120 17 670 15 401 2 560 3 421 783 2 193 312 1 611 2 408 1 654 459 2 269 547 1 722Q3 47 289 17 302 15 061 2 612 3 513 656 2 156 308 1 550 2 246 1 561 459 2 241 534 1 707Q4 55 897 18 733 16 610 2 744 4 089 643 2 266 356 1 359 2 328 2 290 535 2 123 578 1 545
2008 Q1 51 195 17 565 15 485 2 646 3 748 668 2 085 312 1 417 2 295 1 821 493 2 080 548 1 532Q2 49 032 17 945 15 710 2 575 3 573 805 2 142 316 1 620 2 485 1 671 523 2 235 529 1 706Q3 45 835 16 970 14 715 2 388 3 338 671 2 064 287 1 585 2 297 1 537 548 2 255 544 1 711Q4 53 469 18 083 15 903 2 530 3 526 634 2 229 323 1 541 2 307 2 291 522 2 180 574 1 606
2009 Q1 48 686 16 853 14 746 2 384 3 282 633 2 146 295 1 576 2 217 1 739 474 2 107 561 1 546Q2 46 792 17 542 15 238 2 424 3 300 720 2 162 293 1 820 2 392 1 667 460 2 304 544 1 760Q3 44 366 16 932 14 648 2 420 3 250 652 2 085 291 1 699 2 239 1 563 449 2 284 544 1 740Q4 51 215 18 263 16 004 2 585 3 665 619 2 199 329 1 542 2 282 2 278 505 2 259 605 1 654
2010 Q1 48 686 17 122 14 968 2 458 3 451 636 2 129 316 1 541 2 216 1 776 445 2 154 581 1 573
Percentage chang e , quar ter on corresponding quarter of previous year
2007 Q1 0.3 0.9 0.5 −0.4 −1.5 1.9 1.1 −5.0 −1.7 0.4 7.6 3.2 3.5 1.9 4.0Q2 −1.6 1.1 1.1 0.9 0.2 4.3 2.3 −2.8 2.3 −0.2 −0.2 8.5 1.2 5.4 −Q3 0.6 1.7 2.7 4.2 4.1 −0.2 1.7 − 3.1 −0.6 3.7 10.1 −5.0 0.8 −6.7Q4 4.3 3.3 4.0 3.1 9.2 −4.6 2.4 4.4 5.1 3.3 −1.2 12.9 −2.4 6.6 −5.4
2008 Q1 2.5 2.4 2.7 4.8 9.6 −1.9 −5.9 −3.4 0.9 0.9 2.3 8.1 − 1.9 −0.7Q2 1.9 1.6 2.0 0.6 4.4 2.8 −2.3 1.3 0.6 3.2 1.0 13.9 −1.5 −3.3 −0.9Q3 −3.1 −1.9 −2.3 −8.6 −5.0 2.3 −4.3 −6.8 2.3 2.3 −1.5 19.4 0.6 1.9 0.2Q4 −4.3 −3.5 −4.3 −7.8 −13.8 −1.4 −1.6 −9.3 13.4 −0.9 − −2.4 2.7 −0.7 3.9
2009 Q1 −4.9 −4.1 −4.8 −9.9 −12.4 −5.2 2.9 −5.4 11.2 −3.4 −4.5 −3.9 1.3 2.4 0.9Q2 −4.6 −2.2 −3.0 −5.9 −7.6 −10.6 0.9 −7.3 12.3 −3.7 −0.2 −12.0 3.1 2.8 3.2Q3 −3.2 −0.2 −0.5 1.3 −2.6 −2.8 1.0 1.4 7.2 −2.5 1.7 −18.1 1.3 − 1.7Q4 −4.2 1.0 0.6 2.2 3.9 −2.4 −1.3 1.9 0.1 −1.1 −0.6 −3.3 3.6 5.4 3.0
2010 Q1 − 1.6 1.5 3.1 5.1 0.5 −0.8 7.1 −2.2 − 2.1 −6.1 2.2 3.6 1.7

175
NDG.KN Household final consumption expenditureNon-durable goodsChained volume measures, reference year 2006 - not seasonally adjustedcontinued £ million
Alcoholic beverages and tobacco Housing, water, electr icity, gas and other fuels
Alcoholic beverages Materials Electricity, gas & other fuelsfor the
maintena-nce &
Wine, repair ofcider & the Water Electric- Liquid Solid Heat
Total Total Spirits perry Beer Tobacco Total dwelling supply Total ity Gas fuels fuels energy
COICOP 02 02.1 02.1.1 02.1.2 02.1.3 02.2 04 04.3.1 04.4.1 04.5 04.5.1 04.5.2 04.5.3 04.5.4 04.5.5
ADIS ADIT UUIL UTHV UUSC ADIU LLMS ATQG ADOU ADJE CCGF ADOZ ADPA ADPB ADPC2005 29 271 13 649 3 725 6 675 3 254 16 039 37 868 7 786 3 196 26 719 11 855 13 762 871 251 −2006 29 286 13 637 3 675 6 543 3 419 15 649 36 530 6 829 3 220 26 481 11 834 13 356 1 066 225 −2007 29 097 14 105 3 837 6 883 3 385 14 992 35 301 6 520 3 415 25 366 10 989 13 194 970 213 −2008 28 798 14 235 3 897 6 857 3 481 14 563 35 977 6 450 3 409 26 118 11 494 13 438 992 194 −2009 27 966 13 463 3 701 6 551 3 211 14 503 33 232 6 150 3 187 23 895 10 992 11 664 1 024 215 −
Percentage chang e , year on previous year
2005 −0.2 3.1 1.3 3.5 4.2 −3.2 3.5 −3.6 −1.7 7.6 2.8 17.4 −26.0 −29.32006 0.1 −0.1 −1.3 −2.0 5.1 −2.4 −3.5 −12.3 0.8 −0.9 −0.2 −3.0 22.4 −10.42007 −0.6 3.4 4.4 5.2 −1.0 −4.2 −3.4 −4.5 6.1 −4.2 −7.1 −1.2 −9.0 −5.32008 −1.0 0.9 1.6 −0.4 2.8 −2.9 1.9 −1.1 −0.2 3.0 4.6 1.8 2.3 −8.92009 −2.9 −5.4 −5.0 −4.5 −7.8 −0.4 −7.6 −4.7 −6.5 −8.5 −4.4 −13.2 3.2 10.8
Not seasonally adjusted
2007 Q1 6 808 2 952 816 1 451 685 3 857 10 502 1 581 827 8 094 3 110 4 589 324 71 −Q2 7 078 3 360 882 1 621 857 3 717 7 188 1 811 850 4 527 2 358 1 949 173 47 −Q3 7 156 3 440 866 1 705 869 3 717 6 497 1 578 862 4 057 2 508 1 350 153 46 −Q4 8 055 4 353 1 273 2 106 974 3 701 11 114 1 550 876 8 688 3 013 5 306 320 49 −
2008 Q1 6 811 3 148 886 1 516 747 3 663 10 893 1 552 871 8 470 3 325 4 782 323 40 −Q2 7 051 3 426 918 1 632 875 3 626 7 661 1 776 860 5 025 2 626 2 159 201 39 −Q3 7 044 3 392 858 1 648 886 3 652 6 558 1 601 847 4 110 2 426 1 508 129 47 −Q4 7 892 4 269 1 235 2 061 973 3 622 10 865 1 521 831 8 513 3 117 4 989 339 68 −
2009 Q1 6 540 2 898 830 1 431 637 3 641 10 919 1 493 813 8 613 3 187 5 024 344 58 −Q2 6 883 3 256 832 1 579 845 3 626 6 999 1 675 798 4 526 2 502 1 780 193 51 −Q3 6 848 3 228 822 1 546 859 3 620 5 977 1 501 789 3 687 2 372 1 102 157 56 −Q4 7 695 4 081 1 217 1 995 870 3 616 9 337 1 481 787 7 069 2 931 3 758 330 50 −
2010 Q1 6 529 2 942 798 1 493 650 3 588 10 947 1 455 793 8 699 3 249 4 985 402 63 −
Percentage chang e , quar ter on corresponding quarter of previous year
2007 Q1 −0.8 2.7 6.1 −0.1 4.1 −3.2 −7.5 3.9 3.0 −12.3 −11.8 −14.2 −7.2 2.9Q2 −2.3 0.8 4.5 2.3 −5.3 −5.0 −11.2 −4.2 5.9 −14.7 −12.4 −15.2 −28.8 −11.3Q3 −1.0 3.2 2.6 7.8 −4.1 −4.6 −6.3 −9.0 7.1 −4.6 0.5 −9.5 −8.9 −11.5Q4 1.3 6.3 4.5 9.4 2.5 −3.9 9.5 −7.9 8.3 12.9 −3.5 25.7 4.6 −3.9
2008 Q1 − 6.6 8.6 4.5 9.1 −5.0 3.7 −1.8 5.3 4.6 6.9 4.2 −0.3 −43.7Q2 −0.4 2.0 4.1 0.7 2.1 −2.4 6.6 −1.9 1.2 11.0 11.4 10.8 16.2 −17.0Q3 −1.6 −1.4 −0.9 −3.3 2.0 −1.7 0.9 1.5 −1.7 1.3 −3.3 11.7 −15.7 2.2Q4 −2.0 −1.9 −3.0 −2.1 −0.1 −2.1 −2.2 −1.9 −5.1 −2.0 3.5 −6.0 5.9 38.8
2009 Q1 −4.0 −7.9 −6.3 −5.6 −14.7 −0.6 0.2 −3.8 −6.7 1.7 −4.2 5.1 6.5 45.0Q2 −2.4 −5.0 −9.4 −3.2 −3.4 − −8.6 −5.7 −7.2 −9.9 −4.7 −17.6 −4.0 30.8Q3 −2.8 −4.8 −4.2 −6.2 −3.0 −0.9 −8.9 −6.2 −6.8 −10.3 −2.2 −26.9 21.7 19.1Q4 −2.5 −4.4 −1.5 −3.2 −10.6 −0.2 −14.1 −2.6 −5.3 −17.0 −6.0 −24.7 −2.7 −26.5
2010 Q1 −0.2 1.5 −3.9 4.3 2.0 −1.5 0.3 −2.5 −2.5 1.0 1.9 −0.8 16.9 8.6
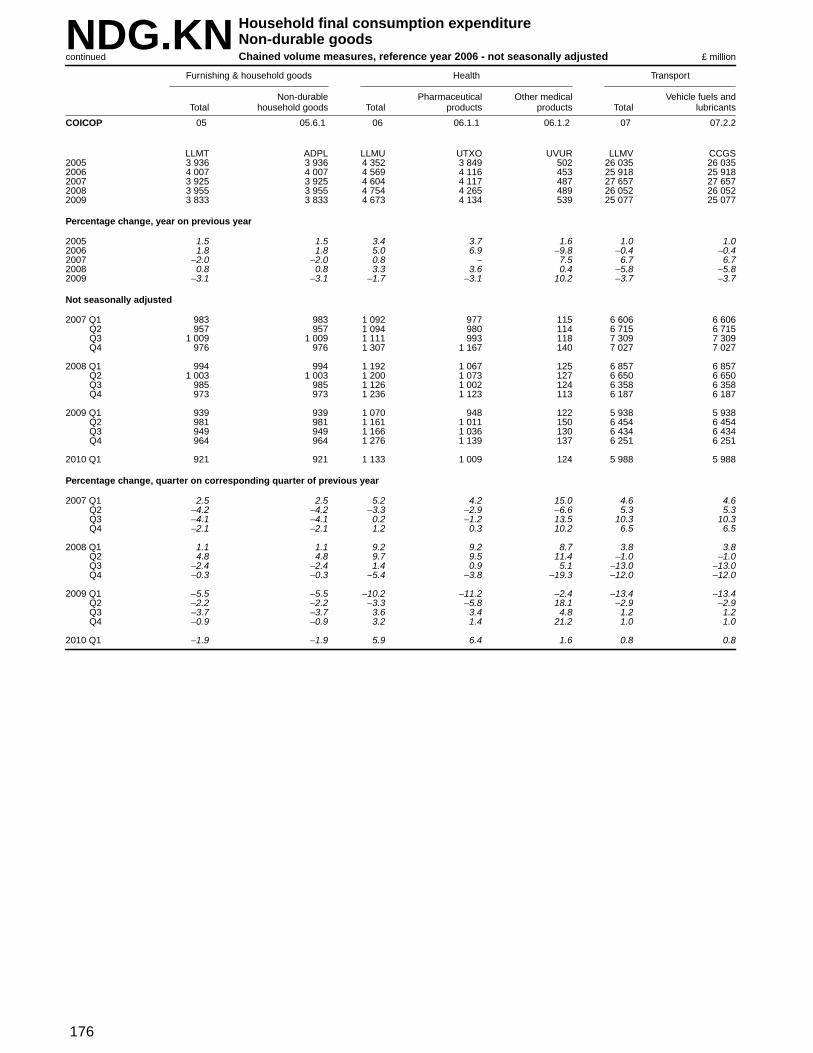
176
NDG.KN Household final consumption expenditureNon-durable goodsChained volume measures, reference year 2006 - not seasonally adjustedcontinued £ million
Fur nishing & household goods Health Transpor t
Non-durable Pharmaceutical Other medical Vehicle fuels andTotal household goods Total products products Total lubricants
COICOP 05 05.6.1 06 06.1.1 06.1.2 07 07.2.2
LLMT ADPL LLMU UTXO UVUR LLMV CCGS2005 3 936 3 936 4 352 3 849 502 26 035 26 0352006 4 007 4 007 4 569 4 116 453 25 918 25 9182007 3 925 3 925 4 604 4 117 487 27 657 27 6572008 3 955 3 955 4 754 4 265 489 26 052 26 0522009 3 833 3 833 4 673 4 134 539 25 077 25 077
Percentage chang e , year on previous year
2005 1.5 1.5 3.4 3.7 1.6 1.0 1.02006 1.8 1.8 5.0 6.9 −9.8 −0.4 −0.42007 −2.0 −2.0 0.8 − 7.5 6.7 6.72008 0.8 0.8 3.3 3.6 0.4 −5.8 −5.82009 −3.1 −3.1 −1.7 −3.1 10.2 −3.7 −3.7
Not seasonally adjusted
2007 Q1 983 983 1 092 977 115 6 606 6 606Q2 957 957 1 094 980 114 6 715 6 715Q3 1 009 1 009 1 111 993 118 7 309 7 309Q4 976 976 1 307 1 167 140 7 027 7 027
2008 Q1 994 994 1 192 1 067 125 6 857 6 857Q2 1 003 1 003 1 200 1 073 127 6 650 6 650Q3 985 985 1 126 1 002 124 6 358 6 358Q4 973 973 1 236 1 123 113 6 187 6 187
2009 Q1 939 939 1 070 948 122 5 938 5 938Q2 981 981 1 161 1 011 150 6 454 6 454Q3 949 949 1 166 1 036 130 6 434 6 434Q4 964 964 1 276 1 139 137 6 251 6 251
2010 Q1 921 921 1 133 1 009 124 5 988 5 988
Percentage chang e , quar ter on corresponding quarter of previous year
2007 Q1 2.5 2.5 5.2 4.2 15.0 4.6 4.6Q2 −4.2 −4.2 −3.3 −2.9 −6.6 5.3 5.3Q3 −4.1 −4.1 0.2 −1.2 13.5 10.3 10.3Q4 −2.1 −2.1 1.2 0.3 10.2 6.5 6.5
2008 Q1 1.1 1.1 9.2 9.2 8.7 3.8 3.8Q2 4.8 4.8 9.7 9.5 11.4 −1.0 −1.0Q3 −2.4 −2.4 1.4 0.9 5.1 −13.0 −13.0Q4 −0.3 −0.3 −5.4 −3.8 −19.3 −12.0 −12.0
2009 Q1 −5.5 −5.5 −10.2 −11.2 −2.4 −13.4 −13.4Q2 −2.2 −2.2 −3.3 −5.8 18.1 −2.9 −2.9Q3 −3.7 −3.7 3.6 3.4 4.8 1.2 1.2Q4 −0.9 −0.9 3.2 1.4 21.2 1.0 1.0
2010 Q1 −1.9 −1.9 5.9 6.4 1.6 0.8 0.8
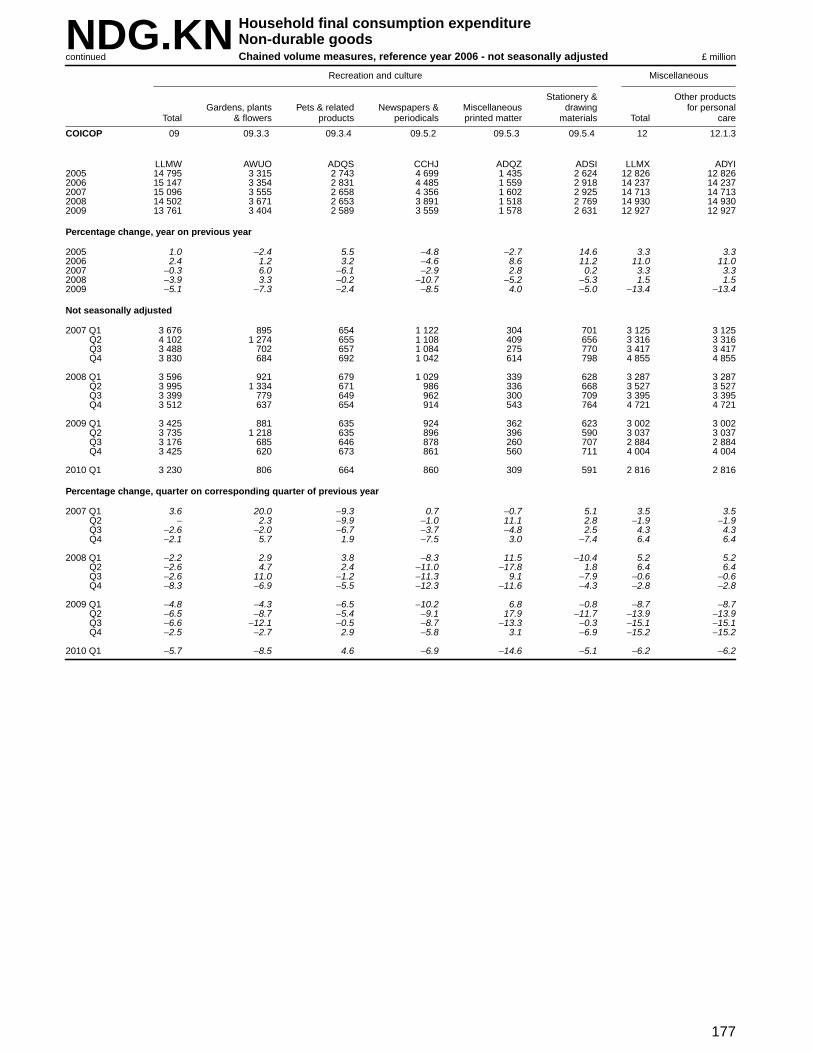
177
NDG.KN Household final consumption expenditureNon-durable goodsChained volume measures, reference year 2006 - not seasonally adjustedcontinued £ million
Recreation and culture Miscellaneous
Stationer y & Other productsGardens, plants Pets & related Newspapers & Miscellaneous drawing for personal
Total & flowers products per iodicals pr inted matter materials Total care
COICOP 09 09.3.3 09.3.4 09.5.2 09.5.3 09.5.4 12 12.1.3
LLMW AWUO ADQS CCHJ ADQZ ADSI LLMX ADYI2005 14 795 3 315 2 743 4 699 1 435 2 624 12 826 12 8262006 15 147 3 354 2 831 4 485 1 559 2 918 14 237 14 2372007 15 096 3 555 2 658 4 356 1 602 2 925 14 713 14 7132008 14 502 3 671 2 653 3 891 1 518 2 769 14 930 14 9302009 13 761 3 404 2 589 3 559 1 578 2 631 12 927 12 927
Percentage chang e , year on previous year
2005 1.0 −2.4 5.5 −4.8 −2.7 14.6 3.3 3.32006 2.4 1.2 3.2 −4.6 8.6 11.2 11.0 11.02007 −0.3 6.0 −6.1 −2.9 2.8 0.2 3.3 3.32008 −3.9 3.3 −0.2 −10.7 −5.2 −5.3 1.5 1.52009 −5.1 −7.3 −2.4 −8.5 4.0 −5.0 −13.4 −13.4
Not seasonally adjusted
2007 Q1 3 676 895 654 1 122 304 701 3 125 3 125Q2 4 102 1 274 655 1 108 409 656 3 316 3 316Q3 3 488 702 657 1 084 275 770 3 417 3 417Q4 3 830 684 692 1 042 614 798 4 855 4 855
2008 Q1 3 596 921 679 1 029 339 628 3 287 3 287Q2 3 995 1 334 671 986 336 668 3 527 3 527Q3 3 399 779 649 962 300 709 3 395 3 395Q4 3 512 637 654 914 543 764 4 721 4 721
2009 Q1 3 425 881 635 924 362 623 3 002 3 002Q2 3 735 1 218 635 896 396 590 3 037 3 037Q3 3 176 685 646 878 260 707 2 884 2 884Q4 3 425 620 673 861 560 711 4 004 4 004
2010 Q1 3 230 806 664 860 309 591 2 816 2 816
Percentage chang e , quar ter on corresponding quarter of previous year
2007 Q1 3.6 20.0 −9.3 0.7 −0.7 5.1 3.5 3.5Q2 − 2.3 −9.9 −1.0 11.1 2.8 −1.9 −1.9Q3 −2.6 −2.0 −6.7 −3.7 −4.8 2.5 4.3 4.3Q4 −2.1 5.7 1.9 −7.5 3.0 −7.4 6.4 6.4
2008 Q1 −2.2 2.9 3.8 −8.3 11.5 −10.4 5.2 5.2Q2 −2.6 4.7 2.4 −11.0 −17.8 1.8 6.4 6.4Q3 −2.6 11.0 −1.2 −11.3 9.1 −7.9 −0.6 −0.6Q4 −8.3 −6.9 −5.5 −12.3 −11.6 −4.3 −2.8 −2.8
2009 Q1 −4.8 −4.3 −6.5 −10.2 6.8 −0.8 −8.7 −8.7Q2 −6.5 −8.7 −5.4 −9.1 17.9 −11.7 −13.9 −13.9Q3 −6.6 −12.1 −0.5 −8.7 −13.3 −0.3 −15.1 −15.1Q4 −2.5 −2.7 2.9 −5.8 3.1 −6.9 −15.2 −15.2
2010 Q1 −5.7 −8.5 4.6 −6.9 −14.6 −5.1 −6.2 −6.2

178
NDG.KS Household final consumption expenditureNon-durable goodsChained volume measures, reference year 2006 - seasonally adjusted £ million
Food and non-alcoholic beverages
Food Non-alcoholic beverages
MineralMilk, Sugar & Food Coffee, water &
Bread & cheese & Oils and Vegetabl- sweet products tea & softTotal Total Total cereals Meat Fish eggs fats Fruit es products n.e.c. Total cocoa dr inks
COICOP ND 01 01.1 01.1.1 01.1.2 01.1.3 01.1.4 01.1.5 01.1.6 01.1.7 01.1.8 01.1.9 01.2 01.2.1 01.2.2
UTIL ZWUN UWBK UWBL CCTK CCTL CCTM CCTN CCTO UWFD UWFX UWGH UWGI CCTT CCTU2005 197 538 68 714 60 092 10 019 14 005 2 652 8 418 1 279 5 505 9 064 7 457 1 701 8 625 2 207 6 4202006 199 337 69 643 60 856 10 240 14 006 2 750 8 667 1 310 5 800 9 193 7 134 1 756 8 787 2 119 6 6682007 201 258 70 865 62 151 10 441 14 442 2 763 8 830 1 299 5 925 9 257 7 285 1 909 8 714 2 197 6 5172008 199 531 70 563 61 813 10 139 14 185 2 778 8 520 1 238 6 163 9 384 7 320 2 086 8 750 2 195 6 5552009 191 059 69 590 60 636 9 813 13 497 2 624 8 592 1 208 6 637 9 130 7 247 1 888 8 954 2 254 6 700
Percentage chang e , year on previous year
2005 1.6 1.5 1.4 1.4 1.1 2.5 2.3 5.6 7.6 0.2 −3.0 2.2 2.3 0.6 2.92006 0.9 1.4 1.3 2.2 − 3.7 3.0 2.4 5.4 1.4 −4.3 3.2 1.9 −4.0 3.92007 1.0 1.8 2.1 2.0 3.1 0.5 1.9 −0.8 2.2 0.7 2.1 8.7 −0.8 3.7 −2.32008 −0.9 −0.4 −0.5 −2.9 −1.8 0.5 −3.5 −4.7 4.0 1.4 0.5 9.3 0.4 −0.1 0.62009 −4.2 −1.4 −1.9 −3.2 −4.9 −5.5 0.8 −2.4 7.7 −2.7 −1.0 −9.5 2.3 2.7 2.2
Seasonally adjusted
2007 Q1 49 569 17 537 15 350 2 551 3 478 689 2 203 323 1 471 2 340 1 842 453 2 187 524 1 663Q2 49 423 17 555 15 356 2 581 3 475 717 2 189 320 1 478 2 288 1 831 477 2 199 568 1 631Q3 50 975 17 835 15 657 2 666 3 649 680 2 206 323 1 485 2 300 1 860 488 2 178 560 1 618Q4 51 291 17 938 15 788 2 643 3 840 677 2 232 333 1 491 2 329 1 752 491 2 150 545 1 605
2008 Q1 50 746 17 985 15 796 2 680 3 789 689 2 087 313 1 492 2 375 1 877 494 2 189 540 1 649Q2 50 431 17 759 15 599 2 593 3 622 725 2 135 324 1 463 2 356 1 840 541 2 160 548 1 612Q3 49 577 17 440 15 240 2 428 3 459 686 2 111 300 1 522 2 347 1 814 573 2 200 566 1 634Q4 48 777 17 379 15 178 2 438 3 315 678 2 187 301 1 686 2 306 1 789 478 2 201 541 1 660
2009 Q1 48 125 17 341 15 121 2 423 3 330 660 2 169 297 1 671 2 299 1 790 482 2 220 557 1 663Q2 48 030 17 315 15 093 2 440 3 347 651 2 142 298 1 657 2 281 1 806 471 2 222 560 1 662Q3 47 575 17 352 15 109 2 459 3 365 653 2 129 300 1 640 2 273 1 821 469 2 243 566 1 677Q4 47 329 17 582 15 313 2 491 3 455 660 2 152 313 1 669 2 277 1 830 466 2 269 571 1 698
2010 Q1 48 126 17 627 15 359 2 506 3 503 672 2 158 319 1 625 2 304 1 815 457 2 268 578 1 690
Percentage chang e , quar ter on previous quarter
2007 Q1 −0.1 1.0 1.3 −0.7 −1.0 −2.0 0.8 2.2 4.9 3.4 3.9 5.3 −1.2 2.3 −2.3Q2 −0.3 0.1 − 1.2 −0.1 4.1 −0.6 −0.9 0.5 −2.2 −0.6 5.3 0.5 8.4 −1.9Q3 3.1 1.6 2.0 3.3 5.0 −5.2 0.8 0.9 0.5 0.5 1.6 2.3 −1.0 −1.4 −0.8Q4 0.6 0.6 0.8 −0.9 5.2 −0.4 1.2 3.1 0.4 1.3 −5.8 0.6 −1.3 −2.7 −0.8
2008 Q1 −1.1 0.3 0.1 1.4 −1.3 1.8 −6.5 −6.0 0.1 2.0 7.1 0.6 1.8 −0.9 2.7Q2 −0.6 −1.3 −1.2 −3.2 −4.4 5.2 2.3 3.5 −1.9 −0.8 −2.0 9.5 −1.3 1.5 −2.2Q3 −1.7 −1.8 −2.3 −6.4 −4.5 −5.4 −1.1 −7.4 4.0 −0.4 −1.4 5.9 1.9 3.3 1.4Q4 −1.6 −0.3 −0.4 0.4 −4.2 −1.2 3.6 0.3 10.8 −1.7 −1.4 −16.6 − −4.4 1.6
2009 Q1 −1.3 −0.2 −0.4 −0.6 0.5 −2.7 −0.8 −1.3 −0.9 −0.3 0.1 0.8 0.9 3.0 0.2Q2 −0.2 −0.1 −0.2 0.7 0.5 −1.4 −1.2 0.3 −0.8 −0.8 0.9 −2.3 0.1 0.5 −0.1Q3 −0.9 0.2 0.1 0.8 0.5 0.3 −0.6 0.7 −1.0 −0.4 0.8 −0.4 0.9 1.1 0.9Q4 −0.5 1.3 1.4 1.3 2.7 1.1 1.1 4.3 1.8 0.2 0.5 −0.6 1.2 0.9 1.3
2010 Q1 1.7 0.3 0.3 0.6 1.4 1.8 0.3 1.9 −2.6 1.2 −0.8 −1.9 − 1.2 −0.5
Percentage chang e , quar ter on corresponding quarter of previous year
2007 Q1 0.5 1.2 1.0 −0.2 −1.1 4.6 2.0 −4.7 −1.7 0.9 7.3 4.1 3.2 2.5 3.4Q2 −1.4 0.7 0.6 0.9 − 2.6 1.7 −3.0 1.3 −0.1 −1.5 7.7 1.0 4.8 −0.2Q3 1.4 1.8 2.7 4.2 4.2 −1.3 1.7 −0.6 3.0 −0.8 4.2 8.9 −4.3 1.1 −6.0Q4 3.3 3.3 4.2 2.9 9.3 −3.7 2.1 5.4 6.3 2.9 −1.2 14.2 −2.9 6.4 −5.7
2008 Q1 2.4 2.6 2.9 5.1 8.9 − −5.3 −3.1 1.4 1.5 1.9 9.1 0.1 3.1 −0.8Q2 2.0 1.2 1.6 0.5 4.2 1.1 −2.5 1.3 −1.0 3.0 0.5 13.4 −1.8 −3.5 −1.2Q3 −2.7 −2.2 −2.7 −8.9 −5.2 0.9 −4.3 −7.1 2.5 2.0 −2.5 17.4 1.0 1.1 1.0Q4 −4.9 −3.1 −3.9 −7.8 −13.7 0.1 −2.0 −9.6 13.1 −1.0 2.1 −2.6 2.4 −0.7 3.4
2009 Q1 −5.2 −3.6 −4.3 −9.6 −12.1 −4.2 3.9 −5.1 12.0 −3.2 −4.6 −2.4 1.4 3.1 0.8Q2 −4.8 −2.5 −3.2 −5.9 −7.6 −10.2 0.3 −8.0 13.3 −3.2 −1.8 −12.9 2.9 2.2 3.1Q3 −4.0 −0.5 −0.9 1.3 −2.7 −4.8 0.9 − 7.8 −3.2 0.4 −18.2 2.0 − 2.6Q4 −3.0 1.2 0.9 2.2 4.2 −2.7 −1.6 4.0 −1.0 −1.3 2.3 −2.5 3.1 5.5 2.3
2010 Q1 − 1.6 1.6 3.4 5.2 1.8 −0.5 7.4 −2.8 0.2 1.4 −5.2 2.2 3.8 1.6

179
NDG.KS Household final consumption expenditureNon-durable goodsChained volume measures, reference year 2006 - seasonally adjustedcontinued £ million
Alcoholic beverages and tobacco Housing, water, electr icity, gas and other fuels
Alcoholic beverages Materials Electricity, gas & other fuelsfor the
maintena-nce &
Wine, repair ofcider & the Water Electric- Liquid Solid Heat
Total Total Spirits perry Beer Tobacco Total dwelling supply Total ity Gas fuels fuels energy
COICOP 02 02.1 02.1.1 02.1.2 02.1.3 02.2 04 04.3.1 04.4.1 04.5 04.5.1 04.5.2 04.5.3 04.5.4 04.5.5
ZAKY JRBA UUIS UTHW UUVG ZWUP LLLL ATUA UTZN ZWUR CCUA LTZA LTZC TTAB ZWIV2005 29 271 13 649 3 725 6 675 3 254 16 039 37 868 7 786 3 196 26 719 11 855 13 762 871 251 −2006 29 286 13 637 3 675 6 543 3 419 15 649 36 530 6 829 3 220 26 481 11 834 13 356 1 066 225 −2007 29 097 14 105 3 837 6 883 3 385 14 992 35 301 6 520 3 415 25 366 10 989 13 194 970 213 −2008 28 798 14 235 3 897 6 857 3 481 14 563 35 977 6 450 3 409 26 118 11 494 13 438 992 194 −2009 27 966 13 463 3 701 6 551 3 211 14 503 33 232 6 150 3 187 23 895 10 992 11 664 1 024 215 −
Percentage chang e , year on previous year
2005 −0.2 3.1 1.3 3.5 4.2 −3.2 3.5 −3.6 −1.7 7.6 2.8 17.4 −26.0 −29.32006 0.1 −0.1 −1.3 −2.0 5.1 −2.4 −3.5 −12.3 0.8 −0.9 −0.2 −3.0 22.4 −10.42007 −0.6 3.4 4.4 5.2 −1.0 −4.2 −3.4 −4.5 6.1 −4.2 −7.1 −1.2 −9.0 −5.32008 −1.0 0.9 1.6 −0.4 2.8 −2.9 1.9 −1.1 −0.2 3.0 4.6 1.8 2.3 −8.92009 −2.9 −5.4 −5.0 −4.5 −7.8 −0.4 −7.6 −4.7 −6.5 −8.5 −4.4 −13.2 3.2 10.8
Seasonally adjusted
2007 Q1 7 292 3 438 934 1 653 852 3 854 8 445 1 669 827 5 949 2 701 2 940 243 65 −Q2 7 235 3 510 972 1 703 835 3 724 8 464 1 651 850 5 963 2 662 3 025 223 53 −Q3 7 273 3 556 962 1 761 834 3 717 9 103 1 585 862 6 656 2 902 3 454 250 50 −Q4 7 297 3 601 969 1 766 864 3 697 9 289 1 615 876 6 798 2 724 3 775 254 45 −
2008 Q1 7 303 3 642 1 010 1 713 920 3 661 8 686 1 630 871 6 185 2 887 3 018 244 36 −Q2 7 209 3 578 1 006 1 722 849 3 632 9 129 1 619 860 6 650 2 967 3 372 266 45 −Q3 7 146 3 494 946 1 701 847 3 651 9 279 1 616 847 6 816 2 808 3 745 213 50 −Q4 7 140 3 521 935 1 721 865 3 619 8 883 1 585 831 6 467 2 832 3 303 269 63 −
2009 Q1 6 994 3 352 946 1 616 790 3 641 8 616 1 562 813 6 241 2 758 3 179 253 51 −Q2 7 051 3 420 926 1 672 822 3 630 8 354 1 529 798 6 027 2 824 2 890 255 58 −Q3 6 971 3 350 916 1 610 824 3 620 8 304 1 519 789 5 996 2 743 2 939 256 58 −Q4 6 950 3 341 913 1 653 775 3 612 7 958 1 540 787 5 631 2 667 2 656 260 48 −
2010 Q1 7 012 3 424 916 1 696 812 3 589 8 626 1 523 793 6 310 2 806 3 156 293 55 −
Percentage chang e , quar ter on previous quarter
2007 Q1 1.0 1.9 0.8 3.1 1.3 0.2 −4.3 −4.6 2.2 −4.7 −3.8 −6.8 3.4 44.4Q2 −0.8 2.1 4.1 3.0 −2.0 −3.4 0.2 −1.1 2.8 0.2 −1.4 2.9 −8.2 −18.5Q3 0.5 1.3 −1.0 3.4 −0.1 −0.2 7.5 −4.0 1.4 11.6 9.0 14.2 12.1 −5.7Q4 0.3 1.3 0.7 0.3 3.6 −0.5 2.0 1.9 1.6 2.1 −6.1 9.3 1.6 −10.0
2008 Q1 0.1 1.1 4.2 −3.0 6.5 −1.0 −6.5 0.9 −0.6 −9.0 6.0 −20.1 −3.9 −20.0Q2 −1.3 −1.8 −0.4 0.5 −7.7 −0.8 5.1 −0.7 −1.3 7.5 2.8 11.7 9.0 25.0Q3 −0.9 −2.3 −6.0 −1.2 −0.2 0.5 1.6 −0.2 −1.5 2.5 −5.4 11.1 −19.9 11.1Q4 −0.1 0.8 −1.2 1.2 2.1 −0.9 −4.3 −1.9 −1.9 −5.1 0.9 −11.8 26.3 26.0
2009 Q1 −2.0 −4.8 1.2 −6.1 −8.7 0.6 −3.0 −1.5 −2.2 −3.5 −2.6 −3.8 −5.9 −19.0Q2 0.8 2.0 −2.1 3.5 4.1 −0.3 −3.0 −2.1 −1.8 −3.4 2.4 −9.1 0.8 13.7Q3 −1.1 −2.0 −1.1 −3.7 0.2 −0.3 −0.6 −0.7 −1.1 −0.5 −2.9 1.7 0.4 −Q4 −0.3 −0.3 −0.3 2.7 −5.9 −0.2 −4.2 1.4 −0.3 −6.1 −2.8 −9.6 1.6 −17.2
2010 Q1 0.9 2.5 0.3 2.6 4.8 −0.6 8.4 −1.1 0.8 12.1 5.2 18.8 12.7 14.6
Percentage chang e , quar ter on corresponding quarter of previous year
2007 Q1 −0.5 2.8 6.4 0.4 3.8 −3.3 −6.7 3.6 3.0 −10.6 −12.3 −9.4 −5.8 3.2Q2 −2.1 1.2 4.7 3.0 −5.8 −5.0 −9.4 −4.6 5.9 −12.5 −12.7 −10.7 −28.3 −11.7Q3 −1.1 3.0 2.1 7.4 −4.2 −4.6 −2.3 −8.9 7.1 −1.7 0.1 −3.2 −4.6 −12.3Q4 1.1 6.8 4.5 10.2 2.7 −3.9 5.3 −7.7 8.3 8.9 −3.0 19.6 8.1 −
2008 Q1 0.2 5.9 8.1 3.6 8.0 −5.0 2.9 −2.3 5.3 4.0 6.9 2.7 0.4 −44.6Q2 −0.4 1.9 3.5 1.1 1.7 −2.5 7.9 −1.9 1.2 11.5 11.5 11.5 19.3 −15.1Q3 −1.7 −1.7 −1.7 −3.4 1.6 −1.8 1.9 2.0 −1.7 2.4 −3.2 8.4 −14.8 −Q4 −2.2 −2.2 −3.5 −2.5 0.1 −2.1 −4.4 −1.9 −5.1 −4.9 4.0 −12.5 5.9 40.0
2009 Q1 −4.2 −8.0 −6.3 −5.7 −14.1 −0.5 −0.8 −4.2 −6.7 0.9 −4.5 5.3 3.7 41.7Q2 −2.2 −4.4 −8.0 −2.9 −3.2 −0.1 −8.5 −5.6 −7.2 −9.4 −4.8 −14.3 −4.1 28.9Q3 −2.4 −4.1 −3.2 −5.3 −2.7 −0.8 −10.5 −6.0 −6.8 −12.0 −2.3 −21.5 20.2 16.0Q4 −2.7 −5.1 −2.4 −4.0 −10.4 −0.2 −10.4 −2.8 −5.3 −12.9 −5.8 −19.6 −3.3 −23.8
2010 Q1 0.3 2.1 −3.2 5.0 2.8 −1.4 0.1 −2.5 −2.5 1.1 1.7 −0.7 15.8 7.8

180
NDG.KS Household final consumption expenditureNon-durable goodsChained volume measures, reference year 2006 - seasonally adjustedcontinued £ million
Fur nishing & household goods Health Transpor t
Non-durable Pharmaceutical Other medical Vehicle fuels andTotal household goods Total products products Total lubricants
COICOP 05 05.6.1 06 06.1.1 06.1.2 07 07.2.2
LLLM UWHO LLLN UTXP UWIB LLLO CCTY2005 3 936 3 936 4 352 3 849 502 26 035 26 0352006 4 007 4 007 4 569 4 116 453 25 918 25 9182007 3 925 3 925 4 604 4 117 487 27 657 27 6572008 3 955 3 955 4 754 4 265 489 26 052 26 0522009 3 833 3 833 4 673 4 134 539 25 077 25 077
Percentage chang e , year on previous year
2005 1.5 1.5 3.4 3.7 1.6 1.0 1.02006 1.8 1.8 5.0 6.9 −9.8 −0.4 −0.42007 −2.0 −2.0 0.8 − 7.5 6.7 6.72008 0.8 0.8 3.3 3.6 0.4 −5.8 −5.82009 −3.1 −3.1 −1.7 −3.1 10.2 −3.7 −3.7
Seasonally adjusted
2007 Q1 988 988 1 148 1 031 117 6 756 6 756Q2 959 959 1 119 1 004 115 6 720 6 720Q3 1 003 1 003 1 147 1 022 125 7 161 7 161Q4 975 975 1 190 1 060 130 7 020 7 020
2008 Q1 1 004 1 004 1 255 1 126 129 7 032 7 032Q2 1 002 1 002 1 221 1 096 125 6 642 6 642Q3 978 978 1 152 1 024 128 6 213 6 213Q4 971 971 1 126 1 019 107 6 165 6 165
2009 Q1 955 955 1 126 998 128 6 108 6 108Q2 976 976 1 181 1 035 146 6 447 6 447Q3 942 942 1 194 1 061 133 6 286 6 286Q4 960 960 1 172 1 040 132 6 236 6 236
2010 Q1 941 941 1 192 1 061 131 6 176 6 176
Percentage chang e , quar ter on previous quarter
2007 Q1 −1.4 −1.4 −2.0 −2.5 2.6 2.4 2.4Q2 −2.9 −2.9 −2.5 −2.6 −1.7 −0.5 −0.5Q3 4.6 4.6 2.5 1.8 8.7 6.6 6.6Q4 −2.8 −2.8 3.7 3.7 4.0 −2.0 −2.0
2008 Q1 3.0 3.0 5.5 6.2 −0.8 0.2 0.2Q2 −0.2 −0.2 −2.7 −2.7 −3.1 −5.5 −5.5Q3 −2.4 −2.4 −5.7 −6.6 2.4 −6.5 −6.5Q4 −0.7 −0.7 −2.3 −0.5 −16.4 −0.8 −0.8
2009 Q1 −1.6 −1.6 − −2.1 19.6 −0.9 −0.9Q2 2.2 2.2 4.9 3.7 14.1 5.6 5.6Q3 −3.5 −3.5 1.1 2.5 −8.9 −2.5 −2.5Q4 1.9 1.9 −1.8 −2.0 −0.8 −0.8 −0.8
2010 Q1 −2.0 −2.0 1.7 2.0 −0.8 −1.0 −1.0
Percentage chang e , quar ter on corresponding quarter of previous year
2007 Q1 2.8 2.8 5.4 4.4 15.8 5.1 5.1Q2 −4.3 −4.3 −3.9 −3.3 −8.7 5.2 5.2Q3 −3.7 −3.7 0.2 −1.1 11.6 10.1 10.1Q4 −2.7 −2.7 1.6 0.3 14.0 6.4 6.4
2008 Q1 1.6 1.6 9.3 9.2 10.3 4.1 4.1Q2 4.5 4.5 9.1 9.2 8.7 −1.2 −1.2Q3 −2.5 −2.5 0.4 0.2 2.4 −13.2 −13.2Q4 −0.4 −0.4 −5.4 −3.9 −17.7 −12.2 −12.2
2009 Q1 −4.9 −4.9 −10.3 −11.4 −0.8 −13.1 −13.1Q2 −2.6 −2.6 −3.3 −5.6 16.8 −2.9 −2.9Q3 −3.7 −3.7 3.6 3.6 3.9 1.2 1.2Q4 −1.1 −1.1 4.1 2.1 23.4 1.2 1.2
2010 Q1 −1.5 −1.5 5.9 6.3 2.3 1.1 1.1

181
NDG.KS Household final consumption expenditureNon-durable goodsChained volume measures, reference year 2006 - seasonally adjustedcontinued £ million
Recreation and culture Miscellaneous
Stationer y & Other productsGardens, plants Pets & related Newspapers & Miscellaneous drawing for personal
Total & flowers products per iodicals pr inted matter materials Total care
COICOP 09 09.3.3 09.3.4 09.5.2 09.5.3 09.5.4 12 12.1.3
LLLP AWUX UWKQ CDZY XYJV XYJW LLLQ ATSP2005 14 795 3 315 2 743 4 699 1 435 2 624 12 826 12 8262006 15 147 3 354 2 831 4 485 1 559 2 918 14 237 14 2372007 15 096 3 555 2 658 4 356 1 602 2 925 14 713 14 7132008 14 502 3 671 2 653 3 891 1 518 2 769 14 930 14 9302009 13 761 3 404 2 589 3 559 1 578 2 631 12 927 12 927
Percentage chang e , year on previous year
2005 1.0 −2.4 5.5 −4.8 −2.7 14.6 3.3 3.32006 2.4 1.2 3.2 −4.6 8.6 11.2 11.0 11.02007 −0.3 6.0 −6.1 −2.9 2.8 0.2 3.3 3.32008 −3.9 3.3 −0.2 −10.7 −5.2 −5.3 1.5 1.52009 −5.1 −7.3 −2.4 −8.5 4.0 −5.0 −13.4 −13.4
Seasonally adjusted
2007 Q1 3 782 904 655 1 117 360 746 3 621 3 621Q2 3 804 868 656 1 109 433 738 3 567 3 567Q3 3 734 863 660 1 084 392 735 3 719 3 719Q4 3 776 920 687 1 046 417 706 3 806 3 806
2008 Q1 3 691 927 680 1 024 391 669 3 790 3 790Q2 3 671 918 673 988 344 748 3 798 3 798Q3 3 674 967 652 961 420 674 3 695 3 695Q4 3 466 859 648 918 363 678 3 647 3 647
2009 Q1 3 532 895 636 919 416 666 3 453 3 453Q2 3 449 844 637 898 409 661 3 257 3 257Q3 3 407 837 649 877 372 672 3 119 3 119Q4 3 373 828 667 865 381 632 3 098 3 098
2010 Q1 3 326 821 665 856 355 629 3 226 3 226
Percentage chang e , quar ter on previous quarter
2007 Q1 −1.8 3.6 −3.0 −1.1 −12.0 −2.6 1.2 1.2Q2 0.6 −4.0 0.2 −0.7 20.3 −1.1 −1.5 −1.5Q3 −1.8 −0.6 0.6 −2.3 −9.5 −0.4 4.3 4.3Q4 1.1 6.6 4.1 −3.5 6.4 −3.9 2.3 2.3
2008 Q1 −2.3 0.8 −1.0 −2.1 −6.2 −5.2 −0.4 −0.4Q2 −0.5 −1.0 −1.0 −3.5 −12.0 11.8 0.2 0.2Q3 0.1 5.3 −3.1 −2.7 22.1 −9.9 −2.7 −2.7Q4 −5.7 −11.2 −0.6 −4.5 −13.6 0.6 −1.3 −1.3
2009 Q1 1.9 4.2 −1.9 0.1 14.6 −1.8 −5.3 −5.3Q2 −2.3 −5.7 0.2 −2.3 −1.7 −0.8 −5.7 −5.7Q3 −1.2 −0.8 1.9 −2.3 −9.0 1.7 −4.2 −4.2Q4 −1.0 −1.1 2.8 −1.4 2.4 −6.0 −0.7 −0.7
2010 Q1 −1.4 −0.8 −0.3 −1.0 −6.8 −0.5 4.1 4.1
Percentage chang e , quar ter on corresponding quarter of previous year
2007 Q1 3.3 18.8 −9.2 0.7 −0.3 4.8 4.3 4.3Q2 0.2 3.0 −10.0 −0.9 12.5 2.2 −1.8 −1.8Q3 −2.6 −1.6 −6.5 −3.9 −3.0 2.4 4.6 4.6Q4 −2.0 5.4 1.8 −7.4 2.0 −7.8 6.4 6.4
2008 Q1 −2.4 2.5 3.8 −8.3 8.6 −10.3 4.7 4.7Q2 −3.5 5.8 2.6 −10.9 −20.6 1.4 6.5 6.5Q3 −1.6 12.1 −1.2 −11.3 7.1 −8.3 −0.6 −0.6Q4 −8.2 −6.6 −5.7 −12.2 −12.9 −4.0 −4.2 −4.2
2009 Q1 −4.3 −3.5 −6.5 −10.3 6.4 −0.4 −8.9 −8.9Q2 −6.0 −8.1 −5.3 −9.1 18.9 −11.6 −14.2 −14.2Q3 −7.3 −13.4 −0.5 −8.7 −11.4 −0.3 −15.6 −15.6Q4 −2.7 −3.6 2.9 −5.8 5.0 −6.8 −15.1 −15.1
2010 Q1 −5.8 −8.3 4.6 −6.9 −14.7 −5.6 −6.6 −6.6

182
NDG.DN Household final consumption expenditureNon-durable goodsImplied deflators - not seasonally adjusted 2006 = 100
Food and non-alcoholic beverages
Food Non-alcoholic beverages
MineralMilk, Sugar & Food Coffee, water &
Bread & cheese & Oils and Vegetabl- sweet products tea & softTotal Total Total cereals Meat Fish eggs fats Fruit es products n.e.c. Total cocoa dr inks
COICOP ND 01 01.1 01.1.1 01.1.2 01.1.3 01.1.4 01.1.5 01.1.6 01.1.7 01.1.8 01.1.9 01.2 01.2.1 01.2.2
UTKW UTJB UTNC AWLJ AWLK AWLL AWLM AWLN AWLO AWLP AWLQ AWLR UTND AWLS AWLT2005 95.6 97.7 97.9 98.1 98.2 93.1 98.5 96.3 99.2 98.1 96.3 100.7 96.4 95.2 96.82006 100.0 100.0 100.0 100.0 100.0 100.0 100.0 100.0 100.0 100.0 100.0 100.0 100.0 100.0 100.02007 104.2 104.6 104.7 104.3 102.3 107.9 107.0 106.5 101.5 109.0 103.8 101.8 103.9 103.4 104.12008 113.3 113.8 114.8 115.7 112.7 113.2 122.7 124.4 108.0 117.9 111.2 107.9 106.8 108.5 106.22009 117.7 119.9 121.1 121.4 120.1 116.6 127.6 124.2 113.6 125.0 119.1 115.9 111.7 118.7 109.4
Percentage chang e , year on previous year
2005 3.4 1.5 1.7 1.2 − 3.9 2.7 −1.8 1.7 2.9 3.0 −0.3 0.4 0.2 0.42006 4.6 2.4 2.1 1.9 1.8 7.4 1.5 3.8 0.8 1.9 3.8 −0.7 3.7 5.0 3.32007 4.2 4.6 4.7 4.3 2.3 7.9 7.0 6.5 1.5 9.0 3.8 1.8 3.9 3.4 4.12008 8.7 8.8 9.6 10.9 10.2 4.9 14.7 16.8 6.4 8.2 7.1 6.0 2.8 4.9 2.02009 3.9 5.4 5.5 4.9 6.6 3.0 4.0 −0.2 5.2 6.0 7.1 7.4 4.6 9.4 3.0
Not seasonally adjusted
2007 Q1 103.4 102.7 102.7 101.9 102.2 106.0 101.9 102.5 99.4 107.1 101.8 100.9 102.4 103.2 102.1Q2 104.0 104.3 104.2 103.9 102.3 107.5 103.7 101.6 100.8 110.5 103.5 101.5 104.4 103.5 104.6Q3 103.5 103.9 103.8 103.3 101.0 108.1 106.9 103.6 98.8 108.4 103.7 102.0 104.6 103.6 104.9Q4 105.6 107.4 107.8 107.8 103.5 110.1 115.4 117.1 107.4 109.8 105.5 102.6 104.2 103.3 104.5
2008 Q1 108.3 108.6 109.0 110.0 104.6 109.9 118.3 118.6 101.6 111.9 108.0 103.7 105.1 103.8 105.5Q2 112.2 112.3 113.2 113.9 110.4 112.2 121.0 123.4 106.1 117.0 110.2 105.0 106.5 105.7 106.7Q3 115.0 116.0 117.3 119.3 118.2 114.5 123.9 130.0 107.6 119.5 111.8 109.7 107.7 110.5 106.8Q4 117.5 118.3 119.7 120.2 118.5 116.6 127.2 126.0 116.5 123.3 114.1 113.0 107.8 113.6 105.7
2009 Q1 118.2 120.1 121.4 121.1 119.7 115.3 127.4 125.8 113.2 130.0 117.4 116.2 110.3 117.6 107.7Q2 116.2 120.3 121.6 121.8 120.7 116.9 127.9 125.3 114.3 127.2 117.9 115.9 111.4 117.3 109.6Q3 116.6 118.9 120.0 121.0 120.2 117.2 127.4 122.0 108.8 121.7 119.5 116.0 112.4 120.4 109.9Q4 119.5 120.3 121.4 121.9 119.9 116.8 127.7 123.7 118.7 121.3 121.1 115.6 112.7 119.5 110.2
2010 Q1 122.6 122.0 122.8 121.4 120.7 119.2 127.3 127.5 119.0 127.9 123.4 114.2 115.8 122.9 113.2
Percentage chang e , quar ter on corresponding quarter of previous year
2007 Q1 5.6 4.6 4.6 2.7 4.2 11.0 2.3 7.6 2.7 9.4 3.8 1.1 4.5 7.3 3.4Q2 4.5 5.4 5.4 4.5 3.4 10.3 6.4 1.3 1.8 11.5 3.4 1.7 5.0 5.9 4.7Q3 2.9 3.4 3.3 3.1 0.1 5.4 5.7 1.3 −0.3 8.7 2.9 2.0 3.9 1.3 4.7Q4 3.6 5.1 5.5 6.5 1.6 5.2 13.5 14.5 1.4 6.2 4.7 2.2 2.5 −0.4 3.5
2008 Q1 4.7 5.7 6.1 7.9 2.3 3.7 16.1 15.7 2.2 4.5 6.1 2.8 2.6 0.6 3.3Q2 7.9 7.7 8.6 9.6 7.9 4.4 16.7 21.5 5.3 5.9 6.5 3.4 2.0 2.1 2.0Q3 11.1 11.6 13.0 15.5 17.0 5.9 15.9 25.5 8.9 10.2 7.8 7.5 3.0 6.7 1.8Q4 11.3 10.1 11.0 11.5 14.5 5.9 10.2 7.6 8.5 12.3 8.2 10.1 3.5 10.0 1.1
2009 Q1 9.1 10.6 11.4 10.1 14.4 4.9 7.7 6.1 11.4 16.2 8.7 12.1 4.9 13.3 2.1Q2 3.6 7.1 7.4 6.9 9.3 4.2 5.7 1.5 7.7 8.7 7.0 10.4 4.6 11.0 2.7Q3 1.4 2.5 2.3 1.4 1.7 2.4 2.8 −6.2 1.1 1.8 6.9 5.7 4.4 9.0 2.9Q4 1.7 1.7 1.4 1.4 1.2 0.2 0.4 −1.8 1.9 −1.6 6.1 2.3 4.5 5.2 4.3
2010 Q1 3.7 1.6 1.2 0.2 0.8 3.4 −0.1 1.4 5.1 −1.6 5.1 −1.7 5.0 4.5 5.1

183
NDG.DN Household final consumption expenditureNon-durable goodsImplied deflators - not seasonally adjustedcontinued 2006 = 100
Alcoholic beverages and tobacco Housing, water, electr icity, gas and other fuels
Alcoholic beverages Materials Electricity, gas & other fuelsfor the
maintena-nce &
Wine, repair ofcider & the Water Electric- Liquid Solid Heat
Total Total Spirits perry Beer Tobacco Total dwelling supply Total ity Gas fuels fuels energy
COICOP 02 02.1 02.1.1 02.1.2 02.1.3 02.2 04 04.3.1 04.4.1 04.5 04.5.1 04.5.2 04.5.3 04.5.4 04.5.5
UTJC UTNE AWLU AWLV AWLW UTNF LLNZ AWMH AWMJ UTNM AWMN AWMO AWMP AWMQ2005 98.6 98.7 99.7 97.2 100.6 95.9 85.0 99.1 93.6 80.4 82.8 77.7 84.8 93.22006 100.0 100.0 100.0 100.0 100.0 100.0 100.0 100.0 100.0 100.0 100.0 100.0 100.0 100.02007 102.4 100.2 99.7 101.3 98.5 104.4 108.3 104.2 106.3 109.6 108.6 110.6 106.5 107.02008 105.2 103.0 105.6 103.7 98.6 107.5 125.1 110.7 113.2 130.2 125.4 133.2 145.8 126.82009 111.3 110.3 109.1 108.7 115.0 112.3 134.3 119.1 119.0 140.2 131.6 150.9 110.2 141.9
Percentage chang e , year on previous year
2005 1.2 −1.6 1.3 −0.9 −5.7 3.8 9.8 0.7 9.9 13.4 10.7 14.8 32.9 8.12006 1.4 1.3 0.3 2.9 −0.6 4.3 17.6 0.9 6.8 24.4 20.8 28.7 17.9 7.32007 2.4 0.2 −0.3 1.3 −1.5 4.4 8.3 4.2 6.3 9.6 8.6 10.6 6.5 7.02008 2.7 2.8 5.9 2.4 0.1 3.0 15.5 6.2 6.5 18.8 15.5 20.4 36.9 18.52009 5.8 7.1 3.3 4.8 16.6 4.5 7.4 7.6 5.1 7.7 4.9 13.3 −24.4 11.9
Not seasonally adjusted
2007 Q1 102.0 100.4 98.9 100.1 102.6 103.1 112.5 102.8 101.3 115.5 112.0 119.7 93.5 105.6Q2 102.8 100.3 99.1 101.5 99.2 105.0 108.4 103.5 107.9 110.4 109.7 112.3 101.7 104.3Q3 102.9 100.8 99.4 101.7 100.5 104.9 105.9 104.9 107.9 105.9 106.5 105.0 105.2 106.5Q4 101.9 99.5 100.9 101.7 93.2 104.6 105.6 105.7 108.0 105.3 106.1 103.7 122.8 112.2
2008 Q1 99.6 92.7 100.0 90.0 89.3 105.6 113.1 108.4 107.9 114.4 114.2 113.2 137.2 107.5Q2 105.9 103.7 104.4 105.6 99.5 107.9 118.3 109.0 115.0 122.2 120.4 119.9 172.6 115.4Q3 106.6 105.1 105.1 106.3 102.8 108.0 125.1 111.4 115.0 132.5 128.1 136.4 173.6 123.4Q4 108.3 108.2 110.8 110.0 101.2 108.4 141.9 114.1 114.9 149.5 139.5 157.2 127.4 147.1
2009 Q1 109.5 108.6 107.0 107.9 112.1 110.3 140.1 115.7 114.9 146.7 138.8 154.7 103.5 143.1Q2 111.4 110.5 107.9 108.8 116.2 112.2 130.0 118.5 120.3 136.0 129.4 148.5 104.7 141.2Q3 112.2 111.2 108.3 109.4 117.2 113.1 128.6 120.3 120.4 133.7 128.4 147.9 111.5 139.3Q4 112.1 110.7 111.8 108.6 113.9 113.5 134.2 122.1 120.5 138.3 128.0 147.8 119.7 144.0
2010 Q1 115.6 112.9 111.8 110.2 120.6 117.9 135.0 125.1 120.4 138.0 128.0 145.0 131.6 138.1
Percentage chang e , quar ter on corresponding quarter of previous year
2007 Q1 3.8 0.9 0.2 2.5 −0.9 5.6 21.5 3.3 5.5 29.6 25.0 37.6 −3.4 7.1Q2 2.6 −0.2 −0.1 −0.6 0.1 5.1 10.5 4.0 6.6 11.6 10.9 12.9 0.1 4.3Q3 2.1 0.6 − 2.1 −1.7 3.8 5.6 4.8 6.4 2.3 2.6 −0.6 −4.5 8.6Q4 1.3 −0.3 −0.9 1.3 −3.2 3.1 −3.6 4.8 6.5 −5.9 −3.2 −9.6 27.0 8.0
2008 Q1 −2.4 −7.7 1.1 −10.1 −13.0 2.4 0.5 5.4 6.5 −1.0 2.0 −5.4 46.7 1.8Q2 3.0 3.4 5.3 4.0 0.3 2.8 9.1 5.3 6.6 10.7 9.8 6.8 69.7 10.6Q3 3.6 4.3 5.7 4.5 2.3 3.0 18.1 6.2 6.6 25.1 20.3 29.9 65.0 15.9Q4 6.3 8.7 9.8 8.2 8.6 3.6 34.4 7.9 6.4 42.0 31.5 51.6 3.7 31.1
2009 Q1 9.9 17.2 7.0 19.9 25.5 4.5 23.9 6.7 6.5 28.2 21.5 36.7 −24.6 33.1Q2 5.2 6.6 3.4 3.0 16.8 4.0 9.9 8.7 4.6 11.3 7.5 23.9 −39.3 22.4Q3 5.3 5.8 3.0 2.9 14.0 4.7 2.8 8.0 4.7 0.9 0.2 8.4 −35.8 12.9Q4 3.5 2.3 0.9 −1.3 12.5 4.7 −5.4 7.0 4.9 −7.5 −8.2 −6.0 −6.0 −2.1
2010 Q1 5.6 4.0 4.5 2.1 7.6 6.9 −3.6 8.1 4.8 −5.9 −7.8 −6.3 27.1 −3.5

184
NDG.DN Household final consumption expenditureNon-durable goodsImplied deflators - not seasonally adjustedcontinued 2006 = 100
Fur nishing & household goods Health Transpor t
Non-durable Pharmaceutical Other medical Vehicle fuels andTotal household goods Total products products Total lubricants
COICOP 05 05.6.1 06 06.1.1 06.1.2 07 07.2.2
LLOA AWNA LLOB AWNC AWND LLOC AWNM2005 96.7 96.7 100.4 100.4 100.8 95.0 95.02006 100.0 100.0 100.0 100.0 100.0 100.0 100.02007 102.1 102.1 101.4 101.4 101.6 102.8 102.82008 105.1 105.1 103.1 103.1 103.1 117.5 117.52009 113.3 113.3 105.1 105.2 103.9 106.8 106.8
Percentage chang e , year on previous year
2005 − − −0.9 −1.1 0.4 8.4 8.42006 3.4 3.4 −0.4 −0.4 −0.8 5.3 5.32007 2.1 2.1 1.4 1.4 1.6 2.8 2.82008 2.9 2.9 1.7 1.7 1.5 14.3 14.32009 7.8 7.8 1.9 2.0 0.8 −9.1 −9.1
Not seasonally adjusted
2007 Q1 101.7 101.7 101.0 101.0 100.9 96.5 96.5Q2 102.7 102.7 101.3 101.2 101.8 102.9 102.9Q3 102.0 102.0 101.2 101.1 101.7 103.1 103.1Q4 101.8 101.8 102.0 102.0 102.1 108.4 108.4
2008 Q1 102.1 102.1 102.6 102.6 102.4 115.5 115.5Q2 103.6 103.6 103.1 103.1 103.1 123.9 123.9Q3 107.7 107.7 103.5 103.5 103.2 124.9 124.9Q4 107.1 107.1 103.4 103.4 103.5 105.3 105.3
2009 Q1 111.2 111.2 104.0 104.0 104.1 97.0 97.0Q2 113.9 113.9 104.9 105.0 104.0 104.4 104.4Q3 115.1 115.1 105.8 106.2 103.1 110.9 110.9Q4 113.2 113.2 105.3 105.4 104.4 114.4 114.4
2010 Q1 114.2 114.2 106.0 106.0 105.6 121.1 121.1
Percentage chang e , quar ter on corresponding quarter of previous year
2007 Q1 3.0 3.0 1.5 1.5 0.9 −2.0 −2.0Q2 2.6 2.6 1.7 1.7 1.8 −0.9 −0.9Q3 1.9 1.9 1.2 1.1 1.7 −0.4 −0.4Q4 0.8 0.8 1.2 1.1 2.1 15.1 15.1
2008 Q1 0.4 0.4 1.6 1.6 1.5 19.7 19.7Q2 0.9 0.9 1.8 1.9 1.3 20.4 20.4Q3 5.6 5.6 2.3 2.4 1.5 21.1 21.1Q4 5.2 5.2 1.4 1.4 1.4 −2.9 −2.9
2009 Q1 8.9 8.9 1.4 1.4 1.7 −16.0 −16.0Q2 9.9 9.9 1.7 1.8 0.9 −15.7 −15.7Q3 6.9 6.9 2.2 2.6 −0.1 −11.2 −11.2Q4 5.7 5.7 1.8 1.9 0.9 8.6 8.6
2010 Q1 2.7 2.7 1.9 1.9 1.4 24.8 24.8

185
NDG.DN Household final consumption expenditureNon-durable goodsImplied deflators - not seasonally adjustedcontinued 2006 = 100
Recreation and culture Miscellaneous
Stationer y & Other productsGardens, plants Pets & related Newspapers & Miscellaneous drawing for personal
Total & flowers products per iodicals pr inted matter materials Total care
COICOP 09 09.3.3 09.3.4 09.5.2 09.5.3 09.5.4 12 12.1.3
LLOD AWOE AWOF AWOL CJ72 AWON LLOE AWOS2005 97.6 99.9 97.1 93.9 99.7 100.0 103.4 103.42006 100.0 100.0 100.0 100.0 100.0 100.0 100.0 100.02007 101.5 101.2 101.9 103.6 99.7 99.4 102.4 102.42008 105.5 103.7 108.4 108.6 102.7 102.2 103.2 103.22009 110.8 106.0 116.6 113.5 109.3 108.6 111.2 111.2
Percentage chang e , year on previous year
2005 0.5 −0.4 1.9 1.4 0.4 −1.3 −1.0 −1.02006 2.5 0.1 3.0 6.5 0.3 − −3.3 −3.32007 1.5 1.2 1.9 3.6 −0.3 −0.6 2.4 2.42008 3.9 2.5 6.4 4.8 3.0 2.8 0.8 0.82009 5.0 2.2 7.6 4.5 6.4 6.3 7.8 7.8
Not seasonally adjusted
2007 Q1 101.3 102.0 100.5 102.4 100.0 99.7 99.2 99.2Q2 101.3 100.9 101.7 102.9 100.2 99.5 102.1 102.1Q3 101.2 100.4 101.2 103.7 99.3 99.2 102.3 102.3Q4 102.2 101.5 104.2 105.5 99.3 99.2 104.9 104.9
2008 Q1 104.3 103.7 105.4 107.1 101.2 101.0 102.7 102.7Q2 104.9 103.7 106.6 108.6 101.8 101.5 103.2 103.2Q3 106.0 103.2 110.2 108.9 103.0 102.7 103.8 103.8Q4 106.9 104.1 111.5 110.0 104.1 103.5 103.2 103.2
2009 Q1 109.0 104.8 114.6 112.8 105.8 105.6 106.7 106.7Q2 110.1 105.2 116.7 113.6 108.8 108.5 109.7 109.7Q3 111.5 106.6 116.9 114.2 108.8 108.8 112.0 112.0Q4 112.9 108.9 118.3 113.6 112.0 111.3 115.3 115.3
2010 Q1 115.3 112.2 119.7 115.7 114.6 114.2 116.4 116.4
Percentage chang e , quar ter on corresponding quarter of previous year
2007 Q1 2.0 0.9 2.0 4.7 1.0 −0.6 −2.1 −2.1Q2 1.6 1.2 1.4 3.4 −0.3 −0.7 4.5 4.5Q3 0.8 0.7 0.6 3.0 −0.7 −0.5 −0.1 −0.1Q4 1.6 1.8 3.5 3.4 −0.9 −0.7 5.7 5.7
2008 Q1 3.0 1.7 4.9 4.6 1.2 1.3 3.5 3.5Q2 3.6 2.8 4.8 5.5 1.6 2.0 1.1 1.1Q3 4.7 2.8 8.9 5.0 3.7 3.5 1.5 1.5Q4 4.6 2.6 7.0 4.3 4.8 4.3 −1.6 −1.6
2009 Q1 4.5 1.1 8.7 5.3 4.5 4.6 3.9 3.9Q2 5.0 1.4 9.5 4.6 6.9 6.9 6.3 6.3Q3 5.2 3.3 6.1 4.9 5.6 5.9 7.9 7.9Q4 5.6 4.6 6.1 3.3 7.6 7.5 11.7 11.7
2010 Q1 5.8 7.1 4.5 2.6 8.3 8.1 9.1 9.1
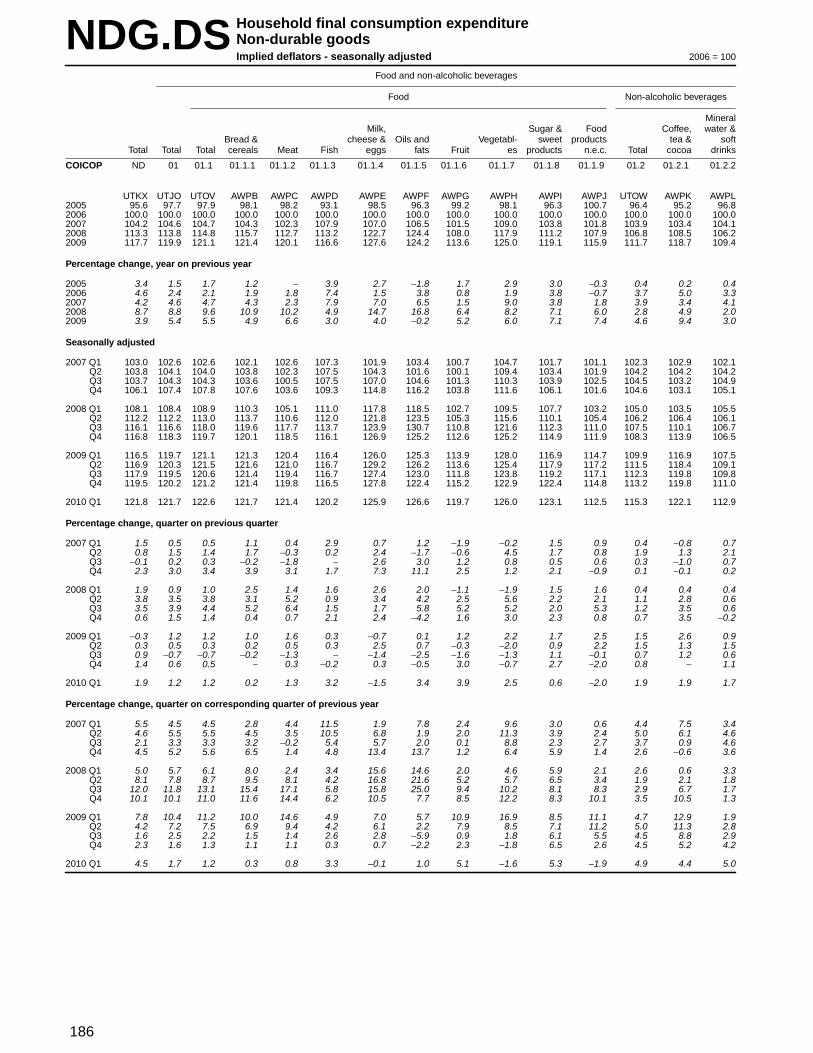
186
NDG.DS Household final consumption expenditureNon-durable goodsImplied deflators - seasonally adjusted 2006 = 100
Food and non-alcoholic beverages
Food Non-alcoholic beverages
MineralMilk, Sugar & Food Coffee, water &
Bread & cheese & Oils and Vegetabl- sweet products tea & softTotal Total Total cereals Meat Fish eggs fats Fruit es products n.e.c. Total cocoa dr inks
COICOP ND 01 01.1 01.1.1 01.1.2 01.1.3 01.1.4 01.1.5 01.1.6 01.1.7 01.1.8 01.1.9 01.2 01.2.1 01.2.2
UTKX UTJO UTOV AWPB AWPC AWPD AWPE AWPF AWPG AWPH AWPI AWPJ UTOW AWPK AWPL2005 95.6 97.7 97.9 98.1 98.2 93.1 98.5 96.3 99.2 98.1 96.3 100.7 96.4 95.2 96.82006 100.0 100.0 100.0 100.0 100.0 100.0 100.0 100.0 100.0 100.0 100.0 100.0 100.0 100.0 100.02007 104.2 104.6 104.7 104.3 102.3 107.9 107.0 106.5 101.5 109.0 103.8 101.8 103.9 103.4 104.12008 113.3 113.8 114.8 115.7 112.7 113.2 122.7 124.4 108.0 117.9 111.2 107.9 106.8 108.5 106.22009 117.7 119.9 121.1 121.4 120.1 116.6 127.6 124.2 113.6 125.0 119.1 115.9 111.7 118.7 109.4
Percentage chang e , year on previous year
2005 3.4 1.5 1.7 1.2 − 3.9 2.7 −1.8 1.7 2.9 3.0 −0.3 0.4 0.2 0.42006 4.6 2.4 2.1 1.9 1.8 7.4 1.5 3.8 0.8 1.9 3.8 −0.7 3.7 5.0 3.32007 4.2 4.6 4.7 4.3 2.3 7.9 7.0 6.5 1.5 9.0 3.8 1.8 3.9 3.4 4.12008 8.7 8.8 9.6 10.9 10.2 4.9 14.7 16.8 6.4 8.2 7.1 6.0 2.8 4.9 2.02009 3.9 5.4 5.5 4.9 6.6 3.0 4.0 −0.2 5.2 6.0 7.1 7.4 4.6 9.4 3.0
Seasonally adjusted
2007 Q1 103.0 102.6 102.6 102.1 102.6 107.3 101.9 103.4 100.7 104.7 101.7 101.1 102.3 102.9 102.1Q2 103.8 104.1 104.0 103.8 102.3 107.5 104.3 101.6 100.1 109.4 103.4 101.9 104.2 104.2 104.2Q3 103.7 104.3 104.3 103.6 100.5 107.5 107.0 104.6 101.3 110.3 103.9 102.5 104.5 103.2 104.9Q4 106.1 107.4 107.8 107.6 103.6 109.3 114.8 116.2 103.8 111.6 106.1 101.6 104.6 103.1 105.1
2008 Q1 108.1 108.4 108.9 110.3 105.1 111.0 117.8 118.5 102.7 109.5 107.7 103.2 105.0 103.5 105.5Q2 112.2 112.2 113.0 113.7 110.6 112.0 121.8 123.5 105.3 115.6 110.1 105.4 106.2 106.4 106.1Q3 116.1 116.6 118.0 119.6 117.7 113.7 123.9 130.7 110.8 121.6 112.3 111.0 107.5 110.1 106.7Q4 116.8 118.3 119.7 120.1 118.5 116.1 126.9 125.2 112.6 125.2 114.9 111.9 108.3 113.9 106.5
2009 Q1 116.5 119.7 121.1 121.3 120.4 116.4 126.0 125.3 113.9 128.0 116.9 114.7 109.9 116.9 107.5Q2 116.9 120.3 121.5 121.6 121.0 116.7 129.2 126.2 113.6 125.4 117.9 117.2 111.5 118.4 109.1Q3 117.9 119.5 120.6 121.4 119.4 116.7 127.4 123.0 111.8 123.8 119.2 117.1 112.3 119.8 109.8Q4 119.5 120.2 121.2 121.4 119.8 116.5 127.8 122.4 115.2 122.9 122.4 114.8 113.2 119.8 111.0
2010 Q1 121.8 121.7 122.6 121.7 121.4 120.2 125.9 126.6 119.7 126.0 123.1 112.5 115.3 122.1 112.9
Percentage chang e , quar ter on previous quarter
2007 Q1 1.5 0.5 0.5 1.1 0.4 2.9 0.7 1.2 −1.9 −0.2 1.5 0.9 0.4 −0.8 0.7Q2 0.8 1.5 1.4 1.7 −0.3 0.2 2.4 −1.7 −0.6 4.5 1.7 0.8 1.9 1.3 2.1Q3 −0.1 0.2 0.3 −0.2 −1.8 − 2.6 3.0 1.2 0.8 0.5 0.6 0.3 −1.0 0.7Q4 2.3 3.0 3.4 3.9 3.1 1.7 7.3 11.1 2.5 1.2 2.1 −0.9 0.1 −0.1 0.2
2008 Q1 1.9 0.9 1.0 2.5 1.4 1.6 2.6 2.0 −1.1 −1.9 1.5 1.6 0.4 0.4 0.4Q2 3.8 3.5 3.8 3.1 5.2 0.9 3.4 4.2 2.5 5.6 2.2 2.1 1.1 2.8 0.6Q3 3.5 3.9 4.4 5.2 6.4 1.5 1.7 5.8 5.2 5.2 2.0 5.3 1.2 3.5 0.6Q4 0.6 1.5 1.4 0.4 0.7 2.1 2.4 −4.2 1.6 3.0 2.3 0.8 0.7 3.5 −0.2
2009 Q1 −0.3 1.2 1.2 1.0 1.6 0.3 −0.7 0.1 1.2 2.2 1.7 2.5 1.5 2.6 0.9Q2 0.3 0.5 0.3 0.2 0.5 0.3 2.5 0.7 −0.3 −2.0 0.9 2.2 1.5 1.3 1.5Q3 0.9 −0.7 −0.7 −0.2 −1.3 − −1.4 −2.5 −1.6 −1.3 1.1 −0.1 0.7 1.2 0.6Q4 1.4 0.6 0.5 − 0.3 −0.2 0.3 −0.5 3.0 −0.7 2.7 −2.0 0.8 − 1.1
2010 Q1 1.9 1.2 1.2 0.2 1.3 3.2 −1.5 3.4 3.9 2.5 0.6 −2.0 1.9 1.9 1.7
Percentage chang e , quar ter on corresponding quarter of previous year
2007 Q1 5.5 4.5 4.5 2.8 4.4 11.5 1.9 7.8 2.4 9.6 3.0 0.6 4.4 7.5 3.4Q2 4.6 5.5 5.5 4.5 3.5 10.5 6.8 1.9 2.0 11.3 3.9 2.4 5.0 6.1 4.6Q3 2.1 3.3 3.3 3.2 −0.2 5.4 5.7 2.0 0.1 8.8 2.3 2.7 3.7 0.9 4.6Q4 4.5 5.2 5.6 6.5 1.4 4.8 13.4 13.7 1.2 6.4 5.9 1.4 2.6 −0.6 3.6
2008 Q1 5.0 5.7 6.1 8.0 2.4 3.4 15.6 14.6 2.0 4.6 5.9 2.1 2.6 0.6 3.3Q2 8.1 7.8 8.7 9.5 8.1 4.2 16.8 21.6 5.2 5.7 6.5 3.4 1.9 2.1 1.8Q3 12.0 11.8 13.1 15.4 17.1 5.8 15.8 25.0 9.4 10.2 8.1 8.3 2.9 6.7 1.7Q4 10.1 10.1 11.0 11.6 14.4 6.2 10.5 7.7 8.5 12.2 8.3 10.1 3.5 10.5 1.3
2009 Q1 7.8 10.4 11.2 10.0 14.6 4.9 7.0 5.7 10.9 16.9 8.5 11.1 4.7 12.9 1.9Q2 4.2 7.2 7.5 6.9 9.4 4.2 6.1 2.2 7.9 8.5 7.1 11.2 5.0 11.3 2.8Q3 1.6 2.5 2.2 1.5 1.4 2.6 2.8 −5.9 0.9 1.8 6.1 5.5 4.5 8.8 2.9Q4 2.3 1.6 1.3 1.1 1.1 0.3 0.7 −2.2 2.3 −1.8 6.5 2.6 4.5 5.2 4.2
2010 Q1 4.5 1.7 1.2 0.3 0.8 3.3 −0.1 1.0 5.1 −1.6 5.3 −1.9 4.9 4.4 5.0

187
NDG.DS Household final consumption expenditureNon-durable goodsImplied deflators - seasonally adjustedcontinued 2006 = 100
Alcoholic beverages and tobacco Housing, water, electr icity, gas and other fuels
Alcoholic beverages Materials Electricity, gas & other fuelsfor the
maintena-nce &
Wine, repair ofcider & the Water Electric- Liquid Solid Heat
Total Total Spirits perry Beer Tobacco Total dwelling supply Total ity Gas fuels fuels energy
COICOP 02 02.1 02.1.1 02.1.2 02.1.3 02.2 04 04.3.1 04.4.1 04.5 04.5.1 04.5.2 04.5.3 04.5.4 04.5.5
UTJP UTOX AWPM AWPN AWPO UTOY LLPG AWPZ AWQB UTPF AWQF AWQG AWQH AWQI2005 98.6 98.7 99.7 97.2 100.6 95.9 85.0 99.1 93.6 80.4 82.8 77.7 84.8 93.22006 100.0 100.0 100.0 100.0 100.0 100.0 100.0 100.0 100.0 100.0 100.0 100.0 100.0 100.02007 102.4 100.2 99.7 101.3 98.5 104.4 108.3 104.2 106.3 109.6 108.6 110.6 106.5 107.02008 105.2 103.0 105.6 103.7 98.6 107.5 125.1 110.7 113.2 130.2 125.4 133.2 145.8 126.82009 111.3 110.3 109.1 108.7 115.0 112.3 134.3 119.1 119.0 140.2 131.6 150.9 110.2 141.9
Percentage chang e , year on previous year
2005 1.2 −1.6 1.3 −0.9 −5.7 3.8 9.8 0.7 9.9 13.4 10.7 14.8 32.9 8.12006 1.4 1.3 0.3 2.9 −0.6 4.3 17.6 0.9 6.8 24.4 20.8 28.7 17.9 7.32007 2.4 0.2 −0.3 1.3 −1.5 4.4 8.3 4.2 6.3 9.6 8.6 10.6 6.5 7.02008 2.7 2.8 5.9 2.4 0.1 3.0 15.5 6.2 6.5 18.8 15.5 20.4 36.9 18.52009 5.8 7.1 3.3 4.8 16.6 4.5 7.4 7.6 5.1 7.7 4.9 13.3 −24.4 11.9
Seasonally adjusted
2007 Q1 102.7 102.0 100.2 102.8 102.5 103.3 111.3 102.6 103.6 114.8 111.1 119.7 98.8 104.6Q2 102.0 99.5 99.5 100.2 98.2 104.3 108.6 103.6 105.6 110.4 110.2 111.3 101.3 107.5Q3 102.5 100.1 100.1 101.4 97.4 104.7 107.7 105.0 107.1 108.4 107.6 109.6 101.6 106.0Q4 102.3 99.2 99.1 101.0 95.9 105.3 105.8 105.6 108.8 105.5 105.7 104.0 123.2 111.1
2008 Q1 100.2 94.8 101.5 93.4 89.9 105.6 112.8 108.2 110.3 114.3 112.9 113.8 138.5 111.1Q2 105.5 103.9 105.6 105.1 99.5 107.1 118.6 109.1 112.4 121.7 121.2 119.1 161.7 117.8Q3 106.7 105.4 106.8 106.9 100.7 107.9 130.1 111.4 114.3 136.5 129.2 140.7 159.6 124.0Q4 108.6 108.1 108.8 109.2 105.1 109.2 138.5 114.1 115.8 147.5 138.7 156.8 125.7 144.4
2009 Q1 110.7 111.2 108.6 111.8 113.0 110.2 137.3 115.6 117.3 145.3 137.5 155.3 106.3 143.1Q2 110.5 109.7 108.7 107.2 115.7 111.4 132.9 118.6 117.8 138.5 131.0 149.1 101.6 143.1Q3 111.7 110.3 109.4 108.9 113.8 113.0 134.2 120.3 119.6 139.7 130.0 151.3 109.4 143.1Q4 112.4 110.1 109.6 106.8 117.7 114.4 132.4 122.1 121.2 136.8 127.7 147.2 123.1 137.5
2010 Q1 116.5 115.1 113.0 113.5 120.9 117.7 133.8 124.9 122.7 137.3 126.8 146.4 138.9 141.8
Percentage chang e , quar ter on previous quarter
2007 Q1 1.9 2.6 0.4 3.2 3.7 1.3 4.1 1.6 1.4 4.8 1.8 8.1 0.5 2.3Q2 −0.7 −2.5 −0.7 −2.5 −4.2 1.0 −2.4 1.0 1.9 −3.8 −0.8 −7.0 2.5 2.8Q3 0.5 0.6 0.6 1.2 −0.8 0.4 −0.8 1.4 1.4 −1.8 −2.4 −1.5 0.3 −1.4Q4 −0.2 −0.9 −1.0 −0.4 −1.5 0.6 −1.8 0.6 1.6 −2.7 −1.8 −5.1 21.3 4.8
2008 Q1 −2.1 −4.4 2.4 −7.5 −6.3 0.3 6.6 2.5 1.4 8.3 6.8 9.4 12.4 −Q2 5.3 9.6 4.0 12.5 10.7 1.4 5.1 0.8 1.9 6.5 7.4 4.7 16.8 6.0Q3 1.1 1.4 1.1 1.7 1.2 0.7 9.7 2.1 1.7 12.2 6.6 18.1 −1.3 5.3Q4 1.8 2.6 1.9 2.2 4.4 1.2 6.5 2.4 1.3 8.1 7.4 11.4 −21.2 16.5
2009 Q1 1.9 2.9 −0.2 2.4 7.5 0.9 −0.9 1.3 1.3 −1.5 −0.9 −1.0 −15.4 −0.9Q2 −0.2 −1.3 0.1 −4.1 2.4 1.1 −3.2 2.6 0.4 −4.7 −4.7 −4.0 −4.4 −Q3 1.1 0.5 0.6 1.6 −1.6 1.4 1.0 1.4 1.5 0.9 −0.8 1.5 7.7 −Q4 0.6 −0.2 0.2 −1.9 3.4 1.2 −1.3 1.5 1.3 −2.1 −1.8 −2.7 12.5 −3.9
2010 Q1 3.6 4.5 3.1 6.3 2.7 2.9 1.1 2.3 1.2 0.4 −0.7 −0.5 12.8 3.1
Percentage chang e , quar ter on corresponding quarter of previous year
2007 Q1 3.5 1.2 −0.1 2.9 −0.4 5.6 22.4 3.3 5.6 30.8 25.0 39.0 0.7 6.3Q2 2.2 −0.7 −0.4 −0.9 −0.7 4.9 11.3 4.1 6.6 13.9 11.8 16.9 2.3 5.7Q3 2.3 0.5 0.1 2.1 −2.1 3.9 2.9 4.8 6.6 2.0 3.0 1.8 −2.9 7.9Q4 1.5 −0.2 −0.7 1.4 −2.9 3.2 −1.0 4.6 6.5 −3.7 −3.1 −6.1 25.3 8.7
2008 Q1 −2.4 −7.1 1.3 −9.1 −12.3 2.2 1.3 5.5 6.5 −0.4 1.6 −4.9 40.2 6.2Q2 3.4 4.4 6.1 4.9 1.3 2.7 9.2 5.3 6.4 10.2 10.0 7.0 59.6 9.6Q3 4.1 5.3 6.7 5.4 3.4 3.1 20.8 6.1 6.7 25.9 20.1 28.4 57.1 17.0Q4 6.2 9.0 9.8 8.1 9.6 3.7 30.9 8.0 6.4 39.8 31.2 50.8 2.0 30.0
2009 Q1 10.5 17.3 7.0 19.7 25.7 4.4 21.7 6.8 6.3 27.1 21.8 36.5 −23.2 28.8Q2 4.7 5.6 2.9 2.0 16.3 4.0 12.1 8.7 4.8 13.8 8.1 25.2 −37.2 21.5Q3 4.7 4.6 2.4 1.9 13.0 4.7 3.2 8.0 4.6 2.3 0.6 7.5 −31.5 15.4Q4 3.5 1.9 0.7 −2.2 12.0 4.8 −4.4 7.0 4.7 −7.3 −7.9 −6.1 −2.1 −4.8
2010 Q1 5.2 3.5 4.1 1.5 7.0 6.8 −2.5 8.0 4.6 −5.5 −7.8 −5.7 30.7 −0.9

188
NDG.DS Household final consumption expenditureNon-durable goodsImplied deflators - seasonally adjustedcontinued 2006 = 100
Fur nishing & household goods Health Transpor t
Non-durable Pharmaceutical Other medical Vehicle fuels andTotal household goods Total products products Total lubricants
COICOP 05 05.6.1 06 06.1.1 06.1.2 07 07.2.2
LLPH AWQS LLPI AWQU AWQV LLPJ AWRE2005 96.7 96.7 100.4 100.4 100.8 95.0 95.02006 100.0 100.0 100.0 100.0 100.0 100.0 100.02007 102.1 102.1 101.4 101.4 101.6 102.8 102.82008 105.1 105.1 103.1 103.1 103.1 117.5 117.52009 113.3 113.3 105.1 105.2 103.9 106.8 106.8
Percentage chang e , year on previous year
2005 − − −0.9 −1.1 0.4 8.4 8.42006 3.4 3.4 −0.4 −0.4 −0.8 5.3 5.32007 2.1 2.1 1.4 1.4 1.6 2.8 2.82008 2.9 2.9 1.7 1.7 1.5 14.3 14.32009 7.8 7.8 1.9 2.0 0.8 −9.1 −9.1
Seasonally adjusted
2007 Q1 101.9 101.9 101.0 101.1 100.9 97.9 97.9Q2 102.6 102.6 101.3 101.2 101.7 102.1 102.1Q3 101.3 101.3 101.1 101.1 101.6 100.8 100.8Q4 102.5 102.5 102.1 102.1 102.3 110.3 110.3
2008 Q1 102.1 102.1 102.6 102.7 102.3 117.2 117.2Q2 103.6 103.6 102.9 102.9 103.2 123.2 123.2Q3 107.0 107.0 103.5 103.4 103.9 121.7 121.7Q4 107.9 107.9 103.6 103.6 102.8 107.5 107.5
2009 Q1 111.0 111.0 104.1 104.1 103.9 98.5 98.5Q2 113.8 113.8 104.7 104.9 103.4 103.9 103.9Q3 114.0 114.0 105.9 106.1 103.8 107.8 107.8Q4 114.5 114.5 105.5 105.6 104.5 116.9 116.9
2010 Q1 113.9 113.9 106.0 106.1 104.6 122.9 122.9
Percentage chang e , quar ter on previous quarter
2007 Q1 0.5 0.5 0.1 0.1 0.9 2.5 2.5Q2 0.7 0.7 0.3 0.1 0.8 4.3 4.3Q3 −1.3 −1.3 −0.2 −0.1 −0.1 −1.3 −1.3Q4 1.2 1.2 1.0 1.0 0.7 9.4 9.4
2008 Q1 −0.4 −0.4 0.5 0.6 − 6.3 6.3Q2 1.5 1.5 0.3 0.2 0.9 5.1 5.1Q3 3.3 3.3 0.6 0.5 0.7 −1.2 −1.2Q4 0.8 0.8 0.1 0.2 −1.1 −11.7 −11.7
2009 Q1 2.9 2.9 0.5 0.5 1.1 −8.4 −8.4Q2 2.5 2.5 0.6 0.8 −0.5 5.5 5.5Q3 0.2 0.2 1.1 1.1 0.4 3.8 3.8Q4 0.4 0.4 −0.4 −0.5 0.7 8.4 8.4
2010 Q1 −0.5 −0.5 0.5 0.5 0.1 5.1 5.1
Percentage chang e , quar ter on corresponding quarter of previous year
2007 Q1 2.9 2.9 1.5 1.6 0.9 −2.4 −2.4Q2 2.6 2.6 1.8 1.8 1.7 −0.6 −0.6Q3 1.7 1.7 1.1 1.1 1.6 −0.8 −0.8Q4 1.1 1.1 1.2 1.1 2.3 15.5 15.5
2008 Q1 0.2 0.2 1.6 1.6 1.4 19.7 19.7Q2 1.0 1.0 1.6 1.7 1.5 20.7 20.7Q3 5.6 5.6 2.4 2.3 2.3 20.7 20.7Q4 5.3 5.3 1.5 1.5 0.5 −2.5 −2.5
2009 Q1 8.7 8.7 1.5 1.4 1.6 −16.0 −16.0Q2 9.8 9.8 1.7 1.9 0.2 −15.7 −15.7Q3 6.5 6.5 2.3 2.6 −0.1 −11.4 −11.4Q4 6.1 6.1 1.8 1.9 1.7 8.7 8.7
2010 Q1 2.6 2.6 1.8 1.9 0.7 24.8 24.8
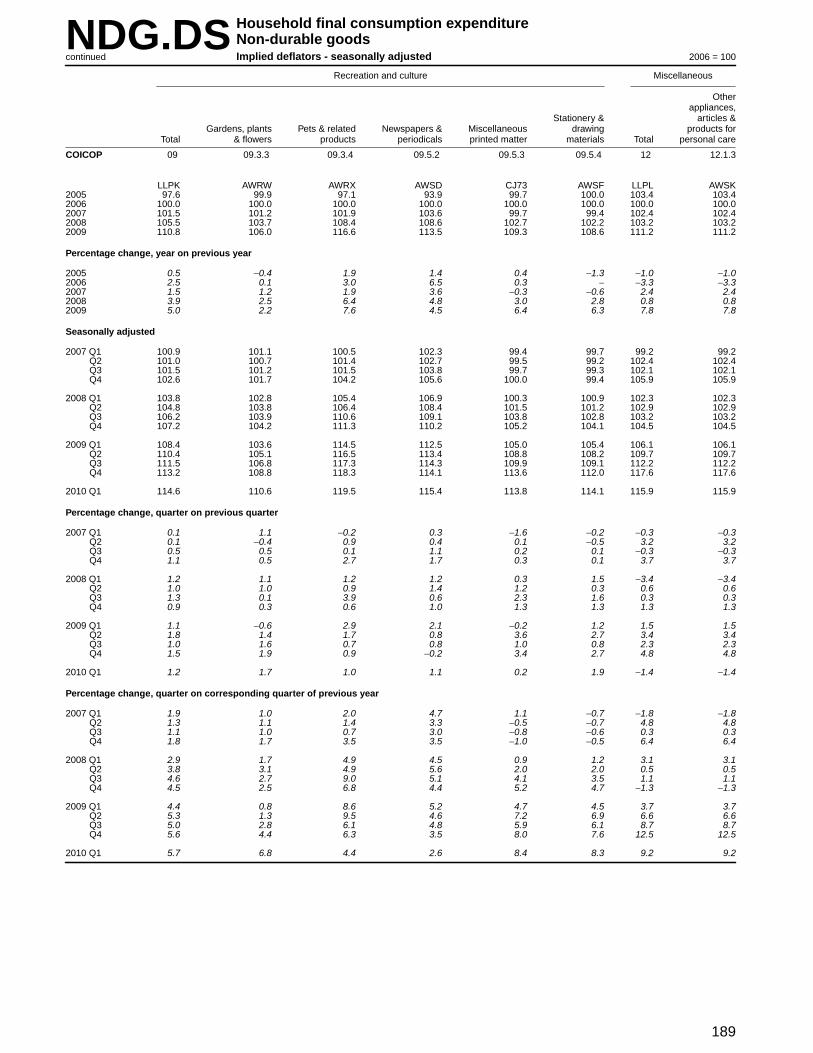
189
NDG.DS Household final consumption expenditureNon-durable goodsImplied deflators - seasonally adjustedcontinued 2006 = 100
Recreation and culture Miscellaneous
Otherappliances,
Stationer y & articles &Gardens, plants Pets & related Newspapers & Miscellaneous drawing products for
Total & flowers products per iodicals pr inted matter materials Total personal care
COICOP 09 09.3.3 09.3.4 09.5.2 09.5.3 09.5.4 12 12.1.3
LLPK AWRW AWRX AWSD CJ73 AWSF LLPL AWSK2005 97.6 99.9 97.1 93.9 99.7 100.0 103.4 103.42006 100.0 100.0 100.0 100.0 100.0 100.0 100.0 100.02007 101.5 101.2 101.9 103.6 99.7 99.4 102.4 102.42008 105.5 103.7 108.4 108.6 102.7 102.2 103.2 103.22009 110.8 106.0 116.6 113.5 109.3 108.6 111.2 111.2
Percentage chang e , year on previous year
2005 0.5 −0.4 1.9 1.4 0.4 −1.3 −1.0 −1.02006 2.5 0.1 3.0 6.5 0.3 − −3.3 −3.32007 1.5 1.2 1.9 3.6 −0.3 −0.6 2.4 2.42008 3.9 2.5 6.4 4.8 3.0 2.8 0.8 0.82009 5.0 2.2 7.6 4.5 6.4 6.3 7.8 7.8
Seasonally adjusted
2007 Q1 100.9 101.1 100.5 102.3 99.4 99.7 99.2 99.2Q2 101.0 100.7 101.4 102.7 99.5 99.2 102.4 102.4Q3 101.5 101.2 101.5 103.8 99.7 99.3 102.1 102.1Q4 102.6 101.7 104.2 105.6 100.0 99.4 105.9 105.9
2008 Q1 103.8 102.8 105.4 106.9 100.3 100.9 102.3 102.3Q2 104.8 103.8 106.4 108.4 101.5 101.2 102.9 102.9Q3 106.2 103.9 110.6 109.1 103.8 102.8 103.2 103.2Q4 107.2 104.2 111.3 110.2 105.2 104.1 104.5 104.5
2009 Q1 108.4 103.6 114.5 112.5 105.0 105.4 106.1 106.1Q2 110.4 105.1 116.5 113.4 108.8 108.2 109.7 109.7Q3 111.5 106.8 117.3 114.3 109.9 109.1 112.2 112.2Q4 113.2 108.8 118.3 114.1 113.6 112.0 117.6 117.6
2010 Q1 114.6 110.6 119.5 115.4 113.8 114.1 115.9 115.9
Percentage chang e , quar ter on previous quarter
2007 Q1 0.1 1.1 −0.2 0.3 −1.6 −0.2 −0.3 −0.3Q2 0.1 −0.4 0.9 0.4 0.1 −0.5 3.2 3.2Q3 0.5 0.5 0.1 1.1 0.2 0.1 −0.3 −0.3Q4 1.1 0.5 2.7 1.7 0.3 0.1 3.7 3.7
2008 Q1 1.2 1.1 1.2 1.2 0.3 1.5 −3.4 −3.4Q2 1.0 1.0 0.9 1.4 1.2 0.3 0.6 0.6Q3 1.3 0.1 3.9 0.6 2.3 1.6 0.3 0.3Q4 0.9 0.3 0.6 1.0 1.3 1.3 1.3 1.3
2009 Q1 1.1 −0.6 2.9 2.1 −0.2 1.2 1.5 1.5Q2 1.8 1.4 1.7 0.8 3.6 2.7 3.4 3.4Q3 1.0 1.6 0.7 0.8 1.0 0.8 2.3 2.3Q4 1.5 1.9 0.9 −0.2 3.4 2.7 4.8 4.8
2010 Q1 1.2 1.7 1.0 1.1 0.2 1.9 −1.4 −1.4
Percentage chang e , quar ter on corresponding quarter of previous year
2007 Q1 1.9 1.0 2.0 4.7 1.1 −0.7 −1.8 −1.8Q2 1.3 1.1 1.4 3.3 −0.5 −0.7 4.8 4.8Q3 1.1 1.0 0.7 3.0 −0.8 −0.6 0.3 0.3Q4 1.8 1.7 3.5 3.5 −1.0 −0.5 6.4 6.4
2008 Q1 2.9 1.7 4.9 4.5 0.9 1.2 3.1 3.1Q2 3.8 3.1 4.9 5.6 2.0 2.0 0.5 0.5Q3 4.6 2.7 9.0 5.1 4.1 3.5 1.1 1.1Q4 4.5 2.5 6.8 4.4 5.2 4.7 −1.3 −1.3
2009 Q1 4.4 0.8 8.6 5.2 4.7 4.5 3.7 3.7Q2 5.3 1.3 9.5 4.6 7.2 6.9 6.6 6.6Q3 5.0 2.8 6.1 4.8 5.9 6.1 8.7 8.7Q4 5.6 4.4 6.3 3.5 8.0 7.6 12.5 12.5
2010 Q1 5.7 6.8 4.4 2.6 8.4 8.3 9.2 9.2
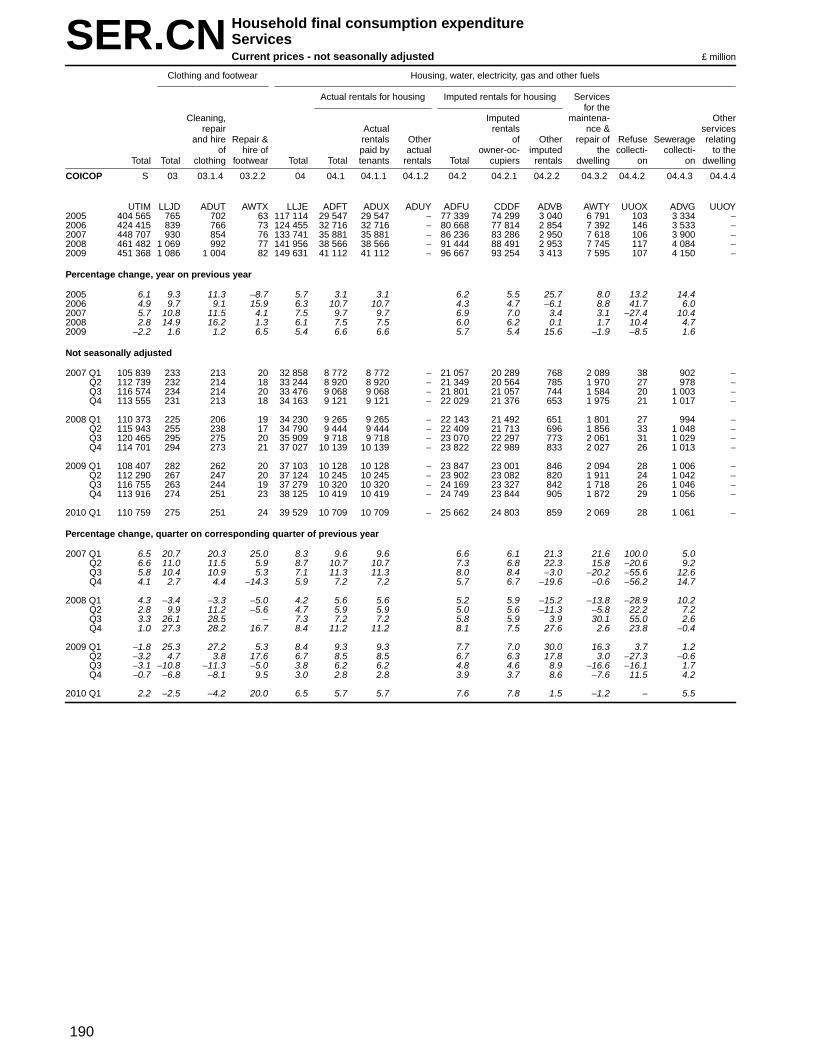
190
SER.CN Household final consumption expenditureSer vicesCurrent prices - not seasonally adjusted £ million
Clothing and footwear Housing, water, electr icity, gas and other fuels
Actual rentals for housing Imputed rentals for housing Ser vicesfor the
Cleaning, Imputed maintena- Otherrepair Actual rentals nce & ser vices
and hire Repair & rentals Other of Other repair of Refuse Sewerage relatingof hire of paid by actual owner-oc- imputed the collecti- collecti- to the
Total Total clothing footwear Total Total tenants rentals Total cupiers rentals dwelling on on dwelling
COICOP S 03 03.1.4 03.2.2 04 04.1 04.1.1 04.1.2 04.2 04.2.1 04.2.2 04.3.2 04.4.2 04.4.3 04.4.4
UTIM LLJD ADUT AWTX LLJE ADFT ADUX ADUY ADFU CDDF ADVB AWTY UUOX ADV G UUOY2005 404 565 765 702 63 117 114 29 547 29 547 − 77 339 74 299 3 040 6 791 103 3 334 −2006 424 415 839 766 73 124 455 32 716 32 716 − 80 668 77 814 2 854 7 392 146 3 533 −2007 448 707 930 854 76 133 741 35 881 35 881 − 86 236 83 286 2 950 7 618 106 3 900 −2008 461 482 1 069 992 77 141 956 38 566 38 566 − 91 444 88 491 2 953 7 745 117 4 084 −2009 451 368 1 086 1 004 82 149 631 41 112 41 112 − 96 667 93 254 3 413 7 595 107 4 150 −
Percentage chang e , year on previous year
2005 6.1 9.3 11.3 −8.7 5.7 3.1 3.1 6.2 5.5 25.7 8.0 13.2 14.42006 4.9 9.7 9.1 15.9 6.3 10.7 10.7 4.3 4.7 −6.1 8.8 41.7 6.02007 5.7 10.8 11.5 4.1 7.5 9.7 9.7 6.9 7.0 3.4 3.1 −27.4 10.42008 2.8 14.9 16.2 1.3 6.1 7.5 7.5 6.0 6.2 0.1 1.7 10.4 4.72009 −2.2 1.6 1.2 6.5 5.4 6.6 6.6 5.7 5.4 15.6 −1.9 −8.5 1.6
Not seasonally adjusted
2007 Q1 105 839 233 213 20 32 858 8 772 8 772 − 21 057 20 289 768 2 089 38 902 −Q2 112 739 232 214 18 33 244 8 920 8 920 − 21 349 20 564 785 1 970 27 978 −Q3 116 574 234 214 20 33 476 9 068 9 068 − 21 801 21 057 744 1 584 20 1 003 −Q4 113 555 231 213 18 34 163 9 121 9 121 − 22 029 21 376 653 1 975 21 1 017 −
2008 Q1 110 373 225 206 19 34 230 9 265 9 265 − 22 143 21 492 651 1 801 27 994 −Q2 115 943 255 238 17 34 790 9 444 9 444 − 22 409 21 713 696 1 856 33 1 048 −Q3 120 465 295 275 20 35 909 9 718 9 718 − 23 070 22 297 773 2 061 31 1 029 −Q4 114 701 294 273 21 37 027 10 139 10 139 − 23 822 22 989 833 2 027 26 1 013 −
2009 Q1 108 407 282 262 20 37 103 10 128 10 128 − 23 847 23 001 846 2 094 28 1 006 −Q2 112 290 267 247 20 37 124 10 245 10 245 − 23 902 23 082 820 1 911 24 1 042 −Q3 116 755 263 244 19 37 279 10 320 10 320 − 24 169 23 327 842 1 718 26 1 046 −Q4 113 916 274 251 23 38 125 10 419 10 419 − 24 749 23 844 905 1 872 29 1 056 −
2010 Q1 110 759 275 251 24 39 529 10 709 10 709 − 25 662 24 803 859 2 069 28 1 061 −
Percentage chang e , quar ter on corresponding quarter of previous year
2007 Q1 6.5 20.7 20.3 25.0 8.3 9.6 9.6 6.6 6.1 21.3 21.6 100.0 5.0Q2 6.6 11.0 11.5 5.9 8.7 10.7 10.7 7.3 6.8 22.3 15.8 −20.6 9.2Q3 5.8 10.4 10.9 5.3 7.1 11.3 11.3 8.0 8.4 −3.0 −20.2 −55.6 12.6Q4 4.1 2.7 4.4 −14.3 5.9 7.2 7.2 5.7 6.7 −19.6 −0.6 −56.2 14.7
2008 Q1 4.3 −3.4 −3.3 −5.0 4.2 5.6 5.6 5.2 5.9 −15.2 −13.8 −28.9 10.2Q2 2.8 9.9 11.2 −5.6 4.7 5.9 5.9 5.0 5.6 −11.3 −5.8 22.2 7.2Q3 3.3 26.1 28.5 − 7.3 7.2 7.2 5.8 5.9 3.9 30.1 55.0 2.6Q4 1.0 27.3 28.2 16.7 8.4 11.2 11.2 8.1 7.5 27.6 2.6 23.8 −0.4
2009 Q1 −1.8 25.3 27.2 5.3 8.4 9.3 9.3 7.7 7.0 30.0 16.3 3.7 1.2Q2 −3.2 4.7 3.8 17.6 6.7 8.5 8.5 6.7 6.3 17.8 3.0 −27.3 −0.6Q3 −3.1 −10.8 −11.3 −5.0 3.8 6.2 6.2 4.8 4.6 8.9 −16.6 −16.1 1.7Q4 −0.7 −6.8 −8.1 9.5 3.0 2.8 2.8 3.9 3.7 8.6 −7.6 11.5 4.2
2010 Q1 2.2 −2.5 −4.2 20.0 6.5 5.7 5.7 7.6 7.8 1.5 −1.2 − 5.5
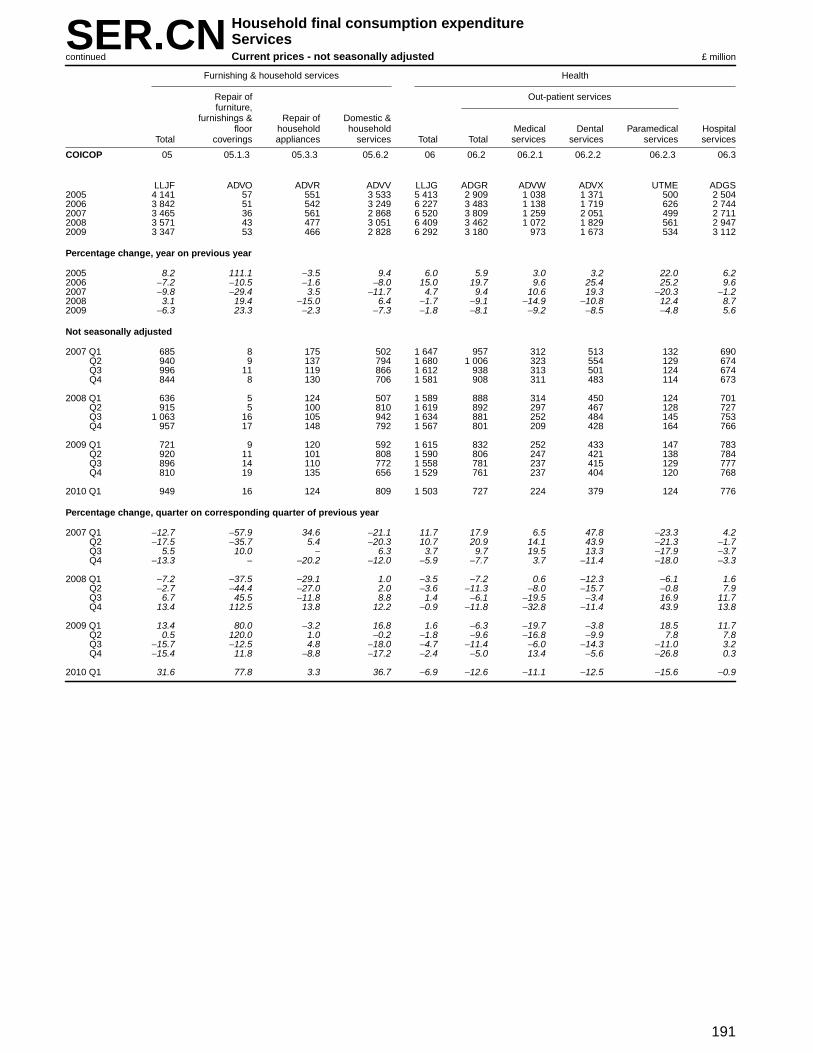
191
SER.CN Household final consumption expenditureSer vicesCurrent prices - not seasonally adjustedcontinued £ million
Fur nishing & household services Health
Repair of Out-patient servicesfur niture,
fur nishings & Repair of Domestic &floor household household Medical Dental Paramedical Hospital
Total coverings appliances ser vices Total Total services services services services
COICOP 05 05.1.3 05.3.3 05.6.2 06 06.2 06.2.1 06.2.2 06.2.3 06.3
LLJF ADVO ADVR ADVV LLJG ADGR ADVW ADVX UTME ADGS2005 4 141 57 551 3 533 5 413 2 909 1 038 1 371 500 2 5042006 3 842 51 542 3 249 6 227 3 483 1 138 1 719 626 2 7442007 3 465 36 561 2 868 6 520 3 809 1 259 2 051 499 2 7112008 3 571 43 477 3 051 6 409 3 462 1 072 1 829 561 2 9472009 3 347 53 466 2 828 6 292 3 180 973 1 673 534 3 112
Percentage chang e , year on previous year
2005 8.2 111.1 −3.5 9.4 6.0 5.9 3.0 3.2 22.0 6.22006 −7.2 −10.5 −1.6 −8.0 15.0 19.7 9.6 25.4 25.2 9.62007 −9.8 −29.4 3.5 −11.7 4.7 9.4 10.6 19.3 −20.3 −1.22008 3.1 19.4 −15.0 6.4 −1.7 −9.1 −14.9 −10.8 12.4 8.72009 −6.3 23.3 −2.3 −7.3 −1.8 −8.1 −9.2 −8.5 −4.8 5.6
Not seasonally adjusted
2007 Q1 685 8 175 502 1 647 957 312 513 132 690Q2 940 9 137 794 1 680 1 006 323 554 129 674Q3 996 11 119 866 1 612 938 313 501 124 674Q4 844 8 130 706 1 581 908 311 483 114 673
2008 Q1 636 5 124 507 1 589 888 314 450 124 701Q2 915 5 100 810 1 619 892 297 467 128 727Q3 1 063 16 105 942 1 634 881 252 484 145 753Q4 957 17 148 792 1 567 801 209 428 164 766
2009 Q1 721 9 120 592 1 615 832 252 433 147 783Q2 920 11 101 808 1 590 806 247 421 138 784Q3 896 14 110 772 1 558 781 237 415 129 777Q4 810 19 135 656 1 529 761 237 404 120 768
2010 Q1 949 16 124 809 1 503 727 224 379 124 776
Percentage chang e , quar ter on corresponding quarter of previous year
2007 Q1 −12.7 −57.9 34.6 −21.1 11.7 17.9 6.5 47.8 −23.3 4.2Q2 −17.5 −35.7 5.4 −20.3 10.7 20.9 14.1 43.9 −21.3 −1.7Q3 5.5 10.0 − 6.3 3.7 9.7 19.5 13.3 −17.9 −3.7Q4 −13.3 − −20.2 −12.0 −5.9 −7.7 3.7 −11.4 −18.0 −3.3
2008 Q1 −7.2 −37.5 −29.1 1.0 −3.5 −7.2 0.6 −12.3 −6.1 1.6Q2 −2.7 −44.4 −27.0 2.0 −3.6 −11.3 −8.0 −15.7 −0.8 7.9Q3 6.7 45.5 −11.8 8.8 1.4 −6.1 −19.5 −3.4 16.9 11.7Q4 13.4 112.5 13.8 12.2 −0.9 −11.8 −32.8 −11.4 43.9 13.8
2009 Q1 13.4 80.0 −3.2 16.8 1.6 −6.3 −19.7 −3.8 18.5 11.7Q2 0.5 120.0 1.0 −0.2 −1.8 −9.6 −16.8 −9.9 7.8 7.8Q3 −15.7 −12.5 4.8 −18.0 −4.7 −11.4 −6.0 −14.3 −11.0 3.2Q4 −15.4 11.8 −8.8 −17.2 −2.4 −5.0 13.4 −5.6 −26.8 0.3
2010 Q1 31.6 77.8 3.3 36.7 −6.9 −12.6 −11.1 −12.5 −15.6 −0.9
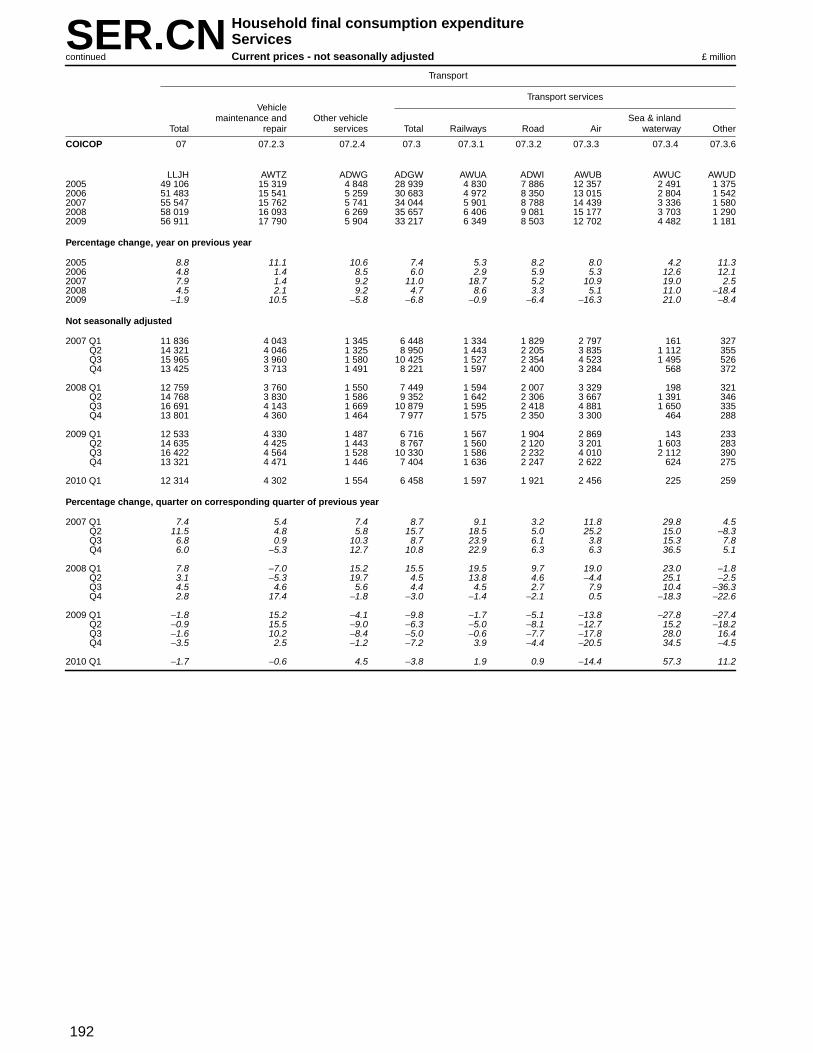
192
SER.CN Household final consumption expenditureSer vicesCurrent prices - not seasonally adjustedcontinued £ million
Tr anspor t
Tr anspor t ser vicesVehicle
maintenance and Other vehicle Sea & inlandTotal repair ser vices Total Railways Road Air waterway Other
COICOP 07 07.2.3 07.2.4 07.3 07.3.1 07.3.2 07.3.3 07.3.4 07.3.6
LLJH AWTZ ADWG ADGW AWUA ADWI AWUB AWUC AWUD2005 49 106 15 319 4 848 28 939 4 830 7 886 12 357 2 491 1 3752006 51 483 15 541 5 259 30 683 4 972 8 350 13 015 2 804 1 5422007 55 547 15 762 5 741 34 044 5 901 8 788 14 439 3 336 1 5802008 58 019 16 093 6 269 35 657 6 406 9 081 15 177 3 703 1 2902009 56 911 17 790 5 904 33 217 6 349 8 503 12 702 4 482 1 181
Percentage chang e , year on previous year
2005 8.8 11.1 10.6 7.4 5.3 8.2 8.0 4.2 11.32006 4.8 1.4 8.5 6.0 2.9 5.9 5.3 12.6 12.12007 7.9 1.4 9.2 11.0 18.7 5.2 10.9 19.0 2.52008 4.5 2.1 9.2 4.7 8.6 3.3 5.1 11.0 −18.42009 −1.9 10.5 −5.8 −6.8 −0.9 −6.4 −16.3 21.0 −8.4
Not seasonally adjusted
2007 Q1 11 836 4 043 1 345 6 448 1 334 1 829 2 797 161 327Q2 14 321 4 046 1 325 8 950 1 443 2 205 3 835 1 112 355Q3 15 965 3 960 1 580 10 425 1 527 2 354 4 523 1 495 526Q4 13 425 3 713 1 491 8 221 1 597 2 400 3 284 568 372
2008 Q1 12 759 3 760 1 550 7 449 1 594 2 007 3 329 198 321Q2 14 768 3 830 1 586 9 352 1 642 2 306 3 667 1 391 346Q3 16 691 4 143 1 669 10 879 1 595 2 418 4 881 1 650 335Q4 13 801 4 360 1 464 7 977 1 575 2 350 3 300 464 288
2009 Q1 12 533 4 330 1 487 6 716 1 567 1 904 2 869 143 233Q2 14 635 4 425 1 443 8 767 1 560 2 120 3 201 1 603 283Q3 16 422 4 564 1 528 10 330 1 586 2 232 4 010 2 112 390Q4 13 321 4 471 1 446 7 404 1 636 2 247 2 622 624 275
2010 Q1 12 314 4 302 1 554 6 458 1 597 1 921 2 456 225 259
Percentage chang e , quar ter on corresponding quarter of previous year
2007 Q1 7.4 5.4 7.4 8.7 9.1 3.2 11.8 29.8 4.5Q2 11.5 4.8 5.8 15.7 18.5 5.0 25.2 15.0 −8.3Q3 6.8 0.9 10.3 8.7 23.9 6.1 3.8 15.3 7.8Q4 6.0 −5.3 12.7 10.8 22.9 6.3 6.3 36.5 5.1
2008 Q1 7.8 −7.0 15.2 15.5 19.5 9.7 19.0 23.0 −1.8Q2 3.1 −5.3 19.7 4.5 13.8 4.6 −4.4 25.1 −2.5Q3 4.5 4.6 5.6 4.4 4.5 2.7 7.9 10.4 −36.3Q4 2.8 17.4 −1.8 −3.0 −1.4 −2.1 0.5 −18.3 −22.6
2009 Q1 −1.8 15.2 −4.1 −9.8 −1.7 −5.1 −13.8 −27.8 −27.4Q2 −0.9 15.5 −9.0 −6.3 −5.0 −8.1 −12.7 15.2 −18.2Q3 −1.6 10.2 −8.4 −5.0 −0.6 −7.7 −17.8 28.0 16.4Q4 −3.5 2.5 −1.2 −7.2 3.9 −4.4 −20.5 34.5 −4.5
2010 Q1 −1.7 −0.6 4.5 −3.8 1.9 0.9 −14.4 57.3 11.2

193
SER.CN Household final consumption expenditureSer vicesCurrent prices - not seasonally adjustedcontinued £ million
Communication Recreation and culture
Repair of Recreational and cultural servicesaudio-visu- Maintenance
al, & repair ofphotograph- other major
ic & durables Veter inary Recreation-Telephone infor mation for and other al &
Postal and telefax processing recreation services sporting Cultural Games of PackageTotal services services Total equipment and culture for pets Total services services chance holidays
COICOP 08 08.1 08.3 09 09.1.5 09.2.3 09.3.5 09.4 09.4.1 09.4.2 9.4.3 9.6
LLJI CDEF ADWP LLJJ ADWU ADWX ADXC ADIA ADXD ADXE CDEM ADID2005 16 989 1 016 15 973 29 779 156 102 2 156 27 365 5 769 12 663 8 933 −2006 17 142 1 020 16 122 30 946 97 45 2 073 28 731 6 405 13 639 8 687 −2007 17 504 1 037 16 467 32 788 93 64 2 534 30 097 6 584 14 114 9 399 −2008 17 357 1 027 16 330 33 339 54 104 2 952 30 229 5 936 14 366 9 927 −2009 17 643 1 087 16 556 33 315 162 93 2 478 30 582 6 010 15 860 8 712 −
Percentage chang e , year on previous year
2005 4.1 5.7 4.0 4.3 13.0 32.5 22.8 3.0 10.6 3.7 −2.32006 0.9 0.4 0.9 3.9 −37.8 −55.9 −3.8 5.0 11.0 7.7 −2.82007 2.1 1.7 2.1 6.0 −4.1 42.2 22.2 4.8 2.8 3.5 8.22008 −0.8 −1.0 −0.8 1.7 −41.9 62.5 16.5 0.4 −9.8 1.8 5.62009 1.6 5.8 1.4 −0.1 200.0 −10.6 −16.1 1.2 1.2 10.4 −12.2
Not seasonally adjusted
2007 Q1 4 313 228 4 085 7 983 26 14 598 7 345 1 878 3 278 2 189 −Q2 4 241 204 4 037 8 505 24 17 609 7 855 1 923 3 709 2 223 −Q3 4 306 180 4 126 8 564 22 17 681 7 844 1 468 3 777 2 599 −Q4 4 644 425 4 219 7 736 21 16 646 7 053 1 315 3 350 2 388 −
2008 Q1 4 348 223 4 125 8 358 14 19 737 7 588 1 595 3 368 2 625 −Q2 4 300 183 4 117 8 535 12 22 704 7 797 1 667 3 617 2 513 −Q3 4 228 176 4 052 8 710 12 30 785 7 883 1 460 3 917 2 506 −Q4 4 481 445 4 036 7 736 16 33 726 6 961 1 214 3 464 2 283 −
2009 Q1 4 297 247 4 050 8 122 20 24 680 7 398 1 568 3 647 2 183 −Q2 4 388 202 4 186 8 722 34 21 616 8 051 1 696 4 120 2 235 −Q3 4 313 215 4 098 8 503 50 20 601 7 832 1 460 4 194 2 178 −Q4 4 645 423 4 222 7 968 58 28 581 7 301 1 286 3 899 2 116 −
2010 Q1 4 481 204 4 277 8 154 46 25 608 7 475 1 561 3 791 2 123 −
Percentage chang e , quar ter on corresponding quarter of previous year
2007 Q1 −0.6 −8.4 −0.1 10.8 4.0 27.3 16.3 10.4 15.4 8.4 9.2Q2 0.2 10.3 −0.2 5.3 9.1 70.0 21.8 4.2 3.9 2.9 6.6Q3 3.8 −4.3 4.2 5.3 −4.3 54.5 31.2 3.5 −4.7 2.8 9.8Q4 4.9 6.8 4.7 2.7 −22.2 23.1 19.6 1.5 −5.3 0.5 7.1
2008 Q1 0.8 −2.2 1.0 4.7 −46.2 35.7 23.2 3.3 −15.1 2.7 19.9Q2 1.4 −10.3 2.0 0.4 −50.0 29.4 15.6 −0.7 −13.3 −2.5 13.0Q3 −1.8 −2.2 −1.8 1.7 −45.5 76.5 15.3 0.5 −0.5 3.7 −3.6Q4 −3.5 4.7 −4.3 − −23.8 106.2 12.4 −1.3 −7.7 3.4 −4.4
2009 Q1 −1.2 10.8 −1.8 −2.8 42.9 26.3 −7.7 −2.5 −1.7 8.3 −16.8Q2 2.0 10.4 1.7 2.2 183.3 −4.5 −12.5 3.3 1.7 13.9 −11.1Q3 2.0 22.2 1.1 −2.4 316.7 −33.3 −23.4 −0.6 − 7.1 −13.1Q4 3.7 −4.9 4.6 3.0 262.5 −15.2 −20.0 4.9 5.9 12.6 −7.3
2010 Q1 4.3 −17.4 5.6 0.4 130.0 4.2 −10.6 1.0 −0.4 3.9 −2.7

194
SER.CN Household final consumption expenditureSer vicesCurrent prices - not seasonally adjustedcontinued £ million
Restaurants and hotels
Cater ing ser vices
Restaurants, cafes AccommodationEducation Total Total etc Canteens services
COICOP 10 11 11.1 11.1.1 11.1.2 11.2
ADIE ADIF ADIG ADXO ADXP ADIH2005 11 050 85 473 74 642 66 595 8 047 10 8312006 11 711 87 812 76 072 68 074 7 998 11 7402007 12 356 90 729 78 121 70 170 7 951 12 6082008 12 591 91 933 78 798 70 785 8 013 13 1352009 13 024 88 563 75 841 68 102 7 739 12 722
Percentage chang e , year on previous year
2005 2.7 3.1 2.7 3.1 −0.4 6.02006 6.0 2.7 1.9 2.2 −0.6 8.42007 5.5 3.3 2.7 3.1 −0.6 7.42008 1.9 1.3 0.9 0.9 0.8 4.22009 3.4 −3.7 −3.8 −3.8 −3.4 −3.1
Not seasonally adjusted
2007 Q1 3 017 19 903 17 728 15 609 2 119 2 175Q2 3 087 23 201 20 016 17 984 2 032 3 185Q3 3 115 24 472 20 032 18 368 1 664 4 440Q4 3 137 23 153 20 345 18 209 2 136 2 808
2008 Q1 3 163 20 407 18 110 16 156 1 954 2 297Q2 3 141 23 464 20 238 18 163 2 075 3 226Q3 3 176 25 043 20 411 18 617 1 794 4 632Q4 3 111 23 019 20 039 17 849 2 190 2 980
2009 Q1 3 210 19 674 17 433 15 517 1 916 2 241Q2 3 238 22 278 19 148 17 241 1 907 3 130Q3 3 272 24 029 19 606 17 862 1 744 4 423Q4 3 304 22 582 19 654 17 482 2 172 2 928
2010 Q1 3 336 19 681 17 548 15 627 1 921 2 133
Percentage chang e , quar ter on corresponding quarter of previous year
2007 Q1 6.8 4.9 4.0 4.5 0.1 12.7Q2 6.7 4.7 3.7 4.0 1.3 11.1Q3 4.4 1.7 0.9 1.4 −4.3 5.9Q4 4.3 2.4 2.4 2.7 −0.1 2.2
2008 Q1 4.8 2.5 2.2 3.5 −7.8 5.6Q2 1.7 1.1 1.1 1.0 2.1 1.3Q3 2.0 2.3 1.9 1.4 7.8 4.3Q4 −0.8 −0.6 −1.5 −2.0 2.5 6.1
2009 Q1 1.5 −3.6 −3.7 −4.0 −1.9 −2.4Q2 3.1 −5.1 −5.4 −5.1 −8.1 −3.0Q3 3.0 −4.0 −3.9 −4.1 −2.8 −4.5Q4 6.2 −1.9 −1.9 −2.1 −0.8 −1.7
2010 Q1 3.9 − 0.7 0.7 0.3 −4.8

195
SER.CN Household final consumption expenditureSer vicesCurrent prices - not seasonally adjustedcontinued £ million
Miscellaneous
Hairdress- Insurance Financial ser vicesing salons
andpersonal Insurance Insurance Insurance Financial
grooming connected connected connected ser vicesestablish- Social Life with the with with Other other than Other
Total ments protection Total insurance dwelling health transpor t insurance Total FISIM1 FISIM services
COICOP 12 12.1.1 12.4 12.5 12.5.1 12.5.2 12.5.3 12.5.4 12.5.5 12.6 12.6.1 12.6.2 12.7
LLJK CDEV ADIL ADIM ADXW ADXX ADXY ADXZ ADYA ADIN C68S ADYC ADIO2005 84 735 4 870 9 131 26 397 18 365 3 681 1 435 2 916 − 36 794 21 019 15 775 7 5432006 89 958 5 065 9 962 26 740 17 950 4 023 1 571 3 196 − 40 765 22 900 17 865 7 4262007 95 127 5 273 10 868 28 535 21 082 3 300 1 354 2 799 − 42 581 24 017 18 564 7 8702008 95 238 5 500 11 391 28 254 19 632 3 997 1 640 2 985 − 41 916 23 011 18 905 8 1772009 81 556 5 370 10 883 25 190 18 156 3 355 1 447 2 232 − 32 174 14 796 17 378 7 939
Percentage chang e , year on previous year
2005 9.5 3.2 3.7 5.1 12.2 −2.2 −0.1 −17.9 15.5 8.8 26.0 9.52006 6.2 4.0 9.1 1.3 −2.3 9.3 9.5 9.6 10.8 8.9 13.2 −1.62007 5.7 4.1 9.1 6.7 17.4 −18.0 −13.8 −12.4 4.5 4.9 3.9 6.02008 0.1 4.3 4.8 −1.0 −6.9 21.1 21.1 6.6 −1.6 −4.2 1.8 3.92009 −14.4 −2.4 −4.5 −10.8 −7.5 −16.1 −11.8 −25.2 −23.2 −35.7 −8.1 −2.9
Not seasonally adjusted
2007 Q1 23 364 1 282 2 752 6 891 5 031 748 342 770 − 10 474 5 905 4 569 1 965Q2 23 288 1 303 2 730 6 559 4 643 918 334 664 − 10 743 5 991 4 752 1 953Q3 23 834 1 337 2 659 6 903 5 167 799 321 616 − 10 982 6 432 4 550 1 953Q4 24 641 1 351 2 727 8 182 6 241 835 357 749 − 10 382 5 689 4 693 1 999
2008 Q1 24 658 1 414 3 239 7 202 5 089 929 370 814 − 10 803 6 193 4 610 2 000Q2 24 156 1 394 2 955 6 831 4 358 1 203 425 845 − 10 960 6 041 4 919 2 016Q3 23 716 1 374 2 644 6 788 4 715 931 412 730 − 10 848 6 059 4 789 2 062Q4 22 708 1 318 2 553 7 433 5 470 934 433 596 − 9 305 4 718 4 587 2 099
2009 Q1 20 850 1 364 2 797 6 641 4 784 853 381 623 − 8 075 3 901 4 174 1 973Q2 19 128 1 380 2 710 5 329 3 592 860 347 530 − 7 741 3 476 4 265 1 968Q3 20 220 1 333 2 622 6 206 4 356 933 362 555 − 8 087 3 744 4 343 1 972Q4 21 358 1 293 2 754 7 014 5 424 709 357 524 − 8 271 3 675 4 596 2 026
2010 Q1 20 537 1 339 3 092 6 099 4 591 628 325 555 − 8 038 3 506 4 532 1 969
Percentage chang e , quar ter on corresponding quarter of previous year
2007 Q1 5.1 3.0 7.2 4.4 12.6 −28.8 −7.6 8.1 5.4 6.8 3.7 4.4Q2 5.4 2.4 8.2 2.7 17.4 −26.6 −17.3 −14.7 6.5 9.3 3.0 7.0Q3 8.5 4.7 6.5 12.8 21.5 6.8 −11.8 −18.4 7.6 9.4 5.3 4.9Q4 4.1 6.4 14.9 7.2 18.4 −14.2 −17.6 −21.2 −1.5 −5.4 3.8 7.8
2008 Q1 5.5 10.3 17.7 4.5 1.2 24.2 8.2 5.7 3.1 4.9 0.9 1.8Q2 3.7 7.0 8.2 4.1 −6.1 31.0 27.2 27.3 2.0 0.8 3.5 3.2Q3 −0.5 2.8 −0.6 −1.7 −8.7 16.5 28.3 18.5 −1.2 −5.8 5.3 5.6Q4 −7.8 −2.4 −6.4 −9.2 −12.4 11.9 21.3 −20.4 −10.4 −17.1 −2.3 5.0
2009 Q1 −15.4 −3.5 −13.6 −7.8 −6.0 −8.2 3.0 −23.5 −25.3 −37.0 −9.5 −1.3Q2 −20.8 −1.0 −8.3 −22.0 −17.6 −28.5 −18.4 −37.3 −29.4 −42.5 −13.3 −2.4Q3 −14.7 −3.0 −0.8 −8.6 −7.6 0.2 −12.1 −24.0 −25.5 −38.2 −9.3 −4.4Q4 −5.9 −1.9 7.9 −5.6 −0.8 −24.1 −17.6 −12.1 −11.1 −22.1 0.2 −3.5
2010 Q1 −1.5 −1.8 10.5 −8.2 −4.0 −26.4 −14.7 −10.9 −0.5 −10.1 8.6 −0.2
1 Financial intermediation services indirectly measured.

196
SER.CS Household final consumption expenditureSer vicesCurrent prices - seasonally adjusted £ million
Clothing and footwear Housing, water, electr icity, gas and other fuels
Actual rentals for housing Imputed rentals for housing Ser vicesfor the
Cleaning, Imputed maintena- Otherrepair Actual rentals nce & ser vices
and hire Repair & rentals Other of Other repair of Refuse Sewerage relatingof hire of paid by actual owner-oc- imputed the collecti- collecti- to the
Total Total clothing footwear Total Total tenants rentals Total cupiers rentals dwelling on on dwelling
COICOP S 03 03.1.4 03.2.2 04 04.1 04.1.1 04.1.2 04.2 04.2.1 04.2.2 04.3.2 04.4.2 04.4.3 04.4.4
UTIN LLKK UVGC AWUG LLKL ZAVP BMBT UVGD GBFJ CCSS GBFM AWUH UVGE UTZS UVGF2005 404 565 765 702 63 117 114 29 547 29 547 − 77 339 74 299 3 040 6 791 103 3 334 −2006 424 415 839 766 73 124 455 32 716 32 716 − 80 668 77 814 2 854 7 392 146 3 533 −2007 448 707 930 854 76 133 741 35 881 35 881 − 86 236 83 286 2 950 7 618 106 3 900 −2008 461 482 1 069 992 77 141 956 38 566 38 566 − 91 444 88 491 2 953 7 745 117 4 084 −2009 451 368 1 086 1 004 82 149 631 41 112 41 112 − 96 667 93 254 3 413 7 595 107 4 150 −
Percentage chang e , year on previous year
2005 6.1 9.3 11.3 −8.7 5.7 3.1 3.1 6.2 5.5 25.7 8.0 13.2 14.42006 4.9 9.7 9.1 15.9 6.3 10.7 10.7 4.3 4.7 −6.1 8.8 41.7 6.02007 5.7 10.8 11.5 4.1 7.5 9.7 9.7 6.9 7.0 3.4 3.1 −27.4 10.42008 2.8 14.9 16.2 1.3 6.1 7.5 7.5 6.0 6.2 0.1 1.7 10.4 4.72009 −2.2 1.6 1.2 6.5 5.4 6.6 6.6 5.7 5.4 15.6 −1.9 −8.5 1.6
Seasonally adjusted
2007 Q1 110 616 233 213 20 32 848 8 772 8 772 − 21 057 20 289 768 2 057 39 923 −Q2 112 259 230 212 18 33 294 8 920 8 920 − 21 349 20 564 785 2 042 26 957 −Q3 112 507 235 215 20 33 434 9 068 9 068 − 21 801 21 057 744 1 550 19 996 −Q4 113 325 232 214 18 34 165 9 121 9 121 − 22 029 21 376 653 1 969 22 1 024 −
2008 Q1 115 350 225 207 18 34 224 9 265 9 265 − 22 143 21 492 651 1 773 27 1 016 −Q2 115 409 252 235 17 34 830 9 444 9 444 − 22 409 21 713 696 1 919 33 1 025 −Q3 116 227 295 275 20 35 869 9 718 9 718 − 23 070 22 297 773 2 028 31 1 022 −Q4 114 496 297 275 22 37 033 10 139 10 139 − 23 822 22 989 833 2 025 26 1 021 −
2009 Q1 113 205 282 263 19 37 086 10 128 10 128 − 23 847 23 001 846 2 057 28 1 026 −Q2 111 570 264 244 20 37 163 10 245 10 245 − 23 902 23 082 820 1 972 24 1 020 −Q3 112 780 261 242 19 37 248 10 320 10 320 − 24 169 23 327 842 1 693 26 1 040 −Q4 113 813 279 255 24 38 134 10 419 10 419 − 24 749 23 844 905 1 873 29 1 064 −
2010 Q1 115 427 275 252 23 39 492 10 709 10 709 − 25 662 24 803 859 2 011 28 1 082 −
Percentage chang e , quar ter on previous quarter
2007 Q1 1.6 3.6 4.4 −4.8 1.8 3.1 3.1 1.0 1.3 −5.4 4.3 −20.4 3.1Q2 1.5 −1.3 −0.5 −10.0 1.4 1.7 1.7 1.4 1.4 2.2 −0.7 −33.3 3.7Q3 0.2 2.2 1.4 11.1 0.4 1.7 1.7 2.1 2.4 −5.2 −24.1 −26.9 4.1Q4 0.7 −1.3 −0.5 −10.0 2.2 0.6 0.6 1.0 1.5 −12.2 27.0 15.8 2.8
2008 Q1 1.8 −3.0 −3.3 − 0.2 1.6 1.6 0.5 0.5 −0.3 −10.0 22.7 −0.8Q2 0.1 12.0 13.5 −5.6 1.8 1.9 1.9 1.2 1.0 6.9 8.2 22.2 0.9Q3 0.7 17.1 17.0 17.6 3.0 2.9 2.9 2.9 2.7 11.1 5.7 −6.1 −0.3Q4 −1.5 0.7 − 10.0 3.2 4.3 4.3 3.3 3.1 7.8 −0.1 −16.1 −0.1
2009 Q1 −1.1 −5.1 −4.4 −13.6 0.1 −0.1 −0.1 0.1 0.1 1.6 1.6 7.7 0.5Q2 −1.4 −6.4 −7.2 5.3 0.2 1.2 1.2 0.2 0.4 −3.1 −4.1 −14.3 −0.6Q3 1.1 −1.1 −0.8 −5.0 0.2 0.7 0.7 1.1 1.1 2.7 −14.1 8.3 2.0Q4 0.9 6.9 5.4 26.3 2.4 1.0 1.0 2.4 2.2 7.5 10.6 11.5 2.3
2010 Q1 1.4 −1.4 −1.2 −4.2 3.6 2.8 2.8 3.7 4.0 −5.1 7.4 −3.4 1.7
Percentage chang e , quar ter on corresponding quarter of previous year
2007 Q1 6.4 20.7 20.3 25.0 8.3 9.6 9.6 6.6 6.1 21.3 22.0 95.0 5.1Q2 6.8 11.1 11.6 5.9 8.7 10.7 10.7 7.3 6.8 22.3 14.5 −21.2 9.1Q3 5.6 9.8 10.3 5.3 7.1 11.3 11.3 8.0 8.4 −3.0 −20.5 −56.8 12.8Q4 4.1 3.1 4.9 −14.3 5.9 7.2 7.2 5.7 6.7 −19.6 −0.2 −55.1 14.4
2008 Q1 4.3 −3.4 −2.8 −10.0 4.2 5.6 5.6 5.2 5.9 −15.2 −13.8 −30.8 10.1Q2 2.8 9.6 10.8 −5.6 4.6 5.9 5.9 5.0 5.6 −11.3 −6.0 26.9 7.1Q3 3.3 25.5 27.9 − 7.3 7.2 7.2 5.8 5.9 3.9 30.8 63.2 2.6Q4 1.0 28.0 28.5 22.2 8.4 11.2 11.2 8.1 7.5 27.6 2.8 18.2 −0.3
2009 Q1 −1.9 25.3 27.1 5.6 8.4 9.3 9.3 7.7 7.0 30.0 16.0 3.7 1.0Q2 −3.3 4.8 3.8 17.6 6.7 8.5 8.5 6.7 6.3 17.8 2.8 −27.3 −0.5Q3 −3.0 −11.5 −12.0 −5.0 3.8 6.2 6.2 4.8 4.6 8.9 −16.5 −16.1 1.8Q4 −0.6 −6.1 −7.3 9.1 3.0 2.8 2.8 3.9 3.7 8.6 −7.5 11.5 4.2
2010 Q1 2.0 −2.5 −4.2 21.1 6.5 5.7 5.7 7.6 7.8 1.5 −2.2 − 5.5

197
SER.CS Household final consumption expenditureSer vicesCurrent prices - seasonally adjustedcontinued £ million
Fur nishing & household services Health
Repair of Out-patient servicesfur niture,
fur nishings & Repair of Domestic &floor household household Medical Dental Paramedical Hospital
Total coverings appliances ser vices Total Total services services services services
COICOP 05 05.1.3 05.3.3 05.6.2 06 06.2 06.2.1 06.2.2 06.2.3 06.3
LLKM UVGG UVGH UVGU LLKN ZAWF ZAWH ZAWJ UTMF UTYD2005 4 141 57 551 3 533 5 413 2 909 1 038 1 371 500 2 5042006 3 842 51 542 3 249 6 227 3 483 1 138 1 719 626 2 7442007 3 465 36 561 2 868 6 520 3 809 1 259 2 051 499 2 7112008 3 571 43 477 3 051 6 409 3 462 1 072 1 829 561 2 9472009 3 347 53 466 2 828 6 292 3 180 973 1 673 534 3 112
Percentage chang e , year on previous year
2005 8.2 111.1 −3.5 9.4 6.0 5.9 3.0 3.2 22.0 6.22006 −7.2 −10.5 −1.6 −8.0 15.0 19.7 9.6 25.4 25.2 9.62007 −9.8 −29.4 3.5 −11.7 4.7 9.4 10.6 19.3 −20.3 −1.22008 3.1 19.4 −15.0 6.4 −1.7 −9.1 −14.9 −10.8 12.4 8.72009 −6.3 23.3 −2.3 −7.3 −1.8 −8.1 −9.2 −8.5 −4.8 5.6
Seasonally adjusted
2007 Q1 891 8 163 720 1 645 955 301 523 131 690Q2 881 9 150 722 1 676 1 002 321 552 129 674Q3 861 11 135 715 1 619 947 326 498 123 672Q4 832 8 113 711 1 580 905 311 478 116 675
2008 Q1 857 5 117 735 1 590 889 311 455 123 701Q2 875 5 113 757 1 613 886 292 466 128 727Q3 911 16 118 777 1 637 887 259 484 144 750Q4 928 17 129 782 1 569 800 210 424 166 769
2009 Q1 857 10 114 733 1 611 828 247 435 146 783Q2 825 12 114 699 1 583 799 240 421 138 784Q3 814 13 121 680 1 565 792 246 418 128 773Q4 851 18 117 716 1 533 761 240 399 122 772
2010 Q1 909 16 118 775 1 501 725 220 381 124 776
Percentage chang e , quar ter on previous quarter
2007 Q1 −0.7 − 11.6 −3.1 −1.8 −2.2 3.4 −3.9 −7.1 −1.3Q2 −1.1 12.5 −8.0 0.3 1.9 4.9 6.6 5.5 −1.5 −2.3Q3 −2.3 22.2 −10.0 −1.0 −3.4 −5.5 1.6 −9.8 −4.7 −0.3Q4 −3.4 −27.3 −16.3 −0.6 −2.4 −4.4 −4.6 −4.0 −5.7 0.4
2008 Q1 3.0 −37.5 3.5 3.4 0.6 −1.8 − −4.8 6.0 3.9Q2 2.1 − −3.4 3.0 1.4 −0.3 −6.1 2.4 4.1 3.7Q3 4.1 220.0 4.4 2.6 1.5 0.1 −11.3 3.9 12.5 3.2Q4 1.9 6.2 9.3 0.6 −4.2 −9.8 −18.9 −12.4 15.3 2.5
2009 Q1 −7.7 −41.2 −11.6 −6.3 2.7 3.5 17.6 2.6 −12.0 1.8Q2 −3.7 20.0 − −4.6 −1.7 −3.5 −2.8 −3.2 −5.5 0.1Q3 −1.3 8.3 6.1 −2.7 −1.1 −0.9 2.5 −0.7 −7.2 −1.4Q4 4.5 38.5 −3.3 5.3 −2.0 −3.9 −2.4 −4.5 −4.7 −0.1
2010 Q1 6.8 −11.1 0.9 8.2 −2.1 −4.7 −8.3 −4.5 1.6 0.5
Percentage chang e , quar ter on corresponding quarter of previous year
2007 Q1 −10.6 −57.9 32.5 −15.8 11.4 17.3 3.4 48.6 −23.4 4.2Q2 −12.4 −35.7 7.9 −15.4 10.4 20.4 13.0 43.8 −21.3 −1.7Q3 −8.6 10.0 0.7 −10.4 3.9 10.0 19.9 13.4 −18.0 −3.6Q4 −7.2 − −22.6 −4.3 −5.7 −7.3 6.9 −12.1 −17.7 −3.4
2008 Q1 −3.8 −37.5 −28.2 2.1 −3.3 −6.9 3.3 −13.0 −6.1 1.6Q2 −0.7 −44.4 −24.7 4.8 −3.8 −11.6 −9.0 −15.6 −0.8 7.9Q3 5.8 45.5 −12.6 8.7 1.1 −6.3 −20.6 −2.8 17.1 11.6Q4 11.5 112.5 14.2 10.0 −0.7 −11.6 −32.5 −11.3 43.1 13.9
2009 Q1 − 100.0 −2.6 −0.3 1.3 −6.9 −20.6 −4.4 18.7 11.7Q2 −5.7 140.0 0.9 −7.7 −1.9 −9.8 −17.8 −9.7 7.8 7.8Q3 −10.6 −18.8 2.5 −12.5 −4.4 −10.7 −5.0 −13.6 −11.1 3.1Q4 −8.3 5.9 −9.3 −8.4 −2.3 −4.9 14.3 −5.9 −26.5 0.4
2010 Q1 6.1 60.0 3.5 5.7 −6.8 −12.4 −10.9 −12.4 −15.1 −0.9

198
SER.CS Household final consumption expenditureSer vicesCurrent prices - seasonally adjustedcontinued £ million
Tr anspor t ser vicesVehicle
maintenance and Other vehicle Sea & inlandTotal repair ser vices Total Railways Road Air waterway Other
COICOP 07 07.2.3 07.2.4 07.3 07.3.1 07.3.2 07.3.3 07.3.4 07.3.6
LLKO AWUI ZAWP ZAWR AWUJ ZAWT AWUK AWUL AWUM2005 49 106 15 319 4 848 28 939 4 830 7 886 12 357 2 491 1 3752006 51 483 15 541 5 259 30 683 4 972 8 350 13 015 2 804 1 5422007 55 547 15 762 5 741 34 044 5 901 8 788 14 439 3 336 1 5802008 58 019 16 093 6 269 35 657 6 406 9 081 15 177 3 703 1 2902009 56 911 17 790 5 904 33 217 6 349 8 503 12 702 4 482 1 181
Percentage chang e , year on previous year
2005 8.8 11.1 10.6 7.4 5.3 8.2 8.0 4.2 11.32006 4.8 1.4 8.5 6.0 2.9 5.9 5.3 12.6 12.12007 7.9 1.4 9.2 11.0 18.7 5.2 10.9 19.0 2.52008 4.5 2.1 9.2 4.7 8.6 3.3 5.1 11.0 −18.42009 −1.9 10.5 −5.8 −6.8 −0.9 −6.4 −16.3 21.0 −8.4
Seasonally adjusted
2007 Q1 13 563 4 059 1 385 8 119 1 344 2 097 3 437 855 386Q2 14 124 4 045 1 367 8 712 1 441 2 191 3 922 793 365Q3 13 732 3 935 1 465 8 332 1 532 2 231 3 388 769 412Q4 14 128 3 723 1 524 8 881 1 584 2 269 3 692 919 417
2008 Q1 14 659 3 777 1 584 9 298 1 602 2 299 4 050 978 369Q2 14 500 3 827 1 629 9 044 1 640 2 293 3 741 1 027 343Q3 14 402 4 113 1 570 8 719 1 599 2 276 3 656 933 255Q4 14 458 4 376 1 486 8 596 1 565 2 213 3 730 765 323
2009 Q1 14 294 4 355 1 507 8 432 1 575 2 169 3 455 962 271Q2 14 294 4 420 1 476 8 398 1 558 2 114 3 251 1 182 293Q3 14 206 4 527 1 452 8 227 1 589 2 100 3 003 1 228 307Q4 14 117 4 488 1 469 8 160 1 627 2 120 2 993 1 110 310
2010 Q1 14 139 4 331 1 559 8 249 1 605 2 186 2 984 1 162 312
Percentage chang e , quar ter on previous quarter
2007 Q1 2.5 3.3 2.8 2.0 4.5 −1.3 − 18.4 −1.8Q2 4.1 −0.3 −1.3 7.3 7.2 4.5 14.1 −7.3 −5.4Q3 −2.8 −2.7 7.2 −4.4 6.3 1.8 −13.6 −3.0 12.9Q4 2.9 −5.4 4.0 6.6 3.4 1.7 9.0 19.5 1.2
2008 Q1 3.8 1.5 3.9 4.7 1.1 1.3 9.7 6.4 −11.5Q2 −1.1 1.3 2.8 −2.7 2.4 −0.3 −7.6 5.0 −7.0Q3 −0.7 7.5 −3.6 −3.6 −2.5 −0.7 −2.3 −9.2 −25.7Q4 0.4 6.4 −5.4 −1.4 −2.1 −2.8 2.0 −18.0 26.7
2009 Q1 −1.1 −0.5 1.4 −1.9 0.6 −2.0 −7.4 25.8 −16.1Q2 − 1.5 −2.1 −0.4 −1.1 −2.5 −5.9 22.9 8.1Q3 −0.6 2.4 −1.6 −2.0 2.0 −0.7 −7.6 3.9 4.8Q4 −0.6 −0.9 1.2 −0.8 2.4 1.0 −0.3 −9.6 1.0
2010 Q1 0.2 −3.5 6.1 1.1 −1.4 3.1 −0.3 4.7 0.6
Percentage chang e , quar ter on corresponding quarter of previous year
2007 Q1 7.2 5.5 6.7 8.2 8.7 3.4 10.2 13.5 4.9Q2 10.7 4.7 4.5 14.8 18.4 4.9 23.1 12.8 −8.1Q3 7.0 0.8 12.2 9.3 24.2 5.8 3.5 22.8 7.3Q4 6.7 −5.2 13.1 11.5 23.2 6.8 7.4 27.3 6.1
2008 Q1 8.1 −6.9 14.4 14.5 19.2 9.6 17.8 14.4 −4.4Q2 2.7 −5.4 19.2 3.8 13.8 4.7 −4.6 29.5 −6.0Q3 4.9 4.5 7.2 4.6 4.4 2.0 7.9 21.3 −38.1Q4 2.3 17.5 −2.5 −3.2 −1.2 −2.5 1.0 −16.8 −22.5
2009 Q1 −2.5 15.3 −4.9 −9.3 −1.7 −5.7 −14.7 −1.6 −26.6Q2 −1.4 15.5 −9.4 −7.1 −5.0 −7.8 −13.1 15.1 −14.6Q3 −1.4 10.1 −7.5 −5.6 −0.6 −7.7 −17.9 31.6 20.4Q4 −2.4 2.6 −1.1 −5.1 4.0 −4.2 −19.8 45.1 −4.0
2010 Q1 −1.1 −0.6 3.5 −2.2 1.9 0.8 −13.6 20.8 15.1

199
SER.CS Household final consumption expenditureSer vicesCurrent prices - seasonally adjustedcontinued £ million
Communication Recreation and culture
Repair of Recreational and cultural servicesaudio-visu- Maintenance
al, & repair ofphotograph- other major
ic & durables Veter inary Recreation-Telephone infor mation for and other al &
Postal and telefax processing recreation services sporting Cultural Games of PackageTotal services services Total equipment and culture for pets Total services services chance holidays
COICOP 08 08.1 08.3 09 09.1.5 09.2.3 09.3.5 09.4 09.4.1 09.4.2 9.4.3 9.6
LLKP CCVS ZAWX LLKQ UVJI UVJJ UVJX ZAXH ZAXJ ZAXL CCQZ ZAXP2005 16 989 1 016 15 973 29 779 156 102 2 156 27 365 5 769 12 663 8 933 −2006 17 142 1 020 16 122 30 946 97 45 2 073 28 731 6 405 13 639 8 687 −2007 17 504 1 037 16 467 32 788 93 64 2 534 30 097 6 584 14 114 9 399 −2008 17 357 1 027 16 330 33 339 54 104 2 952 30 229 5 936 14 366 9 927 −2009 17 643 1 087 16 556 33 315 162 93 2 478 30 582 6 010 15 860 8 712 −
Percentage chang e , year on previous year
2005 4.1 5.7 4.0 4.3 13.0 32.5 22.8 3.0 10.6 3.7 −2.32006 0.9 0.4 0.9 3.9 −37.8 −55.9 −3.8 5.0 11.0 7.7 −2.82007 2.1 1.7 2.1 6.0 −4.1 42.2 22.2 4.8 2.8 3.5 8.22008 −0.8 −1.0 −0.8 1.7 −41.9 62.5 16.5 0.4 −9.8 1.8 5.62009 1.6 5.8 1.4 −0.1 200.0 −10.6 −16.1 1.2 1.2 10.4 −12.2
Seasonally adjusted
2007 Q1 4 339 264 4 075 8 192 26 14 593 7 559 1 810 3 508 2 241 −Q2 4 303 278 4 025 8 106 25 17 619 7 445 1 693 3 569 2 183 −Q3 4 399 245 4 154 8 366 22 17 661 7 666 1 523 3 564 2 579 −Q4 4 463 250 4 213 8 124 20 16 661 7 427 1 558 3 473 2 396 −
2008 Q1 4 381 259 4 122 8 575 14 19 732 7 810 1 526 3 607 2 677 −Q2 4 356 256 4 100 8 157 12 23 717 7 405 1 470 3 469 2 466 −Q3 4 324 243 4 081 8 508 12 30 760 7 706 1 516 3 693 2 497 −Q4 4 296 269 4 027 8 099 16 32 743 7 308 1 424 3 597 2 287 −
2009 Q1 4 331 277 4 054 8 346 21 24 676 7 625 1 503 3 905 2 217 −Q2 4 436 272 4 164 8 322 36 22 628 7 636 1 499 3 944 2 193 −Q3 4 413 287 4 126 8 327 50 20 580 7 677 1 511 3 989 2 177 −Q4 4 463 251 4 212 8 320 55 27 594 7 644 1 497 4 022 2 125 −
2010 Q1 4 530 243 4 287 8 398 48 25 606 7 719 1 505 4 060 2 154 −
Percentage chang e , quar ter on previous quarter
2007 Q1 2.0 15.3 1.2 3.0 − 7.7 7.2 2.7 10.2 0.8 0.2Q2 −0.8 5.3 −1.2 −1.0 −3.8 21.4 4.4 −1.5 −6.5 1.7 −2.6Q3 2.2 −11.9 3.2 3.2 −12.0 − 6.8 3.0 −10.0 −0.1 18.1Q4 1.5 2.0 1.4 −2.9 −9.1 −5.9 − −3.1 2.3 −2.6 −7.1
2008 Q1 −1.8 3.6 −2.2 5.6 −30.0 18.8 10.7 5.2 −2.1 3.9 11.7Q2 −0.6 −1.2 −0.5 −4.9 −14.3 21.1 −2.0 −5.2 −3.7 −3.8 −7.9Q3 −0.7 −5.1 −0.5 4.3 − 30.4 6.0 4.1 3.1 6.5 1.3Q4 −0.6 10.7 −1.3 −4.8 33.3 6.7 −2.2 −5.2 −6.1 −2.6 −8.4
2009 Q1 0.8 3.0 0.7 3.0 31.2 −25.0 −9.0 4.3 5.5 8.6 −3.1Q2 2.4 −1.8 2.7 −0.3 71.4 −8.3 −7.1 0.1 −0.3 1.0 −1.1Q3 −0.5 5.5 −0.9 0.1 38.9 −9.1 −7.6 0.5 0.8 1.1 −0.7Q4 1.1 −12.5 2.1 −0.1 10.0 35.0 2.4 −0.4 −0.9 0.8 −2.4
2010 Q1 1.5 −3.2 1.8 0.9 −12.7 −7.4 2.0 1.0 0.5 0.9 1.4
Percentage chang e , quar ter on corresponding quarter of previous year
2007 Q1 −0.4 −6.7 − 10.9 4.0 27.3 16.3 10.5 14.8 9.2 9.2Q2 0.3 10.8 −0.3 5.9 8.7 70.0 22.6 4.6 5.1 3.2 6.4Q3 3.8 −4.7 4.3 5.2 −4.3 54.5 30.9 3.4 −3.4 2.1 9.9Q4 4.9 9.2 4.6 2.2 −23.1 23.1 19.5 0.9 −5.1 −0.2 7.1
2008 Q1 1.0 −1.9 1.2 4.7 −46.2 35.7 23.4 3.3 −15.7 2.8 19.5Q2 1.2 −7.9 1.9 0.6 −52.0 35.3 15.8 −0.5 −13.2 −2.8 13.0Q3 −1.7 −0.8 −1.8 1.7 −45.5 76.5 15.0 0.5 −0.5 3.6 −3.2Q4 −3.7 7.6 −4.4 −0.3 −20.0 100.0 12.4 −1.6 −8.6 3.6 −4.5
2009 Q1 −1.1 6.9 −1.6 −2.7 50.0 26.3 −7.7 −2.4 −1.5 8.3 −17.2Q2 1.8 6.2 1.6 2.0 200.0 −4.3 −12.4 3.1 2.0 13.7 −11.1Q3 2.1 18.1 1.1 −2.1 316.7 −33.3 −23.7 −0.4 −0.3 8.0 −12.8Q4 3.9 −6.7 4.6 2.7 243.8 −15.6 −20.1 4.6 5.1 11.8 −7.1
2010 Q1 4.6 −12.3 5.7 0.6 128.6 4.2 −10.4 1.2 0.1 4.0 −2.8

200
SER.CS Household final consumption expenditureSer vicesCurrent prices - seasonally adjustedcontinued £ million
Restaurants and hotels
Cater ing ser vices
Restaurants, cafes AccommodationEducation Total Total etc Canteens services
COICOP 10 11 11.1 11.1.1 11.1.2 11.2
ZWUS ZAXR ZAXT ZAXV ZAYB ZAYD2005 11 050 85 473 74 642 66 595 8 047 10 8312006 11 711 87 812 76 072 68 074 7 998 11 7402007 12 356 90 729 78 121 70 170 7 951 12 6082008 12 591 91 933 78 798 70 785 8 013 13 1352009 13 024 88 563 75 841 68 102 7 739 12 722
Percentage chang e , year on previous year
2005 2.7 3.1 2.7 3.1 −0.4 6.02006 6.0 2.7 1.9 2.2 −0.6 8.42007 5.5 3.3 2.7 3.1 −0.6 7.42008 1.9 1.3 0.9 0.9 0.8 4.22009 3.4 −3.7 −3.8 −3.8 −3.4 −3.1
Seasonally adjusted
2007 Q1 3 017 22 508 19 343 17 278 2 065 3 165Q2 3 087 22 888 19 640 17 615 2 025 3 248Q3 3 115 22 559 19 407 17 512 1 895 3 152Q4 3 137 22 774 19 731 17 765 1 966 3 043
2008 Q1 3 163 23 096 19 761 17 843 1 918 3 335Q2 3 141 23 159 19 874 17 805 2 069 3 285Q3 3 176 22 954 19 699 17 671 2 028 3 255Q4 3 111 22 724 19 464 17 466 1 998 3 260
2009 Q1 3 210 22 298 19 026 17 131 1 895 3 272Q2 3 238 21 982 18 834 16 928 1 906 3 148Q3 3 272 22 018 18 889 16 927 1 962 3 129Q4 3 304 22 265 19 092 17 116 1 976 3 173
2010 Q1 3 336 22 330 19 191 17 277 1 914 3 139
Percentage chang e , quar ter on previous quarter
2007 Q1 0.3 1.2 0.4 − 4.1 6.1Q2 2.3 1.7 1.5 2.0 −1.9 2.6Q3 0.9 −1.4 −1.2 −0.6 −6.4 −3.0Q4 0.7 1.0 1.7 1.4 3.7 −3.5
2008 Q1 0.8 1.4 0.2 0.4 −2.4 9.6Q2 −0.7 0.3 0.6 −0.2 7.9 −1.5Q3 1.1 −0.9 −0.9 −0.8 −2.0 −0.9Q4 −2.0 −1.0 −1.2 −1.2 −1.5 0.2
2009 Q1 3.2 −1.9 −2.3 −1.9 −5.2 0.4Q2 0.9 −1.4 −1.0 −1.2 0.6 −3.8Q3 1.1 0.2 0.3 − 2.9 −0.6Q4 1.0 1.1 1.1 1.1 0.7 1.4
2010 Q1 1.0 0.3 0.5 0.9 −3.1 −1.1
Percentage chang e , quar ter on corresponding quarter of previous year
2007 Q1 6.8 5.3 4.0 4.4 0.7 14.0Q2 6.7 4.7 3.9 4.1 1.9 10.1Q3 4.4 1.0 0.5 1.1 −4.1 4.0Q4 4.3 2.4 2.4 2.8 −0.9 2.0
2008 Q1 4.8 2.6 2.2 3.3 −7.1 5.4Q2 1.7 1.2 1.2 1.1 2.2 1.1Q3 2.0 1.8 1.5 0.9 7.0 3.3Q4 −0.8 −0.2 −1.4 −1.7 1.6 7.1
2009 Q1 1.5 −3.5 −3.7 −4.0 −1.2 −1.9Q2 3.1 −5.1 −5.2 −4.9 −7.9 −4.2Q3 3.0 −4.1 −4.1 −4.2 −3.3 −3.9Q4 6.2 −2.0 −1.9 −2.0 −1.1 −2.7
2010 Q1 3.9 0.1 0.9 0.9 1.0 −4.1
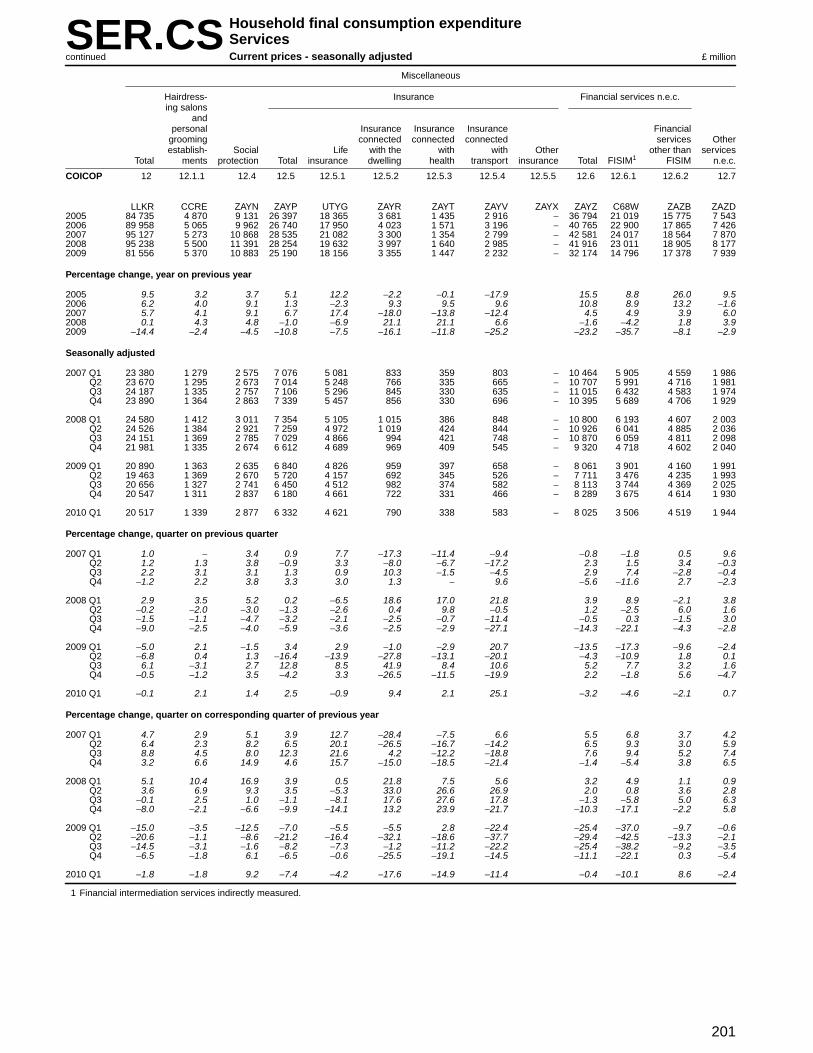
201
SER.CS Household final consumption expenditureSer vicesCurrent prices - seasonally adjustedcontinued £ million
Miscellaneous
Hairdress- Insurance Financial ser vices n.e.c.ing salons
andpersonal Insurance Insurance Insurance Financial
grooming connected connected connected ser vices Otherestablish- Social Life with the with with Other other than services
Total ments protection Total insurance dwelling health transpor t insurance Total FISIM1 FISIM n.e.c.
COICOP 12 12.1.1 12.4 12.5 12.5.1 12.5.2 12.5.3 12.5.4 12.5.5 12.6 12.6.1 12.6.2 12.7
LLKR CCRE ZAYN ZAYP UTYG ZAYR ZAYT ZAYV ZAYX ZAYZ C68W ZAZB ZAZD2005 84 735 4 870 9 131 26 397 18 365 3 681 1 435 2 916 − 36 794 21 019 15 775 7 5432006 89 958 5 065 9 962 26 740 17 950 4 023 1 571 3 196 − 40 765 22 900 17 865 7 4262007 95 127 5 273 10 868 28 535 21 082 3 300 1 354 2 799 − 42 581 24 017 18 564 7 8702008 95 238 5 500 11 391 28 254 19 632 3 997 1 640 2 985 − 41 916 23 011 18 905 8 1772009 81 556 5 370 10 883 25 190 18 156 3 355 1 447 2 232 − 32 174 14 796 17 378 7 939
Percentage chang e , year on previous year
2005 9.5 3.2 3.7 5.1 12.2 −2.2 −0.1 −17.9 15.5 8.8 26.0 9.52006 6.2 4.0 9.1 1.3 −2.3 9.3 9.5 9.6 10.8 8.9 13.2 −1.62007 5.7 4.1 9.1 6.7 17.4 −18.0 −13.8 −12.4 4.5 4.9 3.9 6.02008 0.1 4.3 4.8 −1.0 −6.9 21.1 21.1 6.6 −1.6 −4.2 1.8 3.92009 −14.4 −2.4 −4.5 −10.8 −7.5 −16.1 −11.8 −25.2 −23.2 −35.7 −8.1 −2.9
Seasonally adjusted
2007 Q1 23 380 1 279 2 575 7 076 5 081 833 359 803 − 10 464 5 905 4 559 1 986Q2 23 670 1 295 2 673 7 014 5 248 766 335 665 − 10 707 5 991 4 716 1 981Q3 24 187 1 335 2 757 7 106 5 296 845 330 635 − 11 015 6 432 4 583 1 974Q4 23 890 1 364 2 863 7 339 5 457 856 330 696 − 10 395 5 689 4 706 1 929
2008 Q1 24 580 1 412 3 011 7 354 5 105 1 015 386 848 − 10 800 6 193 4 607 2 003Q2 24 526 1 384 2 921 7 259 4 972 1 019 424 844 − 10 926 6 041 4 885 2 036Q3 24 151 1 369 2 785 7 029 4 866 994 421 748 − 10 870 6 059 4 811 2 098Q4 21 981 1 335 2 674 6 612 4 689 969 409 545 − 9 320 4 718 4 602 2 040
2009 Q1 20 890 1 363 2 635 6 840 4 826 959 397 658 − 8 061 3 901 4 160 1 991Q2 19 463 1 369 2 670 5 720 4 157 692 345 526 − 7 711 3 476 4 235 1 993Q3 20 656 1 327 2 741 6 450 4 512 982 374 582 − 8 113 3 744 4 369 2 025Q4 20 547 1 311 2 837 6 180 4 661 722 331 466 − 8 289 3 675 4 614 1 930
2010 Q1 20 517 1 339 2 877 6 332 4 621 790 338 583 − 8 025 3 506 4 519 1 944
Percentage chang e , quar ter on previous quarter
2007 Q1 1.0 − 3.4 0.9 7.7 −17.3 −11.4 −9.4 −0.8 −1.8 0.5 9.6Q2 1.2 1.3 3.8 −0.9 3.3 −8.0 −6.7 −17.2 2.3 1.5 3.4 −0.3Q3 2.2 3.1 3.1 1.3 0.9 10.3 −1.5 −4.5 2.9 7.4 −2.8 −0.4Q4 −1.2 2.2 3.8 3.3 3.0 1.3 − 9.6 −5.6 −11.6 2.7 −2.3
2008 Q1 2.9 3.5 5.2 0.2 −6.5 18.6 17.0 21.8 3.9 8.9 −2.1 3.8Q2 −0.2 −2.0 −3.0 −1.3 −2.6 0.4 9.8 −0.5 1.2 −2.5 6.0 1.6Q3 −1.5 −1.1 −4.7 −3.2 −2.1 −2.5 −0.7 −11.4 −0.5 0.3 −1.5 3.0Q4 −9.0 −2.5 −4.0 −5.9 −3.6 −2.5 −2.9 −27.1 −14.3 −22.1 −4.3 −2.8
2009 Q1 −5.0 2.1 −1.5 3.4 2.9 −1.0 −2.9 20.7 −13.5 −17.3 −9.6 −2.4Q2 −6.8 0.4 1.3 −16.4 −13.9 −27.8 −13.1 −20.1 −4.3 −10.9 1.8 0.1Q3 6.1 −3.1 2.7 12.8 8.5 41.9 8.4 10.6 5.2 7.7 3.2 1.6Q4 −0.5 −1.2 3.5 −4.2 3.3 −26.5 −11.5 −19.9 2.2 −1.8 5.6 −4.7
2010 Q1 −0.1 2.1 1.4 2.5 −0.9 9.4 2.1 25.1 −3.2 −4.6 −2.1 0.7
Percentage chang e , quar ter on corresponding quarter of previous year
2007 Q1 4.7 2.9 5.1 3.9 12.7 −28.4 −7.5 6.6 5.5 6.8 3.7 4.2Q2 6.4 2.3 8.2 6.5 20.1 −26.5 −16.7 −14.2 6.5 9.3 3.0 5.9Q3 8.8 4.5 8.0 12.3 21.6 4.2 −12.2 −18.8 7.6 9.4 5.2 7.4Q4 3.2 6.6 14.9 4.6 15.7 −15.0 −18.5 −21.4 −1.4 −5.4 3.8 6.5
2008 Q1 5.1 10.4 16.9 3.9 0.5 21.8 7.5 5.6 3.2 4.9 1.1 0.9Q2 3.6 6.9 9.3 3.5 −5.3 33.0 26.6 26.9 2.0 0.8 3.6 2.8Q3 −0.1 2.5 1.0 −1.1 −8.1 17.6 27.6 17.8 −1.3 −5.8 5.0 6.3Q4 −8.0 −2.1 −6.6 −9.9 −14.1 13.2 23.9 −21.7 −10.3 −17.1 −2.2 5.8
2009 Q1 −15.0 −3.5 −12.5 −7.0 −5.5 −5.5 2.8 −22.4 −25.4 −37.0 −9.7 −0.6Q2 −20.6 −1.1 −8.6 −21.2 −16.4 −32.1 −18.6 −37.7 −29.4 −42.5 −13.3 −2.1Q3 −14.5 −3.1 −1.6 −8.2 −7.3 −1.2 −11.2 −22.2 −25.4 −38.2 −9.2 −3.5Q4 −6.5 −1.8 6.1 −6.5 −0.6 −25.5 −19.1 −14.5 −11.1 −22.1 0.3 −5.4
2010 Q1 −1.8 −1.8 9.2 −7.4 −4.2 −17.6 −14.9 −11.4 −0.4 −10.1 8.6 −2.4
1 Financial intermediation services indirectly measured.
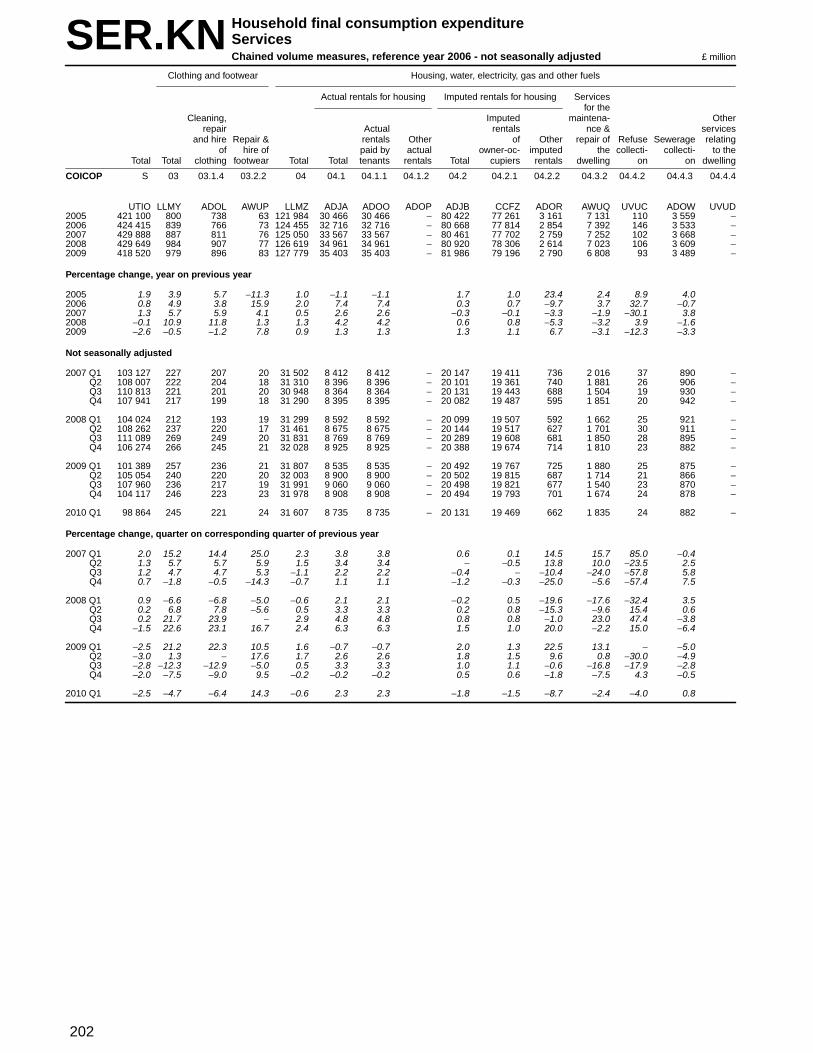
202
SER.KN Household final consumption expenditureSer vicesChained volume measures, reference year 2006 - not seasonally adjusted £ million
Clothing and footwear Housing, water, electr icity, gas and other fuels
Actual rentals for housing Imputed rentals for housing Ser vicesfor the
Cleaning, Imputed maintena- Otherrepair Actual rentals nce & ser vices
and hire Repair & rentals Other of Other repair of Refuse Sewerage relatingof hire of paid by actual owner-oc- imputed the collecti- collecti- to the
Total Total clothing footwear Total Total tenants rentals Total cupiers rentals dwelling on on dwelling
COICOP S 03 03.1.4 03.2.2 04 04.1 04.1.1 04.1.2 04.2 04.2.1 04.2.2 04.3.2 04.4.2 04.4.3 04.4.4
UTIO LLMY ADOL AWUP LLMZ ADJA ADOO ADOP ADJB CCFZ ADOR AWUQ UVUC ADOW UVUD2005 421 100 800 738 63 121 984 30 466 30 466 − 80 422 77 261 3 161 7 131 110 3 559 −2006 424 415 839 766 73 124 455 32 716 32 716 − 80 668 77 814 2 854 7 392 146 3 533 −2007 429 888 887 811 76 125 050 33 567 33 567 − 80 461 77 702 2 759 7 252 102 3 668 −2008 429 649 984 907 77 126 619 34 961 34 961 − 80 920 78 306 2 614 7 023 106 3 609 −2009 418 520 979 896 83 127 779 35 403 35 403 − 81 986 79 196 2 790 6 808 93 3 489 −
Percentage chang e , year on previous year
2005 1.9 3.9 5.7 −11.3 1.0 −1.1 −1.1 1.7 1.0 23.4 2.4 8.9 4.02006 0.8 4.9 3.8 15.9 2.0 7.4 7.4 0.3 0.7 −9.7 3.7 32.7 −0.72007 1.3 5.7 5.9 4.1 0.5 2.6 2.6 −0.3 −0.1 −3.3 −1.9 −30.1 3.82008 −0.1 10.9 11.8 1.3 1.3 4.2 4.2 0.6 0.8 −5.3 −3.2 3.9 −1.62009 −2.6 −0.5 −1.2 7.8 0.9 1.3 1.3 1.3 1.1 6.7 −3.1 −12.3 −3.3
Not seasonally adjusted
2007 Q1 103 127 227 207 20 31 502 8 412 8 412 − 20 147 19 411 736 2 016 37 890 −Q2 108 007 222 204 18 31 310 8 396 8 396 − 20 101 19 361 740 1 881 26 906 −Q3 110 813 221 201 20 30 948 8 364 8 364 − 20 131 19 443 688 1 504 19 930 −Q4 107 941 217 199 18 31 290 8 395 8 395 − 20 082 19 487 595 1 851 20 942 −
2008 Q1 104 024 212 193 19 31 299 8 592 8 592 − 20 099 19 507 592 1 662 25 921 −Q2 108 262 237 220 17 31 461 8 675 8 675 − 20 144 19 517 627 1 701 30 911 −Q3 111 089 269 249 20 31 831 8 769 8 769 − 20 289 19 608 681 1 850 28 895 −Q4 106 274 266 245 21 32 028 8 925 8 925 − 20 388 19 674 714 1 810 23 882 −
2009 Q1 101 389 257 236 21 31 807 8 535 8 535 − 20 492 19 767 725 1 880 25 875 −Q2 105 054 240 220 20 32 003 8 900 8 900 − 20 502 19 815 687 1 714 21 866 −Q3 107 960 236 217 19 31 991 9 060 9 060 − 20 498 19 821 677 1 540 23 870 −Q4 104 117 246 223 23 31 978 8 908 8 908 − 20 494 19 793 701 1 674 24 878 −
2010 Q1 98 864 245 221 24 31 607 8 735 8 735 − 20 131 19 469 662 1 835 24 882 −
Percentage chang e , quar ter on corresponding quarter of previous year
2007 Q1 2.0 15.2 14.4 25.0 2.3 3.8 3.8 0.6 0.1 14.5 15.7 85.0 −0.4Q2 1.3 5.7 5.7 5.9 1.5 3.4 3.4 − −0.5 13.8 10.0 −23.5 2.5Q3 1.2 4.7 4.7 5.3 −1.1 2.2 2.2 −0.4 − −10.4 −24.0 −57.8 5.8Q4 0.7 −1.8 −0.5 −14.3 −0.7 1.1 1.1 −1.2 −0.3 −25.0 −5.6 −57.4 7.5
2008 Q1 0.9 −6.6 −6.8 −5.0 −0.6 2.1 2.1 −0.2 0.5 −19.6 −17.6 −32.4 3.5Q2 0.2 6.8 7.8 −5.6 0.5 3.3 3.3 0.2 0.8 −15.3 −9.6 15.4 0.6Q3 0.2 21.7 23.9 − 2.9 4.8 4.8 0.8 0.8 −1.0 23.0 47.4 −3.8Q4 −1.5 22.6 23.1 16.7 2.4 6.3 6.3 1.5 1.0 20.0 −2.2 15.0 −6.4
2009 Q1 −2.5 21.2 22.3 10.5 1.6 −0.7 −0.7 2.0 1.3 22.5 13.1 − −5.0Q2 −3.0 1.3 − 17.6 1.7 2.6 2.6 1.8 1.5 9.6 0.8 −30.0 −4.9Q3 −2.8 −12.3 −12.9 −5.0 0.5 3.3 3.3 1.0 1.1 −0.6 −16.8 −17.9 −2.8Q4 −2.0 −7.5 −9.0 9.5 −0.2 −0.2 −0.2 0.5 0.6 −1.8 −7.5 4.3 −0.5
2010 Q1 −2.5 −4.7 −6.4 14.3 −0.6 2.3 2.3 −1.8 −1.5 −8.7 −2.4 −4.0 0.8

203
SER.KN Household final consumption expenditureSer vicesChained volume measures, reference year 2006 - not seasonally adjustedcontinued £ million
Fur nishing & household services Health
Repair of Out-patient servicesfur niture,
fur nishings & Repair of Domestic &floor household household Medical Dental Paramedical Hospital
Total coverings appliances ser vices Total Total services services services services
COICOP 05 05.1.3 05.3.3 05.6.2 06 06.2 06.2.1 06.2.2 06.2.3 06.3
LLNA ADPF ADPI ADPM LLNB ADJO ADPN ADPO UTMG ADJP2005 4 325 57 561 3 708 5 610 3 034 1 079 1 434 521 2 5772006 3 842 51 542 3 249 6 227 3 483 1 138 1 719 626 2 7442007 3 309 36 550 2 723 6 320 3 684 1 228 1 970 486 2 6362008 3 248 41 442 2 765 6 147 3 324 1 017 1 778 529 2 8232009 2 982 47 426 2 509 5 768 2 949 894 1 567 488 2 819
Percentage chang e , year on previous year
2005 2.7 103.6 −7.6 3.6 3.8 4.2 0.3 3.5 16.3 3.32006 −11.2 −10.5 −3.4 −12.4 11.0 14.8 5.5 19.9 20.2 6.52007 −13.9 −29.4 1.5 −16.2 1.5 5.8 7.9 14.6 −22.4 −3.92008 −1.8 13.9 −19.6 1.5 −2.7 −9.8 −17.2 −9.7 8.8 7.12009 −8.2 14.6 −3.6 −9.3 −6.2 −11.3 −12.1 −11.9 −7.8 −0.1
Not seasonally adjusted
2007 Q1 665 8 173 484 1 609 935 308 497 130 674Q2 901 9 135 757 1 628 971 316 529 126 657Q3 946 11 117 818 1 556 901 302 479 120 655Q4 797 8 125 664 1 527 877 302 465 110 650
2008 Q1 591 5 116 470 1 537 859 301 440 118 678Q2 840 5 94 741 1 557 856 281 454 121 701Q3 962 15 98 849 1 564 843 238 468 137 721Q4 855 16 134 705 1 489 766 197 416 153 723
2009 Q1 645 8 111 526 1 509 784 234 414 136 725Q2 821 10 93 718 1 464 749 228 395 126 715Q3 799 13 101 685 1 417 718 217 384 117 699Q4 717 16 121 580 1 378 698 215 374 109 680
2010 Q1 835 14 112 709 1 352 663 203 348 112 689
Percentage chang e , quar ter on corresponding quarter of previous year
2007 Q1 −16.5 −57.9 33.1 −25.1 7.4 12.8 3.7 38.8 −25.3 0.6Q2 −21.3 −35.7 3.8 −24.5 6.6 15.9 11.3 36.3 −23.6 −4.6Q3 0.6 10.0 −1.7 0.7 0.4 5.9 15.3 9.4 −20.5 −6.2Q4 −17.1 − −23.3 −15.8 −7.6 −9.1 2.4 −13.1 −19.1 −5.4
2008 Q1 −11.1 −37.5 −32.9 −2.9 −4.5 −8.1 −2.3 −11.5 −9.2 0.6Q2 −6.8 −44.4 −30.4 −2.1 −4.4 −11.8 −11.1 −14.2 −4.0 6.7Q3 1.7 36.4 −16.2 3.8 0.5 −6.4 −21.2 −2.3 14.2 10.1Q4 7.3 100.0 7.2 6.2 −2.5 −12.7 −34.8 −10.5 39.1 11.2
2009 Q1 9.1 60.0 −4.3 11.9 −1.8 −8.7 −22.3 −5.9 15.3 6.9Q2 −2.3 100.0 −1.1 −3.1 −6.0 −12.5 −18.9 −13.0 4.1 2.0Q3 −16.9 −13.3 3.1 −19.3 −9.4 −14.8 −8.8 −17.9 −14.6 −3.1Q4 −16.1 − −9.7 −17.7 −7.5 −8.9 9.1 −10.1 −28.8 −5.9
2010 Q1 29.5 75.0 0.9 34.8 −10.4 −15.4 −13.2 −15.9 −17.6 −5.0

204
SER.KN Household final consumption expenditureSer vicesChained volume measures, reference year 2006 - not seasonally adjustedcontinued £ million
Tr anspor t ser vicesVehicle
maintenance and Other vehicle Sea & inlandTotal repair ser vices Total Railways Road Air waterway Other
COICOP 07 07.2.3 07.2.4 07.3 07.3.1 07.3.2 07.3.3 07.3.4 07.3.6
LLNC AWUR ADPX ADJT AWUS ADPZ AWUT AWUU AWUV2005 51 000 16 375 5 070 29 592 5 043 8 151 12 439 2 502 1 4662006 51 483 15 541 5 259 30 683 4 972 8 350 13 015 2 804 1 5422007 53 605 14 912 5 396 33 297 5 668 8 386 14 559 3 244 1 4402008 53 581 14 336 5 710 33 535 5 883 8 306 14 524 3 546 1 2762009 51 566 15 303 5 222 31 041 5 696 7 379 12 805 4 118 1 043
Percentage chang e , year on previous year
2005 4.0 3.6 4.0 4.2 0.5 1.7 6.4 7.8 6.22006 0.9 −5.1 3.7 3.7 −1.4 2.4 4.6 12.1 5.22007 4.1 −4.0 2.6 8.5 14.0 0.4 11.9 15.7 −6.62008 − −3.9 5.8 0.7 3.8 −1.0 −0.2 9.3 −11.42009 −3.8 6.7 −8.5 −7.4 −3.2 −11.2 −11.8 16.1 −18.3
Not seasonally adjusted
2007 Q1 11 661 3 891 1 292 6 478 1 293 1 771 2 954 166 294Q2 13 486 3 841 1 246 8 399 1 365 2 112 3 506 1 099 317Q3 15 353 3 719 1 478 10 156 1 474 2 233 4 544 1 420 485Q4 13 105 3 461 1 380 8 264 1 536 2 270 3 555 559 344
2008 Q1 12 127 3 424 1 430 7 273 1 479 1 875 3 453 193 273Q2 13 912 3 445 1 447 9 020 1 506 2 126 3 683 1 356 349Q3 15 149 3 668 1 516 9 965 1 477 2 196 4 348 1 550 394Q4 12 393 3 799 1 317 7 277 1 421 2 109 3 040 447 260
2009 Q1 11 326 3 766 1 329 6 231 1 395 1 668 2 839 133 196Q2 13 324 3 816 1 279 8 229 1 400 1 837 3 230 1 497 265Q3 14 840 3 904 1 345 9 591 1 452 1 929 3 956 1 915 339Q4 12 076 3 817 1 269 6 990 1 449 1 945 2 780 573 243
2010 Q1 10 980 3 581 1 342 6 057 1 379 1 630 2 650 202 196
Percentage chang e , quar ter on corresponding quarter of previous year
2007 Q1 3.7 −0.4 2.4 6.0 6.8 1.9 7.4 27.7 −3.0Q2 2.9 −1.4 −0.8 5.6 11.0 −0.6 9.0 11.7 −20.9Q3 5.2 −4.8 3.4 10.1 19.3 − 14.1 12.2 −Q4 4.6 −9.6 5.3 11.8 18.6 0.7 16.0 31.8 −2.5
2008 Q1 4.0 −12.0 10.7 12.3 14.4 5.9 16.9 16.3 −7.1Q2 3.2 −10.3 16.1 7.4 10.3 0.7 5.0 23.4 10.1Q3 −1.3 −1.4 2.6 −1.9 0.2 −1.7 −4.3 9.2 −18.8Q4 −5.4 9.8 −4.6 −11.9 −7.5 −7.1 −14.5 −20.0 −24.4
2009 Q1 −6.6 10.0 −7.1 −14.3 −5.7 −11.0 −17.8 −31.1 −28.2Q2 −4.2 10.8 −11.6 −8.8 −7.0 −13.6 −12.3 10.4 −24.1Q3 −2.0 6.4 −11.3 −3.8 −1.7 −12.2 −9.0 23.5 −14.0Q4 −2.6 0.5 −3.6 −3.9 2.0 −7.8 −8.6 28.2 −6.5
2010 Q1 −3.1 −4.9 1.0 −2.8 −1.1 −2.3 −6.7 51.9 −
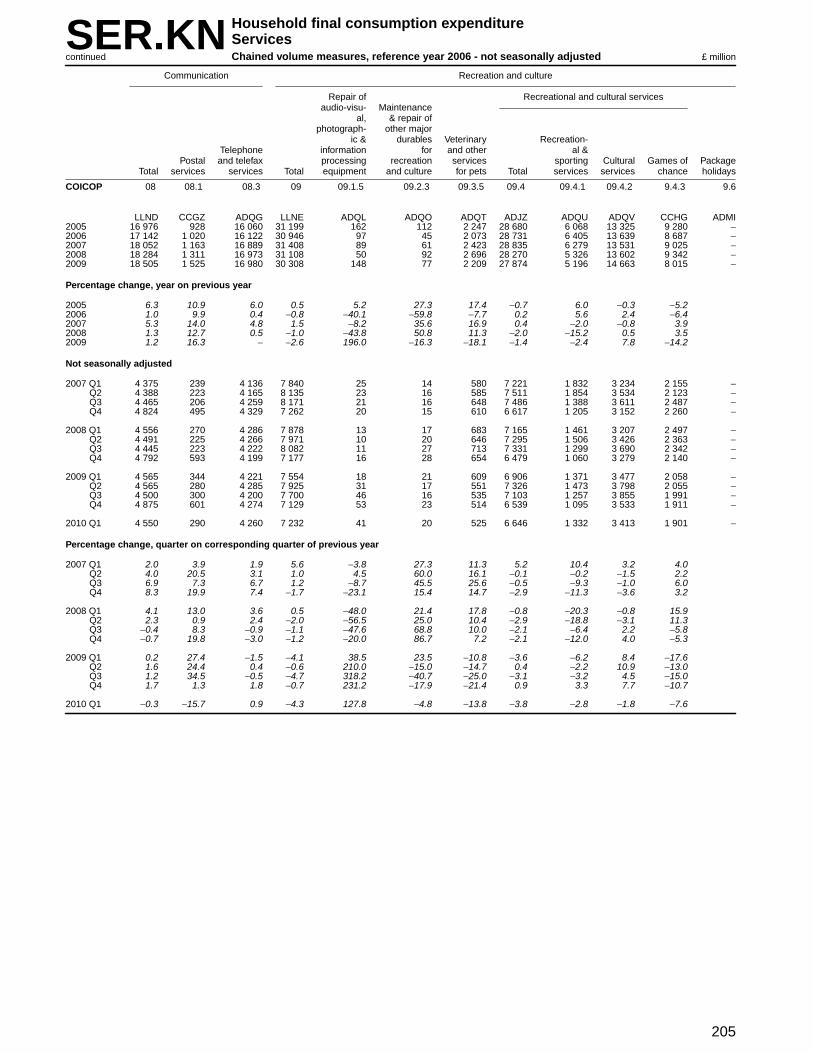
205
SER.KN Household final consumption expenditureSer vicesChained volume measures, reference year 2006 - not seasonally adjustedcontinued £ million
Communication Recreation and culture
Repair of Recreational and cultural servicesaudio-visu- Maintenance
al, & repair ofphotograph- other major
ic & durables Veter inary Recreation-Telephone infor mation for and other al &
Postal and telefax processing recreation services sporting Cultural Games of PackageTotal services services Total equipment and culture for pets Total services services chance holidays
COICOP 08 08.1 08.3 09 09.1.5 09.2.3 09.3.5 09.4 09.4.1 09.4.2 9.4.3 9.6
LLND CCGZ ADQG LLNE ADQL ADQO ADQT ADJZ ADQU ADQV CCHG ADMI2005 16 976 928 16 060 31 199 162 112 2 247 28 680 6 068 13 325 9 280 −2006 17 142 1 020 16 122 30 946 97 45 2 073 28 731 6 405 13 639 8 687 −2007 18 052 1 163 16 889 31 408 89 61 2 423 28 835 6 279 13 531 9 025 −2008 18 284 1 311 16 973 31 108 50 92 2 696 28 270 5 326 13 602 9 342 −2009 18 505 1 525 16 980 30 308 148 77 2 209 27 874 5 196 14 663 8 015 −
Percentage chang e , year on previous year
2005 6.3 10.9 6.0 0.5 5.2 27.3 17.4 −0.7 6.0 −0.3 −5.22006 1.0 9.9 0.4 −0.8 −40.1 −59.8 −7.7 0.2 5.6 2.4 −6.42007 5.3 14.0 4.8 1.5 −8.2 35.6 16.9 0.4 −2.0 −0.8 3.92008 1.3 12.7 0.5 −1.0 −43.8 50.8 11.3 −2.0 −15.2 0.5 3.52009 1.2 16.3 − −2.6 196.0 −16.3 −18.1 −1.4 −2.4 7.8 −14.2
Not seasonally adjusted
2007 Q1 4 375 239 4 136 7 840 25 14 580 7 221 1 832 3 234 2 155 −Q2 4 388 223 4 165 8 135 23 16 585 7 511 1 854 3 534 2 123 −Q3 4 465 206 4 259 8 171 21 16 648 7 486 1 388 3 611 2 487 −Q4 4 824 495 4 329 7 262 20 15 610 6 617 1 205 3 152 2 260 −
2008 Q1 4 556 270 4 286 7 878 13 17 683 7 165 1 461 3 207 2 497 −Q2 4 491 225 4 266 7 971 10 20 646 7 295 1 506 3 426 2 363 −Q3 4 445 223 4 222 8 082 11 27 713 7 331 1 299 3 690 2 342 −Q4 4 792 593 4 199 7 177 16 28 654 6 479 1 060 3 279 2 140 −
2009 Q1 4 565 344 4 221 7 554 18 21 609 6 906 1 371 3 477 2 058 −Q2 4 565 280 4 285 7 925 31 17 551 7 326 1 473 3 798 2 055 −Q3 4 500 300 4 200 7 700 46 16 535 7 103 1 257 3 855 1 991 −Q4 4 875 601 4 274 7 129 53 23 514 6 539 1 095 3 533 1 911 −
2010 Q1 4 550 290 4 260 7 232 41 20 525 6 646 1 332 3 413 1 901 −
Percentage chang e , quar ter on corresponding quarter of previous year
2007 Q1 2.0 3.9 1.9 5.6 −3.8 27.3 11.3 5.2 10.4 3.2 4.0Q2 4.0 20.5 3.1 1.0 4.5 60.0 16.1 −0.1 −0.2 −1.5 2.2Q3 6.9 7.3 6.7 1.2 −8.7 45.5 25.6 −0.5 −9.3 −1.0 6.0Q4 8.3 19.9 7.4 −1.7 −23.1 15.4 14.7 −2.9 −11.3 −3.6 3.2
2008 Q1 4.1 13.0 3.6 0.5 −48.0 21.4 17.8 −0.8 −20.3 −0.8 15.9Q2 2.3 0.9 2.4 −2.0 −56.5 25.0 10.4 −2.9 −18.8 −3.1 11.3Q3 −0.4 8.3 −0.9 −1.1 −47.6 68.8 10.0 −2.1 −6.4 2.2 −5.8Q4 −0.7 19.8 −3.0 −1.2 −20.0 86.7 7.2 −2.1 −12.0 4.0 −5.3
2009 Q1 0.2 27.4 −1.5 −4.1 38.5 23.5 −10.8 −3.6 −6.2 8.4 −17.6Q2 1.6 24.4 0.4 −0.6 210.0 −15.0 −14.7 0.4 −2.2 10.9 −13.0Q3 1.2 34.5 −0.5 −4.7 318.2 −40.7 −25.0 −3.1 −3.2 4.5 −15.0Q4 1.7 1.3 1.8 −0.7 231.2 −17.9 −21.4 0.9 3.3 7.7 −10.7
2010 Q1 −0.3 −15.7 0.9 −4.3 127.8 −4.8 −13.8 −3.8 −2.8 −1.8 −7.6

206
SER.KN Household final consumption expenditureSer vicesChained volume measures, reference year 2006 - not seasonally adjustedcontinued £ million
Restaurants and hotels
Cater ing ser vices
Restaurants, cafes AccommodationEducation Total Total etc Canteens services
COICOP 10 11 11.1 11.1.1 11.1.2 11.2
ADMJ ADMK ADML ADSR ADYF ADMM2005 11 670 88 686 77 312 69 049 8 262 11 3682006 11 711 87 812 76 072 68 074 7 998 11 7402007 11 502 87 577 75 399 67 788 7 611 12 1782008 10 971 85 249 72 864 65 500 7 364 12 3852009 10 716 80 174 68 147 61 124 7 023 12 027
Percentage chang e , year on previous year
2005 −2.1 −0.5 −0.7 −0.3 −3.7 0.72006 0.4 −1.0 −1.6 −1.4 −3.2 3.32007 −1.8 −0.3 −0.9 −0.4 −4.8 3.72008 −4.6 −2.7 −3.4 −3.4 −3.2 1.72009 −2.3 −6.0 −6.5 −6.7 −4.6 −2.9
Not seasonally adjusted
2007 Q1 2 869 19 504 17 366 15 303 2 063 2 138Q2 2 935 22 479 19 391 17 437 1 954 3 088Q3 2 919 23 533 19 267 17 684 1 583 4 266Q4 2 779 22 061 19 375 17 364 2 011 2 686
2008 Q1 2 801 19 247 17 047 15 228 1 819 2 200Q2 2 777 21 812 18 757 16 845 1 912 3 055Q3 2 787 23 093 18 754 17 114 1 640 4 339Q4 2 606 21 097 18 306 16 313 1 993 2 791
2009 Q1 2 686 17 975 15 855 14 103 1 752 2 120Q2 2 709 20 178 17 227 15 489 1 738 2 951Q3 2 709 21 725 17 552 15 972 1 580 4 173Q4 2 612 20 296 17 513 15 560 1 953 2 783
2010 Q1 2 646 17 511 15 474 13 756 1 718 2 037
Percentage chang e , quar ter on corresponding quarter of previous year
2007 Q1 −0.7 1.2 0.4 0.9 −3.4 9.2Q2 −0.8 1.1 0.2 0.5 −2.9 7.0Q3 −3.0 −1.7 −2.6 −2.0 −9.0 2.2Q4 −2.7 −1.3 −1.3 −0.9 −4.7 −1.3
2008 Q1 −2.4 −1.3 −1.8 −0.5 −11.8 2.9Q2 −5.4 −3.0 −3.3 −3.4 −2.1 −1.1Q3 −4.5 −1.9 −2.7 −3.2 3.6 1.7Q4 −6.2 −4.4 −5.5 −6.1 −0.9 3.9
2009 Q1 −4.1 −6.6 −7.0 −7.4 −3.7 −3.6Q2 −2.4 −7.5 −8.2 −8.0 −9.1 −3.4Q3 −2.8 −5.9 −6.4 −6.7 −3.7 −3.8Q4 0.2 −3.8 −4.3 −4.6 −2.0 −0.3
2010 Q1 −1.5 −2.6 −2.4 −2.5 −1.9 −3.9
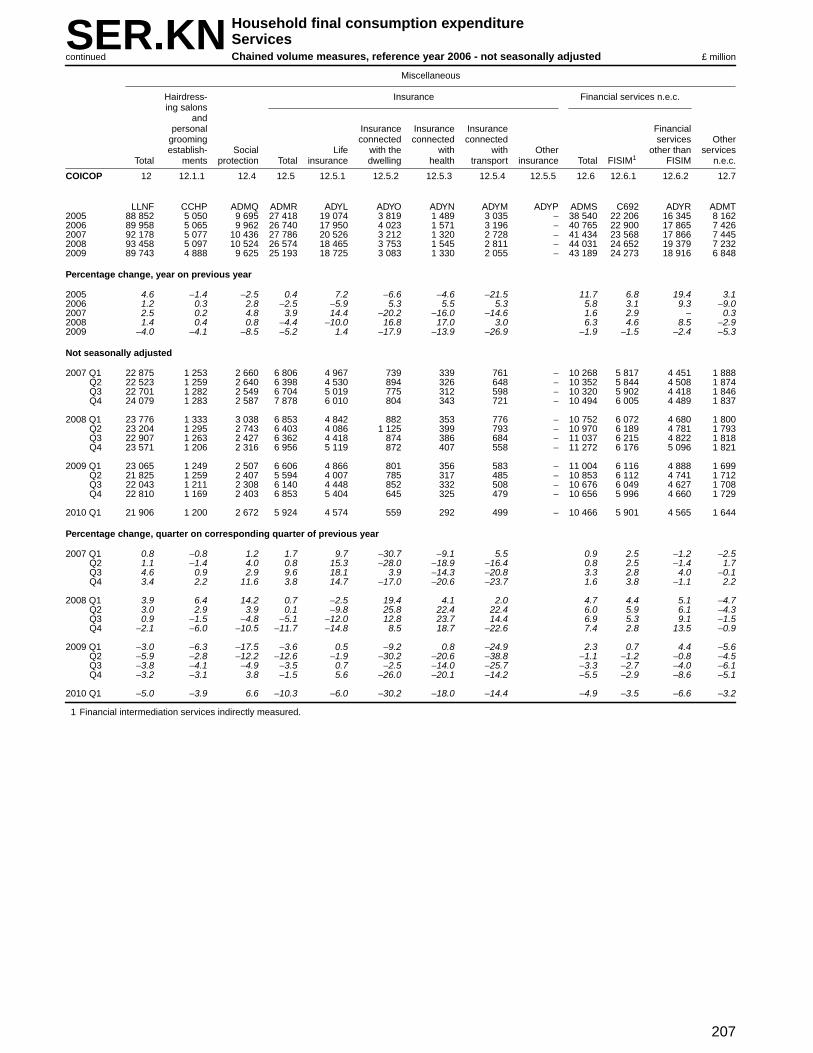
207
SER.KN Household final consumption expenditureSer vicesChained volume measures, reference year 2006 - not seasonally adjustedcontinued £ million
Miscellaneous
Hairdress- Insurance Financial ser vices n.e.c.ing salons
andpersonal Insurance Insurance Insurance Financial
grooming connected connected connected ser vices Otherestablish- Social Life with the with with Other other than services
Total ments protection Total insurance dwelling health transpor t insurance Total FISIM1 FISIM n.e.c.
COICOP 12 12.1.1 12.4 12.5 12.5.1 12.5.2 12.5.3 12.5.4 12.5.5 12.6 12.6.1 12.6.2 12.7
LLNF CCHP ADMQ ADMR ADYL ADYO ADYN ADYM ADYP ADMS C692 ADYR ADMT2005 88 852 5 050 9 695 27 418 19 074 3 819 1 489 3 035 − 38 540 22 206 16 345 8 1622006 89 958 5 065 9 962 26 740 17 950 4 023 1 571 3 196 − 40 765 22 900 17 865 7 4262007 92 178 5 077 10 436 27 786 20 526 3 212 1 320 2 728 − 41 434 23 568 17 866 7 4452008 93 458 5 097 10 524 26 574 18 465 3 753 1 545 2 811 − 44 031 24 652 19 379 7 2322009 89 743 4 888 9 625 25 193 18 725 3 083 1 330 2 055 − 43 189 24 273 18 916 6 848
Percentage chang e , year on previous year
2005 4.6 −1.4 −2.5 0.4 7.2 −6.6 −4.6 −21.5 11.7 6.8 19.4 3.12006 1.2 0.3 2.8 −2.5 −5.9 5.3 5.5 5.3 5.8 3.1 9.3 −9.02007 2.5 0.2 4.8 3.9 14.4 −20.2 −16.0 −14.6 1.6 2.9 − 0.32008 1.4 0.4 0.8 −4.4 −10.0 16.8 17.0 3.0 6.3 4.6 8.5 −2.92009 −4.0 −4.1 −8.5 −5.2 1.4 −17.9 −13.9 −26.9 −1.9 −1.5 −2.4 −5.3
Not seasonally adjusted
2007 Q1 22 875 1 253 2 660 6 806 4 967 739 339 761 − 10 268 5 817 4 451 1 888Q2 22 523 1 259 2 640 6 398 4 530 894 326 648 − 10 352 5 844 4 508 1 874Q3 22 701 1 282 2 549 6 704 5 019 775 312 598 − 10 320 5 902 4 418 1 846Q4 24 079 1 283 2 587 7 878 6 010 804 343 721 − 10 494 6 005 4 489 1 837
2008 Q1 23 776 1 333 3 038 6 853 4 842 882 353 776 − 10 752 6 072 4 680 1 800Q2 23 204 1 295 2 743 6 403 4 086 1 125 399 793 − 10 970 6 189 4 781 1 793Q3 22 907 1 263 2 427 6 362 4 418 874 386 684 − 11 037 6 215 4 822 1 818Q4 23 571 1 206 2 316 6 956 5 119 872 407 558 − 11 272 6 176 5 096 1 821
2009 Q1 23 065 1 249 2 507 6 606 4 866 801 356 583 − 11 004 6 116 4 888 1 699Q2 21 825 1 259 2 407 5 594 4 007 785 317 485 − 10 853 6 112 4 741 1 712Q3 22 043 1 211 2 308 6 140 4 448 852 332 508 − 10 676 6 049 4 627 1 708Q4 22 810 1 169 2 403 6 853 5 404 645 325 479 − 10 656 5 996 4 660 1 729
2010 Q1 21 906 1 200 2 672 5 924 4 574 559 292 499 − 10 466 5 901 4 565 1 644
Percentage chang e , quar ter on corresponding quarter of previous year
2007 Q1 0.8 −0.8 1.2 1.7 9.7 −30.7 −9.1 5.5 0.9 2.5 −1.2 −2.5Q2 1.1 −1.4 4.0 0.8 15.3 −28.0 −18.9 −16.4 0.8 2.5 −1.4 1.7Q3 4.6 0.9 2.9 9.6 18.1 3.9 −14.3 −20.8 3.3 2.8 4.0 −0.1Q4 3.4 2.2 11.6 3.8 14.7 −17.0 −20.6 −23.7 1.6 3.8 −1.1 2.2
2008 Q1 3.9 6.4 14.2 0.7 −2.5 19.4 4.1 2.0 4.7 4.4 5.1 −4.7Q2 3.0 2.9 3.9 0.1 −9.8 25.8 22.4 22.4 6.0 5.9 6.1 −4.3Q3 0.9 −1.5 −4.8 −5.1 −12.0 12.8 23.7 14.4 6.9 5.3 9.1 −1.5Q4 −2.1 −6.0 −10.5 −11.7 −14.8 8.5 18.7 −22.6 7.4 2.8 13.5 −0.9
2009 Q1 −3.0 −6.3 −17.5 −3.6 0.5 −9.2 0.8 −24.9 2.3 0.7 4.4 −5.6Q2 −5.9 −2.8 −12.2 −12.6 −1.9 −30.2 −20.6 −38.8 −1.1 −1.2 −0.8 −4.5Q3 −3.8 −4.1 −4.9 −3.5 0.7 −2.5 −14.0 −25.7 −3.3 −2.7 −4.0 −6.1Q4 −3.2 −3.1 3.8 −1.5 5.6 −26.0 −20.1 −14.2 −5.5 −2.9 −8.6 −5.1
2010 Q1 −5.0 −3.9 6.6 −10.3 −6.0 −30.2 −18.0 −14.4 −4.9 −3.5 −6.6 −3.2
1 Financial intermediation services indirectly measured.

208
SER.KS Household final consumption expenditureSer vicesChained volume measures, reference year 2006 - seasonally adjusted £ million
Clothing and footwear Housing, water, electr icity, gas and other fuels
Actual rentals for housing Imputed rentals for housing Ser vicesfor the
Cleaning, Imputed maintena- Otherrepair Actual rentals nce & ser vices
and hire Repair & rentals Other of Other repair of Refuse Sewerage relatingof hire of paid by actual owner-oc- imputed the collecti- collecti- to the
Total Total clothing footwear Total Total tenants rentals Total cupiers rentals dwelling on on dwelling
COICOP S 03 03.1.4 03.2.2 04 04.1 04.1.1 04.1.2 04.2 04.2.1 04.2.2 04.3.2 04.4.2 04.4.3 04.4.4
UTIP LLLR UWHI AWUY LLLS ZAVQ GBFG UWHJ GBFK CCUO GBFN AWUZ UWHK UTZX UWHL2005 421 100 800 738 63 121 984 30 466 30 466 − 80 422 77 261 3 161 7 131 110 3 559 −2006 424 415 839 766 73 124 455 32 716 32 716 − 80 668 77 814 2 854 7 392 146 3 533 −2007 429 888 887 811 76 125 050 33 567 33 567 − 80 461 77 702 2 759 7 252 102 3 668 −2008 429 649 984 907 77 126 619 34 961 34 961 − 80 920 78 306 2 614 7 023 106 3 609 −2009 418 520 979 896 83 127 779 35 403 35 403 − 81 986 79 196 2 790 6 808 93 3 489 −
Percentage chang e , year on previous year
2005 1.9 3.9 5.7 −11.3 1.0 −1.1 −1.1 1.7 1.0 23.4 2.4 8.9 4.02006 0.8 4.9 3.8 15.9 2.0 7.4 7.4 0.3 0.7 −9.7 3.7 32.7 −0.72007 1.3 5.7 5.9 4.1 0.5 2.6 2.6 −0.3 −0.1 −3.3 −1.9 −30.1 3.82008 −0.1 10.9 11.8 1.3 1.3 4.2 4.2 0.6 0.8 −5.3 −3.2 3.9 −1.62009 −2.6 −0.5 −1.2 7.8 0.9 1.3 1.3 1.3 1.1 6.7 −3.1 −12.3 −3.3
Seasonally adjusted
2007 Q1 107 518 226 207 19 31 480 8 412 8 412 − 20 147 19 411 736 1 993 38 890 −Q2 107 646 220 202 18 31 368 8 396 8 396 − 20 101 19 361 740 1 939 26 906 −Q3 107 151 223 202 21 30 921 8 364 8 364 − 20 131 19 443 688 1 478 18 930 −Q4 107 573 218 200 18 31 281 8 395 8 395 − 20 082 19 487 595 1 842 20 942 −
2008 Q1 108 494 212 194 18 31 283 8 592 8 592 − 20 099 19 507 592 1 646 25 921 −Q2 107 883 235 218 17 31 499 8 675 8 675 − 20 144 19 517 627 1 739 30 911 −Q3 107 422 270 249 21 31 814 8 769 8 769 − 20 289 19 608 681 1 833 28 895 −Q4 105 850 267 246 21 32 023 8 925 8 925 − 20 388 19 674 714 1 805 23 882 −
2009 Q1 105 613 257 237 20 31 789 8 535 8 535 − 20 492 19 767 725 1 862 25 875 −Q2 104 628 237 217 20 32 028 8 900 8 900 − 20 502 19 815 687 1 739 21 866 −Q3 104 434 237 217 20 31 984 9 060 9 060 − 20 498 19 821 677 1 533 23 870 −Q4 103 845 248 225 23 31 978 8 908 8 908 − 20 494 19 793 701 1 674 24 878 −
2010 Q1 102 958 245 222 23 31 577 8 735 8 735 − 20 131 19 469 662 1 805 24 882 −
Percentage chang e , quar ter on previous quarter
2007 Q1 0.6 2.7 3.5 −5.0 − 1.3 1.3 −0.9 −0.7 −7.2 2.6 −19.1 1.6Q2 0.1 −2.7 −2.4 −5.3 −0.4 −0.2 −0.2 −0.2 −0.3 0.5 −2.7 −31.6 1.8Q3 −0.5 1.4 − 16.7 −1.4 −0.4 −0.4 0.1 0.4 −7.0 −23.8 −30.8 2.6Q4 0.4 −2.2 −1.0 −14.3 1.2 0.4 0.4 −0.2 0.2 −13.5 24.6 11.1 1.3
2008 Q1 0.9 −2.8 −3.0 − − 2.3 2.3 0.1 0.1 −0.5 −10.6 25.0 −2.2Q2 −0.6 10.8 12.4 −5.6 0.7 1.0 1.0 0.2 0.1 5.9 5.7 20.0 −1.1Q3 −0.4 14.9 14.2 23.5 1.0 1.1 1.1 0.7 0.5 8.6 5.4 −6.7 −1.8Q4 −1.5 −1.1 −1.2 − 0.7 1.8 1.8 0.5 0.3 4.8 −1.5 −17.9 −1.5
2009 Q1 −0.2 −3.7 −3.7 −4.8 −0.7 −4.4 −4.4 0.5 0.5 1.5 3.2 8.7 −0.8Q2 −0.9 −7.8 −8.4 − 0.8 4.3 4.3 − 0.2 −5.2 −6.6 −16.0 −1.0Q3 −0.2 − − − −0.1 1.8 1.8 − − −1.5 −11.8 9.5 0.5Q4 −0.6 4.6 3.7 15.0 − −1.7 −1.7 − −0.1 3.5 9.2 4.3 0.9
2010 Q1 −0.9 −1.2 −1.3 − −1.3 −1.9 −1.9 −1.8 −1.6 −5.6 7.8 − 0.5
Percentage chang e , quar ter on corresponding quarter of previous year
2007 Q1 2.0 14.7 14.4 18.8 2.3 3.8 3.8 0.6 0.1 14.5 16.2 81.0 −0.4Q2 1.6 5.8 5.8 5.9 1.4 3.4 3.4 − −0.5 13.8 8.3 −23.5 2.5Q3 1.0 4.2 4.1 5.0 −1.1 2.2 2.2 −0.4 − −10.4 −24.0 −59.1 5.8Q4 0.6 −0.9 − −10.0 −0.7 1.1 1.1 −1.2 −0.3 −25.0 −5.2 −57.4 7.5
2008 Q1 0.9 −6.2 −6.3 −5.3 −0.6 2.1 2.1 −0.2 0.5 −19.6 −17.4 −34.2 3.5Q2 0.2 6.8 7.9 −5.6 0.4 3.3 3.3 0.2 0.8 −15.3 −10.3 15.4 0.6Q3 0.3 21.1 23.3 − 2.9 4.8 4.8 0.8 0.8 −1.0 24.0 55.6 −3.8Q4 −1.6 22.5 23.0 16.7 2.4 6.3 6.3 1.5 1.0 20.0 −2.0 15.0 −6.4
2009 Q1 −2.7 21.2 22.2 11.1 1.6 −0.7 −0.7 2.0 1.3 22.5 13.1 − −5.0Q2 −3.0 0.9 −0.5 17.6 1.7 2.6 2.6 1.8 1.5 9.6 − −30.0 −4.9Q3 −2.8 −12.2 −12.9 −4.8 0.5 3.3 3.3 1.0 1.1 −0.6 −16.4 −17.9 −2.8Q4 −1.9 −7.1 −8.5 9.5 −0.1 −0.2 −0.2 0.5 0.6 −1.8 −7.3 4.3 −0.5
2010 Q1 −2.5 −4.7 −6.3 15.0 −0.7 2.3 2.3 −1.8 −1.5 −8.7 −3.1 −4.0 0.8

209
SER.KS Household final consumption expenditureSer vicesChained volume measures, reference year 2006 - seasonally adjustedcontinued £ million
Fur nishing & household services Health
Repair of Out-patient servicesfur niture,
fur nishings & Repair of Domestic &floor household household Medical Dental Paramedical Hospital
Total coverings appliances ser vices Total Total services services services services
COICOP 05 05.1.3 05.3.3 05.6.2 06 06.2 06.2.1 06.2.2 06.2.3 06.3
LLLT UWHM UWHN UWIA LLLU ZAWG ZAWI ZAWK UTMH UTYF2005 4 325 57 561 3 708 5 610 3 034 1 079 1 434 521 2 5772006 3 842 51 542 3 249 6 227 3 483 1 138 1 719 626 2 7442007 3 309 36 550 2 723 6 320 3 684 1 228 1 970 486 2 6362008 3 248 41 442 2 765 6 147 3 324 1 017 1 778 529 2 8232009 2 982 47 426 2 509 5 768 2 949 894 1 567 488 2 819
Percentage chang e , year on previous year
2005 2.7 103.6 −7.6 3.6 3.8 4.2 0.3 3.5 16.3 3.32006 −11.2 −10.5 −3.4 −12.4 11.0 14.8 5.5 19.9 20.2 6.52007 −13.9 −29.4 1.5 −16.2 1.5 5.8 7.9 14.6 −22.4 −3.92008 −1.8 13.9 −19.6 1.5 −2.7 −9.8 −17.2 −9.7 8.8 7.12009 −8.2 14.6 −3.6 −9.3 −6.2 −11.3 −12.1 −11.9 −7.8 −0.1
Seasonally adjusted
2007 Q1 867 8 163 696 1 606 932 298 505 129 674Q2 844 9 147 688 1 627 970 315 529 126 657Q3 817 11 131 675 1 565 912 316 477 119 653Q4 781 8 109 664 1 522 870 299 459 112 652
2008 Q1 795 5 111 679 1 538 860 299 444 117 678Q2 799 5 105 689 1 552 851 276 454 121 701Q3 824 15 109 700 1 569 851 245 470 136 718Q4 830 16 117 697 1 488 762 197 410 155 726
2009 Q1 770 9 107 654 1 505 780 229 416 135 725Q2 735 10 104 621 1 457 742 220 396 126 715Q3 726 12 111 603 1 423 728 225 387 116 695Q4 751 16 104 631 1 383 699 220 368 111 684
2010 Q1 792 15 108 669 1 350 661 200 349 112 689
Percentage chang e , quar ter on previous quarter
2007 Q1 −1.5 14.3 12.4 −4.4 −2.6 −2.7 3.1 −5.1 −6.5 −2.3Q2 −2.7 12.5 −9.8 −1.1 1.3 4.1 5.7 4.8 −2.3 −2.5Q3 −3.2 22.2 −10.9 −1.9 −3.8 −6.0 0.3 −9.8 −5.6 −0.6Q4 −4.4 −27.3 −16.8 −1.6 −2.7 −4.6 −5.4 −3.8 −5.9 −0.2
2008 Q1 1.8 −37.5 1.8 2.3 1.1 −1.1 − −3.3 4.5 4.0Q2 0.5 − −5.4 1.5 0.9 −1.0 −7.7 2.3 3.4 3.4Q3 3.1 200.0 3.8 1.6 1.1 − −11.2 3.5 12.4 2.4Q4 0.7 6.7 7.3 −0.4 −5.2 −10.5 −19.6 −12.8 14.0 1.1
2009 Q1 −7.2 −43.8 −8.5 −6.2 1.1 2.4 16.2 1.5 −12.9 −0.1Q2 −4.5 11.1 −2.8 −5.0 −3.2 −4.9 −3.9 −4.8 −6.7 −1.4Q3 −1.2 20.0 6.7 −2.9 −2.3 −1.9 2.3 −2.3 −7.9 −2.8Q4 3.4 33.3 −6.3 4.6 −2.8 −4.0 −2.2 −4.9 −4.3 −1.6
2010 Q1 5.5 −6.2 3.8 6.0 −2.4 −5.4 −9.1 −5.2 0.9 0.7
Percentage chang e , quar ter on corresponding quarter of previous year
2007 Q1 −14.5 −60.0 31.5 −20.0 7.1 12.3 1.7 38.7 −25.4 0.6Q2 −16.4 −35.7 5.8 −19.7 6.5 15.8 10.9 36.3 −23.6 −4.6Q3 −12.9 10.0 −2.2 −15.0 0.8 6.4 16.2 9.7 −20.7 −6.0Q4 −11.3 14.3 −24.8 −8.8 −7.7 −9.2 3.5 −13.7 −18.8 −5.5
2008 Q1 −8.3 −37.5 −31.9 −2.4 −4.2 −7.7 0.3 −12.1 −9.3 0.6Q2 −5.3 −44.4 −28.6 0.1 −4.6 −12.3 −12.4 −14.2 −4.0 6.7Q3 0.9 36.4 −16.8 3.7 0.3 −6.7 −22.5 −1.5 14.3 10.0Q4 6.3 100.0 7.3 5.0 −2.2 −12.4 −34.1 −10.7 38.4 11.3
2009 Q1 −3.1 80.0 −3.6 −3.7 −2.1 −9.3 −23.4 −6.3 15.4 6.9Q2 −8.0 100.0 −1.0 −9.9 −6.1 −12.8 −20.3 −12.8 4.1 2.0Q3 −11.9 −20.0 1.8 −13.9 −9.3 −14.5 −8.2 −17.7 −14.7 −3.2Q4 −9.5 − −11.1 −9.5 −7.1 −8.3 11.7 −10.2 −28.4 −5.8
2010 Q1 2.9 66.7 0.9 2.3 −10.3 −15.3 −12.7 −16.1 −17.0 −5.0

210
SER.KS Household final consumption expenditureSer vicesChained volume measures, reference year 2006 - seasonally adjustedcontinued £ million
Tr anspor t ser vicesVehicle
maintenance and Other vehicle Sea & inlandTotal repair ser vices Total Railways Road Air waterway Other
COICOP 07 07.2.3 07.2.4 07.3 07.3.1 07.3.2 07.3.3 07.3.4 07.3.6
LLLV AWVA ZAWQ ZAWS AWVB ZAWU AWVC AWVD AWVE2005 51 000 16 375 5 070 29 592 5 043 8 151 12 439 2 502 1 4662006 51 483 15 541 5 259 30 683 4 972 8 350 13 015 2 804 1 5422007 53 605 14 912 5 396 33 297 5 668 8 386 14 559 3 244 1 4402008 53 581 14 336 5 710 33 535 5 883 8 306 14 524 3 546 1 2762009 51 566 15 303 5 222 31 041 5 696 7 379 12 805 4 118 1 043
Percentage chang e , year on previous year
2005 4.0 3.6 4.0 4.2 0.5 1.7 6.4 7.8 6.22006 0.9 −5.1 3.7 3.7 −1.4 2.4 4.6 12.1 5.22007 4.1 −4.0 2.6 8.5 14.0 0.4 11.9 15.7 −6.62008 − −3.9 5.8 0.7 3.8 −1.0 −0.2 9.3 −11.42009 −3.8 6.7 −8.5 −7.4 −3.2 −11.2 −11.8 16.1 −18.3
Seasonally adjusted
2007 Q1 13 228 3 913 1 330 7 985 1 326 2 050 3 407 827 375Q2 13 188 3 841 1 289 8 058 1 366 2 094 3 511 770 317Q3 13 422 3 692 1 371 8 359 1 462 2 112 3 654 754 377Q4 13 767 3 466 1 406 8 895 1 514 2 130 3 987 893 371
2008 Q1 13 838 3 446 1 461 8 931 1 511 2 164 3 978 926 352Q2 13 572 3 444 1 489 8 639 1 508 2 110 3 689 989 343Q3 13 233 3 642 1 426 8 165 1 461 2 063 3 450 893 298Q4 12 938 3 804 1 334 7 800 1 403 1 969 3 407 738 283
2009 Q1 12 909 3 794 1 348 7 767 1 427 1 912 3 279 894 255Q2 12 931 3 814 1 309 7 808 1 403 1 830 3 236 1 075 264Q3 12 902 3 872 1 279 7 751 1 432 1 812 3 134 1 112 261Q4 12 824 3 823 1 286 7 715 1 434 1 825 3 156 1 037 263
2010 Q1 12 663 3 611 1 348 7 704 1 411 1 861 3 106 1 070 256
Percentage chang e , quar ter on previous quarter
2007 Q1 1.3 2.1 −0.2 1.2 4.2 −2.8 −0.2 15.5 −0.3Q2 −0.3 −1.8 −3.1 0.9 3.0 2.1 3.1 −6.9 −15.5Q3 1.8 −3.9 6.4 3.7 7.0 0.9 4.1 −2.1 18.9Q4 2.6 −6.1 2.6 6.4 3.6 0.9 9.1 18.4 −1.6
2008 Q1 0.5 −0.6 3.9 0.4 −0.2 1.6 −0.2 3.7 −5.1Q2 −1.9 −0.1 1.9 −3.3 −0.2 −2.5 −7.3 6.8 −2.6Q3 −2.5 5.7 −4.2 −5.5 −3.1 −2.2 −6.5 −9.7 −13.1Q4 −2.2 4.4 −6.5 −4.5 −4.0 −4.6 −1.2 −17.4 −5.0
2009 Q1 −0.2 −0.3 1.0 −0.4 1.7 −2.9 −3.8 21.1 −9.9Q2 0.2 0.5 −2.9 0.5 −1.7 −4.3 −1.3 20.2 3.5Q3 −0.2 1.5 −2.3 −0.7 2.1 −1.0 −3.2 3.4 −1.1Q4 −0.6 −1.3 0.5 −0.5 0.1 0.7 0.7 −6.7 0.8
2010 Q1 −1.3 −5.5 4.8 −0.1 −1.6 2.0 −1.6 3.2 −2.7
Percentage chang e , quar ter on corresponding quarter of previous year
2007 Q1 3.3 −0.4 1.8 5.4 6.7 2.1 6.8 10.6 −1.8Q2 2.5 −1.5 −2.0 5.3 11.0 −0.9 9.7 8.5 −20.9Q3 5.2 −4.9 5.1 10.5 19.3 −0.4 13.8 19.7 −1.6Q4 5.5 −9.6 5.6 12.8 18.9 1.0 16.8 24.7 −1.3
2008 Q1 4.6 −11.9 9.8 11.8 14.0 5.6 16.8 12.0 −6.1Q2 2.9 −10.3 15.5 7.2 10.4 0.8 5.1 28.4 8.2Q3 −1.4 −1.4 4.0 −2.3 −0.1 −2.3 −5.6 18.4 −21.0Q4 −6.0 9.8 −5.1 −12.3 −7.3 −7.6 −14.5 −17.4 −23.7
2009 Q1 −6.7 10.1 −7.7 −13.0 −5.6 −11.6 −17.6 −3.5 −27.6Q2 −4.7 10.7 −12.1 −9.6 −7.0 −13.3 −12.3 8.7 −23.0Q3 −2.5 6.3 −10.3 −5.1 −2.0 −12.2 −9.2 24.5 −12.4Q4 −0.9 0.5 −3.6 −1.1 2.2 −7.3 −7.4 40.5 −7.1
2010 Q1 −1.9 −4.8 − −0.8 −1.1 −2.7 −5.3 19.7 0.4

211
SER.KS Household final consumption expenditureSer vicesChained volume measures, reference year 2006 - seasonally adjustedcontinued £ million
Communication Recreation and culture
Repair of Recreational and cultural servicesaudio-visu- Maintenance
al, & repair ofphotograph- other major
ic & durables Veter inary Recreation-Telephone infor mation for and other al &
Postal and telefax processing recreation services sporting Cultural Games of PackageTotal services services Total equipment and culture for pets Total services services chance holidays
COICOP 08 08.1 08.3 09 09.1.5 09.2.3 09.3.5 09.4 09.4.1 09.4.2 9.4.3 9.6
LLLW CCVM ZAWY LLLX UWKO UWKP UWLD ZAXI ZAXK ZAXM CCVA ZAXQ2005 16 976 928 16 060 31 199 162 112 2 247 28 680 6 068 13 325 9 279 −2006 17 142 1 020 16 122 30 946 97 45 2 073 28 731 6 405 13 639 8 687 −2007 18 052 1 163 16 889 31 408 89 61 2 423 28 835 6 279 13 531 9 025 −2008 18 284 1 311 16 973 31 108 50 92 2 696 28 270 5 326 13 602 9 342 −2009 18 505 1 525 16 980 30 308 148 77 2 209 27 874 5 196 14 663 8 015 −
Percentage chang e , year on previous year
2005 6.3 10.9 6.0 0.5 5.2 27.3 17.4 −0.7 6.0 −0.3 −5.22006 1.0 9.9 0.4 −0.8 −40.1 −59.8 −7.7 0.2 5.6 2.4 −6.42007 5.3 14.0 4.8 1.5 −8.2 35.6 16.9 0.4 −2.0 −0.8 3.92008 1.3 12.7 0.5 −1.0 −43.8 50.8 11.3 −2.0 −15.2 0.5 3.52009 1.2 16.3 − −2.6 196.0 −16.3 −18.1 −1.4 −2.4 7.8 −14.2
Seasonally adjusted
2007 Q1 4 404 276 4 128 7 991 25 14 577 7 375 1 757 3 419 2 199 −Q2 4 469 306 4 163 7 782 24 16 595 7 147 1 635 3 421 2 091 −Q3 4 557 283 4 274 8 005 21 16 629 7 339 1 445 3 425 2 469 −Q4 4 622 298 4 324 7 630 19 15 622 6 974 1 442 3 266 2 266 −
2008 Q1 4 599 315 4 284 8 044 13 17 679 7 335 1 391 3 406 2 538 −Q2 4 579 320 4 259 7 646 11 21 658 6 956 1 329 3 304 2 323 −Q3 4 555 315 4 240 7 906 11 27 691 7 177 1 351 3 492 2 334 −Q4 4 551 361 4 190 7 512 15 27 668 6 802 1 255 3 400 2 147 −
2009 Q1 4 611 386 4 225 7 730 19 21 608 7 082 1 307 3 690 2 085 −Q2 4 651 378 4 273 7 595 33 18 561 6 983 1 300 3 662 2 021 −Q3 4 622 404 4 218 7 538 46 16 516 6 960 1 303 3 667 1 990 −Q4 4 621 357 4 264 7 445 50 22 524 6 849 1 286 3 644 1 919 −
2010 Q1 4 612 343 4 269 7 402 43 20 525 6 814 1 278 3 613 1 923 −
Percentage chang e , quar ter on previous quarter
2007 Q1 3.2 13.6 2.6 2.3 − 7.7 6.5 2.0 8.4 0.2 0.2Q2 1.5 10.9 0.8 −2.6 −4.0 14.3 3.1 −3.1 −6.9 0.1 −4.9Q3 2.0 −7.5 2.7 2.9 −12.5 − 5.7 2.7 −11.6 0.1 18.1Q4 1.4 5.3 1.2 −4.7 −9.5 −6.2 −1.1 −5.0 −0.2 −4.6 −8.2
2008 Q1 −0.5 5.7 −0.9 5.4 −31.6 13.3 9.2 5.2 −3.5 4.3 12.0Q2 −0.4 1.6 −0.6 −4.9 −15.4 23.5 −3.1 −5.2 −4.5 −3.0 −8.5Q3 −0.5 −1.6 −0.4 3.4 − 28.6 5.0 3.2 1.7 5.7 0.5Q4 −0.1 14.6 −1.2 −5.0 36.4 − −3.3 −5.2 −7.1 −2.6 −8.0
2009 Q1 1.3 6.9 0.8 2.9 26.7 −22.2 −9.0 4.1 4.1 8.5 −2.9Q2 0.9 −2.1 1.1 −1.7 73.7 −14.3 −7.7 −1.4 −0.5 −0.8 −3.1Q3 −0.6 6.9 −1.3 −0.8 39.4 −11.1 −8.0 −0.3 0.2 0.1 −1.5Q4 − −11.6 1.1 −1.2 8.7 37.5 1.6 −1.6 −1.3 −0.6 −3.6
2010 Q1 −0.2 −3.9 0.1 −0.6 −14.0 −9.1 0.2 −0.5 −0.6 −0.9 0.2
Percentage chang e , quar ter on corresponding quarter of previous year
2007 Q1 2.2 6.6 2.0 5.8 −3.8 27.3 11.4 5.3 10.1 4.0 3.8Q2 4.1 20.9 3.0 1.4 4.3 60.0 16.7 0.2 1.0 −1.3 2.0Q3 6.7 6.8 6.7 1.3 −8.7 45.5 25.0 −0.4 −7.9 −1.4 6.2Q4 8.3 22.6 7.4 −2.3 −24.0 15.4 14.8 −3.5 −11.0 −4.3 3.2
2008 Q1 4.4 14.1 3.8 0.7 −48.0 21.4 17.7 −0.5 −20.8 −0.4 15.4Q2 2.5 4.6 2.3 −1.7 −54.2 31.2 10.6 −2.7 −18.7 −3.4 11.1Q3 − 11.3 −0.8 −1.2 −47.6 68.8 9.9 −2.2 −6.5 2.0 −5.5Q4 −1.5 21.1 −3.1 −1.5 −21.1 80.0 7.4 −2.5 −13.0 4.1 −5.3
2009 Q1 0.3 22.5 −1.4 −3.9 46.2 23.5 −10.5 −3.4 −6.0 8.3 −17.8Q2 1.6 18.1 0.3 −0.7 200.0 −14.3 −14.7 0.4 −2.2 10.8 −13.0Q3 1.5 28.3 −0.5 −4.7 318.2 −40.7 −25.3 −3.0 −3.6 5.0 −14.7Q4 1.5 −1.1 1.8 −0.9 233.3 −18.5 −21.6 0.7 2.5 7.2 −10.6
2010 Q1 − −11.1 1.0 −4.2 126.3 −4.8 −13.7 −3.8 −2.2 −2.1 −7.8

212
SER.KS Household final consumption expenditureSer vicesChained volume measures, reference year 2006 - seasonally adjustedcontinued £ million
Restaurants and hotels
Cater ing ser vices
Restaurants, cafes AccommodationEducation Total Total etc Canteens services
COICOP 10 11 11.1 11.1.1 11.1.2 11.2
ZWUT ZAXS ZAXU ZAXW ZAYC ZAYE2005 11 670 88 686 77 312 69 049 8 262 11 3682006 11 711 87 812 76 072 68 074 7 998 11 7402007 11 502 87 577 75 399 67 788 7 611 12 1782008 10 971 85 249 72 864 65 500 7 364 12 3852009 10 716 80 174 68 147 61 124 7 023 12 027
Percentage chang e , year on previous year
2005 −2.1 −0.5 −0.7 −0.3 −3.7 0.72006 0.4 −1.0 −1.6 −1.4 −3.2 3.32007 −1.8 −0.3 −0.9 −0.4 −4.8 3.72008 −4.6 −2.7 −3.4 −3.4 −3.2 1.72009 −2.3 −6.0 −6.5 −6.7 −4.6 −2.9
Seasonally adjusted
2007 Q1 2 869 22 024 18 937 16 926 2 011 3 087Q2 2 935 22 217 19 070 17 123 1 947 3 147Q3 2 919 21 684 18 656 16 856 1 800 3 028Q4 2 779 21 652 18 736 16 883 1 853 2 916
2008 Q1 2 802 21 765 18 591 16 805 1 786 3 174Q2 2 777 21 543 18 441 16 537 1 904 3 102Q3 2 787 21 156 18 101 16 248 1 853 3 055Q4 2 605 20 785 17 731 15 910 1 821 3 054
2009 Q1 2 686 20 367 17 287 15 555 1 732 3 080Q2 2 709 19 927 16 961 15 227 1 734 2 966Q3 2 709 19 866 16 905 15 128 1 777 2 961Q4 2 612 20 014 16 994 15 214 1 780 3 020
2010 Q1 2 646 19 877 16 893 15 182 1 711 2 984
Percentage chang e , quar ter on previous quarter
2007 Q1 0.5 0.4 −0.2 −0.6 2.6 4.5Q2 2.3 0.9 0.7 1.2 −3.2 1.9Q3 −0.5 −2.4 −2.2 −1.6 −7.6 −3.8Q4 −4.8 −0.1 0.4 0.2 2.9 −3.7
2008 Q1 0.8 0.5 −0.8 −0.5 −3.6 8.8Q2 −0.9 −1.0 −0.8 −1.6 6.6 −2.3Q3 0.4 −1.8 −1.8 −1.7 −2.7 −1.5Q4 −6.5 −1.8 −2.0 −2.1 −1.7 −
2009 Q1 3.1 −2.0 −2.5 −2.2 −4.9 0.9Q2 0.9 −2.2 −1.9 −2.1 0.1 −3.7Q3 − −0.3 −0.3 −0.7 2.5 −0.2Q4 −3.6 0.7 0.5 0.6 0.2 2.0
2010 Q1 1.3 −0.7 −0.6 −0.2 −3.9 −1.2
Percentage chang e , quar ter on corresponding quarter of previous year
2007 Q1 −0.7 1.7 0.4 0.8 −2.8 10.3Q2 −0.8 1.0 0.2 0.5 −2.5 6.0Q3 −3.0 −2.4 −2.8 −2.2 −8.8 0.3Q4 −2.7 −1.3 −1.3 −0.8 −5.5 −1.3
2008 Q1 −2.3 −1.2 −1.8 −0.7 −11.2 2.8Q2 −5.4 −3.0 −3.3 −3.4 −2.2 −1.4Q3 −4.5 −2.4 −3.0 −3.6 2.9 0.9Q4 −6.3 −4.0 −5.4 −5.8 −1.7 4.7
2009 Q1 −4.1 −6.4 −7.0 −7.4 −3.0 −3.0Q2 −2.4 −7.5 −8.0 −7.9 −8.9 −4.4Q3 −2.8 −6.1 −6.6 −6.9 −4.1 −3.1Q4 0.3 −3.7 −4.2 −4.4 −2.3 −1.1
2010 Q1 −1.5 −2.4 −2.3 −2.4 −1.2 −3.1
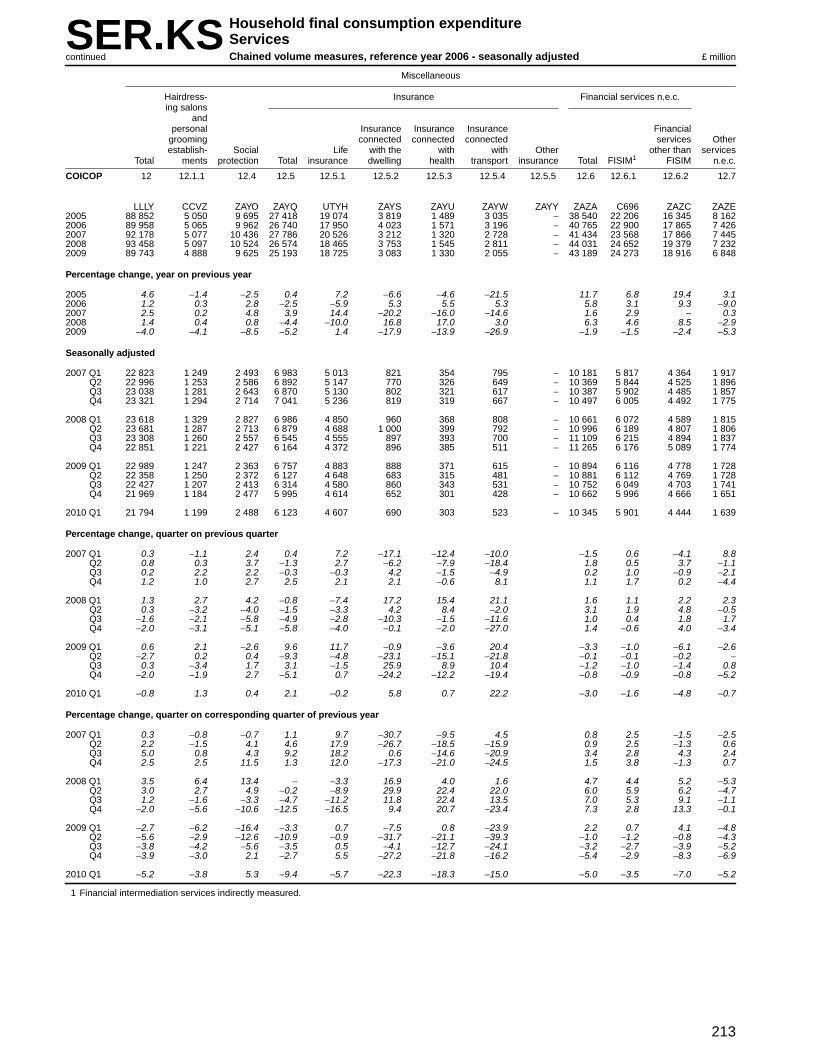
213
SER.KS Household final consumption expenditureSer vicesChained volume measures, reference year 2006 - seasonally adjustedcontinued £ million
Miscellaneous
Hairdress- Insurance Financial ser vices n.e.c.ing salons
andpersonal Insurance Insurance Insurance Financial
grooming connected connected connected ser vices Otherestablish- Social Life with the with with Other other than services
Total ments protection Total insurance dwelling health transpor t insurance Total FISIM1 FISIM n.e.c.
COICOP 12 12.1.1 12.4 12.5 12.5.1 12.5.2 12.5.3 12.5.4 12.5.5 12.6 12.6.1 12.6.2 12.7
LLLY CCVZ ZAYO ZAYQ UTYH ZAYS ZAYU ZAYW ZAYY ZAZA C696 ZAZC ZAZE2005 88 852 5 050 9 695 27 418 19 074 3 819 1 489 3 035 − 38 540 22 206 16 345 8 1622006 89 958 5 065 9 962 26 740 17 950 4 023 1 571 3 196 − 40 765 22 900 17 865 7 4262007 92 178 5 077 10 436 27 786 20 526 3 212 1 320 2 728 − 41 434 23 568 17 866 7 4452008 93 458 5 097 10 524 26 574 18 465 3 753 1 545 2 811 − 44 031 24 652 19 379 7 2322009 89 743 4 888 9 625 25 193 18 725 3 083 1 330 2 055 − 43 189 24 273 18 916 6 848
Percentage chang e , year on previous year
2005 4.6 −1.4 −2.5 0.4 7.2 −6.6 −4.6 −21.5 11.7 6.8 19.4 3.12006 1.2 0.3 2.8 −2.5 −5.9 5.3 5.5 5.3 5.8 3.1 9.3 −9.02007 2.5 0.2 4.8 3.9 14.4 −20.2 −16.0 −14.6 1.6 2.9 − 0.32008 1.4 0.4 0.8 −4.4 −10.0 16.8 17.0 3.0 6.3 4.6 8.5 −2.92009 −4.0 −4.1 −8.5 −5.2 1.4 −17.9 −13.9 −26.9 −1.9 −1.5 −2.4 −5.3
Seasonally adjusted
2007 Q1 22 823 1 249 2 493 6 983 5 013 821 354 795 − 10 181 5 817 4 364 1 917Q2 22 996 1 253 2 586 6 892 5 147 770 326 649 − 10 369 5 844 4 525 1 896Q3 23 038 1 281 2 643 6 870 5 130 802 321 617 − 10 387 5 902 4 485 1 857Q4 23 321 1 294 2 714 7 041 5 236 819 319 667 − 10 497 6 005 4 492 1 775
2008 Q1 23 618 1 329 2 827 6 986 4 850 960 368 808 − 10 661 6 072 4 589 1 815Q2 23 681 1 287 2 713 6 879 4 688 1 000 399 792 − 10 996 6 189 4 807 1 806Q3 23 308 1 260 2 557 6 545 4 555 897 393 700 − 11 109 6 215 4 894 1 837Q4 22 851 1 221 2 427 6 164 4 372 896 385 511 − 11 265 6 176 5 089 1 774
2009 Q1 22 989 1 247 2 363 6 757 4 883 888 371 615 − 10 894 6 116 4 778 1 728Q2 22 358 1 250 2 372 6 127 4 648 683 315 481 − 10 881 6 112 4 769 1 728Q3 22 427 1 207 2 413 6 314 4 580 860 343 531 − 10 752 6 049 4 703 1 741Q4 21 969 1 184 2 477 5 995 4 614 652 301 428 − 10 662 5 996 4 666 1 651
2010 Q1 21 794 1 199 2 488 6 123 4 607 690 303 523 − 10 345 5 901 4 444 1 639
Percentage chang e , quar ter on previous quarter
2007 Q1 0.3 −1.1 2.4 0.4 7.2 −17.1 −12.4 −10.0 −1.5 0.6 −4.1 8.8Q2 0.8 0.3 3.7 −1.3 2.7 −6.2 −7.9 −18.4 1.8 0.5 3.7 −1.1Q3 0.2 2.2 2.2 −0.3 −0.3 4.2 −1.5 −4.9 0.2 1.0 −0.9 −2.1Q4 1.2 1.0 2.7 2.5 2.1 2.1 −0.6 8.1 1.1 1.7 0.2 −4.4
2008 Q1 1.3 2.7 4.2 −0.8 −7.4 17.2 15.4 21.1 1.6 1.1 2.2 2.3Q2 0.3 −3.2 −4.0 −1.5 −3.3 4.2 8.4 −2.0 3.1 1.9 4.8 −0.5Q3 −1.6 −2.1 −5.8 −4.9 −2.8 −10.3 −1.5 −11.6 1.0 0.4 1.8 1.7Q4 −2.0 −3.1 −5.1 −5.8 −4.0 −0.1 −2.0 −27.0 1.4 −0.6 4.0 −3.4
2009 Q1 0.6 2.1 −2.6 9.6 11.7 −0.9 −3.6 20.4 −3.3 −1.0 −6.1 −2.6Q2 −2.7 0.2 0.4 −9.3 −4.8 −23.1 −15.1 −21.8 −0.1 −0.1 −0.2 −Q3 0.3 −3.4 1.7 3.1 −1.5 25.9 8.9 10.4 −1.2 −1.0 −1.4 0.8Q4 −2.0 −1.9 2.7 −5.1 0.7 −24.2 −12.2 −19.4 −0.8 −0.9 −0.8 −5.2
2010 Q1 −0.8 1.3 0.4 2.1 −0.2 5.8 0.7 22.2 −3.0 −1.6 −4.8 −0.7
Percentage chang e , quar ter on corresponding quarter of previous year
2007 Q1 0.3 −0.8 −0.7 1.1 9.7 −30.7 −9.5 4.5 0.8 2.5 −1.5 −2.5Q2 2.2 −1.5 4.1 4.6 17.9 −26.7 −18.5 −15.9 0.9 2.5 −1.3 0.6Q3 5.0 0.8 4.3 9.2 18.2 0.6 −14.6 −20.9 3.4 2.8 4.3 2.4Q4 2.5 2.5 11.5 1.3 12.0 −17.3 −21.0 −24.5 1.5 3.8 −1.3 0.7
2008 Q1 3.5 6.4 13.4 − −3.3 16.9 4.0 1.6 4.7 4.4 5.2 −5.3Q2 3.0 2.7 4.9 −0.2 −8.9 29.9 22.4 22.0 6.0 5.9 6.2 −4.7Q3 1.2 −1.6 −3.3 −4.7 −11.2 11.8 22.4 13.5 7.0 5.3 9.1 −1.1Q4 −2.0 −5.6 −10.6 −12.5 −16.5 9.4 20.7 −23.4 7.3 2.8 13.3 −0.1
2009 Q1 −2.7 −6.2 −16.4 −3.3 0.7 −7.5 0.8 −23.9 2.2 0.7 4.1 −4.8Q2 −5.6 −2.9 −12.6 −10.9 −0.9 −31.7 −21.1 −39.3 −1.0 −1.2 −0.8 −4.3Q3 −3.8 −4.2 −5.6 −3.5 0.5 −4.1 −12.7 −24.1 −3.2 −2.7 −3.9 −5.2Q4 −3.9 −3.0 2.1 −2.7 5.5 −27.2 −21.8 −16.2 −5.4 −2.9 −8.3 −6.9
2010 Q1 −5.2 −3.8 5.3 −9.4 −5.7 −22.3 −18.3 −15.0 −5.0 −3.5 −7.0 −5.2
1 Financial intermediation services indirectly measured.

214
SER.DN Household final consumption expenditureSer vicesImplied deflators - not seasonally adjusted 2006 = 100
Clothing and footwear Housing, water, electr icity, gas and other fuels
Actual rentals for housing Imputed rentals for housing Ser vicesfor the
Cleaning, Imputed maintena- Otherrepair Actual rentals nce & ser vices
and hire Repair & rentals Other of Other repair of Refuse Sewerage relatingof hire of paid by actual owner-oc- imputed the collecti- collecti- to the
Total Total clothing footwear Total Total tenants rentals Total cupiers rentals dwelling on on dwelling
COICOP S 03 03.1.4 03.2.2 04 04.1 04.1.1 04.1.2 04.2 04.2.1 04.2.2 04.3.2 04.4.2 04.4.3 04.4.4
UTKY LLOF AWMA AWMC LLOG UTNI AWMD UTNJ AWMF AWMG AWMI AWMK AWML2005 96.1 95.6 95.1 100.0 96.0 97.0 97.0 96.2 96.2 96.2 95.2 93.6 93.72006 100.0 100.0 100.0 100.0 100.0 100.0 100.0 100.0 100.0 100.0 100.0 100.0 100.02007 104.4 104.8 105.3 100.0 107.0 106.9 106.9 107.2 107.2 106.9 105.0 103.9 106.32008 107.4 108.6 109.4 100.0 112.1 110.3 110.3 113.0 113.0 113.0 110.3 110.4 113.22009 107.8 110.9 112.1 98.8 117.1 116.1 116.1 117.9 117.8 122.3 111.6 115.1 118.9
Percentage chang e , year on previous year
2005 4.1 5.2 5.2 2.9 4.7 4.3 4.3 4.3 4.5 1.9 5.4 3.9 10.02006 4.1 4.6 5.2 − 4.2 3.1 3.1 4.0 4.0 4.0 5.0 6.8 6.72007 4.4 4.8 5.3 − 7.0 6.9 6.9 7.2 7.2 6.9 5.0 3.9 6.32008 2.9 3.6 3.9 − 4.8 3.2 3.2 5.4 5.4 5.7 5.0 6.3 6.52009 0.4 2.1 2.5 −1.2 4.5 5.3 5.3 4.3 4.2 8.2 1.2 4.3 5.0
Not seasonally adjusted
2007 Q1 102.6 102.6 102.9 100.0 104.3 104.3 104.3 104.5 104.5 104.3 103.6 102.7 101.3Q2 104.4 104.5 104.9 100.0 106.2 106.2 106.2 106.2 106.2 106.1 104.7 103.8 107.9Q3 105.2 105.9 106.5 100.0 108.2 108.4 108.4 108.3 108.3 108.1 105.3 105.3 107.8Q4 105.2 106.5 107.0 100.0 109.2 108.6 108.6 109.7 109.7 109.7 106.7 105.0 108.0
2008 Q1 106.1 106.1 106.7 100.0 109.4 107.8 107.8 110.2 110.2 110.0 108.4 108.0 107.9Q2 107.1 107.6 108.2 100.0 110.6 108.9 108.9 111.2 111.3 111.0 109.1 110.0 115.0Q3 108.4 109.7 110.4 100.0 112.8 110.8 110.8 113.7 113.7 113.5 111.4 110.7 115.0Q4 107.9 110.5 111.4 100.0 115.6 113.6 113.6 116.8 116.8 116.7 112.0 113.0 114.9
2009 Q1 106.9 109.7 111.0 95.2 116.7 118.7 118.7 116.4 116.4 116.7 111.4 112.0 115.0Q2 106.9 111.2 112.3 100.0 116.0 115.1 115.1 116.6 116.5 119.4 111.5 114.3 120.3Q3 108.1 111.4 112.4 100.0 116.5 113.9 113.9 117.9 117.7 124.4 111.6 113.0 120.2Q4 109.4 111.4 112.6 100.0 119.2 117.0 117.0 120.8 120.5 129.1 111.8 120.8 120.3
2010 Q1 112.0 112.2 113.6 100.0 125.1 122.6 122.6 127.5 127.4 129.8 112.8 116.7 120.3
Percentage chang e , quar ter on corresponding quarter of previous year
2007 Q1 4.4 4.7 5.2 − 5.8 5.6 5.6 6.0 6.0 6.0 5.1 8.1 5.4Q2 5.2 5.0 5.4 − 7.2 7.1 7.1 7.3 7.3 7.4 5.2 3.8 6.4Q3 4.6 5.4 6.0 − 8.3 8.9 8.9 8.4 8.4 8.2 4.9 5.3 6.3Q4 3.4 4.6 4.9 − 6.6 6.0 6.0 7.0 7.0 7.1 5.3 2.8 6.6
2008 Q1 3.4 3.4 3.7 − 4.9 3.4 3.4 5.5 5.5 5.5 4.6 5.2 6.5Q2 2.6 3.0 3.1 − 4.1 2.5 2.5 4.7 4.8 4.6 4.2 6.0 6.6Q3 3.0 3.6 3.7 − 4.3 2.2 2.2 5.0 5.0 5.0 5.8 5.1 6.7Q4 2.6 3.8 4.1 − 5.9 4.6 4.6 6.5 6.5 6.4 5.0 7.6 6.4
2009 Q1 0.8 3.4 4.0 −4.8 6.7 10.1 10.1 5.6 5.6 6.1 2.8 3.7 6.6Q2 −0.2 3.3 3.8 − 4.9 5.7 5.7 4.9 4.7 7.6 2.2 3.9 4.6Q3 −0.3 1.5 1.8 − 3.3 2.8 2.8 3.7 3.5 9.6 0.2 2.1 4.5Q4 1.4 0.8 1.1 − 3.1 3.0 3.0 3.4 3.2 10.6 −0.2 6.9 4.7
2010 Q1 4.8 2.3 2.3 5.0 7.2 3.3 3.3 9.5 9.5 11.2 1.3 4.2 4.6

215
SER.DN Household final consumption expenditureSer vicesImplied deflators - not seasonally adjustedcontinued 2006 = 100
Fur nishing & household services Health
Repair of Out-patient servicesfur niture,
fur nishings & Repair of Domestic &floor household household Medical Dental Paramedical Hospital
Total coverings appliances ser vices Total Total services services services services
COICOP 05 05.1.3 05.3.3 05.6.2 06 06.2 06.2.1 06.2.2 06.2.3 06.3
LLOH AWMU AWMX AWNB LLOI UTNU AWNF AWNG AWNH UTNV2005 95.7 100.0 98.2 95.3 96.5 95.9 96.2 95.6 96.0 97.22006 100.0 100.0 100.0 100.0 100.0 100.0 100.0 100.0 100.0 100.02007 104.7 100.0 102.0 105.3 103.2 103.4 102.5 104.1 102.7 102.82008 109.9 104.9 107.9 110.3 104.3 104.2 105.4 102.9 106.0 104.42009 112.2 112.8 109.4 112.7 109.1 107.8 108.8 106.8 109.4 110.4
Percentage chang e , year on previous year
2005 5.3 3.7 4.4 5.7 2.2 1.7 2.7 −0.3 4.9 2.92006 4.5 − 1.8 4.9 3.6 4.3 4.0 4.6 4.2 2.92007 4.7 − 2.0 5.3 3.2 3.4 2.5 4.1 2.7 2.82008 5.0 4.9 5.8 4.7 1.1 0.8 2.8 −1.2 3.2 1.62009 2.1 7.5 1.4 2.2 4.6 3.5 3.2 3.8 3.2 5.7
Not seasonally adjusted
2007 Q1 103.0 100.0 101.2 103.7 102.4 102.4 101.3 103.2 101.5 102.4Q2 104.3 100.0 101.5 104.9 103.2 103.6 102.2 104.7 102.4 102.6Q3 105.3 100.0 101.7 105.9 103.6 104.1 103.6 104.6 103.3 102.9Q4 105.9 100.0 104.0 106.3 103.5 103.5 103.0 103.9 103.6 103.5
2008 Q1 107.6 100.0 106.9 107.9 103.4 103.4 104.3 102.3 105.1 103.4Q2 108.9 100.0 106.4 109.3 104.0 104.2 105.7 102.9 105.8 103.7Q3 110.5 106.7 107.1 111.0 104.5 104.5 105.9 103.4 105.8 104.4Q4 111.9 106.2 110.4 112.3 105.2 104.6 106.1 102.9 107.2 105.9
2009 Q1 111.8 112.5 108.1 112.5 107.0 106.1 107.7 104.6 108.1 108.0Q2 112.1 110.0 108.6 112.5 108.6 107.6 108.3 106.6 109.5 109.7Q3 112.1 107.7 108.9 112.7 110.0 108.8 109.2 108.1 110.3 111.2Q4 113.0 118.8 111.6 113.1 111.0 109.0 110.2 108.0 110.1 112.9
2010 Q1 113.7 114.3 110.7 114.1 111.2 109.7 110.3 108.9 110.7 112.6
Percentage chang e , quar ter on corresponding quarter of previous year
2007 Q1 4.5 − 1.2 5.3 4.1 4.6 2.6 6.5 2.6 3.6Q2 4.7 − 1.5 5.5 3.8 4.3 2.6 5.5 3.0 3.0Q3 4.9 − 1.7 5.5 3.3 3.6 3.6 3.7 3.3 2.6Q4 4.6 − 4.0 4.6 1.8 1.5 1.3 2.0 1.4 2.2
2008 Q1 4.5 − 5.6 4.1 1.0 1.0 3.0 −0.9 3.5 1.0Q2 4.4 − 4.8 4.2 0.8 0.6 3.4 −1.7 3.3 1.1Q3 4.9 6.7 5.3 4.8 0.9 0.4 2.2 −1.1 2.4 1.5Q4 5.7 6.2 6.2 5.6 1.6 1.1 3.0 −1.0 3.5 2.3
2009 Q1 3.9 12.5 1.1 4.3 3.5 2.6 3.3 2.2 2.9 4.4Q2 2.9 10.0 2.1 2.9 4.4 3.3 2.5 3.6 3.5 5.8Q3 1.4 0.9 1.7 1.5 5.3 4.1 3.1 4.5 4.3 6.5Q4 1.0 11.9 1.1 0.7 5.5 4.2 3.9 5.0 2.7 6.6
2010 Q1 1.7 1.6 2.4 1.4 3.9 3.4 2.4 4.1 2.4 4.3

216
SER.DN Household final consumption expenditureSer vicesImplied deflators - not seasonally adjustedcontinued 2006 = 100
Tr anspor t ser vicesVehicle
maintenance and Other vehicle Sea & inlandTotal repair ser vices Total Railways Road Air waterway Other
COICOP 07 07.2.3 07.2.4 07.3 07.3.1 07.3.2 07.3.3 07.3.4 07.3.6
LLOJ AWNN AWNO UTNY AWNP AWNQ AWNR AWNS AWNT2005 96.3 93.6 95.6 97.8 95.8 96.7 99.3 99.6 93.82006 100.0 100.0 100.0 100.0 100.0 100.0 100.0 100.0 100.02007 103.6 105.7 106.4 102.2 104.1 104.8 99.2 102.8 109.72008 108.3 112.3 109.8 106.3 108.9 109.3 104.5 104.4 101.12009 110.4 116.3 113.1 107.0 111.5 115.2 99.2 108.8 113.2
Percentage chang e , year on previous year
2005 4.7 7.3 6.3 3.1 4.8 6.3 1.4 −3.3 4.92006 3.8 6.8 4.6 2.2 4.4 3.4 0.7 0.4 6.62007 3.6 5.7 6.4 2.2 4.1 4.8 −0.8 2.8 9.72008 4.5 6.2 3.2 4.0 4.6 4.3 5.3 1.6 −7.82009 1.9 3.6 3.0 0.7 2.4 5.4 −5.1 4.2 12.0
Not seasonally adjusted
2007 Q1 101.5 103.9 104.1 99.5 103.2 103.3 94.7 97.0 111.2Q2 106.2 105.3 106.3 106.6 105.7 104.4 109.4 101.2 112.0Q3 104.0 106.5 106.9 102.6 103.6 105.4 99.5 105.3 108.5Q4 102.4 107.3 108.0 99.5 104.0 105.7 92.4 101.6 108.1
2008 Q1 105.2 109.8 108.4 102.4 107.8 107.0 96.4 102.6 117.6Q2 106.2 111.2 109.6 103.7 109.0 108.5 99.6 102.6 99.1Q3 110.2 112.9 110.1 109.2 108.0 110.1 112.3 106.5 85.0Q4 111.4 114.8 111.2 109.6 110.8 111.4 108.6 103.8 110.8
2009 Q1 110.7 115.0 111.9 107.8 112.3 114.1 101.1 107.5 118.9Q2 109.8 116.0 112.8 106.5 111.4 115.4 99.1 107.1 106.8Q3 110.7 116.9 113.6 107.7 109.2 115.7 101.4 110.3 115.0Q4 110.3 117.1 113.9 105.9 112.9 115.5 94.3 108.9 113.2
2010 Q1 112.1 120.1 115.8 106.6 115.8 117.9 92.7 111.4 132.1
Percentage chang e , quar ter on corresponding quarter of previous year
2007 Q1 3.6 5.8 4.9 2.5 2.2 1.3 4.1 1.7 7.6Q2 8.4 6.3 6.6 9.6 6.8 5.6 14.8 3.0 16.1Q3 1.5 6.1 6.8 −1.3 3.9 6.1 −9.0 2.8 7.9Q4 1.4 4.8 7.0 −0.9 3.7 5.5 −8.3 3.6 7.8
2008 Q1 3.6 5.7 4.1 2.9 4.5 3.6 1.8 5.8 5.8Q2 − 5.6 3.1 −2.7 3.1 3.9 −9.0 1.4 −11.5Q3 6.0 6.0 3.0 6.4 4.2 4.5 12.9 1.1 −21.7Q4 8.8 7.0 3.0 10.2 6.5 5.4 17.5 2.2 2.5
2009 Q1 5.2 4.7 3.2 5.3 4.2 6.6 4.9 4.8 1.1Q2 3.4 4.3 2.9 2.7 2.2 6.4 −0.5 4.4 7.8Q3 0.5 3.5 3.2 −1.4 1.1 5.1 −9.7 3.6 35.3Q4 −1.0 2.0 2.4 −3.4 1.9 3.7 −13.2 4.9 2.2
2010 Q1 1.3 4.4 3.5 −1.1 3.1 3.3 −8.3 3.6 11.1
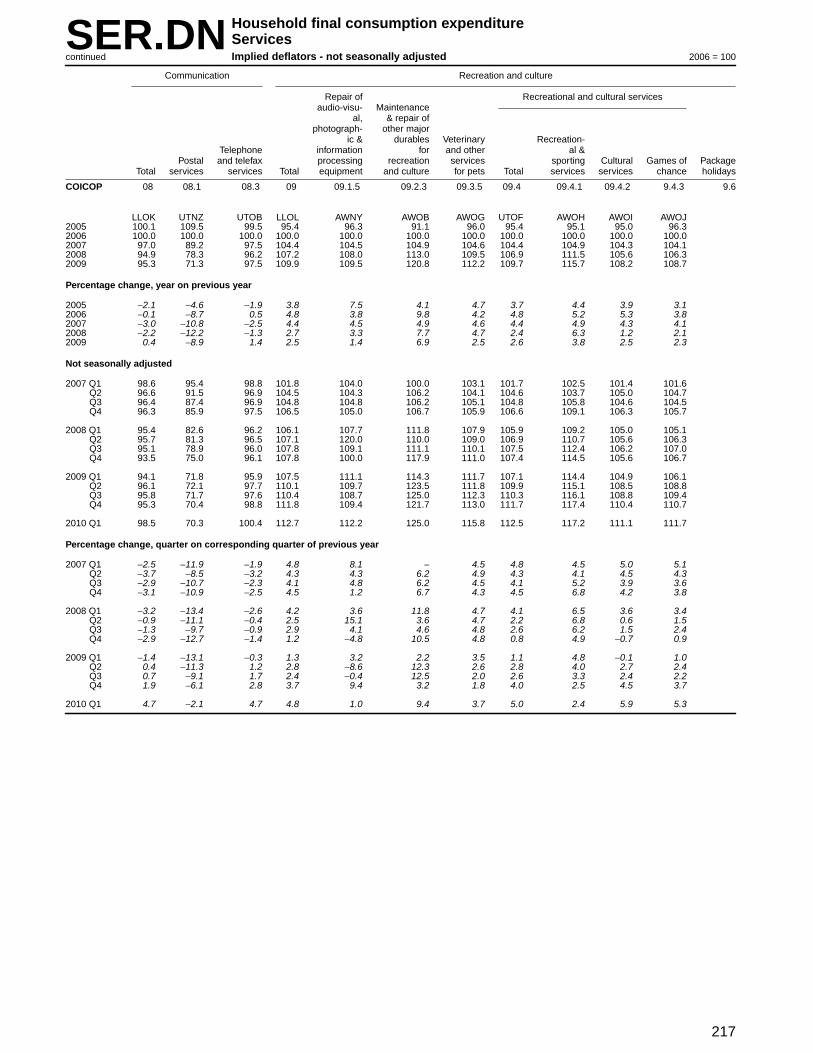
217
SER.DN Household final consumption expenditureSer vicesImplied deflators - not seasonally adjustedcontinued 2006 = 100
Communication Recreation and culture
Repair of Recreational and cultural servicesaudio-visu- Maintenance
al, & repair ofphotograph- other major
ic & durables Veter inary Recreation-Telephone infor mation for and other al &
Postal and telefax processing recreation services sporting Cultural Games of PackageTotal services services Total equipment and culture for pets Total services services chance holidays
COICOP 08 08.1 08.3 09 09.1.5 09.2.3 09.3.5 09.4 09.4.1 09.4.2 9.4.3 9.6
LLOK UTNZ UTOB LLOL AWNY AWOB AWOG UTOF AWOH AWOI AWOJ2005 100.1 109.5 99.5 95.4 96.3 91.1 96.0 95.4 95.1 95.0 96.32006 100.0 100.0 100.0 100.0 100.0 100.0 100.0 100.0 100.0 100.0 100.02007 97.0 89.2 97.5 104.4 104.5 104.9 104.6 104.4 104.9 104.3 104.12008 94.9 78.3 96.2 107.2 108.0 113.0 109.5 106.9 111.5 105.6 106.32009 95.3 71.3 97.5 109.9 109.5 120.8 112.2 109.7 115.7 108.2 108.7
Percentage chang e , year on previous year
2005 −2.1 −4.6 −1.9 3.8 7.5 4.1 4.7 3.7 4.4 3.9 3.12006 −0.1 −8.7 0.5 4.8 3.8 9.8 4.2 4.8 5.2 5.3 3.82007 −3.0 −10.8 −2.5 4.4 4.5 4.9 4.6 4.4 4.9 4.3 4.12008 −2.2 −12.2 −1.3 2.7 3.3 7.7 4.7 2.4 6.3 1.2 2.12009 0.4 −8.9 1.4 2.5 1.4 6.9 2.5 2.6 3.8 2.5 2.3
Not seasonally adjusted
2007 Q1 98.6 95.4 98.8 101.8 104.0 100.0 103.1 101.7 102.5 101.4 101.6Q2 96.6 91.5 96.9 104.5 104.3 106.2 104.1 104.6 103.7 105.0 104.7Q3 96.4 87.4 96.9 104.8 104.8 106.2 105.1 104.8 105.8 104.6 104.5Q4 96.3 85.9 97.5 106.5 105.0 106.7 105.9 106.6 109.1 106.3 105.7
2008 Q1 95.4 82.6 96.2 106.1 107.7 111.8 107.9 105.9 109.2 105.0 105.1Q2 95.7 81.3 96.5 107.1 120.0 110.0 109.0 106.9 110.7 105.6 106.3Q3 95.1 78.9 96.0 107.8 109.1 111.1 110.1 107.5 112.4 106.2 107.0Q4 93.5 75.0 96.1 107.8 100.0 117.9 111.0 107.4 114.5 105.6 106.7
2009 Q1 94.1 71.8 95.9 107.5 111.1 114.3 111.7 107.1 114.4 104.9 106.1Q2 96.1 72.1 97.7 110.1 109.7 123.5 111.8 109.9 115.1 108.5 108.8Q3 95.8 71.7 97.6 110.4 108.7 125.0 112.3 110.3 116.1 108.8 109.4Q4 95.3 70.4 98.8 111.8 109.4 121.7 113.0 111.7 117.4 110.4 110.7
2010 Q1 98.5 70.3 100.4 112.7 112.2 125.0 115.8 112.5 117.2 111.1 111.7
Percentage chang e , quar ter on corresponding quarter of previous year
2007 Q1 −2.5 −11.9 −1.9 4.8 8.1 − 4.5 4.8 4.5 5.0 5.1Q2 −3.7 −8.5 −3.2 4.3 4.3 6.2 4.9 4.3 4.1 4.5 4.3Q3 −2.9 −10.7 −2.3 4.1 4.8 6.2 4.5 4.1 5.2 3.9 3.6Q4 −3.1 −10.9 −2.5 4.5 1.2 6.7 4.3 4.5 6.8 4.2 3.8
2008 Q1 −3.2 −13.4 −2.6 4.2 3.6 11.8 4.7 4.1 6.5 3.6 3.4Q2 −0.9 −11.1 −0.4 2.5 15.1 3.6 4.7 2.2 6.8 0.6 1.5Q3 −1.3 −9.7 −0.9 2.9 4.1 4.6 4.8 2.6 6.2 1.5 2.4Q4 −2.9 −12.7 −1.4 1.2 −4.8 10.5 4.8 0.8 4.9 −0.7 0.9
2009 Q1 −1.4 −13.1 −0.3 1.3 3.2 2.2 3.5 1.1 4.8 −0.1 1.0Q2 0.4 −11.3 1.2 2.8 −8.6 12.3 2.6 2.8 4.0 2.7 2.4Q3 0.7 −9.1 1.7 2.4 −0.4 12.5 2.0 2.6 3.3 2.4 2.2Q4 1.9 −6.1 2.8 3.7 9.4 3.2 1.8 4.0 2.5 4.5 3.7
2010 Q1 4.7 −2.1 4.7 4.8 1.0 9.4 3.7 5.0 2.4 5.9 5.3

218
SER.DN Household final consumption expenditureSer vicesImplied deflators - not seasonally adjustedcontinued 2006 = 100
Restaurants and hotels
Cater ing ser vices
Restaurants, cafes AccommodationEducation Total Total etc Canteens services
COICOP 10 11 11.1 11.1.1 11.1.2 11.2
UTJK UTJL UTON AWOO AWOP UTOO2005 94.7 96.4 96.5 96.4 97.4 95.32006 100.0 100.0 100.0 100.0 100.0 100.02007 107.4 103.6 103.6 103.5 104.5 103.52008 114.8 107.8 108.1 108.1 108.8 106.12009 121.5 110.5 111.3 111.4 110.2 105.8
Percentage chang e , year on previous year
2005 4.9 3.7 3.4 3.4 3.4 5.22006 5.6 3.7 3.6 3.7 2.7 4.92007 7.4 3.6 3.6 3.5 4.5 3.52008 6.9 4.1 4.3 4.4 4.1 2.52009 5.8 2.5 3.0 3.1 1.3 −0.3
Not seasonally adjusted
2007 Q1 105.2 102.0 102.1 102.0 102.7 101.7Q2 105.2 103.2 103.2 103.1 104.0 103.1Q3 106.7 104.0 104.0 103.9 105.1 104.1Q4 112.9 104.9 105.0 104.9 106.2 104.5
2008 Q1 112.9 106.0 106.2 106.1 107.4 104.4Q2 113.1 107.6 107.9 107.8 108.5 105.6Q3 114.0 108.4 108.8 108.8 109.4 106.8Q4 119.4 109.1 109.5 109.4 109.9 106.8
2009 Q1 119.5 109.5 110.0 110.0 109.4 105.7Q2 119.5 110.4 111.2 111.3 109.7 106.1Q3 120.8 110.6 111.7 111.8 110.4 106.0Q4 126.5 111.3 112.2 112.4 111.2 105.2
2010 Q1 126.1 112.4 113.4 113.6 111.8 104.7
Percentage chang e , quar ter on corresponding quarter of previous year
2007 Q1 7.6 3.6 3.7 3.6 3.6 3.1Q2 7.6 3.5 3.5 3.4 4.3 3.7Q3 7.6 3.6 3.6 3.5 5.2 3.7Q4 7.2 3.7 3.8 3.7 4.8 3.5
2008 Q1 7.3 3.9 4.0 4.0 4.6 2.7Q2 7.5 4.3 4.6 4.6 4.3 2.4Q3 6.8 4.2 4.6 4.7 4.1 2.6Q4 5.8 4.0 4.3 4.3 3.5 2.2
2009 Q1 5.8 3.3 3.6 3.7 1.9 1.2Q2 5.7 2.6 3.1 3.2 1.1 0.5Q3 6.0 2.0 2.7 2.8 0.9 −0.7Q4 5.9 2.0 2.5 2.7 1.2 −1.5
2010 Q1 5.5 2.6 3.1 3.3 2.2 −0.9
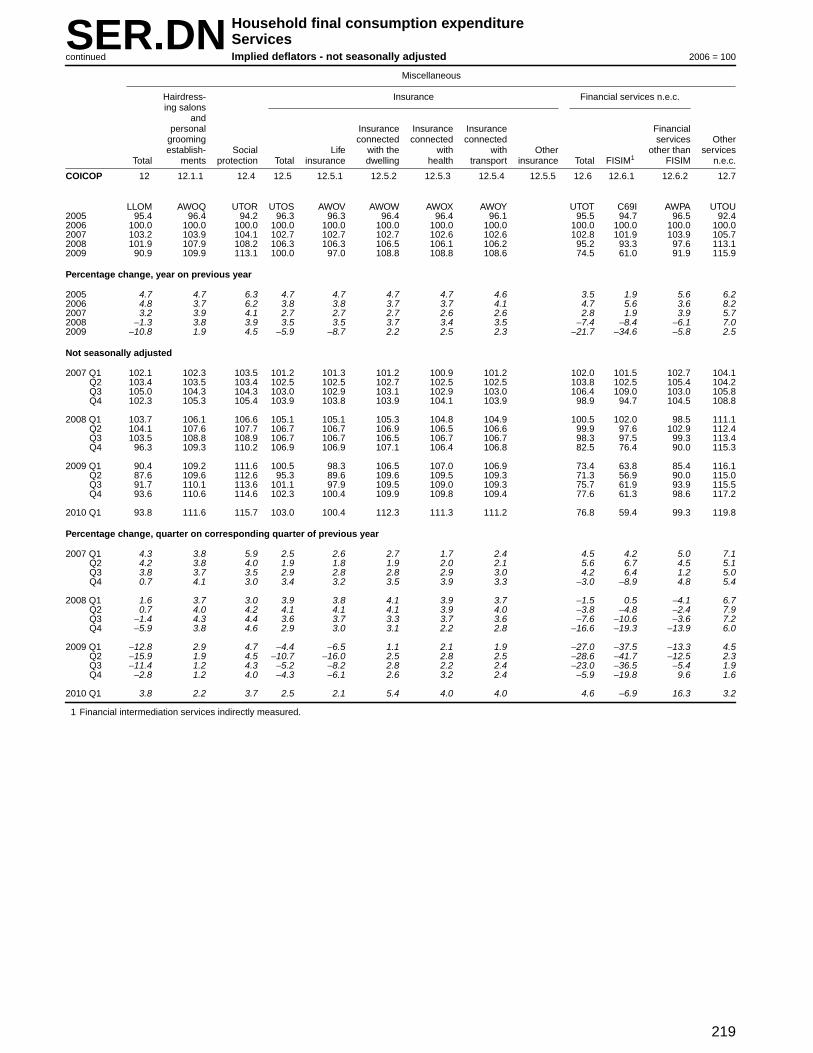
219
SER.DN Household final consumption expenditureSer vicesImplied deflators - not seasonally adjustedcontinued 2006 = 100
Miscellaneous
Hairdress- Insurance Financial ser vices n.e.c.ing salons
andpersonal Insurance Insurance Insurance Financial
grooming connected connected connected ser vices Otherestablish- Social Life with the with with Other other than services
Total ments protection Total insurance dwelling health transpor t insurance Total FISIM1 FISIM n.e.c.
COICOP 12 12.1.1 12.4 12.5 12.5.1 12.5.2 12.5.3 12.5.4 12.5.5 12.6 12.6.1 12.6.2 12.7
LLOM AWOQ UTOR UTOS AWOV AWOW AWOX AWOY UTOT C69I AWPA UTOU2005 95.4 96.4 94.2 96.3 96.3 96.4 96.4 96.1 95.5 94.7 96.5 92.42006 100.0 100.0 100.0 100.0 100.0 100.0 100.0 100.0 100.0 100.0 100.0 100.02007 103.2 103.9 104.1 102.7 102.7 102.7 102.6 102.6 102.8 101.9 103.9 105.72008 101.9 107.9 108.2 106.3 106.3 106.5 106.1 106.2 95.2 93.3 97.6 113.12009 90.9 109.9 113.1 100.0 97.0 108.8 108.8 108.6 74.5 61.0 91.9 115.9
Percentage chang e , year on previous year
2005 4.7 4.7 6.3 4.7 4.7 4.7 4.7 4.6 3.5 1.9 5.6 6.22006 4.8 3.7 6.2 3.8 3.8 3.7 3.7 4.1 4.7 5.6 3.6 8.22007 3.2 3.9 4.1 2.7 2.7 2.7 2.6 2.6 2.8 1.9 3.9 5.72008 −1.3 3.8 3.9 3.5 3.5 3.7 3.4 3.5 −7.4 −8.4 −6.1 7.02009 −10.8 1.9 4.5 −5.9 −8.7 2.2 2.5 2.3 −21.7 −34.6 −5.8 2.5
Not seasonally adjusted
2007 Q1 102.1 102.3 103.5 101.2 101.3 101.2 100.9 101.2 102.0 101.5 102.7 104.1Q2 103.4 103.5 103.4 102.5 102.5 102.7 102.5 102.5 103.8 102.5 105.4 104.2Q3 105.0 104.3 104.3 103.0 102.9 103.1 102.9 103.0 106.4 109.0 103.0 105.8Q4 102.3 105.3 105.4 103.9 103.8 103.9 104.1 103.9 98.9 94.7 104.5 108.8
2008 Q1 103.7 106.1 106.6 105.1 105.1 105.3 104.8 104.9 100.5 102.0 98.5 111.1Q2 104.1 107.6 107.7 106.7 106.7 106.9 106.5 106.6 99.9 97.6 102.9 112.4Q3 103.5 108.8 108.9 106.7 106.7 106.5 106.7 106.7 98.3 97.5 99.3 113.4Q4 96.3 109.3 110.2 106.9 106.9 107.1 106.4 106.8 82.5 76.4 90.0 115.3
2009 Q1 90.4 109.2 111.6 100.5 98.3 106.5 107.0 106.9 73.4 63.8 85.4 116.1Q2 87.6 109.6 112.6 95.3 89.6 109.6 109.5 109.3 71.3 56.9 90.0 115.0Q3 91.7 110.1 113.6 101.1 97.9 109.5 109.0 109.3 75.7 61.9 93.9 115.5Q4 93.6 110.6 114.6 102.3 100.4 109.9 109.8 109.4 77.6 61.3 98.6 117.2
2010 Q1 93.8 111.6 115.7 103.0 100.4 112.3 111.3 111.2 76.8 59.4 99.3 119.8
Percentage chang e , quar ter on corresponding quarter of previous year
2007 Q1 4.3 3.8 5.9 2.5 2.6 2.7 1.7 2.4 4.5 4.2 5.0 7.1Q2 4.2 3.8 4.0 1.9 1.8 1.9 2.0 2.1 5.6 6.7 4.5 5.1Q3 3.8 3.7 3.5 2.9 2.8 2.8 2.9 3.0 4.2 6.4 1.2 5.0Q4 0.7 4.1 3.0 3.4 3.2 3.5 3.9 3.3 −3.0 −8.9 4.8 5.4
2008 Q1 1.6 3.7 3.0 3.9 3.8 4.1 3.9 3.7 −1.5 0.5 −4.1 6.7Q2 0.7 4.0 4.2 4.1 4.1 4.1 3.9 4.0 −3.8 −4.8 −2.4 7.9Q3 −1.4 4.3 4.4 3.6 3.7 3.3 3.7 3.6 −7.6 −10.6 −3.6 7.2Q4 −5.9 3.8 4.6 2.9 3.0 3.1 2.2 2.8 −16.6 −19.3 −13.9 6.0
2009 Q1 −12.8 2.9 4.7 −4.4 −6.5 1.1 2.1 1.9 −27.0 −37.5 −13.3 4.5Q2 −15.9 1.9 4.5 −10.7 −16.0 2.5 2.8 2.5 −28.6 −41.7 −12.5 2.3Q3 −11.4 1.2 4.3 −5.2 −8.2 2.8 2.2 2.4 −23.0 −36.5 −5.4 1.9Q4 −2.8 1.2 4.0 −4.3 −6.1 2.6 3.2 2.4 −5.9 −19.8 9.6 1.6
2010 Q1 3.8 2.2 3.7 2.5 2.1 5.4 4.0 4.0 4.6 −6.9 16.3 3.2
1 Financial intermediation services indirectly measured.

220
SER.DS Household final consumption expenditureSer vicesImplied deflators - seasonally adjusted 2006 = 100
Clothing and footwear Housing, water, electr icity, gas and other fuels
Actual rentals for housing
Imputed rentals for housing Ser vicesfor the
Cleaning, Imputed maintena- Otherrepair Actual rentals nce & ser vices
and hire Repair & rentals Other of Other repair of Refuse Sewerage relatingof hire of paid by actual owner-oc- imputed the collecti- collecti- to the
Total Total clothing footwear Total Total tenants rentals Total cupiers rentals dwelling on on dwelling
COICOP S 03 03.1.4 03.2.2 04 04.1 04.1.1 04.1.2 04.2 04.2.1 04.2.2 04.3.2 04.4.2 04.4.3 04.4.4
UTKZ LLPM AWPS AWPU LLPN UTPB AWPV UTPC AWPX AWPY AWQA AWQC AWQD2005 96.1 95.6 95.1 100.0 96.0 97.0 97.0 96.2 96.2 96.2 95.2 93.6 93.72006 100.0 100.0 100.0 100.0 100.0 100.0 100.0 100.0 100.0 100.0 100.0 100.0 100.02007 104.4 104.8 105.3 100.0 107.0 106.9 106.9 107.2 107.2 106.9 105.0 103.9 106.32008 107.4 108.6 109.4 100.0 112.1 110.3 110.3 113.0 113.0 113.0 110.3 110.4 113.22009 107.8 110.9 112.1 98.8 117.1 116.1 116.1 117.9 117.8 122.3 111.6 115.1 118.9
Percentage chang e , year on previous year
2005 4.1 5.2 5.2 2.9 4.7 4.3 4.3 4.3 4.5 1.9 5.4 3.9 10.02006 4.1 4.6 5.2 − 4.2 3.1 3.1 4.0 4.0 4.0 5.0 6.8 6.72007 4.4 4.8 5.3 − 7.0 6.9 6.9 7.2 7.2 6.9 5.0 3.9 6.32008 2.9 3.6 3.9 − 4.8 3.2 3.2 5.4 5.4 5.7 5.0 6.3 6.52009 0.4 2.1 2.5 −1.2 4.5 5.3 5.3 4.3 4.2 8.2 1.2 4.3 5.0
Seasonally adjusted
2007 Q1 102.9 103.1 102.9 105.3 104.3 104.3 104.3 104.5 104.5 104.3 103.2 102.6 103.7Q2 104.3 104.5 105.0 100.0 106.1 106.2 106.2 106.2 106.2 106.1 105.3 100.0 105.6Q3 105.0 105.4 106.4 95.2 108.1 108.4 108.4 108.3 108.3 108.1 104.9 105.6 107.1Q4 105.3 106.4 107.0 100.0 109.2 108.6 108.6 109.7 109.7 109.7 106.9 110.0 108.7
2008 Q1 106.3 106.1 106.7 100.0 109.4 107.8 107.8 110.2 110.2 110.0 107.7 108.0 110.3Q2 107.0 107.2 107.8 100.0 110.6 108.9 108.9 111.2 111.3 111.0 110.4 110.0 112.5Q3 108.2 109.3 110.4 95.2 112.7 110.8 110.8 113.7 113.7 113.5 110.6 110.7 114.2Q4 108.2 111.2 111.8 104.8 115.6 113.6 113.6 116.8 116.8 116.7 112.2 113.0 115.8
2009 Q1 107.2 109.7 111.0 95.0 116.7 118.7 118.7 116.4 116.4 116.7 110.5 112.0 117.3Q2 106.6 111.4 112.4 100.0 116.0 115.1 115.1 116.6 116.5 119.4 113.4 114.3 117.8Q3 108.0 110.1 111.5 95.0 116.5 113.9 113.9 117.9 117.7 124.4 110.4 113.0 119.5Q4 109.6 112.5 113.3 104.3 119.3 117.0 117.0 120.8 120.5 129.1 111.9 120.8 121.2
2010 Q1 112.1 112.2 113.5 100.0 125.1 122.6 122.6 127.5 127.4 129.8 111.4 116.7 122.7
Percentage chang e , quar ter on previous quarter
2007 Q1 1.0 0.8 0.9 0.3 1.9 1.8 1.8 2.0 2.0 1.9 1.7 −1.6 1.5Q2 1.4 1.4 2.0 −5.0 1.7 1.8 1.8 1.6 1.6 1.7 2.0 −2.5 1.8Q3 0.7 0.9 1.3 −4.8 1.9 2.1 2.1 2.0 2.0 1.9 −0.4 5.6 1.4Q4 0.3 0.9 0.6 5.0 1.0 0.2 0.2 1.3 1.3 1.5 1.9 4.2 1.5
2008 Q1 0.9 −0.3 −0.3 − 0.2 −0.7 −0.7 0.5 0.5 0.3 0.7 −1.8 1.5Q2 0.7 1.0 1.0 − 1.1 1.0 1.0 0.9 1.0 0.9 2.5 1.9 2.0Q3 1.1 2.0 2.4 −4.8 1.9 1.7 1.7 2.2 2.2 2.3 0.2 0.6 1.5Q4 − 1.7 1.3 10.1 2.6 2.5 2.5 2.7 2.7 2.8 1.4 2.1 1.4
2009 Q1 −0.9 −1.3 −0.7 −9.4 1.0 4.5 4.5 −0.3 −0.3 − −1.5 −0.9 1.3Q2 −0.6 1.5 1.3 5.3 −0.6 −3.0 −3.0 0.2 0.1 2.3 2.6 2.1 0.4Q3 1.3 −1.2 −0.8 −5.0 0.4 −1.0 −1.0 1.1 1.0 4.2 −2.6 −1.1 1.4Q4 1.5 2.2 1.6 9.8 2.4 2.7 2.7 2.5 2.4 3.8 1.4 6.9 1.4
2010 Q1 2.3 −0.3 0.2 −4.1 4.9 4.8 4.8 5.5 5.7 0.5 −0.4 −3.4 1.2
Percentage chang e , quar ter on corresponding quarter of previous year
2007 Q1 4.4 5.2 5.2 5.3 5.8 5.6 5.6 6.0 6.0 6.0 5.0 7.8 5.6Q2 5.2 5.0 5.5 − 7.1 7.1 7.1 7.3 7.3 7.4 5.6 3.0 6.5Q3 4.6 5.4 5.9 0.2 8.2 8.9 8.9 8.4 8.4 8.2 4.6 5.6 6.6Q4 3.3 4.0 4.9 −4.8 6.6 6.0 6.0 7.0 7.0 7.1 5.3 5.5 6.4
2008 Q1 3.3 2.9 3.7 −5.0 4.9 3.4 3.4 5.5 5.5 5.5 4.4 5.3 6.4Q2 2.6 2.6 2.7 − 4.2 2.5 2.5 4.7 4.8 4.6 4.8 10.0 6.5Q3 3.0 3.7 3.8 − 4.3 2.2 2.2 5.0 5.0 5.0 5.4 4.8 6.6Q4 2.8 4.5 4.5 4.8 5.9 4.6 4.6 6.5 6.5 6.4 5.0 2.7 6.5
2009 Q1 0.8 3.4 4.0 −5.0 6.7 10.1 10.1 5.6 5.6 6.1 2.6 3.7 6.3Q2 −0.4 3.9 4.3 − 4.9 5.7 5.7 4.9 4.7 7.6 2.7 3.9 4.7Q3 −0.2 0.7 1.0 −0.2 3.4 2.8 2.8 3.7 3.5 9.6 −0.2 2.1 4.6Q4 1.3 1.2 1.3 −0.5 3.2 3.0 3.0 3.4 3.2 10.6 −0.3 6.9 4.7
2010 Q1 4.6 2.3 2.3 5.3 7.2 3.3 3.3 9.5 9.5 11.2 0.8 4.2 4.6

221
SER.DS Household final consumption expenditureSer vicesImplied deflators - seasonally adjustedcontinued 2006 = 100
Fur nishing & household services Health
Repair of Out-patient servicesfur niture,
fur nishings & Repair of Domestic &floor household household Medical Dental Paramedical Hospital
Total coverings appliances ser vices Total Total services services services services
COICOP 05 05.1.3 05.3.3 05.6.2 06 06.2 06.2.1 06.2.2 06.2.3 06.3
LLPO AWQM AWQP AWQT LLPP UTPN AWQX AWQY AWQZ UTPO2005 95.7 100.0 98.2 95.3 96.5 95.9 96.2 95.6 96.0 97.22006 100.0 100.0 100.0 100.0 100.0 100.0 100.0 100.0 100.0 100.02007 104.7 100.0 102.0 105.3 103.2 103.4 102.5 104.1 102.7 102.82008 109.9 104.9 107.9 110.3 104.3 104.2 105.4 102.9 106.0 104.42009 112.2 112.8 109.4 112.7 109.1 107.8 108.8 106.8 109.4 110.4
Percentage chang e , year on previous year
2005 5.3 3.7 4.4 5.7 2.2 1.7 2.7 −0.3 4.9 2.92006 4.5 − 1.8 4.9 3.6 4.3 4.0 4.6 4.2 2.92007 4.7 − 2.0 5.3 3.2 3.4 2.5 4.1 2.7 2.82008 5.0 4.9 5.8 4.7 1.1 0.8 2.8 −1.2 3.2 1.62009 2.1 7.5 1.4 2.2 4.6 3.5 3.2 3.8 3.2 5.7
Seasonally adjusted
2007 Q1 102.8 100.0 100.0 103.4 102.4 102.5 101.0 103.6 101.6 102.4Q2 104.4 100.0 102.0 104.9 103.0 103.3 101.9 104.3 102.4 102.6Q3 105.4 100.0 103.1 105.9 103.5 103.8 103.2 104.4 103.4 102.9Q4 106.5 100.0 103.7 107.1 103.8 104.0 104.0 104.1 103.6 103.5
2008 Q1 107.8 100.0 105.4 108.2 103.4 103.4 104.0 102.5 105.1 103.4Q2 109.5 100.0 107.6 109.9 103.9 104.1 105.8 102.6 105.8 103.7Q3 110.6 106.7 108.3 111.0 104.3 104.2 105.7 103.0 105.9 104.5Q4 111.8 106.2 110.3 112.2 105.4 105.0 106.6 103.4 107.1 105.9
2009 Q1 111.3 111.1 106.5 112.1 107.0 106.2 107.9 104.6 108.1 108.0Q2 112.2 120.0 109.6 112.6 108.6 107.7 109.1 106.3 109.5 109.7Q3 112.1 108.3 109.0 112.8 110.0 108.8 109.3 108.0 110.3 111.2Q4 113.3 112.5 112.5 113.5 110.8 108.9 109.1 108.4 109.9 112.9
2010 Q1 114.8 106.7 109.3 115.8 111.2 109.7 110.0 109.2 110.7 112.6
Percentage chang e , quar ter on previous quarter
2007 Q1 0.9 −12.5 −0.7 1.3 0.8 0.6 0.3 1.3 −0.6 1.1Q2 1.6 − 2.0 1.5 0.6 0.8 0.9 0.7 0.8 0.2Q3 1.0 − 1.1 1.0 0.5 0.5 1.3 0.1 1.0 0.3Q4 1.0 − 0.6 1.1 0.3 0.2 0.8 −0.3 0.2 0.6
2008 Q1 1.2 − 1.6 1.0 −0.4 −0.6 − −1.5 1.4 −0.1Q2 1.6 − 2.1 1.6 0.5 0.7 1.7 0.1 0.7 0.3Q3 1.0 6.7 0.7 1.0 0.4 0.1 −0.1 0.4 0.1 0.8Q4 1.1 −0.5 1.8 1.1 1.1 0.8 0.9 0.4 1.1 1.3
2009 Q1 −0.4 4.6 −3.4 −0.1 1.5 1.1 1.2 1.2 0.9 2.0Q2 0.8 8.0 2.9 0.4 1.5 1.4 1.1 1.6 1.3 1.6Q3 −0.1 −9.7 −0.5 0.2 1.3 1.0 0.2 1.6 0.7 1.4Q4 1.1 3.9 3.2 0.6 0.7 0.1 −0.2 0.4 −0.4 1.5
2010 Q1 1.3 −5.2 −2.8 2.0 0.4 0.7 0.8 0.7 0.7 −0.3
Percentage chang e , quar ter on corresponding quarter of previous year
2007 Q1 4.6 5.3 0.8 5.2 4.0 4.5 1.7 7.1 2.8 3.6Q2 4.8 − 2.0 5.4 3.6 4.0 1.9 5.4 3.0 3.0Q3 5.0 − 3.1 5.4 3.1 3.3 3.2 3.5 3.4 2.6Q4 4.5 −12.5 3.0 4.9 2.2 2.1 3.3 1.8 1.4 2.2
2008 Q1 4.9 − 5.4 4.6 1.0 0.9 3.0 −1.1 3.4 1.0Q2 4.9 − 5.5 4.8 0.9 0.8 3.8 −1.6 3.3 1.1Q3 4.9 6.7 5.0 4.8 0.8 0.4 2.4 −1.3 2.4 1.6Q4 5.0 6.2 6.4 4.8 1.5 1.0 2.5 −0.7 3.4 2.3
2009 Q1 3.2 11.1 1.0 3.6 3.5 2.7 3.8 2.0 2.9 4.4Q2 2.5 20.0 1.9 2.5 4.5 3.5 3.1 3.6 3.5 5.8Q3 1.4 1.5 0.6 1.6 5.5 4.4 3.4 4.9 4.2 6.4Q4 1.3 5.9 2.0 1.2 5.1 3.7 2.3 4.8 2.6 6.6
2010 Q1 3.1 −4.0 2.6 3.3 3.9 3.3 1.9 4.4 2.4 4.3

222
SER.DS Household final consumption expenditureSer vicesImplied deflators - seasonally adjustedcontinued 2006 = 100
Tr anspor t ser vicesVehicle
maintenance and Other vehicle Sea & inlandTotal repair ser vices Total Railways Road Air waterway Other
COICOP 07 07.2.3 07.2.4 07.3 07.3.1 07.3.2 07.3.3 07.3.4 07.3.6
LLPQ AWRF AWRG UTPR AWRH AWRI AWRJ AWRK AWRL2005 96.3 93.6 95.6 97.8 95.8 96.7 99.3 99.6 93.82006 100.0 100.0 100.0 100.0 100.0 100.0 100.0 100.0 100.02007 103.6 105.7 106.4 102.2 104.1 104.8 99.2 102.8 109.72008 108.3 112.3 109.8 106.3 108.9 109.3 104.5 104.4 101.12009 110.4 116.3 113.1 107.0 111.5 115.2 99.2 108.8 113.2
Percentage chang e , year on previous year
2005 4.7 7.3 6.3 3.1 4.8 6.3 1.4 −3.3 4.92006 3.8 6.8 4.6 2.2 4.4 3.4 0.7 0.4 6.62007 3.6 5.7 6.4 2.2 4.1 4.8 −0.8 2.8 9.72008 4.5 6.2 3.2 4.0 4.6 4.3 5.3 1.6 −7.82009 1.9 3.6 3.0 0.7 2.4 5.4 −5.1 4.2 12.0
Seasonally adjusted
2007 Q1 102.5 103.7 104.1 101.7 101.4 102.3 100.9 103.4 102.9Q2 107.1 105.3 106.1 108.1 105.5 104.6 111.7 103.0 115.1Q3 102.3 106.6 106.9 99.7 104.8 105.6 92.7 102.0 109.3Q4 102.6 107.4 108.4 99.8 104.6 106.5 92.6 102.9 112.4
2008 Q1 105.9 109.6 108.4 104.1 106.0 106.2 101.8 105.6 104.8Q2 106.8 111.1 109.4 104.7 108.8 108.7 101.4 103.8 100.0Q3 108.8 112.9 110.1 106.8 109.4 110.3 106.0 104.5 85.6Q4 111.7 115.0 111.4 110.2 111.5 112.4 109.5 103.7 114.1
2009 Q1 110.7 114.8 111.8 108.6 110.4 113.4 105.4 107.6 106.3Q2 110.5 115.9 112.8 107.6 111.0 115.5 100.5 110.0 111.0Q3 110.1 116.9 113.5 106.1 111.0 115.9 95.8 110.4 117.6Q4 110.1 117.4 114.2 105.8 113.5 116.2 94.8 107.0 117.9
2010 Q1 111.7 119.9 115.7 107.1 113.7 117.5 96.1 108.6 121.9
Percentage chang e , quar ter on previous quarter
2007 Q1 1.1 1.2 3.0 0.7 0.4 1.6 0.2 2.6 −1.5Q2 4.5 1.5 1.9 6.3 4.0 2.2 10.7 −0.4 11.9Q3 −4.5 1.2 0.8 −7.8 −0.7 1.0 −17.0 −1.0 −5.0Q4 0.3 0.8 1.4 0.1 −0.2 0.9 −0.1 0.9 2.8
2008 Q1 3.2 2.0 − 4.3 1.3 −0.3 9.9 2.6 −6.8Q2 0.8 1.4 0.9 0.6 2.6 2.4 −0.4 −1.7 −4.6Q3 1.9 1.6 0.6 2.0 0.6 1.5 4.5 0.7 −14.4Q4 2.7 1.9 1.2 3.2 1.9 1.9 3.3 −0.8 33.3
2009 Q1 −0.9 −0.2 0.4 −1.5 −1.0 0.9 −3.7 3.8 −6.8Q2 −0.2 1.0 0.9 −0.9 0.5 1.9 −4.6 2.2 4.4Q3 −0.4 0.9 0.6 −1.4 − 0.3 −4.7 0.4 5.9Q4 − 0.4 0.6 −0.3 2.3 0.3 −1.0 −3.1 0.3
2010 Q1 1.5 2.1 1.3 1.2 0.2 1.1 1.4 1.5 3.4
Percentage chang e , quar ter on corresponding quarter of previous year
2007 Q1 3.7 5.9 4.8 2.6 2.0 1.3 3.3 2.7 6.9Q2 8.0 6.3 6.6 9.0 6.7 5.8 12.3 4.0 16.3Q3 1.6 6.0 6.8 −1.1 4.1 6.2 −9.1 2.6 9.0Q4 1.2 4.8 7.2 −1.2 3.6 5.8 −8.0 2.1 7.6
2008 Q1 3.3 5.7 4.1 2.4 4.5 3.8 0.9 2.1 1.8Q2 −0.3 5.5 3.1 −3.1 3.1 3.9 −9.2 0.8 −13.1Q3 6.4 5.9 3.0 7.1 4.4 4.5 14.3 2.5 −21.7Q4 8.9 7.1 2.8 10.4 6.6 5.5 18.3 0.8 1.5
2009 Q1 4.5 4.7 3.1 4.3 4.2 6.8 3.5 1.9 1.4Q2 3.5 4.3 3.1 2.8 2.0 6.3 −0.9 6.0 11.0Q3 1.2 3.5 3.1 −0.7 1.5 5.1 −9.6 5.6 37.4Q4 −1.4 2.1 2.5 −4.0 1.8 3.4 −13.4 3.2 3.3
2010 Q1 0.9 4.4 3.5 −1.4 3.0 3.6 −8.8 0.9 14.7
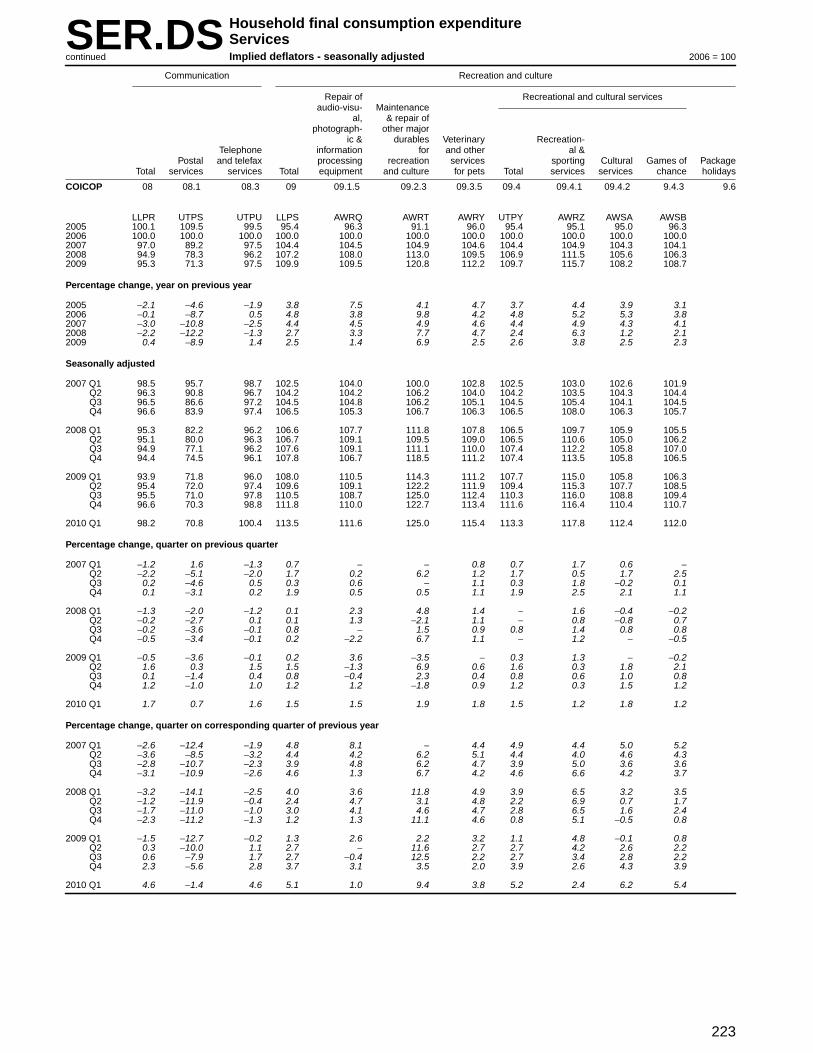
223
SER.DS Household final consumption expenditureSer vicesImplied deflators - seasonally adjustedcontinued 2006 = 100
Communication Recreation and culture
Repair of Recreational and cultural servicesaudio-visu- Maintenance
al, & repair ofphotograph- other major
ic & durables Veter inary Recreation-Telephone infor mation for and other al &
Postal and telefax processing recreation services sporting Cultural Games of PackageTotal services services Total equipment and culture for pets Total services services chance holidays
COICOP 08 08.1 08.3 09 09.1.5 09.2.3 09.3.5 09.4 09.4.1 09.4.2 9.4.3 9.6
LLPR UTPS UTPU LLPS AWRQ AWRT AWRY UTPY AWRZ AWSA AWSB2005 100.1 109.5 99.5 95.4 96.3 91.1 96.0 95.4 95.1 95.0 96.32006 100.0 100.0 100.0 100.0 100.0 100.0 100.0 100.0 100.0 100.0 100.02007 97.0 89.2 97.5 104.4 104.5 104.9 104.6 104.4 104.9 104.3 104.12008 94.9 78.3 96.2 107.2 108.0 113.0 109.5 106.9 111.5 105.6 106.32009 95.3 71.3 97.5 109.9 109.5 120.8 112.2 109.7 115.7 108.2 108.7
Percentage chang e , year on previous year
2005 −2.1 −4.6 −1.9 3.8 7.5 4.1 4.7 3.7 4.4 3.9 3.12006 −0.1 −8.7 0.5 4.8 3.8 9.8 4.2 4.8 5.2 5.3 3.82007 −3.0 −10.8 −2.5 4.4 4.5 4.9 4.6 4.4 4.9 4.3 4.12008 −2.2 −12.2 −1.3 2.7 3.3 7.7 4.7 2.4 6.3 1.2 2.12009 0.4 −8.9 1.4 2.5 1.4 6.9 2.5 2.6 3.8 2.5 2.3
Seasonally adjusted
2007 Q1 98.5 95.7 98.7 102.5 104.0 100.0 102.8 102.5 103.0 102.6 101.9Q2 96.3 90.8 96.7 104.2 104.2 106.2 104.0 104.2 103.5 104.3 104.4Q3 96.5 86.6 97.2 104.5 104.8 106.2 105.1 104.5 105.4 104.1 104.5Q4 96.6 83.9 97.4 106.5 105.3 106.7 106.3 106.5 108.0 106.3 105.7
2008 Q1 95.3 82.2 96.2 106.6 107.7 111.8 107.8 106.5 109.7 105.9 105.5Q2 95.1 80.0 96.3 106.7 109.1 109.5 109.0 106.5 110.6 105.0 106.2Q3 94.9 77.1 96.2 107.6 109.1 111.1 110.0 107.4 112.2 105.8 107.0Q4 94.4 74.5 96.1 107.8 106.7 118.5 111.2 107.4 113.5 105.8 106.5
2009 Q1 93.9 71.8 96.0 108.0 110.5 114.3 111.2 107.7 115.0 105.8 106.3Q2 95.4 72.0 97.4 109.6 109.1 122.2 111.9 109.4 115.3 107.7 108.5Q3 95.5 71.0 97.8 110.5 108.7 125.0 112.4 110.3 116.0 108.8 109.4Q4 96.6 70.3 98.8 111.8 110.0 122.7 113.4 111.6 116.4 110.4 110.7
2010 Q1 98.2 70.8 100.4 113.5 111.6 125.0 115.4 113.3 117.8 112.4 112.0
Percentage chang e , quar ter on previous quarter
2007 Q1 −1.2 1.6 −1.3 0.7 − − 0.8 0.7 1.7 0.6 −Q2 −2.2 −5.1 −2.0 1.7 0.2 6.2 1.2 1.7 0.5 1.7 2.5Q3 0.2 −4.6 0.5 0.3 0.6 − 1.1 0.3 1.8 −0.2 0.1Q4 0.1 −3.1 0.2 1.9 0.5 0.5 1.1 1.9 2.5 2.1 1.1
2008 Q1 −1.3 −2.0 −1.2 0.1 2.3 4.8 1.4 − 1.6 −0.4 −0.2Q2 −0.2 −2.7 0.1 0.1 1.3 −2.1 1.1 − 0.8 −0.8 0.7Q3 −0.2 −3.6 −0.1 0.8 − 1.5 0.9 0.8 1.4 0.8 0.8Q4 −0.5 −3.4 −0.1 0.2 −2.2 6.7 1.1 − 1.2 − −0.5
2009 Q1 −0.5 −3.6 −0.1 0.2 3.6 −3.5 − 0.3 1.3 − −0.2Q2 1.6 0.3 1.5 1.5 −1.3 6.9 0.6 1.6 0.3 1.8 2.1Q3 0.1 −1.4 0.4 0.8 −0.4 2.3 0.4 0.8 0.6 1.0 0.8Q4 1.2 −1.0 1.0 1.2 1.2 −1.8 0.9 1.2 0.3 1.5 1.2
2010 Q1 1.7 0.7 1.6 1.5 1.5 1.9 1.8 1.5 1.2 1.8 1.2
Percentage chang e , quar ter on corresponding quarter of previous year
2007 Q1 −2.6 −12.4 −1.9 4.8 8.1 − 4.4 4.9 4.4 5.0 5.2Q2 −3.6 −8.5 −3.2 4.4 4.2 6.2 5.1 4.4 4.0 4.6 4.3Q3 −2.8 −10.7 −2.3 3.9 4.8 6.2 4.7 3.9 5.0 3.6 3.6Q4 −3.1 −10.9 −2.6 4.6 1.3 6.7 4.2 4.6 6.6 4.2 3.7
2008 Q1 −3.2 −14.1 −2.5 4.0 3.6 11.8 4.9 3.9 6.5 3.2 3.5Q2 −1.2 −11.9 −0.4 2.4 4.7 3.1 4.8 2.2 6.9 0.7 1.7Q3 −1.7 −11.0 −1.0 3.0 4.1 4.6 4.7 2.8 6.5 1.6 2.4Q4 −2.3 −11.2 −1.3 1.2 1.3 11.1 4.6 0.8 5.1 −0.5 0.8
2009 Q1 −1.5 −12.7 −0.2 1.3 2.6 2.2 3.2 1.1 4.8 −0.1 0.8Q2 0.3 −10.0 1.1 2.7 − 11.6 2.7 2.7 4.2 2.6 2.2Q3 0.6 −7.9 1.7 2.7 −0.4 12.5 2.2 2.7 3.4 2.8 2.2Q4 2.3 −5.6 2.8 3.7 3.1 3.5 2.0 3.9 2.6 4.3 3.9
2010 Q1 4.6 −1.4 4.6 5.1 1.0 9.4 3.8 5.2 2.4 6.2 5.4

224
SER.DS Household final consumption expenditureSer vicesImplied deflators - seasonally adjustedcontinued 2006 = 100
Restaurants and hotels
Cater ing ser vices
Restaurants, cafes AccommodationEducation Total Total etc Canteens services
COICOP 10 11 11.1 11.1.1 11.1.2 11.2
UTJX UTJY UTQG AWSG AWSH UTQH2005 94.7 96.4 96.5 96.4 97.4 95.32006 100.0 100.0 100.0 100.0 100.0 100.02007 107.4 103.6 103.6 103.5 104.5 103.52008 114.8 107.8 108.1 108.1 108.8 106.12009 121.5 110.5 111.3 111.4 110.2 105.8
Percentage chang e , year on previous year
2005 4.9 3.7 3.4 3.4 3.4 5.22006 5.6 3.7 3.6 3.7 2.7 4.92007 7.4 3.6 3.6 3.5 4.5 3.52008 6.9 4.1 4.3 4.4 4.1 2.52009 5.8 2.5 3.0 3.1 1.3 −0.3
Seasonally adjusted
2007 Q1 105.2 102.2 102.1 102.1 102.7 102.5Q2 105.2 103.0 103.0 102.9 104.0 103.2Q3 106.7 104.0 104.0 103.9 105.3 104.1Q4 112.9 105.2 105.3 105.2 106.1 104.4
2008 Q1 112.9 106.1 106.3 106.2 107.4 105.1Q2 113.1 107.5 107.8 107.7 108.7 105.9Q3 114.0 108.5 108.8 108.8 109.4 106.5Q4 119.4 109.3 109.8 109.8 109.7 106.7
2009 Q1 119.5 109.5 110.1 110.1 109.4 106.2Q2 119.5 110.3 111.0 111.2 109.9 106.1Q3 120.8 110.8 111.7 111.9 110.4 105.7Q4 126.5 111.2 112.3 112.5 111.0 105.1
2010 Q1 126.1 112.3 113.6 113.8 111.9 105.2
Percentage chang e , quar ter on previous quarter
2007 Q1 −0.1 0.8 0.6 0.6 1.5 1.6Q2 − 0.8 0.9 0.8 1.3 0.7Q3 1.4 1.0 1.0 1.0 1.3 0.9Q4 5.8 1.2 1.3 1.3 0.8 0.3
2008 Q1 − 0.9 0.9 1.0 1.2 0.7Q2 0.2 1.3 1.4 1.4 1.2 0.8Q3 0.8 0.9 0.9 1.0 0.6 0.6Q4 4.7 0.7 0.9 0.9 0.3 0.2
2009 Q1 0.1 0.2 0.3 0.3 −0.3 −0.5Q2 − 0.7 0.8 1.0 0.5 −0.1Q3 1.1 0.5 0.6 0.6 0.5 −0.4Q4 4.7 0.4 0.5 0.5 0.5 −0.6
2010 Q1 −0.3 1.0 1.2 1.2 0.8 0.1
Percentage chang e , quar ter on corresponding quarter of previous year
2007 Q1 7.6 3.5 3.5 3.5 3.5 3.3Q2 7.6 3.6 3.6 3.6 4.4 3.8Q3 7.6 3.5 3.5 3.3 5.2 3.7Q4 7.2 3.7 3.7 3.6 4.8 3.5
2008 Q1 7.3 3.8 4.1 4.0 4.6 2.5Q2 7.5 4.4 4.7 4.7 4.5 2.6Q3 6.8 4.3 4.6 4.7 3.9 2.3Q4 5.8 3.9 4.3 4.4 3.4 2.2
2009 Q1 5.8 3.2 3.6 3.7 1.9 1.0Q2 5.7 2.6 3.0 3.2 1.1 0.2Q3 6.0 2.1 2.7 2.8 0.9 −0.8Q4 5.9 1.7 2.3 2.5 1.2 −1.5
2010 Q1 5.5 2.6 3.2 3.4 2.3 −0.9
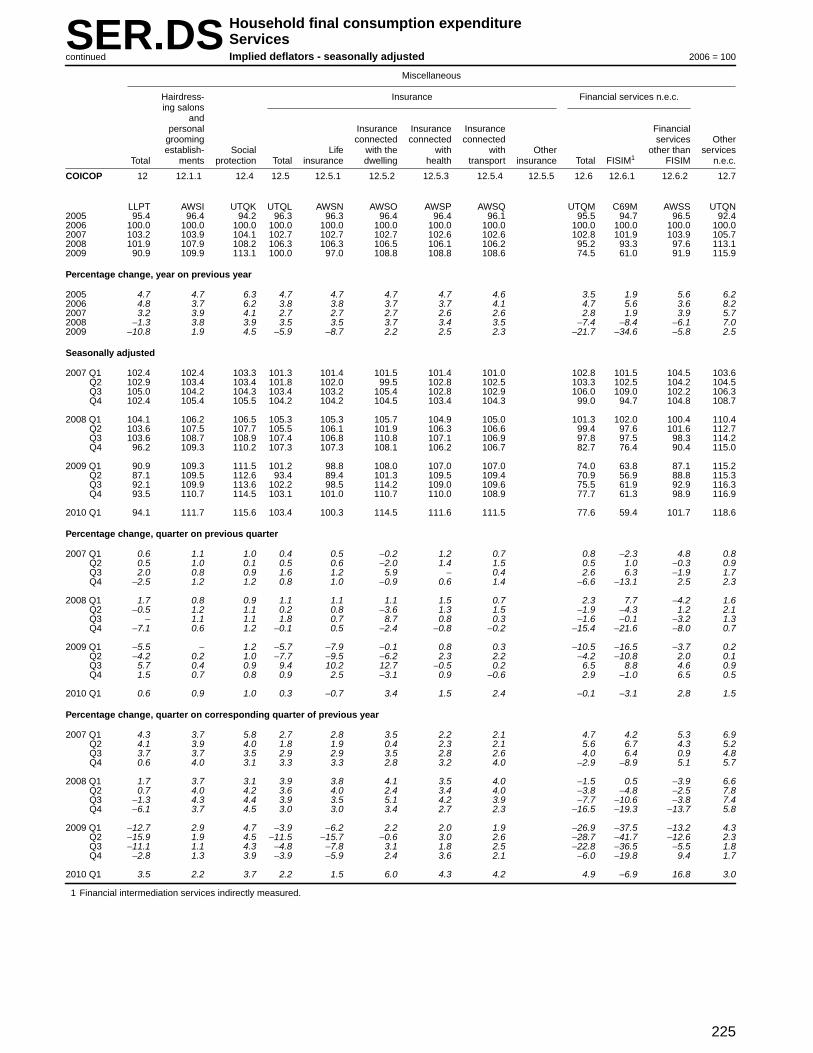
225
SER.DS Household final consumption expenditureSer vicesImplied deflators - seasonally adjustedcontinued 2006 = 100
Miscellaneous
Hairdress- Insurance Financial ser vices n.e.c.ing salons
andpersonal Insurance Insurance Insurance Financial
grooming connected connected connected ser vices Otherestablish- Social Life with the with with Other other than services
Total ments protection Total insurance dwelling health transpor t insurance Total FISIM1 FISIM n.e.c.
COICOP 12 12.1.1 12.4 12.5 12.5.1 12.5.2 12.5.3 12.5.4 12.5.5 12.6 12.6.1 12.6.2 12.7
LLPT AWSI UTQK UTQL AWSN AWSO AWSP AWSQ UTQM C69M AWSS UTQN2005 95.4 96.4 94.2 96.3 96.3 96.4 96.4 96.1 95.5 94.7 96.5 92.42006 100.0 100.0 100.0 100.0 100.0 100.0 100.0 100.0 100.0 100.0 100.0 100.02007 103.2 103.9 104.1 102.7 102.7 102.7 102.6 102.6 102.8 101.9 103.9 105.72008 101.9 107.9 108.2 106.3 106.3 106.5 106.1 106.2 95.2 93.3 97.6 113.12009 90.9 109.9 113.1 100.0 97.0 108.8 108.8 108.6 74.5 61.0 91.9 115.9
Percentage chang e , year on previous year
2005 4.7 4.7 6.3 4.7 4.7 4.7 4.7 4.6 3.5 1.9 5.6 6.22006 4.8 3.7 6.2 3.8 3.8 3.7 3.7 4.1 4.7 5.6 3.6 8.22007 3.2 3.9 4.1 2.7 2.7 2.7 2.6 2.6 2.8 1.9 3.9 5.72008 −1.3 3.8 3.9 3.5 3.5 3.7 3.4 3.5 −7.4 −8.4 −6.1 7.02009 −10.8 1.9 4.5 −5.9 −8.7 2.2 2.5 2.3 −21.7 −34.6 −5.8 2.5
Seasonally adjusted
2007 Q1 102.4 102.4 103.3 101.3 101.4 101.5 101.4 101.0 102.8 101.5 104.5 103.6Q2 102.9 103.4 103.4 101.8 102.0 99.5 102.8 102.5 103.3 102.5 104.2 104.5Q3 105.0 104.2 104.3 103.4 103.2 105.4 102.8 102.9 106.0 109.0 102.2 106.3Q4 102.4 105.4 105.5 104.2 104.2 104.5 103.4 104.3 99.0 94.7 104.8 108.7
2008 Q1 104.1 106.2 106.5 105.3 105.3 105.7 104.9 105.0 101.3 102.0 100.4 110.4Q2 103.6 107.5 107.7 105.5 106.1 101.9 106.3 106.6 99.4 97.6 101.6 112.7Q3 103.6 108.7 108.9 107.4 106.8 110.8 107.1 106.9 97.8 97.5 98.3 114.2Q4 96.2 109.3 110.2 107.3 107.3 108.1 106.2 106.7 82.7 76.4 90.4 115.0
2009 Q1 90.9 109.3 111.5 101.2 98.8 108.0 107.0 107.0 74.0 63.8 87.1 115.2Q2 87.1 109.5 112.6 93.4 89.4 101.3 109.5 109.4 70.9 56.9 88.8 115.3Q3 92.1 109.9 113.6 102.2 98.5 114.2 109.0 109.6 75.5 61.9 92.9 116.3Q4 93.5 110.7 114.5 103.1 101.0 110.7 110.0 108.9 77.7 61.3 98.9 116.9
2010 Q1 94.1 111.7 115.6 103.4 100.3 114.5 111.6 111.5 77.6 59.4 101.7 118.6
Percentage chang e , quar ter on previous quarter
2007 Q1 0.6 1.1 1.0 0.4 0.5 −0.2 1.2 0.7 0.8 −2.3 4.8 0.8Q2 0.5 1.0 0.1 0.5 0.6 −2.0 1.4 1.5 0.5 1.0 −0.3 0.9Q3 2.0 0.8 0.9 1.6 1.2 5.9 − 0.4 2.6 6.3 −1.9 1.7Q4 −2.5 1.2 1.2 0.8 1.0 −0.9 0.6 1.4 −6.6 −13.1 2.5 2.3
2008 Q1 1.7 0.8 0.9 1.1 1.1 1.1 1.5 0.7 2.3 7.7 −4.2 1.6Q2 −0.5 1.2 1.1 0.2 0.8 −3.6 1.3 1.5 −1.9 −4.3 1.2 2.1Q3 − 1.1 1.1 1.8 0.7 8.7 0.8 0.3 −1.6 −0.1 −3.2 1.3Q4 −7.1 0.6 1.2 −0.1 0.5 −2.4 −0.8 −0.2 −15.4 −21.6 −8.0 0.7
2009 Q1 −5.5 − 1.2 −5.7 −7.9 −0.1 0.8 0.3 −10.5 −16.5 −3.7 0.2Q2 −4.2 0.2 1.0 −7.7 −9.5 −6.2 2.3 2.2 −4.2 −10.8 2.0 0.1Q3 5.7 0.4 0.9 9.4 10.2 12.7 −0.5 0.2 6.5 8.8 4.6 0.9Q4 1.5 0.7 0.8 0.9 2.5 −3.1 0.9 −0.6 2.9 −1.0 6.5 0.5
2010 Q1 0.6 0.9 1.0 0.3 −0.7 3.4 1.5 2.4 −0.1 −3.1 2.8 1.5
Percentage chang e , quar ter on corresponding quarter of previous year
2007 Q1 4.3 3.7 5.8 2.7 2.8 3.5 2.2 2.1 4.7 4.2 5.3 6.9Q2 4.1 3.9 4.0 1.8 1.9 0.4 2.3 2.1 5.6 6.7 4.3 5.2Q3 3.7 3.7 3.5 2.9 2.9 3.5 2.8 2.6 4.0 6.4 0.9 4.8Q4 0.6 4.0 3.1 3.3 3.3 2.8 3.2 4.0 −2.9 −8.9 5.1 5.7
2008 Q1 1.7 3.7 3.1 3.9 3.8 4.1 3.5 4.0 −1.5 0.5 −3.9 6.6Q2 0.7 4.0 4.2 3.6 4.0 2.4 3.4 4.0 −3.8 −4.8 −2.5 7.8Q3 −1.3 4.3 4.4 3.9 3.5 5.1 4.2 3.9 −7.7 −10.6 −3.8 7.4Q4 −6.1 3.7 4.5 3.0 3.0 3.4 2.7 2.3 −16.5 −19.3 −13.7 5.8
2009 Q1 −12.7 2.9 4.7 −3.9 −6.2 2.2 2.0 1.9 −26.9 −37.5 −13.2 4.3Q2 −15.9 1.9 4.5 −11.5 −15.7 −0.6 3.0 2.6 −28.7 −41.7 −12.6 2.3Q3 −11.1 1.1 4.3 −4.8 −7.8 3.1 1.8 2.5 −22.8 −36.5 −5.5 1.8Q4 −2.8 1.3 3.9 −3.9 −5.9 2.4 3.6 2.1 −6.0 −19.8 9.4 1.7
2010 Q1 3.5 2.2 3.7 2.2 1.5 6.0 4.3 4.2 4.9 −6.9 16.8 3.0
1 Financial intermediation services indirectly measured.

226
0A.CN Household final consumption expenditureSummar y: annual dataCurrent prices - not seasonally adjusted £ million
2000 2001 2002 2003 2004 2005 2006 2007 2008 2009P.31 FINAL CONSUMPTION EXPENDITURE OF HOUSEHOLDS
01. Food and non-alcoholic beverages ABZV 58 628 59 804 61 310 63 174 65 156 67 138 69 643 74 133 80 316 83 43901.1 Food ABZW 51 905 52 742 53 984 55 507 57 059 58 822 60 856 65 080 70 973 73 43501.2 Non-alcoholic beverages ADFK 6 723 7 062 7 326 7 667 8 097 8 316 8 787 9 053 9 343 10 004
02. Alcoholic beverages and tobacco ADFL 24 617 25 158 25 966 27 293 28 579 28 853 29 286 29 787 30 306 31 13102.1 Alcoholic beverages ADFM 10 395 10 700 11 344 12 027 13 274 13 476 13 637 14 134 14 656 14 85102.2 Tobacco ADFN 14 222 14 458 14 622 15 266 15 305 15 377 15 649 15 653 15 650 16 280
03. Clothing and footwear ADFP 35 479 36 822 39 092 41 155 42 339 43 532 45 064 46 327 47 473 47 60003.1 Clothing ADFQ 31 048 32 103 33 927 35 689 36 490 37 529 38 496 39 618 40 546 41 08603.2 Footwear ADFR 4 431 4 719 5 165 5 466 5 849 6 003 6 568 6 709 6 927 6 514
04. Housing, water, electricity, gas and other fuels ADFS 108 050 115 905 121 238 129 052 139 116 149 309 160 985 171 959 186 958 194 24504.1 Actual rentals for housing ADFT 23 595 25 302 25 828 27 610 28 648 29 547 32 716 35 881 38 566 41 11204.2 Imputed rentals for housing ADFU 54 378 59 581 63 279 68 458 72 850 77 339 80 668 86 236 91 444 96 66704.3 Maintenance and repair of the dwelling ADFV 10 512 11 340 12 306 12 616 14 235 14 509 14 221 14 411 14 884 14 92104.4 Water supply and miscellaneous dwelling services ADFW 5 033 5 059 5 222 5 438 5 773 6 428 6 899 7 637 8 059 8 04904.5 Electricity, gas and other fuels ADFX 14 532 14 623 14 603 14 930 17 610 21 486 26 481 27 794 34 005 33 496
Furnishings, household equipment and05. routine maintenance of the house ADFY 35 675 37 974 40 448 42 466 43 492 44 475 45 613 46 806 46 723 43 83605.1 Furniture, fur nishings, car pets
and other floor coverings ADFZ 13 758 14 362 15 591 16 789 16 806 16 816 17 256 18 040 17 597 16 59505.2 Household textiles ADGG 4 465 4 636 5 086 5 452 5 455 5 248 5 433 6 013 6 095 5 83005.3 Household appliances ADGL 5 156 5 758 5 715 5 578 6 104 6 414 6 472 6 310 6 440 6 12105.4 Glassware, tableware and household utensils ADGM 4 231 4 609 4 710 4 701 4 010 4 415 4 473 4 344 4 341 3 77605.5 Tools and equipment for house and garden ADGN 2 722 2 977 3 355 3 589 4 141 4 244 4 723 5 225 5 042 4 34205.6 Goods and services for routine household maintenance ADGO 5 343 5 632 5 991 6 357 6 976 7 338 7 256 6 874 7 208 7 172
06. Health ADGP 9 208 9 976 10 778 11 335 11 881 12 183 13 502 14 130 14 209 14 25906.1 Medical products, appliances and equipment ADGQ 5 265 5 722 6 266 6 542 6 776 6 770 7 275 7 610 7 800 7 96706.2 Out-patient ser vices ADGR 2 178 2 344 2 422 2 553 2 747 2 909 3 483 3 809 3 462 3 18006.3 Hospital ser vices ADGS 1 765 1 910 2 090 2 240 2 358 2 504 2 744 2 711 2 947 3 112
07. Transpor t ADGT 93 052 96 435 100 147 104 569 109 472 116 186 119 979 129 780 132 534 124 81407.1 Purchase of vehicles ADGU 33 291 35 864 36 574 38 016 38 443 38 562 38 810 42 047 39 722 36 87307.2 Operation of personal transpor t equipment ADGV 37 059 37 028 38 816 40 507 44 081 48 685 50 486 53 689 57 155 54 72407.3 Transpor t ser vices ADGW 22 702 23 543 24 757 26 046 26 948 28 939 30 683 34 044 35 657 33 217
08. Communication ADGX 13 356 14 157 14 675 15 654 17 217 17 939 18 115 18 471 18 340 18 68608.1 Postal services CDEF 873 870 878 890 961 1 016 1 020 1 037 1 027 1 08708.2 Telephone & telefax equipment ADWO 601 636 644 810 890 950 973 967 983 1 04308.3 Telephone & telefax services ADWP 11 882 12 651 13 153 13 954 15 366 15 973 16 122 16 467 16 330 16 556
09. Recreation and culture ADGY 70 154 73 452 79 122 84 386 88 447 90 130 93 795 96 742 99 089 99 08309.1 Audio-visual, photographic and infor mation
processing equipment ADGZ 17 034 17 580 18 051 19 408 20 564 20 919 21 249 20 618 21 203 21 42609.2 Other major durables for recreation and culture ADHL 3 944 4 325 4 672 5 126 5 381 5 835 6 254 6 379 7 003 7 03309.3 Other recreational items and equipment; flowers,
garden and pets ADHZ 18 636 20 216 22 475 23 894 24 224 24 144 25 267 27 134 28 773 28 29109.4 Recreational and cultural services ADIA 20 272 21 034 23 555 25 278 26 572 27 365 28 731 30 097 30 229 30 58209.5 Newspapers, books and stationery ADIC 10 268 10 297 10 369 10 680 11 706 11 867 12 294 12 514 11 881 11 75109.6 Package holidays1 ADID − − − − − − − − − −
10. Education ADIE 9 534 9 409 9 381 9 610 10 763 11 050 11 711 12 356 12 591 13 024
11. Restaurants and hotels ADIF 68 557 71 620 76 426 78 902 82 886 85 473 87 812 90 729 91 933 88 56311.1 Catering services ADIG 59 019 62 449 66 701 68 839 72 667 74 642 76 072 78 121 78 798 75 84111.2 Accommodation ser vices ADIH 9 538 9 171 9 725 10 063 10 219 10 831 11 740 12 608 13 135 12 722
12. Miscellaneous goods and services ADII 83 307 87 541 91 818 94 851 98 579 105 913 112 718 118 266 118 235 104 62112.1 Personal care ADIJ 13 883 14 626 16 444 18 181 19 083 19 392 20 330 21 352 21 804 20 84012.3 Personal effects n.e.c. ADIK 4 748 5 455 6 140 6 462 6 838 6 656 7 495 7 060 6 693 7 59512.4 Social protection ADIL 8 643 8 963 9 219 9 501 8 805 9 131 9 962 10 868 11 391 10 88312.5 Insurance ADIM 22 238 25 423 25 456 24 373 25 119 26 397 26 740 28 535 28 254 25 19012.6 Financial ser vices n.e.c. ADIN 27 706 26 989 28 384 29 977 31 843 36 794 40 765 42 581 41 916 32 17412.7 Other ser vices n.e.c. ADIO 6 089 6 085 6 175 6 357 6 891 7 543 7 426 7 870 8 177 7 939
Total Final consumption expenditure in the UK byresident and non-resident households
(domestic concept) ABQI 609 617 638 253 670 401 702 447 737 927 772 181 808 223 849 486 878 707 863 301
P.33 Final consumption expenditure outside the UKby UK resident households ABTA 21 654 22 907 24 435 26 314 27 550 29 028 30 389 31 701 33 285 29 096
-P.34 less Final consumption expenditure in the UK byhouseholds resident in the rest of the wor ld CDFD −14 713 −13 383 −13 872 −14 156 −15 610 −17 069 −19 002 −19 492 −19 798 −19 483
P.31 Final consumption expenditure by UK residenthouseholds in the UK and abroad
(national concept) ABPB 616 558 647 777 680 964 714 605 749 867 784 140 819 610 861 695 892 194 872 914
1 Package holidays data are dispersed between components (transpor t etc)

227
0GSA.CN Household final consumption expenditureSummar y goods and services: annual dataCurrent prices - not seasonally adjusted £ million
2000 2001 2002 2003 2004 2005 2006 2007 2008 2009
Durable goods05. Furnishings, household equipment and
routine maintenance of the house LLIJ 18 006 19 275 20 470 21 595 21 909 22 363 22 876 23 669 23 612 21 94106. Health LLIK 1 997 2 109 2 411 2 604 2 512 2 400 2 706 2 942 2 897 3 05807. Transpor t LLIL 33 291 35 864 36 574 38 016 38 443 38 562 38 810 42 047 39 722 36 87308. Communication LLIM 601 636 644 810 890 950 973 967 983 1 04309. Recreation and culture LLIN 14 878 15 970 16 471 17 752 18 859 19 954 21 240 21 293 22 161 22 64512. Miscellaneous goods and services LLIO 3 403 3 750 4 204 4 284 4 815 4 622 5 096 4 693 4 433 5 300
D Total durable goods UTIA 72 176 77 604 80 774 85 061 87 428 88 851 91 701 95 611 93 808 90 860
Semi-durable goods03. Clothing and footwear LLJL 34 759 36 092 38 351 40 389 41 639 42 767 44 225 45 397 46 404 46 51405. Furnishings, household equipment and
routine maintenance of the house LLJM 11 677 12 400 13 361 13 932 14 009 14 166 14 888 15 666 15 383 14 20407. Transpor t LLJN 2 772 2 783 3 112 3 423 3 323 3 789 3 768 3 754 4 182 4 24809. Recreation and culture LLJO 20 405 21 606 23 910 26 009 26 811 25 953 26 462 27 338 28 292 27 87112. Miscellaneous goods and services LLJP 2 018 2 427 2 886 3 356 3 421 3 290 3 427 3 374 3 154 3 385
SD Total semi-durable goods UTIQ 71 631 75 308 81 620 87 109 89 203 89 965 92 770 95 529 97 415 96 222
Non-durable goods01. Food and drink ABZV 58 628 59 804 61 310 63 174 65 156 67 138 69 643 74 133 80 316 83 43902. Alcohol and tobacco ADFL 24 617 25 158 25 966 27 293 28 579 28 853 29 286 29 787 30 306 31 13104. Housing, water, electr icity, gas and
other fuels LLIX 22 265 23 076 23 444 24 241 28 324 32 195 36 530 38 218 45 002 44 61405. Furnishings, household equipment and
routine maintenance of the house LLIY 2 786 2 972 3 169 3 338 3 748 3 805 4 007 4 006 4 157 4 34406. Health LLIZ 3 268 3 613 3 855 3 938 4 264 4 370 4 569 4 668 4 903 4 90907. Transpor t LLJA 19 987 19 391 19 129 20 072 22 583 24 729 25 918 28 432 30 611 26 78209. Recreation and culture LLJB 12 959 13 107 13 392 13 507 14 235 14 444 15 147 15 323 15 297 15 25212. Miscellaneous goods and services LLJC 9 463 9 884 11 272 12 602 12 966 13 266 14 237 15 072 15 410 14 380
ND Total non-durable goods UTII 153 973 157 005 161 537 168 165 179 855 188 800 199 337 209 639 226 002 224 851
Total goods01. Food and drink ABZV 58 628 59 804 61 310 63 174 65 156 67 138 69 643 74 133 80 316 83 43902. Alcohol and tobacco ADFL 24 617 25 158 25 966 27 293 28 579 28 853 29 286 29 787 30 306 31 13103. Clothing and footwear LLIP 34 759 36 092 38 351 40 389 41 639 42 767 44 225 45 397 46 404 46 51404. Housing, water, electr icity, gas and
other fuels LLIQ 22 265 23 076 23 444 24 241 28 324 32 195 36 530 38 218 45 002 44 61405. Furnishings, household equipment and
routine maintenance of the house LLIR 32 469 34 647 37 000 38 865 39 666 40 334 41 771 43 341 43 152 40 48906. Health LLIS 5 265 5 722 6 266 6 542 6 776 6 770 7 275 7 610 7 800 7 96707. Transpor t LLIT 56 050 58 038 58 815 61 511 64 349 67 080 68 496 74 233 74 515 67 90308. Communication LLIU 601 636 644 810 890 950 973 967 983 1 04309. Recreation and culture LLIV 48 242 50 683 53 773 57 268 59 905 60 351 62 849 63 954 65 750 65 76812. Miscellaneous goods and services LLIW 14 884 16 061 18 362 20 242 21 202 21 178 22 760 23 139 22 997 23 065
TG Total goods UTIE 297 780 309 917 323 931 340 335 356 486 367 616 383 808 400 779 417 225 411 933
Ser vices03. Clothing and footwear LLJD 720 730 741 766 700 765 839 930 1 069 1 08604. Housing, water, electr icity, gas and
other fuels LLJE 85 785 92 829 97 794 104 811 110 792 117 114 124 455 133 741 141 956 149 63105. Furnishings, household equipment and
routine maintenance of the house LLJF 3 206 3 327 3 448 3 601 3 826 4 141 3 842 3 465 3 571 3 34706. Health LLJG 3 943 4 254 4 512 4 793 5 105 5 413 6 227 6 520 6 409 6 29207. Transpor t LLJH 37 002 38 397 41 332 43 058 45 123 49 106 51 483 55 547 58 019 56 91108. Communication LLJI 12 755 13 521 14 031 14 844 16 327 16 989 17 142 17 504 17 357 17 64309. Recreation and culture LLJJ 21 912 22 769 25 349 27 118 28 542 29 779 30 946 32 788 33 339 33 31510. Education ADIE 9 534 9 409 9 381 9 610 10 763 11 050 11 711 12 356 12 591 13 02411. Restaurants and hotels ADIF 68 557 71 620 76 426 78 902 82 886 85 473 87 812 90 729 91 933 88 56312. Miscellaneous goods and services LLJK 68 423 71 480 73 456 74 609 77 377 84 735 89 958 95 127 95 238 81 556
S Total services UTIM 311 837 328 336 346 470 362 112 381 441 404 565 424 415 448 707 461 482 451 368
Total Final consumption expenditure in the UKby resident and non-resident households
(domestic concept) ABQI 609 617 638 253 670 401 702 447 737 927 772 181 808 223 849 486 878 707 863 301
P.33 Final consumption expenditure outside the UKby UK resident households ABTA 21 654 22 907 24 435 26 314 27 550 29 028 30 389 31 701 33 285 29 096
-P.34 Less Final consumption expenditure in the UKby households resident in the rest of the wor ld CDFD −14 713 −13 383 −13 872 −14 156 −15 610 −17 069 −19 002 −19 492 −19 798 −19 483
P.31 Final consumption expenditure by UK residenthouseholds in the UK and abroad
(national concept) ABPB 616 558 647 777 680 964 714 605 749 867 784 140 819 610 861 695 892 194 872 914

228
0A.KN Household final consumption expenditureSummar y: annual dataChained volume measures, reference year 2006 - not seasonally adjusted £ million
2000 2001 2002 2003 2004 2005 2006 2007 2008 2009P.31 FINAL CONSUMPTION EXPENDITURE OF HOUSEHOLDS
01. Food and non-alcoholic beverages ADIP 64 213 63 284 64 419 65 488 67 682 68 714 69 643 70 865 70 563 69 59001.1 Food ADIQ 56 421 55 135 55 996 56 680 59 257 60 092 60 856 62 151 61 813 60 63601.2 Non-alcoholic beverages ADIR 6 972 7 323 7 581 7 951 8 431 8 625 8 787 8 714 8 750 8 954
02. Alcoholic beverages and tobacco ADIS 27 690 27 475 27 876 28 305 29 344 29 271 29 286 29 097 28 798 27 96602.1 Alcoholic beverages ADIT 10 607 10 965 11 658 12 179 13 239 13 649 13 637 14 105 14 235 13 46302.2 Tobacco ADIU 18 216 17 519 17 144 17 022 16 562 16 039 15 649 14 992 14 563 14 503
03. Clothing and footwear ADIW 29 926 32 510 36 294 38 798 41 029 43 163 45 064 46 727 49 763 52 17403.1 Clothing ADIX 25 913 28 215 31 515 33 760 35 404 37 248 38 496 40 101 42 888 45 73103.2 Footwear ADIY 4 025 4 302 4 787 5 046 5 626 5 918 6 568 6 626 6 875 6 443
04. Housing, water, electricity, gas and other fuels ADIZ 150 874 152 620 154 101 155 392 157 268 159 671 160 985 160 351 162 596 161 01104.1 Actual rentals for housing ADJA 30 739 30 820 30 445 31 036 30 790 30 466 32 716 33 567 34 961 35 40304.2 Imputed rentals for housing ADJB 76 458 77 145 78 488 79 538 79 053 80 422 80 668 80 461 80 920 81 98604.3 Maintenance and repair of the dwelling ADJC 13 177 13 701 14 336 14 238 15 085 14 942 14 221 13 772 13 473 12 95804.4 Water supply and miscellaneous dwelling services ADJD 6 864 6 855 6 912 6 930 6 773 6 866 6 899 7 185 7 124 6 76904.5 Electricity, gas and other fuels ADJE 20 243 20 416 19 896 19 945 24 837 26 719 26 481 25 366 26 118 23 895
Furnishings, household equipment and05. routine maintenance of the house ADJF 37 527 39 599 41 916 43 895 44 172 44 911 45 613 45 586 44 164 39 733
Fur niture, fur nishings, car pets05.1 and other floor coverings ADJG 15 200 15 562 16 647 17 582 17 676 17 203 17 256 17 368 16 084 14 57005.2 Household textiles ADJH 4 270 4 439 4 937 5 338 5 222 5 138 5 433 6 067 6 165 5 74005.3 Household appliances ADJI 4 577 5 160 5 176 5 187 5 858 6 253 6 472 6 156 6 214 5 52205.4 Glassware, tableware and household utensils ADJJ 4 257 4 644 4 705 4 689 3 917 4 405 4 473 4 214 4 098 3 42405.5 Tools and equipment for house and garden ADJK 2 625 2 897 3 284 3 641 4 134 4 309 4 723 5 133 4 883 4 13505.6 Goods and services for routine household maintenance ADJL 5 949 6 106 6 346 6 625 7 453 7 640 7 256 6 648 6 720 6 342
06. Health ADJM 10 701 10 984 11 275 11 640 12 138 12 342 13 502 13 832 13 715 13 38806.1 Medical products, appliances and equipment ADJN 6 044 6 253 6 559 6 795 6 734 6 739 7 275 7 512 7 568 7 62006.2 Out-patient ser vices ADJO 2 429 2 460 2 394 2 453 2 912 3 034 3 483 3 684 3 324 2 94906.3 Hospital ser vices ADJP 2 251 2 294 2 349 2 421 2 494 2 577 2 744 2 636 2 823 2 819
07. Transpor t ADJQ 103 721 106 175 109 555 112 733 114 133 118 335 119 979 126 870 123 973 117 07407.1 Purchase of vehicles ADJR 30 549 33 847 34 771 36 659 35 943 37 465 38 810 41 904 40 351 36 58107.2 Operation of personal transpor t equipment ADJS 46 698 46 819 48 541 48 349 49 962 51 391 50 486 51 669 50 087 49 45207.3 Transpor t ser vices ADJT 27 516 25 712 26 509 27 657 28 389 29 592 30 683 33 297 33 535 31 041
08. Communication ADJU 12 453 14 173 14 510 15 351 16 711 17 853 18 115 19 246 19 727 20 15308.1 Postal services CCGZ 837 823 827 813 837 928 1 020 1 163 1 311 1 52508.2 Telephone & telefax equipment ADQF 498 541 596 754 753 882 973 1 194 1 443 1 64808.3 Telephone & telefax services ADQG 11 160 12 858 13 131 13 825 15 153 16 060 16 122 16 889 16 973 16 980
09. Recreation and culture ADJV 62 967 67 145 71 814 78 097 85 256 88 977 93 795 98 241 104 415 106 88609.1 Audio-visual, photographic and infor mation
processing equipment ADJW 8 884 10 021 11 120 13 240 15 924 18 590 21 249 23 769 29 599 34 41209.2 Other major durables for recreation and culture ADJX 4 396 4 793 5 063 5 388 5 471 5 863 6 254 6 384 6 930 6 72409.3 Other recreational items and equipment; flowers,
gardens and pets ADJY 16 015 17 415 19 858 21 924 23 653 23 810 25 267 27 027 28 533 27 34809.4 Recreational and cultural services ADJZ 25 526 26 453 26 765 27 805 28 892 28 680 28 731 28 835 28 270 27 87409.5 Newspapers, books and stationery ADKM 11 859 11 572 11 408 11 328 12 229 12 299 12 294 12 226 11 083 10 52809.6 Package holidays1 ADMI − − − − − − − − − −
10. Education ADMJ 13 234 12 316 11 624 11 070 11 918 11 670 11 711 11 502 10 971 10 716
11. Restaurants and hotels ADMK 83 458 83 657 85 703 86 359 89 162 88 686 87 812 87 577 85 249 80 17411.1 Catering services ADML 71 879 73 161 74 964 75 377 77 867 77 312 76 072 75 399 72 864 68 14711.2 Accommodation ser vices ADMM 11 568 10 489 10 732 10 972 11 285 11 368 11 740 12 178 12 385 12 027
12. Miscellaneous goods and services ADMN 94 126 98 240 102 236 105 394 106 098 109 877 112 718 114 623 115 279 110 13912.1 Personal care ADMO 14 147 14 611 16 406 18 048 18 979 19 140 20 330 20 755 20 862 18 80412.3 Personal effects n.e.c. ADMP 5 257 5 989 6 717 6 902 7 234 6 961 7 495 6 767 6 056 6 48012.4 Social protection ADMQ 12 359 12 002 11 647 11 337 9 942 9 695 9 962 10 436 10 524 9 62512.5 Insurance ADMR 24 780 26 810 26 253 25 719 27 308 27 418 26 740 27 786 26 574 25 19312.6 Financial ser vices n.e.c. ADMS 27 660 29 012 31 435 33 614 34 490 38 540 40 765 41 434 44 031 43 18912.7 Other ser vices n.e.c. ADMT 9 019 8 394 8 035 7 815 7 917 8 162 7 426 7 445 7 232 6 848
Total Final consumption expenditure in the UK byresident and non-resident households
(domestic concept) ABQJ 683 413 702 843 727 768 750 607 774 273 793 253 808 223 824 517 829 213 809 004
P.33 Final consumption expenditure outside the UKby UK resident households ABTC 25 857 26 613 28 193 28 128 30 005 29 663 30 389 31 149 30 845 21 981
-P.34 less Final consumption expenditure in the UK byhouseholds resident in the rest of the wor ld CCHX −17 510 −15 464 −15 605 −15 457 −16 700 −17 636 −19 002 −18 249 −17 884 −17 818
P.31 Final consumption expenditure by UK residenthouseholds in the UK and abroad
(national concept) ABPF 691 461 713 535 739 832 762 772 787 523 805 273 819 610 837 417 842 174 813 167
1 Package holidays data are dispersed between components (transpor t etc)

229
0GSA.KN Household final consumption expenditureSummar y goods and services: annual dataChained volume measures, reference year 2006 - not seasonally adjusted £ million
2000 2001 2002 2003 2004 2005 2006 2007 2008 2009
Durable goods05. Furnishings, household equipment and
routine maintenance of the house LLME 18 748 19 866 20 945 21 953 22 456 22 602 22 876 22 859 21 903 19 41406. Health LLMF 3 101 2 951 3 058 3 289 2 529 2 387 2 706 2 908 2 814 2 94707. Transpor t LLMG 30 549 33 847 34 770 36 659 35 943 37 465 38 810 41 904 40 351 36 58108. Communication LLMH 495 538 591 748 753 883 973 1 194 1 443 1 64809. Recreation and culture LLMI 7 803 9 261 10 349 12 321 14 697 17 771 21 240 24 531 30 362 34 74312. Miscellaneous goods and services LLMJ 3 920 4 260 4 724 4 641 5 156 4 908 5 096 4 475 3 937 4 380
D Total durable goods UTIC 61 700 68 280 72 194 77 906 80 704 85 777 91 701 97 871 100 810 99 713
Semi-durable goods03. Clothing and footwear LLNG 29 127 31 706 35 483 37 986 40 259 42 362 44 225 45 840 48 779 51 19505. Furnishings, household equipment and
routine maintenance of the house LLNH 11 953 12 732 13 768 14 514 13 665 14 079 14 888 15 493 15 058 13 50407. Transpor t LLNI 3 192 3 219 3 545 3 826 3 536 3 917 3 768 3 704 3 989 3 85009. Recreation and culture LLNJ 17 315 18 366 20 804 23 485 25 907 25 563 26 462 27 206 28 443 28 07412. Miscellaneous goods and services LLNK 2 150 2 553 3 059 3 515 3 583 3 347 3 427 3 257 2 954 3 089
SD Total semi-durable goods UTIS 63 375 68 223 76 322 83 044 86 942 89 258 92 770 95 500 99 223 99 712
Non-durable goods01. Food and drink ADIP 64 213 63 284 64 419 65 488 67 682 68 714 69 643 70 865 70 563 69 59002. Alcohol and tobacco ADIS 27 690 27 475 27 876 28 305 29 344 29 271 29 286 29 097 28 798 27 96604. Housing, water, electr icity, gas and
other fuels LLMS 32 061 33 125 33 017 33 515 36 578 37 868 36 530 35 301 35 977 33 23205. Furnishings, household equipment and
routine maintenance of the house LLMT 2 654 2 865 3 087 3 323 3 876 3 936 4 007 3 925 3 955 3 83306. Health LLMU 3 190 3 461 3 658 3 698 4 208 4 352 4 569 4 604 4 754 4 67307. Transpor t LLMV 23 028 23 553 23 885 24 183 25 765 26 035 25 918 27 657 26 052 25 07709. Recreation and culture LLMW 14 179 14 054 14 204 14 023 14 655 14 795 15 147 15 096 14 502 13 76112. Miscellaneous goods and services LLMX 8 754 9 074 10 530 11 929 12 417 12 826 14 237 14 713 14 930 12 927
ND Total non-durable goods UTIK 175 316 176 326 180 591 184 639 194 376 197 538 199 337 201 258 199 531 191 059
Total goods01. Food and drink ADIP 64 213 63 284 64 419 65 488 67 682 68 714 69 643 70 865 70 563 69 59002. Alcohol and tobacco ADIS 27 690 27 475 27 876 28 305 29 344 29 271 29 286 29 097 28 798 27 96603. Clothing and footwear LLMK 29 127 31 706 35 483 37 986 40 259 42 362 44 225 45 840 48 779 51 19504. Housing, water, electr icity, gas and
other fuels LLML 32 061 33 125 33 017 33 515 36 578 37 868 36 530 35 301 35 977 33 23205. Furnishings, household equipment and
routine maintenance of the house LLMM 33 298 35 406 37 743 39 734 39 975 40 604 41 771 42 277 40 916 36 75106. Health LLMN 6 044 6 253 6 559 6 795 6 734 6 739 7 275 7 512 7 568 7 62007. Transpor t LLMO 56 448 60 549 62 150 64 761 65 090 67 337 68 496 73 265 70 392 65 50808. Communication LLMP 495 538 591 748 753 883 973 1 194 1 443 1 64809. Recreation and culture LLMQ 37 020 40 016 43 872 48 807 54 530 57 920 62 849 66 833 73 307 76 57812. Miscellaneous goods and services LLMR 14 769 15 781 18 212 20 052 21 097 21 068 22 760 22 445 21 821 20 396
TG Total goods UTIG 296 458 310 458 327 675 345 074 361 310 372 253 383 808 394 629 399 564 390 484
Ser vices03. Clothing and footwear LLMY 866 849 834 824 770 800 839 887 984 97904. Housing, water, electr icity, gas and
other fuels LLMZ 118 456 119 162 120 702 121 518 120 757 121 984 124 455 125 050 126 619 127 77905. Furnishings, household equipment and
routine maintenance of the house LLNA 4 428 4 309 4 225 4 173 4 211 4 325 3 842 3 309 3 248 2 98206. Health LLNB 4 670 4 742 4 724 4 853 5 405 5 610 6 227 6 320 6 147 5 76807. Transpor t LLNC 48 043 45 614 47 439 47 937 49 034 51 000 51 483 53 605 53 581 51 56608. Communication LLND 11 979 13 663 13 940 14 615 15 975 16 976 17 142 18 052 18 284 18 50509. Recreation and culture LLNE 27 698 28 646 28 929 29 924 31 051 31 199 30 946 31 408 31 108 30 30810. Education ADMJ 13 234 12 316 11 624 11 070 11 918 11 670 11 711 11 502 10 971 10 71611. Restaurants and hotels ADMK 83 458 83 657 85 703 86 359 89 162 88 686 87 812 87 577 85 249 80 17412. Miscellaneous goods and services LLNF 79 994 83 058 84 320 85 446 84 964 88 852 89 958 92 178 93 458 89 743
S Total services UTIO 391 206 395 306 401 865 406 317 413 201 421 100 424 415 429 888 429 649 418 520
Total Final consumption expenditure in the UKby resident and non-resident households
(domestic concept) ABQJ 683 413 702 843 727 768 750 607 774 273 793 253 808 223 824 517 829 213 809 004
P.33 Final consumption expenditure outside the UKby UK resident households ABTC 25 857 26 613 28 193 28 128 30 005 29 663 30 389 31 149 30 845 21 981
-P.34 Less Final consumption expenditure in the UKby households resident in the rest of the wor ld CCHX −17 510 −15 464 −15 605 −15 457 −16 700 −17 636 −19 002 −18 249 −17 884 −17 818
P.31 Final consumption expenditure by UK residenthouseholds in the UK and abroad
(national concept) ABPF 691 461 713 535 739 832 762 772 787 523 805 273 819 610 837 417 842 174 813 167
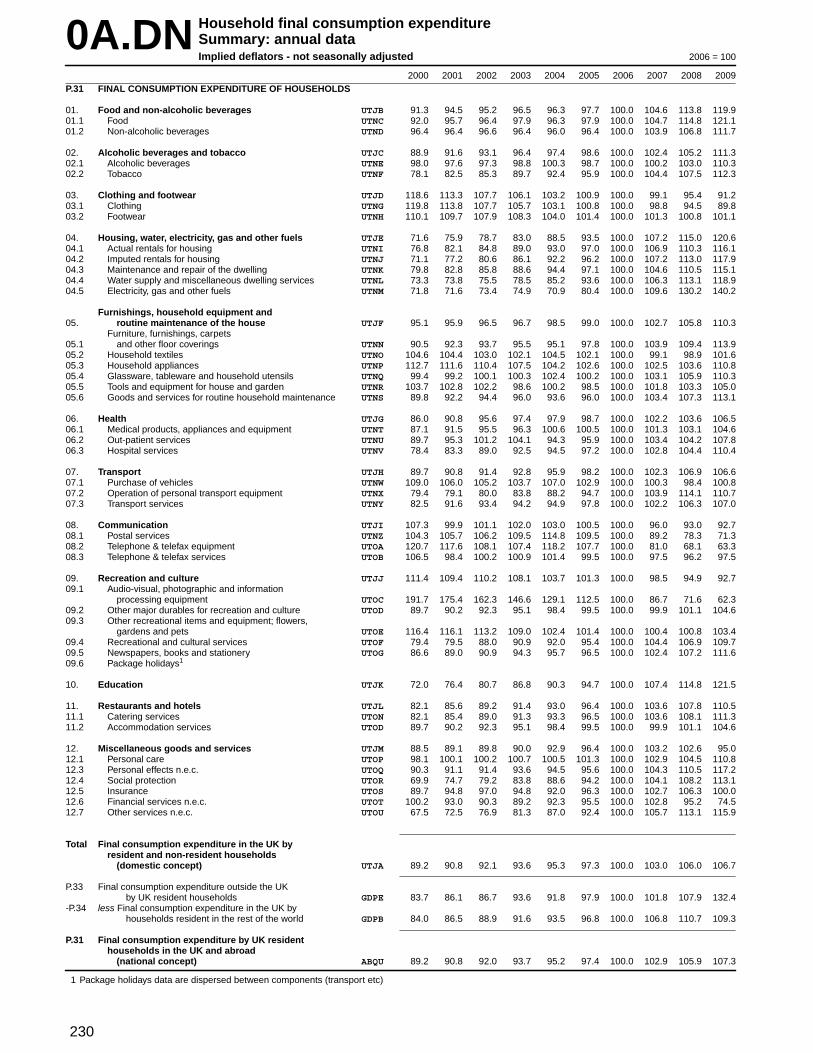
230
0A.DN Household final consumption expenditureSummar y: annual dataImplied deflators - not seasonally adjusted 2006 = 100
2000 2001 2002 2003 2004 2005 2006 2007 2008 2009P.31 FINAL CONSUMPTION EXPENDITURE OF HOUSEHOLDS
01. Food and non-alcoholic beverages UTJB 91.3 94.5 95.2 96.5 96.3 97.7 100.0 104.6 113.8 119.901.1 Food UTNC 92.0 95.7 96.4 97.9 96.3 97.9 100.0 104.7 114.8 121.101.2 Non-alcoholic beverages UTND 96.4 96.4 96.6 96.4 96.0 96.4 100.0 103.9 106.8 111.7
02. Alcoholic beverages and tobacco UTJC 88.9 91.6 93.1 96.4 97.4 98.6 100.0 102.4 105.2 111.302.1 Alcoholic beverages UTNE 98.0 97.6 97.3 98.8 100.3 98.7 100.0 100.2 103.0 110.302.2 Tobacco UTNF 78.1 82.5 85.3 89.7 92.4 95.9 100.0 104.4 107.5 112.3
03. Clothing and footwear UTJD 118.6 113.3 107.7 106.1 103.2 100.9 100.0 99.1 95.4 91.203.1 Clothing UTNG 119.8 113.8 107.7 105.7 103.1 100.8 100.0 98.8 94.5 89.803.2 Footwear UTNH 110.1 109.7 107.9 108.3 104.0 101.4 100.0 101.3 100.8 101.1
04. Housing, water, electricity, gas and other fuels UTJE 71.6 75.9 78.7 83.0 88.5 93.5 100.0 107.2 115.0 120.604.1 Actual rentals for housing UTNI 76.8 82.1 84.8 89.0 93.0 97.0 100.0 106.9 110.3 116.104.2 Imputed rentals for housing UTNJ 71.1 77.2 80.6 86.1 92.2 96.2 100.0 107.2 113.0 117.904.3 Maintenance and repair of the dwelling UTNK 79.8 82.8 85.8 88.6 94.4 97.1 100.0 104.6 110.5 115.104.4 Water supply and miscellaneous dwelling services UTNL 73.3 73.8 75.5 78.5 85.2 93.6 100.0 106.3 113.1 118.904.5 Electricity, gas and other fuels UTNM 71.8 71.6 73.4 74.9 70.9 80.4 100.0 109.6 130.2 140.2
Furnishings, household equipment and05. routine maintenance of the house UTJF 95.1 95.9 96.5 96.7 98.5 99.0 100.0 102.7 105.8 110.3
Fur niture, fur nishings, car pets05.1 and other floor coverings UTNN 90.5 92.3 93.7 95.5 95.1 97.8 100.0 103.9 109.4 113.905.2 Household textiles UTNO 104.6 104.4 103.0 102.1 104.5 102.1 100.0 99.1 98.9 101.605.3 Household appliances UTNP 112.7 111.6 110.4 107.5 104.2 102.6 100.0 102.5 103.6 110.805.4 Glassware, tableware and household utensils UTNQ 99.4 99.2 100.1 100.3 102.4 100.2 100.0 103.1 105.9 110.305.5 Tools and equipment for house and garden UTNR 103.7 102.8 102.2 98.6 100.2 98.5 100.0 101.8 103.3 105.005.6 Goods and services for routine household maintenance UTNS 89.8 92.2 94.4 96.0 93.6 96.0 100.0 103.4 107.3 113.1
06. Health UTJG 86.0 90.8 95.6 97.4 97.9 98.7 100.0 102.2 103.6 106.506.1 Medical products, appliances and equipment UTNT 87.1 91.5 95.5 96.3 100.6 100.5 100.0 101.3 103.1 104.606.2 Out-patient ser vices UTNU 89.7 95.3 101.2 104.1 94.3 95.9 100.0 103.4 104.2 107.806.3 Hospital ser vices UTNV 78.4 83.3 89.0 92.5 94.5 97.2 100.0 102.8 104.4 110.4
07. Transpor t UTJH 89.7 90.8 91.4 92.8 95.9 98.2 100.0 102.3 106.9 106.607.1 Purchase of vehicles UTNW 109.0 106.0 105.2 103.7 107.0 102.9 100.0 100.3 98.4 100.807.2 Operation of personal transpor t equipment UTNX 79.4 79.1 80.0 83.8 88.2 94.7 100.0 103.9 114.1 110.707.3 Transpor t ser vices UTNY 82.5 91.6 93.4 94.2 94.9 97.8 100.0 102.2 106.3 107.0
08. Communication UTJI 107.3 99.9 101.1 102.0 103.0 100.5 100.0 96.0 93.0 92.708.1 Postal services UTNZ 104.3 105.7 106.2 109.5 114.8 109.5 100.0 89.2 78.3 71.308.2 Telephone & telefax equipment UTOA 120.7 117.6 108.1 107.4 118.2 107.7 100.0 81.0 68.1 63.308.3 Telephone & telefax services UTOB 106.5 98.4 100.2 100.9 101.4 99.5 100.0 97.5 96.2 97.5
09. Recreation and culture UTJJ 111.4 109.4 110.2 108.1 103.7 101.3 100.0 98.5 94.9 92.709.1 Audio-visual, photographic and infor mation
processing equipment UTOC 191.7 175.4 162.3 146.6 129.1 112.5 100.0 86.7 71.6 62.309.2 Other major durables for recreation and culture UTOD 89.7 90.2 92.3 95.1 98.4 99.5 100.0 99.9 101.1 104.609.3 Other recreational items and equipment; flowers,
gardens and pets UTOE 116.4 116.1 113.2 109.0 102.4 101.4 100.0 100.4 100.8 103.409.4 Recreational and cultural services UTOF 79.4 79.5 88.0 90.9 92.0 95.4 100.0 104.4 106.9 109.709.5 Newspapers, books and stationery UTOG 86.6 89.0 90.9 94.3 95.7 96.5 100.0 102.4 107.2 111.609.6 Package holidays1
10. Education UTJK 72.0 76.4 80.7 86.8 90.3 94.7 100.0 107.4 114.8 121.5
11. Restaurants and hotels UTJL 82.1 85.6 89.2 91.4 93.0 96.4 100.0 103.6 107.8 110.511.1 Catering services UTON 82.1 85.4 89.0 91.3 93.3 96.5 100.0 103.6 108.1 111.311.2 Accommodation ser vices UTOD 89.7 90.2 92.3 95.1 98.4 99.5 100.0 99.9 101.1 104.6
12. Miscellaneous goods and services UTJM 88.5 89.1 89.8 90.0 92.9 96.4 100.0 103.2 102.6 95.012.1 Personal care UTOP 98.1 100.1 100.2 100.7 100.5 101.3 100.0 102.9 104.5 110.812.3 Personal effects n.e.c. UTOQ 90.3 91.1 91.4 93.6 94.5 95.6 100.0 104.3 110.5 117.212.4 Social protection UTOR 69.9 74.7 79.2 83.8 88.6 94.2 100.0 104.1 108.2 113.112.5 Insurance UTOS 89.7 94.8 97.0 94.8 92.0 96.3 100.0 102.7 106.3 100.012.6 Financial ser vices n.e.c. UTOT 100.2 93.0 90.3 89.2 92.3 95.5 100.0 102.8 95.2 74.512.7 Other ser vices n.e.c. UTOU 67.5 72.5 76.9 81.3 87.0 92.4 100.0 105.7 113.1 115.9
Total Final consumption expenditure in the UK byresident and non-resident households
(domestic concept) UTJA 89.2 90.8 92.1 93.6 95.3 97.3 100.0 103.0 106.0 106.7
P.33 Final consumption expenditure outside the UKby UK resident households GDPE 83.7 86.1 86.7 93.6 91.8 97.9 100.0 101.8 107.9 132.4
-P.34 less Final consumption expenditure in the UK byhouseholds resident in the rest of the wor ld GDPB 84.0 86.5 88.9 91.6 93.5 96.8 100.0 106.8 110.7 109.3
P.31 Final consumption expenditure by UK residenthouseholds in the UK and abroad
(national concept) ABQU 89.2 90.8 92.0 93.7 95.2 97.4 100.0 102.9 105.9 107.3
1 Package holidays data are dispersed between components (transpor t etc)

231
0GSA.DN Household final consumption expenditureSummar y goods and services: annual dataImplied deflators - not seasonally adjusted 2006 = 100
2000 2001 2002 2003 2004 2005 2006 2007 2008 2009
Durable goods05. Furnishings, household equipment and
routine maintenance of the house LLNL 96.0 97.0 97.7 98.4 97.6 98.9 100.0 103.5 107.8 113.006. Health LLNM 64.4 71.5 78.8 79.2 99.3 100.5 100.0 101.2 102.9 103.807. Transpor t LLNN 109.0 106.0 105.2 103.7 107.0 102.9 100.0 100.3 98.4 100.808. Communication LLNO 121.4 118.2 109.0 108.3 118.2 107.6 100.0 81.0 68.1 63.309. Recreation and culture LLNP 190.7 172.4 159.2 144.1 128.3 112.3 100.0 86.8 73.0 65.212. Miscellaneous goods and services LLNQ 86.8 88.0 89.0 92.3 93.4 94.2 100.0 104.9 112.6 121.0
D Total durable goods UTKS 117.0 113.7 111.9 109.2 108.3 103.6 100.0 97.7 93.1 91.1
Semi-durable goods03. Clothing and footwear LLON 119.3 113.8 108.1 106.3 103.4 101.0 100.0 99.0 95.1 90.905. Furnishings, household equipment and
routine maintenance of the house LLOO 97.7 97.4 97.0 96.0 102.5 100.6 100.0 101.1 102.2 105.207. Transpor t LLOP 86.8 86.5 87.8 89.5 94.0 96.7 100.0 101.3 104.8 110.309. Recreation and culture LLOQ 117.8 117.6 114.9 110.7 103.5 101.5 100.0 100.5 99.5 99.312. Miscellaneous goods and services LLOR 93.9 95.1 94.3 95.5 95.5 98.3 100.0 103.6 106.8 109.6
SD Total semi-durable goods UTLA 113.0 110.4 106.9 104.9 102.6 100.8 100.0 100.0 98.2 96.5
Non-durable goods01. Food and drink UTJB 91.3 94.5 95.2 96.5 96.3 97.7 100.0 104.6 113.8 119.902. Alcohol and tobacco UTJC 88.9 91.6 93.1 96.4 97.4 98.6 100.0 102.4 105.2 111.304. Housing, water, electr icity, gas and
other fuels LLNZ 69.4 69.7 71.0 72.3 77.4 85.0 100.0 108.3 125.1 134.305. Furnishings, household equipment and
routine maintenance of the house LLOA 105.0 103.7 102.7 100.5 96.7 96.7 100.0 102.1 105.1 113.306. Health LLOB 102.4 104.4 105.4 106.5 101.3 100.4 100.0 101.4 103.1 105.107. Transpor t LLOC 86.8 82.3 80.1 83.0 87.6 95.0 100.0 102.8 117.5 106.809. Recreation and culture LLOD 91.4 93.3 94.3 96.3 97.1 97.6 100.0 101.5 105.5 110.812. Miscellaneous goods and services LLOE 108.1 108.9 107.0 105.6 104.4 103.4 100.0 102.4 103.2 111.2
ND Total non-durable goods UTKW 87.8 89.0 89.4 91.1 92.5 95.6 100.0 104.2 113.3 117.7
Total goods01. Food and drink UTJB 91.3 94.5 95.2 96.5 96.3 97.7 100.0 104.6 113.8 119.902. Alcohol and tobacco UTJC 88.9 91.6 93.1 96.4 97.4 98.6 100.0 102.4 105.2 111.303. Clothing and footwear LLNR 119.3 113.8 108.1 106.3 103.4 101.0 100.0 99.0 95.1 90.904. Housing, water, electr icity, gas and
other fuels LLNS 69.4 69.7 71.0 72.3 77.4 85.0 100.0 108.3 125.1 134.305. Furnishings, household equipment and
routine maintenance of the house LLNT 97.5 97.9 98.0 97.8 99.2 99.3 100.0 102.5 105.5 110.206. Health LLNU 87.1 91.5 95.5 96.3 100.6 100.5 100.0 101.3 103.1 104.607. Transpor t LLNV 99.3 95.9 94.6 95.0 98.9 99.6 100.0 101.3 105.9 103.708. Communication LLNW 121.4 118.2 109.0 108.3 118.2 107.6 100.0 81.0 68.1 63.309. Recreation and culture LLNX 130.3 126.7 122.6 117.3 109.9 104.2 100.0 95.7 89.7 85.912. Miscellaneous goods and services LLNY 100.8 101.8 100.8 100.9 100.5 100.5 100.0 103.1 105.4 113.1
TG Total goods UTKU 100.4 99.8 98.9 98.6 98.7 98.8 100.0 101.6 104.4 105.5
Ser vices03. Clothing and footwear LLOF 83.1 86.0 88.8 93.0 90.9 95.6 100.0 104.8 108.6 110.904. Housing, water, electr icity, gas and
other fuels LLOG 72.4 77.9 81.0 86.3 91.7 96.0 100.0 107.0 112.1 117.105. Furnishings, household equipment and
routine maintenance of the house LLOH 72.4 77.2 81.6 86.3 90.9 95.7 100.0 104.7 109.9 112.206. Health LLOI 84.4 89.7 95.5 98.8 94.4 96.5 100.0 103.2 104.3 109.107. Transpor t LLOJ 77.0 84.2 87.1 89.8 92.0 96.3 100.0 103.6 108.3 110.408. Communication LLOK 106.5 99.0 100.7 101.6 102.2 100.1 100.0 97.0 94.9 95.309. Recreation and culture LLOL 79.1 79.5 87.6 90.6 91.9 95.4 100.0 104.4 107.2 109.910. Education UTJK 72.0 76.4 80.7 86.8 90.3 94.7 100.0 107.4 114.8 121.511. Restaurants and hotels UTJL 82.1 85.6 89.2 91.4 93.0 96.4 100.0 103.6 107.8 110.512. Miscellaneous goods and services LLOM 85.5 86.1 87.1 87.3 91.1 95.4 100.0 103.2 101.9 90.9
S Total services UTKY 79.7 83.1 86.2 89.1 92.3 96.1 100.0 104.4 107.4 107.8
Total Final consumption expenditure in the UKby resident and non-resident households
(domestic concept) UTJA 89.2 90.8 92.1 93.6 95.3 97.3 100.0 103.0 106.0 106.7
P.33 Final consumption expenditure outside the UKby UK resident households GDPB 84.0 86.5 88.9 91.6 93.5 96.8 100.0 106.8 110.7 109.3
-P.34 Less Final consumption expenditure in the UKby households resident in the rest of the wor ld GDPE 83.7 86.1 86.7 93.6 91.8 97.9 100.0 101.8 107.9 132.4
P.31 Final consumption expenditure by UK residenthouseholds in the UK and abroad
(national concept) ABQU 89.2 90.8 92.0 93.7 95.2 97.4 100.0 102.9 105.9 107.3

232
ALC.CN Household final consumption expenditureTotal alcoholic beverages1
Current prices - not seasonally adjusted £ million
Alcoholic beverages
Total Spirits Wine Beer
Restaurants Restaurants Restaurants RestaurantsTotal Retail and hotels Total Retail and hotels Total Retail and hotels Total Retail and hotels
COICOP 02.1 11 02.1 11 02.1 11 02.1 11
CDCZ ADFM JJCM CDCX UUHX UUIZ CDCY UTHT UWMM CCDX UUMI UWLB2005 41 839 13 476 28 363 8 563 3 713 4 850 14 205 6 488 7 717 19 071 3 275 15 7962006 42 167 13 637 28 530 8 251 3 675 4 576 14 905 6 543 8 362 19 011 3 419 15 5922007 43 412 14 134 29 278 8 638 3 826 4 812 16 291 6 974 9 317 18 483 3 334 15 1492008 43 180 14 656 28 524 8 638 4 114 4 524 16 301 7 108 9 193 18 241 3 434 14 8072009 41 380 14 851 26 529 8 379 4 037 4 342 15 792 7 120 8 672 17 209 3 694 13 515
Percentage chang e , year on previous year
2005 − 1.5 −0.8 1.7 2.7 0.9 1.1 2.5 −0.2 −1.5 −1.7 −1.52006 0.8 1.2 0.6 −3.6 −1.0 −5.6 4.9 0.8 8.4 −0.3 4.4 −1.32007 3.0 3.6 2.6 4.7 4.1 5.2 9.3 6.6 11.4 −2.8 −2.5 −2.82008 −0.5 3.7 −2.6 − 7.5 −6.0 0.1 1.9 −1.3 −1.3 3.0 −2.32009 −4.2 1.3 −7.0 −3.0 −1.9 −4.0 −3.1 0.2 −5.7 −5.7 7.6 −8.7
Not seasonally adjusted
2007 Q1 9 461 2 963 6 498 1 850 807 1 043 3 470 1 453 2 017 4 141 703 3 438Q2 10 838 3 370 7 468 2 100 874 1 226 3 950 1 646 2 304 4 788 850 3 938Q3 10 680 3 468 7 212 1 982 861 1 121 4 110 1 734 2 376 4 588 873 3 715Q4 12 433 4 333 8 100 2 706 1 284 1 422 4 761 2 141 2 620 4 966 908 4 058
2008 Q1 9 477 2 918 6 559 1 892 886 1 006 3 491 1 365 2 126 4 094 667 3 427Q2 10 977 3 553 7 424 2 128 958 1 170 4 046 1 724 2 322 4 803 871 3 932Q3 10 611 3 565 7 046 1 977 902 1 075 4 066 1 752 2 314 4 568 911 3 657Q4 12 115 4 620 7 495 2 641 1 368 1 273 4 698 2 267 2 431 4 776 985 3 791
2009 Q1 9 029 3 146 5 883 1 843 888 955 3 440 1 544 1 896 3 746 714 3 032Q2 10 375 3 598 6 777 2 007 898 1 109 3 854 1 718 2 136 4 514 982 3 532Q3 10 296 3 589 6 707 1 948 890 1 058 3 877 1 692 2 185 4 471 1 007 3 464Q4 11 680 4 518 7 162 2 581 1 361 1 220 4 621 2 166 2 455 4 478 991 3 487
2010 Q1 9 183 3 321 5 862 1 846 892 954 3 576 1 645 1 931 3 761 784 2 977
Percentage chang e , quar ter on corresponding quarter of previous year
2007 Q1 4.7 3.6 5.2 6.3 6.3 6.2 8.3 2.4 12.9 1.2 3.2 0.8Q2 2.2 0.6 3.0 6.3 4.4 7.6 7.7 1.8 12.4 −3.4 −5.2 −3.0Q3 1.9 3.8 1.1 3.2 2.6 3.6 9.4 10.1 8.9 −4.4 −5.7 −4.1Q4 3.2 6.0 1.7 3.6 3.5 3.6 11.3 10.8 11.7 −3.8 −0.8 −4.4
2008 Q1 0.2 −1.5 0.9 2.3 9.8 −3.5 0.6 −6.1 5.4 −1.1 −5.1 −0.3Q2 1.3 5.4 −0.6 1.3 9.6 −4.6 2.4 4.7 0.8 0.3 2.5 −0.2Q3 −0.6 2.8 −2.3 −0.3 4.8 −4.1 −1.1 1.0 −2.6 −0.4 4.4 −1.6Q4 −2.6 6.6 −7.5 −2.4 6.5 −10.5 −1.3 5.9 −7.2 −3.8 8.5 −6.6
2009 Q1 −4.7 7.8 −10.3 −2.6 0.2 −5.1 −1.5 13.1 −10.8 −8.5 7.0 −11.5Q2 −5.5 1.3 −8.7 −5.7 −6.3 −5.2 −4.7 −0.3 −8.0 −6.0 12.7 −10.2Q3 −3.0 0.7 −4.8 −1.5 −1.3 −1.6 −4.6 −3.4 −5.6 −2.1 10.5 −5.3Q4 −3.6 −2.2 −4.4 −2.3 −0.5 −4.2 −1.6 −4.5 1.0 −6.2 0.6 −8.0
2010 Q1 1.7 5.6 −0.4 0.2 0.5 −0.1 4.0 6.5 1.8 0.4 9.8 −1.8
1 Excludes legitimate cross-border shopping, which is included in tourists’ ex-penditure

233
ALC.CS Household final consumption expenditureTotal alcoholic beverages1
Current prices - seasonally adjusted £ million
Alcoholic beverages
Total Spirits Wine Beer
Restaurants Restaurants Restaurants RestaurantsTotal Retail and hotels Total Retail and hotels Total Retail and hotels Total Retail and hotels
COICOP 02.1 11 02.1 11 02.1 11 02.1 11
CCRY JJDA JJDW CCSA UUIE UUJG CCSB UTHU UWMS CCEL UUPI UUNF2005 41 839 13 476 28 363 8 563 3 713 4 850 14 205 6 488 7 717 19 071 3 275 15 7962006 42 167 13 637 28 530 8 251 3 675 4 576 14 905 6 543 8 362 19 011 3 419 15 5922007 43 412 14 134 29 278 8 638 3 826 4 812 16 291 6 974 9 317 18 483 3 334 15 1492008 43 180 14 656 28 524 8 638 4 114 4 524 16 301 7 108 9 193 18 241 3 434 14 8072009 41 380 14 851 26 529 8 379 4 037 4 342 15 792 7 120 8 672 17 209 3 694 13 515
Percentage chang e , year on previous year
2005 − 1.5 −0.8 1.7 2.7 0.9 1.1 2.5 −0.2 −1.5 −1.7 −1.52006 0.8 1.2 0.6 −3.6 −1.0 −5.6 4.9 0.8 8.4 −0.3 4.4 −1.32007 3.0 3.6 2.6 4.7 4.1 5.2 9.3 6.6 11.4 −2.8 −2.5 −2.82008 −0.5 3.7 −2.6 − 7.5 −6.0 0.1 1.9 −1.3 −1.3 3.0 −2.32009 −4.2 1.3 −7.0 −3.0 −1.9 −4.0 −3.1 0.2 −5.7 −5.7 7.6 −8.7
Seasonally adjusted
2007 Q1 10 870 3 508 7 362 2 150 936 1 214 3 964 1 699 2 265 4 756 873 3 883Q2 10 827 3 493 7 334 2 180 967 1 213 4 032 1 706 2 326 4 615 820 3 795Q3 10 796 3 561 7 235 2 141 963 1 178 4 134 1 786 2 348 4 521 812 3 709Q4 10 919 3 572 7 347 2 167 960 1 207 4 161 1 783 2 378 4 591 829 3 762
2008 Q1 10 847 3 452 7 395 2 188 1 025 1 163 3 976 1 600 2 376 4 683 827 3 856Q2 10 973 3 717 7 256 2 213 1 062 1 151 4 138 1 810 2 328 4 622 845 3 777Q3 10 725 3 682 7 043 2 129 1 010 1 119 4 092 1 819 2 273 4 504 853 3 651Q4 10 635 3 805 6 830 2 108 1 017 1 091 4 095 1 879 2 216 4 432 909 3 523
2009 Q1 10 356 3 727 6 629 2 123 1 027 1 096 3 933 1 807 2 126 4 300 893 3 407Q2 10 377 3 751 6 626 2 100 1 007 1 093 3 931 1 793 2 138 4 346 951 3 395Q3 10 411 3 694 6 717 2 100 1 002 1 098 3 909 1 754 2 155 4 402 938 3 464Q4 10 236 3 679 6 557 2 056 1 001 1 055 4 019 1 766 2 253 4 161 912 3 249
2010 Q1 10 542 3 942 6 600 2 128 1 035 1 093 4 088 1 925 2 163 4 326 982 3 344
Percentage chang e , quar ter on previous quarter
2007 Q1 2.6 4.7 1.6 3.1 1.2 4.6 6.0 6.5 5.6 −0.3 5.1 −1.4Q2 −0.4 −0.4 −0.4 1.4 3.3 −0.1 1.7 0.4 2.7 −3.0 −6.1 −2.3Q3 −0.3 1.9 −1.3 −1.8 −0.4 −2.9 2.5 4.7 0.9 −2.0 −1.0 −2.3Q4 1.1 0.3 1.5 1.2 −0.3 2.5 0.7 −0.2 1.3 1.5 2.1 1.4
2008 Q1 −0.7 −3.4 0.7 1.0 6.8 −3.6 −4.4 −10.3 −0.1 2.0 −0.2 2.5Q2 1.2 7.7 −1.9 1.1 3.6 −1.0 4.1 13.1 −2.0 −1.3 2.2 −2.0Q3 −2.3 −0.9 −2.9 −3.8 −4.9 −2.8 −1.1 0.5 −2.4 −2.6 0.9 −3.3Q4 −0.8 3.3 −3.0 −1.0 0.7 −2.5 0.1 3.3 −2.5 −1.6 6.6 −3.5
2009 Q1 −2.6 −2.0 −2.9 0.7 1.0 0.5 −4.0 −3.8 −4.1 −3.0 −1.8 −3.3Q2 0.2 0.6 − −1.1 −1.9 −0.3 −0.1 −0.8 0.6 1.1 6.5 −0.4Q3 0.3 −1.5 1.4 − −0.5 0.5 −0.6 −2.2 0.8 1.3 −1.4 2.0Q4 −1.7 −0.4 −2.4 −2.1 −0.1 −3.9 2.8 0.7 4.5 −5.5 −2.8 −6.2
2010 Q1 3.0 7.1 0.7 3.5 3.4 3.6 1.7 9.0 −4.0 4.0 7.7 2.9
Percentage chang e , quar ter on corresponding quarter of previous year
2007 Q1 4.6 4.1 4.9 6.1 6.2 6.0 8.4 3.3 12.6 1.0 3.3 0.5Q2 2.1 0.5 2.9 5.8 4.3 7.0 8.0 2.0 12.9 −4.0 −6.4 −3.4Q3 2.0 3.6 1.3 3.0 2.2 3.7 9.5 9.6 9.5 −4.4 −6.3 −4.0Q4 3.1 6.6 1.4 3.9 3.8 4.0 11.2 11.7 10.9 −3.7 −0.2 −4.4
2008 Q1 −0.2 −1.6 0.4 1.8 9.5 −4.2 0.3 −5.8 4.9 −1.5 −5.3 −0.7Q2 1.3 6.4 −1.1 1.5 9.8 −5.1 2.6 6.1 0.1 0.2 3.0 −0.5Q3 −0.7 3.4 −2.7 −0.6 4.9 −5.0 −1.0 1.8 −3.2 −0.4 5.0 −1.6Q4 −2.6 6.5 −7.0 −2.7 5.9 −9.6 −1.6 5.4 −6.8 −3.5 9.7 −6.4
2009 Q1 −4.5 8.0 −10.4 −3.0 0.2 −5.8 −1.1 12.9 −10.5 −8.2 8.0 −11.6Q2 −5.4 0.9 −8.7 −5.1 −5.2 −5.0 −5.0 −0.9 −8.2 −6.0 12.5 −10.1Q3 −2.9 0.3 −4.6 −1.4 −0.8 −1.9 −4.5 −3.6 −5.2 −2.3 10.0 −5.1Q4 −3.8 −3.3 −4.0 −2.5 −1.6 −3.3 −1.9 −6.0 1.7 −6.1 0.3 −7.8
2010 Q1 1.8 5.8 −0.4 0.2 0.8 −0.3 3.9 6.5 1.7 0.6 10.0 −1.8
1 Excludes legitimate cross-border shopping, which is included in tourists’ ex-penditure

234
ALC.KN Household final consumption expenditureTotal alcoholic beverages1
Chained volume measures, reference year 2006 - not seasonally adjusted £ million
Alcoholic beverages
Total Spirits Wine Beer
Restaurants Restaurants Restaurants RestaurantsTotal Retail and hotels Total Retail and hotels Total Retail and hotels Total Retail and hotels
COICOP 02.1 11 02.1 11 02.1 11 02.1 11
CCFU ADIT JKTQ CCFS UUIL UUJP CCFT UTHV UWMY CCBN UUSC UUNN2005 43 376 13 649 29 740 8 779 3 725 5 061 14 904 6 675 8 225 19 683 3 254 16 4432006 42 167 13 637 28 530 8 251 3 675 4 576 14 905 6 543 8 362 19 011 3 419 15 5922007 42 306 14 105 28 201 8 506 3 837 4 669 15 831 6 883 8 948 17 969 3 385 14 5842008 40 484 14 235 26 249 8 072 3 897 4 175 15 344 6 857 8 487 17 068 3 481 13 5872009 37 043 13 463 23 580 7 534 3 701 3 833 14 304 6 551 7 753 15 205 3 211 11 994
Percentage chang e , year on previous year
2005 −2.2 3.1 −4.7 −0.6 1.3 −2.1 −0.8 3.5 −4.4 −3.9 4.2 −5.62006 −2.8 −0.1 −4.1 −6.0 −1.3 −9.6 − −2.0 1.7 −3.4 5.1 −5.22007 0.3 3.4 −1.2 3.1 4.4 2.0 6.2 5.2 7.0 −5.5 −1.0 −6.52008 −4.3 0.9 −6.9 −5.1 1.6 −10.6 −3.1 −0.4 −5.2 −5.0 2.8 −6.82009 −8.5 −5.4 −10.2 −6.7 −5.0 −8.2 −6.8 −4.5 −8.6 −10.9 −7.8 −11.7
Not seasonally adjusted
2007 Q1 9 316 2 952 6 365 1 838 816 1 022 3 419 1 451 1 968 4 060 685 3 375Q2 10 570 3 360 7 210 2 076 882 1 193 3 841 1 621 2 220 4 654 857 3 797Q3 10 356 3 440 6 917 1 952 866 1 087 3 980 1 705 2 275 4 424 869 3 555Q4 12 064 4 353 7 709 2 640 1 273 1 367 4 591 2 106 2 485 4 831 974 3 857
2008 Q1 9 290 3 148 6 141 1 832 886 946 3 517 1 516 2 001 3 941 747 3 194Q2 10 248 3 426 6 822 2 002 918 1 083 3 771 1 632 2 139 4 475 875 3 600Q3 9 840 3 392 6 448 1 842 858 984 3 774 1 648 2 126 4 224 886 3 338Q4 11 106 4 269 6 838 2 396 1 235 1 162 4 282 2 061 2 221 4 428 973 3 455
2009 Q1 8 228 2 898 5 330 1 694 830 863 3 155 1 431 1 724 3 380 637 2 743Q2 9 278 3 256 6 021 1 810 832 978 3 488 1 579 1 909 3 979 845 3 134Q3 9 144 3 228 5 917 1 750 822 928 3 480 1 546 1 934 3 914 859 3 055Q4 10 393 4 081 6 312 2 280 1 217 1 064 4 181 1 995 2 186 3 932 870 3 062
2010 Q1 8 064 2 942 5 123 1 626 798 827 3 201 1 493 1 708 3 238 650 2 588
Percentage chang e , quar ter on corresponding quarter of previous year
2007 Q1 1.4 2.7 0.9 4.1 6.1 2.6 4.0 −0.1 7.2 −1.7 4.1 −2.9Q2 −0.2 0.8 −0.7 4.5 4.5 4.3 5.4 2.3 7.8 −6.2 −5.3 −6.4Q3 −0.6 3.2 −2.5 1.6 2.6 0.9 6.4 7.8 5.2 −7.1 −4.1 −7.7Q4 0.8 6.3 −2.0 2.4 4.5 0.6 8.5 9.4 7.9 −6.4 2.5 −8.4
2008 Q1 −0.3 6.6 −3.5 −0.3 8.6 −7.4 2.9 4.5 1.7 −2.9 9.1 −5.4Q2 −3.0 2.0 −5.4 −3.6 4.1 −9.2 −1.8 0.7 −3.6 −3.8 2.1 −5.2Q3 −5.0 −1.4 −6.8 −5.6 −0.9 −9.5 −5.2 −3.3 −6.5 −4.5 2.0 −6.1Q4 −7.9 −1.9 −11.3 −9.2 −3.0 −15.0 −6.7 −2.1 −10.6 −8.3 −0.1 −10.4
2009 Q1 −11.4 −7.9 −13.2 −7.5 −6.3 −8.8 −10.3 −5.6 −13.8 −14.2 −14.7 −14.1Q2 −9.5 −5.0 −11.7 −9.6 −9.4 −9.7 −7.5 −3.2 −10.8 −11.1 −3.4 −12.9Q3 −7.1 −4.8 −8.2 −5.0 −4.2 −5.7 −7.8 −6.2 −9.0 −7.3 −3.0 −8.5Q4 −6.4 −4.4 −7.7 −4.8 −1.5 −8.4 −2.4 −3.2 −1.6 −11.2 −10.6 −11.4
2010 Q1 −2.0 1.5 −3.9 −4.0 −3.9 −4.2 1.5 4.3 −0.9 −4.2 2.0 −5.7
1 Excludes legitimate cross-border shopping, which is included in tourists’ ex-penditure
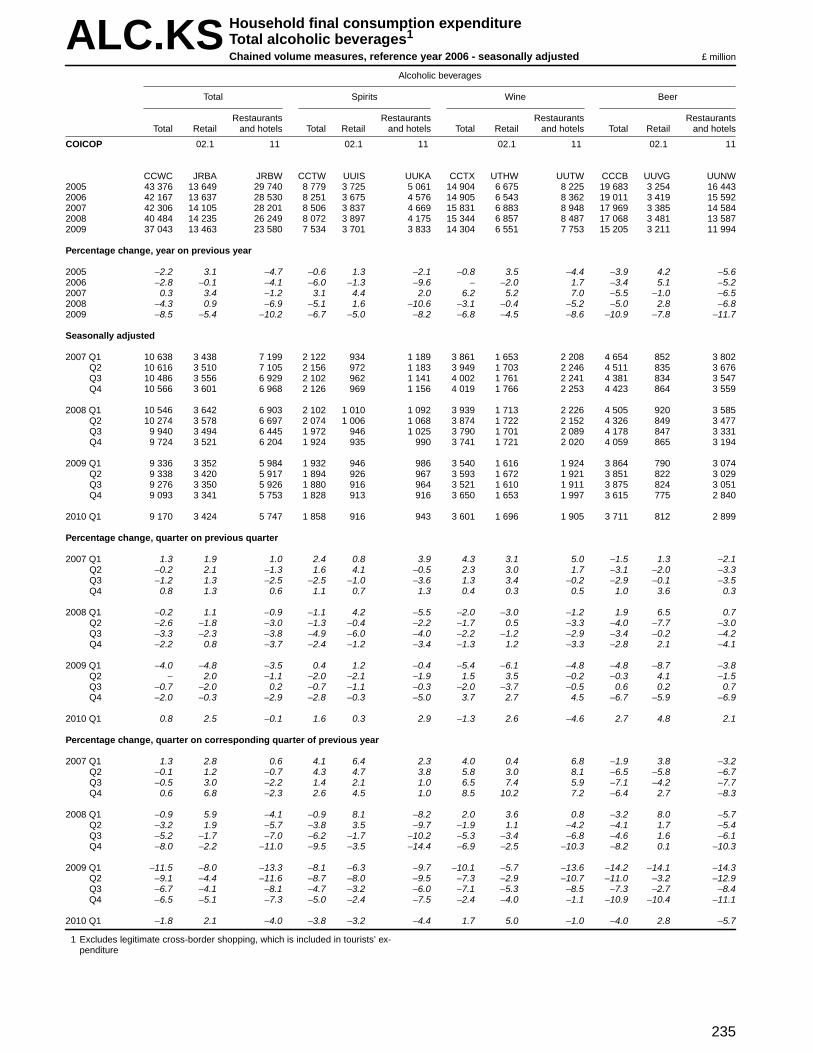
235
ALC.KS Household final consumption expenditureTotal alcoholic beverages1
Chained volume measures, reference year 2006 - seasonally adjusted £ million
Alcoholic beverages
Total Spirits Wine Beer
Restaurants Restaurants Restaurants RestaurantsTotal Retail and hotels Total Retail and hotels Total Retail and hotels Total Retail and hotels
COICOP 02.1 11 02.1 11 02.1 11 02.1 11
CCWC JRBA JRBW CCTW UUIS UUKA CCTX UTHW UUTW CCCB UUVG UUNW2005 43 376 13 649 29 740 8 779 3 725 5 061 14 904 6 675 8 225 19 683 3 254 16 4432006 42 167 13 637 28 530 8 251 3 675 4 576 14 905 6 543 8 362 19 011 3 419 15 5922007 42 306 14 105 28 201 8 506 3 837 4 669 15 831 6 883 8 948 17 969 3 385 14 5842008 40 484 14 235 26 249 8 072 3 897 4 175 15 344 6 857 8 487 17 068 3 481 13 5872009 37 043 13 463 23 580 7 534 3 701 3 833 14 304 6 551 7 753 15 205 3 211 11 994
Percentage chang e , year on previous year
2005 −2.2 3.1 −4.7 −0.6 1.3 −2.1 −0.8 3.5 −4.4 −3.9 4.2 −5.62006 −2.8 −0.1 −4.1 −6.0 −1.3 −9.6 − −2.0 1.7 −3.4 5.1 −5.22007 0.3 3.4 −1.2 3.1 4.4 2.0 6.2 5.2 7.0 −5.5 −1.0 −6.52008 −4.3 0.9 −6.9 −5.1 1.6 −10.6 −3.1 −0.4 −5.2 −5.0 2.8 −6.82009 −8.5 −5.4 −10.2 −6.7 −5.0 −8.2 −6.8 −4.5 −8.6 −10.9 −7.8 −11.7
Seasonally adjusted
2007 Q1 10 638 3 438 7 199 2 122 934 1 189 3 861 1 653 2 208 4 654 852 3 802Q2 10 616 3 510 7 105 2 156 972 1 183 3 949 1 703 2 246 4 511 835 3 676Q3 10 486 3 556 6 929 2 102 962 1 141 4 002 1 761 2 241 4 381 834 3 547Q4 10 566 3 601 6 968 2 126 969 1 156 4 019 1 766 2 253 4 423 864 3 559
2008 Q1 10 546 3 642 6 903 2 102 1 010 1 092 3 939 1 713 2 226 4 505 920 3 585Q2 10 274 3 578 6 697 2 074 1 006 1 068 3 874 1 722 2 152 4 326 849 3 477Q3 9 940 3 494 6 445 1 972 946 1 025 3 790 1 701 2 089 4 178 847 3 331Q4 9 724 3 521 6 204 1 924 935 990 3 741 1 721 2 020 4 059 865 3 194
2009 Q1 9 336 3 352 5 984 1 932 946 986 3 540 1 616 1 924 3 864 790 3 074Q2 9 338 3 420 5 917 1 894 926 967 3 593 1 672 1 921 3 851 822 3 029Q3 9 276 3 350 5 926 1 880 916 964 3 521 1 610 1 911 3 875 824 3 051Q4 9 093 3 341 5 753 1 828 913 916 3 650 1 653 1 997 3 615 775 2 840
2010 Q1 9 170 3 424 5 747 1 858 916 943 3 601 1 696 1 905 3 711 812 2 899
Percentage chang e , quar ter on previous quarter
2007 Q1 1.3 1.9 1.0 2.4 0.8 3.9 4.3 3.1 5.0 −1.5 1.3 −2.1Q2 −0.2 2.1 −1.3 1.6 4.1 −0.5 2.3 3.0 1.7 −3.1 −2.0 −3.3Q3 −1.2 1.3 −2.5 −2.5 −1.0 −3.6 1.3 3.4 −0.2 −2.9 −0.1 −3.5Q4 0.8 1.3 0.6 1.1 0.7 1.3 0.4 0.3 0.5 1.0 3.6 0.3
2008 Q1 −0.2 1.1 −0.9 −1.1 4.2 −5.5 −2.0 −3.0 −1.2 1.9 6.5 0.7Q2 −2.6 −1.8 −3.0 −1.3 −0.4 −2.2 −1.7 0.5 −3.3 −4.0 −7.7 −3.0Q3 −3.3 −2.3 −3.8 −4.9 −6.0 −4.0 −2.2 −1.2 −2.9 −3.4 −0.2 −4.2Q4 −2.2 0.8 −3.7 −2.4 −1.2 −3.4 −1.3 1.2 −3.3 −2.8 2.1 −4.1
2009 Q1 −4.0 −4.8 −3.5 0.4 1.2 −0.4 −5.4 −6.1 −4.8 −4.8 −8.7 −3.8Q2 − 2.0 −1.1 −2.0 −2.1 −1.9 1.5 3.5 −0.2 −0.3 4.1 −1.5Q3 −0.7 −2.0 0.2 −0.7 −1.1 −0.3 −2.0 −3.7 −0.5 0.6 0.2 0.7Q4 −2.0 −0.3 −2.9 −2.8 −0.3 −5.0 3.7 2.7 4.5 −6.7 −5.9 −6.9
2010 Q1 0.8 2.5 −0.1 1.6 0.3 2.9 −1.3 2.6 −4.6 2.7 4.8 2.1
Percentage chang e , quar ter on corresponding quarter of previous year
2007 Q1 1.3 2.8 0.6 4.1 6.4 2.3 4.0 0.4 6.8 −1.9 3.8 −3.2Q2 −0.1 1.2 −0.7 4.3 4.7 3.8 5.8 3.0 8.1 −6.5 −5.8 −6.7Q3 −0.5 3.0 −2.2 1.4 2.1 1.0 6.5 7.4 5.9 −7.1 −4.2 −7.7Q4 0.6 6.8 −2.3 2.6 4.5 1.0 8.5 10.2 7.2 −6.4 2.7 −8.3
2008 Q1 −0.9 5.9 −4.1 −0.9 8.1 −8.2 2.0 3.6 0.8 −3.2 8.0 −5.7Q2 −3.2 1.9 −5.7 −3.8 3.5 −9.7 −1.9 1.1 −4.2 −4.1 1.7 −5.4Q3 −5.2 −1.7 −7.0 −6.2 −1.7 −10.2 −5.3 −3.4 −6.8 −4.6 1.6 −6.1Q4 −8.0 −2.2 −11.0 −9.5 −3.5 −14.4 −6.9 −2.5 −10.3 −8.2 0.1 −10.3
2009 Q1 −11.5 −8.0 −13.3 −8.1 −6.3 −9.7 −10.1 −5.7 −13.6 −14.2 −14.1 −14.3Q2 −9.1 −4.4 −11.6 −8.7 −8.0 −9.5 −7.3 −2.9 −10.7 −11.0 −3.2 −12.9Q3 −6.7 −4.1 −8.1 −4.7 −3.2 −6.0 −7.1 −5.3 −8.5 −7.3 −2.7 −8.4Q4 −6.5 −5.1 −7.3 −5.0 −2.4 −7.5 −2.4 −4.0 −1.1 −10.9 −10.4 −11.1
2010 Q1 −1.8 2.1 −4.0 −3.8 −3.2 −4.4 1.7 5.0 −1.0 −4.0 2.8 −5.7
1 Excludes legitimate cross-border shopping, which is included in tourists’ ex-penditure

236
ALC.DN Household final consumption expenditureTotal alcoholic beverages1
Implied deflators - not seasonally adjusted 2006 = 100
Alcoholic beverages
Total Spirits Wine Beer
Restaurants Restaurants Restaurants RestaurantsTotal Retail and hotels Total Retail and hotels Total Retail and hotels Total Retail and hotels
COICOP 02.1 11 02.1 11 02.1 11 02.1 11
ISLC UTNE ISTM ISHP AWLU OSOT ISIH AWLV OSOY ISKB AWLW OSRE2005 96.5 98.7 95.4 97.5 99.7 95.8 95.3 97.2 93.8 96.9 100.6 96.12006 100.0 100.0 100.0 100.0 100.0 100.0 100.0 100.0 100.0 100.0 100.0 100.02007 102.6 100.2 103.8 101.6 99.7 103.1 102.9 101.3 104.1 102.9 98.5 103.92008 106.7 103.0 108.7 107.0 105.6 108.4 106.2 103.7 108.3 106.9 98.6 109.02009 111.7 110.3 112.5 111.2 109.1 113.3 110.4 108.7 111.9 113.2 115.0 112.7
Percentage chang e , year on previous year
2005 2.2 −1.6 4.1 2.2 1.3 3.0 1.9 −0.9 4.5 2.4 −5.7 4.32006 3.6 1.3 4.8 2.6 0.3 4.4 4.9 2.9 6.6 3.2 −0.6 4.12007 2.6 0.2 3.8 1.6 −0.3 3.1 2.9 1.3 4.1 2.9 −1.5 3.92008 4.0 2.8 4.7 5.3 5.9 5.1 3.2 2.4 4.0 3.9 0.1 4.92009 4.7 7.1 3.5 3.9 3.3 4.5 4.0 4.8 3.3 5.9 16.6 3.4
Not seasonally adjusted
2007 Q1 101.6 100.4 102.1 100.7 98.9 102.1 101.5 100.1 102.5 102.0 102.6 101.9Q2 102.5 100.3 103.6 101.2 99.1 102.8 102.8 101.5 103.8 102.9 99.2 103.7Q3 103.1 100.8 104.3 101.5 99.4 103.1 103.3 101.7 104.4 103.7 100.5 104.5Q4 103.1 99.5 105.1 102.5 100.9 104.0 103.7 101.7 105.4 102.8 93.2 105.2
2008 Q1 102.0 92.7 106.8 103.3 100.0 106.3 99.3 90.0 106.2 103.9 89.3 107.3Q2 107.1 103.7 108.8 106.3 104.4 108.0 107.3 105.6 108.6 107.3 99.5 109.2Q3 107.8 105.1 109.3 107.3 105.1 109.2 107.7 106.3 108.8 108.1 102.8 109.6Q4 109.1 108.2 109.6 110.2 110.8 109.6 109.7 110.0 109.5 107.9 101.2 109.7
2009 Q1 109.7 108.6 110.4 108.8 107.0 110.7 109.0 107.9 110.0 110.8 112.1 110.5Q2 111.8 110.5 112.6 110.9 107.9 113.4 110.5 108.8 111.9 113.4 116.2 112.7Q3 112.6 111.2 113.4 111.3 108.3 114.0 111.4 109.4 113.0 114.2 117.2 113.4Q4 112.4 110.7 113.5 113.2 111.8 114.7 110.5 108.6 112.3 113.9 113.9 113.9
2010 Q1 113.9 112.9 114.4 113.5 111.8 115.4 111.7 110.2 113.1 116.2 120.6 115.0
Percentage chang e , quar ter on corresponding quarter of previous year
2007 Q1 3.3 0.9 4.2 2.1 0.2 3.5 4.2 2.5 5.3 2.9 −0.9 3.8Q2 2.4 −0.2 3.8 1.7 −0.1 3.2 2.2 −0.6 4.3 3.0 0.1 3.6Q3 2.6 0.6 3.7 1.5 − 2.6 2.9 2.1 3.6 2.9 −1.7 4.0Q4 2.4 −0.3 3.9 1.2 −0.9 3.0 2.6 1.3 3.5 2.8 −3.2 4.3
2008 Q1 0.4 −7.7 4.6 2.6 1.1 4.1 −2.2 −10.1 3.6 1.9 −13.0 5.3Q2 4.5 3.4 5.0 5.0 5.3 5.1 4.4 4.0 4.6 4.3 0.3 5.3Q3 4.6 4.3 4.8 5.7 5.7 5.9 4.3 4.5 4.2 4.2 2.3 4.9Q4 5.8 8.7 4.3 7.5 9.8 5.4 5.8 8.2 3.9 5.0 8.6 4.3
2009 Q1 7.5 17.2 3.4 5.3 7.0 4.1 9.8 19.9 3.6 6.6 25.5 3.0Q2 4.4 6.6 3.5 4.3 3.4 5.0 3.0 3.0 3.0 5.7 16.8 3.2Q3 4.5 5.8 3.8 3.7 3.0 4.4 3.4 2.9 3.9 5.6 14.0 3.5Q4 3.0 2.3 3.6 2.7 0.9 4.7 0.7 −1.3 2.6 5.6 12.5 3.8
2010 Q1 3.8 4.0 3.6 4.3 4.5 4.2 2.5 2.1 2.8 4.9 7.6 4.1
1 Excludes legitimate cross-border shopping, which is included in tourists’ ex-penditure

237
ALC.DS Household final consumption expenditureTotal alcoholic beverages1
Implied deflators - seasonally adjusted 2006 = 100
Alcoholic beverages
Total Spirits Wine Beer
Restaurants Restaurants Restaurants RestaurantsTotal Retail and hotels Total Retail and hotels Total Retail and hotels Total Retail and hotels
COICOP 02.1 11 02.1 11 02.1 11 02.1 11
ISLD UTOX ISTN ISHQ AWPM OSOU ISII AWPN OSQC ISKD AWPO OSRF2005 96.5 98.7 95.4 97.5 99.7 95.8 95.3 97.2 93.8 96.9 100.6 96.12006 100.0 100.0 100.0 100.0 100.0 100.0 100.0 100.0 100.0 100.0 100.0 100.02007 102.6 100.2 103.8 101.6 99.7 103.1 102.9 101.3 104.1 102.9 98.5 103.92008 106.7 103.0 108.7 107.0 105.6 108.4 106.2 103.7 108.3 106.9 98.6 109.02009 111.7 110.3 112.5 111.2 109.1 113.3 110.4 108.7 111.9 113.2 115.0 112.7
Percentage chang e , year on previous year
2005 2.2 −1.6 4.1 2.2 1.3 3.0 1.9 −0.9 4.5 2.4 −5.7 4.32006 3.6 1.3 4.8 2.6 0.3 4.4 4.9 2.9 6.6 3.2 −0.6 4.12007 2.6 0.2 3.8 1.6 −0.3 3.1 2.9 1.3 4.1 2.9 −1.5 3.92008 4.0 2.8 4.7 5.3 5.9 5.1 3.2 2.4 4.0 3.9 0.1 4.92009 4.7 7.1 3.5 3.9 3.3 4.5 4.0 4.8 3.3 5.9 16.6 3.4
Seasonally adjusted
2007 Q1 102.2 102.0 102.3 101.3 100.2 102.1 102.7 102.8 102.6 102.2 102.5 102.1Q2 102.0 99.5 103.2 101.1 99.5 102.5 102.1 100.2 103.6 102.3 98.2 103.2Q3 103.0 100.1 104.4 101.9 100.1 103.2 103.3 101.4 104.8 103.2 97.4 104.6Q4 103.3 99.2 105.4 101.9 99.1 104.4 103.5 101.0 105.5 103.8 95.9 105.7
2008 Q1 102.9 94.8 107.1 104.1 101.5 106.5 100.9 93.4 106.7 104.0 89.9 107.6Q2 106.8 103.9 108.3 106.7 105.6 107.8 106.8 105.1 108.2 106.8 99.5 108.6Q3 107.9 105.4 109.3 108.0 106.8 109.2 108.0 106.9 108.8 107.8 100.7 109.6Q4 109.4 108.1 110.1 109.6 108.8 110.2 109.5 109.2 109.7 109.2 105.1 110.3
2009 Q1 110.9 111.2 110.8 109.9 108.6 111.2 111.1 111.8 110.5 111.3 113.0 110.8Q2 111.1 109.7 112.0 110.9 108.7 113.0 109.4 107.2 111.3 112.9 115.7 112.1Q3 112.2 110.3 113.3 111.7 109.4 113.9 111.0 108.9 112.8 113.6 113.8 113.5Q4 112.6 110.1 114.0 112.5 109.6 115.2 110.1 106.8 112.8 115.1 117.7 114.4
2010 Q1 115.0 115.1 114.8 114.5 113.0 115.9 113.5 113.5 113.5 116.6 120.9 115.4
Percentage chang e , quar ter on previous quarter
2007 Q1 1.3 2.6 0.7 0.7 0.4 0.6 1.7 3.2 0.6 1.2 3.7 0.7Q2 −0.2 −2.5 0.9 −0.2 −0.7 0.4 −0.6 −2.5 1.0 0.1 −4.2 1.1Q3 1.0 0.6 1.2 0.8 0.6 0.7 1.2 1.2 1.2 0.9 −0.8 1.4Q4 0.3 −0.9 1.0 − −1.0 1.2 0.2 −0.4 0.7 0.6 −1.5 1.1
2008 Q1 −0.4 −4.4 1.6 2.2 2.4 2.0 −2.5 −7.5 1.1 0.2 −6.3 1.8Q2 3.8 9.6 1.1 2.5 4.0 1.2 5.8 12.5 1.4 2.7 10.7 0.9Q3 1.0 1.4 0.9 1.2 1.1 1.3 1.1 1.7 0.6 0.9 1.2 0.9Q4 1.4 2.6 0.7 1.5 1.9 0.9 1.4 2.2 0.8 1.3 4.4 0.6
2009 Q1 1.4 2.9 0.6 0.3 −0.2 0.9 1.5 2.4 0.7 1.9 7.5 0.5Q2 0.2 −1.3 1.1 0.9 0.1 1.6 −1.5 −4.1 0.7 1.4 2.4 1.2Q3 1.0 0.5 1.2 0.7 0.6 0.8 1.5 1.6 1.3 0.6 −1.6 1.2Q4 0.4 −0.2 0.6 0.7 0.2 1.1 −0.8 −1.9 − 1.3 3.4 0.8
2010 Q1 2.1 4.5 0.7 1.8 3.1 0.6 3.1 6.3 0.6 1.3 2.7 0.9
Percentage chang e , quar ter on corresponding quarter of previous year
2007 Q1 3.2 1.2 4.3 1.9 −0.1 3.7 4.4 2.9 5.4 3.0 −0.4 3.8Q2 2.3 −0.7 3.7 1.4 −0.4 3.0 2.0 −0.9 4.4 2.8 −0.7 3.5Q3 2.6 0.5 3.6 1.6 0.1 2.7 2.8 2.1 3.4 2.9 −2.1 4.1Q4 2.4 −0.2 3.7 1.3 −0.7 2.9 2.5 1.4 3.4 2.8 −2.9 4.2
2008 Q1 0.7 −7.1 4.7 2.8 1.3 4.3 −1.8 −9.1 4.0 1.8 −12.3 5.4Q2 4.7 4.4 4.9 5.5 6.1 5.2 4.6 4.9 4.4 4.4 1.3 5.2Q3 4.8 5.3 4.7 6.0 6.7 5.8 4.5 5.4 3.8 4.5 3.4 4.8Q4 5.9 9.0 4.5 7.6 9.8 5.6 5.8 8.1 4.0 5.2 9.6 4.4
2009 Q1 7.8 17.3 3.5 5.6 7.0 4.4 10.1 19.7 3.6 7.0 25.7 3.0Q2 4.0 5.6 3.4 3.9 2.9 4.8 2.4 2.0 2.9 5.7 16.3 3.2Q3 4.0 4.6 3.7 3.4 2.4 4.3 2.8 1.9 3.7 5.4 13.0 3.6Q4 2.9 1.9 3.5 2.6 0.7 4.5 0.5 −2.2 2.8 5.4 12.0 3.7
2010 Q1 3.7 3.5 3.6 4.2 4.1 4.2 2.2 1.5 2.7 4.8 7.0 4.2
1 Excludes legitimate cross-border shopping, which is included in tourists’ ex-penditure

238
DET.CN Household final consumption expenditureSelected detailed components 1
Current prices classified by function (COICOP ) - not seasonally adjusted £ million
2000 2001 2002 2003 2004 2005 2006 2007 2008 200901. Food and non-alcoholic beverages01.1 Food01.1.8 Sugar and sweet products
Sugar CDCQ 333 328 339 343 346 351 344 353 380 369Confectioner y CCIH 5 519 5 591 5 644 5 759 6 062 6 053 5 926 6 369 6 879 7 375Ice cream SWFQ 792 813 847 844 785 776 864 837 881 889
01.2 Non-alcoholic beverages01.2.1 Coffee, tea and cocoa01.2.1.1 Coffee UUNE 894 920 915 939 1 074 1 078 1 088 1 192 1 268 1 48901.2.1.2 Tea SWMS 707 726 743 764 845 851 857 900 928 98901.2.1.3 Cocoa UUNV 158 165 163 169 165 172 174 179 185 19801.2.2 Mineral water and soft drinks
Fr uit and vegetable juices UUOG 1 027 1 160 1 293 1 378 1 395 1 641 1 998 2 013 2 103 2 112Other soft drinks UUOR 3 937 4 091 4 212 4 417 4 618 4 574 4 670 4 769 4 859 5 216
06. Health06.2 Out-patient ser vices06.2.1 Medical ser vices
Pr ivate patients UUQB 588 607 637 687 734 756 841 946 740 63806.2.2 Dental ser vices
Pr ivate patients UUQM 469 473 480 543 687 725 1 068 1 391 1 147 98006.2.3 Paramedical services
Pa yments by patients ADVY 129 215 183 184 191 274 388 249 296 266Pa yments by insurers UTMM 179 195 215 223 219 226 238 250 265 268
06.3 Hospital ser vicesPa yments by patients UTRI 231 241 251 329 463 544 680 542 651 748
07. Transpor t07.1 Purchase of vehicles07.1.1 Motor cars
Cars in kind CCNW 5 728 5 590 5 077 4 825 4 360 4 160 4 250 4 600 4 700 4 700Second hand cars TMMU 10 430 11 236 11 613 12 116 12 679 13 727 14 064 15 210 14 446 11 883
07.2 Operation of personal transpor t equipment07.2.3 Vehicle maintenance and repair
Subscr iptions to motoring organisations CCOZ 465 455 473 518 541 530 589 602 589 56107.2.4 Other vehicle services
Self-dr ive hire UURX 1 568 1 545 1 660 1 618 1 631 1 683 1 973 1 949 2 583 2 473Dr iving lessons CCPA 119 105 97 88 103 132 135 130 113 109Dr ivers’ licences EAZS 19 19 19 19 19 19 19 19 19 19Dr iving test fees CAPC 68 70 70 70 68 68 71 63 76 66Cher ished vehicle registration fees EDPW 65 72 76 95 106 115 124 128 142 154Other motor vehicle running costs CCOY 1 310 1 481 1 503 1 589 2 262 2 618 2 699 3 208 3 089 2 839
07.3 Transpor t ser vices07.3.1 Railways
National rail fares ZAZO 2 758 2 814 2 913 3 051 3 085 3 240 3 304 4 063 4 389 4 33707.3.2 Road
Bus fares CDEC 3 931 4 137 4 312 4 417 4 688 5 150 5 730 6 045 6 277 5 987Taxi fares UUST 2 179 2 239 2 458 2 479 2 507 2 632 2 504 2 624 2 683 2 397
07.3.3 AirInter national fares SUPY 9 180 9 387 9 515 9 864 10 568 11 257 11 988 12 978 12 713 11 117
09. Recreation and culture09.4 Recreational and cultural services09.4.1 Recreational and sporting services
UK residents’ expenditure UURZ 3 728 4 053 4 535 4 795 5 147 5 696 6 323 6 500 5 851 5 92609.4.2 Cultural services
Cinema admissions CCOG 623 620 724 676 737 791 824 831 904 968Theatre admissions UUUQ 1 111 1 160 1 331 1 244 1 500 1 650 1 796 1 768 1 748 1 963Television and video rentals CCOB 1 383 1 260 1 106 845 753 675 702 719 653 644Social subscriptions CCOI 626 708 802 790 773 807 987 901 864 1 037Photographic processing UUWH 797 775 824 997 1 067 927 892 869 814 736Other cultural services UUMG 2 130 2 145 2 812 3 217 3 550 3 624 4 008 4 112 4 140 4 401
11. Restaurants and hotels11.1 Catering services11.1.2 Canteens
School meals LNPE 361 379 395 412 428 443 460 475 480 487
12. Miscellaneous goods and services12.4 Social protection
Local authority homes CCPI 543 552 557 563 571 578 585 592 602 60912.6 Financial ser vices n.e.c.12.6.2 Other financial services
Banking and finance UTYI 8 823 8 998 9 633 10 110 10 228 13 351 15 323 15 837 16 243 14 483Bank and Building Society fees JW26 6 122 6 525 7 362 7 893 8 078 10 041 11 235 11 213 11 783 11 146Unit trust charges CEEE 2 218 2 009 1 808 1 762 1 736 2 760 3 510 4 041 3 829 2 677
Secur ities dealing charges including stamp duties UTYU 2 728 2 275 1 889 1 929 2 133 2 255 2 366 2 544 2 472 2 726Stamp duties on securities SWOZ 1 400 1 009 766 612 579 569 561 554 547 539
12.7 Other ser vices n.e.c.Under taking CCOO 921 945 960 967 927 926 1 078 1 257 1 448 1 535Government fees TMMD 88 106 98 212 65 72 75 76 73 69
1 These series do not necessarily comprise all components of the identifiedCOICOP headings
2 Fees estimates to be published at aggregated level from quarter1 2010

239
ADD.KS Household final consumption expenditureAdditional totals requested by users 1
Chained volume measures, reference year 2006 - seasonally adjusted £ million
2005 2006 2007 2008 2009
UK domestic total household expenditureD, SD Total durable and semi-durable goods JSRW 174 990 184 471 193 371 200 033 199 425ND, S Total non-durable goods and services JSRZ 619 823 623 752 631 146 629 180 609 5790 Total UK domestic expenditure on goods and services ZAKW 793 253 808 223 824 517 829 213 809 004
Net tourism ABTH 12 000 11 387 12 900 12 961 4 163
UK national total household expenditure04.1, 04.2 Rent and imputed rent JSSB 113 243 113 384 114 028 115 881 117 389
Household final consumption expenditure excluding rent JSRU 693 222 706 226 723 389 726 293 695 778Total household final consumption expenditure ABJR 805 273 819 610 837 417 842 174 813 167
Total non-durable goods, ser vices and net tourism JSSA 631 851 635 139 644 046 642 141 613 742Total semi-durable and non-durable goods, ser vices and tourism JSRV 720 964 727 909 739 546 741 364 713 454Total services excluding rent and imputed rent JSSG 308 641 311 031 315 860 313 768 301 131
Durable and semi-durable goods03SD,05SDpar t Clothing, footwear and household textiles JSSC 47 499 49 658 51 907 54 944 56 93507 Transpor t equipment JSSH 41 366 42 578 45 608 44 340 40 43108,09Dpar t Communication, audio-visual, photographic and infor mation processing JSRR 12 978 16 004 19 402 24 967 29 744
Other durable and semi-durable goods05D, 05SDpar t Fur nishing and household goods JUYC 31 546 32 331 32 285 30 796 27 17806D Health LLKY 2 387 2 706 2 908 2 814 2 94709Dpar t, 09SD Recreational goods JUYE 31 314 32 671 33 529 35 281 34 72112D, 12SD Miscellaneous goods JUYD 8 257 8 523 7 732 6 891 7 469
Total JSRS 73 496 76 231 76 454 75 782 72 315
D, SD Total durable and semi-durable goods JSRW 174 990 184 471 193 371 200 033 199 425
Durable goodsFur niture, car pets, household and therapeutic appliances, tools
05par t Fur niture and carpets JTQR 17 146 17 205 17 332 16 043 14 52305par t,06 Household & therapeutic appliances, tools JSRP 7 856 8 377 8 435 8 674 7 83805, 06 Total JSRT 24 988 25 582 25 767 24 717 22 361
07 Purchase of vehicles TMMI 37 465 38 810 41 904 40 351 36 581
Communication, audio-visual, photographic and infor mation processing08, 09part Communication, audio-visual and photographic equipment JSRQ 8 715 10 840 12 356 15 767 18 78509par t Infor mation processing equipment ATSD 4 265 5 164 7 046 9 200 10 95908, 09part Total JSRR 12 978 16 004 19 402 24 967 29 744
09par t, 12 Other durable goods for recreation and personal use JSRY 10 657 11 305 10 798 10 775 11 027
D Total durable goods UTID 85 777 91 701 97 871 100 810 99 713Total durable goods excluding communication, audio-visual,
photographic & infor mation processing equipment JSRX 73 114 75 697 78 469 75 843 69 969
Semi-durable goods03, 05part Clothing, footwear and household textiles JSSC 47 499 49 658 51 907 54 944 56 935
Other semi-durable goods07 Motor vehicle spares LLMB 3 917 3 768 3 704 3 989 3 85009par t Books CDZQ 3 564 3 332 3 343 2 905 2 76009par t Recreational goods excluding books JSSD 22 015 23 130 23 863 25 538 25 31405par t, 12 Other goods JSSF 12 291 12 882 12 683 11 847 10 85305par t,07,09,12 Total JSSE 41 753 43 112 43 593 44 279 42 777
SD Total semi-durable goods UTIT 89 258 92 770 95 500 99 223 99 712
1 These series are not necessarily mutually exclusive
Appendix A: Definitions and conventions This appendix describes a number of issues of
coverage, definition and presentation of the main
statistical series appearing in Consumer Trends.
More detail is contained in UK National Accounts
Concepts, Sources and Methods, particularly
Chapter 22 and the annex to it, - published by the
Stationery Office price £75 - ISBN 0 11 621062 1.
It is also available to download from the National
statistics website at:-
www.statistics.gov.uk/downloads/theme_economy
/Concepts_Sources_&_Methods.pdf
Household Final Consumption Expenditure
Household final consumption expenditure represents,
in the main, traditional consumer spending. It
includes imputed rent for the provision of owner-
occupied housing services and consumption of own
production.
For national accounting purposes, households are
individuals or groups of people sharing living
accommodation and, possibly, other aspects of daily
life such as meals. The household sector thus
includes not only those living in traditional
households, but also those people living in
institutions, such as retirement homes, boarding
houses or prisons. Household final consumption
expenditure covers the purchase of all goods and
services, including housing services, to meet their
requirements for day-to-day living. It does not
include the purchase of dwellings or expenditure on
valuables (antiques and some jewellery), which are
part of capital formation, nor does it include any
expenditure on goods or services for use in a
business.
Household consumption includes goods and services
received by households as income in kind, in lieu of
cash. The same estimates are also included, for
consistency, as part of output for the production
measure and within compensation of employees in
the income estimates of gross domestic product.
The accounts relate to consumption expenditure by
UK resident households, which can take place either
in the UK or the rest of the world. Spending by non-
residents in the UK is excluded from the total. The
UK consumption expenditure which takes place in
the rest of the world is regarded as an import of
services to the UK. Correspondingly, consumption
expenditure in the UK by households resident in the
rest of the world is regarded as an UK export of
services in the national accounts. Thus, total final
consumption expenditure in the UK by all households
has to have imports of services added and exports
deducted in order to arrive at UK household final
consumption expenditure for the national accounts.
Historically, UK household expenditure data have
been compiled by this route, starting with the so-
called “domestic concept” and moving to the “national
concept”.
Classification of individual consumption
For presentation purposes, household final
consumption expenditure is broken down according
to COICOP. However, the underlying data series are
assembled by a variety of methods and routes,
depending on the data sources used. As a result,
some of the historic details in the COICOP
presentation are derived from older presentations
used for UK purposes. Direct collection of data using
the COICOP framework was introduced during 2001
and historic COICOP estimates continue to be
reviewed as necessary in the light of recent data and
in accordance with the revisions policy for the
national accounts.
Business expenditure and expenses
Household final consumption excludes any business
expenditure incurred by the household as part of the
economic activity of unincorporated businesses.
Such expenditure is included in household
intermediate consumption. Also excluded from
household final consumption is any business
expenditure which might otherwise be claimed for tax
purposes, for example, on cars.
Household final consumption expenditure does not
cover the whole of expenditure on consumer type
goods and services. Where methods of estimation
rely on total supplies or sales, for example the ONS
240

Annual Business and Retail Sales Inquiries,
purchases by businesses must be excluded, but in
practice this can be done only roughly.
Income in kind
Household consumption includes a wide range of
goods and services received by households as
income in kind, in lieu of cash. The main items are
the use of company cars for private purposes, and
free or subsidised accommodation or meals.
Own account production
Household production of goods and certain services
for own consumption is included in household
consumption. The main items are owner-occupied
housing services, domestic service and agricultural
produce. Consumption of own account agricultural
production is included within the food items. The
employment of paid domestic staff, such as servants
and gardeners, is regarded as part of household
consumption. However, where such work is
undertaken by members of the household for the
household, the activity is not part of consumption.
Second-hand goods
The estimates of household consumption are net of
sales of second-hand goods. Where the sale of such
goods is between households, neither the sale nor
the purchase is recorded in household consumption
(since they cancel each other out). However, where
purchases are made from dealers, the figures include
the net value of the dealers’ margins. Where
transactions are with other sectors, such as the
purchase of a second-hand company car, the full
value of the purchase is recorded in household
consumption (while the sale value would have been
included as negative capital formation). See also
Valuables below.
Games of chance (betting and gaming)
Household expenditure on games of chance,
including the national lottery, is defined as the
amount staked less the amount returned in winnings,
representing, essentially, the cost of the service. In
the case of the National Lottery this is ticket sales
less prizes.
Insurance
Insurance premiums are composite payments, which
consist of a charge for the service of insuring, a
payment covering the risk insured and, in the case of
life assurance and pension schemes, a substantial
element of saving. Only the first of these elements is
included in household expenditure. For non-life
insurance an imputed “premium supplement” must be
added to the gross premiums actually paid so as to
calculate the service charge. This supplement
represents all property income received from
investing any reserves held by the insurance
company but deemed to belong to policy holders.
Without this income the company would have to
charge higher premiums to cover its charges.
Fees paid to general government
Households make certain payments to government to
obtain various kinds of licences, permits, certificates
or passports. In the accounts, some of these
payments are treated as taxes and the rest as
household consumption. In broad terms, if licences
are granted automatically on receipt of the due fee,
then the payment is regarded as a tax. However,
where government uses the issue of a licence to
undertake some regulatory function, the payments
are treated as household expenditure. Thus,
payments for owning and using vehicles, boats and
aircraft, TV licences and also for licences to hunt,
shoot and fish are all to be regarded as taxes. All
other payments are included within household
consumption.
Fines paid direct to general government are regarded
as transfers and are outside the scope of household
consumption.
Interest payments
Interest payments in general, though part of a
household’s spending, are treated as distributive
transactions of property income in the economic
accounts and not part of household consumption.
This applies to all interest payments on loans or
credit purchase arrangements except where the
credit is extended by the retailer and is included in
the amount charged for the goods.
241
Imputed rentals for owner-occupied dwellings
One particular feature of the household sector is that
owner-occupiers are deemed to be unincorporated
businesses producing housing services which they
then consume. This requires imputing a rental
payment to the owner-occupied sector, analogous to
the activity of payment of market or public sector
rentals. The main reason for this approach is to
minimise distortions to the consumption and GDP
figures which would otherwise arise when there were
changes in housing tenure, for example from rented
to owner-occupied.
In the UK national accounts, as required by a
European Commission Decision, rentals for owner
occupied dwellings are imputed from actual rents
charged (plus housing subsidies where appropriate)
for tenanted dwellings. However, imputed rentals are
then shown in the accounts after deduction of
maintenance, repair and structural insurance
expenditure incurred by owner occupiers.
Expenditure on those items is recorded separately
under the relevant COICOP headings (04.3 and
12.5.2).
Other imputed rentals
In the same way as for owner occupied dwellings,
rentals are also imputed for dwellings occupied by
tenant households paying very little or no rent.
Examples are dwellings provided "free" as part of
compensation for employment.
Capital expenditure on dwellings Expenditure on the purchase of dwellings, including
any transfer costs, or on major improvements to
existing dwellings, is not part of household
consumption, but is included in gross fixed capital
formation (GFCF).
Durable goods
With the exception of GFCF on dwellings, household
consumption embraces spending on all other durable
goods, such as motor cars. In certain circumstances,
such expenditure might be thought of, not as final
consumption, but as GFCF. However, to treat this
expenditure in this way would require, say, the
imputation of an annual amount representing the
value of the benefit derived by the household from
the goods, essentially as is done for owner-occupied
dwellings. Such imputation would be far from easy.
Expenditure is treated as household consumption
spending. Nevertheless, to aid interpretation, durable
goods items as determined within the COICOP are
separately identified within household consumption.
Semi-durable goods, non-durable goods and
services are also identified separately.
Valuables
Valuables are items such as antiques and jewellery
which are primarily held as a store of value and
which do not decline in value over time. They are
thus not consumed. A proportion of the sales of
antiques dealers is deemed to represent the transfer
costs of valuables and is excluded from household
consumption and included in Gross Capital
Formation.
Household consumption overseas and spending in the UK by non-residents
The UK national aggregate of household
consumption in the accounts includes spending
overseas by UK residents and excludes spending in
the United Kingdom by non-residents. However, the
data collected to estimate the UK domestic
aggregate does the reverse: includes expenditure in
the UK by non-residents and excludes expenditure
outside the UK by UK residents. At present, these
series are identified separately in the TOUR tables of
this publication. There is no single COICOP division
encompassing tourist expenditure.
Time of recording
Expenditure must be understood as the acquisition of
goods and services rather than actual disbursements
of cash in the period of account. It relates to the total
value of goods acquired whether paid for outright or
not. Thus when consumers buy on hire purchase or
other forms of credit much of the payment may occur
after the transaction is recorded. Similarly,
contributions to Christmas or holiday funds are not in
principle regarded as expenditure until goods or
services are actually acquired. Payments in advance
242

are, in effect, regarded as saving and payments in
arrears, dis-saving.
Final Consumption Expenditure of Non-Profit Institutions Serving Households
The final consumption expenditure of non-profit
institutions serving households (NPISH) is separated
from expenditure of households on goods and
services. Final expenditure by NPISH is defined as
expenditure on wages and salaries, etc. plus the
imputed charge for capital consumption plus
purchases of goods and services (including any
taxes on expenditure) less sales of goods and
services. It represents expenditure on goods and
services which is paid for not by the beneficiaries
directly but out of other resources available to the
NPISH, for example gifts, endowments, property
income, government grants, etc. Implicit in this
approach is the assumption that NPISH are
producers of goods and services as well as being
consumers of them. NPISH include charities and
colleges of further and higher education amongst
many others.
Actual final consumption
Household final consumption expenditure includes
only the direct spending of resident households.
Some of this spending is on goods and services,
such as health and education, which are provided by
both the market and the State. Household
consumption includes only the former. However,
spending by Government (and NPISH) on such
goods and services is part of the provision of
individual (as opposed to collective) goods and
services by these sectors. This spending is included
in final consumption expenditure of the providing
sector. For these and other ‘individual’ components
of spending, changes in the pattern of provision will
clearly affect the level of the figures of household
final consumption.
Thus, an alternative, wider concept of consumption
has been established. This is called actual final
consumption, and for households is defined as
household final consumption expenditure plus
government and NPISH individual consumption
expenditure. Figures of actual final consumption are
not affected by arrangements for who provides the
good or service and are of use for comparative
analyses of spending over time and between
countries.
More detailed information is available in the United
Kingdom National Accounts - The Blue Book which is
available on the ONS website at:-
http://212.58.231.21/statbase/Product.asp?vlnk=1143
243

Appendix B: Sources This section briefly describes the main sources of
data used for each of the main headings appearing in
the tables of this publication.
The method used for estimating each equivalent
household final consumption series at chained
volume measure depends on the methods used for
the current price estimate. Generally the current price
estimate in value terms is deflated by an appropriate
price index. Unless otherwise noted below, the
indices used for this purpose are components of the
RPI, weighted as appropriate to reflect national
accounting product groups. The RPI does not cover
the whole range of household final consumption and
other indices have to be used or estimated where
necessary. Similarly where the current price estimate
is not in value terms other methods have to be
adopted. These are detailed in United Kingdom
National Accounts - Concepts, Sources and
Methods, which is published by The Stationery
Office. It is available electronically at:-
www.statistics.gov.uk/downloads/theme_economy/C
oncepts_Sources_&_Methods.pdf
Chained volume measure series are estimates of the
volume of expenditure expressed in the average
prices prevailing in the reference year of 2005.
Abbreviations used in this appendix ABI = Annual Business Inquiry
BERR = Department for Business, Enterprise and
Regulatory Reform
BT = British Telecom
COICOP = Classification of Individual Consumption
by Purpose
CVM = Chained Volume Measure
DCLG = Department for Communities and Local
Government
DEFRA = Department for Environment, Food & Rural
Affairs
DCSF = Department for Children, Schools and
Families
DfT = Department for Transport
DH = Department of Health
DIUS = Department for Innovation, Universities and
Skills
DVLA = Driver & Vehicle Licensing Agency
LCF = Living Costs and Food Survey (formerly EFS,
Expenditure & Food Survey)
HMRC = Her Majesty’s Revenue & Customs
IPS = International Passenger Survey
MoD = Ministry of Defence
NHS = National Health Service
OFCOM = Office of Communications
OFWAT = Office of Water Services
ONS = Office for National Statistics
RPI = Retail Prices Index
RSI = Retail Sales Inquiry
Tables 0.CN - 0.DS Summary of household consumption These tables summarise the totals from:
COICOP Division tables 01.CN-12.DS
Details of the components of each division can be
found under the GS tables, covering durable, non-
durable and semi-durable goods and services, below.
Also included directly after the divisional tables are:
TOUR - UK and foreign tourist expenditure Estimates for foreign tourist expenditure and UK
tourist expenditure abroad are based on the IPS.
Special price deflators are constructed by ONS for
the purposes of revaluing foreign tourists’
expenditure to volume terms. For UK tourist
expenditure abroad, retail price indices are available
for most of the countries visited and special indices
are constructed by ONS to represent the kind of
goods and services likely to be bought by UK
travellers overseas.
GS tables Goods and services summary tables, which
are further broken down into the following:-
DG - Durable goods
SDG - Semi-durable goods NDG - Non-durable goods
244
SER - Services DG - Durable goods
Durable goods are goods that can be used
continuously over a period of time, usually three
years or more. They also have a high price relative to
other goods.
Most durable goods data in this table except for cars
are based on the ABI to retailers and others with
retail activity. Quarterly estimates are derived from
the RSI. The annual inquiries provide a breakdown of
sales by commodity. The RSI collects total retail
sales by type of retailer on a monthly basis. It is used
to interpolate the ABI data and to project forward the
commodity information obtained from the most recent
annual inquiry.
Further subdivision by product is estimated using the
more detailed expenditure data in the LCF. All
durable goods listed below are estimated in this way,
unless otherwise specified.
An article explaining, among other things, the
similarities and differences between household
expenditure estimates and the RSI was published on
the ONS website in January 2005
http://www.statistics.gov.uk/articles/nojournal/Early_e
stimates_of_consumer_spend.pdf
DG Division 05 Furniture and furnishings
Furniture and furnishings include lights, lamps and
pictures but exclude works of art and antiques.
Carpets and other floor coverings This includes estimates for carpets and other floor
coverings.
Major household appliances These include appliances such as refrigerators,
washing machines, cookers and vacuum cleaners.
Major tools and equipment Estimates for major household tools and equipment
eg major power tools.
DG Division 06 Therapeutic appliances and equipment
Estimates for therapeutic appliances and equipment
are derived from the LCF.
DG Division 07 Purchase of vehicles
Information on the V55 Registration Document is
used to measure the number of motor cars and motor
cycles sold to private individuals. These are valued
using trade information and include on-the-road costs
other than vehicle excise duty. The method has been
applied back to 1993. Prior to that, for motor cars,
expenditure on new cars was taken as the residual
after subtracting capital formation from the value of
total new car registrations. Used vehicles are
estimated from motor traders’ data from the ABI. This
heading also includes estimates for cars-in-kind (the
imputed value of the use of company cars for private
purposes), based on the taxable value of company
cars as required by HMRC.
For motor cars there are two different methods of
calculating growth to produce chained volume
estimates. For new cars, expenditure is calculated by
valuing registrations directly at current prices and
prices of the previous year; for used cars, current
price estimates are deflated by the RPI for used cars
to derive estimates at previous year prices.
DG Division 08 Telephone and telefax equipment
Estimates for telephone and telefax equipment are
based on the ABI and RSI.
DG Division 09 Unless otherwise indicated, all items in DG Division
09 are estimated using the ABI and RSI.
Audio visual equipment
This includes televisions, video recorders, CD
players, sound systems and components and radios.
Photo and cinema equipment and optical instruments This includes estimates for photo and cinema
equipment and optical instruments.
245

Information processing equipment This includes computers and software packages and
other Information processing equipment.
Major durables for outdoor recreation Estimates for major durables for outdoor recreation
are based on the ABI and other sources as available.
Musical instruments and major durables for indoor recreation Estimates for musical instruments and major
durables for indoor recreation are derived from the
ABI.
DG Division 12 Jewellery, clocks and watches
Estimates for jewellery, clocks and watches are
based on the ABI and RSI and exclude antiques.
SDG - Semi-durable goods Semi-durable goods differ from durable goods in that
their expected lifetime of use, though more than one
year, is often significantly shorter and their purchase
price is substantially less than for durable goods.
The data are estimated from either the ABI and RSI
or the LCF. Sources are listed below.
SDG Division 03 Clothing materials Estimates for clothing materials are derived from the
ABI and RSI.
Garments
Estimates for garments and footwear are based on
the ABI and RSI.
Other articles of clothing and clothing accessories Estimates for other articles of clothing and clothing
accessories are derived from the ABI and RSI.
Shoes and other footwear
Estimates for shoes and other footwear are based on
the ABI and RSI.
SDG Division 05 Household textiles
Estimates for household textiles are based on the
ABI and RSI.
Small electric household appliances
Estimates for small electric household appliances are
derived from the ABI and RSI.
Glassware, tableware, household utensils
Estimates for glassware tableware and household
utensils are based on the ABI and RSI.
Small tools and miscellaneous accessories
Estimates for small tools and miscellaneous
accessories are derived from the ABI and RSI.
SDG Division 07 Motor vehicle spares Estimates for motor vehicle spares are derived from
the LCF.
SDG Division 09 Recording media
Estimates for recording media based on the ABI and
RSI.
Games, toys and hobbies
Estimates for games, toys and hobbies are based on
the ABI and RSI.
Equipment for sport, camping and open-air recreation
Estimates for equipment for sport, camping and
open-air recreation are derived from the ABI and RSI.
Books Estimates for books are derived from the LCF.
246

SDG Division 12 Electric appliances for personal care Estimates for electric appliances for personal care
are derived from the ABI and RSI.
Other personal effects Estimates for other personal effects are based on the
ABI and RSI.
NDG - Non-durable goods Non-durable goods are goods that can be used only
once. They include food and all types of drink.
Data come from several sources which are listed
below.
NDG Division 01 Food and non alcoholic beverages
The main data source for food estimates is the LCF.
The LCF provides a detailed record of expenditure on
food brought into the home.
Expenditure on food outside the home (e.g. in
restaurants), with the exception of “casual”
purchases of confectionery, soft drinks and ice
cream, is included under catering services.
Relevant components of the RPI are used to deflate
expenditure at current prices to derive chained
volume measures.
NDG Division 02 Alcoholic beverages and tobacco
Estimates for alcoholic beverages are based on
volume of sales and average prices of individual
types of alcoholic beverages for "off-licence" trades.
This information is obtained from a continuous survey
of retail outlets.
The volume data extracted from this survey are
grossed up to align with monthly figures obtained
from HMRC relating to the quantities of alcoholic
drink released for sale within the UK. The price data
obtained from the survey are used to derive both
current expenditure and estimates at previous year
prices in order to derive chained volume measures.
Separate data are provided for outlets licensed to sell
for consumption off the premises (“off-licence trade”
– retail shops etc) from those licensed for
consumption of alcohol on the premises (“licensed
trade” – restaurants, public houses etc). This
information has been used to derive separate
estimates of household expenditure for the two
appropriate COICOP categories: 2.1 alcoholic
beverages – “off-licence trade”; and 11.1.1
restaurants, cafés, pubs and the like – “licensed
trade”. The overall totals for expenditure on alcoholic
drink are summarised in separate tables ALC.CN-ALC.DS after the main household expenditure
tables.
Estimates for tobacco are based on data obtained
from HMRC relating to the quantities of tobacco
released for sale within the UK. Relevant
components of the RPI are used to convert this
volume data into current and chained volume
measure estimates.
Estimates of household expenditure on alcoholic
drink and tobacco smuggled into the UK are also
being made from 1994. These are based on HMRC
intelligence on the level of smuggling, including
freight smuggling and diversion fraud, taking place
together with assumptions on the prices at which the
goods are sold to final consumers through different
types of outlet. For alcohol, retail shops and
restaurants are assumed to sell the goods at the
same prices as the rest of their stock. For “street”
sales (i.e. not through off-licences or restaurants),
70% of the average legal UK price is used for beer
and 115% of the French prices (published by the
French Statistical Institute, INSEE) for wines and
spirits.
For tobacco, the prices at which smuggled goods are
bought by UK households are assumed to be slightly
above Belgian market prices, although the goods are
not necessarily regarded as having been sourced
from Belgium.
247
NDG Division 04 Materials for the maintenance and repair of the dwelling Estimates for materials for the maintenance and
repair of the dwelling are based on the ABI and RSI.
Water supply
Estimates for water supply are based on data
supplied by OFWAT and the Scottish Executive. The
chained volume estimates are based on movements
in domestic rateable values up to 1995. Thereafter,
the appropriate component of the RPI is used to
deflate the current price series.
Electricity, gas and other fuels Estimates for electricity, gas and other fuels are
based on data obtained by the BERR from various
energy suppliers. Relevant components of the RPI
are used to deflate current expenditure and derive
chained volume measures.
NDG Division 05 Non-durable household goods
Estimates for non-durable household goods
(including cleaning products) are based on the LCF.
NDG Division 06 Pharmaceutical and other medical products
Estimates are based on the ABI and RSI or the LCF.
NDG Division 07 Vehicle fuels and lubricants
Estimates for vehicle fuels are based on data
obtained by the BERR from various energy suppliers
together with LCF data on household expenditure.
Estimates for lubricants are based on the LCF. For
vehicle fuels, average prices of the previous year are
applied to volume data in order to obtain chained
volume measures.
NDG Division 09 Garden plants and flowers, pets and newspapers
Estimates are based on the LCF.
Stationery and drawing materials
Estimates are based on the ABI and RSI.
SER - Services
SER Division 03 Clothing and hire of clothing
Clothing and hire of clothing are based on the LCF.
Repair and hire of footwear
Repair and hire of footwear are based on the LCF.
SER Division 04 Actual and imputed housing rentals
Estimates for housing rentals make use of private
sector data from the LCF and public sector rented
dwellings data supplied by local authorities to the
DCLG and to the Scottish Executive and the Wales
and Northern Ireland Offices. Estimates of rent
receipts by New Town corporations and other public
corporations are also included.
A change to the method for calculating owner-
occupiers’ imputed rent was introduced in June 1996
for years subsequent to 1990. Up to 1990, domestic
rateable values provided the basis for estimating
rental values for owner occupied property. Following
the abolition of the rating system in Great Britain, and
in accordance with a European Union Council
Decision under the GNP Directive, a new benchmark
establishing the value of imputed rents was set for
1991.
This has subsequently been updated to 2001, using
information on the dwelling stock from the 2001
Census together with survey and official data on
rents. Estimates of imputed rents are based on an
econometric regression model, which uses certain
characteristics of dwellings to link owner-occupied
and rent-free dwellings to rented properties in the
social and private rented sectors. This benchmark is
then projected forward using numbers and sizes of
owner-occupied dwellings and broadly comparable
data on paid rents. The latest benchmarking was
described in an article in the April 2005 edition of
Economic Trends
248

http://www.statistics.gov.uk/articles/economic_trends/
ET617Richardson.pdf
In order to construct chained volume measures, the
number of occupied dwellings is used as a volume
indicator. This indicator is based on total housing
stock data, less estimates of unoccupied dwellings,
supplied by the DCLG and adjusted by a quality
factor to take account of overall improvements in the
housing stock over time.
Services for maintenance and repair of the dwelling Estimates for services for maintenance and repair of
the dwelling are based on the LCF. They include
expenditure by householders and, under insurance
policies, by insurers.
Refuse collection Estimates for refuse collection are based on the LCF.
Sewerage collection Estimates for sewerage collection are based on the
data supplied by OFWAT and the Scottish Executive.
The methodology for deriving the chained volume
measure is as described for water supply (NDG
Division 04), above.
SER Division 05 Repair of furniture, furnishings and floor coverings Estimates for repair of furniture, furnishings and floor
coverings are based on the LCF.
Repair of household appliances Estimates for repair of household appliances are
based on the LCF.
Domestic and household services
Estimates for domestic and household and services
are mainly based on the LCF.
SER Division 06 Outpatient and hospital services
Estimates for NHS payments and private medicine
are based on DH data and the LCF respectively.
Estimates for medical insurance are based on a
survey of companies conducted by the DH and
information on premiums is provided by the
Association of British Insurers. For NHS payments
and medical insurance, average prices of the
previous years are applied to volume data in order to
obtain chained volume measures. For private
medicine, relevant components of the RPI are used
to deflate to chained volume measure. Estimates for
dental services are based on the LCF and DH data. Paramedical services are based on the LCF and
hospital services are based on the LCF and DH data.
SER Division 07 Vehicle maintenance and repair and other vehicle services
Vehicle maintenance and repair also includes
motoring organisation subscriptions. Data are
obtained from the LCF.
Other vehicle services include cherished number
plates, which are based upon data collected by the
DVLA. Driving licences are based on administrative
records; they are deflated by an appropriate price
index. Estimates for other components are largely
based on the LCF. These include driving lessons and
tests and self-drive car hire.
Transport services
Estimates for national railways travel are derived
from the Strategic Rail Authority. Light rail, road and
other transport services are largely based on data
collected by the DfT. Estimates for air and sea travel
are based on the IPS. The IPS is a continuous
sample survey of passengers (both UK residents and
non-residents) travelling between the UK and foreign
countries. In order to construct chained volume
measure estimates, the number of journeys, based
on information collected by the IPS, is used as a
volume indicator.
249

SER Division 08 Postal services Estimates for postal services are based on the LCF.
Telephone and telefax services Estimates for telephone and telefax services are
based on trade and OFCOM (the industry regulator)
data for fixed lines, including cable, and the LCF for
mobile phones.
SER Division 09 Repair of audio visual, photographic and information processing equipment Estimates for repair of audio-visual, photographic and
information processing equipment are based on the
LCF.
Maintenance and repair of other major durables for recreation and culture Estimates for maintenance and repair of other major
durables for recreation and culture are based on the
LCF.
Veterinary and other services for pets Estimates for veterinary and other services for pets
are based on the LCF.
Recreational and sporting services Estimates for recreational and sporting services are
based are on the LCF.
This heading includes services provided by sports
stadia, horse-racing courses, motor-racing circuits,
swimming pools, tennis courts, bowling alleys,
gymnasia, fitness centres, fairs and amusement
parks, ski facilities; hire of equipment and
accessories for sport and recreation, such as sailing
or camping, aerobics, weight-loss, dancing, music,
skating, skiing and swimming; and services of tour
guides, etc.
Cultural services These include theatre and museum services, other
admissions and social subscriptions; TV rental and
repairs. Estimates for most of these are derived from
the LCF.
Games of chance Data for games of chance other than the National
Lottery are based on duty receipts provided by
HMRC. Estimates for the National Lottery are based
on data obtained from the National Lottery
Commission.
SER Division 10 Education
Estimates for education are based on the LCF, DIUS
and DCSF data and, in the past, data received from
the Higher Education Funding Council, the
Independent Schools Information Service and fees
charged by local authorities (derived from local
government accounts).
SER Division 11 Catering and accommodation services
Household expenditure on catering services is based
on the LCF. Information provided from commercial
data on alcohol sales has been used to derive
household expenditure class 11.1.1 restaurants,
cafes etc. "licensed trade" (see notes under NDG
Division 02 Alcoholic beverages, above).
Similar expenditure by students living in university or
college accommodation is derived from surveys
sponsored by the DIUS. MoD survey data is used to
construct estimates of expenditure by military
personnel residing in barracks. A number of different
deflators, including relevant components of the RPI,
are used to obtain chained volume measure
estimates for catering.
SER Division 12 Hairdressing salons and personal grooming establishments Estimates for hairdressing salons and personal
grooming establishments are based on the LCF.
Social protection Estimates for social protection, including childcare,
are based are on various sources, including the LCF.
Estimates of expenditure by persons living in private
residential and nursing homes are benchmarked on a
1993 survey of such establishments. Estimates for
fees and charges paid by similar persons residing in
Local Authority administered homes are based upon
250

data obtained from the DCLG, the Scottish Executive
and the Wales Office.
Insurance and other financial services Estimates for the administrative costs of life
insurance and pension funds are largely based on
inquiries conducted by the ONS and data published
by the Association of British Insurers. An appropriate
component of the Average Earnings Index is used to
deflate current expenditure and derive a chained
volume measure.
The supply of FISIM (excluding imports), is based on
a total of interest receipts and payments, which are
estimated from detailed data on stocks of loans and
deposits and associated interest rates.
Estimates for stamp duties on securities make use of
HMRC’s data while estimates for securities dealers'
commission are based on stock exchange
information. For both stamp duties and securities
dealers' commission, an index of share prices is used
to deflate current expenditure to derive chained
volume measures.
Estimates for other financial services use data
provided by the Bank of England and several other
sources. A number of different deflators are used to
obtain chained volume measure estimates for
financial services. Estimates for most components of
non-life insurance are based on the LCF.
Other services This includes estimates for undertaking, which makes
use of the number of deaths data collected by ONS.
A price deflator obtained from survey data is used to
convert this volume data into both current and
expenditure estimates.
Also included is expenditure on legal services and on
photocopying services.
Tables 0A Summary of household consumption Annual data These tables summarise the annual totals, which are
available back to 1963.
Tables 0GSA Summary goods and services Annual data These tables summarise annual goods and services
classified by COICOP function back to 1963.
Tables ALC Total alcoholic beverages These tables sum the alcohol purchased in retail
outlets (“off-licence trade”) and that purchased in
cafes, restaurants, pubs and hotels (“licensed trade”).
Tables AT Alcoholic drink and tobacco, including smuggled goods These tables were last published in the Quarter 1
2006 edition of Consumer Trends. They indicate the
size of the estimates for smuggled alcohol and
tobacco included within COICOP Division 02
Alcoholic drink and tobacco and Division 11
Restaurants and hotels. Only annual estimates are
produced, one year in arrears, by HMRC. The total
household expenditure series in this issue of
Consumer Trends do, however, include estimates for
all periods up to the present.
The methodology for smuggled goods was described
in an article on page 240 of the Quarter 1 2002 issue
of Consumer Trends. Since that publication, the
coverage of freight smuggling and diversion fraud in
the estimates has been improved.
Table DET.CN Selected detailed components
Table ADD.KS Additional totals requested by users These tables show a selection of series in long-run
annual format and do not necessarily comprise all
components of the identified COICOP headings.
Quarterly data can be found on the ONS website.
251
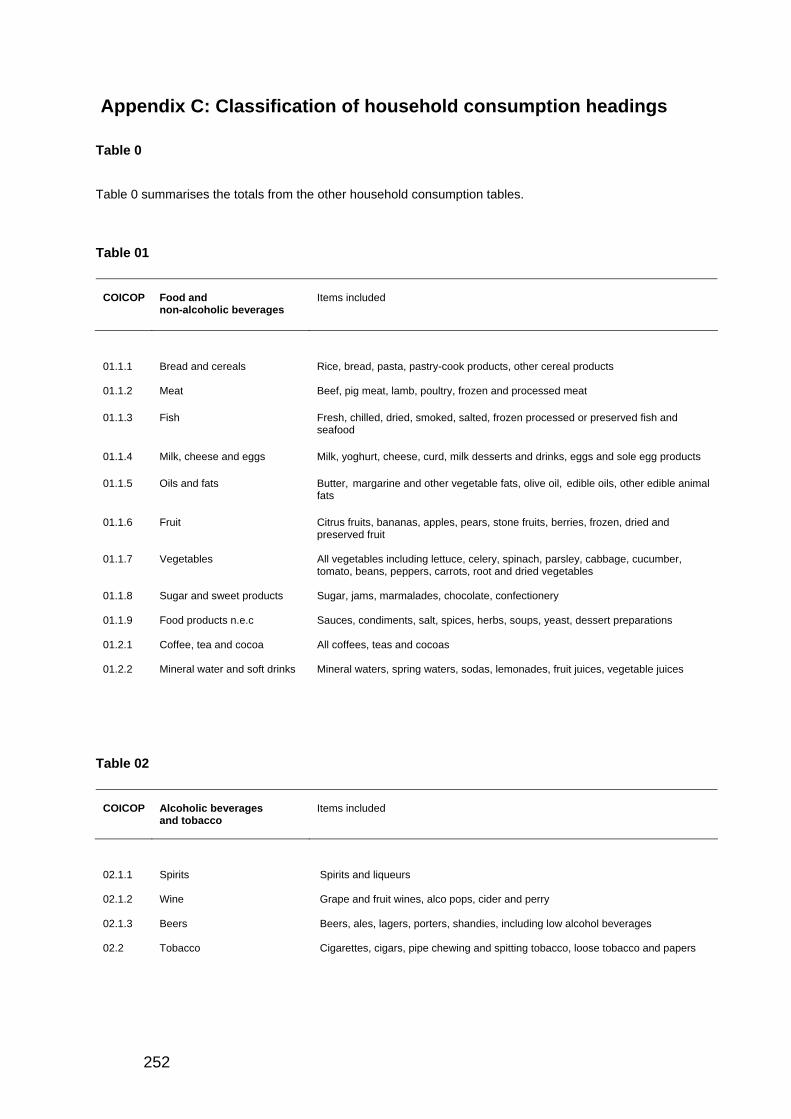
Appendix C: Classification of household consumption headings Table 0 Table 0 summarises the totals from the other household consumption tables. Table 01
COICOP
Food and non-alcoholic beverages
Items included
01.1.1 Bread and cereals Rice, bread, pasta, pastry-cook products, other cereal products
01.1.2 Meat Beef, pig meat, lamb, poultry, frozen and processed meat
01.1.3 Fish Fresh, chilled, dried, smoked, salted, frozen processed or preserved fish and seafood
01.1.4 Milk, cheese and eggs Milk, yoghurt, cheese, curd, milk desserts and drinks, eggs and sole egg products
01.1.5 Oils and fats Butter, margarine and other vegetable fats, olive oil, edible oils, other edible animal fats
01.1.6 Fruit Citrus fruits, bananas, apples, pears, stone fruits, berries, frozen, dried and preserved fruit
01.1.7 Vegetables All vegetables including lettuce, celery, spinach, parsley, cabbage, cucumber, tomato, beans, peppers, carrots, root and dried vegetables
01.1.8 Sugar and sweet products Sugar, jams, marmalades, chocolate, confectionery
01.1.9 Food products n.e.c Sauces, condiments, salt, spices, herbs, soups, yeast, dessert preparations
01.2.1 Coffee, tea and cocoa All coffees, teas and cocoas
01.2.2 Mineral water and soft drinks Mineral waters, spring waters, sodas, lemonades, fruit juices, vegetable juices
Table 02
COICOP
Alcoholic beverages and tobacco
Items included
02.1.1 Spirits Spirits and liqueurs
02.1.2 Wine Grape and fruit wines, alco pops, cider and perry
02.1.3 Beers Beers, ales, lagers, porters, shandies, including low alcohol beverages
02.2 Tobacco Cigarettes, cigars, pipe chewing and spitting tobacco, loose tobacco and papers
252

Table 03
COICOP
Clothing and footwear
Items included
03.1.1 Clothing materials Natural and man-made fabrics used in clothing
03.1.2 Garments Men’s, women’s and children’s clothing
03.1.3 Other articles of clothing/ accessories
Ties, handkerchiefs, scarves, gloves, belts, hats, threads, wool, buttons, zips, ribbons, laces - includes gardening and working gloves but not rubber gloves (included in 5.6.1) and crash helmets for motor cycles and bicycles
03.1.4 Cleaning, repair and hire of clothing
Dry cleaning, laundering, dyeing and altering of clothing
03.2.1 Shoes and other footwear All footwear suitable for everyday and leisure wear but not sports specific (included in 9.3.2) or orthopaedic footwear (included in 6.1.3)
03.2.2 Repair and hire of footwear Repairs, cleaning and hire of non sports related footwear
Table 04
COICOP
Housing, water, electricity gas and other fuels
Items included
04.1.1 Actual rents paid by tenants for housing
Rent paid for use of land and dwelling only and all fixtures and contents supplied
04.1.2 Other actual rentals Rentals paid for secondary residences
04.2.1 Imputed rentals of owner occupiers
Imputed value of rent for the owner occupied sector
04.2.2 Other imputed rentals
Imputed value for rent free households
04.3.1 Materials for maintenance and repair of the dwelling
Paints, wallpaper, plaster, tiles and small plumbing items
04.3.2 Services for maintenance and repair of the dwelling
Fees to plumbers, electricians, carpenters, glaziers, decorators etc
04.4.1 Water supply Hire of meters, standing charges all bills but not including hot water or steam supplied by local authorities
04.4.2 Refuse collection Charges for refuse collection and disposal
04.4.3 Sewerage collection Charges for the collection and disposal of sewerage
04.4.4 Other dwelling related services Caretaking, gardening, stairwell cleaning, maintenance charges, security services but not window cleaning (included in 5.6.2)
04.5.1 Electricity All charges for electricity
04.5.2 Gas All charges for gas
04.5.3 Liquid fuels Domestic heating and lighting oil
04.5.4 Solid fuels Coal, coke etc.
04.5.5 Heat energy Hot water and steam purchased from local authorities
253
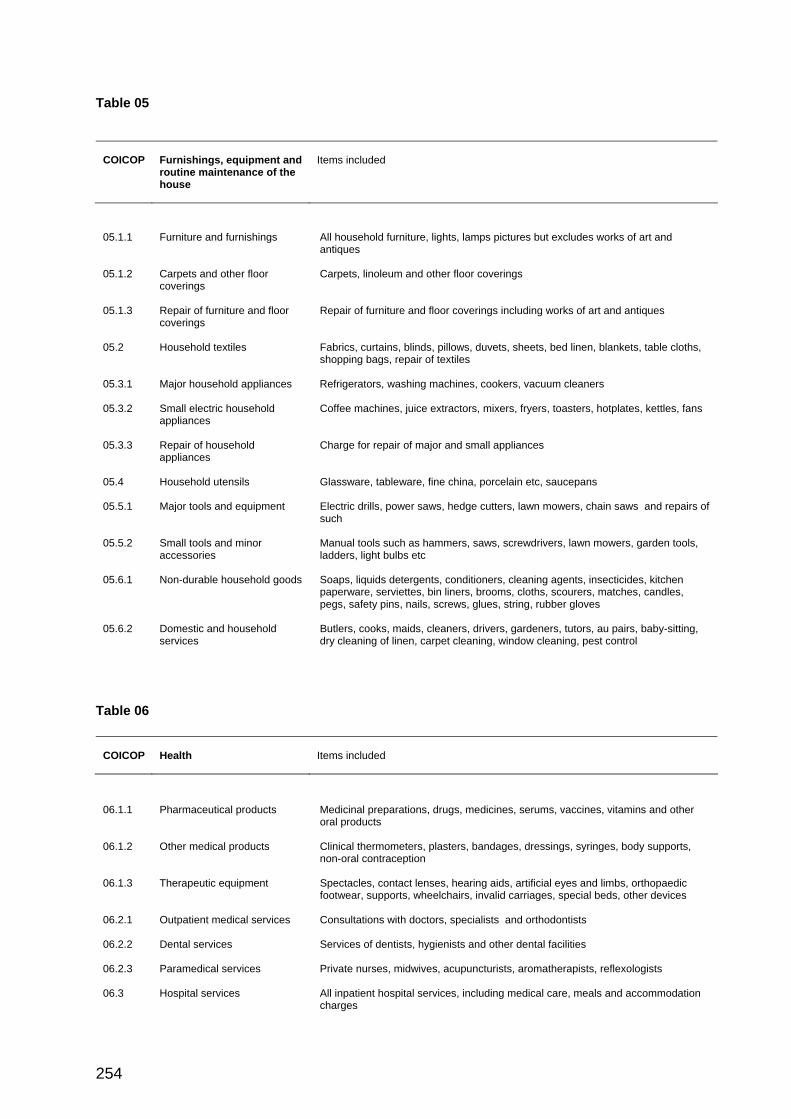
Table 05
COICOP
Furnishings, equipment and routine maintenance of the house
Items included
05.1.1 Furniture and furnishings All household furniture, lights, lamps pictures but excludes works of art and antiques
05.1.2 Carpets and other floor coverings
Carpets, linoleum and other floor coverings
05.1.3 Repair of furniture and floor coverings
Repair of furniture and floor coverings including works of art and antiques
05.2 Household textiles Fabrics, curtains, blinds, pillows, duvets, sheets, bed linen, blankets, table cloths, shopping bags, repair of textiles
05.3.1 Major household appliances Refrigerators, washing machines, cookers, vacuum cleaners
05.3.2 Small electric household appliances
Coffee machines, juice extractors, mixers, fryers, toasters, hotplates, kettles, fans
05.3.3 Repair of household appliances
Charge for repair of major and small appliances
05.4 Household utensils Glassware, tableware, fine china, porcelain etc, saucepans
05.5.1 Major tools and equipment Electric drills, power saws, hedge cutters, lawn mowers, chain saws and repairs of such
05.5.2 Small tools and minor accessories
Manual tools such as hammers, saws, screwdrivers, lawn mowers, garden tools, ladders, light bulbs etc
05.6.1 Non-durable household goods Soaps, liquids detergents, conditioners, cleaning agents, insecticides, kitchen paperware, serviettes, bin liners, brooms, cloths, scourers, matches, candles, pegs, safety pins, nails, screws, glues, string, rubber gloves
05.6.2 Domestic and household services
Butlers, cooks, maids, cleaners, drivers, gardeners, tutors, au pairs, baby-sitting, dry cleaning of linen, carpet cleaning, window cleaning, pest control
Table 06
COICOP
Health
Items included
06.1.1 Pharmaceutical products Medicinal preparations, drugs, medicines, serums, vaccines, vitamins and other oral products
06.1.2 Other medical products Clinical thermometers, plasters, bandages, dressings, syringes, body supports, non-oral contraception
06.1.3 Therapeutic equipment Spectacles, contact lenses, hearing aids, artificial eyes and limbs, orthopaedic footwear, supports, wheelchairs, invalid carriages, special beds, other devices
06.2.1 Outpatient medical services Consultations with doctors, specialists and orthodontists
06.2.2 Dental services Services of dentists, hygienists and other dental facilities
06.2.3 Paramedical services Private nurses, midwives, acupuncturists, aromatherapists, reflexologists
06.3 Hospital services All inpatient hospital services, including medical care, meals and accommodation charges
254

Table 07
COICOP
Transport
Items included
07.1.1 Motor cars Motor cars, vans etc purchased for private/ non-business use
07.1.2 Motor cycles Motor cycles, motor scooters and powered bicycles
07.1.3 Bicycles
All non-powered bicycles, tricycles but not toy bicycles
07.2.1 Motor vehicle spares All spares and accessories to be fitted by owner, but not helmets (included in 3.1.3) or cleaning materials (included in 5.6.1), or charges for fitting or servicing (included in 7.2.3)
07.2.2 Vehicle fuels and lubricants Petrol, diesel, lpg, alcohol ,oil and lubricants, brake and other fluids, coolants etc
07.2.3 Vehicle maintenance and repair
Servicing and repair of motor vehicles, cost of fitting of spare parts and the parts themselves, wheel balancing, AA/RAC inspection, car washing
07.2.4 Other vehicle services Garage hire, parking spaces, tolls, parking meters, driving lessons and tests, driving licences, MOT test
07.3.1 Railways National, suburban and light rail, underground and tram travel
07.3.2 Road Transport by bus, coach, taxi and hired car with driver
07.3.3 Air Passenger transport by air
07.3.4 Sea and inland waterways Passenger travel by ship, boat, ferry, hovercraft and hydrofoil
07.3.6 Other transport services Funicular, chair lift, cable car, removal services, porters, left-luggage, travel agents’ commission
Table 08
COICOP
Communication
Items included
08.1 Postal services Payments for delivery of post via postage stamps and private mail delivery
08.2 Telephone and fax equipment Purchase and repair of telephones, mobile phones, fax machines, answering machines etc
08.3 Telephone and telefax services
Installation and subscription costs of personal telephone equipment
255

Table 09
COICOP
Recreation and culture
Items included
09.1.1 Audio visual equipment Radios, record players, amplifiers, speakers, tape machines, CD and DVD machines, personal stereos, televisions, videocassette recorders, aerials
09.1.2 Photographic and optical equipment
Cameras, camcorders, projectors, screens, binoculars, microscopes, telescopes and other photographic equipment
09.1.3 Information processing equipment
Personal computers, printers, calculators, word processors, typewriters
09.1.4 Recording media Records, pre-recorded tapes and CDs, pre-recorded videotapes and DVDs, floppy disks, blank tapes, videotapes, CD Rs, unexposed film
09.1.5 Repairs of audio-visual equipment
Repair to audio-visual, photographic and cinematic equipment and information processing equipment
09.2.1 Major durables for outdoors recreation
Caravans, camper vans, trailers, aeroplanes helicopters, gliders, air balloons, boats, animals for recreation and associated equipment
09.2.2 Musical instruments and major durables for indoor recreation
Musical instruments of all sizes and types, billiard, snooker and ping-pong tables, pin-ball and gaming machines
09.2.3 Maintenance of other major durables
Repair of caravans, camper vans, trailers, aeroplanes, helicopters, gliders, air balloons, boats, musical instruments of all sizes and types
09.3.1 Games, toys and hobbies Games, toys, toy bicycles, electronic games, fireworks, stamps for collecting, coins, hobby tools and requisites
09.3.2 Sports, camping and open-air recreation equipment
Supply and repair of balls, shuttlecocks, gymnastic equipment, bats, rackets, sport specific footwear, weights, parachutes, recreational firearms, fishing equipment, inflatable boats, tents, sleeping bags, camping stoves, and barbecues
09.3.3 Gardens, plants and flowers Flowers, shrubs, bulbs, seeds, fertilisers, composts, turf
09.3.4 Pets and related products Pets, pet foods, veterinary products, grooming goods, collars, leads, cages, kennels, tanks, litter trays
09.3.5 Veterinary and other services Vets’ charges for grooming, boarding, tattooing, training and surgery etc
09.4.1 Recreational and sporting services
Services provided by sports stadia, racecourses, rinks, golf courses, pools, courts, bowling alleys, gyms, fairs, parks, dancing and skating
09.4.2 Cultural services Cinemas, theatres, concerts, circuses, TV rental, satellite subscription, video hire, hire of musicians, clowns, performers, photographers, film processing
09.4.3 Games of chance Lotteries, scratchcards, betting, gaming, gambling
09.5.1 Books Books, atlases, encyclopaedias, text books, musical scores
09.5.2 Newspapers and periodicals Newspapers, magazines, periodicals
09.5.3 Miscellaneous printed matter Catalogues, posters, greetings cards, invitations, postcards, calendars
09.5.4 Stationery and drawing materials
Writing pads, envelopes, account books, notebooks, diaries, pens, pencils, rubbers, correction fluids, ribbons, punches, scissors, staplers, drawing pins, paper, card
09.6 Package holidays All-inclusive holidays which include travel fares, food and accommodation
256
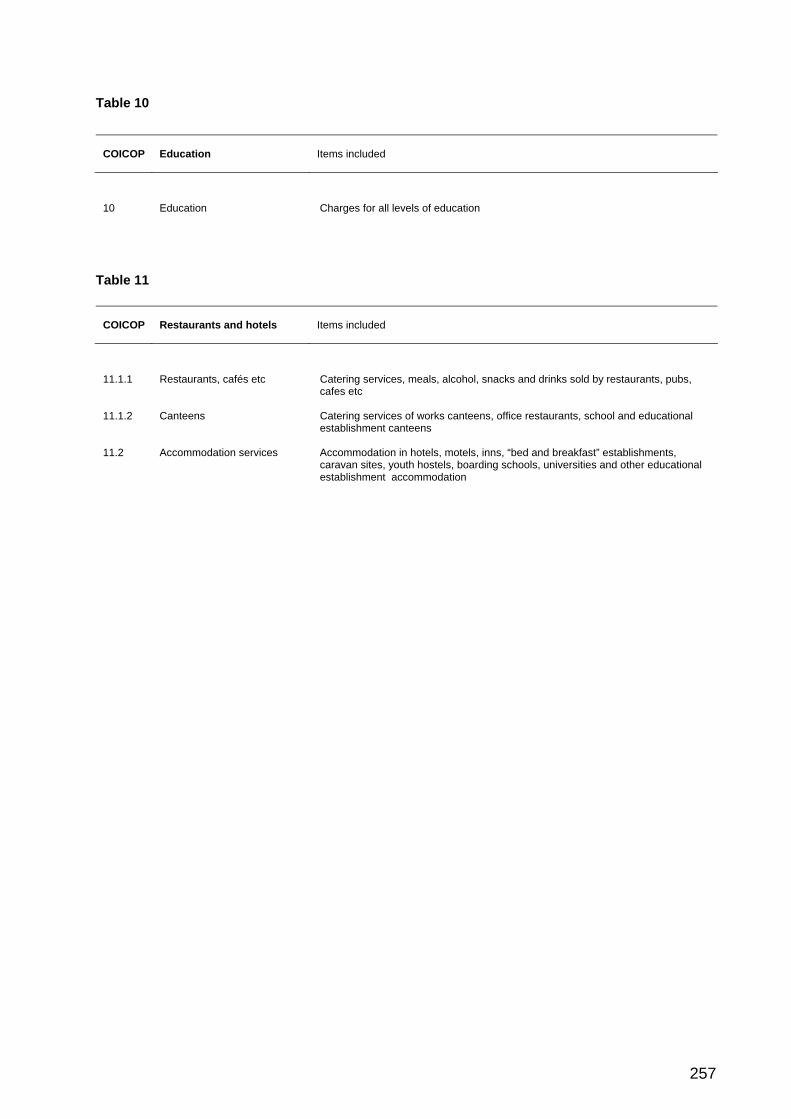
Table 10
COICOP
Education
Items included
10 Education Charges for all levels of education Table 11
COICOP
Restaurants and hotels
Items included
11.1.1 Restaurants, cafés etc Catering services, meals, alcohol, snacks and drinks sold by restaurants, pubs, cafes etc
11.1.2 Canteens Catering services of works canteens, office restaurants, school and educational establishment canteens
11.2 Accommodation services Accommodation in hotels, motels, inns, “bed and breakfast” establishments, caravan sites, youth hostels, boarding schools, universities and other educational establishment accommodation
257

Table 12
COICOP
Miscellaneous goods and services
Items included
12.1.1 Hairdressing and personal grooming
Hairdressers, barbers, beauty shops and salons, men’s personal grooming centres, massage parlours, saunas, tanning centres
12.1.2 Electric appliances for personal care
Razors, hair trimmers, hair dryers, curling tongs, sun lamps, electric tooth brushes etc
12.1.3
Other products for personal care
Non-electrical appliances, hand razors, hand clippers, blades, hair scissors, combs, brushes, hair clips, nail brushes, bathroom scales, soap, oils, shaving soap, creams and foam, toothpaste, deodorants, lipstick, nail varnish, make up, lacquers, aftershave, perfumes, and sun tan lotions
12.3.1 Jewellery, clocks and watches Supply and repair of precious stones and metals, jewellery, clocks, watches
12.3.2 Other personal effects Travel goods, suitcases, bags, purses, lighters, prams, cots, baby car seats, baby carriers, harnesses, reins, sunglasses, sticks and canes, umbrellas, key rings, gravestones, coffins, urns for ashes
12.4 Social protection Assistance and support for elderly, disabled, occupational injured, war survivors, widows and widowers, destitute, homeless, low earners and unearned, refugees, alcohol and drug abused. Homes, centres, schools, cleaning services, meals, holidays, counselling services for the above groups, fostering and adoption services
12.5.1 Life insurance Administration charges of life insurance. i.e. premiums less claims
12.5.2 Dwelling insurance Owner-occupier service and tenant charges for buildings and contents insurance
12.5.3 Health insurance Charges for private sickness and accident insurance
12.5.4 Transport insurance Service charges for car and other vehicle insurance and travel insurance
12.5.5 Other insurance Service charges for Civil liability insurance for injury or damage to third parties and their property but not arising from vehicle operation (included in 12.5.4).
12.6.1 FISIM Financial Intermediation Services Indirectly Measured (FISIM)
12.6.2 Other financial services Charges for financial services of banks, post offices, building societies, money changers, brokers, advisors and the like
12.7 Other services Legal fees, employment agency fees, undertaking, funeral services, estate agents’ charges, photocopies, birth, marriage and death certificates, newspaper advertisements, astrologers, private detectives, bodyguards, dating agencies, cloakroom charges
Table TOUR
UK and foreign tourist expenditure
Items included
UK tourist expenditure abroad Expenditure abroad by UK residents
Foreign tourist expenditure in the UK
Expenditure in the UK by non-UK residents
258

Table 0GS
COICOP
Goods and services summary
Items included
UK national total UK domestic total plus net tourism
Net tourism UK tourist expenditure abroad less foreign tourist expenditure in the UK
0 UK domestic total Sum of durable, semi-durable and non-durable goods plus services
Total for goods Sum of durable, semi-durable and non-durable goods
D Durable goods All goods which have longer shelf-life, vehicles, furniture, major household appliances, telephone etc.
SD Semi-durable goods Household textiles, glassware, table ware, clothing materials, garments, shoes and other footwear, games, toys and hobbies, books and recording media
ND Non-durable goods All goods which have shorter shelf life, food, drink, tobacco, plants, flowers, gas, electricity etc
S Services Clothing and footwear, housing, water, electricity, gas and other fuels, furnishing, household equipment and routine maintenance of the house, financial services, transport and communication, restaurants and hotels, package holiday, education, social protection, recreation and cultural services
Table DG
COICOP
Durable goods
Items included
05.1.1 Furniture and furnishings All household furniture, lights, lamps pictures but excludes works of art and
antiques
05.1.2 Carpets and other floor coverings
Carpets, linoleum and other floor coverings
05.3.1 Major household appliances Refrigerators, washing machines, cookers, vacuum cleaners
05.5.1 Major tools and equipment Electric drills, power saws, hedge cutters, lawn mowers, chain saws and repair of such.
06.1.3 Therapeutic equipment Spectacles, contact lenses, hearing aids, artificial eyes and limbs, orthopaedic footwear, supports, wheelchairs, invalid carriages, special beds, other devices
07.1.1 Motor cars Motor cars, vans etc purchased for private/ non-business use
07.1.2 Motor cycles Motor cycles, motor scooters and powered bicycles
07.1.3 Bicycles All non-powered bicycles, tricycles but not toy bicycles
08.2 Telephone and fax equipment Purchase and repair of telephones, mobile phones, fax machines, answering machines etc
09.1.1 Audio visual equipment Radios, record players, amplifiers speakers, tape machines, CD machines, personal stereos, televisions, televisions, video cassette recorders, aerials
09.1.2 Photographic and optical equipment
Cameras, camcorders, projectors, screens, binoculars, microscopes, telescopes and other photographic equipment
09.1.3 Information processing equipment
Personal computers, printers, calculators, word processors, typewriters
259

Table DG (continued)
COICOP
Durable goods
Items included
09.2.1 Major durables for outdoors recreation
Caravans, camper vans, trailers, aeroplanes helicopters, gliders, air balloons, boats, animals for recreation and associated equipment
09.2.2 Musical instruments and major durables for indoor recreation
Musical instruments of all sizes and types, billiard, snooker and ping-pong tables, pin-ball and gaming machines
12.3.1 Jewellery, clocks and watches Supply and repair of precious stones and metals, jewellery, clocks, watches Table SDG
COICOP
Semi-durable goods
Items included
03.1.1 Clothing materials Natural and man-made fabrics used in clothing
03.1.2 Garments Men’s, women’s and children’s clothing
03.1.3 Other articles of clothing/accessories
Ties, handkerchiefs, scarves, gloves, belts, hats, threads, wool, buttons, zips, ribbons, laces - includes gardening and working gloves but not rubber gloves (included in 5.6.1) and crash helmets for motor cycles and bicycles
03.1.4 Cleaning, repair and hire of clothing
Dry cleaning, laundering, dyeing and altering of clothing
03.2.1 Shoes and other footwear All footwear suitable for everyday and leisure wear, but not sport specific (included in 9.3.2) or orthopaedic footwear (included in 6.1.3)
05.2 Household textiles Fabrics, curtains, blinds, pillows, duvets, sheets, bed linen, blankets, table cloths, shopping bags, repair of textiles
05.3.2 Small electric household appliances
Coffee machines, juice extractors, mixers, fryers, toasters, hotplates, kettles, fans
05.4 Household utensils Glassware, tableware, fine china, porcelain etc saucepans
05.5.2 Small tools and minor accessories
Manual tools such as hammers, saws, screwdrivers, lawn mowers , garden tools, ladders light bulbs etc
07.2.1 Motor vehicle spares All spares and accessories to be fitted by owner, but not helmets (included in 3.1.3) or cleaning materials (included in 5.6.1), or charges for fitting or servicing (included in 7.2.3)
09.1.4 Recording media Records and pre-recorded tapes and CDs, pre-recorded videotapes and DVDs, floppy disks, blank tapes, videotapes, CD Rs, unexposed film
09.3.1 Games, toys and hobbies Games, toys, toy bicycles, electronic games, fireworks, stamps for collecting, coins, hobby tools and requisites
09.3.2 Sports, camping and open-air recreation equipment
Supply and repair of balls, shuttlecocks, gymnastic equipment, bats, rackets, sports specific footwear, weights, parachutes, recreational firearms, fishing, equipment, inflatable boats, tents, sleeping bags, camping stoves, and barbecues
09.5.1 Books Books, atlases, encyclopaedias, text books, musical scores
12.1.2 Electric appliances for personal care
Razors, hair trimmers, hair dryers, curling tongs, sun lamps, electric tooth brushes etc
12.3.2 Other personal effects Travel goods, suitcases, bags, purses, lighters, prams, cots, by car seats, baby carriers, harnesses, reins, sunglasses, sticks and canes, umbrellas, key rings, gravestones, coffins, urns for ashes
260

Table NDG
COICOP
Non-durable goods
Items included
01.1.1 Bread and cereals Rice, bread, pasta, pastry-cook products, other cereal products
01.1.2 Meat Beef, pig meat, lamb, poultry, frozen and processed meat
01.1.3 Fish Fresh, chilled, dried, smoked, salted, frozen processed or preserved fish and
seafood
01.1.4 Milk, cheese and eggs Milk, yoghurt, cheese, curd, milk desserts and drinks, eggs and sole egg products
01.1.5 Oils and fats Butter, margarine and other vegetable fats, olive oil, edible oils, other edible animal fats
01.1.6 Fruit Citrus fruits, bananas, apples, pears, stone fruits, berries, frozen, dried and preserved fruit
01.1.7 Vegetables All vegetables including lettuce, celery, spinach, parsley, cabbage, cucumber, tomato, beans, peppers, carrots, root and dried vegetables
01.1.8 Sugar and sweet products Sugar, jams, marmalades, chocolate, confectionery
01.1.9 Food products n.e.c Sauces, condiments, salt, spices, herbs, soups, yeast, dessert preparations
01.2.1 Coffee, tea and cocoa All coffees, teas and cocoas
01.2.2 Mineral water and soft drinks Mineral waters, spring waters, sodas, lemonades, fruit juices, vegetable juices
02.1.1 Spirits Spirits and liqueurs
02.1.2 Wine Grape and fruit wines, alco pops, cider and perry
02.1.3 Beers Beers, ales, lagers, porters, shandies. includes low alcohol beverages
02.2 Tobacco Cigarettes, cigars, pipe chewing and spitting tobacco, loose tobacco and papers.
04.3.1 Materials for maintenance and repair of the dwelling
Paints, wallpaper, plaster, tiles and small plumbing items
04.4.1 Water supply Hire of meters, standing charges all bills but not including hot water or steam supplied by local authority
04.5.1 Electricity All charges for electricity
04.5.2 Gas All charges for gas
04.5.3 Liquid fuels Domestic heating and lighting oil
04.5.4 Solid fuels Coal, coke etc
04.5.5 Heat energy Hot water and steam purchased from local authority
05.6.1 Non-durable household goods Soaps, liquids detergents, conditioners, cleaning agents, insecticides, kitchen paperware, serviettes, bin liners, brooms, cloths, scourers, matches, candles, pegs, safety pins, nails, screws, glues, string, rubber gloves
06.1.1 Pharmaceutical products Medicinal preparations, drugs, medicines, serums, vaccines, vitamins and other oral products
06.1.2 Other medical products Clinical thermometers, plasters, bandages, dressings, syringes, body supports, non-oral contraception
07.2.2 Vehicle fuels and lubricants Petrol, diesel, lpg, alcohol ,oil and lubricants, brake and other fluids, coolants etc
09.3.3 Gardens, plants and flowers Flowers, shrubs, bulbs, seeds, fertilisers, composts, turf
261

Table NDG (continued)
COICOP
Non-durable goods
Items included
09.3.4 Pets and related products Pets, pet foods, veterinary products, grooming goods, collars, leads, cages, kennels, tanks, litter trays
09.5.2 Newspapers and periodicals Newspapers, magazines, periodicals
09.5.3 Miscellaneous printed matter Catalogues, posters, greetings cards, invitations, postcards, calendars
09.5.4 Stationery and drawing
materials Writing pads, envelopes, account books, notebooks, diaries, pens, pencils, rubbers, correction fluids, ribbons, punches, scissors, staplers, drawing pins, paper, card
12.1.3 Other products for personal care
Non-electrical appliances, hand razors, hand clippers, blades, hair scissors, combs, brushes, hair clips, nail brushes, bathroom scales, soap, oils, shaving soap, creams and foam, toothpaste, deodorants, lipstick, nail varnish, make up, lacquers, aftershave, perfumes, and sun tan lotions
262

Table SER
COICOP
Services
Items included
03.1.4 Clothing and hire of clothing
Dry cleaning, laundering, dyeing and altering of clothing
03.2.2 Repair and hire of footwear Repairs, cleaning and hire of non sports related footwear
04.1.1 Actual rents paid by tenants for housing
Rent paid for use of land and dwelling only and all fixtures and contents supplied
04.1.2 Other actual rentals Rentals paid for secondary residences
04.2.1 Imputed rentals of owner occupiers
Imputed value of rent for the owner occupied sector
04.2.2 Other imputed rentals Imputed value of rent for rent free household
04.3.2 Services for maintenance and repair of the dwelling
Fees to plumbers, electricians, carpenters, glaziers, decorators etc
04.4.2 Refuse collection Charges for refuse collection and disposal
04.3.2 Sewerage collection Charges for the collection and disposal of sewerage
04.4.4 Other dwelling related services Caretaking, gardening, stairwell cleaning, maintenance charges, security services, but not window cleaning (included in 5.6.2)
05.1.3 Repair of furniture and floor coverings
Repair of furniture and floor coverings including works of art and antiques
05.3.3 Repair of household appliances
Charge for repair of major and small appliances
05.6.2 Domestic and household services
Butlers, cooks, maids, cleaners, drivers, gardeners, tutors, au pairs, baby-sitting, dry cleaning of linen, carpet cleaning, window cleaning, pest control
06.2.1 Outpatient medical services Consultations with doctors, specialists and orthodontists
06.2.2 Dental services Services of dentists, hygienists and other dental facilities
06.2.3 Paramedical services Private nurses, midwives, acupuncturists, aromatherapists, reflexologists
06.3 Hospital services All in-patient hospital services, including medical care, meals and accommodation charges
07.2.3 Vehicle maintenance and repair
Servicing and repair of motor vehicles, cost of fitting of spare parts and the parts themselves, wheel balancing, AA/RAC inspection, washing
07.2.4 Other vehicle services Garage hire, parking spaces, tolls, parking meters, driving lessons and tests, driving licences, MOT test
07.3.1 Railways National, suburban, and light rail, underground and tram travel
07.3.2 Road Transport by bus, coach, taxi, and hired car with driver
07.3.3 Air Passenger transport by air
07.3.4 Sea and inland waterways Passenger travel by ship, boat, ferry, hovercraft and hydrofoil
07.3.6 Other transport services Funicular, chair lift, cable car, removal services, porters, left-luggage, travel agents’ commission
08.1 Postal services Payments for delivery of post via postage stamps and private mail delivery
08.3 Telephone and telefax services
Installation and subscription costs of personal telephone equipment
263

Table SER (continued)
COICOP
Services
Items included
09.1.5 Repairs of audio visual equipment
Repair to audio-visual, photographic and cinematic equipment and information processing equipment
09.2.3 Maintenance of other major durables
Repair of caravans, camper vans, trailers, aeroplanes, helicopters, gliders air balloons, boats, musical instruments of all sizes and types
09.3.5 Veterinary and other services Vets’ charges for grooming, boarding, tattooing, training and surgery etc
09.4.1 Recreational and sporting services
Services provided by sport stadia, race courses, rinks, golf courses, pools, courts, bowling alleys, gyms, fairs, parks, dancing and skating
09.4.2 Cultural services Cinemas, theatres, concerts, circuses, TV rental, satellite subscription, video hire, hire of musicians, clowns, performers, photographers, film processing
09.4.3 Games of chance Lotteries, scratchcards, betting, gaming, gambling
09.6 Package holidays All-inclusive holidays which include travel fare, food and accommodation
10 Education Charges for all levels of education
11.1.1 Restaurants, cafés etc Catering services, meals, alcohol, snacks and drinks sold by restaurants, cafés,pubs etc
11.1.2 Canteens Catering services of works canteens, office restaurants, school and educational establishment canteens
11.1.2 Accommodation services Accommodation in hotels, motels, inns, “bed and breakfast” establishments, caravan sites, youth hostels, boarding schools, universities and other educational establishment accommodation
12.1.1 Hairdressing and personal grooming
Hairdressers, barbers, beauty shops and salons, men’s personal grooming centres, massage parlours, saunas, tanning centres
12.4 Social protection Assistance and support for elderly, disabled, occupational injured, war survivors, widows and widowers, destitute, homeless, low earners and unearned, refugees, alcohol and drug abused. Homes, centres, schools, cleaning services, meals, holidays, counselling services for the above groups, fostering and adoption services
12.5.1 Life insurance Administration charges of life insurance i.e. premiums less claims
12.5.2 Dwelling insurance Owner-occupier service and tenant charges for buildings and contents insurance
12.5.3 Health insurance Charges for private sickness and accident insurance
12.5.4 Transport insurance Service charges for car and other vehicle insurance and travel insurance
12.5.5 Other insurance Service charges for civil liability insurance for injury or damage to third parties and their property but not arising from vehicle operation (included in 12.5.4).
12.6.1 FISIM Financial Intermediation Services Indirectly Measured (FISIM)
12.6.2 Other financial services Charges for financial services of banks, post offices, building societies, money changers, brokers, advisors and the like
12.7 Other services Legal fees, employment agency fees, undertaking, funeral services, estate agents’ charges, photocopies, birth, marriage and death certificates, newspaper advertisements, astrologers, private detectives, bodyguards, dating agencies, cloakroom charges
264
Index Accommodation services Actual rentals by tenants Air transport Alcohol and tobacco Audio visual equipment Audio visual equipment repair Beer Bicycles Books Bread Cafes Camping equipment Canteens Carpets Cereals Cider Clocks and watches Clothing and footwear Clothing accessories Clothing hire, cleaning and repair Clothing materials Clothing Cocoa Coffee Communication Cultural services Dental services Domestic and hh services Durable goods Dwellings insurance Education Electric appliances for personal care Electricity Equipment for reception/recording/sound Equipment for sport, camping etc. Fax equipment Financial services Fish FISIM Floor coverings Flowers Food and non-alcoholic beverages Food products n.e.c. Footwear – repair and hire Foreign tourist expenditure Fruit Fuel and lubricants Furnishings Furniture and furnishings Furniture repair Gambling - see “Games of Chance” Games of chance Games, toys and hobbies Gardens, plants and flowers Garments Gas Glassware, tableware etc.
11, SER 04, SER 07, SER 0, 02, NDG 09, DG 09, SER 02, NDG 07, DG 09, SDG 01, DG 11, SER 09, SDG 11, SER 05, DG 01, NDG 02, NDG 12, DG 0, 03 03, SDG 03, SER 03, SDG 0, 03 01, NDG 01, NDG 0, 08 09, SER 06, SER 05, SER 0GS, DG 12, SER 0, 10, SER 12, SDG 04, NDG 09, DG 09, SDG 08, DG 12, SER 01,NDG 12, SER 05, DG 09, NDG 0, 01, DG, DET 01, NDG 03, SER 0A,TOUR 01, NDG 07, NDG 05, DG 05, DG 05, SER 09, SER 09, SER 09, SDG 09, NDG 03, SDG 04, NDG 05, SDG
Hairdressing salons Health Health insurance Heat energy Hobbies House maintenance Hospital services Hotels Household appliances Household equipment Household goods and services Household utensils Household textiles Housing Imputed rentals for housing Indoor recreation durables Information processing Inland waterways transport Insurance Jewellery clocks and watches Life insurance Liquid fuels Lubricants for vehicles Magazines Maintenance of other major durables Maintenance of the dwelling Maintenance of vehicles Major durables for indoors Major durables for outdoors Major household appliances Major tools and equipment Materials for house repair Meat Medical goods Medical services Milk, cheese and eggs Mineral water Miscellaneous goods and services Miscellaneous printed matter Motor cars Motor cycles Motor vehicle purchase Motor vehicle spares Musical instruments Net tourism Newspapers Non-alcoholic beverages Non durable goods ND hh goods for maintenance Non-durable goods
12, SER 0, 06, 0A, DET 12, SER 04, NDG 09, SDG 05, 0A 06, SER 11, SER 05, DG, SDG, 0A 05, DG, SDG, 0A 0, 05, 0A 0A, 05, DG 0A,05,SDG 0, 04, 0A 0A, 04, SER DG, 09 09, DG 07, SER 12, SER, 0A 12, DG 12, SER 04, NDG 07, NDG 09, NDG 09, SER 04, NDG, 0A 07, SER 09, DG 09, DG 05, DG 05, DG 04, NDG 01, NDG 06, 0A 06, SER 01, NDG 01, NDG 0, 0A,12, DET 09, NDG 07, DG 07, DG 07, DG 07, SDG 09, DG 0, 0GS 09, NDG 01, NDG GS,NDG 05, NDG 0GS, NDG
265

Oil for vehicles Oils and fats Open air recreation equipment Operation of vehicles Other actual rentals Other appliances for personal care Other articles of clothing Other footwear Other imputed rentals Other insurance Other medical products Other personal effects Other products for personal care Other recreational goods Other services relating to the dwelling Other services Other transport services Other vehicle services Other water etc service Outdoor recreation durables Outpatient services Package holidays Paramedical services Periodicals Personal care Personal effects Personal grooming establishments Pets and products Pharmaceutical products Photographic and optical equip Plants Postal services Railways transport Recording media Recreation and culture Recreational and sporting services Refuse collection Rent Repair of audio visual equipment Repair and hire of footwear Repair of furniture Repair of household appliances Repair of vehicles Repair to audio visual equip Restaurants and hotels Road transport Sea transport Semi-durable goods Services for house repair Services Sewerage collection Shoe hire and repair Shoe repairs Shoes Small electric household appliances Small tools and misc accessories Smuggling - alcohol and tobacco Social protection Soft drinks Solid fuels Spirits Sport, camping equipment Sporting services Stationery and drawing materials Sugar and sweet products
07,NDG 01, NDG 09, DG 07, 0A 04, SER 12, NDG 03, SDG 03, SDG 04, SER 12, SER 06, NDG 12, SDG 12, NDG 09, 0A 04, SER 12, SER 07, SER 07, SER 04, SER 09, DG 06, SER, 0A 09, SER 06, SER 09, SDG, DG 12, 0A 12, SDG, 0A 12, SER 09, NDG 06, NDG 09, DG 09, NDG 08, SER 07, SER 09, SDG 0, 09, 0A, DET 09, SER 04, SER 04, 0A 09, SER 03, SER 05, SER 05, SER 07, SER 09, SER 0,11,SER, DET 07, SER 07, SER 0GS, SDG 04, SER 0GS, SER 04, SER 03, SER 03, SER 03, SDG 05, SDG 05, SDG AT (Q1 2006) 12, SER 01, NDG 04, NDG 02, NDG 09, SDG 09, SER 09, NDG 01, NDG
Tableware Tea Telefax equipment Telephone equipment Telephone and fax services Textiles Therapeutic appliances and equip. Tobacco Tools and equipment Total purchase of vehicles Toys Transport Transport insurance UK domestic UK national total UK tourist expenditure abroad Vegetables Vehicle fuel and lubricants Vehicle maintenance and repair Vehicle purchase Veterinary services Water supply Wine
05, SDG, 0A 01, NDG 08, DG 08, DG 08, SER 05, SDG 06, DG 02, NDG 05, 0A 07, 0A, DG 09, SDG 0, 07, SER, DET 12, SER 0, 0GS, 0A 0, 0GS, 0A 0A, TOUR 01, NDG 07, NDG 07, SER 07, DG 09, SER 04, NDG 02, NDG
266