Economic, Human, Social, and Ecological - Farmers Market ...
36
Farmers Market Metrics: Economic, Human, Social, and Ecological A Review of the Literature Project Team Youn Hee Jeong, M.S., Graduate Student of Urban and Regional Planning, University of Wisconsin- Madison (UW) Anne Roubal, Ph.D., MPH, Research Scientist, Population Health Sciences – University of Arizona Health Sciences Center Alfonso Morales, Ph.D., Associate Professor of Urban and Regional Planning, University of Madison- Wisconsin (UW) Suggested Citation: Jeong, Youn Hee, Anne Roubal, and Alfonso Morales. 2015. Farmers Market Impact Indicators: Economic, Human, Social, and Ecological. University of Wisconsin – Madison, URPL Working Paper, 2015-001 Acknowledgements The University of Wisconsin Project Team appreciates the thoughtful contributions of its members in the development of this literature review. Reviewers included Lauren Suerth, MS (University of Wisconsin – URPL), Jen Cheek, and Sara Padilla, Darlene Wolnik (Farmers Market Coalition), Stacy Miller (Farmers Market Metrics Project Consultant), and Rebecca Jollay. Funding from the USDA’s Agriculture and Food Research Initiative (grants 2011-68004-30044 and 2014-68006- 21857) supported this study.
-
Upload
khangminh22 -
Category
Documents
-
view
2 -
download
0
Transcript of Economic, Human, Social, and Ecological - Farmers Market ...
Farmers Market Metrics:
Economic, Human, Social, and Ecological
A Review of the Literature
Project Team
Youn Hee Jeong, M.S., Graduate Student of Urban and Regional Planning, University of Wisconsin-
Madison (UW)
Anne Roubal, Ph.D., MPH, Research Scientist, Population Health Sciences – University of Arizona
Health Sciences Center
Alfonso Morales, Ph.D., Associate Professor of Urban and Regional Planning, University of Madison-
Wisconsin (UW)
Suggested Citation: Jeong, Youn Hee, Anne Roubal, and Alfonso Morales. 2015. Farmers Market
Impact Indicators: Economic, Human, Social, and Ecological. University of Wisconsin – Madison,
URPL Working Paper, 2015-001
Acknowledgements
The University of Wisconsin Project Team appreciates the thoughtful contributions of its members in the
development of this literature review. Reviewers included Lauren Suerth, MS (University of Wisconsin – URPL),
Jen Cheek, and Sara Padilla, Darlene Wolnik (Farmers Market Coalition), Stacy Miller (Farmers Market Metrics
Project Consultant), and Rebecca Jollay.
Funding from the USDA’s Agriculture and Food Research Initiative (grants 2011-68004-30044 and 2014-68006-
21857) supported this study.
Table of Contents
I. Introduction .............................................................................................................................................. 1
Methods: How We Processed ........................................................................................................................... 2
Limitations ........................................................................................................................................................ 2
II. Research into Existing Tools and Methodologies ...................................................................................... 3
III. Relevant Tools for Research Questions in Farmers Markets Research ...................................................... 5
1. Economic Impacts and Data Collection Tools ............................................................................................... 5
2. Human Impacts and Data Collection Tools ................................................................................................. 13
3. Social Impacts and Data Collection Tools ................................................................................................... 16
4. Ecological Impacts and Data Collection Tools............................................................................................. 18
5. Integrated approaches to assessing farmers market performance ........................................................... 19
IV. Conclusions: Key Learnings and Implications for Practice ...................................................................... 22
References ................................................................................................................................................. 24
Appendix A. Survey Questions to Measure Impacts of Farmers Markets .................................................... 29
Appendix B. Glossary of Terms ................................................................................................................... 33
1
I. Introduction
Markets have been the beating hearts of communities for centuries. Morales (2011) outlined this
history and summarized the literature on the four types of benefits marketplaces produce: public health,
economic well-being, social/political life, and ecological concerns. While a variety of complementary
local food and farm marketing enterprises have emerged and grown in recent years (Martinez, 2010),
farmers markets remain the most prominent and public forums supporting direct agricultural commerce.
Markets are initiated by a variety of grassroots community stakeholders (Friedlander, 1976), and as
such, their goals are aligned with the unique issues or assets found in their respective places.
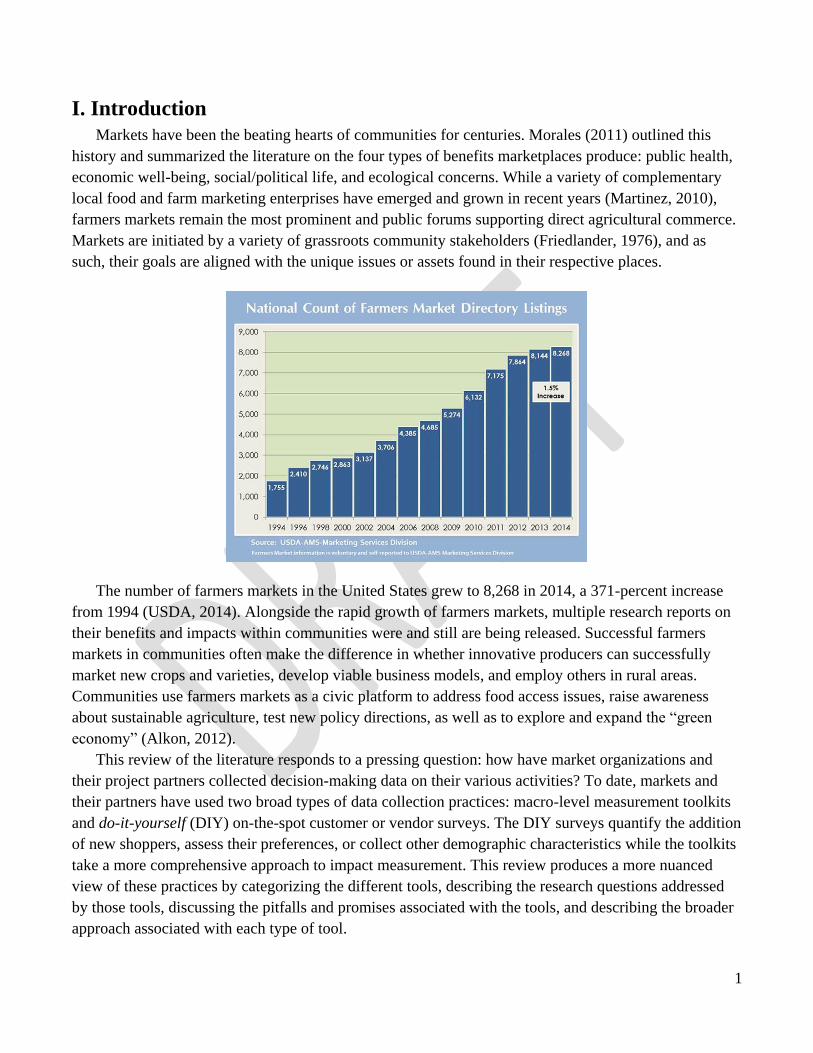
The number of farmers markets in the United States grew to 8,268 in 2014, a 371-percent increase
from 1994 (USDA, 2014). Alongside the rapid growth of farmers markets, multiple research reports on
their benefits and impacts within communities were and still are being released. Successful farmers
markets in communities often make the difference in whether innovative producers can successfully
market new crops and varieties, develop viable business models, and employ others in rural areas.
Communities use farmers markets as a civic platform to address food access issues, raise awareness
about sustainable agriculture, test new policy directions, as well as to explore and expand the “green
economy” (Alkon, 2012).
This review of the literature responds to a pressing question: how have market organizations and
their project partners collected decision-making data on their various activities? To date, markets and
their partners have used two broad types of data collection practices: macro-level measurement toolkits
and do-it-yourself (DIY) on-the-spot customer or vendor surveys. The DIY surveys quantify the addition
of new shoppers, assess their preferences, or collect other demographic characteristics while the toolkits
take a more comprehensive approach to impact measurement. This review produces a more nuanced
view of these practices by categorizing the different tools, describing the research questions addressed
by those tools, discussing the pitfalls and promises associated with the tools, and describing the broader
approach associated with each type of tool.

2
The impact of farmers markets in the United States is a topic that has been explored by multiple and
diverse researchers. For this paper, we reviewed a selection of the existing research to understand the
current status of data collection and measurement tools available and in use at markets to assess the
impact at the community level. The purpose of the current paper is to examine indicators and methods
utilized at farmers markets for data collection, as well as to discuss impacts that have been identified
through existing research, and to identify what is missing in order for reliable data collection to take
place in the market environment.
Specifically, we respond to the following questions:
1) What instruments or tools are employed for data collection at farmers markets?
2) What are the research questions markets are seeking to answer? What kinds of research are they
accomplishing?
3) What indicators and metrics are being examined?
4) How valid and applicable is the methodology?
Additionally, we address the issue of challenges and barriers to data collection at markets in this review.
Methods: How We Processed
The process used to assemble this literature review included:
Review of scholarly articles and other published documents
Review of national websites and a general internet search
Outreach to experts, academics, and practitioners in the field to identify current methodology and
projects underway
Categorization of the literature according to specific themes that emerged throughout the process
Collaborative suggestions from internal and external audiences
The list of selected literature on farmers markets and data collection was compiled as part of a new
initiative led by the Farmers Market Coalition and the University of Wisconsin – Madison, entitled
Indicators for Impact: Farmers Markets as Leaders in Collaborative Food System Data Collection and
Analysis. It is intended to inform the process by which a meaningful list of indicators and metrics is
developed for the design and implementation of a data collection process to take place over three years.
Additionally, this paper will enhance our understanding of the indicators used to collect data common to
all markets.
Limitations
This examination of the literature attempted to map the methods commonly employed, as well as
those less commonly used. However, it is possible that certain articles, reports, surveys, or other
resources that may contain relevant information have been overlooked in this review. Additionally,
some of the articles highlighted fall into multiple categories or themes.
3
II. Research into Existing Tools and Methodologies
The results of the literature search unique to farmers markets and data collection or evaluation
revealed 67 peer-reviewed articles published or otherwise reported between 1999 and 2015. The
literature search not directly related to farmers markets yielded 31 articles, books, or relevant materials.
The articles describing data collection efforts and methodologies used at venues other than markets and
strategies for working with non-market data collection initiatives were also included.
We found four types of research tools, including surveys (farmer/producer/vendor/shopper),
interviews (qualitative), multivariate analysis (OLS/Logistic/multiple regression, generalized estimating
equations modeling), and model analysis (IMPLAN/I-O MODEL). A total of 98 peer-reviewed articles
and agency or organization reports were selected for this review of the literature. In order to identify and
analyze relevant scholarly and non-scholarly or popular literature, we employed the following process:
Participating in regular conference calls of the Indictors for Impact project team (UW and FMC),
we selected relevant reports that frame current conditions, efforts, and gaps in research and/or
measurement of the impacts of farmers markets on communities.
We conducted a search on leading practitioner websites and mined existing reports found to be
relevant in terms of measuring benefits/impacts of farmers markets (e.g. Market Umbrella,
Project for Public Spaces, Farmers Market Coalition, Vancity Community Foundation).
The search engines Web of Science and Google Scholar were utilized using terms such as
‘farmers markets, ‘direct farm marketing’, ‘public markets’, ‘local food systems’, ‘impacts’,
‘measurement’, ‘assessment’, ‘indicator’, and ‘outcomes.’
Primary criteria for selecting literature included whether the research explored or measured
impacts or benefits of farmers markets in terms of social, economic, and ecological capital, or
contained survey instruments designed to collect quantitative or descriptive data from farmers
market participants.
From the selected literature, a list of frequently mentioned impacts and tools were categorized
according to work the Farmers Market Coalition (FMC) did in 2011 with community-level coordinators
of CDC’s Communities Putting Prevention to Work (CPPW). Together they crafted a draft set of
indicators for measuring farmers market activities and outcomes. They engaged a community-level
process that sorted the indicators into four types of capital:
Economic (ex. producer sales, related sales to restaurants, number of new food businesses,
creation of jobs on farm and in host community, sales at neighboring businesses, financial or in-
kind investments by sponsoring organizations.)
Human (ex. shoppers learning new recipes, trying new vegetables, producers learning new
languages to communicate better with shoppers, or community partners learning about market
shopper behavior and preferences.)
Social (ex. instances of civic engagement, volunteer hours, nonprofits conducting education at
market, producers donating food to social service agencies.)
4
Ecological (ex. acres in production or preserved, distance from harvest to final consumers, crop
diversity, water conservation, nutrient management, humane livestock practices, and certified
and non-certified sustainability practices.)
While there is a common understanding that farmers markets serve many different audiences in a
variety of ways, the leaders of the FMC work in 2011 felt that the sector has relied too long on
assumptions or case studies, and identified a need to apply greater discipline to the collection of accurate
information and analysis of these diverse impacts. Another general review of the literature on
marketplaces by Morales (2011) also identified four, similarly categorized types of market benefits.
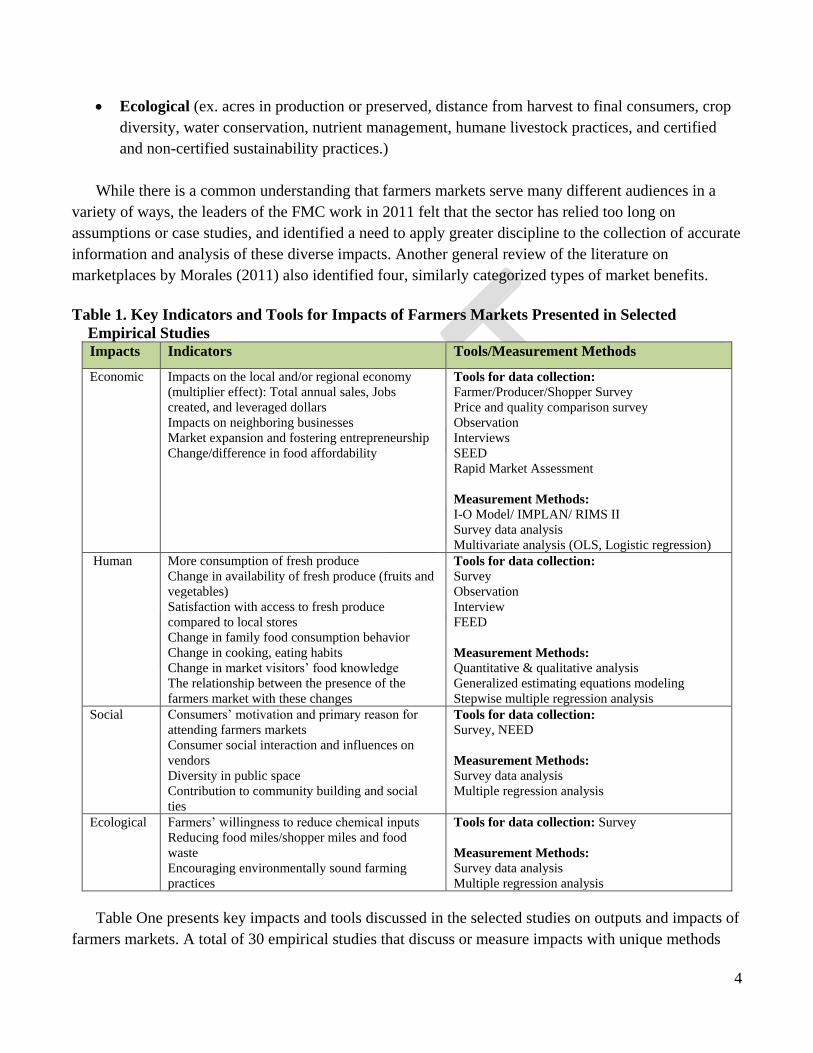
Table 1. Key Indicators and Tools for Impacts of Farmers Markets Presented in Selected
Empirical Studies Impacts Indicators Tools/Measurement Methods
Economic Impacts on the local and/or regional economy
(multiplier effect): Total annual sales, Jobs
created, and leveraged dollars
Impacts on neighboring businesses
Market expansion and fostering entrepreneurship
Change/difference in food affordability
Tools for data collection:
Farmer/Producer/Shopper Survey
Price and quality comparison survey
Observation
Interviews
SEED
Rapid Market Assessment
Measurement Methods:
I-O Model/ IMPLAN/ RIMS II
Survey data analysis
Multivariate analysis (OLS, Logistic regression)
Human More consumption of fresh produce
Change in availability of fresh produce (fruits and
vegetables)
Satisfaction with access to fresh produce
compared to local stores
Change in family food consumption behavior
Change in cooking, eating habits
Change in market visitors’ food knowledge
The relationship between the presence of the
farmers market with these changes
Tools for data collection:
Survey
Observation
Interview
FEED
Measurement Methods:
Quantitative & qualitative analysis
Generalized estimating equations modeling
Stepwise multiple regression analysis
Social Consumers’ motivation and primary reason for
attending farmers markets
Consumer social interaction and influences on
vendors Diversity in public space
Contribution to community building and social
ties
Tools for data collection:
Survey, NEED
Measurement Methods:
Survey data analysis
Multiple regression analysis
Ecological Farmers’ willingness to reduce chemical inputs Reducing food miles/shopper miles and food
waste Encouraging environmentally sound farming
practices
Tools for data collection: Survey
Measurement Methods:
Survey data analysis
Multiple regression analysis
Table One presents key impacts and tools discussed in the selected studies on outputs and impacts of
farmers markets. A total of 30 empirical studies that discuss or measure impacts with unique methods

5
and data are included. We also reviewed scholarly literature review papers but did not include them in
the table, as this table shows only literature with its own data, methodology, and applicable metrics.
III. Relevant Tools for Research Questions in Farmers Markets Research
In this section, we examine four types of impacts1 and the tools used for measurement, including
how and what they measured, and also identify which indicators or metrics are used to determine
whether those impacts were realized.
Economic Impacts and Data Collection Tools
The expansion of farmers markets suggests that farmers have benefited from increased
opportunities to sell their products directly to consumers (Brown et al., 2007; Henneberry, 2009).
Furthermore, it implies that consumers are purchasing an increasing portion of their food from local
sources, enjoying better prices and easier access (Kunkel, Luccia, & Moore, 2003; Larsen &
Gilliland, 2009; Suarez-Balcazar et al., 2006). Farmers markets have been found to have positive
impacts on local economies in terms of job creation, increased revenue and income, and business
incubation. Citing a study by Tulane’s A.B. Freeman School of Business, a green paper published by
Market Umbrella (1999) suggests that a farmers market is an efficient tool for economic
development of participating agricultural enterprises, as well as the downtown area and the rural
communities from which vendors travel.
In order to estimate the economic contribution of farmers markets, several studies utilized the
regional modeling system such as Impact Analysis for Planning input-output (I-O) model and
Regional Input Modeling System (RIMS). A study by the Union of Concerned Scientists explained
the logic of measuring the economic multiplier effects of the farmers market as follows.
“The value of goods and services sold by a business, or the direct effect of a market, is just one
component of a given market’s economic impacts. Each business represented must also purchase
inputs to produce and market its goods, and these collective expenditures are the indirect effects of a
market. Direct and indirect effects lead to increases in labor and capital income in households. This
results in additional expenditures by households, which are the induced effects of a particular market.
The economic multiplier of a market is a measure of the increase in economic activity that occurs as
a consequence of direct market sales (p.16)2.”
To undertake such an analysis, farmers market researchers administered surveys of farmers
markets within a specified region (like a state), and then they relied on model parameters to
1 For the definition of metric, indicator, and impact, see Appendix B. Glossary of terms. 2 For more information, read market-forces-report.pdf text version. (July 22, 2015). Retrieved from
http://www.readbag.com/ucsusa-assets-documents-food-and-agriculture-market-force
6
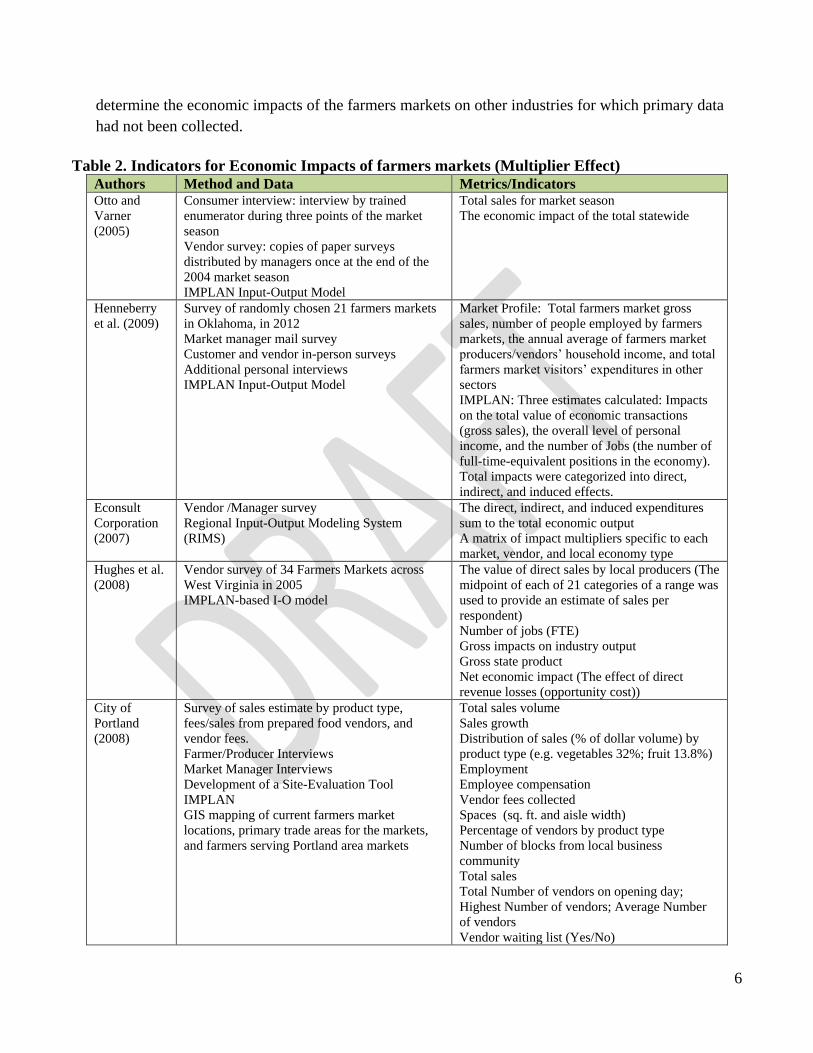
determine the economic impacts of the farmers markets on other industries for which primary data
had not been collected.
Table 2. Indicators for Economic Impacts of farmers markets (Multiplier Effect) Authors Method and Data Metrics/Indicators Otto and
Varner
(2005)
Consumer interview: interview by trained
enumerator during three points of the market
season
Vendor survey: copies of paper surveys
distributed by managers once at the end of the
2004 market season IMPLAN Input-Output Model
Total sales for market season The economic impact of the total statewide
Henneberry
et al. (2009) Survey of randomly chosen 21 farmers markets
in Oklahoma, in 2012
Market manager mail survey Customer and vendor in-person surveys
Additional personal interviews IMPLAN Input-Output Model
Market Profile: Total farmers market gross
sales, number of people employed by farmers
markets, the annual average of farmers market
producers/vendors’ household income, and total
farmers market visitors’ expenditures in other
sectors IMPLAN: Three estimates calculated: Impacts
on the total value of economic transactions
(gross sales), the overall level of personal
income, and the number of Jobs (the number of
full-time-equivalent positions in the economy).
Total impacts were categorized into direct,
indirect, and induced effects. Econsult
Corporation
(2007)
Vendor /Manager survey
Regional Input-Output Modeling System
(RIMS)
The direct, indirect, and induced expenditures
sum to the total economic output
A matrix of impact multipliers specific to each
market, vendor, and local economy type
Hughes et al.
(2008) Vendor survey of 34 Farmers Markets across
West Virginia in 2005 IMPLAN-based I-O model
The value of direct sales by local producers (The
midpoint of each of 21 categories of a range was
used to provide an estimate of sales per
respondent) Number of jobs (FTE) Gross impacts on industry output
Gross state product Net economic impact (The effect of direct
revenue losses (opportunity cost)) City of
Portland
(2008)
Survey of sales estimate by product type,
fees/sales from prepared food vendors, and
vendor fees.
Farmer/Producer Interviews
Market Manager Interviews
Development of a Site-Evaluation Tool
IMPLAN
GIS mapping of current farmers market
locations, primary trade areas for the markets,
and farmers serving Portland area markets
Total sales volume
Sales growth
Distribution of sales (% of dollar volume) by
product type (e.g. vegetables 32%; fruit 13.8%)
Employment
Employee compensation
Vendor fees collected
Spaces (sq. ft. and aisle width)
Percentage of vendors by product type
Number of blocks from local business
community
Total sales
Total Number of vendors on opening day;
Highest Number of vendors; Average Number
of vendors
Vendor waiting list (Yes/No)
7
Number of adult customers on average day
(high and low estimate requested)
Several qualitative metrics included also
Market
Umbrella (2012)
SEED methodology: Survey, The Regional Input-Output Modeling
System II multiplier
The market’s total combined economic impact:
Total immediate economic benefit to vendors,
nearby businesses, and the local community and
BEA RIMS II multiplier or comparable
multiplier. Market impact on vendors with multiplier
(Average gross receipts, Average gross receipts
per market sq. ft., Projected gross annual
receipts) Local area impact with multiplier (Average
gross receipts, Projected gross annual receipts at
businesses near the market, Projected annual
state & municipal sales tax revenue) Project tax revenue (the sales taxes nearby
businesses pay to local and state authorities
from the purchases made by market shoppers)
Sadler, Clark,
and Gilliland
(2013)
Customer surveys (N=895)
SPSS analysis
Spatial analysis in GIS
A modified economic impact multiplier
(Econsult Corporation (2007) methodology)
The socioeconomic distress index
Consumer characteristics (gender, age,
Frequency of visits, distance from market, mode
of transportation)
Products purchased
Reasons for coming
How heard about market
Time spent at market
Money spent at market
Spatial distribution of customers by level of
urbanization and presence of above-average
neighborhood socioeconomic distress
Kernel density of customers weighted by dollars
spent
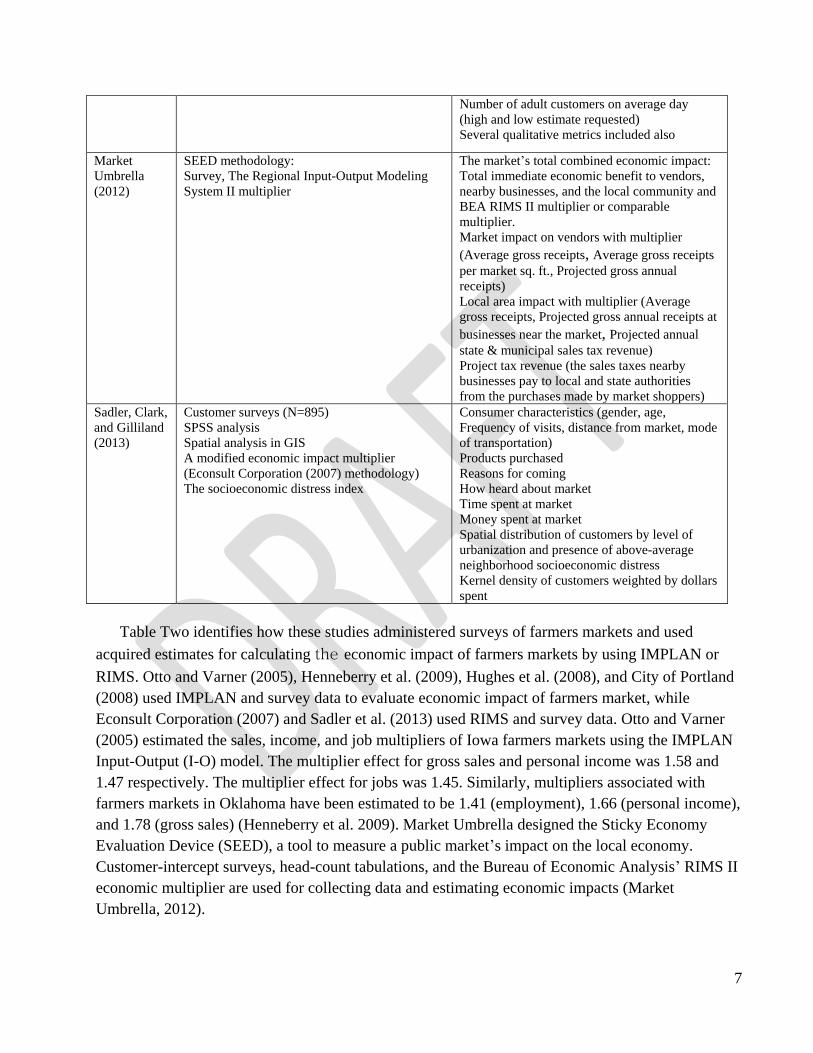
Table Two identifies how these studies administered surveys of farmers markets and used
acquired estimates for calculating the economic impact of farmers markets by using IMPLAN or
RIMS. Otto and Varner (2005), Henneberry et al. (2009), Hughes et al. (2008), and City of Portland
(2008) used IMPLAN and survey data to evaluate economic impact of farmers market, while
Econsult Corporation (2007) and Sadler et al. (2013) used RIMS and survey data. Otto and Varner
(2005) estimated the sales, income, and job multipliers of Iowa farmers markets using the IMPLAN
Input-Output (I-O) model. The multiplier effect for gross sales and personal income was 1.58 and
1.47 respectively. The multiplier effect for jobs was 1.45. Similarly, multipliers associated with
farmers markets in Oklahoma have been estimated to be 1.41 (employment), 1.66 (personal income),
and 1.78 (gross sales) (Henneberry et al. 2009). Market Umbrella designed the Sticky Economy
Evaluation Device (SEED), a tool to measure a public market’s impact on the local economy.
Customer-intercept surveys, head-count tabulations, and the Bureau of Economic Analysis’ RIMS II
economic multiplier are used for collecting data and estimating economic impacts (Market
Umbrella, 2012).
8
On the other hand, Hughes et al. (2008) pointed out that these approaches did not consider the
opportunity cost of money spent at farmers markets. They examined the net impact of farmers
markets on the West Virginia economy, using an IMPLAN-based input-output model. Gross impacts
were 119 jobs and $2.389 million in output, including $1.48 million in gross state product. When the
effect of direct revenue losses, referred to as the opportunity cost, was included, the impact was
reduced to 82 jobs, $1.075 million in output, and $0.653 million in gross state product (2008, 253).
This study identified that displaced economic activity by farmers markets within the local
community reduced the positive economic impacts of localization, although estimated net benefits
were still positive.
Portland’s analysis of its farmers markets also took into account the substitution effect.
“Assuming that all goods sold at a traditional grocery store are imported to the region (to
simplify the analysis), IMPLAN estimates that nearly three-quarters of the direct impact leaks
outside the region with the estimated $11.2 million in spending at farmers’ markets equivalent to
approximately $3.4 million in economic impact in a traditional grocery market, because of the
household margins associated with retail sectors.”
Martinez et al. (2010) pointed out that it is not clear how estimates of net economic benefits
would be affected if the costs of public investments were accounted for in the empirical studies of
economic impact of local food markets. For instance, the Farmers Market Promotion Program has
provided public financing to support farmers markets for several years since 2006, and local
governments often either directly operate local markets or provide resources to support their
operation. These costs have not been explained in existing research on the economic impacts of
farmers markets (2010, 45).
The recent USDA (2015) report contends that it is hard to draw conclusions about the local
economic impact of local food systems because the existing literature has narrow geographic and
market scope, making comparing studies complicated. This study notes that data necessary to
conduct the economic impact analysis are costly to obtain, and there is no standard way of
accounting for the opportunity cost. The authors conclude that many questions surrounding the
economic impact of local foods remain unanswered and could be addressed by future research.
The existence of farmers markets may also spur consumer spending at other businesses in a
community. People who come to a market also spend money with nearby merchants. This is one of
the direct economic benefits of farmers markets acclaimed by community leaders and market
organizers. Lev et al. (2003) and Bubinas (2009, 2011) found that many farmers market shoppers
who traveled to downtown areas specifically to patronize the market also spent additional money at
neighboring businesses. Bubinas calculated the direct economic benefit of a farmers market to
downtown and neighboring business storeowners and vendors in two farmers markets in Kenosha
and Waukesha, WI. Lev et al. (2003) estimated spillover sales generated by farmers market shoppers
who also make purchases at neighboring businesses in Oregon farmers market during 1998-2003.
9
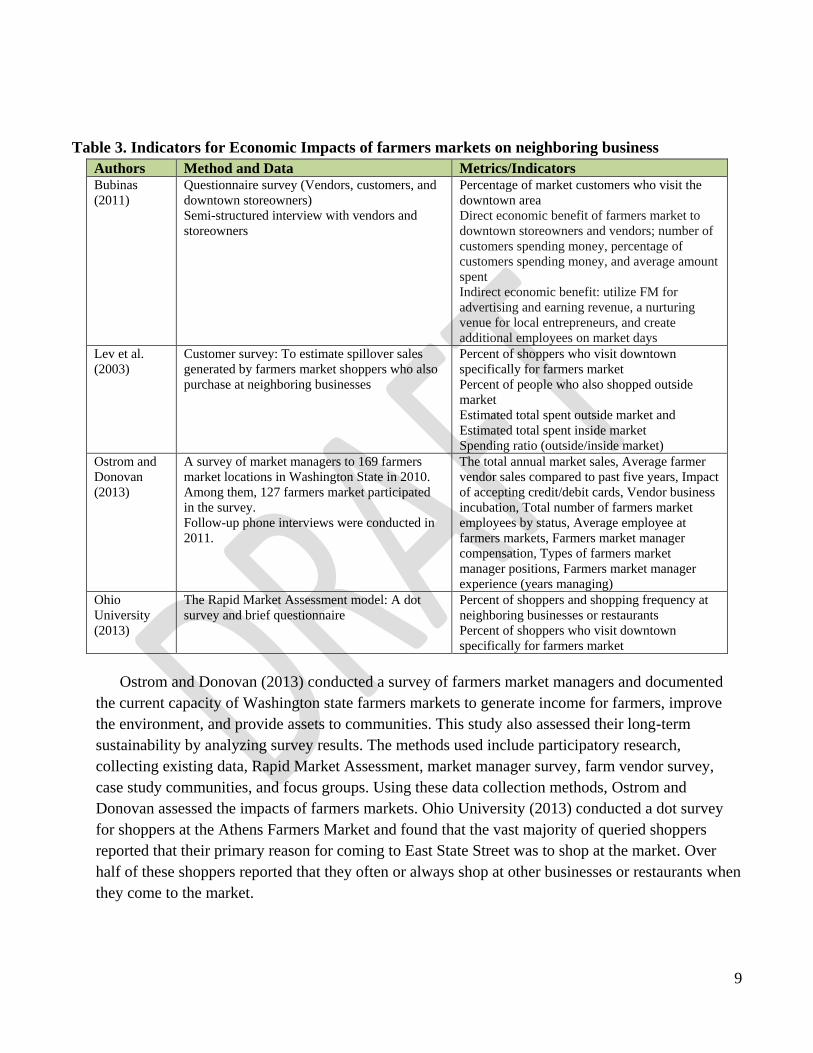
Table 3. Indicators for Economic Impacts of farmers markets on neighboring business
Authors Method and Data Metrics/Indicators Bubinas
(2011)
Questionnaire survey (Vendors, customers, and
downtown storeowners)
Semi-structured interview with vendors and
storeowners
Percentage of market customers who visit the
downtown area
Direct economic benefit of farmers market to
downtown storeowners and vendors; number of
customers spending money, percentage of
customers spending money, and average amount
spent
Indirect economic benefit: utilize FM for
advertising and earning revenue, a nurturing
venue for local entrepreneurs, and create
additional employees on market days
Lev et al.
(2003)
Customer survey: To estimate spillover sales
generated by farmers market shoppers who also
purchase at neighboring businesses
Percent of shoppers who visit downtown
specifically for farmers market Percent of people who also shopped outside
market Estimated total spent outside market and
Estimated total spent inside market Spending ratio (outside/inside market)
Ostrom and
Donovan
(2013)
A survey of market managers to 169 farmers
market locations in Washington State in 2010.
Among them, 127 farmers market participated
in the survey.
Follow-up phone interviews were conducted in
2011.
The total annual market sales, Average farmer
vendor sales compared to past five years, Impact
of accepting credit/debit cards, Vendor business
incubation, Total number of farmers market
employees by status, Average employee at
farmers markets, Farmers market manager
compensation, Types of farmers market
manager positions, Farmers market manager
experience (years managing) Ohio
University
(2013)
The Rapid Market Assessment model: A dot
survey and brief questionnaire
Percent of shoppers and shopping frequency at
neighboring businesses or restaurants
Percent of shoppers who visit downtown
specifically for farmers market
Ostrom and Donovan (2013) conducted a survey of farmers market managers and documented
the current capacity of Washington state farmers markets to generate income for farmers, improve
the environment, and provide assets to communities. This study also assessed their long-term
sustainability by analyzing survey results. The methods used include participatory research,
collecting existing data, Rapid Market Assessment, market manager survey, farm vendor survey,
case study communities, and focus groups. Using these data collection methods, Ostrom and
Donovan assessed the impacts of farmers markets. Ohio University (2013) conducted a dot survey
for shoppers at the Athens Farmers Market and found that the vast majority of queried shoppers
reported that their primary reason for coming to East State Street was to shop at the market. Over
half of these shoppers reported that they often or always shop at other businesses or restaurants when
they come to the market.

10
Market Expansion for Farmers and Fostering Entrepreneurial Activity
Farmers markets may facilitate entrepreneurial activity within the local economy by improving
business skills and opportunities. Feenstra et al. (2003) examined the role of farmers markets in
creating and sustaining new businesses. In this study, the capacities of farmers market vendors,
which are associated with entrepreneurial outcomes, were examined. In particular, this study
explores how vendors’ business activities and capacities are associated with different sizes of
enterprises by conducting a mail survey of up to 400 vendors from 20 markets in each state in 1999.
They concluded that farmers markets helped medium- and large-scale enterprises to expand or
complemented existing, well-established businesses. For small vendors, farmers markets appeared to
operate as a relatively low-risk incubator for new businesses and a nurturing primary venue for part-
time enterprises.
Using the same data from a 1999 mail survey of farmers market vendors, Hinrichs et al. (2004)
examined the role of social learning in vendor innovation. Social learning through engagement with
customers contributed to more innovative marketing by vendors while social learning through
engagement with customers and fellow vendors increased the likelihood of vendors diversifying to
additional markets beyond the farmers market. Brown and Miller (2008) suggested that farmers
markets allow farmers to expand their business and increase market sales and household income by
reviewing research conducted on farmers markets since 2000.
Table 4. Indicators for Market Expansion and Fostering Entrepreneurial Activity through
Farmers Markets
Authors Method and Data Metrics/Indicators Feenstra et al.
(2003)
Survey analysis
Mail survey of farmers market vendors of New
York, Iowa, and California in 1999
Vendor’s entrepreneurial activities and skills
gained through the farmers market experience
Activity: added new product category, expanded
existing product lines, begun additional
processing, developed mailing list of farmers
market customers, and made new business
contacts
Skills: Customer relations improved, business
self-confidence improved, merchandizing skills
improved, pricing skills improved, cooperating
with business people
Hinrichs et
al. (2004) Multivariate analysis: Ordinary least squares
regression, Logistic regression The same survey conducted by Feenstra et al.
Dependent variables: Intensity of innovative
marketing practices3, Expansion beyond this
farmers market4
3 The questions asked whether, since selling at the farmers market, vendors had (1) ‘‘added new categories of products (like
a fruit vendor who added baked goods, or a vegetable vendor who added handcrafted birdfeeders);’’ (2) ‘‘expanded existing
product lines (like a vegetable vendor who added a new variety of pepper or a potter who added a new kind of vase);’’ (3)
‘‘begun additional processing to add value to one or more products;’’ (4) ‘‘developed a mailing list of your regular farmers
market customers;’’ (5) ‘‘provided opportunities for farmers market customers to visit your farm;’’ and (6) ‘‘made new
business contacts through the market, e.g., with restaurants, stores.’’ A summated measure of scores for the six individual
practices provided one dependent variable, intensity of innovative marketing practices (p.42). 4 This study asked a fixed-choice question: ‘‘How do you think selling at the X market (i.e., the market through which the
vendor was surveyed) has affected sales of your products in other outlets?’’ and created a dichotomous variable where
‘‘increased sales in other outlets’’ was the reference category (p.42).
11
(2013) Explanatory variables: Regional community
context, social learning at farmers markets,
Individual characteristics, Enterprise
characteristics
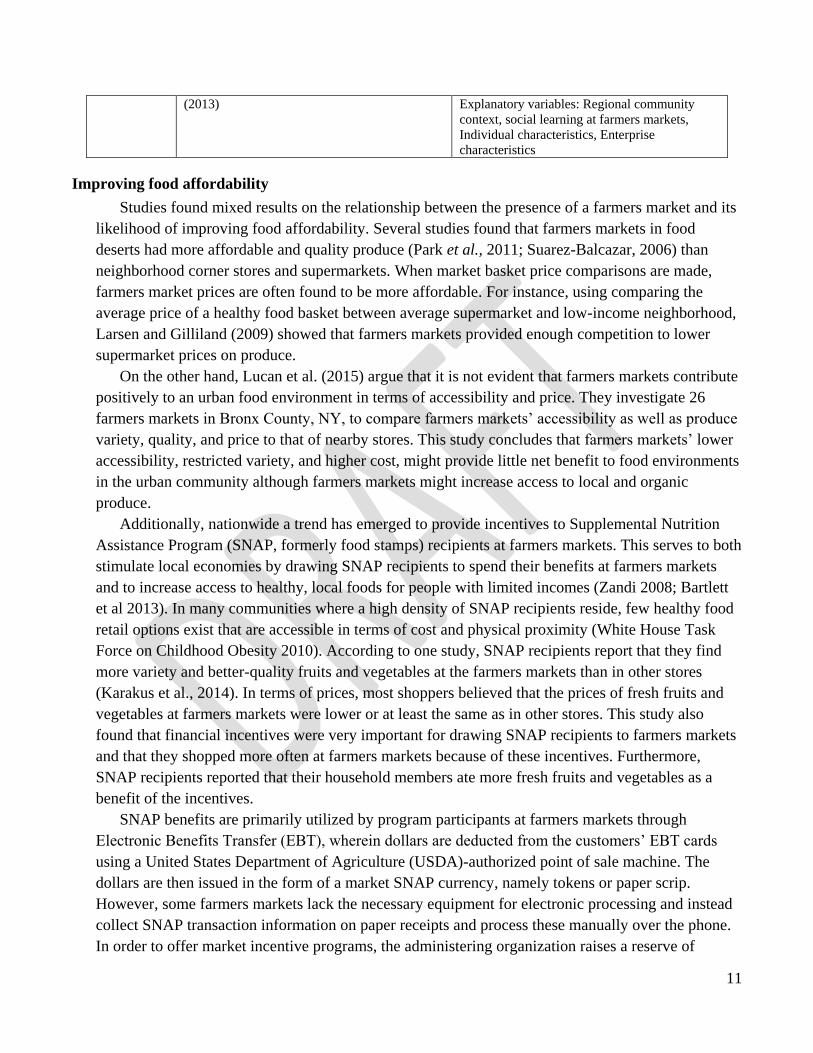
Improving food affordability
Studies found mixed results on the relationship between the presence of a farmers market and its
likelihood of improving food affordability. Several studies found that farmers markets in food
deserts had more affordable and quality produce (Park et al., 2011; Suarez-Balcazar, 2006) than
neighborhood corner stores and supermarkets. When market basket price comparisons are made,
farmers market prices are often found to be more affordable. For instance, using comparing the
average price of a healthy food basket between average supermarket and low-income neighborhood,
Larsen and Gilliland (2009) showed that farmers markets provided enough competition to lower
supermarket prices on produce.
On the other hand, Lucan et al. (2015) argue that it is not evident that farmers markets contribute
positively to an urban food environment in terms of accessibility and price. They investigate 26
farmers markets in Bronx County, NY, to compare farmers markets’ accessibility as well as produce
variety, quality, and price to that of nearby stores. This study concludes that farmers markets’ lower
accessibility, restricted variety, and higher cost, might provide little net benefit to food environments
in the urban community although farmers markets might increase access to local and organic
produce.
Additionally, nationwide a trend has emerged to provide incentives to Supplemental Nutrition
Assistance Program (SNAP, formerly food stamps) recipients at farmers markets. This serves to both
stimulate local economies by drawing SNAP recipients to spend their benefits at farmers markets
and to increase access to healthy, local foods for people with limited incomes (Zandi 2008; Bartlett
et al 2013). In many communities where a high density of SNAP recipients reside, few healthy food
retail options exist that are accessible in terms of cost and physical proximity (White House Task
Force on Childhood Obesity 2010). According to one study, SNAP recipients report that they find
more variety and better-quality fruits and vegetables at the farmers markets than in other stores
(Karakus et al., 2014). In terms of prices, most shoppers believed that the prices of fresh fruits and
vegetables at farmers markets were lower or at least the same as in other stores. This study also
found that financial incentives were very important for drawing SNAP recipients to farmers markets
and that they shopped more often at farmers markets because of these incentives. Furthermore,
SNAP recipients reported that their household members ate more fresh fruits and vegetables as a
benefit of the incentives.
SNAP benefits are primarily utilized by program participants at farmers markets through
Electronic Benefits Transfer (EBT), wherein dollars are deducted from the customers’ EBT cards
using a United States Department of Agriculture (USDA)-authorized point of sale machine. The
dollars are then issued in the form of a market SNAP currency, namely tokens or paper scrip.
However, some farmers markets lack the necessary equipment for electronic processing and instead
collect SNAP transaction information on paper receipts and process these manually over the phone.
In order to offer market incentive programs, the administering organization raises a reserve of
12
supporting funds to provide a ‘match’ to withdrawn SNAP benefits up to a certain dollar amount,
typically between $5 and $30 dollars. Consumers spend their SNAP benefits and these bonus funds
on eligible foods and plants, with some programs restricting the use of bonuses to only fresh fruits
and vegetables. To offer SNAP-based incentives, a market must request a waiver from the USDA
given that the program provides different treatment to SNAP recipients than other customers. The
primary hurdle in implementing bonus incentives is securing sustaining funds for both the matching
dollars and the staff hours required to administer these programs.
Incentive programs have a positive economic impact on farmers market sales. A study lead by
Lydia Oberholtzer evaluating just over 100 farmers market incentive programs in their second year
of implementation found an average increase of 134% in SNAP sales between years one and two.
The usage of incentives also increased by 61% between years one and two (Oberholtzer 2012).
Additional studies that look at the difference in SNAP spending before and after the introduction of
incentive programs show impressive increases, ranging between 117%, 179%, and 328% at different
markets (Bodonyi and Gilroy 2011; New York City Department of Health and Hygiene 2010).
Regionally, several Midwestern states are on the forefront of incentive program implementation,
with Minnesota and Michigan working with partners to implement initiatives at farmers markets
statewide (Blue Cross Blue Shield 2014; Fair Food Network 2014), and Citywide initiatives in
Wisconsin (Dundore and Morales 2015).
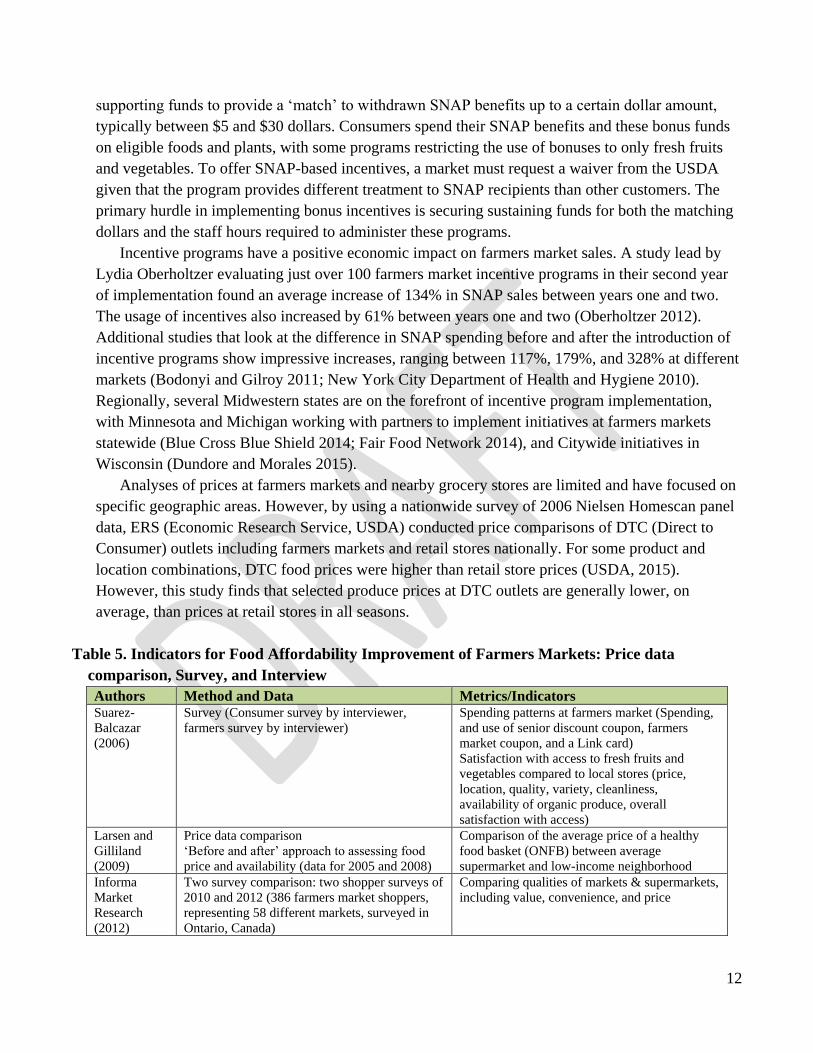
Analyses of prices at farmers markets and nearby grocery stores are limited and have focused on
specific geographic areas. However, by using a nationwide survey of 2006 Nielsen Homescan panel
data, ERS (Economic Research Service, USDA) conducted price comparisons of DTC (Direct to
Consumer) outlets including farmers markets and retail stores nationally. For some product and
location combinations, DTC food prices were higher than retail store prices (USDA, 2015).
However, this study finds that selected produce prices at DTC outlets are generally lower, on
average, than prices at retail stores in all seasons.
Table 5. Indicators for Food Affordability Improvement of Farmers Markets: Price data
comparison, Survey, and Interview
Authors Method and Data Metrics/Indicators Suarez-
Balcazar (2006)
Survey (Consumer survey by interviewer,
farmers survey by interviewer)
Spending patterns at farmers market (Spending,
and use of senior discount coupon, farmers
market coupon, and a Link card) Satisfaction with access to fresh fruits and
vegetables compared to local stores (price,
location, quality, variety, cleanliness,
availability of organic produce, overall
satisfaction with access) Larsen and
Gilliland (2009)
Price data comparison ‘Before and after’ approach to assessing food
price and availability (data for 2005 and 2008)
Comparison of the average price of a healthy
food basket (ONFB) between average
supermarket and low-income neighborhood Informa
Market
Research
(2012)
Two survey comparison: two shopper surveys of
2010 and 2012 (386 farmers market shoppers,
representing 58 different markets, surveyed in
Ontario, Canada)
Comparing qualities of markets & supermarkets,
including value, convenience, and price

13
Community
Science
(2013)
Cluster evaluation for 31 sample sites of the
healthy food incentive programs (SNAP)
The data collected by the individual projects or
organizations that participate in the evaluation
Market sites profile/Monthly transaction
reporting forms
Consumer Survey
Vendor Survey
Market Manager Survey
Program manager semi-structured interviews &
survey
Characteristics of farmers markets offering
SNAP incentives
Change in SNAP recipients food purchasing
behaviors as a result of incentive.
Effect of incentive programs on local farmers
(e.g. revenues, jobs) and the local economies
Cost implications of implementing the healthy
food incentive programs
Essential strategies & components of
“effective” healthy incentive program
Factors & conditions that can affect
implementation
Lucan et al
(2015)
A Cross-sectional assessment by field
investigators of all FMs in Bronx County, NY,
and of the nearest store(s) selling produce within
a half-mile walking distance to compare FM
accessibility as well as produce variety, quality,
and price.
Investigator observation
Interview
Data analysis
Food-source accessibility: how far stores were
from FMs along street-network walking routes
Food-item variety: Food variety including best –
selling items, specific tailored-items, or
promotion items
Produce quality: freshness (the number of days
since harvest), purity/naturalness (organic)
Produce price: price comparison
Table Five presents methodology and indicators that measure food affordability in the existing
literature. In order to evaluate the increased food affordability of farmers market, several studies
carried comparison of the price and quality of the products of farmers markets and supermarkets.
This comparison data is also used to evaluate the health impact of farmers market (see also table
six). Some organization related to agriculture offer price data of fruit and vegetables in farmers
markets to support agriculture. For instance, Center for crop diversification of University of
Kentucky offers weekly price report of fruit and vegetable from a selection of farmers markets in
Kentucky, Illinois, and Tennessee in order to meet demand for crop diversification information for
farmers5.
Human Impacts and Data Collection Tools
For the purpose of the project informed by this paper, we define human capital or practices as
those that improve the capacity, skills, and motivation of individuals to make healthy or healthier
choices. Accordingly, human impact is presented as changes in behavior and not as an impact to
physical health. However, in this review we identified a number of articles that suggest that farmers
markets provide broad, sustainable health outcomes by improving access to fresher food. The health
impacts most commonly cited and discussed in the research included improved food access and
security, increased fruit and vegetable consumption, and healthy cooking and eating practices.
Placing farmers markets in ‘food deserts’ has been identified as a strategy for healthy eating by
the Centers for Disease Control and Prevention (CDC, 2013). By exploring the location of farmers
markets across the U.S., Roubal (2015) identified that a higher percentage of farmers markets census
5 For more information, read Price Reports of Center for Crop Diversification of University of Kentucky. (Nov. 21, 2014).
Retrieved from http://www.uky.edu/Ag/CCD/price.html
14
tracks were food deserts and suggest that farmers markets have the potential to reduce food
insecurity through location. She found that in Wisconsin seasonal summer markets improved access,
transforming food “deserts” into places of accessible food. Additionally, incentive programs at
farmers markets increase the ability of low-income individuals to purchase fresh produce. Through
the CDC’s Communities Putting Prevention to Work initiative during 2010-2012, more than one
million Americans in 14 communities were able to use SNAP, EBT and/or WIC to purchase foods
from local farmers markets and other healthy food retailers.
Farmers markets have been found to provide residents with significantly higher access to fresh
fruits and vegetables (Larsen & Gilliland 2009, Park et al. 2011, Suarez-Balcazar, 2006).
Furthermore, neighborhoods with farmers markets had higher fruit and vegetable consumption rates
among people of color (Park et al., 2011). This was particularly true in low-income markets where
WIC funds or EBT were available (McCormack et al. 2010; Krokowski, 2014). Evidence also
suggests that healthy eating habits are associated with participation in the Senior Farmers Market
Nutrition Program (Kunkel et al., 2003). According to Ruelas et al. (2012), access to alternative
sources of fresh produce, such as farmers markets, might help to mitigate the impact of healthy food
disparities by both lowering the cost of produce in the food deserts and improving healthy food
choices (555).
The ability of farmers markets to accept SNAP EBT cards will be critical if low-income
populations are to be reached. Recent results from the Washington State Farmers Market
Technology Improvement Pilot Program indicate that such technology increased the use of Basic
Food Dollars at Washington State farmers markets by over 300% (Bollen et al., 2010. 9). The newly
awarded FINIP grants are seeking to increase consumption of fruits and vegetables among SNAP
consumers. There is a significant evaluation component to these grants; the larger class of grants is
required to conduct program evaluations.6 This demonstrates the national interest in further research
on this area.
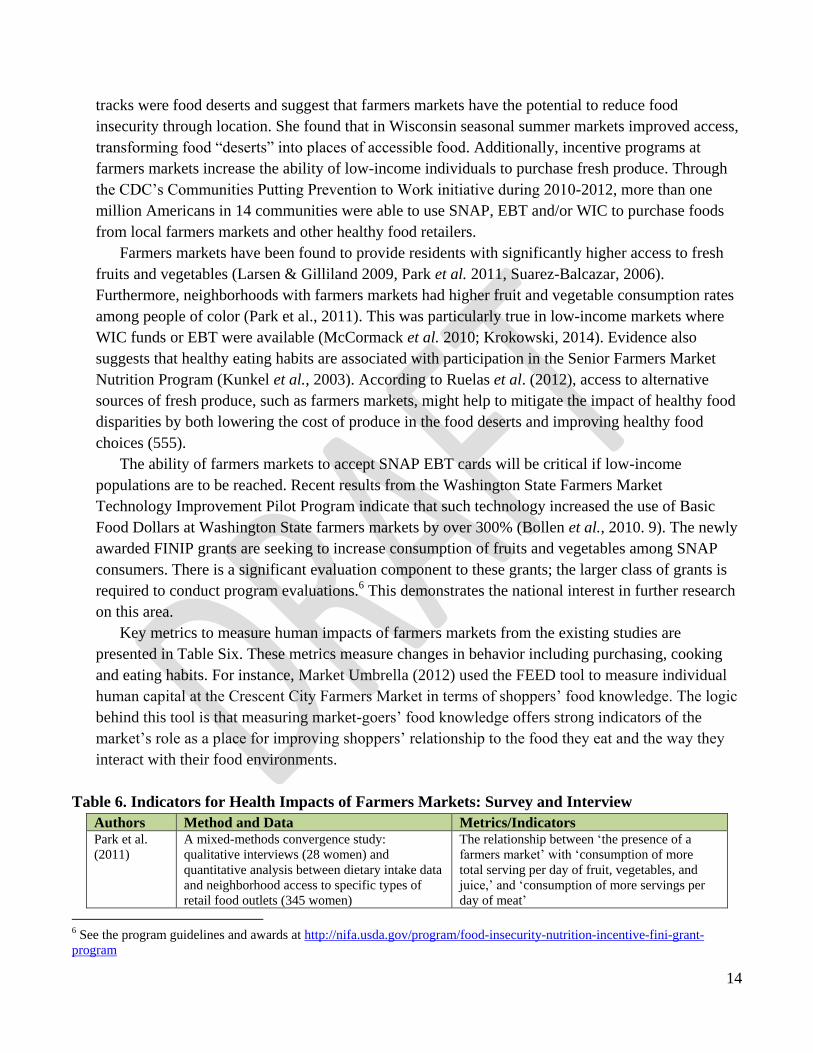
Key metrics to measure human impacts of farmers markets from the existing studies are
presented in Table Six. These metrics measure changes in behavior including purchasing, cooking
and eating habits. For instance, Market Umbrella (2012) used the FEED tool to measure individual
human capital at the Crescent City Farmers Market in terms of shoppers’ food knowledge. The logic
behind this tool is that measuring market-goers’ food knowledge offers strong indicators of the
market’s role as a place for improving shoppers’ relationship to the food they eat and the way they
interact with their food environments.
Table 6. Indicators for Health Impacts of Farmers Markets: Survey and Interview
Authors Method and Data Metrics/Indicators Park et al.
(2011) A mixed-methods convergence study:
qualitative interviews (28 women) and
quantitative analysis between dietary intake data
and neighborhood access to specific types of
retail food outlets (345 women)
The relationship between ‘the presence of a
farmers market’ with ‘consumption of more
total serving per day of fruit, vegetables, and
juice,’ and ‘consumption of more servings per
day of meat’
6 See the program guidelines and awards at http://nifa.usda.gov/program/food-insecurity-nutrition-incentive-fini-grant-
program

15
Kunkel et al.
(2003) A random sample survey of 1,500 participants
of SFMNP and a similar survey of a random
sample of 102 farmers.
Comparison of the quality of the fruits and
vegetables at the farmers market to the grocery
store
More intakes of fruits and vegetables Buying fresh fruit or vegetable that had never
tried before Learning a new way to cook fresh fruits and
vegetables Ruelas et al.
(2012) Two years of evaluation from customer survey
(2007, 2009) in two farmers market in low-
income urban communities in Los Angeles. (415
customers from East LA and 1374 customers
from South LA)
Satisfaction with the market and the type and
quality of produce offered (5-point Likert
Scales) Changes in Family food consumption behavior,
food insecurity physical activity and utilization
of WIC and SFMNP checks
Estimated annual income and household size CDC (2013) Presenting Indicator of fruits and vegetables
consumption
Availability of Healthier food retail in
communities:
Number of farmers markets per 100,000 state
residents
Percentage of farmers markets that accept SNAP
benefits
Percentage of farmers markets that accept WIC
FMNP coupons
Informa
Market
Research
(2012)
See also Table Five
Impact on cooking, recipes, and sharing
Eating seasonally (including adaptation in
winter)
Comparing product qualities at markets &
supermarkets
Impact on eating and cooking
Impact on children’s eating
Impacts on food waste
Frequency of product purchasing at markets
Market
Umbrella
(2012)
FEED tool: use of surveys and visual cues to
measure shoppers’ food knowledge, shopping
behaviors, and familiarity with fresh produce
Changes in market visitors’ food knowledge,
shopping behavior, and the role of shopping
experience at the farmers market in those
changes
Chapman-
Novakofski
and Wheeler
(2014)
Price comparison: Prices were collected
biweekly from grocery stores and Farmers
market vendors. Participants were recruited
from Special Supplemental Nutrition Program
for Women, Infants, and Children clinic to
complete a survey of Fruits and Vegetable
intake, psychosocial variables, and Farmers
Market usage.
Stepwise multiple regression analysis
Comparison of fruit and vegetable cost at
commercial grocery stores and farmers markets
The relationship between fruit and vegetable
survey items and intake
Chapman-Novakofski and Wheeler’s 2014 study on cost comparisons between supermarkets and
farmers markets and the relationship to fruit and vegetable intake showed that farmers market
vouchers (FMNP) facilitated purchasing more vegetables than a family might otherwise be able to
afford, especially when farmers market produce was more expensive than grocery stores. The FMNP
also motivated more WIC participants to go to the markets. This study found that, despite higher
costs, farmers markets were often used, and farmers markets users had a better vegetable intake
pattern.
16
The State Indicator Report on Fruits and Vegetables (CDC, 2013) provides environmental and
policy indicators of support for fruits & vegetables consumption. As a proxy to measure the
availability of healthier food retail in communities, the report uses some metrics relating to farmers
market policies: Number of farmers markets per 100,000 state residents; Percentage of farmers
markets that accept SNAP benefits (new); and Percentage of farmers markets that accept WIC
Farmers Market Nutrition Program coupons.
“Creating greater access to quality and affordable fruits and vegetables (F&V) nationwide is an
important step to increase F&V consumption. When state leaders, health professionals, food retail
owners, farmers, education staff, and community members work together, more Americans can live
healthier lives...Farmers markets are a mechanism for purchasing foods from local farms and can
augment access to F&V from typical retail stores or provide a retail venue for F&V in areas lacking
such stores. The number of farmers markets per 100,000 state residents provides a broad estimate of
the availability of F&V from farmers markets adjusted for variation in state population. Farmers
markets that accept nutrition assistance program benefits, such as Supplemental Nutrition
Assistance Program (SNAP), Special Supplemental Nutrition Program for Women, Infants, and
Children (WIC) Farmers Market Nutrition Program (FMNP) coupons, and WIC Cash Value
Vouchers (CVV), improve access to F&V for individuals and families with lower incomes.”
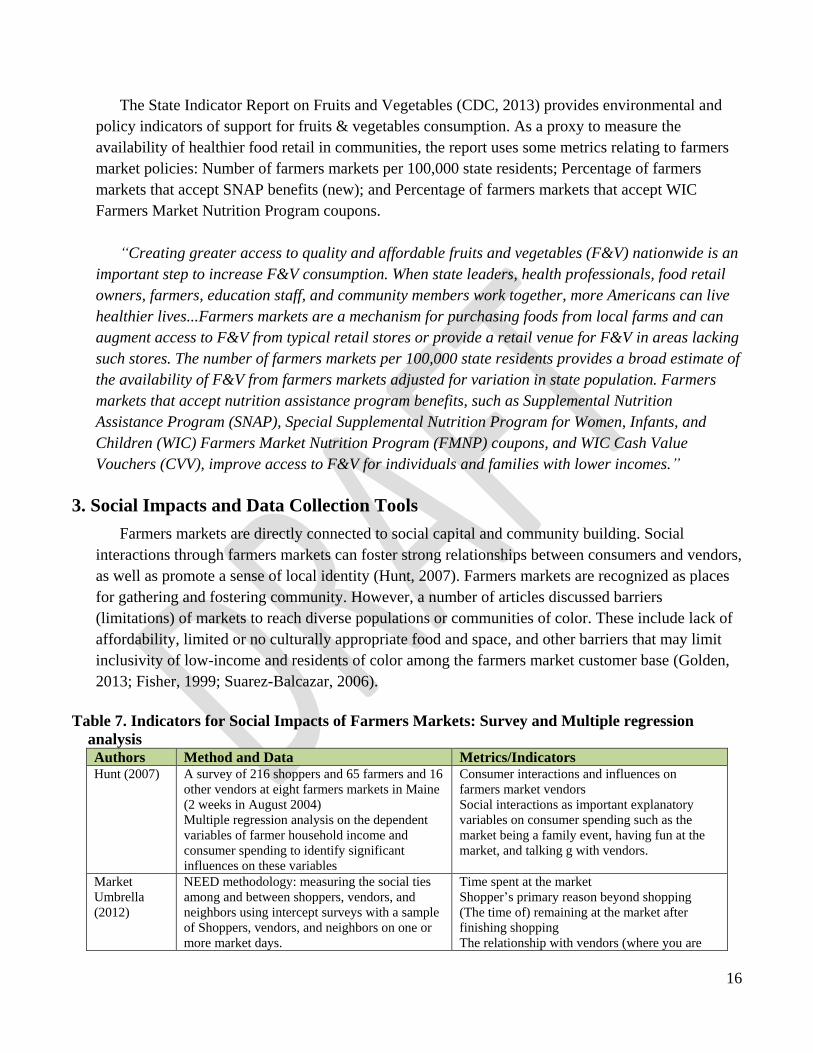
3. Social Impacts and Data Collection Tools
Farmers markets are directly connected to social capital and community building. Social
interactions through farmers markets can foster strong relationships between consumers and vendors,
as well as promote a sense of local identity (Hunt, 2007). Farmers markets are recognized as places
for gathering and fostering community. However, a number of articles discussed barriers
(limitations) of markets to reach diverse populations or communities of color. These include lack of
affordability, limited or no culturally appropriate food and space, and other barriers that may limit
inclusivity of low-income and residents of color among the farmers market customer base (Golden,
2013; Fisher, 1999; Suarez-Balcazar, 2006).
Table 7. Indicators for Social Impacts of Farmers Markets: Survey and Multiple regression
analysis Authors Method and Data Metrics/Indicators Hunt (2007) A survey of 216 shoppers and 65 farmers and 16
other vendors at eight farmers markets in Maine
(2 weeks in August 2004) Multiple regression analysis on the dependent
variables of farmer household income and
consumer spending to identify significant
influences on these variables
Consumer interactions and influences on
farmers market vendors Social interactions as important explanatory
variables on consumer spending such as the
market being a family event, having fun at the
market, and talking g with vendors.
Market
Umbrella (2012)
NEED methodology: measuring the social ties
among and between shoppers, vendors, and
neighbors using intercept surveys with a sample
of Shoppers, vendors, and neighbors on one or
more market days.
Time spent at the market Shopper’s primary reason beyond shopping
(The time of) remaining at the market after
finishing shopping The relationship with vendors (where you are
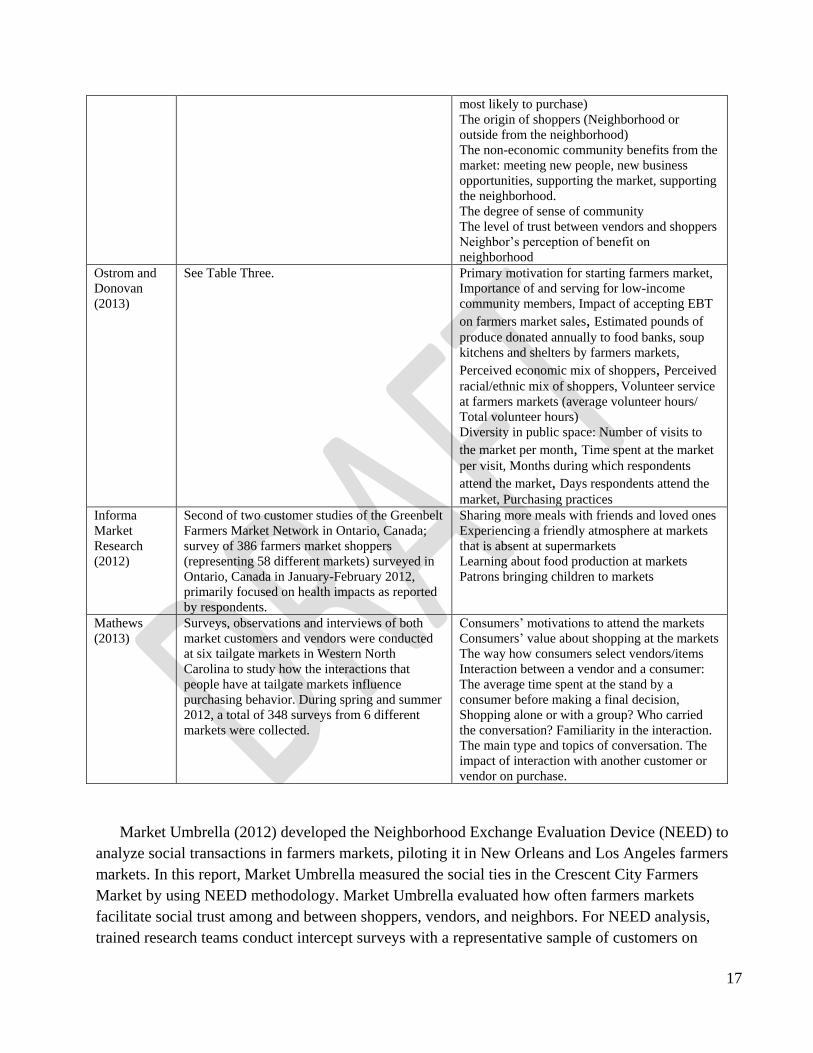
17
most likely to purchase) The origin of shoppers (Neighborhood or
outside from the neighborhood) The non-economic community benefits from the
market: meeting new people, new business
opportunities, supporting the market, supporting
the neighborhood. The degree of sense of community The level of trust between vendors and shoppers Neighbor’s perception of benefit on
neighborhood
Ostrom and
Donovan
(2013)
See Table Three. Primary motivation for starting farmers market,
Importance of and serving for low-income
community members, Impact of accepting EBT
on farmers market sales, Estimated pounds of
produce donated annually to food banks, soup
kitchens and shelters by farmers markets,
Perceived economic mix of shoppers, Perceived
racial/ethnic mix of shoppers, Volunteer service
at farmers markets (average volunteer hours/
Total volunteer hours) Diversity in public space: Number of visits to
the market per month, Time spent at the market
per visit, Months during which respondents
attend the market, Days respondents attend the
market, Purchasing practices Informa
Market
Research
(2012)
Second of two customer studies of the Greenbelt
Farmers Market Network in Ontario, Canada;
survey of 386 farmers market shoppers
(representing 58 different markets) surveyed in
Ontario, Canada in January-February 2012,
primarily focused on health impacts as reported
by respondents.
Sharing more meals with friends and loved ones
Experiencing a friendly atmosphere at markets
that is absent at supermarkets
Learning about food production at markets
Patrons bringing children to markets
Mathews
(2013)
Surveys, observations and interviews of both
market customers and vendors were conducted
at six tailgate markets in Western North
Carolina to study how the interactions that
people have at tailgate markets influence
purchasing behavior. During spring and summer
2012, a total of 348 surveys from 6 different
markets were collected.
Consumers’ motivations to attend the markets
Consumers’ value about shopping at the markets
The way how consumers select vendors/items
Interaction between a vendor and a consumer:
The average time spent at the stand by a
consumer before making a final decision,
Shopping alone or with a group? Who carried
the conversation? Familiarity in the interaction.
The main type and topics of conversation. The
impact of interaction with another customer or
vendor on purchase.
Market Umbrella (2012) developed the Neighborhood Exchange Evaluation Device (NEED) to
analyze social transactions in farmers markets, piloting it in New Orleans and Los Angeles farmers
markets. In this report, Market Umbrella measured the social ties in the Crescent City Farmers
Market by using NEED methodology. Market Umbrella evaluated how often farmers markets
facilitate social trust among and between shoppers, vendors, and neighbors. For NEED analysis,
trained research teams conduct intercept surveys with a representative sample of customers on
18
representative market days and compile quantitative and qualitative questions about their
experiences at the market. Indicators and data used for NEED analysis are presented in Table Seven.
NEED indicators have the capability to tell us a great deal about the market and its ability to create
and enhance social capital. Interpreting these indicators may help researchers deduce the market’s
role in facilitating both social transactions and market transactions with social components. Market
Umbrella suggested that the level of trust between vendors and shoppers could be quantified, and
reveal opportunities for creating and improving bonding and bridging for farmers market participants
and neighbors.
Leah G. Mathews of the University of North Carolina-Asheville conducted research on how the
interactions that people have at tailgate markets influence purchasing behavior. To measure the
characteristics of interactions taking place at the markets, he conducted surveys, observations, and
interview of both market customers and vendors at six tailgate markets in Western North Carolina.
This study shows that consumers and vendors value tailgate markets both for the social atmosphere
and interactions, and direct exchange of information.
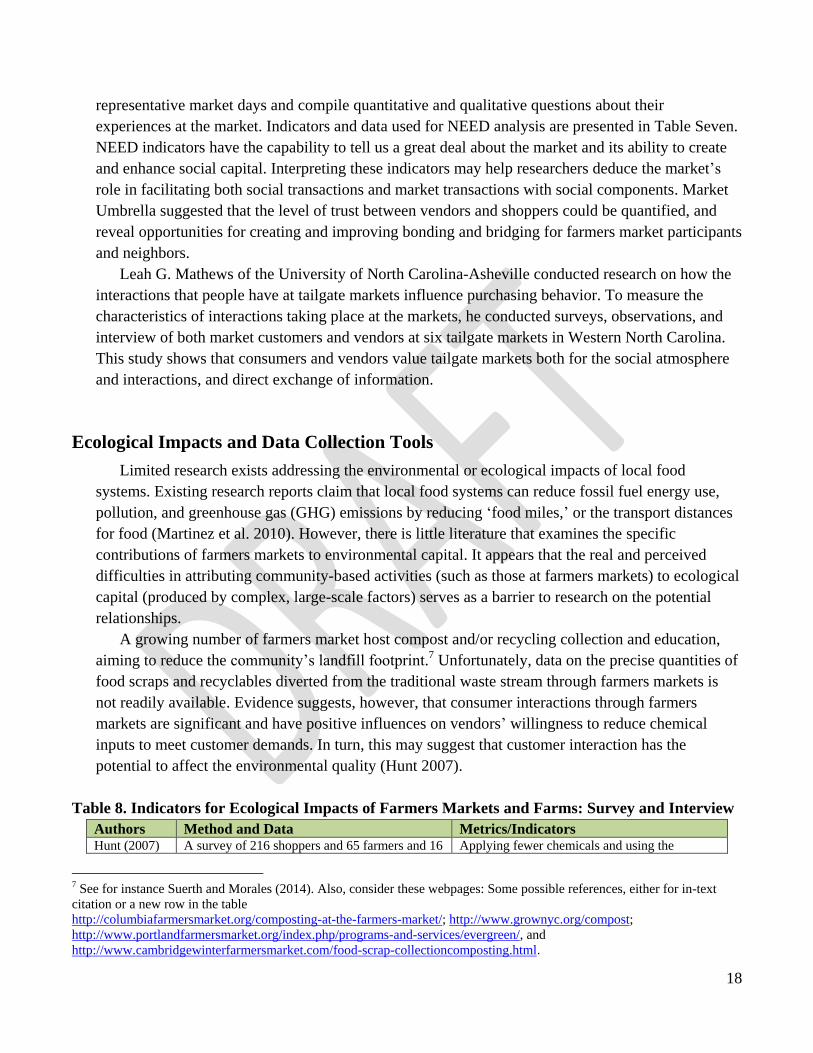
Ecological Impacts and Data Collection Tools
Limited research exists addressing the environmental or ecological impacts of local food
systems. Existing research reports claim that local food systems can reduce fossil fuel energy use,
pollution, and greenhouse gas (GHG) emissions by reducing ‘food miles,’ or the transport distances
for food (Martinez et al. 2010). However, there is little literature that examines the specific
contributions of farmers markets to environmental capital. It appears that the real and perceived
difficulties in attributing community-based activities (such as those at farmers markets) to ecological
capital (produced by complex, large-scale factors) serves as a barrier to research on the potential
relationships.
A growing number of farmers market host compost and/or recycling collection and education,
aiming to reduce the community’s landfill footprint.7 Unfortunately, data on the precise quantities of
food scraps and recyclables diverted from the traditional waste stream through farmers markets is
not readily available. Evidence suggests, however, that consumer interactions through farmers
markets are significant and have positive influences on vendors’ willingness to reduce chemical
inputs to meet customer demands. In turn, this may suggest that customer interaction has the
potential to affect the environmental quality (Hunt 2007).
Table 8. Indicators for Ecological Impacts of Farmers Markets and Farms: Survey and Interview
Authors Method and Data Metrics/Indicators Hunt (2007) A survey of 216 shoppers and 65 farmers and 16 Applying fewer chemicals and using the
7 See for instance Suerth and Morales (2014). Also, consider these webpages: Some possible references, either for in-text
citation or a new row in the table
http://columbiafarmersmarket.org/composting-at-the-farmers-market/; http://www.grownyc.org/compost;
http://www.portlandfarmersmarket.org/index.php/programs-and-services/evergreen/, and
http://www.cambridgewinterfarmersmarket.com/food-scrap-collectioncomposting.html.
19
other vendors at eight farmers markets in Maine
(2 weeks in August 2004) Multiple regression analysis
environment as a selling point to meet consumer
demand
Informa
Market
Research
(2012)
Second in a series of customer studies of the
Greenbelt Farmers Market Network in Ontario,
Canada;
Survey of 386 farmers market shoppers
(representing 58 different markets) surveyed in
Ontario, Canada in January-February 2012,
primarily focused on health impacts as reported
by respondents.
Food Waste
Ostrom &
Donovan
(2013)
See Table Three. Environmentally-friendly means of getting to
farmers markets, Recycling and composting at
farmers market
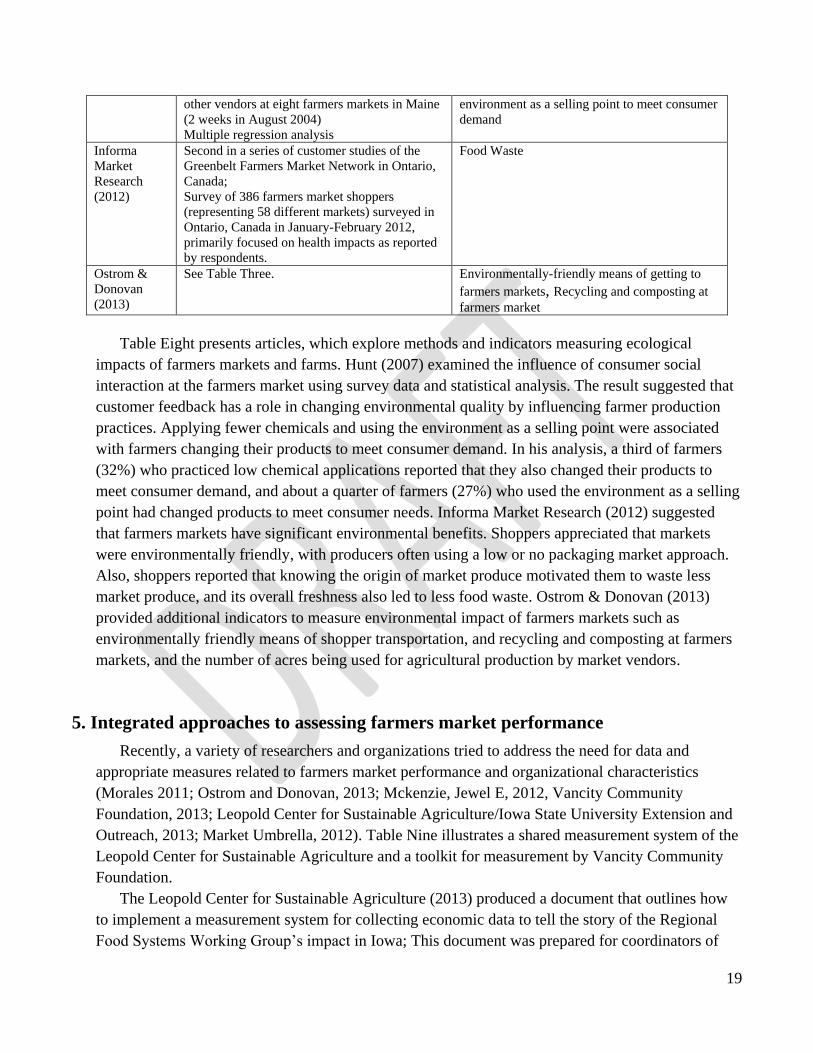
Table Eight presents articles, which explore methods and indicators measuring ecological
impacts of farmers markets and farms. Hunt (2007) examined the influence of consumer social
interaction at the farmers market using survey data and statistical analysis. The result suggested that
customer feedback has a role in changing environmental quality by influencing farmer production
practices. Applying fewer chemicals and using the environment as a selling point were associated
with farmers changing their products to meet consumer demand. In his analysis, a third of farmers
(32%) who practiced low chemical applications reported that they also changed their products to
meet consumer demand, and about a quarter of farmers (27%) who used the environment as a selling
point had changed products to meet consumer needs. Informa Market Research (2012) suggested
that farmers markets have significant environmental benefits. Shoppers appreciated that markets
were environmentally friendly, with producers often using a low or no packaging market approach.
Also, shoppers reported that knowing the origin of market produce motivated them to waste less
market produce, and its overall freshness also led to less food waste. Ostrom & Donovan (2013)
provided additional indicators to measure environmental impact of farmers markets such as
environmentally friendly means of shopper transportation, and recycling and composting at farmers
markets, and the number of acres being used for agricultural production by market vendors.
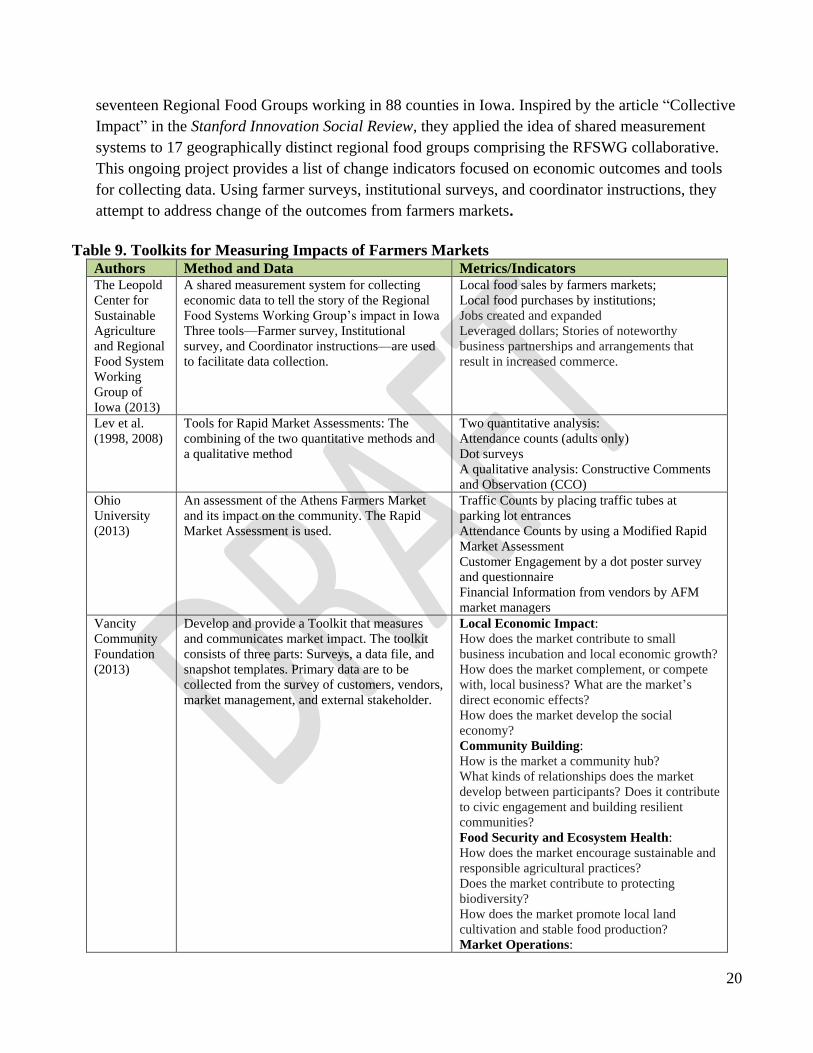
5. Integrated approaches to assessing farmers market performance
Recently, a variety of researchers and organizations tried to address the need for data and
appropriate measures related to farmers market performance and organizational characteristics
(Morales 2011; Ostrom and Donovan, 2013; Mckenzie, Jewel E, 2012, Vancity Community
Foundation, 2013; Leopold Center for Sustainable Agriculture/Iowa State University Extension and
Outreach, 2013; Market Umbrella, 2012). Table Nine illustrates a shared measurement system of the
Leopold Center for Sustainable Agriculture and a toolkit for measurement by Vancity Community
Foundation.
The Leopold Center for Sustainable Agriculture (2013) produced a document that outlines how
to implement a measurement system for collecting economic data to tell the story of the Regional
Food Systems Working Group’s impact in Iowa; This document was prepared for coordinators of
20
seventeen Regional Food Groups working in 88 counties in Iowa. Inspired by the article “Collective
Impact” in the Stanford Innovation Social Review, they applied the idea of shared measurement
systems to 17 geographically distinct regional food groups comprising the RFSWG collaborative.
This ongoing project provides a list of change indicators focused on economic outcomes and tools
for collecting data. Using farmer surveys, institutional surveys, and coordinator instructions, they
attempt to address change of the outcomes from farmers markets.
Table 9. Toolkits for Measuring Impacts of Farmers Markets Authors Method and Data Metrics/Indicators The Leopold
Center for
Sustainable
Agriculture
and Regional
Food System
Working
Group of
Iowa (2013)
A shared measurement system for collecting
economic data to tell the story of the Regional
Food Systems Working Group’s impact in Iowa Three tools—Farmer survey, Institutional
survey, and Coordinator instructions—are used
to facilitate data collection.
Local food sales by farmers markets; Local food purchases by institutions; Jobs created and expanded Leveraged dollars; Stories of noteworthy
business partnerships and arrangements that
result in increased commerce.
Lev et al.
(1998, 2008)
Tools for Rapid Market Assessments: The
combining of the two quantitative methods and
a qualitative method
Two quantitative analysis:
Attendance counts (adults only)
Dot surveys
A qualitative analysis: Constructive Comments
and Observation (CCO)
Ohio
University
(2013)
An assessment of the Athens Farmers Market
and its impact on the community. The Rapid
Market Assessment is used.
Traffic Counts by placing traffic tubes at
parking lot entrances
Attendance Counts by using a Modified Rapid
Market Assessment
Customer Engagement by a dot poster survey
and questionnaire
Financial Information from vendors by AFM
market managers
Vancity
Community
Foundation
(2013)
Develop and provide a Toolkit that measures
and communicates market impact. The toolkit
consists of three parts: Surveys, a data file, and
snapshot templates. Primary data are to be
collected from the survey of customers, vendors,
market management, and external stakeholder.
Local Economic Impact: How does the market contribute to small
business incubation and local economic growth? How does the market complement, or compete
with, local business? What are the market’s
direct economic effects? How does the market develop the social
economy? Community Building: How is the market a community hub? What kinds of relationships does the market
develop between participants? Does it contribute
to civic engagement and building resilient
communities? Food Security and Ecosystem Health: How does the market encourage sustainable and
responsible agricultural practices? Does the market contribute to protecting
biodiversity? How does the market promote local land
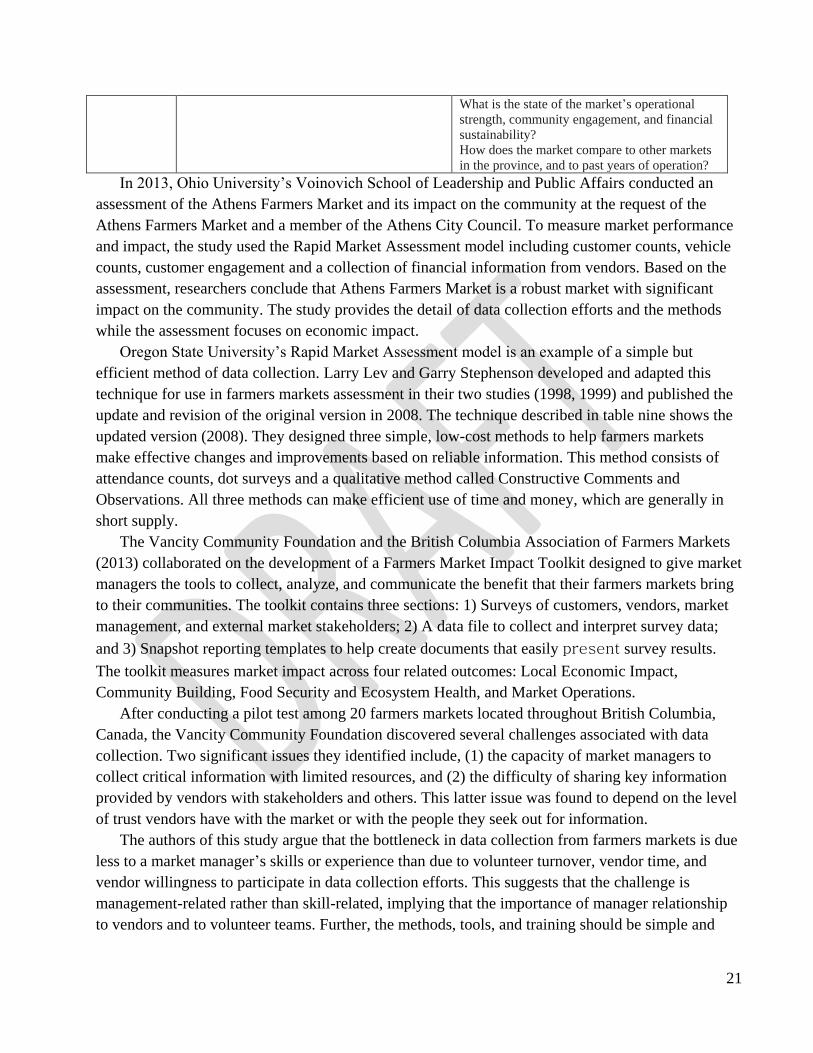
cultivation and stable food production? Market Operations:
21
What is the state of the market’s operational
strength, community engagement, and financial
sustainability? How does the market compare to other markets
in the province, and to past years of operation?
In 2013, Ohio University’s Voinovich School of Leadership and Public Affairs conducted an
assessment of the Athens Farmers Market and its impact on the community at the request of the
Athens Farmers Market and a member of the Athens City Council. To measure market performance
and impact, the study used the Rapid Market Assessment model including customer counts, vehicle
counts, customer engagement and a collection of financial information from vendors. Based on the
assessment, researchers conclude that Athens Farmers Market is a robust market with significant
impact on the community. The study provides the detail of data collection efforts and the methods
while the assessment focuses on economic impact.
Oregon State University’s Rapid Market Assessment model is an example of a simple but
efficient method of data collection. Larry Lev and Garry Stephenson developed and adapted this
technique for use in farmers markets assessment in their two studies (1998, 1999) and published the
update and revision of the original version in 2008. The technique described in table nine shows the
updated version (2008). They designed three simple, low-cost methods to help farmers markets
make effective changes and improvements based on reliable information. This method consists of
attendance counts, dot surveys and a qualitative method called Constructive Comments and
Observations. All three methods can make efficient use of time and money, which are generally in
short supply.
The Vancity Community Foundation and the British Columbia Association of Farmers Markets
(2013) collaborated on the development of a Farmers Market Impact Toolkit designed to give market
managers the tools to collect, analyze, and communicate the benefit that their farmers markets bring
to their communities. The toolkit contains three sections: 1) Surveys of customers, vendors, market
management, and external market stakeholders; 2) A data file to collect and interpret survey data;
and 3) Snapshot reporting templates to help create documents that easily present survey results.
The toolkit measures market impact across four related outcomes: Local Economic Impact,
Community Building, Food Security and Ecosystem Health, and Market Operations.
After conducting a pilot test among 20 farmers markets located throughout British Columbia,
Canada, the Vancity Community Foundation discovered several challenges associated with data
collection. Two significant issues they identified include, (1) the capacity of market managers to
collect critical information with limited resources, and (2) the difficulty of sharing key information
provided by vendors with stakeholders and others. This latter issue was found to depend on the level
of trust vendors have with the market or with the people they seek out for information.
The authors of this study argue that the bottleneck in data collection from farmers markets is due
less to a market manager’s skills or experience than due to volunteer turnover, vendor time, and
vendor willingness to participate in data collection efforts. This suggests that the challenge is
management-related rather than skill-related, implying that the importance of manager relationship
to vendors and to volunteer teams. Further, the methods, tools, and training should be simple and
22
continually reinforced to enhance vendor willingness to participate in consistent and effective data
collection.
IV. Conclusions: Key Learnings and Implications for Practice
This review of the literature found that studies of farmers markets present the benefits of farmers
markets in relation to social, economic, human, and ecological aspects. To collect data and measure
these aspects, virtually all these studies utilized surveys. However, the surveys were implemented at
single markets, or by state entities, and little is known at the national level beyond the effort to
enumerate the number of markets. Few of these studies address issues of data collection methods and
indicators at farmers markets (Diane Eggert (2009); Corry Bregendahl (2013); McCarthy (2010)).
Additionally, a limited number of universally applicable toolkits or manuals on data collection exist
(Market Umbrella (2012); Vancity Community Foundation (2013)), none of which is commonly
used around the country. Comprehensive and longitudinal studies with consistent metrics are needed
to have a fuller appreciation of markets’ contributions to social, economic, human, and ecological
capitals. Such data would enable and make more useful regional economic analyses.
The collection of data pertaining to farmers markets is recognized as important by researchers
and market practitioners. Currently, regular data collection is taking place at a limited selection of
markets across the 8,000+ active markets in the United States. Given the limited capacity and
resources available to many markets, it might be quite difficult to ensure that data collection is done
efficiently and effectively.
The results of this literature review show that a number of different methods to collect data for
measuring the performance of farmers market and its impact on the community already exist. These
include surveys, interviews and focus groups, observation, comparison, and mapping. Among them,
survey techniques are presently the core data collection strategy for measuring the impacts of
farmers markets. In existing research on farmers markets, survey data on the impacts of farmers
markets have been analyzed by various methods such as IMPLAN and RIMS that are based on
survey data that estimates sales. Multivariate regression analysis also utilizes survey data of sample
farmers markets. Additionally, survey data provides important measures of social, economic, and
human impacts of farmers markets. Surveys most frequently measure total sales, number of visitors
and vendors, number of employed individuals, time/money spent at markets/neighboring businesses,
motivations and satisfaction levels, price and quality of products, etc. Meaningful impact indicators
based on this data can help market organizations and their project partners collect and use data they
need to inform decision-making and annual planning.
Therefore, the design and implementation of surveys must be carefully considered as a critical
part of the assessment process. For instance, Bubinas (2009) conducted vendor surveys during
market hours and asked vendors to fill out the survey when possible during the day and then she
collected the surveys at the end of the day. Vendors who were too busy to complete the survey on
site were given a stamped University addressed envelope in which to return the survey. This
approach can raise the response rate of vendor surveys. However, we are not aware of systematic
research about the efficacy of this approach.
23
Financial incentives are another approach to enhancing participation in research. Sometimes
researchers use financial incentives such farmers market gift certificates that they raffle off to
respondents to encourage shopper participation in surveys. Researchers should also understand that
vendors may have different, non-financial motivations for participating in data collection activities.
From her survey of vendors, Bubinas showed that vendors derive significant personal satisfaction
from vending, which they see as performing a service for the community. Therefore, to facilitate
vendors’ active participation in data collection, it is important to share with them how their market is
performing this service and that the ultimate goals of data collection will benefit their field. Showing
vendors that their market cares about this work and how data collection will improve the market and
its contribution will enhance vendor participation in the data collection.
Even when the methods used are sound and the collection process efficient, the tedious and time-
consuming nature of data entry may serve as an additional bottleneck in the process. Online forms,
excel templates with built-in formulas, and even mobile applications allowing surveyors to enter data
into a portal site could prove useful in increasing the efficiency and accuracy of data entry. However,
we have no clear understanding of the differences, if any, between paper surveys/verbal
questionnaires and the online application of the same. Thus, we need experimentation with
computer/phone or other technologically assisted data collection. If possible, we need comparisons
between such technologically assisted data collection and the paper or other modes of data
collection. It is possible that for many questions, both formats will be required, at least at present.
However, no matter which data collection instruments are selected it is important remain sensitive to
the respondent’s needs and interest and to maximize their trust in the collection process.
In this regard, we need to consider how the capacity for data collection varies across farmers
markets. Markets need support to identify and implement data collection tools, and they need access
to technical assistance sensitive to their context. Well-tailored training materials and exercises from
which markets may learn are becoming available, but access to information is still limited or
unavailable. In addition to providing effective tools and strategies, it is important to consider the
management structure, staffing, and evaluation timeline for implementing data collection efforts.
There is a need for clear, tailored, and useful tools and training for measurement and evaluation of
farmers markets in order to identify their impact on social, ecological, economic, and human capital
and enable more constructive discussion on how such impacts can be maximized for wider
community benefit.
24
References
Alkon, A. H. (2012). Black, white, and green: farmers markets, race, and the green economy. Athens:
University of Georgia Press.
America, F. M. (2008). Characteristics of Successful Farmers Markets: Portland Farmers
Markets/Direct-Market Economic Analysis: City of Portland.
Bartlett, S., Klerman, J., Wilde, P., Olsho, L., Blocklin, C., & Enver, A. (2013). Healthy Incentives Pilot
(HIP) Interim Report. U.S. Department of Agriculture, Food and Nutrition Service. Washington,
D.C.: Abt Associates.
Blue Cross Blue Shield. (2014). Minnesota Market Bucks Program. Eagan, MN.
http://www.centerforpreventionmn.com/what-we-do/our-current-initiatives/farmers-markets
Bodonyi, B., & Gilroy, A. (2011). Healthy eating at farmers markets: The impact of nutrition incentives.
Portland, Oregon: Oregon Public Health Institute
Brown, C., Miller, S. M., Boone, D. A., Boone, H. N., Gartin, S. A., & McConnell, T. R. (2007). “The
importance of farmers’ markets for West Virginia direct marketers.” Renewable Agriculture and
Food Systems, 22(01), 20. doi: 10.1017/s1742170507001561
Bubinas, K. (2009). Feeding the Downtown: A Study of the Economic Effects of Farmers’ Markets on
Local Economies in Wisconsin: The cases of Kenosha Harbor Market and Waukesha Farmers’
Market. University of Wisconsin-Waukesha.
Bubinas, K. (2011). “Farmers Markets in the Post-Industrial City.” City and Society, 23(2), 154-172.
CDC. (2013). State Indicator Report on Fruits and Vegetables. Atlanta, GA: Centers for Disease
Control and Prevention.
Chapman-Novakofski and Wheeler. (2014). “Farmers’ Markets: Costs Compared with Supermarkets,
Use among WIC Clients, and Relationship to Fruit and Vegetable Intake and Related
Psychosocial Variables.” Journal of Nutrition Education and Behavior 46, no. 3S.
City of Portland. (2008). Growing Portland’s Farmers Markets: Portland Farmers Markets/Direct-
Market Economic Analysis. City of Portland.
Community Science. (2013). Snap Healthy Food Incentives Cluster Evaluation 2013 Final Report.
Corry Bregendahl, L. K., and Teresa Wiemerslage. (2013). Collecting Data for Collecitve Impact: A
Guide for Coordinators in the Regional Food System Working Group: Leopold Center for
Sustainable Agriculture, Iowa State University Extension and Outreach.
25
Daniel Otto, T. V. (2005). Consumers, Vendors and the Economic Importance of Iowa Farmers’
Markets: An Economic Impact Survey Analysis: The Regional Food Systems Working Group,
IOWA State University.
Diane Eggert, J. F. (2009). Farmers Market Manager Training Manual: Farmers Market Federation of
New York.
Dundore, Lexa and Alfonso Morales. (2015). City of Madison, WI, MadMarket Double Dollars Program
Report. University of Wisconsin-Madison, WI.
Econsult Corporation. (2007). ESTIMATING THE ECONOMIC IMPACT OF PUBLIC MARKETS.
New York, NY: Project for Public Spaces.
Fair Food Network. (2014). Double Up Food Bucks five year report. Ann Arbor, Michigan.
http://www.fairfoodnetwork.org/sites/default/files/FFN_DoubleUpFoodBucks_5YearReport.pdf
Feenstra, G. W., Lewis, C. C., Hinrichs, C. C., Gillespie, G. W., & Hilchey, D. (2003). Entrepreneurial
outcomes and enterprise size in US retail farmers’ markets. American Journal of Alternative
Agriculture, 18, 45-55.
Fisher, Andy. (1999). Hot Peppers and Parking Lot Peaches: Evaluating Farmers’ Markets in Low
Income Communities: Community Food Security Coalition.
Friedlander, H. (1976). “If you want to be a customer at a farmers’ market-start one. ” Organic
Gardening and Farming, 23, 108-109.
Golden, S. (2013). Urban Agriculture Impacts: Social, Health, and Economic: A Literature Review: UC
Sustainable Agriculture Research and Education Program, Agricultural Sustainability Institute at
UC Davis.
Henneberry, S. R., B. Whitacre, and H N. Agustini. (2009). “An Evaluation of the Economic Impacts of
Oklahoma Farmers Markets.” Journal of Food Distribution Research, 40(3), 64-78.
Hughes et al. (2004). Social Learning and Innovation at Retail Farmers’ Markets. Rural Sociology,
69(1), 31-58.
Hunt, Alan R. (2007). “Consumer Interactions and Influences on Farmers’ Market Vendors.” Renewable
Agriculture and Food Systems 22, no. 01.
Informa Market Research Co. Ltd. (2012). Healthy Habits: Farmers’ Markets’ Impacts on Customers. In
Greenbelt Farmers’ Market Network Research Survey 2012.
Karakus, M., MacAllum, K., Milfort, R., and Hao, H. (2014). Nutrition assistance at farmers markets:
Understanding the shopping patterns of SNAP participants. Prepared by Westat for the U.S.
26
Department of Agriculture, Food and Nutrition Service.
http://www.fns.usda.gov/sites/default/files/FarmersMarkets-Shopping-Patterns.pdf
Kinney, K., Lindahl J., Creahan, K., & Richey J. (2010). Farmers Market Report. King County
Department of Natural Resources & Parks, Water & Land Resources Division.
Krokowski, K. (2014). “Evaluating the Economic and Nutrition Benefits of EBT Programs at Farmers’
Markets.” Journal of Agriculture, Food Systems, and Community Development, 1-8. doi:
10.5304/jafscd.2014.042.011
Kunkel, M. E., Luccia, B., & Moore, A. C. (2003). “Evaluation of the South Carolina seniors farmers’
market nutrition education program. “Journal of American Dietetic Association, 103(7), 880-
883. doi: 10.1053/jada.2003.50164
Larsen, K., & Gilliland, J. (2009). “A farmers’ market in a food desert: Evaluating impacts on the price
and availability of healthy food.” Health & Place, 15(4), 1158-1162. doi:
10.1016/j.healthplace.2009.06.007
Lev, L. and Gary, S. (1998). Analyzing Three Farmers’ Markets in Corvallis and Albany, Oregon,
Oregon State University Small Farms Technical Report Number 2.
http://smallfarms.oregonstate.edu/sites/default/files/publications/techreports/ TechReport2.pdf
Lev, L. and Gary, S. (1999). Dot Posters: A Practical Alternative to Written Questions and Oral
lnterviews, Journal of Extension. http://www.joe.org/joe/1999october/tt1.html
Lev, L. et al. (2003). How Do Farmers’ Markets Affect Neighboring Businesses? Oregon Small Farms
Technical Report (Vol. 16): Small Farms Extension Program, Oregon State University.
Lev, L. et al. (2008). Tools for Rapid Market Assessment. Oregon Small Farms Technical Report No.6.
Special Report 1088-E, Oregon State University Extension Service.
Low, S., A. Adalja, E. Beaulieu, N. Key, S. Martinez, A. Melton, et al. (2015). Trends in U.S. local and
regional food systems. U.S. Department of Agriculture, Economic Research Service.
Washington, DC. http://www.ers.usda.gov/media/1763057/ap068.pdf
Lucan et al. (2015). “Urban Farmers’ Markets: Accessibility, Offerings, and Produce Variety, Quality,
and Price Compared to Nearby Stores.” Appetite 90: 23-30.
LLC, B. G. Y. (2008). Economic Impact of Portland’s Farmers Markets: The City of Portland.
Market Umbrella. (1999). Catalysts for Growth: Farmers Markets as Stimulus for Economic
Development Green Paper. New Orleans, LA: Marketumbrella.org.
27
Market Umbrella. (2012). FEED: Measuring the Human Impact of a Public Market: Individual Human
Capital Impact Study. The Crescent City Farmers Market: Marketumbrella.org.
Market Umbrella. (2012). NEED: Measuring the Social Impact of a Public Market: Social Capital
Impact Study: The Crescent City Farmers Market. New Orleans, LA: Marketumbrella.org.
Market Umbrella. (2012). SEED: Sticky Economic Evaluation Device: Measuring the Financial Impact
of a Public Market. The Crescent City Farmers Market: Marketumbrella.org.
Martinez, S., et al. (2010). Local Food Systems: Concepts, Impacts, and Issues (Vol. 97): U.S.
Department of Agriculture, Economic Research Service.
Mathews, L. G. (October 2013). The Talk at Tailgate Markets: Results Summary: University of North
Carolina Asheville.
McCarthy, R. (2010). Evaluating the Social, Financial and Human Capital Impacts of Farmers Markets:
Market Umbrella.
McKenzie, J. E. (2012). Farmers Markets in Rockingham and Strafford Counties in New Hampshire: An
Analysis of Market Manager and Cosumer Trends, Preferences, and Characteristics: University
of New Hampshire.
Morales, A. (2011). “Marketplaces: Prospects for Social, Economic, and Political Development.”
Journal of Planning Literature, 26 (1), 3-17.
New York City Department of Health and Hygiene. (2010). Farmers’ markets initiatives: Promoting
fresh fruits and vegetables in underserved communities 2010 report.
http://www.nyc.gov/html/doh/downloads/pdf/cdp/cdp-farmers-marketreport.pdf
Oberholtzer, L., et al. (2012). Linking farmers, healthy foods, and underserved consumers: Exploring the
impact of nutrition incentive programs on farmers and farmers’ markets. Journal of Agriculture,
Food Systems, and Community Development. 63-77.
http://dx.doi.org/10.5304/jafscd.2012.024.002
Ostrom, M and C. Donovan. (2013). Summary Report: Farmers Markets and the Experiences of Market
Managers in Washington State: Washington State University Small Farms Program.
Park, Y., Quinn, J., Florez, K., Jacobson, J., Neckerman, K., & Rundle, A. (2011). Hispanic immigrant
women’s perspective on healthy foods and the New York City retail food environment: A mixed-
method study. Social Science & Medicine, 73(1), 13-21. doi: 10.1016/j.socscimed.2011.04.012
Roubal, M. Anne. (2015). The Food Environment and Health: Roles Fast Food and Fast Causal
Restaurants and Farmers’ Markets can Play. University of Wisconsin-Madison. Dissertation
28
Ruelas et al. (2012). “The Role of Farmers’ Markets in Two Low Income, Urban Communities.”
Journal of Community Health 37, no. 3: 554-62.
Sadler, R., Clark, M., & Gilliland, J. (2013). “An Economic Impact Comparative Analysis of Farmers’
Markets in Michigan and Ontario.” Journal of Agriculture, Food Systems, and Community
Development, 61-81. doi: 10.5304/jafscd.2013.033.009
Suarez-Balcazar, Y., Martinez, L. I., Cox, J., & Jayraj, A. (2006). “African Americans’ Views on Access
to Healthy Foods: What a Farmers’ Market Provides.” Journal of Extension, 44(2).
Suerth, Lauren and Alfonso Morales. (2014). “Composting.” Zoning Practice. 31(9): 1-8.
Swenson, Dave. (2009). Investigating the Potential Economic Impact of Local Food for Southeast Iowa.
Leopold Center for Sustainable Agriculture.
Ohio University. (2013). Assessing the Impact of the Athens Farmers Market: Ohio University’s
Voinovich School of Leadership and Public Affairs.
USDA, A. M. S. (2014). National Count of Farmers Market Directory Listing Graph: 1994-2014
Retrieved October 10, 2014
Vancity Community Foundation and British Columbia Association of Farmers’ Markets. (2013).
Farmers’ Market Impact Toolkit User’s Guide.
White House Task Force on Childhood Obesity. (2010). Solving the problem of childhood obesity
within a generation: White House task force on childhood obesity report to the President.
http://www.letsmove.gov/sites/letsmove.gov/files/TaskForce_on_Childhood_Obesity_May2010
_FullReport.pdf
Zandi, Mark. (2008). Assessing the macroeconomic impact of fiscal stimulus 2008. Moody’s
Economy.com. West Chester, PA. https://www.economy.com/mark-zandi/documents/Stimulus-
Impact-2008.pdf
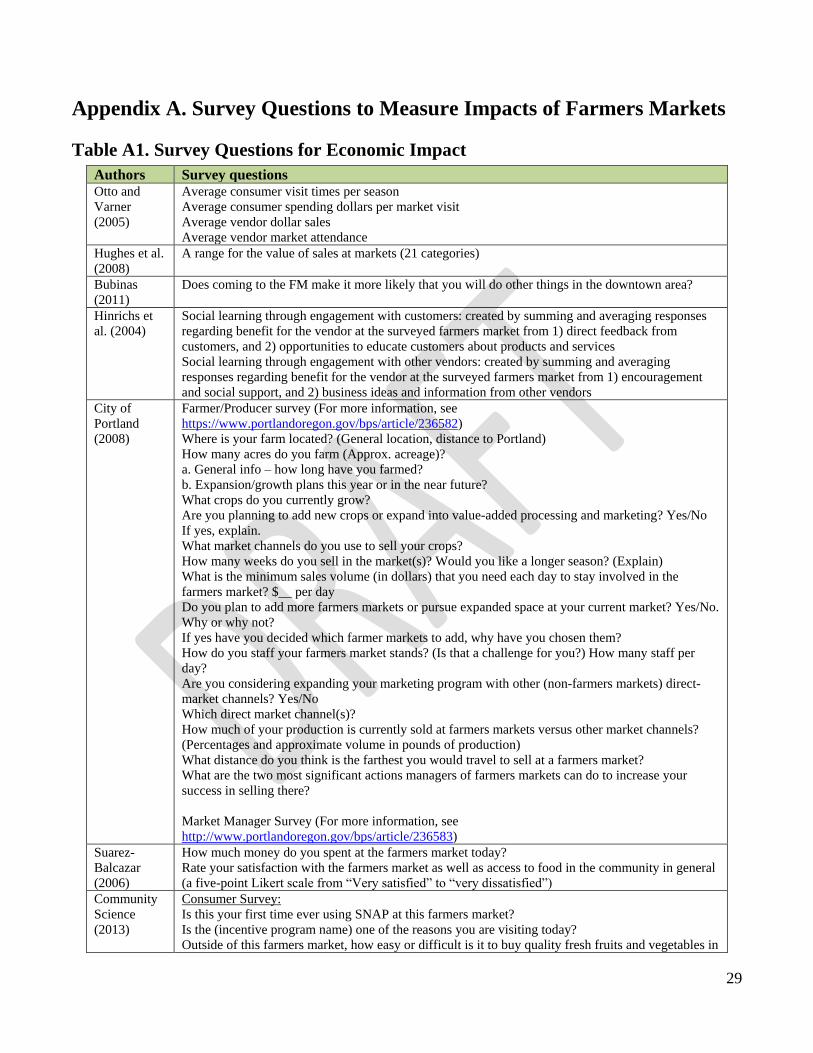
29
Appendix A. Survey Questions to Measure Impacts of Farmers Markets
Table A1. Survey Questions for Economic Impact
Authors Survey questions Otto and
Varner
(2005)
Average consumer visit times per season Average consumer spending dollars per market visit Average vendor dollar sales Average vendor market attendance
Hughes et al.
(2008) A range for the value of sales at markets (21 categories)
Bubinas
(2011)
Does coming to the FM make it more likely that you will do other things in the downtown area?
Hinrichs et
al. (2004)
Social learning through engagement with customers: created by summing and averaging responses
regarding benefit for the vendor at the surveyed farmers market from 1) direct feedback from
customers, and 2) opportunities to educate customers about products and services Social learning through engagement with other vendors: created by summing and averaging
responses regarding benefit for the vendor at the surveyed farmers market from 1) encouragement
and social support, and 2) business ideas and information from other vendors
City of
Portland
(2008)
Farmer/Producer survey (For more information, see
https://www.portlandoregon.gov/bps/article/236582)
Where is your farm located? (General location, distance to Portland)
How many acres do you farm (Approx. acreage)?
a. General info – how long have you farmed?
b. Expansion/growth plans this year or in the near future?
What crops do you currently grow?
Are you planning to add new crops or expand into value-added processing and marketing? Yes/No
If yes, explain.
What market channels do you use to sell your crops?
How many weeks do you sell in the market(s)? Would you like a longer season? (Explain) What is the minimum sales volume (in dollars) that you need each day to stay involved in the
farmers market? $__ per day
Do you plan to add more farmers markets or pursue expanded space at your current market? Yes/No.
Why or why not?
If yes have you decided which farmer markets to add, why have you chosen them?
How do you staff your farmers market stands? (Is that a challenge for you?) How many staff per
day?
Are you considering expanding your marketing program with other (non-farmers markets) direct-
market channels? Yes/No
Which direct market channel(s)?
How much of your production is currently sold at farmers markets versus other market channels?
(Percentages and approximate volume in pounds of production) What distance do you think is the farthest you would travel to sell at a farmers market?
What are the two most significant actions managers of farmers markets can do to increase your
success in selling there?
Market Manager Survey (For more information, see
http://www.portlandoregon.gov/bps/article/236583)
Suarez-
Balcazar (2006)
How much money do you spent at the farmers market today? Rate your satisfaction with the farmers market as well as access to food in the community in general
(a five-point Likert scale from “Very satisfied” to “very dissatisfied”)
Community
Science
(2013)
Consumer Survey:
Is this your first time ever using SNAP at this farmers market?
Is the (incentive program name) one of the reasons you are visiting today?
Outside of this farmers market, how easy or difficult is it to buy quality fresh fruits and vegetables in
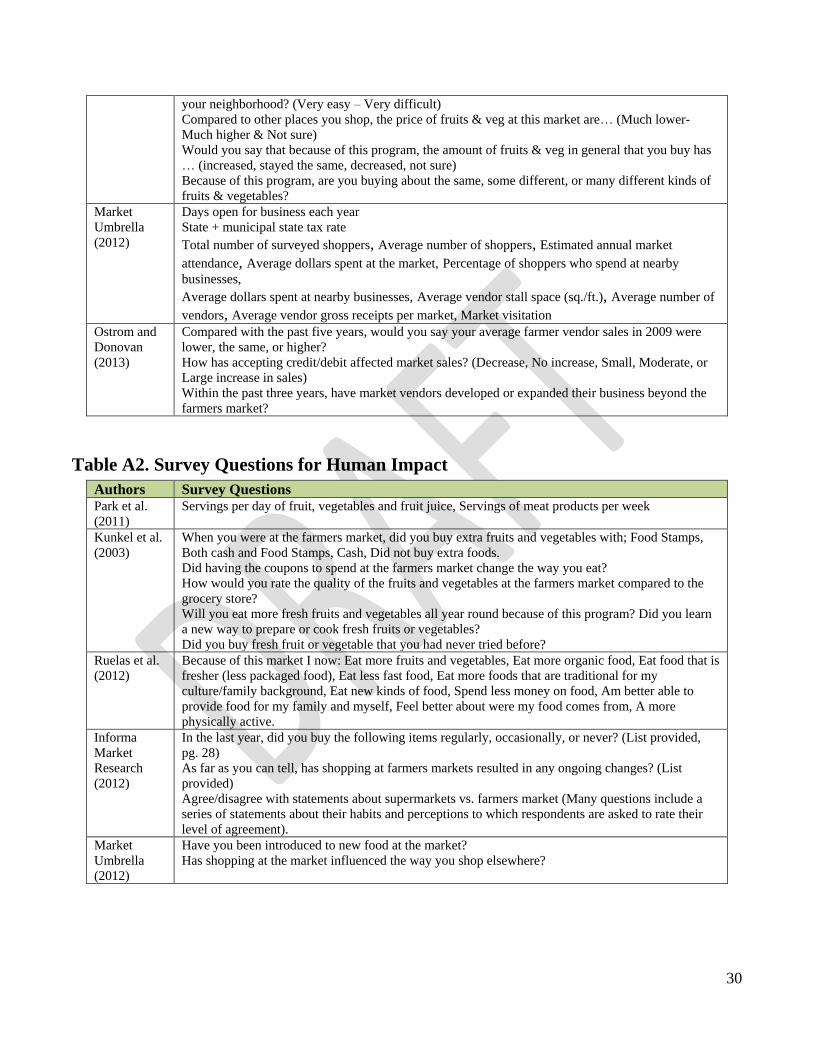
30
your neighborhood? (Very easy – Very difficult)
Compared to other places you shop, the price of fruits & veg at this market are… (Much lower-
Much higher & Not sure)
Would you say that because of this program, the amount of fruits & veg in general that you buy has
… (increased, stayed the same, decreased, not sure)
Because of this program, are you buying about the same, some different, or many different kinds of
fruits & vegetables?
Market
Umbrella
(2012)
Days open for business each year State + municipal state tax rate Total number of surveyed shoppers, Average number of shoppers, Estimated annual market
attendance, Average dollars spent at the market, Percentage of shoppers who spend at nearby
businesses, Average dollars spent at nearby businesses, Average vendor stall space (sq./ft.), Average number of
vendors, Average vendor gross receipts per market, Market visitation
Ostrom and
Donovan
(2013)
Compared with the past five years, would you say your average farmer vendor sales in 2009 were
lower, the same, or higher? How has accepting credit/debit affected market sales? (Decrease, No increase, Small, Moderate, or
Large increase in sales) Within the past three years, have market vendors developed or expanded their business beyond the
farmers market?
Table A2. Survey Questions for Human Impact
Authors Survey Questions Park et al.
(2011) Servings per day of fruit, vegetables and fruit juice, Servings of meat products per week
Kunkel et al.
(2003) When you were at the farmers market, did you buy extra fruits and vegetables with; Food Stamps,
Both cash and Food Stamps, Cash, Did not buy extra foods. Did having the coupons to spend at the farmers market change the way you eat? How would you rate the quality of the fruits and vegetables at the farmers market compared to the
grocery store? Will you eat more fresh fruits and vegetables all year round because of this program? Did you learn
a new way to prepare or cook fresh fruits or vegetables? Did you buy fresh fruit or vegetable that you had never tried before?
Ruelas et al.
(2012) Because of this market I now: Eat more fruits and vegetables, Eat more organic food, Eat food that is
fresher (less packaged food), Eat less fast food, Eat more foods that are traditional for my
culture/family background, Eat new kinds of food, Spend less money on food, Am better able to
provide food for my family and myself, Feel better about were my food comes from, A more
physically active. Informa
Market
Research
(2012)
In the last year, did you buy the following items regularly, occasionally, or never? (List provided,
pg. 28)
As far as you can tell, has shopping at farmers markets resulted in any ongoing changes? (List
provided)
Agree/disagree with statements about supermarkets vs. farmers market (Many questions include a
series of statements about their habits and perceptions to which respondents are asked to rate their
level of agreement).
Market
Umbrella
(2012)
Have you been introduced to new food at the market?
Has shopping at the market influenced the way you shop elsewhere?
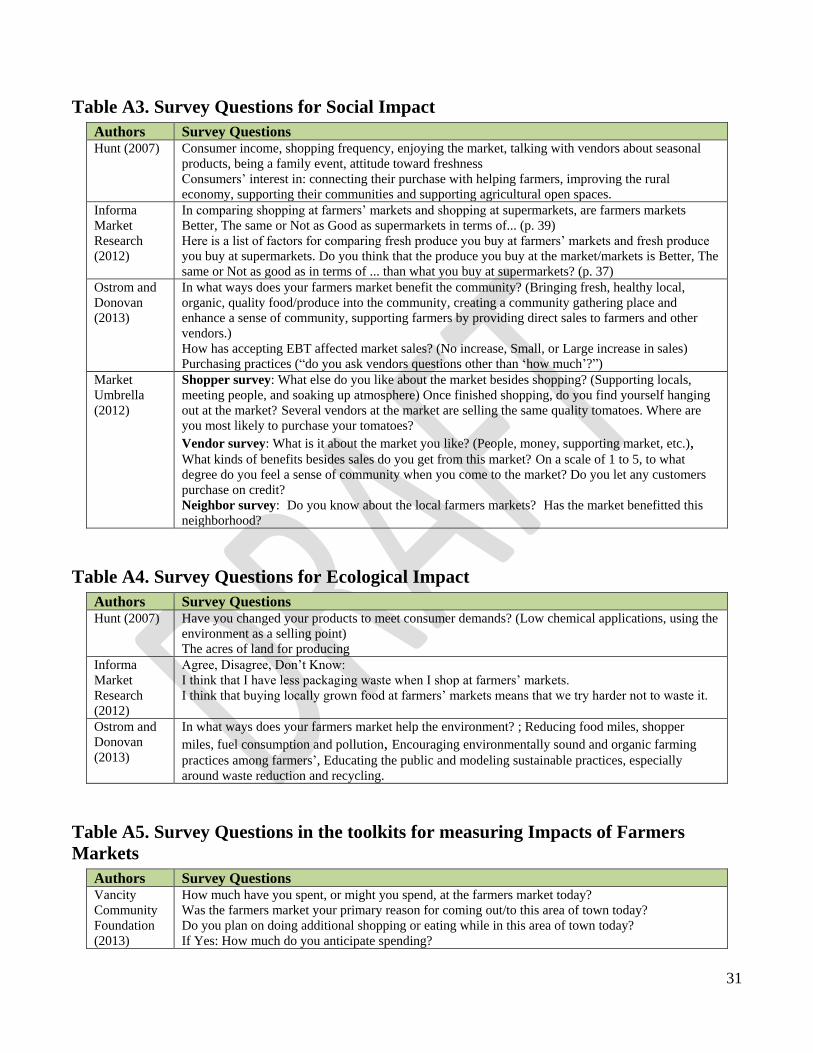
31
Table A3. Survey Questions for Social Impact
Authors Survey Questions Hunt (2007) Consumer income, shopping frequency, enjoying the market, talking with vendors about seasonal
products, being a family event, attitude toward freshness Consumers’ interest in: connecting their purchase with helping farmers, improving the rural
economy, supporting their communities and supporting agricultural open spaces. Informa
Market
Research
(2012)
In comparing shopping at farmers’ markets and shopping at supermarkets, are farmers markets
Better, The same or Not as Good as supermarkets in terms of... (p. 39)
Here is a list of factors for comparing fresh produce you buy at farmers’ markets and fresh produce
you buy at supermarkets. Do you think that the produce you buy at the market/markets is Better, The
same or Not as good as in terms of ... than what you buy at supermarkets? (p. 37)
Ostrom and
Donovan
(2013)
In what ways does your farmers market benefit the community? (Bringing fresh, healthy local,
organic, quality food/produce into the community, creating a community gathering place and
enhance a sense of community, supporting farmers by providing direct sales to farmers and other
vendors.) How has accepting EBT affected market sales? (No increase, Small, or Large increase in sales) Purchasing practices (“do you ask vendors questions other than ‘how much’?”)
Market
Umbrella
(2012)
Shopper survey: What else do you like about the market besides shopping? (Supporting locals,
meeting people, and soaking up atmosphere) Once finished shopping, do you find yourself hanging
out at the market? Several vendors at the market are selling the same quality tomatoes. Where are
you most likely to purchase your tomatoes? Vendor survey: What is it about the market you like? (People, money, supporting market, etc.), What kinds of benefits besides sales do you get from this market? On a scale of 1 to 5, to what
degree do you feel a sense of community when you come to the market? Do you let any customers
purchase on credit? Neighbor survey: Do you know about the local farmers markets? Has the market benefitted this
neighborhood?
Table A4. Survey Questions for Ecological Impact
Authors Survey Questions Hunt (2007) Have you changed your products to meet consumer demands? (Low chemical applications, using the
environment as a selling point) The acres of land for producing
Informa
Market
Research
(2012)
Agree, Disagree, Don’t Know:
I think that I have less packaging waste when I shop at farmers’ markets.
I think that buying locally grown food at farmers’ markets means that we try harder not to waste it.
Ostrom and
Donovan
(2013)
In what ways does your farmers market help the environment? ; Reducing food miles, shopper
miles, fuel consumption and pollution, Encouraging environmentally sound and organic farming
practices among farmers’, Educating the public and modeling sustainable practices, especially
around waste reduction and recycling.
Table A5. Survey Questions in the toolkits for measuring Impacts of Farmers
Markets
Authors Survey Questions Vancity
Community
Foundation
(2013)
How much have you spent, or might you spend, at the farmers market today? Was the farmers market your primary reason for coming out/to this area of town today? Do you plan on doing additional shopping or eating while in this area of town today? If Yes: How much do you anticipate spending?
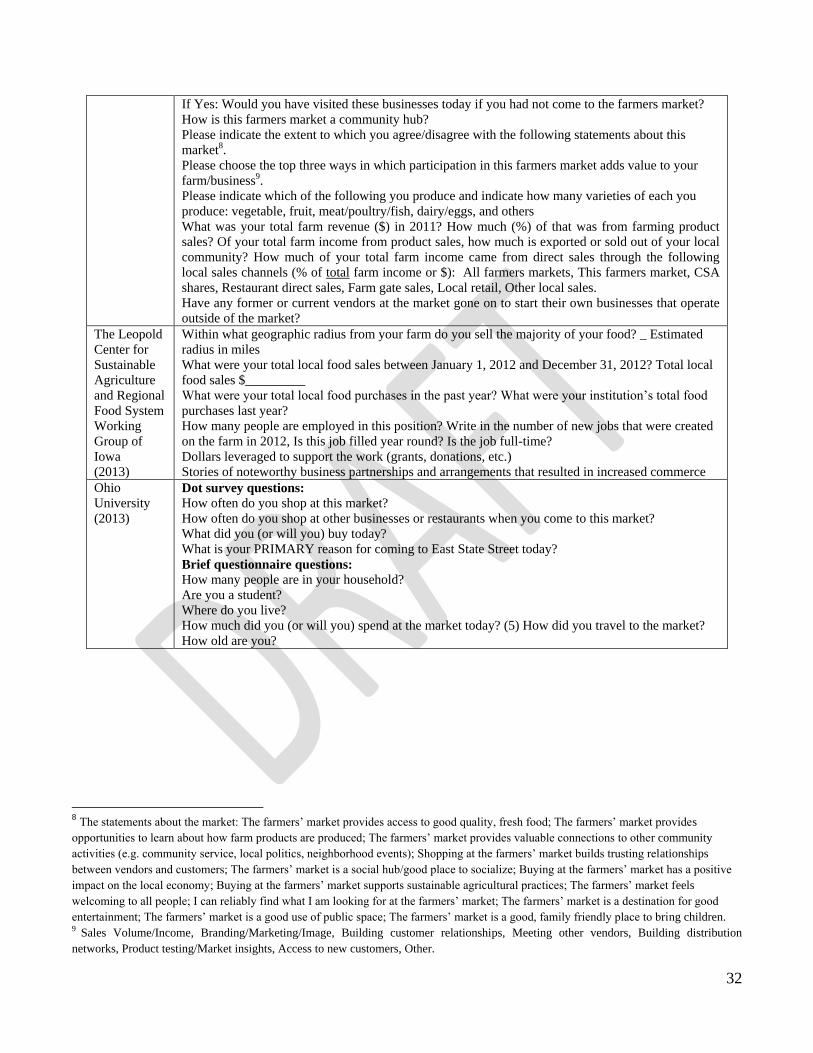
32
If Yes: Would you have visited these businesses today if you had not come to the farmers market? How is this farmers market a community hub? Please indicate the extent to which you agree/disagree with the following statements about this
market8. Please choose the top three ways in which participation in this farmers market adds value to your
farm/business9. Please indicate which of the following you produce and indicate how many varieties of each you
produce: vegetable, fruit, meat/poultry/fish, dairy/eggs, and others
What was your total farm revenue ($) in 2011? How much (%) of that was from farming product
sales? Of your total farm income from product sales, how much is exported or sold out of your local
community? How much of your total farm income came from direct sales through the following
local sales channels (% of total farm income or $): All farmers markets, This farmers market, CSA
shares, Restaurant direct sales, Farm gate sales, Local retail, Other local sales. Have any former or current vendors at the market gone on to start their own businesses that operate
outside of the market? The Leopold
Center for
Sustainable
Agriculture
and Regional
Food System
Working
Group of
Iowa (2013)
Within what geographic radius from your farm do you sell the majority of your food? _ Estimated
radius in miles What were your total local food sales between January 1, 2012 and December 31, 2012? Total local
food sales $_________ What were your total local food purchases in the past year? What were your institution’s total food
purchases last year? How many people are employed in this position? Write in the number of new jobs that were created
on the farm in 2012, Is this job filled year round? Is the job full-time? Dollars leveraged to support the work (grants, donations, etc.) Stories of noteworthy business partnerships and arrangements that resulted in increased commerce
Ohio
University
(2013)
Dot survey questions:
How often do you shop at this market?
How often do you shop at other businesses or restaurants when you come to this market?
What did you (or will you) buy today?
What is your PRIMARY reason for coming to East State Street today?
Brief questionnaire questions:
How many people are in your household?
Are you a student?
Where do you live?
How much did you (or will you) spend at the market today? (5) How did you travel to the market?
How old are you?
8 The statements about the market: The farmers’ market provides access to good quality, fresh food; The farmers’ market provides
opportunities to learn about how farm products are produced; The farmers’ market provides valuable connections to other community
activities (e.g. community service, local politics, neighborhood events); Shopping at the farmers’ market builds trusting relationships
between vendors and customers; The farmers’ market is a social hub/good place to socialize; Buying at the farmers’ market has a positive
impact on the local economy; Buying at the farmers’ market supports sustainable agricultural practices; The farmers’ market feels
welcoming to all people; I can reliably find what I am looking for at the farmers’ market; The farmers’ market is a destination for good
entertainment; The farmers’ market is a good use of public space; The farmers’ market is a good, family friendly place to bring children. 9 Sales Volume/Income, Branding/Marketing/Image, Building customer relationships, Meeting other vendors, Building distribution
networks, Product testing/Market insights, Access to new customers, Other.

33
Appendix B. Glossary of Terms
Impact
Impacts are the broader changes that occur within the community related to its economic status,
individual and community health, and/or natural environment as a result of program outcomes. Impacts
also define which group(s) are affected—vendors, shoppers, neighboring businesses, project partners,
etc. In many cases, impacts will be experienced by more than one group.
Indicator
An indicator compares a metric with a baseline or expected result, providing information on the state of,
or change in, the people, places, or systems that are being measured. It provides evidence that a certain
condition exists, or that certain results have (or have not) been achieved, enabling decision-makers to
measure progress toward the achievement of intended goals, outputs, or outcomes.
Methodology
Methodology refers to the research strategy that defines how data is collected and analyzed.
Quantitative data collection methods are used for that which can be precisely measured like
counting shoppers or numbers of SNAP sales per day and may include paper or video
interviews, online surveys, pre-and post-tests, clinical measurements, observation checklists,
or review of existing records.
Qualitative methods capture characteristics of what is being observed such as a market
neighbor’s perception of the market, personal experience of vendors. They may include paper
or video interviews, dot surveys, focus groups, open-ended survey questions, case studies,
field notes, and review of meeting minutes or news articles.
Metric
A metric compares two or more specific units of measurement, often expressed as {Number of X} per
{Unit of time or space}. In a market context, a metric might be expressed as “Total producer sales per
year” or “Total shopper visits per day.” Metrics might also be represented as percentages, increases, or
decreases; when two or more metrics are compared (for example “Total producer sales this year” and
“Total producer sales last year”), they are interpreted as indicators of change in producer income.
Outcome
An outcome is the short-term and intermediate change that occurs in learners, visitors, program
participants, etc., as a result of the activity, program or experience. Examples include acquisition of
skills or knowledge, a change in behavior or policy, or overall improvement to social, environmental,
economic, or civic conditions. When distinguishing between outputs and outcomes, it is helpful to think
of outcomes as the difference your outputs made in the community, which may take a year or more to
effectively measure.

34
Output
An output is the accomplishment of an activity or creation of a product, which can be described or
quantified. Examples of outputs might include a publication created, a workshop hosted, the number of
participants in an activity, or establishment of a new partnership.