ECONOMIC GEOLOGY AND THE BULLETIN OF THE SOCIETY OF ECONOMIC GEOLOGISTS Analysis of Supergene...
30
ECONOMIC GEOLOGY AND THE BULLETIN OF THE SOCIETY OF ECONOMIC GEOLOGISTS VOL. 80 AUGUST, 1985 NO. 5 Analysis of Supergene Ore-FormingProcesses and Ground-Water Solute Transport Using MassBalance Principles GEORGEH BRIMHALL, CHARLESN. ALPERS, AND ARIC B. CUNNINGHAM* Department of Geology and Geophysics, University of California, Berkeley, California94720 Abstract Analysis of metal distribution in weathering profilesdeveloped above ore deposits provides a simple anddirectmethod to determine the geologic controls on surficial leaching and enrichment of metals by supergene (descending) fluids. This approach offers an understanding of the interrelationships of metal concentration, zone thicknesses, and bulk- rock density of the various zones within a weathered-rock column. Analytical solutions to mass balance equations provide expressions describing the chemical evolutionpaths of enrichment blanket metal grade, b, in termsof original protoremetal grade,p, leached- zonemetal grade,1, andthe ratio of total leached-zone column heightto blanketthickness, LPr/B. Neglecting density terms for the sake of simplicity, this function is expressed as: b= p+ (p - 1). Linear data arrays in the coordinate system b versus (p - 1) for groups of drill holes in individual geologic domains, e.g., wall-rock types, strongly suggest that enrichment blanket metal grades evolve froma protore metal grade, p, with a fairlyconstant slope of I-Pr/B to a final value, b, determined by the extentof metalleaching in the zoneof oxidation. The constancy of theratio I-Pr/B within geologic domains indicates a simultaneous deepening of the zone of oxidation and thickening of the enrichment blanket under conditions of a descending ground-water table. Analysis of metal mass balance in drilling profiles also provides a means of reconstructing paleosurficial topography at the time of activeoxidation even in highly erodedterrains. Application of thesemethods usingrock densityand assay data from the Butte districtof Montana shows the palco-oxidation surface to have beeneroded by asmuch as450 ft down to the present unconformity between weathered bedrock and overlying Tertiary gravels. Geomorphic stability andslow erosion rates often thought necessary for effective chemical weathering are thereforequestioned. We propose instead a generalbalance of rates of erosion and descent of the ground-water table for optimalenrichment. Preservation of the fossil weathering profiles occurs by submergence of the zone of oxidation below the palcoground-water table resulting in cessation of supergene oxidation and preservation of the blanket. The mass balance methods derivedin this studyalso relate overallleaching e•ciency to protore characteristics, showing a strong hypogene alteration control at Butte asdescribed by McClave (1973). Lateralcopper transport is evaluated by identifying local anomalies in the computed oxidation surface. Zones of copper introduction nearfaults and zones of high permeability appear as apparent topographic highs whereas zones of depletion appear as topographic depressions. Preliminary analysis of this type at the porphyry copper deposit at La Escondida, Chile, indicates deeper oxidation andleaching effects thanat Butte.The assumption of vertically homogeneous protorecoppergrades leads to the conclusion that erosion of at least200 m * Present address: Sohio Alaska Petroleum Company, Development Geoscience Division, Tudor Park Building, Anchorage, Alaska 99502. 0361-0128/85/425/1227-30$ 2..50 122 7
-
Upload
independent -
Category
Documents
-
view
2 -
download
0
Transcript of ECONOMIC GEOLOGY AND THE BULLETIN OF THE SOCIETY OF ECONOMIC GEOLOGISTS Analysis of Supergene...
ECONOMIC GEOLOGY AND THE
BULLETIN OF THE SOCIETY OF ECONOMIC GEOLOGISTS
VOL. 80 AUGUST, 1985 NO. 5
Analysis of Supergene Ore-Forming Processes and Ground-Water Solute Transport Using Mass Balance Principles
GEORGE H BRIMHALL, CHARLES N. ALPERS, AND ARIC B. CUNNINGHAM*
Department of Geology and Geophysics, University of California, Berkeley, California 94720
Abstract
Analysis of metal distribution in weathering profiles developed above ore deposits provides a simple and direct method to determine the geologic controls on surficial leaching and enrichment of metals by supergene (descending) fluids. This approach offers an understanding of the interrelationships of metal concentration, zone thicknesses, and bulk- rock density of the various zones within a weathered-rock column. Analytical solutions to mass balance equations provide expressions describing the chemical evolution paths of enrichment blanket metal grade, b, in terms of original protore metal grade, p, leached- zone metal grade, 1, and the ratio of total leached-zone column height to blanket thickness, LPr/B. Neglecting density terms for the sake of simplicity, this function is expressed as:
b = p + (p - 1). Linear data arrays in the coordinate system b versus (p - 1) for groups of drill holes in individual geologic domains, e.g., wall-rock types, strongly suggest that enrichment blanket metal grades evolve from a protore metal grade, p, with a fairly constant slope of I-Pr/B to a final value, b, determined by the extent of metal leaching in the zone of oxidation. The constancy of the ratio I-Pr/B within geologic domains indicates a simultaneous deepening of the zone of oxidation and thickening of the enrichment blanket under conditions of a descending ground-water table.
Analysis of metal mass balance in drilling profiles also provides a means of reconstructing paleosurficial topography at the time of active oxidation even in highly eroded terrains. Application of these methods using rock density and assay data from the Butte district of Montana shows the palco-oxidation surface to have been eroded by as much as 450 ft down to the present unconformity between weathered bedrock and overlying Tertiary gravels. Geomorphic stability and slow erosion rates often thought necessary for effective chemical weathering are therefore questioned. We propose instead a general balance of rates of erosion and descent of the ground-water table for optimal enrichment. Preservation of the fossil weathering profiles occurs by submergence of the zone of oxidation below the palcoground-water table resulting in cessation of supergene oxidation and preservation of the blanket. The mass balance methods derived in this study also relate overall leaching e•ciency to protore characteristics, showing a strong hypogene alteration control at Butte as described by McClave (1973). Lateral copper transport is evaluated by identifying local anomalies in the computed oxidation surface. Zones of copper introduction near faults and zones of high permeability appear as apparent topographic highs whereas zones of depletion appear as topographic depressions.
Preliminary analysis of this type at the porphyry copper deposit at La Escondida, Chile, indicates deeper oxidation and leaching effects than at Butte. The assumption of vertically homogeneous protore copper grades leads to the conclusion that erosion of at least 200 m
* Present address: Sohio Alaska Petroleum Company, Development Geoscience Division, Tudor Park Building, Anchorage, Alaska 99502.
0361-0128/85/425/1227-30$ 2..50 122 7
1228 BRIMHALL, ALPERS, AND CUNNINGHAM
of leached capping has occurred throughout much of the La Escondida district. Geologic domains defined by computed values of LPr/B correlate well with hypogene alteration zoning. Computation of the magnitude and direction of overall subsurface lateral metal fluxes indicates transport distances of at least 1 km in directions consistent with present surface topography and fracture patterns. There is a strong correlation of the thickest and highest grade enrichment zones with inferred positive lateral fluxes, whereas the most thoroughly leached cap rocks make up zones of inferred negative lateral flux which are likely source regions. Alternative explanations to the lateral flux hypothesis are evaluated, including assessment of variations in protore metal-grade projections, both in vertical and horizontal directions. Despite the approximations involved in the present calculations, the lateral flux pattern appears to be the most likely interpretation of the present metal distribution in the supergene system at La Escondida.
Introduction
THE knowledge that supergene oxidation processes affect a wide variety of metals has long been an integral part of successful base and precious metal exploration. For the most part though, concern has been with interpretation of gossans, limonitic leached outcrops, and relict sulfides to deduce the nature and zoning of original hypogene sulfide assemblages (Locke, 1926; Blanchard, 1968; Lowell and Guilbert, 1970; Loghry, 1972; Gustafson and Hunt, 1975; Blain and Andrew, 1977; J.P. Hunt and J. A. Bratt, unpub. data, 1981; Titley and Beane, 1981; Ander- son, 1982). Relatively few studies have addressed the broader scientific problems of enrichment pro- cesses by treating geological, hydrological, and cli- matological factors as well as postoxidation and erosional history (Emmons, 1918; Lindgren, 1933; Bateman, 1950; Titley, 1978; Bladh, 1982; Sanga- meshwar and Barnes, 1983). Despite some advances, many of the factors controlling and limiting oxidation proposed by Emmons (1918) and Bateman (1950) as the result of elegant thought experiments still remain. They have gone largely untested for lack of analytical methods with which to assess metal leach- ing and redeposition in terms of weathering processes and known patterns and rates of geomorphic evo- lution. Some notable exceptions include a deduction of rates of erosion in the Silver Bell district of
Arizona assuming an age of enrichment (Graybeal, 1982) and the qualitative estimation of lateral copper fluxes at the Castle Dome district of Arizona (Peter- son et al., 1951). Besides erosional effects, other controlling factors affecting enrichment as well as the state of preservation of enrichment blankets are: redox effects at the water table (Sato, 1960; Ander- son, 1982), climate, time, wall-rock characteristics, structure, burial, uplift, and submergence of the ground-water table by fluvial sedimentation (Bate- man, 1950). Assessment of the dominant controls on supergene behavior is therefore largely dependent upon successful reconstruction of the surficial envi- ronment as it existed during enrichment at some time in the geologic past. Notwithstanding oppor- tunities to observe surficial processes directly, the
present understanding of surficial enrichment sys- tems is ironically incomplete.
A number of questions remain which are addressed in this paper. What are the interrelationships be- tween metal concentrations in the various weathering zones? How is the depth of leaching related to the thickness of an enrichment blanket? Why do enrich- ment blankets attain a maximum metal grade and how is this grade related to the efficiency of leaching in various rock types? How can one determine rigorously the magnitude and direction of lateral metal transport? How much erosion has occurred in a given area? This last question is perhaps the most fundamental for purposes of reconstructing the sur- face environment.
A far-reaching suggestion was made by Emmons in 1918 (p. 153) on how to estimate the vertical extent of the portion of an ore deposit that has been eroded since oxidation. This technique utilized a fundamental principle in geochemistry, i.e., conser- vation of mass of chemical elements. By considering the metal grades of copper in the leached zone, the enrichment blanket, and the protore in conjunction with the present thickness of blanket and leached zones, Emmons presented a formula to compute the amount of erosion in a given vertical profile as a "rude approximation," using the principle of the conservation of mass. In retrospect, however, without taking into consideration rock density variations in weathering profiles nor primary vertical-zoning ef- fects, the estimates of erosion and of original leached- zone column height would necessarily be crude, but the concept was nevertheless valid and definitely worth pursuing. A somewhat analogous approach using mass balance of geochemical profiles of nickel, cobalt, and iron has been used in a study of nickel laterite deposits (Golightly, 1981). By considering a large group of adjacent profiles, mass balance cal- culations give an indication of the original amount of rock represented by the in situ weathered chem- ical profiles. In the present study we develop a general analytical method also utilizing mass balance principles. Sufficient geologic information that ac- counts for complexities in primary district zoning is incorporated into the equations in order to make
MASS BALANCE PRINCIPLES APPLIED TO ORE-FORMING PROCESSES 1229
the results as accurate as possible. Using drilling data, reconstructions are made of paleosurficial to- pography at the time of active oxidation and enrich- ment, thus providing the necessary framework in which to assess the questions posed above.
Once the effects of postoxidation erosion are accounted for, the most significant questions ad- dressed with this approach deal with the nature and level of exposure of the fossil hydrothermal system when supergene oxidation, leaching, and enrichment were initiated. For example, in the case of porphyry copper deposits, consider the following questions. Is an altered sulfide-poor volcanic edifice removed by erosional processes of an essentially mechanical nature, thus ultimately exposing protore sulfides to oxidizing ground water and thereby initiating a transition to composite chemical and mechanical weathering and subsurface redistribution of metals? If so, what initiates sulfide oxidation? Is it simply a function of exposing sulfide-grain surfaces to suffi- cient amounts of oxygenated fluids? Once enrichment begins, is there a necessary balance between rates of surface erosion, surface runoff, ground-water fluxes, and rates of chemical reaction? What roles do the ground-water table and overlying capillary fringe zone play in oxidation and enrichment? What factors determine the efficiency with which super- gene processes transport metals?
To begin to answer such broad questions we must consider the present state of remobilization of chem- ical elements in weathering profiles in relation to their initial or antecedent state before supergene modification. In this context we use the term protore (proto-ore) to describe all the previous mineralization effects which occurred before weathering processes. Two field areas have been chosen for this purpose: Butte, Montana, and La Escondida, Chile. These two porphyry copper districts present ideal and complementary opportunities to gain insight into copper-enrichment processes. Butte is a large district in which the geology has been well described. The geochronology, zoning, protore characteristics, and structure are well understood. This effort is facilitated
by the homogeneous nature of the Butte quartz monzonite wall rock. In contrast, La Escondida, a newly discovered deposit also of world-class size, has only been drilled at the exploration and pre- development stage. By applying our methods early in the history of development of this orebody, we have an ideal opportunity to realize the practical utility of applying such techniques as an exploration project develops. Our methods also provide a basis for focusing further research and exploration in the La Escondida district and they contribute toward a conceptual exploration model for supergene deposits in other settings.
The approach developed is applicable to a variety of rocks that have undergone chemical weathering.
A great number of elements may be treated in this manner, regardless of whether they occur as primary sulfides or simply as constituents in rock-forming minerals, e.g., silicates. For example, it is known that deep lateritic weathering can concentrate Cr, Co, Cu, A1, and Ni regardless of the presence of primary sulfides (Grubb, 1979; Butt and Nickel, 1981; Elias et al., 1981). Although the approach taken here is general, we concentrate in this effort on weathering of copper sulfide-bearing protores.
Analytical Method
Metal mass balance arguments offer the most direct evidence that the nature of supergene ore- forming processes is a redistributive phenomena. There is no doubt as to the source of water involved
nor to the presupergene source of metals that have undergone transport and redistribution. The fluids are exclusively meteoric in origin. The metals are emplaced in a protore by primary processes which may be igneous, sedimentary, or hydrothermal in nature. In this paper we are concerned only with the secondary redistribution of a metal or group of metals among the various weathering zones in an ore deposit. For this purpose, we must develop a terminology and formalism for variables in the mass balance analysis because none exists in the current literature. Table 1 is a list of symbols. The mass of a given metal in each of the zones is a function of: (1) concentration, e.g., wt percent copper in a leached capping, (2) the thickness of each weathering zone, and (3) the bulk-rock density of each zone, given in g per cm 3. A vertical cross section (Fig. 1) shows a reference column in which supergene metal redistribution has occurred. For purposes of discus- sion, its cross section is i cm 2. Since we are con- cerned with the principle of conservation of mass, we are necessarily interested also in density, defined as mass per unit volume. The volume is given by the cross-sectional area (1 cm 2) times the height of a column. Thus the mass of rock per cm • of column is equal to rock density times column height. To evaluate the mass balance of a given chemical element in a rock we must consider the
concentration of that element in each weathering zone of the rock column. As shown in Figure 2, which depicts a leached zone, enrichment blanket, and protore, the necessary variables to describe metal mass are: three metal grades in wt percent (1, b, and p, for leached zone, enrichment blanket, and protore, respectively), three density terms (t•, t•p) in g per cm 3, and two distance parameters (I-,r and B) where I-,r refers to the total leached zone of the column above the top of secondary sulfides and B refers to the enrichment blanket thickness. In this
simplest example it is assumed that the metal grades 1, b, and p as well as the densities t•, t•b, and t•v are constants in a single vertical column but may vary

1230 BRIMHALL, ALPERS, AND CUNNINGHAM
TABLE 1. List of Symbols
Symbol Description Units
1 b
P•
Pb
Po B
L
L½ L•
EGRAV
ETB
EBB
EBH
TDS
PWT
TSO4 EL
Bmax Closed or "no-flux" system
Open system
flux
flUX 0
flUX3,300
0 Pete
bo b• Co
Cl
d• eo
el
pø Op ø
a and •
Average metal grade within leached capping Average metal grade within enrichment blanket Average metal grade within protore Average rock density of leached capping Average rock density of enrichment blanket Average rock density of protore Enrichment blanket thickness
Leach capping zone Current leached capping-zone column height Eroded leached-zone column height Open-system total leached-zone column height Total leached-zone column height assuming a closed
system, i.e., zero lateral flux Topographic surface constructed from LPr column
heights plus elevation of top of blanket Length ratio of total leached-zone column height to
blanket thickness
Elevation at base of gravels Elevation at top of enrichment blanket Elevation at base of enrichment blanket Elevation at bottom of a drill hole
Elevation at top of dominant sulfides (base of significant oxidation)
Elevation of present water table Elevation at top of Ca sulfates (gypsum, anhydrite) Leaching efficiency: percent removal of original protore
metal grade Maximum attainable closed-system blanket grade Chemical system defined assuming no material exchange
with surroundings, i.e., no lateral fluxes or basal discharge
Chemical system defined with provision for material exchange with surroundings
Flux of ore metal transported laterally Flux of ore metal transported laterally, assuming no
leaching of rocks other than preserved leached capping
Flux of ore metal transported laterally, assuming leaching of rocks from 3,300om elevation to ETB
Protore metal grade necessary to explain present metal distribution with no lateral flux and no leaching of rocks other than preserved leached capping; calc -- calculated
Protore metal grade necessary to explain present metal distribution with no lateral flux and leaching of rocks from 3,300-m elevation to ETB
Regression coefficients to drill hole data; subscript 0 refers to y-intercept, 1 refers to slope
Ore metal grade at sea level Ore metal rate of change with elevation Blanket density at sea level Blanket density rate of change with elevation Leached-zone density at sea level Leached-zone density rate of change with elevation Protore density at sea level Protore density rate of change with elevation Leached-zone ore metal grade at sea level Leached-zone metal grade rate of change with elevation Projected protore metal grade at EBB using regression Projected protore density at EBB using regression Projected leached-zone density at EGRAV using
regression Two-cycle enrichment processes, a being the first,/• the
second; they apply to all time-dependent variables in mass balance expressions
Weight percent metal Weight percent metal Weight percent metal Grams of rock per cm a Grams of rock per cm a Grams of rock per cm a Distance, e.g., feet or meters
Distance
Distance
Distance
Distance
Distance (elevation)
Unitless number
Distance (elevation) Distance (elevation) Distance (elevation) Distance (elevation) Distance (elevation)
Distance (elevation) Distance (elevation) Percent
Weight percent metal
Grams metal per cm 2 Grams metal per cm 2
Grams metal per cm •
Weight percent metal
Weight percent metal
See below
Weight percent metal Weight percent metal per distance Grams per cm a Grams per cm a per distance Grams per cm a Grams per cm a per distance Grams per cm a Grams per cm a per distance Weight percent metal Weight percent metal per distance Weight percent metal Grams per cm a Grams per cm a
MASS BALANCE PRINCIPLES APPLIED TO ORE-FORMING PROCESSES 12 31
TABLE 1--(Continued)
Symbol Description Units
hc Capillary fringe zone height -dz
E, dt Erosion rate Distance per unit time t Time Time
U Uplift rate Distance per unit time W Ground-water table
Wo Initial elevation of the ground-water table at start of Distance (elevation) oxidation
dW Time rate of change of the ground-water table Distance per unit time dt
z or Z (in figures) Elevation Distance (elevation)
laterally in adjacent columns. Obviously, geologic reality and zoning patterns may demand that some of these parameters will vary as well with elevation, but this initial simplified model 1 suffices for purposes of illustration. Additional geologic complexity will be incorporated in other models, discussed below.
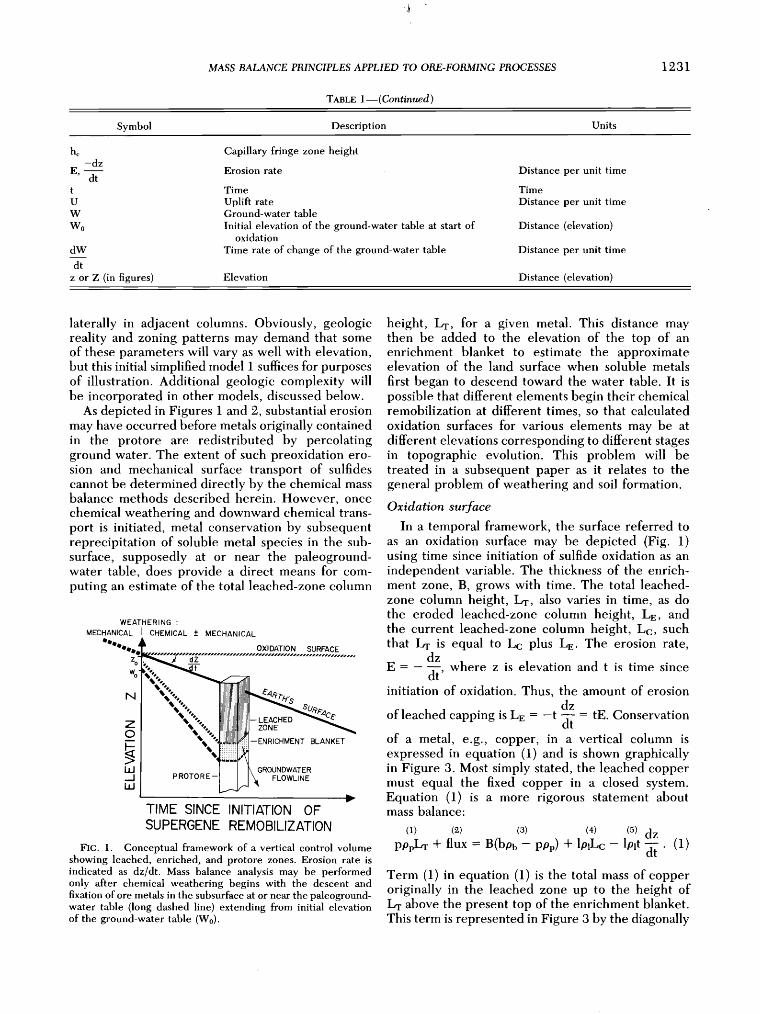
As depicted in Figures 1 and 2, substantial erosion may have occurred before metals originally contained in the protore are redistributed by percolating ground water. The extent of such preoxidation ero- sion and mechanical surface transport of sulfides cannot be determined directly by the chemical mass balance methods described herein. However, once chemical weathering and downward chemical trans- port is initiated, metal conservation by subsequent reprecipitation of soluble metal species in the sub- surface, supposedly at or near the palcoground- water table, does provide a direct means for com- puting an estimate of the total leached-zone column
WEATHERING :
MECHANICAL I CHEMICAL -+ MECHANICAL
OXIDATION SURFACE dZ
%-
r,q
LEACHED Z ZONE O
--ENRICHMENT BLANKET
LIJ GROUNDWATER ..J P ROT O R E - FLOWLI N E
TIME SINCE INITIATION OF SUPERGENE REMOBILIZATION
FIG. 1. Conceptual framework of a vertical control volume showing leached, enriched, and protore zones. Erosion rate is indicated as dz/dt. Mass balance analysis may be performed only after chemical weathering begins with the descent and fixation of ore metals in the subsurface at or near the palcoground- water table (long dashed line) extending from initial elevation of the ground-water table (W0).
height, LT, for a given metal. This distance may then be added to the elevation of the top of an enrichment blanket to estimate the approximate elevation of the land surface when soluble metals
first began to descend toward the water table. It is possible that different elements begin their chemical remobilization at different times, so that calculated oxidation surfaces for various elements may be at different elevations corresponding to different stages in topographic evolution. This problem will be treated in a subsequent paper as it relates to the general problem of weathering and soil formation.
Oxidation surface
In a temporal framework, the surface referred to as an oxidation surface may be depicted (Fig. 1) using time since initiation of sulfide oxidation as an independent variable. The thickness of the enrich- ment zone, B, grows with time. The total leached- zone column height, LT, also varies in time, as do the eroded leached-zone column height, Lz, and the current leached-zone column height, Lc, such that LT is equal to Lc plus Lz. The erosion rate,
dz
E- dt' where z is elevation and t is time since initiation of oxidation. Thus, the amount of erosion
dz
of leached capping is LE = -t • -- tE. Conservation of a metal, e.g., copper, in a vertical column is expressed in equation (1) and is shown graphically in Figure 3. Most simply stated, the leached copper must equal the fixed copper in a closed system. Equation (1) is a more rigorous statement about mass balance:
(1) (2) (3) (4) (5) dz pppLT q- flux = B(bpb - POp) q- lp•Lc - lplt -•. (1)
Term (1) in equation (1) is the total mass of copper originally in the leached zone up to the height of LT above the present top of the enrichment blanket. This term is represented in Figure 3 by the diagonally
1232 BRIMHALL, ALPERS, AND CUNNINGHAM
VERTICAL CONTROL VOLUME (NO N- DEFORMATIONAL SYSTEM)
DISTANCE METAL ROCK GRADE DENSITY
b .... - _
I cm
-- OXIDATION SURFACE -- PRESENT "
LEACHED CAPPING
ENRICHMENT BLANKET --
PROTOR E
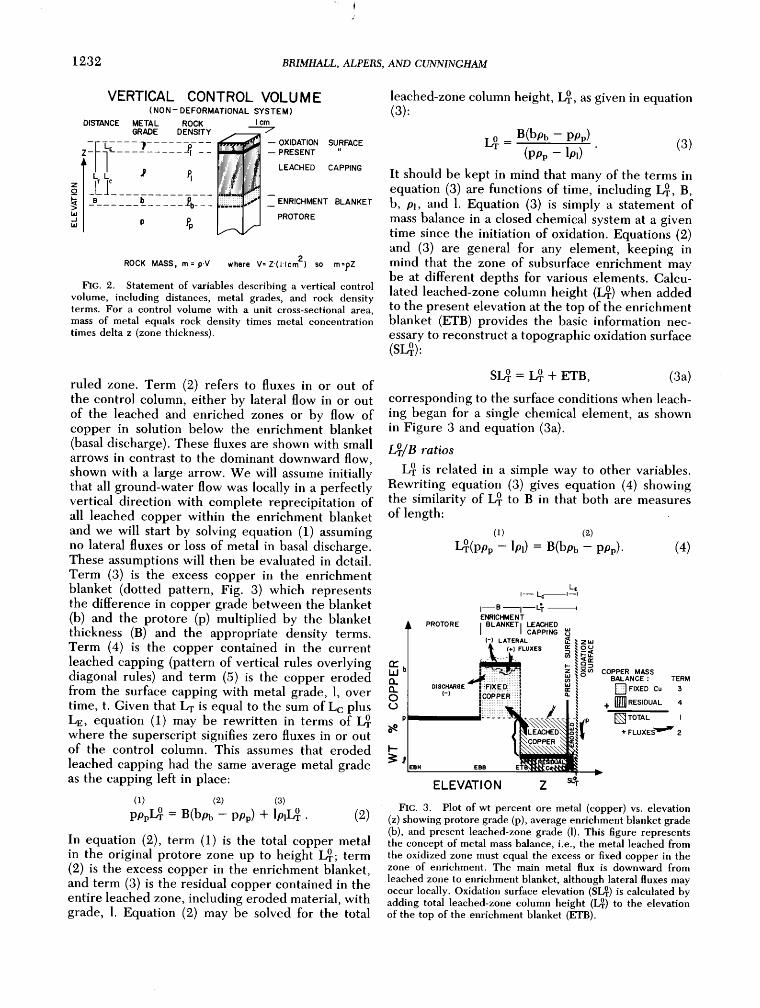
ROCK MASS, m=p.V where V=Z'(llcm 2) so rn=pZ FIG. 2. Statement of variables describing a vertical control
volume, including distances, metal grades, and rock density terms. For a control volume with a unit cross-sectional area, mass of metal equals rock density times metal concentration times delta z (zone thickness).
ruled zone. Term (2) refers to fluxes in or out of the control column, either by lateral flow in or out of the leached and enriched zones or by flow of copper in solution below the enrichment blanket (basal discharge). These fluxes are shown with small arrows in contrast to the dominant downward flow, shown with a large arrow. We will assume initially that all ground-water flow was locally in a perfectly vertical direction with complete reprecipitation of all leached copper within the enrichment blanket and we will start by solving equation (1) assuming no lateral fluxes or loss of metal in basal discharge. These assumptions will then be evaluated in detail. Term (3) is the excess copper in the enrichment blanket (dotted pattern, Fig. 3) which represents the difference in copper grade between the blanket (b) and the protore (p) multiplied by the blanket thickness (B) and the appropriate density terms. Term (4) is the copper contained in the current leached capping (pattern of vertical rules overlying diagonal rules) and term (5) is the copper eroded from the surface capping with metal grade, 1, over time, t. Given that LT is equal to the sum of Lc plus LE, equation (1) may be rewritten in terms of LPr where the superscript signifies zero fluxes in or out of the control column. This assumes that eroded leached capping had the same average metal grade as the capping left in place:
(•) (2) (3)
pppLPr = B(bpb -- POp) 4- lplLP r . (2)
In equation (2), term (1) is the total copper metal in the original protore zone up to height LPr; term (2) is the excess copper in the enrichment blanket, and term (3) is the residual copper contained in the entire leached zone, including eroded material, with grade, 1. Equation (2) may be solved for the total
leached-zone column height, LPr, as given in equation (3):
LPr = B(bob - POp) (POp -- lpl) (3) It should be kept in mind that many of the terms in equation (3) are functions of time, including LPr, B, b, pl, and 1. Equation (3) is simply a statement of mass balance in a closed chemical system at a given time since the initiation of oxidation. Equations (2) and (3) are general for any element, keeping in mind that the zone of subsurface enrichment may be at different depths for various elements. Calcu- lated leached-zone column height (LPr) when added to the present elevation at the top of the enrichment blanket (ETB) provides the basic information nec- essary to reconstruct a topographic oxidation surface (SlA):
SLPr: I•r + ETB, (3a) corresponding to the surface conditions when leach- ing began for a single chemical element, as shown in Figure 3 and equation (3a).
L•/B ratios LPr is related in a simple way to other variables.
Rewriting equation (3) gives equation (4) showing the similarity of L•r to B in that both are measures of length:
(1) (2)
LPr(ppp -- lp.) = B(bpb -- POp). (4)
ENRICHMENT
PROTORE I BLANKETI LEACHED CAPPING
,,,, ,.•LUXE$ ' • •m C•PER M•S
(-I [COPPER ::•
+ VLUXE$ ,
ELEY•T• 0 N Z
FIG. 3. Plot of wt percent ore metal (copper) vs. elevation (z) showing protore grade (p), average enrichment blanket grade (b), and present leached-zone grade (1). This figure represents the concept of metal mass balance, i.e., the metal leached from the oxidized zone must equal the excess or fixed copper in the zone of enrichment. The main metal flux is downward from
leached zone to enrichment blanket, although lateral fluxes may occur locally. Oxidation surface elevation (SLPr) is calculated by adding total leached-zone column height (LPr) to the elevation of the top of the enrichment blanket (ETB).
MASS BALANCE PRINCIPLES APPLIED TO ORE-FORMING PROCESSES 1233
Term (1) in equation (4) is simply the product of total leached-zone column height times the differ- ence in metal grade between the protore and the leached capping, modified by density terms. The metal grade for this leached copper is p - 1 as shown in Figure 3. The rectangular area corresponding to term (1) must equal, in a closed system, the area of excess or fixed copper added to the enrichment blanket, term (2). The ratio of the widths of these two areas, the unitless number LPr/B, is a function which simultaneously relates b to p as well as p to 1, and thus carries information concerning both the extent of enrichment and the extent of leaching for a given control volume.
Blanket metal grade
In addition to finding the approximate position of the former oxidation surface, it is important to consider the factors controlling enrichment blanket metal grade, b. Solving equation (4) for b gives equation (5):
(]) (2)
Pb Pb
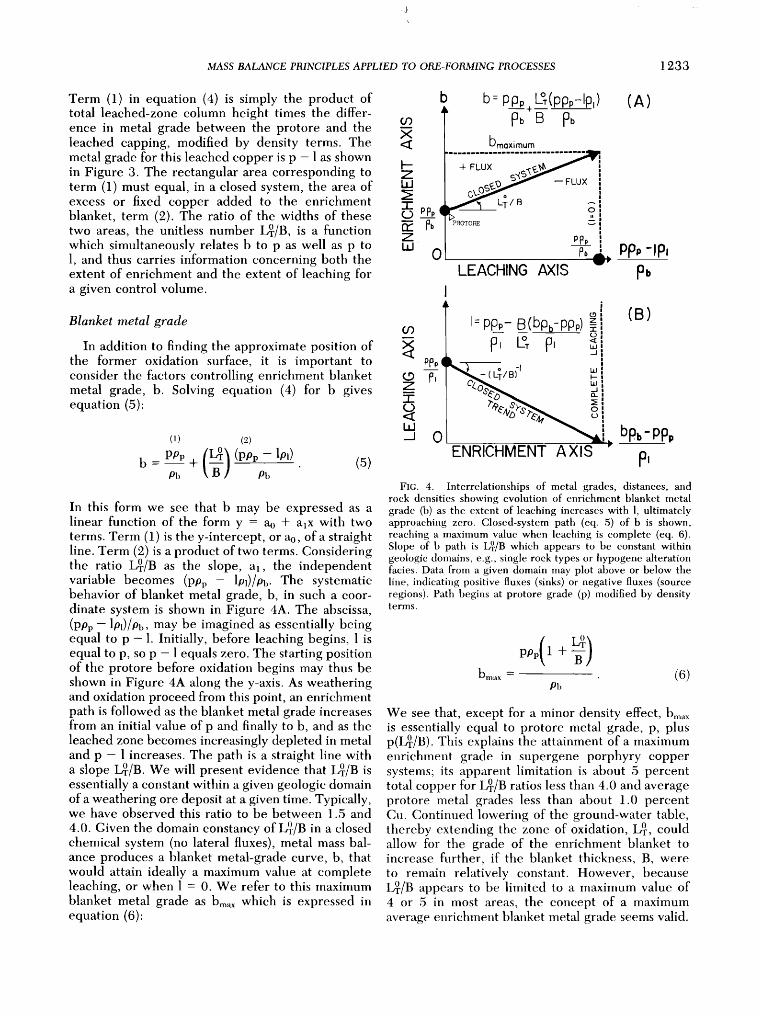
In this form we see that b may be expressed as a linear function of the form y = ao q- alx with two terms. Term (1) is the y-intercept, or ao, of a straight line. Term (2) is a product of two terms. Considering the ratio LøT/B as the slope, a•, the independent variable becomes (POp -- 101)/0b. The systematic behavior of blanket metal grade, b, in such a coor- dinate system is shown in Figure 4A. The abscissa, (POp -- 101)/0b, may be imagined as essentially being equal to p - 1. Initially, before leaching begins, 1 is equal to p, so p - 1 equals zero. The starting position of the protore before oxidation begins may thus be shown in Figure 4A along the y-axis. As weathering and oxidation proceed from this point, an enrichment path is followed as the blanket metal grade increases from an initial value of p and finally to b, and as the leached zone becomes increasingly depleted in metal and p - I increases. The path is a straight line with a slope LPr/B. We will present evidence that L•/B is essentially a constant within a given geologic domain of a weathering ore deposit at a given time. Typically, we have observed this ratio to be between 1.5 and
4.0. Given the domain constancy of LPr/B in a closed chemical system (no lateral fluxes), metal mass bal- ance produces a blanket metal-grade curve, b, that would attain ideally a maximum value at complete leaching, or when 1 = 0. We refer to this maximum blanket metal grade as bmax which is expressed in equation (6):
g
0
b b = ppp + L(ppp-lpl ) B pb
bmoximum
....... O SAy -- FLUX
LEACHING AXIS
(A)
PPp PP,-IP,
ENRICHMENT AXIS
(B)
bp-pp. pI
FIG. 4. Interrelationships of metal grades, distances, and rock densities showing evolution of enrichment blanket metal grade (b) as the extent of leaching increases with 1, ultimately approaching zero. Closed-system path (eq. 5) of b is shown, reaching a maximum value when leaching is complete (eq. 6). Slope of b path is LPr/B which appears to be constant within geologic domains, e.g., single rock types or hypogene alteration facies. Data from a given domain may plot above or below the line, indicating positive fluxes (sinks) or negative fluxes (source regions). Path begins at protore grade (p) modified by density terms.
b .... = (6) Pl)
We see that, except for a minor density effect, b ... is essentially equal to protore metal grade, p, plus p(LPr/B). This explains the attainment of a maximum enrichment grade in supergene porphyry copper systems; its apparent limitation is about 5 percent total copper for LPr/B ratios less than 4.0 and average protore metal grades less than about 1.0 percent Cu. Continued lowering of the ground-water table, thereby extending the zone of oxidation, LPr, could allow for the grade of the enrichment blanket to increase further, if the blanket thickness, B, were to remain relatively constant. However, because LPr/B appears to be limited to a maximum value of 4 or 5 in most areas, the concept of a maximum average enrichment blanket metal grade seems valid.

1234 BRIMHALL, ALPERS, AND CUNNINGHAM
We have shown a closed-system analysis of blanket metal-grade evolution in Figure 4A as a straight path proceeding away from the initial protore state to a final, rarely attained state of complete leaching in the oxidation zone. Open-system characteristics are also shown. Positive lateral metal fluxes into the blanket zone (metal sink areas) would occur above the closed-system line, with negative fluxes of metal source areas below.
Leached-zone metal grade
It is possible to derive an expression for leached- zone metal grade, 1, from equation (4) which is analogous to the expression for blanket grade, b, in that chemical evolution paths are shown for geologic domains with constant LPr/B. Equation (7) shows leached-zone metal grade, 1, as a function of a starting grade (p) or y-intercept, a slope which is the negative reciprocal of I_fir/B, and an independent variable, essentially (b - p), which represents the excess metal in the zone of enrichment:
1 -ppp (--•o) (bpb - ppp) (7) Pl Pl
This function is shown in Figure 4B, illustrating the end state of a closed system which attains a maximum blanket metal grade, bmax, when 1 is equal to zero and leaching is complete.
Leaching efficiency The efficiency of the leaching process for a given
control volume (e.g., drill hole) may be evaluated in terms of the percent removal of a certain metal from the leached capping zone. Of course, this presumes knowledge of the concentration of that metal before the leaching took place. Thus, we must examine the deepest penetrations in that area to get an idea of protore metal-grade variations before we can properly interpret the leached capping zone for that area. The leaching efficiency, E•., can be ex- pressed as:
metal retained in leached zone EL = 100 1 - m-•--•al o r i g• •-n 1 e a-•--h-d-ed z-•-ne
= 100(1 IplLT.'•. pppLT/ (s)
This expression can be simplified as shown in equa- tion (8a):
EL-- I \ •p . (8a) Note that the distance term • cancels out, so that EL is solely a function of protore and leached-zone grades and densities. Values for EL approach 100
for zones which are nearly completely leached, but they cannot exceed 100 because the product lpl will always be finite and positive. It is, however, possible for EL to be negative for the special case where lpl > ppp, as will be seen below for one anomalous area at La Escondida. This anomalous situation may be interpreted in terms of vertically inhomogeneous protore metal grades or alternatively in terms of a positive lateral flux into the leached zone, perhaps most commonly expressed in the form of exotic chrysocolla and other copper oxide mineralization.
Substituting equation (8a) into equation (5) gives equation (9), an expression for blanket metal grade, b, as a function of leaching efficiency, EL, shown graphically in Figure 5:
b = PPv + (I-fir'l( PPp ']EL pb •,-•-] •, l'•pb ] ' (9) This function shows a similarity to the linear behavior in Figure 4 with maximum blanket metal grade at 1 equal to zero and leaching efficiency equal to 100.
Estimation of subsurface lateral fluxes
In principle, by the use of equation (3), it should be possible to reconstruct the original oxidation surface using drilling data and surface contouring even in highly eroded areas. In certain instances, after reconstruction of the calculated original oxi- dation surface (SLPr), we recognize topographic fea- tures that are geologically unrealistic. These may be evaluated considering the possible causes of such apparent topographic anomalies (Fig. 6). There are four possible explanations: (1) real physical topog- raphy on the top of copper sulfides at the time of initiation of chemical weathering, (2) lateral metal fluxes into or out of these anomalous areas, (3)
bmaxlmum
.....................
b= ppp+ Lg PP. EL --
p• B IOOp•
o El_ I00 % LEACHING AXIS
FIG. 5. Interrelationships of metal grades, distances, and rock densities showing evolution of the enrichment blanket grade (b) as the leaching efficiency (EL) approaches 100 (eq. 9).
MASS BALANCE PRINCIPLES APPLIED TO ORE-FORMING PROCESSES 1235
PHASE I: ASSUME NO LATERAL FLUX • COMPUTED OXIDATION SURFACE ...........
• •'•._ _•'?•--, / ..... '."] ENRICHMENT ZONE
---• '1' / ' FLUX- B(bp- p.) - L (,p-Ip) LLI .•. O__?:5•--• -'-"----- / i FLUX:B •b J' T J' h ,•[ LATERAL
; TRANSPORT '•.. DISTAN CE
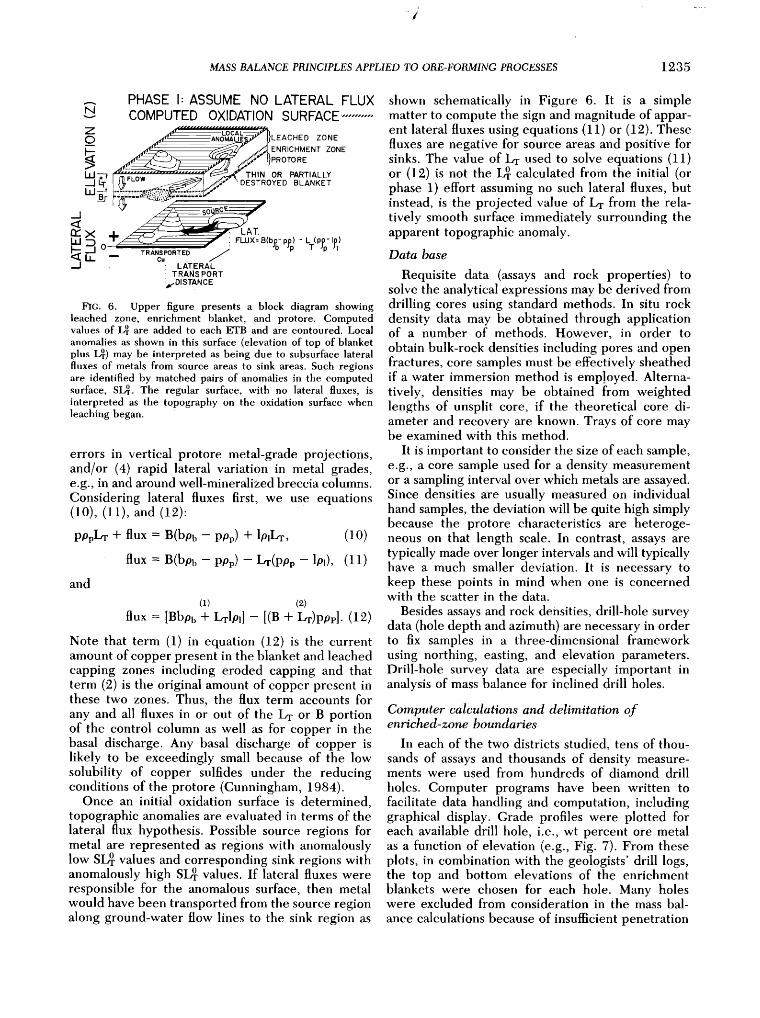
FIG. 6. Upper figure presents a block diagram showing leached zone, enrichment blanket, and protore. Computed values of L• are added to each ETB and are contoured. Local anomalies as shown in this surface (elevation of top of blanket plus IPr) may be interpreted as being due to subsurface lateral fluxes of metals from source areas to sink areas. Such regions are identified by matched pairs of anomalies in the computed surface, SLUr. The regular surface, with no lateral fluxes, is interpreted as the topography on the oxidation surface when leaching began.
errors in vertical protore metal-grade projections, and/or (4) rapid lateral variation in metal grades, e.g., in and around well-mineralized breccia columns. Considering lateral fluxes first, we use equations (10), (11), and (12):
pOpL-r + flux = B(bob - POp) + 10]Lr,
flux = B(bpb - pop) - L.r(p,op- and
(10)
10,), (11)
(]) (2)
flux = [Bb0b + LT10,] --[(B + LT)P01,]. (12)
Note that term (1) in equation (12) is the current amount of copper present in the blanket and leached capping zones including eroded capping and that term (2) is the original amount of copper present in these two zones. Thus, the flux term accounts for any and all fluxes in or out of the Dr or B portion of the control column as well as for copper in the basal discharge. Any basal discharge of copper is likely to be exceedingly small because of the low solubility of copper sulfides under the reducing conditions of the protore (Cunningham, 1984).
Once an initial oxidation surface is determined, topographic anomalies are evaluated in terms of the lateral flux hypothesis. Possible source regions for metal are represented as regions with anomalously low SI?r values and corresponding sink regions with anomalously high SI?r values. If lateral fluxes were responsible for the anomalous surface, then metal would have been transported from the source region along ground-water flow lines to the sink region as
shown schematically in Figure 6. It is a simple matter to compute the sign and magnitude of appar- ent lateral fluxes using equations (11) or (12). These fluxes are negative for source areas and positive for sinks. The value of Dr used to solve equations (11) or (12) is not the LPr calculated from the initial (or phase 1) effort assuming no such lateral fluxes, but instead, is the projected value of Dr from the rela- tively smooth surface immediately surrounding the apparent topographic anomaly. Data base
Requisite data (assays and rock properties) to solve the analytical expressions may be derived from drilling cores using standard methods. In situ rock density data may be obtained through application of a number of methods. However, in order to obtain bulk-rock densities including pores and open fractures, core samples must be effectively sheathed if a water immersion method is employed. Alterna- tively, densities may be obtained from weighted lengths of unsplit core, if the theoretical core di- ameter and recovery are known. Trays of core may be examined with this method.
It is important to consider the size of each sample, e.g., a core sample used for a density measurement or a sampling interval over which metals are assayed. Since densities are usually measured on individual hand samples, the deviation will be quite high simply because the protore characteristics are heteroge- neous on that length scale. In contrast, assays are typically made over longer intervals and will typically have a much smaller deviation. It is necessary to keep these points in mind when one is concerned with the scatter in the data.
Besides assays and rock densities, drill-hole survey data (hole depth and azimuth) are necessary in order to fix samples in a three-dimensional framework using northing, casting, and elevation parameters. Drill-hole survey data are especially important in analysis of mass balance for inclined drill holes.
Computer calculations and delimitation of enriched-zone boundaries
In each of the two districts studied, tens of thou- sands of assays and thousands of density measure- ments were used from hundreds of diamond drill
holes. Computer programs have been written to facilitate data handling and computation, including graphical display. Grade profiles were plotted for each available drill hole, i.e., wt percent ore metal as a function of elevation (e.g., Fig. 7). From these plots, in combination with the geologists' drill logs, the top and bottom elevations of the enrichment blankets were chosen for each hole. Many holes were excluded from consideration in the mass bal-
ance calculations because of insufficient penetration

1236 BRIMHALL, ALPERS, AND CUNNINGHAM
- 4.0
ß 3.0
.2.0
1.0
0.5
i
PROTORE BLANKET LEACHED
FRESH'•'"'•'Q•S, - • • INCIPIENT ' ST'--'"'"""•ONG ß CAPPING PROTORE I PROTORE ENRICHMENT I ENRICHMENT
I i ß
leee
', ,, . ', . • ß
. .I ' ee ß I ß "/ • eee I I
I I EBH EBB ETB COLLAR
ELEVATION
FIC. 7. Plot of wt percent metal (copper) vs. elevation (z) for La Escondida diamond drill hole 159, showing various weathering zones described in the text. Each dot represents 2 m of diamond drill core.
into unenriched protore zones or incomplete assay data for the leached zone.
Owing to the lack of accurate quantitative min- eralogical data for most holes, the boundaries of the enriched zone were assigned on the basis of slope changes in grade profiles. The elevation at the top of the enrichment blanket (ETB) is extremely well defined for most holes both at Butte and La Escon-
dida by an abrupt rise in copper grade, usually coincident with the horizon mapped as the top of dominant sulfides (TDS), which in general marks the bottom of significant oxidation. As shown in Figure 7, zones of partially oxidized or "mixed" ore may occur within the leached zone. These "perched blankets" may represent former tops of enrichment, or ETB horizons, whose significance will be discussed in a later section on multistage leaching.
Delimiting the bottom of the enriched zone (EBB) is considerably more problematic for most holes, yet it is critical in terms of influencing the results of the mass balance calculations. As shown in Figure 7, the enrichment blanket can be divided into two zones: an upper zone of strong enrichment, where greater than 50 percent of the copper resides in supergene phases (usually digenite, djurleite, chal- cocite, idaitc, and/or covellite), and a lower zone of incipient enrichment, where only 10 to 50 percent of the copper resides in supergene phases. In addition to the relatively higher abundance of hypogene copper sulfides (mostly chalcopyrite and bornite), the zone of incipient enrichment is distinguished by the presence of apparently unenriched intervals of approximately protore grade which are conspicuously
absent from the superadjacent strongly enriched zone (Fig. 7). An attempt was made to exclude from the present calculations any holes which bottom in either of these two zones, because reliable estimates of protore metal grade cannot be made for these areas. Work is currently in progress to gather ac- curate modal data for sulfide mineralogy from such holes. Plots of percent total copper vs. percent supergene copper will be used to estimate original protore metal grades in zones for which little or no protore has been drilled, as done by Brimhall (1979) for the analogous problem of hypogene enrichment.
Beneath the zone of incipient enrichment is a zone referred to as quasi-protore which has not been enriched significantly in copper (less than 10% total Cu in supergene phases) but nevertheless has been affected by supergene fluids, as manifested by the hydration, hydrolysis, and/or dissolution of var- ious hypogene gangue minerals and the attendant lowering of bulk density (see Figs. 12 and 13 and discussion of model 3 density vs. depth regressions). Supergene alteration effects in the quasi-protore zone include hydration of anhydrite to gypsum and ultimate dissolution and alteration of plagioclase and K-feldspar to minerals at the kaolinite group and (at La Escondida) alteration of biotite to a green phyl- losilicate (chlorite?). The possible formation of su- pergene sericite is a matter of some controversy (Titley and Beane, 1981; Graybeal, 1982; Marozas, 1982), the resolution of which must await a careful study of stable isotopes such as the work at Santa Rita, New Mexico, by Sheppard et al. (1969, 1971).
The elevation of the bottom of the enrichment
blanket is defined for this study by the usually distinct change in slope of the copper grade vs. depth profile which separates the zone of incipient enrichment from the quasi-protore zone. Because the quasi-protore zone is considered together with the protore for the purposes of protore metal-grade estimates, the presence of small amounts of super- gene copper in the quasi-protore zone must inevi- tably introduce a small systematic error in the cal- culation of the no-flux leached-zone column height (LPr). If protore metal-grade estimates are slightly too high because of supergene copper in the quasi- protore, the amount of excess copper calculated to be in the enriched zone will be slightly too low, as will the calculated height of the leached-zone column needed to account for that excess copper. This can be seen by inspection of equation (3). An increase in p will decrease the excess copper in the numerator and increase the leaching term in the denominator. Thus, the results presented below may, in some instances, be considered minimum values for the total leached-zone column height (LPr).
Once the elevations of the top and bottom of the enrichment blanket are selected for a given drill

MASS BALANCE PRINCIPLES APPLIED TO ORE-FORMING PROCESSES 1237
hole, the computer program calculates average metal grades, densities, and all the derivative functions such as LPr, B, lateral fluxes, etc. In addition, the program performs linear least-squares regressions and standard statistical measures of fit for grade and density data within the three zones, L½, B, and the protore. See Table i for definition of symbols.
Results for the Butte District, Montana
The Butte district of Montana is a porphyry cop- per-molybdenum deposit in which large, high-grade base and precious metal veins have been mined for over a century. The geologic setting has been well described (Meyer et al., 1968; Brimhall, 1977, 1979, 1980; Brimhall and Ghiorso, 1983; Brimhall et al., 1983). An excellent summary of supergene effects is given by McClave (1973).
OXIDATION SURFACE RECONSTRUCTION •..,,_-,- MODEL I •'•'"';'J
• TERTIARY GRAVELS F TR • [•] LEACHED CAPPING
---- -'"r'•"•ENRICHMENT BLANKET SL; = ETB + L• = ETB, B(bpFpp • E •--"[] VE,N-BE•,NG ,•RO•RE ppFIp, [] D'SSEM,NAT• OI I000 FEET ß SCALE
bJ L?oo•"•
o ...:.:.:.:.: .......... :.:.:.:.::::!:i
• -•.:.:.:.:.:.:.:.:.:.:.:.:.:.:.:.:.:,....v.-.'.'.' i :,:.:,x.:.:. ß IN PROTORE ..... :':' ': .... :'' ':':':':g':':':':': .... :.:.:.:':,:':' ':.
FIG. 9. .Generalized east-west cross section (looking north) through the Butte district of Montana showing results of model 1 calculations.
Model I results
The mass balance equations developed above are only a first approximation (model 1) to the variations in metal grades and rock densities which are known to exist in weathering zones. Figure 8A shows metal- grade (copper) variation with elevation for a repre- sentative diamond drill hole in the Butte district.
Data points for assays represent 5- to 10-ft core intervals. Elevations have been computed using hole survey and sample depth data. Mean values of copper grades for leached zone, 1, enrichment blanket, b, and protore, p, are shown. Figure 8A represents a simple, geometric interpretation of the closed-system copper mass balance equation (2). The validity of model 1 as a reasonable approximation hinges largely upon the assumption of a constant average protore metal grade (p) throughout the column (a column may be constructed for each drill hole). Average values for the other five grade and density terms (1, b, pl, p•,, and pp), as shown in Figure 8A and B, are also used as input data to model 1. The total copper
(A) MODEL,
1.81 ,,,- ..-- , .
•le ! .1.- z •e- <•o , i •N
LLI •"•/ J.' J --AVERAGE UI I.U •' It ) ZONE GRADE Z
b / .r ! o 0 -:
/ , I: .•.: .... PROJECTED /
500(•- - 6OO0 ELEVATION (feet)
--
Z
J
2.0
(B)
4000 ELEVATION
I
i :
Average "' "' I
6000 (feet)
FIG. 8. A. Plot of wt percent metal (copper) vs. elevation (z), for a typical Butte drill hole. B. Variation in bulk-rock density with elevation (z).
in the leached zone of the original column (term 1, eq. 2) above the top of the enrichment blanket is equal to the area below the protore metal-grade curve p up to the height of LPr. By equation (2) this area is equal to the excess copper in the blanket, i.e., the copper leached from the leached capping zone (term 2 in eq. 2; dotted pattern in Fig. 8A) plus the relict copper contained in the leached zone (term 3 in eq. 2; vertical lined pattern in Fig. 8A). The areas depicted in Figure 8A present only a partial assessment of the copper mass balance and must be multiplied by densities given in Figure 8B for each zone.
Results of model 1 calculations are shown in an
east-west vertical cross section through the eastern half of the Butte district (Fig. 9). Shown are Tertiary gravels overlying the leached capping, the enrich- ment blanket, and underlying protores previously described by Brimhall (1977, 1979, 1980). LPr so- lutions to mass balance equations are shown as solid dots, one for each diamond drill hole. A major north- south-striking fault divides the district protore do- mains. To the west of the Continental fault, in the downdropped block, oxidation and enrichment have occurred in a phyllically altered vein-bearing protore, above a deeper protore mass consisting of dissemi- nated pyrite and chalcopyrite. Notice that the current leached-zone and the total leached-zone column
heights are both substantially greater than in the region east of the Continental fault where a dissem- inated sulfide protore with potassic alteration has been enriched. The enrichment blanket is corre-
spondingly thinner over this disseminated sulfide protore and leaching efficiency is lower.
In order to check the validity of model i calcu- lations for the resultant presupergene oxidation sur- face, additional models 2 and 3 have been devised. These are offered simply to place likely bounds on solutions to the mass balance equations and to
1238 BRIMHALL, ALPERS, AND CUNNINGHAM
bracket the position and shape of the oxidation surface. In addition, by incorporating more realistic geologic variation into the models, the relative effects of the different variables on the solutions may be assessed.
Model 2 (unbounded linear protore metal-grade variation)
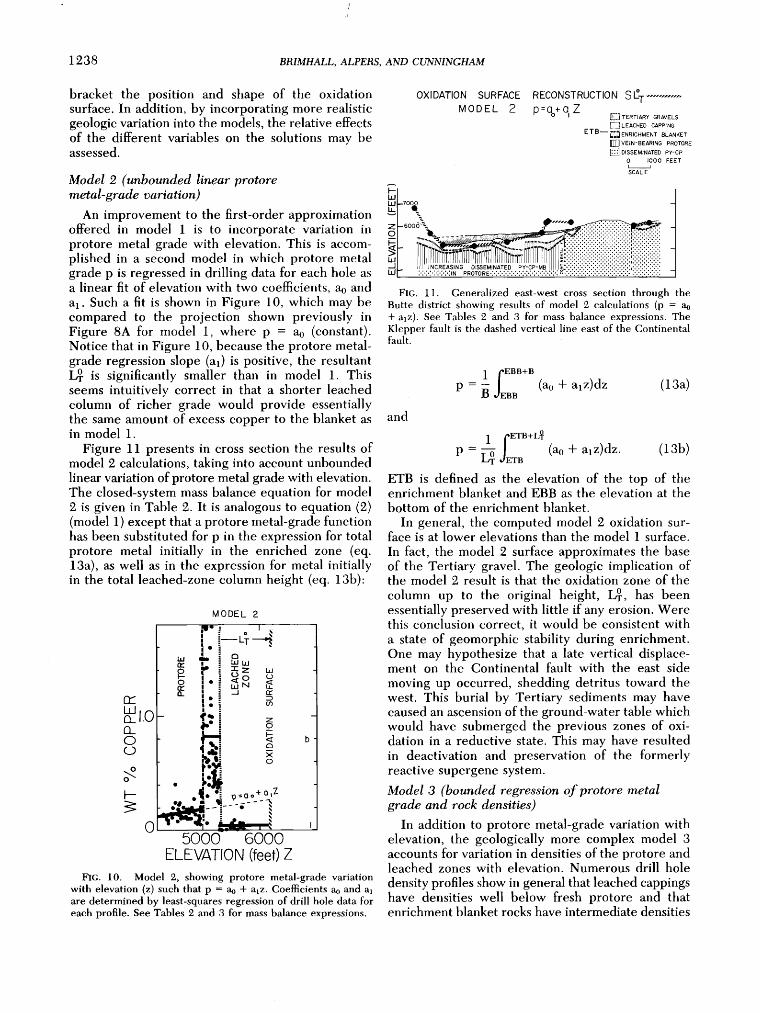
An improvement to the first-order approximation offered in model 1 is to incorporate variation in protore metal grade with elevation. This is accom- plished in a second model in which protore metal grade p is regressed in drilling data for each hole as a linear fit of elevation with two coefficients, ao and a•. Such a fit is shown in Figure 10, which may be compared to the projection shown previously in Figure 8A for model 1, where p = ao (constant). Notice that in Figure 10, because the protore metal- grade regression slope (a]) is positive, the resultant LPr is significantly smaller than in model 1. This seems intuitively correct in that a shorter leached column of richer grade would provide essentially the same amount of excess copper to the blanket as in model 1.
Figure 11 presents in cross section the results of model 2 calculations, taking into account unbounded linear variation of protore metal grade with elevation. The closed-system mass balance equation for model 2 is given in Table 2. It is analogous to equation (2) (model 1) except that a protore metal-grade function has been substituted for p in the expression for total protore metal initially in the enriched zone (eq. 13a), as well as in the expression for metal initially in the total leached-zone column height (eq. 13b):
MODEL 2
I i --'ø • •T•
:
o
5000 GOO0 ELEVATION Z
FIG. 10. Model 2, showing protore metal-grade variation with elevation (z) such that p -- a0 -t- alz. Coefficients a0 and al are determined by least-squares regression of drill hole data for each profile. See Tables 2 and 3 for mass balance expressions.
OXIDATION SURFACE RECONSTRUCTION $1• T MODEL 2 p=%+ Ci, Z • TERTIARY GRAVELS
[•]} LEACHED CAPPING ETB-- •'."•,ENRICHMENT BLANKET
[] VEIN-BEARING PROTORE • DISSEMINATED PY-CP
1 IOO0 FEET SCALE
..... ß ......'-:.........:. • .•,.,,...'•. ::z.• • ...... ....::!:i:i:i:i:i:i:i:i:i:i:i:i:i:
! :':':':':':':':':IN PROTORE,:.:.:.:.:,:-:,:.:.:.:.:.:,:,:.:.:': oø,:.:.:.:.:.:.:,:,:,:,:,:.:,:.:.:.:.
FIG. 11. Generalized east-west cross section through the Butte district showing results oœ model 9. calculations (p + a]z). See Tables œ and 3 œor mass balance expressions. •lepper Fault is t•e •s•e• vertical ]i•e e•st o• t•e Co•ti•e•t•] F•ult.
= (a0 + a,z)dz (13a) P • OE• and
1 fETS+Le : (a0 + a•z)dz. (13b)
ETB is defined as the elevation of the top of the enrichment blanket and EBB as the elevation at the bottom of the enrichment blanket.
In general, the computed model 2 oxidation sur- face is at lower elevations than the model 1 surface.
In fact, the model 2 surface approximates the base of the Tertiary gravel. The geologic implication of the model 2 result is that the oxidation zone of the
column up to the original height, IPr, has been essentially preserved with little if any erosion. Were this conclusion correct, it would be consistent with a state of geomorphic stability during enrichment. One may hypothesize that a late vertical displace- ment on the Continental fault with the east side
moving up occurred, shedding detritus toward the west. This burial by Tertiary sediments may have caused an ascension of the ground-water table which would have submerged the previous zones of oxi- dation in a reductive state. This may have resulted in deactivation and preservation of the formerly reactive supergene system.
Model 3 (bounded regression of protore metal grade and rock densities)
In addition to protore metal-grade variation with elevation, the geologically more complex model 3 accounts for variation in densities of the protore and leached zones with elevation. Numerous drill hole
density profiles show in general that leached cappings have densities well below fresh protore and that enrichment blanket rocks have intermediate densities
MASS BALANCE PRINCIPLES APPLIED TO ORE-FORMING PROCESSES 1239
4- 4-
r--1
L__J •
4-4-++
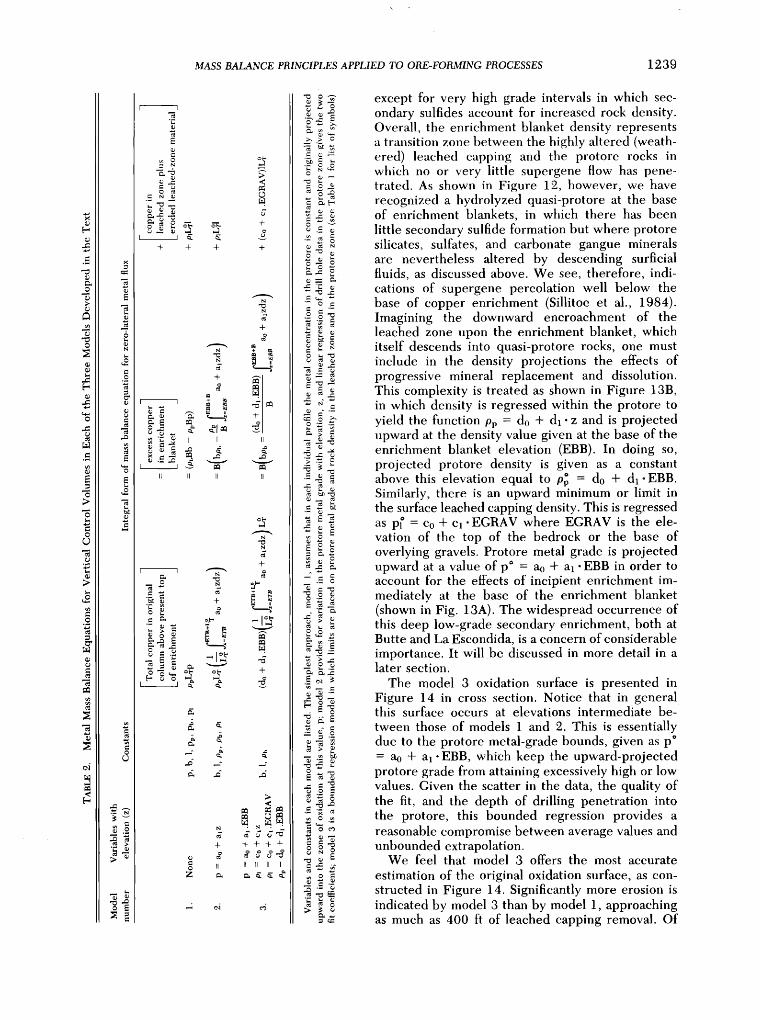
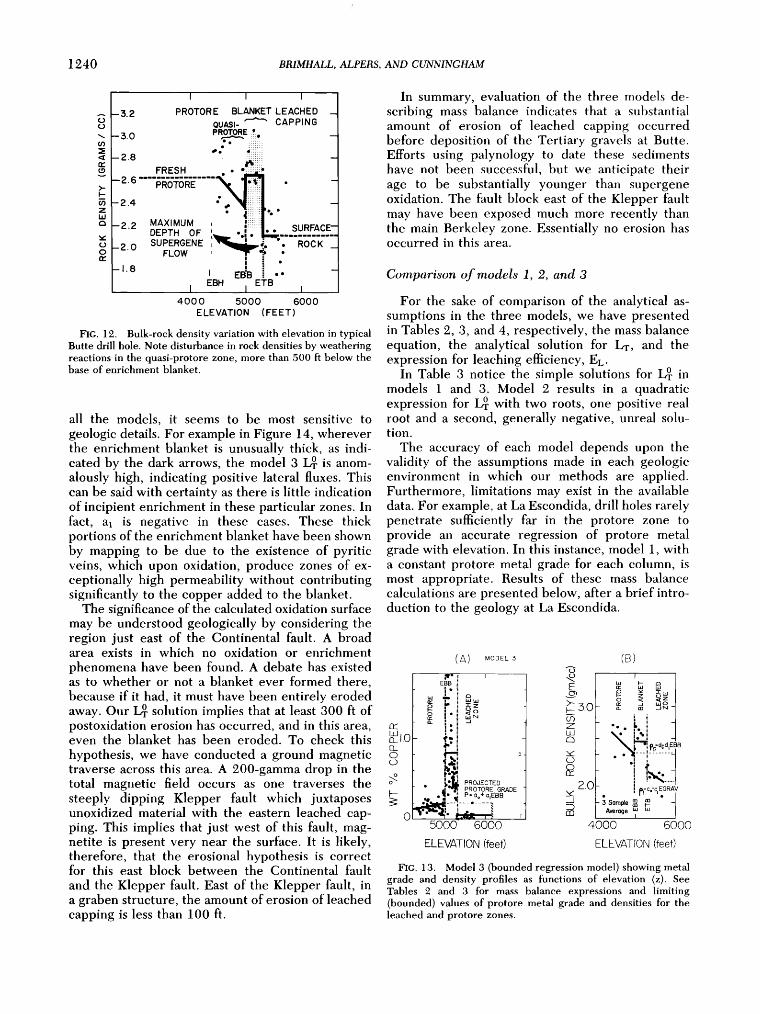
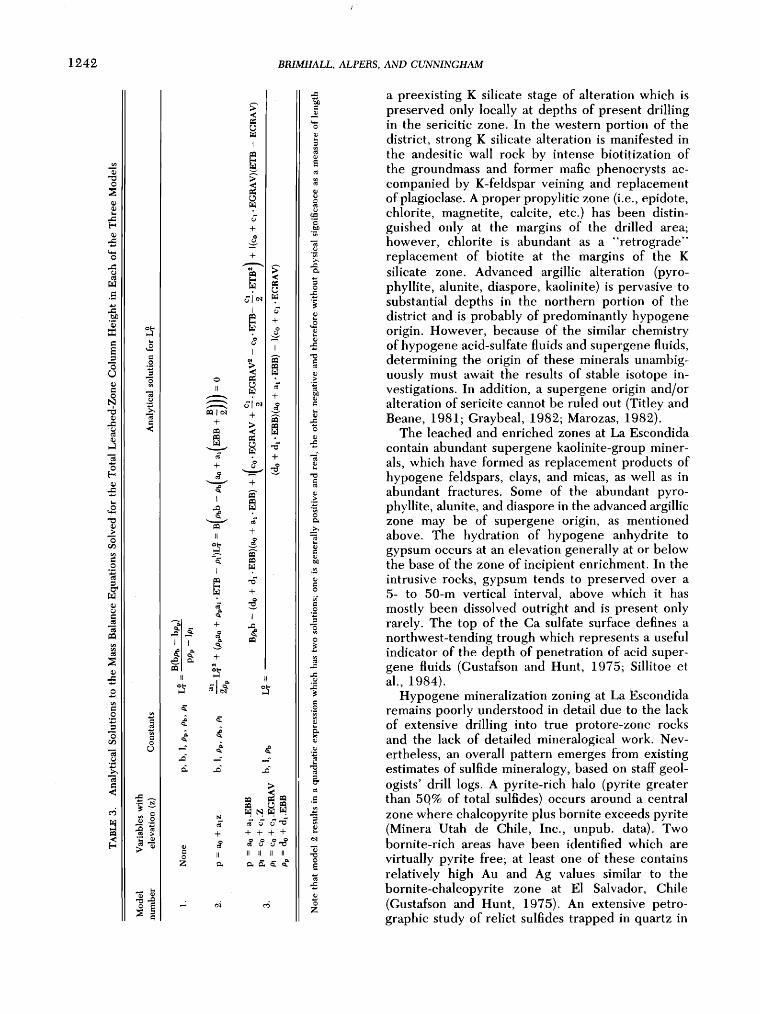
except for very high grade intervals in which sec- ondary sulfides account for increased rock density. Overall, the enrichment blanket density represents a transition zone between the highly altered (weath- ered) leached capping and the protore rocks in which no or very little supergene flow has pene- trated. As shown in Figure 12, however, we have recognized a hydrolyzed quasi-protore at the base of enrichment blankets, in which there has been little secondary sulfide formation but where protore silicates, sulfates, and carbonate gangue minerals are nevertheless altered by descending surficial fluids, as discussed above. We see, therefore, indi- cations of supergene percolation well below the base of copper enrichment (Sillitoe et al., 1984). Imagining the downward encroachment of the leached zone upon the enrichment blanket, which itself descends into quasi-protore rocks, one must include in the density projections the effects of progressive mineral replacement and dissolution. This complexity is treated as shown in Figure 13B, in which density is regressed within the protore to yield the function op = do + dl. z and is projected upward at the density value given at the base of the enrichment blanket elevation (EBB). In doing so, projected protore density is given as a constant above this elevation equal to o• -- do + d•.EBB. Similarly, there is an upward minimum or limit in the surface leached capping density. This is regressed as p•' = Co + c•' EGRAV where EGRAV is the ele- vation of the top of the bedrock or the base of overlying gravels. Protore metal grade is projected upward at a value of p* -- a0 + a•. EBB in order to account tbr the effects of incipient enrichment im- mediately at the base of the enrichment blanket (shown in Fig. 13A). The widespread occurrence of this deep low-grade secondary enrichment, both at Butte and La Escondida, is a concern of considerable importance. It will be discussed in more detail in a later section.
The model 3 oxidation surface is presented in Figure 14 in cross section. Notice that in general this surface occurs at elevations intermediate be- tween those of models I and 2. This is essentially due to the protore metal-grade bounds, given as p* = ao + a•-EBB, which keep the upward-projected protore grade from attaining excessively high or low values. Given the scatter in the data, the quality of the fit, and the depth of drilling penetration into the protore, this bounded regression provides a reasonable compromise between average values and unbounded extrapolation.
We feel that model 3 offers the most accurate
estimation of the original oxidation surface, as con- structed in Figure 14. Significantly more erosion is indicated by model 3 than by model 1, approaching as much as 400 ft of leached capping removal. Of
1240 BRIMHALL, ALPERS, AND CUNNINGHAM
I I I
• -3,.2 PROTORE BLANKET LEACHED _ (• QUASi- CAPPING PROTORE ?.
• -5.0 . _'-2-' 03 ß :iiiih
<[ --2.8
• FRESH
v ß ß ß '::;":ß z
r, -Z Z MAXIMUM , |:::!11 •iiI•'At• • DEPTH OF , . .......... u _2.0 FLOW , o •
I EBH I ETB I I 400 0 5000 6000
ELEVATION (FEET)
•C. •. Bu}E-roc• •ebsity v•iatiob wffh elevatiob i, typical Batte •ill hole. Note •i•tarb•ce i. rock •e.•itie• reactiobs ib the quasi-protore zobe, more thab 500 •t below the
all the models, it seems to be most sensitive to geologic details. For example in Figure 14, wherever the enrichment blanket is unusually thick, as indi- cated by the dark arrows, the model 3 I-fir is anom- alously high, indicating positive lateral fluxes. This can be said with certainty as there is little indication of incipient enrichment in these particular zones. In fact, ax is negative in these cases. These thick portions of the enrichment blanket have been shown by mapping to be due to the existence of pyritic veins, which upon oxidation, produce zones of ex- ceptionally high permeability without contributing significantly to the copper added to the blanket.
The significance of the calculated oxidation surface may be understood geologically by considering the region just east of the Continental fault. A broad area exists in which no oxidation or enrichment
phenomena have been found. A debate has existed as to whether or not a blanket ever formed there, because if it had, it must have been entirely eroded away. Our I-fir solution implies that at least 300 ft of postoxidation erosion has occurred, and in this area, even the blanket has been eroded. To check this
hypothesis, we have conducted a ground magnetic traverse across this area. A 200-gamma drop in the total magnetic field occurs as one traverses the steeply dipping Klepper fault which juxtaposes unoxidized material with the eastern leached cap- ping. This implies that just west of this fault, mag- netite is present very near the surface. It is likely, therefore, that the erosional hypothesis is correct for this east block between the Continental fault
and the Klepper fault. East of the Klepper fault, in a graben structure, the amount of erosion of leached capping is less than 100 ft.
In summary, evaluation of the three models de- scribing mass balance indicates that a substantial amount of erosion of leached capping occurred before deposition of the Tertiary gravels at Butte. Efforts using palynology to date these sediments have not been successful, but we anticipate their age to be substantially younger than supergene oxidation. The fault block east of the Klepper fault may have been exposed much more recently than the main Berkeley zone. Essentially no erosion has occurred in this area.
Comparison of models 1, 2, and 3
For the sake of comparison of the analytical as- sumptions in the three models, we have presented in Tables 2, 3, and 4, respectively, the mass balance equation, the analytical solution for Dr, and the expression for leaching efficiency, EL.
In Table 3 notice the simple solutions for I_• in models 1 and 3. Model 2 results in a quadratic expression for I_• with two roots, one positive real root and a second, generally negative, unreal solu- tion.
The accuracy of each model depends upon the validity of the assumptions made in each geologic environment in which our methods are applied. Furthermore, limitations may exist in the available data. For example, at La Escondida, drill holes rarely penetrate sufficiently far in the protore zone to provide an accurate regression of protore metal grade with elevation. In this instance, model 1, with a constant protore metal grade for each column, is most appropriate. Results of these mass balance calculations are presented below, after a brief intro- duction to the geology at La Escondida.
o •' • '•z
.•, • P=a +o,EBB ß •e • , •
5000 6000
ELEVATION (feet)
•_50 --
2.0
4000
(B)
ELEVATION (feet)
FIG. 13. Model 3 (bounded regression model) showing metal grade and density profiles as functions of elevation (z). See Tables 2 and 3 for mass balance expressions and limiting (bounded) values of protore metal grade and densities for the leached and protore zones.

MASS BALANCE PRINCIPLES APPLIED TO ORE-FORMING PROCESSES 1241
OXIDATION SURFACE RECONSTRUCTION $ [•T ........... MODEL 3
• TERTIARY GRAVELS • LEACHED CAPPING • ENRICHMENT BLANKET [] VEIN-BEARING PROTORE [] DISSEMINATED PY-CP
a 01 IOO0 FEET SCALE
• . ,T F -157o00
ooo , . t I • • '• ,IF" • ,, • z •-6ooa--,I-_ ,,,I,• .... ß "•.-'"'•. ß ß "..'.':::..'•:i'::;:..'•' J
• • ,- :::::::::::::::::::::::::::::: ::: ¾::::::: L• , ....... .•' :::::::::::::::::::::::::::::::::::::::::::::::::::::
Li•L_ I// I N C Ill [ - ' --'• -- -- '•••' '" '• "''•• "'•'•..'i:')i:: ß [ :':':':':':':';':IN PROTORE. ß .:..: ..... :, .:. ,:.:.:.:. •o ......... : ..... :.:.:.:. :.:.:.:.:.:.:.: ß
FIG. 14. Generalized east-west cross section through the Butte district showing results of model 3 calculations. Note general similarity to model 1. Anomalous data points on the surface, indicated by arrows, are interpreted as regions of subsurface lateral copper flux into anomalously thick sections of the enrichment zone.
Geologic Setting at La Escondida, Chile
La Escondida is a large, relatively high-grade porphyry copper deposit located in the Atacama desert of northern Chile, approximately midway between the Chuquicamata and E1 Salvador mines (Fig. 15). Since discovery of the deposit in March 1981, exploration and development drilling has out- lined an orebody of world-class proportions. The 112 diamond drill holes considered in the present study were chosen based on completeness of assay profiles, with respect to adequate penetration into protore or quasi-protore zones (e.g., Fig. 7) and continuity of assay profiles for all zones, including the leached zone.
Mineralization at La Escondida is associated with
a complex of porphyritic quartz diorite to granitic intrusions, extrusions (?), and igneous breccias set in a structurally complicated zone of Lower Creta- ceous sedimentary rocks and Upper Cretaceous to lower Tertiary (?) volcanic rocks. The following discussion of the geology at La Escondida will be limited to that needed as background to understand the supergene mass balance calculations presented below. Space does not permit an exhaustive intro- duction to La Escondida geology, which might in- clude the results of ongoing studies concerning geochronology, petrology, geochemistry, and para- genesis of hypogene and supergene ores (Alpers and Brimhall, in prep.; Ojeda and Burns, in prep.). Host rocks
The principal wall rock for the mineralization at Escondida is an aphanitic to finely porphyritic an- desitc with rarely preserved vesicular and tuffaceous texture (Ford, 1983). The distribution of this is shown by the blank area in Figure 16. Intense
hypogene alteration of this rock type has resulted in a variety of facies with dramatically different leaching and enrichment properties in the supergene environment, as will be discussed below. A dacitic unit probably overlies the andesite in the western part of the district and lies in fault contact with a sedimentary sequence which includes sandstones, siltstones, limestones, shales, and interbedded vol- canics and conglomerates (Perell(•, 1983b). Tentative identification of these sediments as Lower Cretaceous
(Chong, 1977; Perell6, 1983b; Ford, 1983) and interpretation of their contact with the dacite unit as a structural disconformity suggest a minimum Lower Cretaceous age for the andesite wall rock. A sequence of hornblende andesite |apilli tuffs and volcanic breccias which unconformably overlies the sedimentary sequence is tentatively correlated by Ford (1983) and Perell6 (1983b) with the Augusta Victoria Formation of Upper Cretaceous to lower Tertiary age (Garcia, 1967). This unconformity may correlate with the Middle Cretaceous sub-Hercynian tectonic phase documented in Peru, central Chile, and Argentina (Coira et al., 1982).
Intrusive rocks and younger volcanics
At least three intrusive pulses of porphyritic quartz diorite with associated brecciation and hydrothermal alteration are thought to have been responsible for the bulk of the hypogene Cu-Au-Ag-Mo mineraliza- tion at Escondida (Ford, 1982, 1983; Ojeda, 1982; Perell6, 1983a). The distribution of these units is shown in Figure 16. Breccias and pebble dikes crosscut these plugs and generally trend northwest- southeast, as shown in Figure 16.
A younger (postmineral?) rhyolitic porphyry, shown in the light gray area, forms a major, north- trending dike 0.5 to 1.5 km wide which may have truncated the eastern margin of the La Escondida orebody (Ford, 1983). A subvolcanic neck, as evi- denced by vertical flow banding and coarse igneous brecciation, of the rhyolitic porphyry is present near hill C in the southeast portion of the district (P. dos Santos, pers. commun.). This rhyolitic unit also makes up much of hill B. Its eraplacement was probably accompanied by intense silicification as well as per- vasive advanced argillic alteration, perhaps cogenetic with hypogene leaching of primary sulfides from previously mineralized adjacent units, especially in the northern part of the district (J. H. Courtright, pers. commun.).
Alteration and mineralization
The hypogene alteration zoning is dominated by a northwest-trending trough of deep sericitic alter- ation, closely associated with the highly fractured, brecciated, and well-mineralized quartz diorite por- phyries. This sericitic zone was superimposed upon
1242 BRIMHALL, ALPERS, AND CUNNINGHAM
+
a preexisting K silicate stage of alteration which is preserved only locally at depths of present drilling in the sericitic zone. In the western portion of the district, strong K silicate alteration is manifested in the andesitic wall rock by intense biotitization of the groundmass and former mafic phenocrysts ac- companied by K-feldspar veining and replacement of plagioclase. A proper propylitic zone (i.e., epidote, chlorite, magnetite, calcite, etc.) has been distin- guished only at the margins of the drilled area; however, chlorite is abundant as a "retrograde" replacement of biotite at the margins of the K silicate zone. Advanced argillic alteration (pyro- phyllite, alunite, diaspore, kaolinite) is pervasive to substantial depths in the northern portion of the district and is probably of predominantly hypogene origin. However, because of the similar chemistry of hypogene acid-sulfate fluids and supergene fluids, determining the origin of these minerals unambig- uously must await the results of stable isotope in- vestigations. In addition, a supergene origin and/or alteration of sericite cannot be ruled out (Titley and Beane, 1981; Graybeal, 1982; Marozas, 1982).
The leached and enriched zones at La Escondida
contain abundant supergene kaolinite-group miner- als, which have formed as replacement products of hypogene feldspars, clays, and micas, as well as in abundant fractures. Some of the abundant pyro- phyllite, alunite, and diaspore in the advanced argillic zone may be of supergene origin, as mentioned above. The hydration of hypogene anhydrite to gypsum occurs at an elevation generally at or below the base of the zone of incipient enrichment. In the intrusive rocks, gypsum tends to preserved over a 5- to 50-m vertical interval, above which it has mostly been dissolved outright and is present only rarely. The top of the Ca sulfate surface defines a northwest-tending trough which represents a useful indicator of the depth of penetration of acid super- gene fluids (Gustafson and Hunt, 1975; Sillitoe et al., 1984).
Hypogene mineralization zoning at La Escondida remains poorly understood in detail due to the lack of extensive drilling into true protore-zone rocks and the lack of detailed mineralogical work. Nev- ertheless, an overall pattern emerges from existing estimates of sulfide mineralogy, based on staff geol- ogists' drill logs. A pyrite-rich halo (pyrite greater than 50% of total sulfides) occurs around a central zone where chalcopyrite plus bornite exceeds pyrite (Minera Utah de Chile, Inc., unpub. data). Two bornite-rich areas have been identified which are
virtually pyrite free; at least one of these contains relatively high Au and Ag values similar to the bornite-chalcopyrite zone at E1 Salvador, Chile (Gustafson and Hunt, 1975). An extensive petro- graphic study of relict sulfides trapped in quartz in

MASS BALANCE PRINCIPLES APPLIED TO ORE-FORMING PROCESSES 1243
TABLE 4. Solutions to Mass Balance Equations Giving Formulas for the Efficiency of Leaching
in Each of the Three Models
Model
number Analytical solution for EL
1. EL = 100 1-•
- 2. EL =
100B(pbb - (do + dx' EBB)(ao + ax' EBB)) (do + d•. EBB)(ao + ax' EBB)L•
surface samples from La Escondida (A. Aguilar, unpub. data) shows a pattern similar in many respects to that mapped at depth from drill intercepts, sug- gesting at least qualitatively that hypogene sulfide mineralogy may have been consistent over vertical intervals as long as the deepest drilling in the district. This evidence is particularly useful in terms of placing possible constraints on the original ele- vation of the top of copper sulfides as well as constraining vertical extrapolation of protore copper- grade trends observed at depth.
The top of the enrichment blanket for most drill holes is a sharp contact between oxidized (leached) and unoxidized (enriched) zones. Mineralogically, the uppermost sulfides in the enriched zone are "sooty chalcocite" and residual pyrite. Small amounts of chalcopyrite and bornite are present in the zone of strong enrichment as cores in grains of supergene sooty chalcocite as well as tiny inclusions (less than 5 #) of chalcopyrite and bornite plus digenite in pyrite grains which have effectively shielded these inclusions from supergene replacement. Most pyrite grains in this zone are rimmed, veined, and/or partly replaced by the sooty chalcocite, the precise min- eralogy of which remains undetermined. Deeper in a typical profile, chalcopyrite occurs rimmed con- centrically outward by blue digenite and then white digenite of distinctly lower Fe content (as noted at Mantos Blancos, Chile, by Chfivez, 1983).
Present geometry and hydrologic setting of the enrichment blanket
The collars of the 112 drill holes considered in the present study are plotted on a topographic base map in Figure 17A. The three most prominent hills in the district, labeled A, B, and C, have summit elevations of 3,436, 3,355,and 3,194 m above sea level, respectively. These summits are labeled for reference on all appropriate maps in this paper.
Figure 17B is a contour map of the elevation at the top of the enrichment blanket, as defined by grade profiles and mineralogic data. This top surface shows several linear discontinuities which may indicate fault offsets of postsu, pergene age, especially in the southeastern, eastern, and north-central portions of the map area. The bottom surface (not shown) roughly parallels the top in terms of its general shape; however, the slopes are generally steeper. Thus, the bottom surface also defines a northwest- trending trough whose position corresponds well with the distribution of deep (hypogene?) sericitic alteration as well as with the top surface of the Ca sulfates,
The relationship between the top surface of the enrichment blanket and the present water table was investigated by measurement of static water levels in more than 150 open vertical drill holes within both the mineralized area and the outlying areas, covering a total area of about 15 km •. These data indicate that the water table is a virtually fiat surface at 2,988 ñ 3 m above sea level, or about 10 m below the surface elevation in the nearby Salar Hamburgo,
FIG. 15. Location map of northern Chile, showing principal porphyry copper mines and prospects (after Stoertz and Ericksen, 1974).

1244 BRIMHALL, ALPERS, AND CUNNINGHAM
AGE ROCK TYPE
I •-] B .... ia N ] Late Porphyries MID-TERTIARY • Rhyolitic Porphyry [30 - 35 m.y.I
I •[] Quartz Diorite Porphyries .. . [] Dacltic Ignimbrite U. CRETACEOUS [] DecItc
[?) [] Andesitc L. CRETACEOUS [] Sandstone, Limestone
•km
FIG. 16. Generalized geologic map of the La Escondida district, based on mapping and core logging by Minera Utah de Chile, Inc., staff geologists, summarized by Ford (1983) and J. M. Ojeda (written commun., 1984). Oligocene ages (30-35 m.y.) based on K-Ar dating of hydrothermal biotites and sericites associated with hypogene mineralization. Raw data for these and other age date samples from La Escondida will be detailed by A!pers and others in subsequent publications. A, B, and C represent summits of principal hills in the district (see Fig. 17A). Dash-dot lines represent principal fault and fracture zones.
a local topographic depression (or playa) located 1 to 3 km south and east of the map area shown in Figure 17A and B. This essentially fiat water table indicates a nearly static hydrologic system, consistent with the present hyper-arid climate in the Atacama desert. Present precipitation rates at La Escondida are estimated to be approximately 0.5 cm/yr (Fuen- zalida, 1967).
In Figure 17B, the shaded areas indicate where the top surface at the enriched zone is above the present water tables. In general, capillary fringe effects cause saturated conditions to be maintained
to heights above the present water table, depending on pore-size distribution (Davies and deWest, 1966). Therefore, at La Escondida, 2,988 m represents a minimum elevation for the present top of saturated conditions. The shaded areas in Figure 17B represent maximum possible areas over which sulfides are
presently exposed to unsaturated, actively oxidizing conditions. Conversely, throughout most of the dis- trict (unshaded in Fig. 17B) completely saturated conditions now exist in the lower portion of the leached zone. In the central part of the district (south of hill B), 100 to 200 vertical m of oxidized leached-zone rocks are now saturated below the
present water table. The top surface of the enrichment blanket in a
given place most likely represents a former interface of saturated and unsaturated conditions (i.e., former top of capillary fringe). The present hydrologic setting indicates that some important climatic and geemorphologic changes have occurred since the time of active supergene leaching and enrichment during the middle Miocene (Alpers et al., 1984). Submergence of the zone of active oxidation in the central portion of the district appears to have been responsible for preservation of most of the enrich- ment blanket as sulfides. This is in sharp contrast to the Chuquicamata deposit, located approximately 200 km to the north (Fig. 15), where decades of important copper production have come from oxi- dized ores which represent a former sulfide-enrich- ment blanket which oxidized essentially in place due to prolonged exposure to unsaturated conditions (Lindgren, 1917; Jarrell, 1944).
In several porphyry copper districts, important reserves of copper occur as exotic copper oxide
1^•;-2-• ' • PRESENT' • '/•• • SURFACE
FIC. 17. A. Plan view of portion of the La Escondida district showing present surface topography in meters above sea level; contour interval = 40 m. Dots show locations of collars of 112 diamond drill holes considered as individual control volumes for mass balance calculations discussed in text. The summits of hills
A, B, and C are shown by open triangles in this and subsequent figures for reference. B. Elevation of top of enrichment blanket (ETB); contour interval = 40 m. Based on grade profiles for individual drill holes as well as geologic logs. Shaded areas represent zones where sulfides are preserved above the present water table (2,988_ 3 m above sea level) and oxidation is presumably active. The oxide-sulfide interface is submerged throughout most of the district. Contours for this and all subsequent figures generated by ISM software package, Dynamic Graphics, 2855 Telegraph Avenue, Berkeley, California 94705.

MASS BALANCE PRINCIPLES APPLIED TO ORE-FORMING PROCESSES 1245
mineralization, often discovered at considerable dis- tances from the oxidizing sulfide source areas. Most notably, the Exotica deposit (Mina Sur), 2.5 to 6.5 km south of the main pit at Chuquicamata, has been shown to have been derived from the main deposit by lateral flow of copper-bearing ground waters which followed palcoriver channels (Newberg, 1967; Mortimer et al., 1977). The genesis of other exotic copper deposits in northern Chile (e.g., E1 Tesoro, Sagasea) and in Arizona (e.g., Emerald Isle, Jerome) is less well documented. In the next portion of this paper, we present the results of mass balance cal- culations in an attempt to quantify the magnitude, direction, and distance of lateral copper transport at La Escondida, in terms of both exotic copper oxide mineralization and copper sulfide mineraliza- tion within the present enrichment blanket.
Results of Supergene Mass Balance Calculations at La Escondida
In general, there are three possible interpretations for topography on calculated I_• surfaces: (1) the calculated topography is real, i.e., all assumptions are more or less valid, (2) the assumption of no lateral flux is incorrect and the apparent topography represents source and sink regions, or (3) the as- sumed protore metal grades are incorrect, resulting in spurious topography. Any combination of these three factors could account for an anomalous I-Pr value for a given drill hole. By holding constant the alternate pairs of these three factors, it is possible to evaluate the magnitude of each factor as an end- member interpretation. The results for La Escondida will be discussed in terms of each of these possibil- ities by itself, followed by a discussion of the most reasonable overall interpretation for different por- tions of the district.
These supergene mass balance calculations account for lateral variations in protore metal grade by considering each drill hole as a separate control volume. Thus, the protore metal-grade estimate for each hole is based on assays at depth for that individual drill hole. In the case of inclined drill holes, the northing and casting coordinates of the midpoint of the enrichment blanket are used as a point of projection. Forty-nine of the 112 holes considered in this study (44%) were collared as inclined holes, plunging typically 50 ø to 70 ø from horizontal. The distance of projection is typically less than 200 m, which introduces uncertainties less than those inherent in projecting constant protore metal grades vertically for up to 1 km, as is necessary for model 1 calculations. Regressions of protore metal grade vs. depth for individual drill holes are not well enough constrained at La Escondida to present consistently meaningful results for models 2 and 3. Therefore, results of only model i calculations
will be presented here. Future field and laboratory work concerning La Escondida will provide addi- tional geologic constraints which may allow for rea- sonable extrapolation of observed protore metal- grade trends and calculation of more realistic grade projections.
Model 1: No lateral flux, vertically homogeneous protore metal grade
For each drill hole considered, a total leached zone thickness (I-Pr) was calculated to account for the amount of copper in the enriched zone in excess of the average protore metal grade for that hole, assuming no lateral fluxes. Values for I-Pr were cal- culated for each drill hole using equation (3) and constant average values for the variables 1, b, p, ol,, and ov for each hole (model 1). A contoured plot of the resulting IPr values is shown in Figure 18A. This no-flux total leached-zone thickness for each hole is added to the elevation at the top of the enriched zone to yield a value for the SI_Pr surface, contoured in Figure 18B. The simplest interpretation of the topography in Figure 18B is that the two major assumptions made to this point (no lateral fluxes and vertically constant protore metal grade) are approximately correct and that the calculated topography represents the actual elevation of hy- pogene copper sulfides before the onset of significant oxidation and supergene leaching. However, this surface represents a minimum elevation for some drill holes for the reason discussed above, i.e., that copper added to the weakly enriched quasi-protore zone near the bottoms of these holes is not consid-
ered part of the enrichment blanket. The surface in Figure 18B exhibits gentle topog-
raphy over much of the mineralized area at an average elevation of roughly 3,300 m. The major exception to this low relief is an anomalously high
O•ID•TION SURFACE'
FIc. 18. A. Calculated I-•r; contour interval = 200 m. Data contoured at northing and casting coordinates of blanket midpoint for each drill hole. B. Calculated SI-•r (=L• + ETB) for each drill hole; contour interval = 100 m.

1246 BRIMHALL, ALPERS, AND CUNNINGHAM
zone center in the right center of the map area, which corresponds to the thickest and richest portion of the enrichment blanket. Calculated SLUr elevations in this anomalous zone are greater than 3,800 m for seven drill holes in this area and greater than 3,400 m for ten others. An additional high portion of the SLPr (surface) is present in the northwestern part of the district, where four holes show calculated ele- vations greater than 3,400 m. The anomalously low region present in the southwest portion of the map area is discussed below.
The calculated LPr surface, SLPr, in Figure 18B can be interpreted by comparing it to the present surface topography (Fig. 17A) and the topography of the top of the enrichment blanket (Fig. 17B). The high areas on the surface, particularly the southeast zone, are 400 to 1,000 m higher than the present land surface, indicating that at least this much erosion of mineralized and leached rock must
have taken place if the assumptions of constant protore metal grade and no lateral flux are valid. The low areas on the surface are locally below the present topographic surface, indicating apparent negative erosion, a geological impossibility which indicates that at least one of the two major assump- tions is not valid for these areas. These areas (e.g., the area near hill B) are sites where the amount of copper presumably leached from the present thick- ness of leached capping does not appear in the subjacent enriched zone. To evaluate which of the basic assumptions is more likely to be incorrect in these cases, we have considered data concerning relict sulfides trapped in quartz in surface samples (A. Aguilar, unpub. data). The area near hill B happens to contain pyrite but no copper sulfide relicts in rhyolitic porphyry with advanced argillic alteration, suggesting that the original protore dis- tribution was inhomogeneous in a vertical sense due either to the change in rock type or hypogene leaching effects.
Several holes in the southwest part of the map area in Figure 18B show SLPr values for the surface at elevations actually below those of the top of the enrichment blanket. Of course, this also represents a physical impossibility and again indicates that one or both of the major assumptions must be incorrect. These holes are anomalous in that their average leached-zone metal grades are greater than their average protore grades (i.e., 1 > b), which represents evidence either of strong vertical inhomogeneities in protore metal-grade distribution or positive lateral copper flux now manifested as copper oxides.
Model 1: Lateral flux interpretation using assumed test values for LT
The anomalous topography in certain areas of the calculated surface, SI_Pr, in Figure 18B could con-
ceivably be explained entirely by local lateral fluxes of copper in the supergene environment. To evaluate the lateral flux interpretation we solve the complete mass balance expression (eq. 1) for the flux term, yielding equation (12). Given that one must assume a value for • to evaluate lateral flux, two different cases are tested: (1) no erosion of mineralized rock, i.e., • -- L½, where L½ is the present thickness of the leached zone, and (2) leaching from the average elevation of the LPr surface (3,300 m) to the present top of enrichment, i.e., I_q- = 3,300 - ETB.
Contour maps of calculated lateral copper flux (in g/cm 2) for these two cases are shown in Figure 19A and B, respectively. Negative lateral flux corresponds to possible source regions, and positive lateral flux to possible supergene sinks. As would be expected
LAT. FLUXo
•'•C. 19. A. Calculated lateral flux of copper, assuming no erosion, based on model I calculations; contour interval = 100 g per cm z. Arrows indicate possible directions and distances of implied subsurface transport of copper by ground water. B. Same as A, but assuming leaching from a fiat surface at 3,300- m elevation, the approximate average value for the surface, SI-Pr in Figure 18B. C. p•ø,•c/p for model 1; contour interval = 0.25 wt percent. Represents variation in protore metal grade relative to observed protore metal grade necessary to explain present distribution of copper, assuming no lateral flux and no leaching of rocks other than preserved leached capping (Lc = I-Pt; see text and Table 1). D. p•00/p for model 1, assuming no lateral flux and leaching from a fiat surface at 3,300-m elevation; contour interval = 0.25 wt percent.

MASS BALANCE PRINCIPLES APPLIED TO ORE-FORMING PROCESSES 1247
for a closed chemical system, the contour for zero lateral flux in Figure 19B coincides closely with the contour for SL9r = 3,300 m in Figure 18B. Possible directions and magnitudes of lateral fluxes are shown schematically with arrows. Despite being speculative in nature, these directions are consistent both with district-wide fracture orientations and with present topographic gradients. Two-dimensional polygons were constructed to calculate an area of influence
for each of the 112 drill holes, allowing the flux surfaces to be integrated by a finite element approx- imation to evaluate the overall net flux within the
region considered. The integrated sum, or net lateral flux, in the no-erosion case (Fig. 19A) is a large positive number, which indicates that we have pos- tulated too little leached material for the grades as stated. Because this result contradicts the fundamen-
tal principle of mass conservation, at least within the boundaries of the system as defined, we must therefore reject the assumption of no erosion of leached protore for the simple model 1 case. In the second case, leaching from 3,300 m, the net lateral flux balance is a relatively small negative number, which is much more realistic. One would expect the net lateral flux to be zero only for a closed chemical system in which no copper was lost at the boundaries, defined as the map area shown and the bottom of the blanket. To confirm that the computed lateral fluxes represent real phenomena we must consider an additional possible contribution to anomalies on SlPr surfaces.
Model 1: Evaluation of vertical protore metal- grade variation
An alternative to the above lateral flux interpre- tation for anomalous topography on the calculated surface, SL9r is to consider errors in the projected values of protore metal grade. Errors in protore metal-grade prediction may be divided into three kinds: (1) errors in estimating average values, (2) errors due to gradual variation in protore metal grade with depth due to primary sulfide-zoning features, and (3) errors due to abrupt changes in grade due to rock-type contacts which cross a control volume of interest. To evaluate in a general way the effects of the possible errors in protore metal-grade estimation, equation (2) is inverted to solve for the quantity pca•c, the calculated protore metal grade necessary to account for the present distribution of ore metal in each hole, given an assumed value for
bobB + lp•LPr Pca• = Op(B + LPr) (14)
Note that the superscript "0" is retained for the IPr term because we need to assume no lateral flux
to evaluate potential vertical protore metal-grade variation. As in the evaluation of lateral flux, two cases are evaluated in terms of finding p•½ for assumed values of IPr for each hole. This method of solution is shown schematically in Figure 20A for the case of no erosion of mineralized rock, where
o p½,•c is the grade which allows the excess copper
Pca•½); stippled area in Fig. 20) to equal area (B(b - o the leached copper area (LPr(p•ø• - 1); diagonally ruled minus vertically ruled area), the density terms are left out for simplicity. Similarly, in Figure 20B, p3 300 •.• is the protore metal grade which equalizes the amounts (areas) of excess copper and leached copper for the arbitrary assumption of erosion from 3,300 m. Thus, a given low anomaly on the surface, SLPr, could be explained either in terms of a negative lateral flux (source region) or alternatively by having Pca•½ less than p, i.e., having a lower original protore metal grade in the leached and enriched zones than is presently observed at depth.
Figure 19C and D show contour maps of P•a•dP
(A) : i
I ..... ,• Elevation (z)
EBB ETB
Elevation
FIG. 20. A. Schematic grade profile showing approximate graphical solution for o pc•c. Once an arbitrary original surface elevation is chosen (in this case, the present surface), pc• is the calculated protore metal grade which would equate excess copper and leached copper terms with no lateral flux. Actual areas as shown would not be equal due to modification by density terms (see eq. 14). B. Same as A but with a different assumption for original surface elevation, e.g., 3,300 m. Note that in this case p•3;•oo < p whereas p•a;•oo > p in A for the arbitrary grade profile selected, but this is by no means a general relationship.
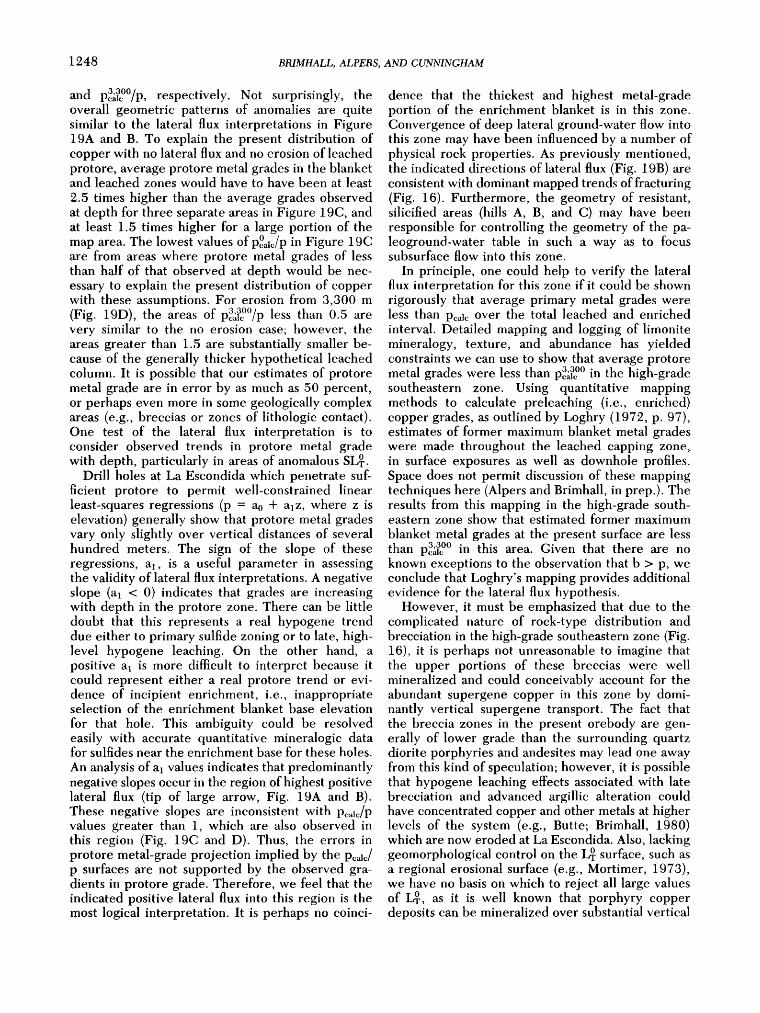
1248 BRIMHALL, ALPERS, AND CUNNINGHAM
and p•;•00/p, respectively. Not surprisingly, the overall geometric patterns of anomalies are quite similar to the lateral flux interpretations in Figure 19A and B. To explain the present distribution of copper with no lateral flux and no erosion of leached protore, average protore metal grades in the blanket and leached zones would have to have been at least
2.5 times higher than the average grades observed at depth for three separate areas in Figure 19C, and at least 1.5 times higher for a large portion of the map area. The lowest values of P•aic/P in Figure 19C are from areas where protore metal grades of less than half of that observed at depth would be nec- essary to explain the present distribution of copper with these assumptions. For erosion from 3,300 m (Fig. 19D), the areas of p•.•00/p less than 0.5 are very similar to the no erosion case; however, the areas greater than 1.5 are substantially smaller be- cause of the generally thicker hypothetical leached column. It is possible that our estimates of protore metal grade are in error by as much as 50 percent, or perhaps even more in some geologically complex areas (e.g., breccias or zones of lithologic contact). One test of the lateral flux interpretation is to consider observed trends in protore metal grade with depth, particularly in areas of anomalous SI_Pr.
Drill holes at La Escondida which penetrate suf- ficient protore to permit well-constrained linear least-squares regressions (p = a0 q- aiz, where z is elevation) generally show that protore metal grades vary only slightly over vertical distances of several hundred meters. The sign of the slope of these regressions, ai, is a useful parameter in assessing the validity of lateral flux interpretations. A negative slope (al < 0) indicates that grades are increasing with depth in the protore zone. There can be little doubt that this represents a real hypogene trend due either to primary sulfide zoning or to late, high- level hypogene leaching. On the other hand, a positive a 1 is more difficult to interpret because it could represent either a real protore trend or evi- dence of incipient enrichment, i.e., inappropriate selection of the enrichment blanket base elevation
for that hole. This ambiguity could be resolved easily with accurate quantitative mineralogic data for sulfides near the enrichment base for these holes.
An analysis of al values indicates that predominantly negative slopes occur in the region of highest positive lateral flux (tip of large arrow, Fig. 19A and B). These negative slopes are inconsistent with Pealalp values greater than 1, which are also observed in this region (Fig. 19C and D). Thus, the errors in protore metal-grade projection implied by the p•a•/ p surfaces are not supported by the observed gra- dients in protore grade. Therefore, we feel that the indicated positive lateral flux into this region is the most logical interpretation. It is perhaps no coinci-
dence that the thickest and highest metal-grade portion of the enrichment blanket is in this zone. Convergence of deep lateral ground-water flow into this zone may have been influenced by a number of physical rock properties. As previously mentioned, the indicated directions of lateral flux (Fig. 19B) are consistent with dominant mapped trends of fracturing (Fig. 16). Furthermore, the geometry of resistant, silicified areas (hills A, B, and C) may have been responsible for controlling the geometry of the pa- leoground-water table in such a way as to focus subsurface flow into this zone.
In principle, one could help to verify the lateral flux interpretation for this zone if it could be shown rigorously that average primary metal grades were less than p•lc over the total leached and enriched interval. Detailed mapping and logging of limonite mineralogy, texture, and abundance has yielded constraints we can use to show that average protore metal grades were less than p•3;•00 in the high-grade southeastern zone. Using quantitative mapping methods to calculate preleaching (i.e., enriched) copper grades, as outlined by Loghry (1972, p. 97), estimates of former maximum blanket metal grades were made throughout the leached capping zone, in surface exposures as well as downhole profiles. Space does not permit discussion of these mapping techniques here (Alpers and Brimhall, in prep.). The results from this mapping in the high-grade south- eastern zone show that estimated former maximum
blanket metal grades at the present surface are less than p•.•00 in this area. Given that there are no known exceptions to the observation that b > p, we conclude that Loghry's mapping provides additional evidence for the lateral flux hypothesis.
However, it must be emphasized that due to the complicated nature of rock-type distribution and brecciation in the high-grade southeastern zone (Fig. 16), it is perhaps not unreasonable to imagine that the upper portions of these breccias were well mineralized and could conceivably account for the abundant supergene copper in this zone by domi- nantly vertical supergene transport. The fact that the breccia zones in the present orebody are gen- erally of lower grade than the surrounding quartz diorite porphyries and andesites may lead one away from this kind of speculation; however, it is possible that hypogene leaching effects associated with late brecciation and advanced argillic alteration could have concentrated copper and other metals at higher levels of the system (e.g., Butte; Brimhall, 1980) which are now eroded at La Escondida. Also, lacking geomorphological control on the I-Pr surface, such as a regional erosional surface (e.g., Mortimer, 1973), we have no basis on which to reject all large values of I-Pr, as it is well known that porphyry copper deposits can be mineralized over substantial vertical
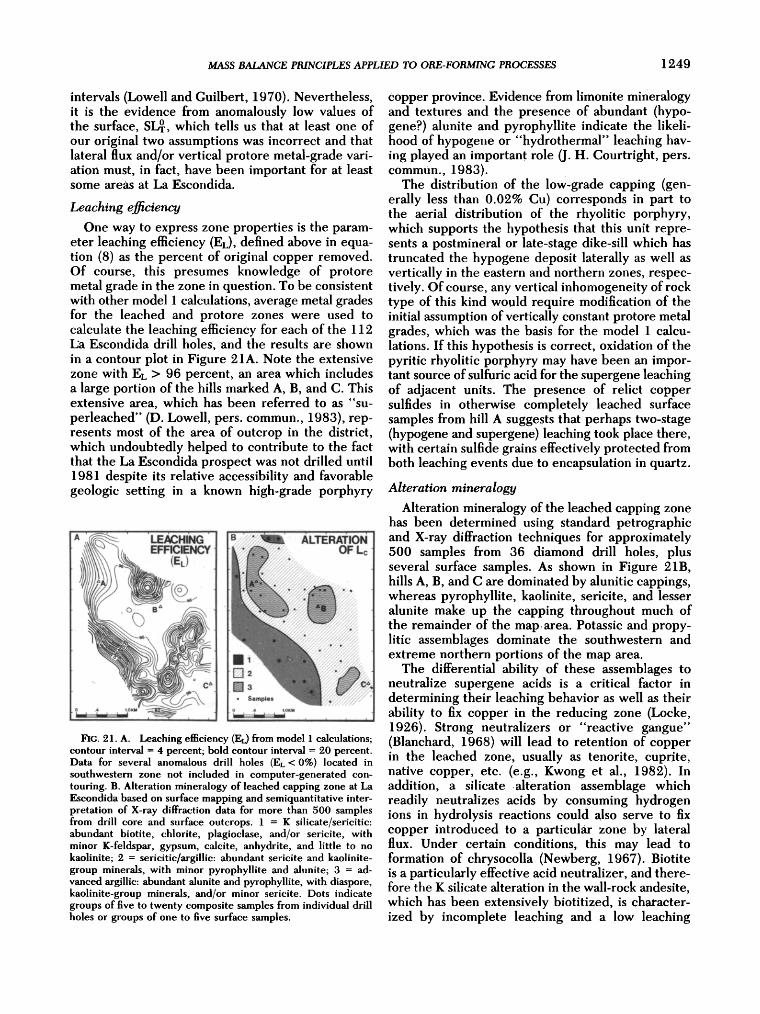
MASS BALANCE PRINCIPLES APPLIED TO ORE-FORMING PROCESSES 1249
intervals (Lowell and Guilbert, 1970). Nevertheless, it is the evidence from anomalously low values of the surface, Slfr, which tells us that at least one of our original two assumptions was incorrect and that lateral flux and/or vertical protore metal-grade vari- ation must, in fact, have been important for at least some areas at La Escondida.
Leaching ej•iciency
One way to express zone properties is the param- eter leaching efficiency (EL), defined above in equa- tion (8) as the percent of original copper removed. Of course, this presumes knowledge of protore metal grade in the zone in question. To be consistent with other model I calculations, average metal grades for the leached and protore zones were used to calculate the leaching efficiency for each of the 112 Ea Escondida drill holes, and the results are shown in a contour plot in Figure 21A. Note the extensive zone with EL > 96 percent, an area which includes a large portion of the hills marked A, B, and C. This extensive area, which has been referred to as "su- perleached" (D. Lowell, pers. commun., 1983), rep- resents most of the area of outcrop in the district, which undoubtedly helped to contribute to the fact that the La Escondida prospect was not drilled until 1981 despite its relative accessibility and favorable geologic setting in a known high-grade porphyry
A ALTERATION ' ' OF Lc
ß
. o
FIG. 21. A. Leaching efficiency (EL) from model 1 calculations; contour interval = 4 percent; bold contour interval = 20 percent. Data for several anomalous drill holes (EL < 0%) located in southwestern zone not included in computer-generated con- touring. B. Alteration mineralogy of leached capping zone at La Eseondida based on surface mapping and semiquantitative inter- pretation of X-ray diffraction data for more than 500 samples from drill core and surface outcrops. 1 = K silieate/serieitie: abundant biotite, ehlorite, plagioelase, and/or serieite, with minor K-feldspar, gypsum, calcite, anhydrite, and little to no kaolinitc; 2 = serieitie/argillie: abundant serieite and kaolinitc- group minerals, with minor pyrophy!!ite and alunite; 3 = ad- vanced argi!lie: abundant alunite and pyrophy!!ite, with diaspore, kaolinRe-group minerals, and/or minor serieite. Dots indicate groups of five to twenty composite samples from individual drill holes or groups of one to five surface samples.
copper province. Evidence from limonite mineralogy and textures and the presence of abundant (hypo- gene?) alunite and pyrophyllite indicate the likeli- hood of hypogene or "hydrothermal" leaching hav- ing played an important role (J. H. Courtright, pers. commun., 1983).
The distribution of the low-grade capping (gen- erally less than 0.02% Cu) corresponds in part to the aerial distribution of the rhyolitie porphyry, which supports the hypothesis that this unit repre- sents a postmineral or late-stage dike-sill which has truncated the hypogene deposit laterally as well as vertically in the eastern and northern zones, respec- tively. Of course, any vertical inhomogeneity of rock type of this kind would require modification of the initial assumption of vertically constant protore metal grades, which was the basis for the model 1 calcu- lations. If this hypothesis is correct, oxidation of the pyritie rhyolitie porphyry may have been an impor- tant source of sulfurie acid for the supergene leaching of adjacent units. The presence of relict copper sulfides in otherwise completely leached surface samples from hill A suggests that perhaps two-stage (hypogene and supergene) leaching took place there, with certain sulfide grains effectively protected from both. leaching events due to encapsulation in quartz.
Alteration mineralogy
Alteration mineralogy of the leached capping zone has been determined using standard petrographic and X-ray diffraction techniques for approximately 500 samples from 36 diamond drill holes, plus several surface samples. As shown in Figure 2lB, hills A, B, and C are dominated by alunitic cappings, whereas pyrophyllite, kaolinitc, sericite, and lesser alunite make up the capping throughout much of the remainder of the map.area. Potassic and propy- litic assemblages dominate the southwestern and extreme northern portions of the map area.
The differential ability of these assemblages to neutralize supergene acids is a critical factor in determining their leaching behavior as well as their ability to fix copper in the reducing zone (Locke, 1926). Strong neutralizers or "reactive gangue" (Blanchard, 1968) will lead to retention of copper in the leached zone, usually as tenoritc, cuprite, native copper, etc. (e.g., Kwong et al., 1982). In addition, a silicate .alteration assemblage which readily neutralizes acids by consuming hydrogen ions in hydrolysis reactions could also serve to fix copper introduced to a particular zone by lateral flux. Under certain conditions, this may lead to formation of chrysocolla (Newberg, 1967). Biotite is a particularly effective acid neutralizer, and there- fore the K silicate alteration in the wall-rock andesitc, which has been extensively biotitized, is character- ized by incomplete leaching and a low leaching

1250 BRIMHALL, ALPERS, AND CUNNINGHAM
efficiency. Note that several anomalous drill holes with a highly negative leaching efficiency were not included in the contouring of Figure 21A. These holes are mostly located in the southwestern portibn of the map area and contain 1 greater than p, resulting in the apparent negative leaching mafii- fested in !-Pt less than 0 (see Fig. 18A and B). This anomalous result can be attributed to one of several possibilities: (1) lateral flux could have added copper to the oxidized zone, (2) inhomogeneous protore metal-grade distribution could have led to an un- derestimation of p for that zone, or (3) the relatively high-grade oxide mineralization could represent a former chalcocite blanket which is now completely oxidized but only partially remobilized. This final possibility only could lead to a situation where. average leached-zone metal grades, 1, are greater than the protore metal grade, p•, if the leached zone itself were heterogeneous in grade distribution (per- haps due to vertically heterogeneous hypogene al- teration or rock-type distribution) and the lower grade portion of the capping had been eroded (see section on two-cycle leaching, below).
There is no textural or mineralogical evidence in the southwestern zone to suggest that the oxide copper there is an oxidation product or replacement of chalcocite, except perhaps just above the present top of .the enrichment blanket. Most of the copper in the oxidized zone in that area is present as chrysocolla and brochantite which probably formed due to lateral flux into the present leached zone either on a large scale (derived from hill A?) or on a small scale due to locally high-grade hypogene veins which may be less abundant at depth in that area (J. Bratt, pers. commun., 1983).
In the eastern portion of the study area: the zone of reduced leaching e•ciency is probably due to partial destruction of a former high-grade chalcocite zone. Leaching efficiencies are low in this zone (locally less than 60%) but are nowhere negative as in the southwestern area. Copper oxide mineralogy in this zone includes brochantite, antleritc, atacamite, and pseudomalachite (Cus(PO4)2(OH)4'H20); the phosphorus was probably derived from the super- gene acid destruction of apatite. The incomplete leaching in this zone is probably due to its relatively low pyrite content.
The remainder of the leached zone is dominated by kaolinitc, sericite, and local alunite-pyrophyllite- diaspore alteration. This nonreactive gangue is ex- tremely well leached, as manifested by the extensive area with a leaching efficiency greater than 96 percent. One finds predominantly exotic as opposed to indigenous limonites in this zone due to original or pyrite/chalcocite ratios greater than 2 to 1 and the inability of the gangue minerals to neutralize acids produced by pyrite oxidation (Blanchard, 1968;
Loghry, 1972). Jarosite veining is common through- out this extensive superleached zone, and supergene jarosite commonly replaces hypogene(?) alunite in former feldspar sites. Leached-capping studies cur- rently in progress (Alpers and Brimhall, in prep.) include detailed mapping of limonite mineralogy, textures, and modes of occurrence in addition to mass balances for sulfur and iron.
Interrelations of metal grades and thicknesses of leached and enriched zones
The interrelationship of metal grades, densities, and thicknesses of the various zones as expressed in equation (5) provides a basis for grouping the 112 drill holes considered in this study into spatial do- mains. Figure 22 is a plot 'of the 112 holes using the same axes as Figure 4. The value of I_Pr[B for each drill hole is the slope from the y-intercept /•0 (not shown in Fig. 22) to the point plotted. The four shaded domains in Figure 22 are distinguished primarily by differences in calculated I_Pr/B, as noted in the figure caption and the key to Figure 23. Comparing Figure 22 to the schematic Figure 4, one sees that domain H, with I-Pr/B between 1.5 and
SINK DOMAINS
OXIDE SULFIDE
'1 * '/:/FLUX ß ** .•* • ./DOMAIN
•C_• = ß •
. • d **• ß SOURCE I • • • DOMAIN
• ' ' • ' o
FIG. 22. Orthogonal plot of blanket metal grade (b) vs. (p -!), modified by densi.ty terms, as in Figure 4, showing data for 112 La Eseondida drill holes. Four domains are identified on the basis of values of I-•r/B, the slope which eormeets each point, as plotted, with a unique intercept, ppffp• (not shown) on the y-axis. Symbols and shading are explained in Figure 23. For domain I, I•r/B is less than or equal to 1.5; for domain H L•/B is greater than or equal to 1.5 and less than or equal to 2.5; domain HI, L•/B is greater than 2.5 and less than 10; and domain IV, I•r]B is negative or greater than 10. Four subdomains within domain HI are based on spatial distribution, as shown in Figure 23. Interpretation in terms of lateral fluxes of copper (open-system evolution; see Fig. 4) indicates that domain I represents source areas and domains HI and IV represent sink areas. Domain HI sinks are manifested principally by sulfide copper in the enriched zone, and the domain IV sink, by abundant copper oxides, where lt• is greater than or approxi- mately equal to ppp. Domain H represents areas of little lateral copper 'flux (closed-system trend).

MASS BALANCE PRINCIPLES APPLIED TO ORE-FORMING PROCESSES 1251
. ß : ',. LT/ • ß ß
[•]I ß • * o•
J- J•] "m' A 'Jr /'"'• k .'-• •
lrT,'O,o.o ß / 0 4 1.0KM ß • --
FIG. 23. Plan view of spatial domains based on contoured values of l.•r/B, showing individual drill holes plotted at northing and e.asting coordinates of blanket midpoints. Subdomains of domain HI are shown in central (A), southern (B), northwestern (C), and eastern (D) portions of map area. Arrows indicate possible directions and distance of implied subsurface copper transport, based on Figure 19B. Solid arrows denote transport to sulfide sinks; open arrow denotes transport to oxide sink (see Fig. 22 and text).
2.5, corresponds best to the closed-system line in Figure 4. Domain I represents a copper deficiency, which can be interpreted either as a zone with negative lateral flux (source region) or as a zone where protore metal grades were overestimated. In contrast, domains !IIA, B, C, and D include holes with a copper surplus, interpretable either as areas of positive lateral flux (sink regions) or as areas where protore grades were underestimated. Domain IH is divided into .four subdomains (A-D), corre- sponding to the spatial distribution of the drill holes, which can be seen in Figure 23.
Subdomain !IIA represents the highest grade and thickest portion of the enrichment blanket as well as the zone of highest protore copper grades. The aeri.al distribution of domain IHA corresponds well to that of the southeastern zone of intrusions and breccias (see Fig. 16). As discussed above, the apparent surplus of copper in this zone can perhaps best be explained by a large positive lateral flux into this zone, although an extremely thick total leached- zone column (e.g., from a breccia pipe) cannot be ruled out. Subdomains IHB and C are located at the extreme southern and northern parts of the map area, respectively, and are predominantly in K silicate-chlorite-sericite-altered andesitc wall rock. These areas also have apparent surplus copper, as manifested by values of LPr/B greater than or equal to 2.5. Subdomain IHD is represented by three drill
holes at the eastern margin of the map area, which have relatively high LPr/B values (greater than or equal to 3.5) and relatively low protore metal grades. The rock type for this subdomain is the rhyolitie porphyry, which hosts a thin enriched zone appar- ently created by positive lateral flux of copper from the west and/or northwest.
Domain IV is manifested primarily in the south- western portion of the study area where biotite- altered andesitc hosts abundant ehrysocolla and bro- chantitc in the oxide zone, to the extent that several holes exhibit I greater than p' and calculated values for lfr < 0. The enrichment blanket in this zone is relatively thin but is locally high grade. In addition to the highly reactive nature of the biotitie assem- blage tO acidic waters, the thin blanket in this zone is probably due to relatively low permeability within this rock and alteration type. Domain IV probably represents areas of positive lateral flux into the oxide zone, or alternatively, areas of extreme vertical protore-grade variation. Detailed mapping and core logging in these areas will make it possible to make a reasonable choice between these competing inter- pretations.
Summary of results from La Escondida
At La Escondida, we are_ faced with the problem of characterizing the supergene-enriehment. process at a large, newly discovered porphyry copper district with abundant available assay data but relatively little geologic control. The results of the mass balance calculations presented herein represent only a first attempt at understanding how supergene processes have affected this district and produced one of the world's largest copper deposits. By looking at the present distribution of a single element (copper) and making various assumptions regarding its initial distribution, we have been able to identify domains within the district with e0nsistent and disrifler prop- erties which can be related to both chemical and physical parameters.
Supergene mass balance calculations for La Es- eondida, assuming no lateral flux and vertically ho- mogeneous protore metal grades (model 1), yield an oxidation surface which is predominantly regular, at an average elevation of roughly 3,300 m above sea level. This is our preliminary estimate for the original average surface elevation at the onset of significant supergene processes without respect to any regional postsupergene tectonic effects. In real- ity, this surface would probably have been gently inclined, perhaps dipping as much as 15 ø southeast; this configuration would provide a surface compatible with observations of relict sulfides near the summits of hills A and B in the district as well as inferred lateral flux vectors for ground-water transport.

1252 BRIMHALL, ALPERS, AND CUNNINGHAM
Local anomalies on the calculated oxidation surface
are presumed to be due either to lateral fluxes of copper in the supergene environment, as indicated by arrows in Figure 19A and B, or to errors in prediction of protore metal grades, as shown in Figure 19C and D. The lateral flux interpretation appears most logical for the highest grade and thick- est portion of the enrichment blanket (subdomain IIIA) as well as an important zone of oxide miner- alization (domain IV), a conclusion reached through consideration of possible errors in protore metal- grade estimation constrained by detailed mapping and observed gradients in protore metal grades with depth.
More often than not, the detailed study of a newly discovered district such as La Escondida results in
the generation of many unanswered questions and stimulating directions for further research. Some other questions which should be addressed in future work at La Escondida include: (1) what was the extent of hypogene leaching and was it controlled by the intrusion of the rhyolitic porphyry, (2) how homogeneous was the protore mineralization and with what confidence can it be extrapolated verti- cally, (3) is the supergene process continuing in the present climate and what was the total flux of water necessary to carry out the observed mass transfer, and (4) at what scale is the district an open vs. a closed system?
Progress toward a Dynamic Model
Two-cycle enrichment
Perched enrichment blankets that are presently in a state of oxidation are not uncommon. Sudden
drops in the ground-water table due to uplift or tilting have been proposed to explain such phenom- ena or their limonitic equivalents, for example, at Toquepala, Peru (Richard and Courtright, 1958; Anderson, 1982). In order to understand the controls on two-cycle enrichment phenomena we have de- rived the expression for blanket metal grade, b, in terms of mass balance variables. The first and second cycles of enrichment are referred to as a and •, respectively. Equation (15) is analogous to equation (5), giving the second-cycle blanket metal grade, b •, in terms of a y-intercept (terms 1 plus 2), and a slope (term 3) times an independent variable (term 4):
b• = p?___•p (B") (b%og - p•Op) (3) (4)
+ oi (15)
In this expression, we see that the initial state for the second cycle of blanket enrichment is essentially equal to the protore metal grade as before (term 1) but has an additional metal contribution given by term (2), the excess metal in the first cycle of blanket enrichment. Also there is a coefficient, B"/ B • which is the thickness ratio of the two blankets.
In term (3), L D is the vertical distance of the ground- water table drop in the leached zone. Note that the ratio LD/B • is analogous to LPr/B in model 1 for single-cycle enrichment. Term (4) is a measure of the extent of the leaching process; the more complete it is, the smaller the value of 1 • and the greater the value of term (4).
The rate of increase in b • is given by term (3). In other words, a more profound ground-water table drop produces a steeper rate at which the second- cycle blanket metal grade increases along with the extent of leaching of the overlying composite zones (first-cycle of enrichment blanket, intervening pro- tore, and original leached zone). From this analysis, we see that the ratio L•/B • for a second cycle of enrichment is exactly analogous to LøT/B for a single oxidation event. In this context, LPr may be thought of as simply a vertical distance corresponding to a change in the position of the ground-water table from an initial state. We may then think of a dynamic supergene system as being the result of an infinite number of small drops in the ground-water table in an overall state of descent. There may be minor up and down fluctuations, but only the net descent intervals cause metal transport in this continuous process.
Domain constancy of L•/B
Within individual geographic or geologic domains, there is good evidence that the ratio LPr/B is now a constant and we have postulated that this ratio has essentially remained constant during geochemical evolution of the composite leaching and enrichment system. That is, as the total distance of the leached zone increased, the thickness of the enrichment blanket increased proportionally so that the ratio LPr/B remained constant. According to equation (5), the enrichment blanket metal grade, b, will increase linearly in a closed system from protore metal grade, p, to a maximum value when leaching is nearly complete. The slope of the b evolution line is LPr/B; the greater this slope, the steeper the increase in the value of b. We have just seen in the case of two-cycle enrichment that an analogous function for second-cycle blanket metal grade exists. In this case, the slope of b • depends on the water table drop distance, L •, divided by the thickness of the second- cycle blanket, B •. We may envision an evolving oxidation-enrichment system as an infinite number
MASS BALANCE PRINCIPLES APPLIED TO ORE-FORMING PROCESSES 1253
of small drops in the water table, including annual seasonal fluctuations occurring as up and down os- cillations on a generally descending trend in time. By this mechanism, copper liberation and enrichment would only occur during times of descent of the ground-water table. Once a stable ground-water table were established, any perched blankets would slowly be oxidized and soluble elements transported downward into the underlying zone of reduction within the deepest enrichment blanket.
There is evidence which suggests that the hydro- logic domain which is most characteristic of the blanket interval is the capillary fringe zone between the unsaturated zone (pores partially filled with air) and the actual water table, below which the pores are filled with water. The height of this capillary fringe zone is inversely proportional to pore radius (Davies and DeWest, 1966). For example, a 0.5-t• pore radius would result in a capillary rise of 30 m, according to a simple tube calculation. It is likely that the average pore size decreases with time within the blanket zone due to continued influx and
reprecipitation of secondary minerals. Thus, one would expect that the capillary fringe height would increase as the depth and extent of leaching in- creases. Pore-size data on the Butte district clearly show predominantly submicron-size pores in the blanket zone (Cunningham, 1984). We propose, therefore, that the blanket thickness, B, is in a general way a direct function of the capillary fringe height, he, and that hc is proportional to the depth of leaching through a constant.
It appears that the value of IPr/B within well- defined domains is simply a function of the local wall-rock characteristics, e.g., alteration type, chem- ical weathering effects, and the manner in which pore-size distribution evolves with time. Just as the enrichment blanket metal grade, b, reaches a maxi- mum value, it is possible that the blanket thickness, B, also approaches a maximum value as effective pore radii diminish to the point of precluding further downward flow. This assumes that the capillary fringe is roughly coincident with the zone of enrich- ment and that the base of enrichment is more or
less coincident with the ground-water table, defined where air pressure equals pore water pressure. This end state of blanket growth may represent a transi- tion from vertical flow to a terminal state with a
significant horizontal flow component due to reduced permeability within the blanket zone. Lateral redis- tribution of metals may then result. Metals leached from the zone of oxidation may migrate downward, encounter an impermeable zone, and then migrate laterally, being fixed at some distance in a permeable portion of the zone of enrichment. A more complete analysis of this subject is the main focus of a subse- quent paper.
Evolution of supergene systems in time
Mass balance relationships derived above to de- scribe the present state of metal distribution may be extended in a simplified fashion to include vari- ation with elapsed time since initiation of chemical weathering. As stated above, we assume that the top of the capillary fringe corresponds roughly to the top of enrichment and the palcoground-water table to the base of enrichment. We include in our
formulation a function to express the elevation of the ground-water table through time. W0 is the initial elevation of the ground-water table at the start of oxidation and dW/dt is the time rate of change of the water table, such that W(t) = W0
dW
+ -•--t. The leached column height expressed as a function of time is given by equation (16), where z0 is the elevation of the land surface at the start of oxidation:
dW
I_2r(t) = z0 - W0 • t - B(t) + Ut. (16) In equation (16), B(t) is the thickness of the enrich- ment blanket at time, t. Initially B(0) may be very small or equal to zero and is likened to the capillary fringe. U is the uplift rate.
With these additions to our treatment of mass
balance, we derive expressions for the leached-zone column height, I_•(t), and enrichment blanket metal grade, b(t), equivalent to equations (3) and (5) and given in equations (17) and (18):
(b(t)pb - ppp) (17) ppp -- l(t)p•
Lg(t) = B(t)- and
b(t) = ppp + f zø - W0 - - dw •-.t+ ut B(t) - 1
X ppp - l(t)p• (18) In these expressions, l(t) is the leached-zone metal grade expressed as a function of time. Although rock densities of the leached zone and enrichment blanket
must also vary in time, we express these densities here as constants for simplicity.
Of major importance in equations (17) and (18) is the functional similarity of these time-dependent expressions with their counterparts, equations (3) and (5), derived for a given instant in time. This is particularly significant when we consider that pro- vision has been included for a changing ground- water table and a variation in total leached-zone
column height with time. In other words, even in a situation in which there has been a descending
1254 BRIMHALL, ALPERS, AND CUNNINGHAM
ground-water table exposing a protore-zone column height of increasing length to deep oxidation, we may still solve for the original leached-zone column height and thereby reconstruct the original oxidation surface.
Furthermore, we see in equation (18), that at any time, t, the blanket metal grade, b(t), in a closed chemical system is a linear function of the extent of leaching (p - l(t)) as in equation (5), with an initial value given by the protore metal grade and a slope given by the leached-zone column height to blanket thickness ratio. Linear data arrays in these coordi- nates for several control volumes from a spatial domain may be interpreted as representing the metal mass distribution at a specific and spatially uniform time, t, since oxidation began. Thus, ob- served variation of LPr/B between spatial domains which exhibit a linear relation between b and p - 1 (apparently closed systems) indicates that between such domains there are: (1) intrinsic differences between the protore characteristics and consequent weathering reactions in each zone, causing differ- ential effects on B(t) and LPr(t) that produce different characteristic slopes, and/or (2) different values of elapsed time, t, in the various zones, or (3) differing rates of movement of the ground-water table, dW/ dt, between domains without a compensating effect in B(t), or (4) systematic lateral fluxes from one domain to another (open chemical system).
General Conclusions and Implications for Exploration
The mass balance methods outlined here provide quantitative understanding of geochemical profiles designed to complement existing mapping, core logging, and assay practice. We have derived equa- tions describing redistribution of metals from the zone of near-surface oxidation and leaching to a deeper zone of enrichment by reprecipitation.
Calculated topographic surfaces using mass bal- ance of geochemical profiles can approximate the land surface at the onset of chemical weathering processes when metals were first transported and fixed in the subsurface by supergene fluids. Local anomalies on these calculated oxidation surfaces
probably correspond to open-system lateral flux re- gions. Such anomalies occur in matched pairs (sources and sinks aligned) along trends of fracturing and faulting. At La Escondida, these source and sink regions are separated over distances exceeding 1 km. Both copper sulfide- and copper oxide-enrich- ment sink regions have been identified. Continued work on oxidation surfaces could indicate regional unconformities associated with major periods of chemical weathering and enrichment of potential use in mineral exploration. Dating of such surfaces, when done in conjunction with estimates of the
amount of erosion of leached capping, may yield reliable long-term erosion rates presently lacking in the literature of geomorphology.
The methods developed, although applied to cop- per profiles, are applicable to many other elements. Other metals enriched by solution and reprecipita- tion in supergene environments include gold, silver, zinc, and nickel, presenting numerous possibilities for further studies. The methods are applicable to ore deposits that are moderately homogeneous such as nickel-cobalt laterites or porphyry copper-gold deposits. More heterogeneous deposits such as vein- controlled copper or lode gold deposits present obvious problems in estimation of lateral and vertical protore metal-grade projections. Another group of elements with a different mechanism of concentra- tion, i.e., removal of nonore metals, also warrants consideration in this respect. This group includes iron, gold, silver, zinc, lead, antimony, tin, nickel, and aluminum. In the case of lateritic weathering and residual metal concentration, it may be necessary to account for major changes in density resulting from rock and soil deformation by collapse.
Metal distribution studies performed during active exploration could better explain ore patterns and geologic controls with the goal of refining drilling strategies. Overall mass balance summing of all lateral fluxes could be a very useful means of iden- tifying exotic or transported metal orebodies since our methods indicate both the magnitude and direc- tions of possible lateral metal fluxes. In either con- text, a critical need exists for deep drilling to pen- etrate far enough into protore masses to define the antecedent hypogene metal variation before weath- ering and remobilization.
Our first-order mass balance expressions include rate expressions for erosion, uplift, and ground- water table movement with time. It is apparent from these considerations that it is necessary to reevaluate the prevalent idea of the necessity of geomorphic stability for supergene processes. Instead of this static condition, we propose that a state of dynamic balance of rates of surficial processes is required for optimal supergene enrichment to be initiated, main- tained, and ultimately preserved over geological time spans. Our analysis shows that a critical param- eter in this regard is the height of the oxidizing protore, LPr, in the unsaturated zone between the top of the capillary fringe and the elevation of the original top of the ore sulfides. This distance is a function of both the rate of change of elevation of the ground-water table, W, and the regional uplift rate, U. Leaching and enrichment processes are enhanced when both rates are high. Climatic varia- tion, specifically wet going to more arid conditions, may cause descent of the ground-water table thereby exposing a longer part of the protore column to

MASS BALANCE PRINCIPLES APPLIED TO ORE-FORMING PROCESSES 1255
oxidizing conditions. Similarly, regional uplift may have the same effect. In combination, high values of both rates, W and U, may be an important reason for the extent of supergene enrichment in active orogenic zones, i.e., the arid deserts of the Chile in contrast to the relative paucity of well-enriched copper deposits in the tropics.
Acknowledgments The support of NSF grant EAR-81-15907 has
made the development and field application of the principles outlined in this paper a reality. In addition, a research grant from Utah International and Getty Minerals has supported the Chilean field program. The Anaconda Company has kindly provided mine access, drilling data, and core samples from the Butte district.
Sustained interest and cooperation of a number of individuals have contributed immensely to this effort including George Burns and Rich Ramseier (Anaconda Company), James Bratt, John Hoyt, Don Rebal, and Patrick Burns (Utah International), Rich- ard Berg and Lester Zeihen (Montana College of Mineral Science and Technology), Ulrich Petersen (Harvard University), Fred Graybeal (Asarco), and especially T. Narasimhan and Bill Dietrich of the University of California-Berkeley.
Constructive criticism and advice has improved the overall effort both in substance and presentation including very helpful reviews by Spence Titley, Andrew Button, and Christopher Blain. Their efforts are much appreciated. Joachim Hampel provided essential technical support. Word processing was performed cheerfully by Janice Elliott, Patty Murtha, and Joan Bossart. Portions of the drafting were done by Donald Miller.
June 18, 1984; January 29, 1985 REFERENCES
Alpers, C. N., Brimhall, G. H, Cunningham, A. B., and Burns, P. J., 1984, Mass balance and timing of supergene enrichment at La Escondida, Antofagasta province, Chile labs.l: Geol. Soc. America Abstracts with Programs, v. 16, p. 428.
Anderson, J. A., 1982, Characteristics of leached capping and techniques of appraisal, in Titley, S. R., ed., Advances in the geology of porphyry copper deposits, southwestern North America: Tucson, Univ. Arizona Press, p. 275-295.
Bateman, A.M., 1950, Economic mineral deposits: New York, John Wiley and Sons, p. 245-287.
Bladh, K. W., 1982, The formation of goethite, jarosite, and alunite during the weathering of sulfide-bearing felsic rocks: ECON. GEOL., v. 77, p. 176-184.
Blain, C. F., and Andrew, R. L., 1977, Sulfide weathering and the evaluation of gossans in mineral exploration: Minerals Sci. Eng., v. 9, p. 119-149.
Blanchard, R., 1968, Interpretation of leached outcrops: Nevada Bur. Mines. Bull., v. 66, 196 p.
Brimhall, G. H, 1977, Early fractured-controlled disseminated mineralization at Butte, Montana: ECON. GEOL., v. 72, p. 37- 59.
-- 1979, Lithologic determination of mass transfer mechanisms
of multiple-stage porphyry copper mineralization at Butte, Montana: Vein formation by hypogene leaching and enrichment of potassium-silicate protore: ECON. GEOL., v. 74, p. 556- 589.
-- 1980, Deep hypogene oxidation of porphyry copper po- tassium-silicate protore at Butte, Montana: A theoretical eval- uation of the copper remobilization hypothesis: ECON. GEOL., v. 75, p. 384-409.
Brimhall, G. H, and Ghiorso, M. S., 1983, Origin and ore- forming consequences of the advanced argillic alteration pro- cess in hypogene environments by magmatic gas contamination of meteoric fluids: ECON. GEOL., v. 78, p. 73-90.
Brimhall, G. H, Gilzean, M. N., and Burnham, C. W., 1983, Magmatic source region protoliths and controls on metallo- genesis: Mica halogen geochemistry labs.]: Am. Geophys. Union Trans., v. 64, p. 884.
Butt, C. R. M., and Nickel, E. H., 1981, Mineralogy and geochemistry of ore weathering of the disseminated nickel sulfide deposit at Mt. Keith, Western Australia: ECON. GEOL., v. 76, p. 1736-1751.
Ch'Svez, W. X., Jr., 1983, Zoning and compositions of hypogene and supergene sulfides, Mantos Blancos district, northern Chile labs.l: Geol. Soc. America Abstracts with Programs, v. 15, p. 542.
Coira, B., Davidson, J., Mpodozis, C., and Ramos, V., 1982, Tectonic and magmatic evolution of the Andes of northern Argentina and Chile: Earth-Sci. Rev., v. 18, p. 303-332.
Cunningham, A. B., 1984, Geologically constrained hydrologic and geochemical modeling of supergene weathering processes using physical rock parameters, geochemical profiles and modal data: Unpub. M.S. thesis, Univ. California, Berkeley, 122 p.
Davis, S. N., and DeWest, R. J. M., 1966, Hydrology: New York, John Wiley and Sons, 187 p.
Elias, M., Donaldson, M. J., and Giorgetla, N. E., 1981, Geology, mineralogy, and chemistry of lateritic nickel-cobalt deposits near Kalgoorlie, Western Australia: ECON. GEOL., v. 76, p. 1775-1783.
Emmons, W. H., 1918, The principles of economic geology: New York, McGraw-Hill, 153 p.
Ford, C., 1982, Escondida geology--overview and ideas: An- tofagasta, Chile, Minera Utah de Chile, Inc., Int. memo, Nov. 17, 1982, 8 p.
-- 1983, Escondida geology: Minera Utah de Chile, Inc., Int. Memo, Nov. 1983, 26 p.
Fuenzalida, H., 1967, Clima: Geografia economica de Chile: Santiago, Chile, CorporaciSn de Formento de la Producci•n, p. 99-156.
Golightly, J.P., 1981, Nickeliferous laterite deposits: ECON. GEOL. 75TH ANNIV. VOL., p. 710-734.
Graybeal, K. T., 1982, Geology of the E1 Tiro area, Silver Bell mining district, Pima County, Arizona, in Titley, S. R., ed., Advances in the geology of porphyry copper deposits, south- western North America: Tucson, Univ. Arizona Press, p. 487- 505.
Grubb, P. L. C., 1979, Genesis of bauxite deposits in the lower Amazon basin and Guianas coastal plain: ECON. GEOL., v. 74, p. 735-75O.
Gustafson, L. B., and Hunt, J.P., 1975, The porphyry copper deposit at E1 Salvador Chile: ECON. GEOL., v. 70, p. 857- 912.
Hollister, V. F., 1978, Geology of the porphyry copper deposits of the western hemisphere: New York, Am. Inst. Mining Metall. Petroleum Engineers, p. 29-137.
Jarrell, O. W., 1944, Oxidation at Chuquicamata, Chile: ECON. GEOL., v. 39, p. 251-286.
Kwong, Y. T. J., Brown, T. H., and Greenwood, H. J., 1982, A thermodynamic approach to the understanding of the super- gene alteration at the Afton copper mine, south-central British Columbia: Canadian Jour. Earth Sci., v. 19, p. 2378-2386.

1256 BRIMHALL, ALPERS, AND CUNNINGHAM
Lindgren, W., 1917, Report on the Chuquicamata lode: Chu- quicamata, Chile, Chile Explor. Co., Private rept., 120 p.
1933, Mineral deposits: New York, Mcgraw-Hill, 930 p. Locke, A., 1926, Leached outcrops as guides to copper ores:
Baltimore, Williams and Wilkins Co., 166 p. Loghry, J. D., 1972, Characteristics of favorable cappings from
several southwestern porphyry copper deposits: Unpub. M.S. thesis, Univ. Arizona, 112 p.
Lowell, J. D., and Guilbert, J. M., 1970, Lateral and vertical alteration-mineralization zoning in porphyry ore deposits: ]•CON. GEOL., v. 65, p. 373-408.
Marozas, D., 1982, The role of silicate mineral alteration in the supergene enrichment process: Unpub. M.S. thesis, Univ. Arizona, 58 p.
McClave, M., 1973, Control and distribution of supergene enrichment in the Berkeley pit, Butte district, Montana, in Miller, R. N., ed., Guidebook for the Butte field meeting, Soc. Econ. Geologists.: Butte, Montana, The Anaconda Co., p. K1-K4.
Mortimer, C., 1973, The Cenozoic history of the southern Atacama desert, Chile: Geol. Soc. London Jour., v. 129, p. 505-526.
Mortimer, C., Munchmeyer, F. C., and Urqueta, D. I., 1977, Emplacement of the Exotica orebody, Chile: Inst. Mining Metallurgy Trans., v. 86, sec. B, p. B121-127.
Newberg, D. W., 1967, Geochemical implications of chrysocolla- bearing alluvial gravels: ECON. GEOL., v. 62, p. 932-956.
Ojeda, J. M., 1982, Complementary instructions: Drillhole log- ging: Antofagasta, Chile, Minera Utah de Chile, Inc., Int. Memo, July 12, 1982, 5 p.
PerellG, J., 1983a, AI menos tres etapas en la evoluciGn del "p(•rtido principal" de Escondida.. Antofagasta, Chile, Minera Utah de Chile, Inc., Int. Memo, May 1983, 6 p.
1983b, Perfiles estratigr•tficos, area de Escondida: Anto- fagasta, Chile, Minera Utah de Chile, Inc., Int. Memo, July 16, 1983, 2 p.
Peterson, N. P., Gilbert, C. M., and Quick, G. L., 1951, Geology and ore deposits of the Castle Dome area, Gila County, Arizona: U.S. Geol. Survey Bull., v. 971, 134 p.
Richard, K., and Courtright, J. H., 1958, Geology of Toquepala, Peru: Mining Eng., Feb. 1958, p. 262-266.
Sangameshwar, S. R., and Barnes, H. L., 1983, Supergene processes in zinc-lead-silver sulfide ores in carbonates: ECON. GEOL., v. 78, p. 1379-1397.
Sato, M., 1960, Oxidation of sulfide ore bodies: 1. Biochemical environments in terms of Eh and pH: ECON. GEOL., v. 55, p. 928-961.
Sheppard, S. M. F., Nielsen, R. L., and Taylor, H. P., Jr., 1969, Oxygen and hydrogen isotope ratios of clay minerals from porphyry copper deposits: ECON. GEOL., v. 64, p. 755-777.
1971, Hydrogen and oxygen isotope ratios in minerals from porphyry copper deposits: ECON. GEOL., v. 66, p. 515- 542.
Sillitoe, R. H., Jamarillo, L., and Castro, H., 1984, Geologic exploration of a molybdenum-rich porphyry copper deposit at Macoa, Colombia: ECON. GEOL., v. 79, p. 106-123.
Stoertz, G. E., and Ericksen, G. E., 1974, Geology of salars in northern Chile: U.S. Geol. Survey Prof. Paper 811, 65 p.
TitIcy, S. R., 1978, Geologic history, hypogene features, and processes of secondary sulfide enrichment at the Plesyumi copper prospect, New Britain, Papua New Guinea: ECON. GEOL., v. 73, p. 765-784.
TitIcy, S. R., and Beane, R. E., 1981, Porphyry copper deposits: ECON. GEOL. 75TH ANNIV. VOL., p. 214-269.