Detailed Characterization of Solute Transport in a Heterogeneous Field Soil
11
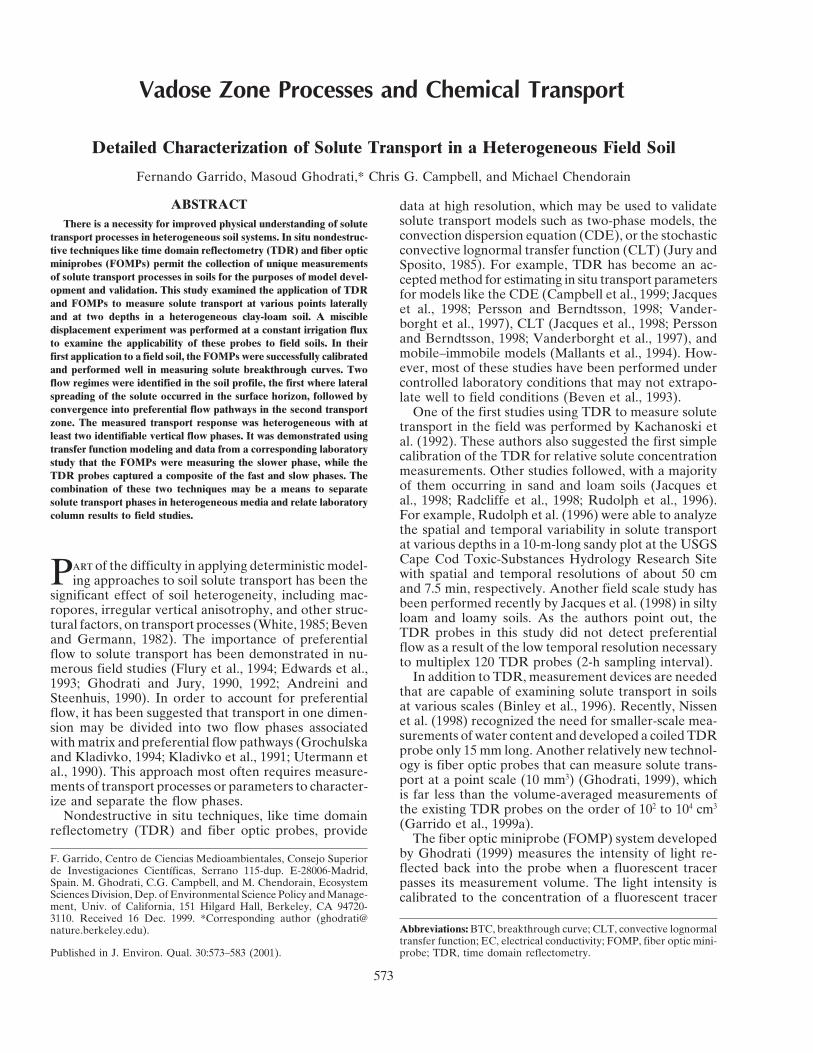
Vadose Zone Processes and Chemical Transport Detailed Characterization of Solute Transport in a Heterogeneous Field Soil Fernando Garrido, Masoud Ghodrati,* Chris G. Campbell, and Michael Chendorain ABSTRACT data at high resolution, which may be used to validate solute transport models such as two-phase models, the There is a necessity for improved physical understanding of solute convection dispersion equation (CDE), or the stochastic transport processes in heterogeneous soil systems. In situ nondestruc- tive techniques like time domain reflectometry (TDR) and fiber optic convective lognormal transfer function (CLT) (Jury and miniprobes (FOMPs) permit the collection of unique measurements Sposito, 1985). For example, TDR has become an ac- of solute transport processes in soils for the purposes of model devel- cepted method for estimating in situ transport parameters opment and validation. This study examined the application of TDR for models like the CDE (Campbell et al., 1999; Jacques and FOMPs to measure solute transport at various points laterally et al., 1998; Persson and Berndtsson, 1998; Vander- and at two depths in a heterogeneous clay-loam soil. A miscible borght et al., 1997), CLT (Jacques et al., 1998; Persson displacement experiment was performed at a constant irrigation flux and Berndtsson, 1998; Vanderborght et al., 1997), and to examine the applicability of these probes to field soils. In their mobile–immobile models (Mallants et al., 1994). How- first application to a field soil, the FOMPs were successfully calibrated ever, most of these studies have been performed under and performed well in measuring solute breakthrough curves. Two flow regimes were identified in the soil profile, the first where lateral controlled laboratory conditions that may not extrapo- spreading of the solute occurred in the surface horizon, followed by late well to field conditions (Beven et al., 1993). convergence into preferential flow pathways in the second transport One of the first studies using TDR to measure solute zone. The measured transport response was heterogeneous with at transport in the field was performed by Kachanoski et least two identifiable vertical flow phases. It was demonstrated using al. (1992). These authors also suggested the first simple transfer function modeling and data from a corresponding laboratory calibration of the TDR for relative solute concentration study that the FOMPs were measuring the slower phase, while the measurements. Other studies followed, with a majority TDR probes captured a composite of the fast and slow phases. The of them occurring in sand and loam soils (Jacques et combination of these two techniques may be a means to separate al., 1998; Radcliffe et al., 1998; Rudolph et al., 1996). solute transport phases in heterogeneous media and relate laboratory column results to field studies. For example, Rudolph et al. (1996) were able to analyze the spatial and temporal variability in solute transport at various depths in a 10-m-long sandy plot at the USGS Cape Cod Toxic-Substances Hydrology Research Site P art of the difficulty in applying deterministic model- with spatial and temporal resolutions of about 50 cm ing approaches to soil solute transport has been the and 7.5 min, respectively. Another field scale study has significant effect of soil heterogeneity, including mac- been performed recently by Jacques et al. (1998) in silty ropores, irregular vertical anisotrophy, and other struc- loam and loamy soils. As the authors point out, the tural factors, on transport processes (White, 1985; Beven TDR probes in this study did not detect preferential and Germann, 1982). The importance of preferential flow as a result of the low temporal resolution necessary flow to solute transport has been demonstrated in nu- to multiplex 120 TDR probes (2-h sampling interval). merous field studies (Flury et al., 1994; Edwards et al., In addition to TDR, measurement devices are needed 1993; Ghodrati and Jury, 1990, 1992; Andreini and that are capable of examining solute transport in soils Steenhuis, 1990). In order to account for preferential at various scales (Binley et al., 1996). Recently, Nissen flow, it has been suggested that transport in one dimen- et al. (1998) recognized the need for smaller-scale mea- sion may be divided into two flow phases associated surements of water content and developed a coiled TDR with matrix and preferential flow pathways (Grochulska probe only 15 mm long. Another relatively new technol- and Kladivko, 1994; Kladivko et al., 1991; Utermann et ogy is fiber optic probes that can measure solute trans- al., 1990). This approach most often requires measure- port at a point scale (10 mm 3 ) (Ghodrati, 1999), which ments of transport processes or parameters to character- is far less than the volume-averaged measurements of ize and separate the flow phases. the existing TDR probes on the order of 10 2 to 10 4 cm 3 Nondestructive in situ techniques, like time domain (Garrido et al., 1999a). reflectometry (TDR) and fiber optic probes, provide The fiber optic miniprobe (FOMP) system developed by Ghodrati (1999) measures the intensity of light re- F. Garrido, Centro de Ciencias Medioambientales, Consejo Superior flected back into the probe when a fluorescent tracer de Investigaciones Cientı ´ficas, Serrano 115-dup. E-28006-Madrid, Spain. M. Ghodrati, C.G. Campbell, and M. Chendorain, Ecosystem passes its measurement volume. The light intensity is Sciences Division, Dep. of Environmental Science Policy and Manage- calibrated to the concentration of a fluorescent tracer ment, Univ. of California, 151 Hilgard Hall, Berkeley, CA 94720- 3110. Received 16 Dec. 1999. *Corresponding author (ghodrati@ Abbreviations: BTC, breakthrough curve; CLT, convective lognormal nature.berkeley.edu). transfer function; EC, electrical conductivity; FOMP, fiber optic mini- probe; TDR, time domain reflectometry. Published in J. Environ. Qual. 30:573–583 (2001). 573
-
Upload
independent -
Category
Documents
-
view
2 -
download
0
Transcript of Detailed Characterization of Solute Transport in a Heterogeneous Field Soil
Vadose Zone Processes and Chemical Transport
Detailed Characterization of Solute Transport in a Heterogeneous Field Soil
Fernando Garrido, Masoud Ghodrati,* Chris G. Campbell, and Michael Chendorain
ABSTRACT data at high resolution, which may be used to validatesolute transport models such as two-phase models, theThere is a necessity for improved physical understanding of soluteconvection dispersion equation (CDE), or the stochastictransport processes in heterogeneous soil systems. In situ nondestruc-
tive techniques like time domain reflectometry (TDR) and fiber optic convective lognormal transfer function (CLT) (Jury andminiprobes (FOMPs) permit the collection of unique measurements Sposito, 1985). For example, TDR has become an ac-of solute transport processes in soils for the purposes of model devel- cepted method for estimating in situ transport parametersopment and validation. This study examined the application of TDR for models like the CDE (Campbell et al., 1999; Jacquesand FOMPs to measure solute transport at various points laterally et al., 1998; Persson and Berndtsson, 1998; Vander-and at two depths in a heterogeneous clay-loam soil. A miscible
borght et al., 1997), CLT (Jacques et al., 1998; Perssondisplacement experiment was performed at a constant irrigation fluxand Berndtsson, 1998; Vanderborght et al., 1997), andto examine the applicability of these probes to field soils. In theirmobile–immobile models (Mallants et al., 1994). How-first application to a field soil, the FOMPs were successfully calibratedever, most of these studies have been performed underand performed well in measuring solute breakthrough curves. Two
flow regimes were identified in the soil profile, the first where lateral controlled laboratory conditions that may not extrapo-spreading of the solute occurred in the surface horizon, followed by late well to field conditions (Beven et al., 1993).convergence into preferential flow pathways in the second transport One of the first studies using TDR to measure solutezone. The measured transport response was heterogeneous with at transport in the field was performed by Kachanoski etleast two identifiable vertical flow phases. It was demonstrated using al. (1992). These authors also suggested the first simpletransfer function modeling and data from a corresponding laboratory calibration of the TDR for relative solute concentrationstudy that the FOMPs were measuring the slower phase, while the
measurements. Other studies followed, with a majorityTDR probes captured a composite of the fast and slow phases. Theof them occurring in sand and loam soils (Jacques etcombination of these two techniques may be a means to separateal., 1998; Radcliffe et al., 1998; Rudolph et al., 1996).solute transport phases in heterogeneous media and relate laboratory
column results to field studies. For example, Rudolph et al. (1996) were able to analyzethe spatial and temporal variability in solute transportat various depths in a 10-m-long sandy plot at the USGSCape Cod Toxic-Substances Hydrology Research SitePart of the difficulty in applying deterministic model-with spatial and temporal resolutions of about 50 cming approaches to soil solute transport has been theand 7.5 min, respectively. Another field scale study hassignificant effect of soil heterogeneity, including mac-been performed recently by Jacques et al. (1998) in siltyropores, irregular vertical anisotrophy, and other struc-loam and loamy soils. As the authors point out, thetural factors, on transport processes (White, 1985; BevenTDR probes in this study did not detect preferentialand Germann, 1982). The importance of preferentialflow as a result of the low temporal resolution necessaryflow to solute transport has been demonstrated in nu-to multiplex 120 TDR probes (2-h sampling interval).merous field studies (Flury et al., 1994; Edwards et al.,
In addition to TDR, measurement devices are needed1993; Ghodrati and Jury, 1990, 1992; Andreini andthat are capable of examining solute transport in soilsSteenhuis, 1990). In order to account for preferentialat various scales (Binley et al., 1996). Recently, Nissenflow, it has been suggested that transport in one dimen-et al. (1998) recognized the need for smaller-scale mea-sion may be divided into two flow phases associatedsurements of water content and developed a coiled TDRwith matrix and preferential flow pathways (Grochulskaprobe only 15 mm long. Another relatively new technol-and Kladivko, 1994; Kladivko et al., 1991; Utermann etogy is fiber optic probes that can measure solute trans-al., 1990). This approach most often requires measure-port at a point scale (10 mm3) (Ghodrati, 1999), whichments of transport processes or parameters to character-is far less than the volume-averaged measurements ofize and separate the flow phases.the existing TDR probes on the order of 102 to 104 cm3
Nondestructive in situ techniques, like time domain(Garrido et al., 1999a).reflectometry (TDR) and fiber optic probes, provide
The fiber optic miniprobe (FOMP) system developedby Ghodrati (1999) measures the intensity of light re-F. Garrido, Centro de Ciencias Medioambientales, Consejo Superiorflected back into the probe when a fluorescent tracerde Investigaciones Cientıficas, Serrano 115-dup. E-28006-Madrid,
Spain. M. Ghodrati, C.G. Campbell, and M. Chendorain, Ecosystem passes its measurement volume. The light intensity isSciences Division, Dep. of Environmental Science Policy and Manage- calibrated to the concentration of a fluorescent tracerment, Univ. of California, 151 Hilgard Hall, Berkeley, CA 94720-3110. Received 16 Dec. 1999. *Corresponding author (ghodrati@
Abbreviations: BTC, breakthrough curve; CLT, convective lognormalnature.berkeley.edu).transfer function; EC, electrical conductivity; FOMP, fiber optic mini-probe; TDR, time domain reflectometry.Published in J. Environ. Qual. 30:573–583 (2001).
573
574 J. ENVIRON. QUAL., VOL. 30, MARCH–APRIL 2001
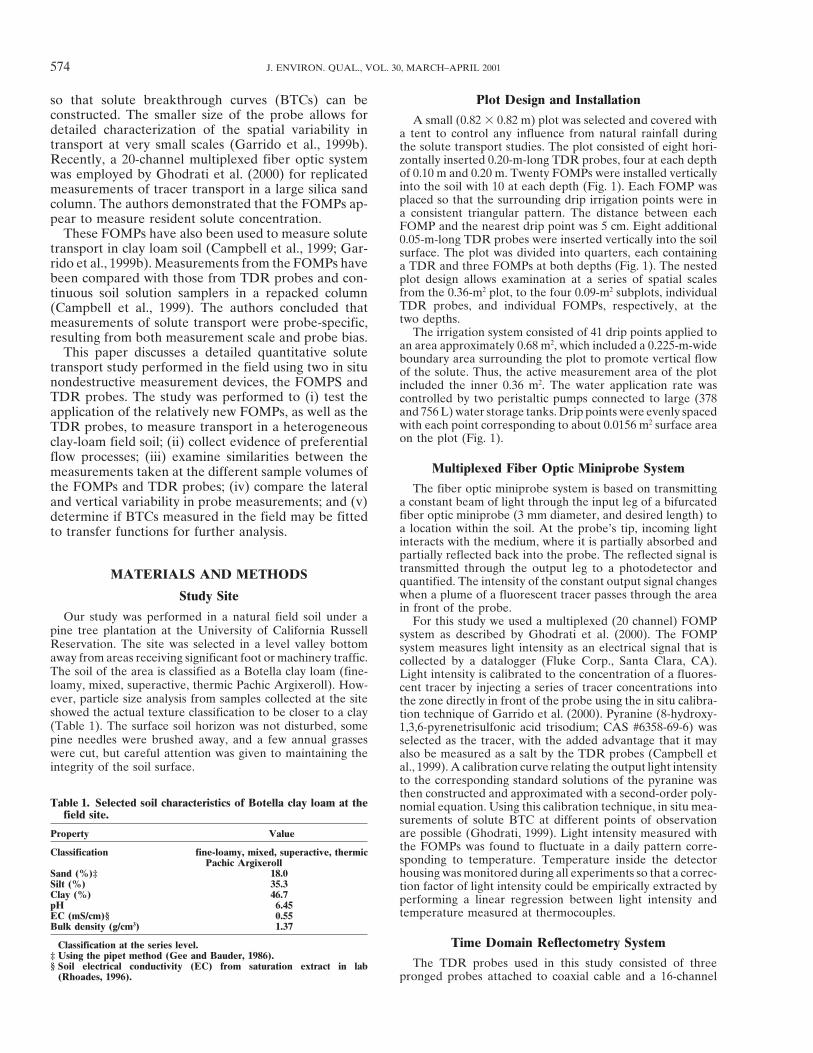
Plot Design and Installationso that solute breakthrough curves (BTCs) can beconstructed. The smaller size of the probe allows for A small (0.82 3 0.82 m) plot was selected and covered withdetailed characterization of the spatial variability in a tent to control any influence from natural rainfall duringtransport at very small scales (Garrido et al., 1999b). the solute transport studies. The plot consisted of eight hori-Recently, a 20-channel multiplexed fiber optic system zontally inserted 0.20-m-long TDR probes, four at each depth
of 0.10 m and 0.20 m. Twenty FOMPs were installed verticallywas employed by Ghodrati et al. (2000) for replicatedinto the soil with 10 at each depth (Fig. 1). Each FOMP wasmeasurements of tracer transport in a large silica sandplaced so that the surrounding drip irrigation points were incolumn. The authors demonstrated that the FOMPs ap-a consistent triangular pattern. The distance between eachpear to measure resident solute concentration.FOMP and the nearest drip point was 5 cm. Eight additional
These FOMPs have also been used to measure solute 0.05-m-long TDR probes were inserted vertically into the soiltransport in clay loam soil (Campbell et al., 1999; Gar- surface. The plot was divided into quarters, each containingrido et al., 1999b). Measurements from the FOMPs have a TDR and three FOMPs at both depths (Fig. 1). The nestedbeen compared with those from TDR probes and con- plot design allows examination at a series of spatial scales
from the 0.36-m2 plot, to the four 0.09-m2 subplots, individualtinuous soil solution samplers in a repacked columnTDR probes, and individual FOMPs, respectively, at the(Campbell et al., 1999). The authors concluded thattwo depths.measurements of solute transport were probe-specific,
The irrigation system consisted of 41 drip points applied toresulting from both measurement scale and probe bias.an area approximately 0.68 m2, which included a 0.225-m-wideThis paper discusses a detailed quantitative solute boundary area surrounding the plot to promote vertical flow
transport study performed in the field using two in situ of the solute. Thus, the active measurement area of the plotnondestructive measurement devices, the FOMPS and included the inner 0.36 m2. The water application rate wasTDR probes. The study was performed to (i) test the controlled by two peristaltic pumps connected to large (378
and 756 L) water storage tanks. Drip points were evenly spacedapplication of the relatively new FOMPs, as well as thewith each point corresponding to about 0.0156 m2 surface areaTDR probes, to measure transport in a heterogeneouson the plot (Fig. 1).clay-loam field soil; (ii) collect evidence of preferential
flow processes; (iii) examine similarities between theMultiplexed Fiber Optic Miniprobe Systemmeasurements taken at the different sample volumes of
the FOMPs and TDR probes; (iv) compare the lateral The fiber optic miniprobe system is based on transmittinga constant beam of light through the input leg of a bifurcatedand vertical variability in probe measurements; and (v)fiber optic miniprobe (3 mm diameter, and desired length) todetermine if BTCs measured in the field may be fitteda location within the soil. At the probe’s tip, incoming lightto transfer functions for further analysis.interacts with the medium, where it is partially absorbed andpartially reflected back into the probe. The reflected signal istransmitted through the output leg to a photodetector andMATERIALS AND METHODS quantified. The intensity of the constant output signal changeswhen a plume of a fluorescent tracer passes through the areaStudy Sitein front of the probe.
Our study was performed in a natural field soil under a For this study we used a multiplexed (20 channel) FOMPpine tree plantation at the University of California Russell system as described by Ghodrati et al. (2000). The FOMPReservation. The site was selected in a level valley bottom system measures light intensity as an electrical signal that isaway from areas receiving significant foot or machinery traffic. collected by a datalogger (Fluke Corp., Santa Clara, CA).The soil of the area is classified as a Botella clay loam (fine- Light intensity is calibrated to the concentration of a fluores-loamy, mixed, superactive, thermic Pachic Argixeroll). How- cent tracer by injecting a series of tracer concentrations intoever, particle size analysis from samples collected at the site the zone directly in front of the probe using the in situ calibra-showed the actual texture classification to be closer to a clay tion technique of Garrido et al. (2000). Pyranine (8-hydroxy-(Table 1). The surface soil horizon was not disturbed, some 1,3,6-pyrenetrisulfonic acid trisodium; CAS #6358-69-6) waspine needles were brushed away, and a few annual grasses selected as the tracer, with the added advantage that it maywere cut, but careful attention was given to maintaining the also be measured as a salt by the TDR probes (Campbell et
al., 1999). A calibration curve relating the output light intensityintegrity of the soil surface.to the corresponding standard solutions of the pyranine wasthen constructed and approximated with a second-order poly-
Table 1. Selected soil characteristics of Botella clay loam at the nomial equation. Using this calibration technique, in situ mea-field site. surements of solute BTC at different points of observation
Property Value are possible (Ghodrati, 1999). Light intensity measured withthe FOMPs was found to fluctuate in a daily pattern corre-Classification† fine-loamy, mixed, superactive, thermicsponding to temperature. Temperature inside the detectorPachic Argixeroll
Sand (%)‡ 18.0 housing was monitored during all experiments so that a correc-Silt (%) 35.3 tion factor of light intensity could be empirically extracted byClay (%) 46.7 performing a linear regression between light intensity andpH 6.45
temperature measured at thermocouples.EC (mS/cm)§ 0.55Bulk density (g/cm3) 1.37
Time Domain Reflectometry System† Classification at the series level.‡ Using the pipet method (Gee and Bauder, 1986).
The TDR probes used in this study consisted of three§ Soil electrical conductivity (EC) from saturation extract in lab(Rhoades, 1996). pronged probes attached to coaxial cable and a 16-channel
GARRIDO ET AL.: CHARACTERIZATION OF SOLUTE TRANSPORT IN FIELD SOIL 575
Fig. 1. Schematic plot design and instrumentation. Fiber optic miniprobes (FOMPs) and time domain reflectometry (TDR) are identified bytheir respective numbers at each depth level.
multiplexer that connected the coaxial cable to a Tektronix EC of the soil solution to tracer concentration were linear,then relative EC could be used to obtain relative resident1502C pulse generator (Dynamax Corp., Houston, TX). The
probes were used to carry an electromagnetic pulse from the concentration (C r/Co) for all TDR probes of both 0.05 and0.20 m length:pulse generator to the soil. The electrical signal that returns
to the pulse generator is a function of the material it movesthrough, in contact with the probes (Topp and Davis, 1984). C r
Co
5ECECo
5[ECz,t 2 ECi][ECo 2 ECi]
[2]The apparent permitivity of the material (also known as thedielectric constant) determines travel time of the electricalpulse. The change in this signal may be calibrated to soil water where ECz,t is the EC measured over time at a given depth,content for a given soil (Topp and Davis, 1984). In addition ECo is the EC of the initial concentration of the tracer pulse,to water content, bulk soil electrical conductivity can be mea- and ECi is the baseline before the tracer application (Kacha-sured using the change in magnitude of the reflected signal noski et al., 1992). As the ZL measurements are temperatureor impedance loading (Topp et al., 1988; Dalton and van dependent, a correction technique proposed by HeimovaaraGenuchten, 1986). Electrical conductivity is, for a large part, et al. (1995) was applied, which is a simple linear regressiondetermined by solute concentration, and this has lead to the similar to our FOMP temperature correction.employment of TDR probes to monitor solute transport usingany salt as a tracer. Miscible Displacement Studies
There have been numerous methods proposed for the cali-The plot was irrigated for more than a week at 1.5 cm/hbration of change in the TDR measured relative impedance
until a steady-state water content (measured with the TDRloading (ZL) to bulk soil electrical conductivity (EC) and thenprobes) was reached. At steady state, a 20-mm pulse of theto solute concentration. These methods, and their assump-fluorescent tracer, pyranine, was applied at a concentrationtions, have been reviewed by Mallants et al. (1996). This studyof 4 g/L. One pulse of pyranine was approximately 7 L andemployed the methodology discussed for horizontally insertedwas applied in less than 1 h. Once the pulse was applied toprobes by Campbell et al. (1999) for both the 0.20- and 0.05-the plot, irrigation of fresh water resumed at the same rate. Thecm-long TDR probes. In short, concentration was estimatedplot was leached for 4 to 5 d following the pulse application.by calibrating the ZL measurements from the TDR to the
The FOMP and TDR systems collected data at 5- and 10-electrical conductivity of the solution in the soil pore space.min intervals, respectively. Data measured by the probes wasBulk soil EC was estimated by fitting a geometric constant,converted to concentration using the calibration curves andKc, from ZL data obtained while immersing TDR probes intoBTCs were constructed. Mass recovery was calculated usingsolutions of known concentration using the equation proposedplot average values for the water content measured by theby Nadler et al. (1991):0.20-cm TDR probes and the irrigation flux. In order to ana-lyze flow phases measured by the TDR probes the potentialECbulk 5 KcZ21
L [1]to fit the BTCs to transfer function models was examined.The CLT equation used was:Using this equation, the Kc values were empirically deter-
mined for each probe of both the 0.20- and 0.05-cm lengths.Bulk soil EC was then related to solution EC by saturating
the soil with two solutions of CaCl2 with known EC. Then, aCrt* (z,t) 5
lz
1
sl√2pexp32
3ln1tlz2 2 ml42
2sl2l
2 ml 2s2
l
2 4third relationship was developed for concentration of pyranineand its EC. Once it was established that the relationshipsbetween EC of the bulk soil to EC of the soil solution and [3]
576 J. ENVIRON. QUAL., VOL. 30, MARCH–APRIL 2001
where ml and sl are the mean and variance of the natural was performed on both fits of the CLT to the two flow phases,demonstrating the suitability of the parameter estimationlog transformed solute travel times normalized to depth l
(Vanderborght et al., 1996) and Crt* (z,t), as described by (data not shown).In addition to the transfer function analysis, an independentVanderborght et al. (1996), is the time integral resident con-
centration. The concentration is dependent on both depth statistical moment analysis was performed to compare thenormalized travel time of the BTCs constructed from FOMPand time.
Pyranine was used as a tracer in these experiments and was data with those from the TDR (Jury and Roth, 1990). Themoments also allow a comparison between the modeled andsubject to retardation during movement through the soil. A
retardation factor of 1.43 was estimated in previous laboratory actual travel times of the tracer (Valocchi, 1990).studies and applied to Eq. [3] (Garrido et al., 1999b). AddingR results in this equation: RESULTS AND DISCUSSION
Fiber Optic Miniprobe System MeasurementsCrt* (z,t) 5lz
1
sl√2p The FOMPS performed well in the field with a suc-cessful calibration for 19 of the 20 probes using thecalibration method presented in Garrido et al. (2000).
exp323ln1 tl
Rz2 2 ml42
2s2ll
2 ml 2s2
l
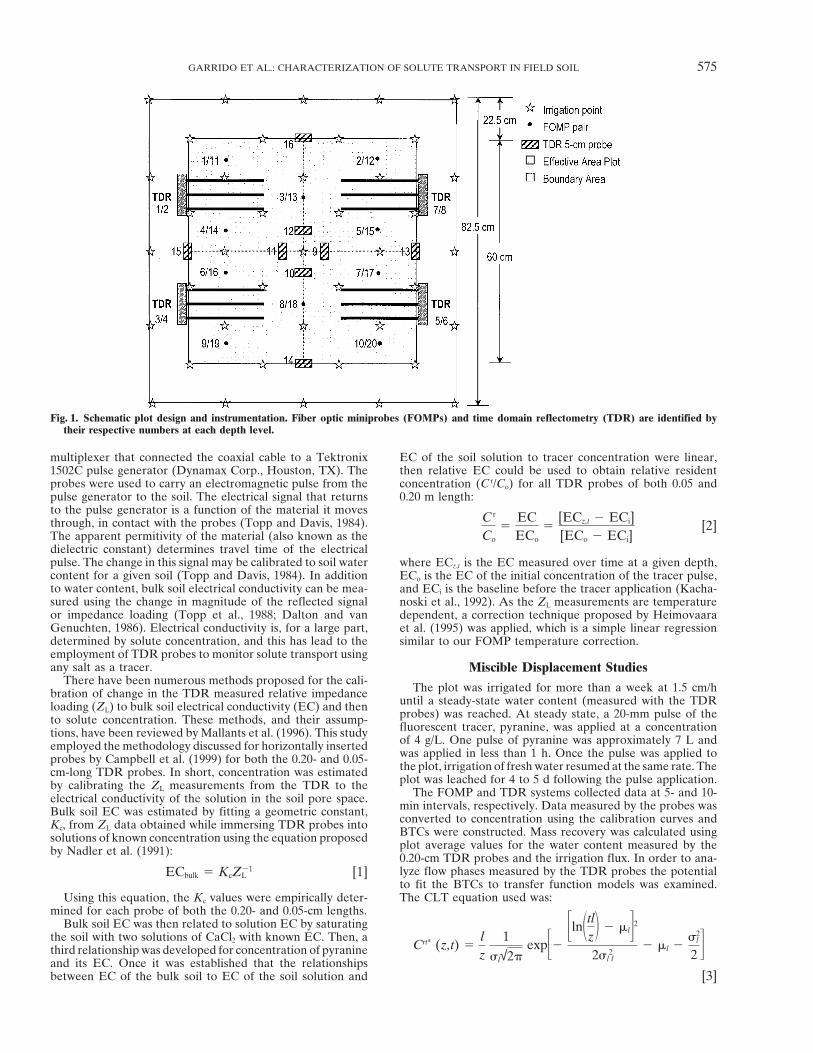
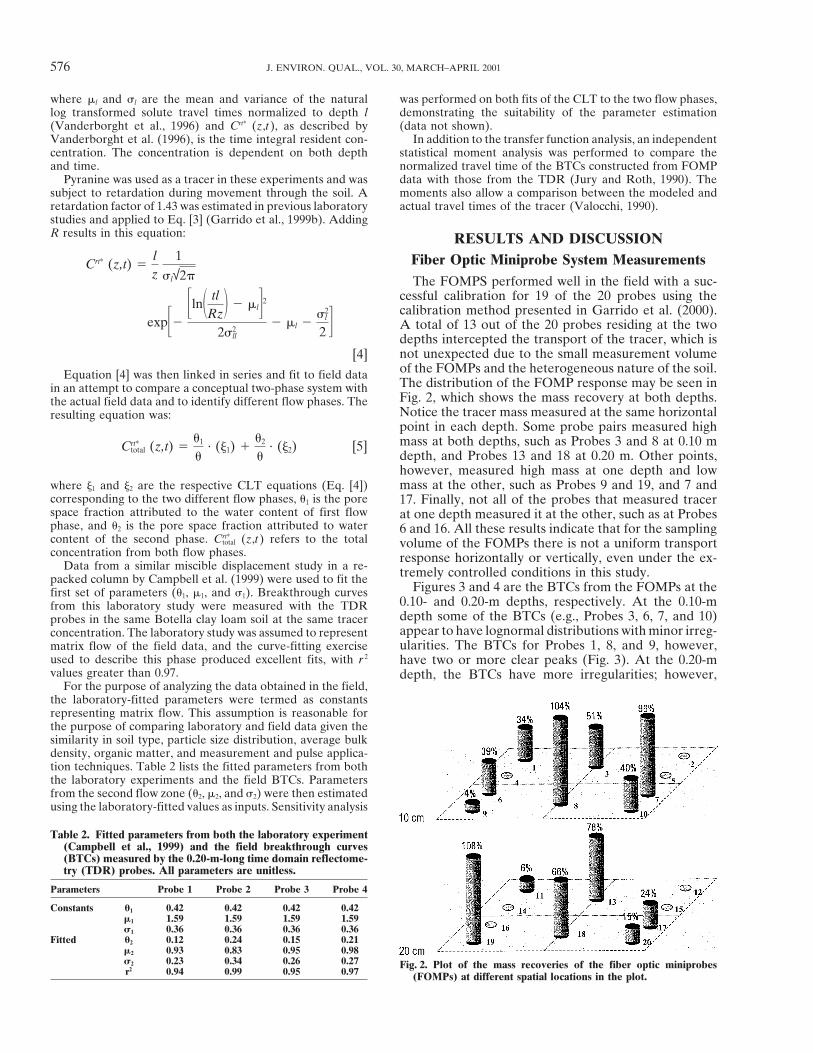
2 4 A total of 13 out of the 20 probes residing at the twodepths intercepted the transport of the tracer, which isnot unexpected due to the small measurement volume[4]of the FOMPs and the heterogeneous nature of the soil.Equation [4] was then linked in series and fit to field dataThe distribution of the FOMP response may be seen inin an attempt to compare a conceptual two-phase system withFig. 2, which shows the mass recovery at both depths.the actual field data and to identify different flow phases. TheNotice the tracer mass measured at the same horizontalresulting equation was:point in each depth. Some probe pairs measured highmass at both depths, such as Probes 3 and 8 at 0.10 mCrt*
total (z,t) 5u1
u· (j1) 1
u2
u· (j2) [5]
depth, and Probes 13 and 18 at 0.20 m. Other points,however, measured high mass at one depth and lowmass at the other, such as Probes 9 and 19, and 7 andwhere j1 and j2 are the respective CLT equations (Eq. [4])
corresponding to the two different flow phases, u1 is the pore 17. Finally, not all of the probes that measured tracerspace fraction attributed to the water content of first flow at one depth measured it at the other, such as at Probesphase, and u2 is the pore space fraction attributed to water 6 and 16. All these results indicate that for the samplingcontent of the second phase. Crt*
total (z,t) refers to the total volume of the FOMPs there is not a uniform transportconcentration from both flow phases. response horizontally or vertically, even under the ex-
Data from a similar miscible displacement study in a re- tremely controlled conditions in this study.packed column by Campbell et al. (1999) were used to fit theFigures 3 and 4 are the BTCs from the FOMPs at thefirst set of parameters (u1, m1, and s1). Breakthrough curves
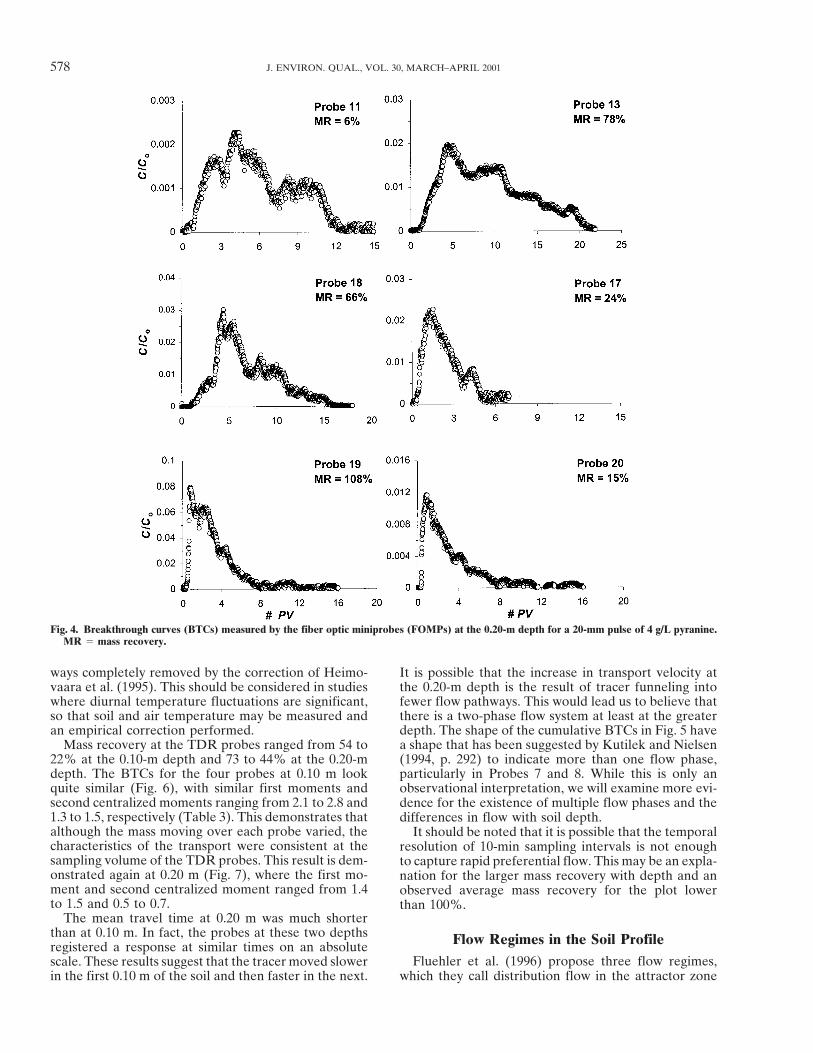
0.10- and 0.20-m depths, respectively. At the 0.10-mfrom this laboratory study were measured with the TDRdepth some of the BTCs (e.g., Probes 3, 6, 7, and 10)probes in the same Botella clay loam soil at the same tracerappear to have lognormal distributions with minor irreg-concentration. The laboratory study was assumed to representularities. The BTCs for Probes 1, 8, and 9, however,matrix flow of the field data, and the curve-fitting exercise
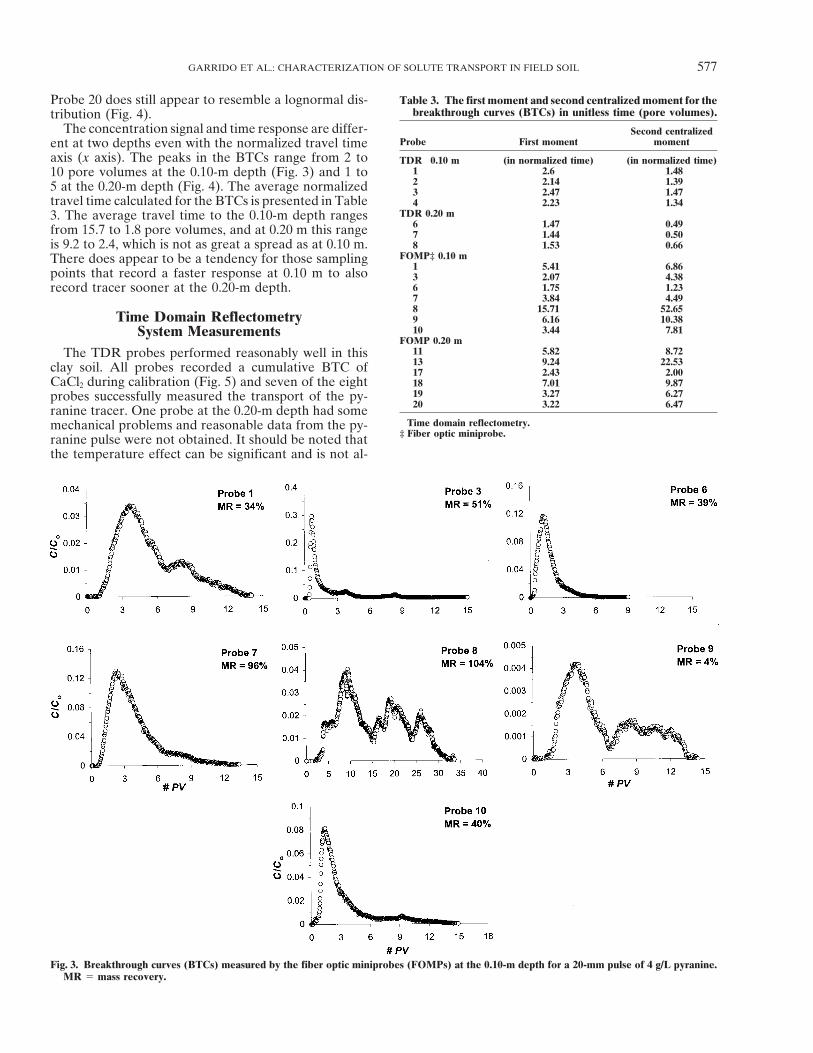
used to describe this phase produced excellent fits, with r 2 have two or more clear peaks (Fig. 3). At the 0.20-mvalues greater than 0.97. depth, the BTCs have more irregularities; however,
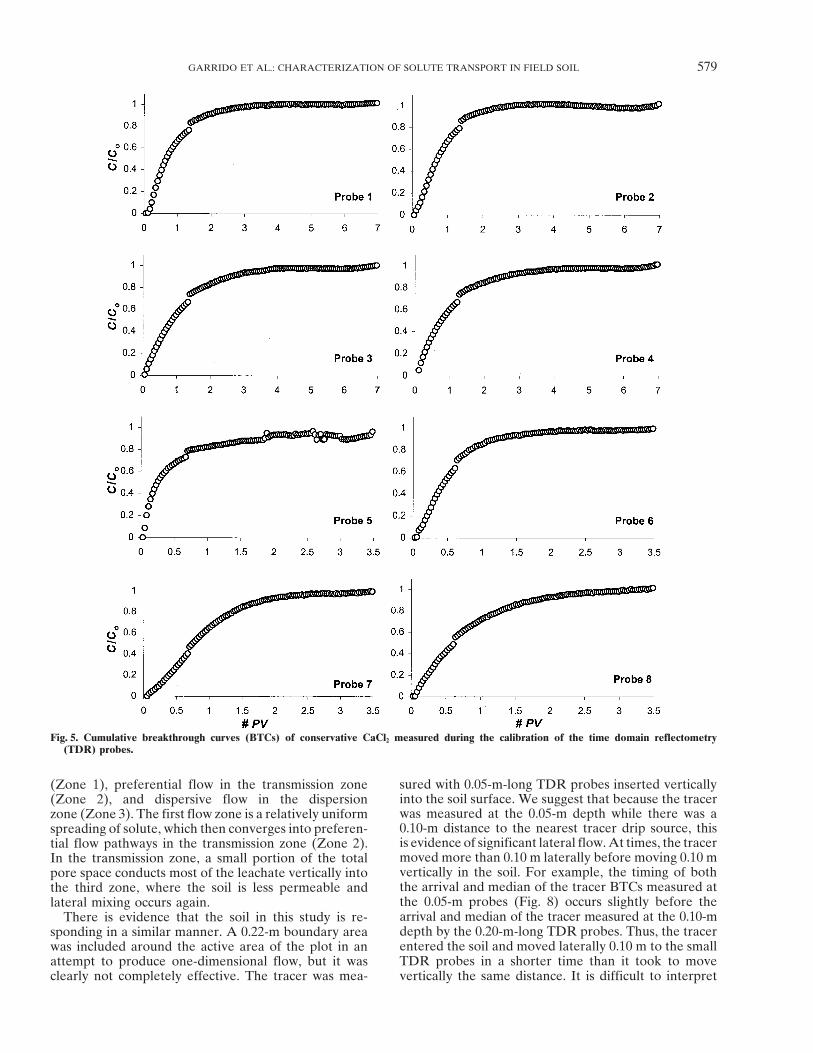
For the purpose of analyzing the data obtained in the field,the laboratory-fitted parameters were termed as constantsrepresenting matrix flow. This assumption is reasonable forthe purpose of comparing laboratory and field data given thesimilarity in soil type, particle size distribution, average bulkdensity, organic matter, and measurement and pulse applica-tion techniques. Table 2 lists the fitted parameters from boththe laboratory experiments and the field BTCs. Parametersfrom the second flow zone (u2, m2, and s2) were then estimatedusing the laboratory-fitted values as inputs. Sensitivity analysis
Table 2. Fitted parameters from both the laboratory experiment(Campbell et al., 1999) and the field breakthrough curves(BTCs) measured by the 0.20-m-long time domain reflectome-try (TDR) probes. All parameters are unitless.
Parameters Probe 1 Probe 2 Probe 3 Probe 4
Constants u1 0.42 0.42 0.42 0.42m1 1.59 1.59 1.59 1.59s1 0.36 0.36 0.36 0.36
Fitted u2 0.12 0.24 0.15 0.21m2 0.93 0.83 0.95 0.98s2 0.23 0.34 0.26 0.27 Fig. 2. Plot of the mass recoveries of the fiber optic miniprobesr2 0.94 0.99 0.95 0.97 (FOMPs) at different spatial locations in the plot.
GARRIDO ET AL.: CHARACTERIZATION OF SOLUTE TRANSPORT IN FIELD SOIL 577
Probe 20 does still appear to resemble a lognormal dis- Table 3. The first moment and second centralized moment for thebreakthrough curves (BTCs) in unitless time (pore volumes).tribution (Fig. 4).
The concentration signal and time response are differ- Second centralizedProbe First moment momentent at two depths even with the normalized travel time
axis (x axis). The peaks in the BTCs range from 2 to TDR† 0.10 m (in normalized time) (in normalized time)1 2.6 1.4810 pore volumes at the 0.10-m depth (Fig. 3) and 1 to2 2.14 1.395 at the 0.20-m depth (Fig. 4). The average normalized 3 2.47 1.47
travel time calculated for the BTCs is presented in Table 4 2.23 1.34TDR 0.20 m3. The average travel time to the 0.10-m depth ranges
6 1.47 0.49from 15.7 to 1.8 pore volumes, and at 0.20 m this range 7 1.44 0.50is 9.2 to 2.4, which is not as great a spread as at 0.10 m. 8 1.53 0.66
FOMP‡ 0.10 mThere does appear to be a tendency for those sampling1 5.41 6.86points that record a faster response at 0.10 m to also 3 2.07 4.386 1.75 1.23record tracer sooner at the 0.20-m depth.7 3.84 4.498 15.71 52.65
Time Domain Reflectometry 9 6.16 10.3810 3.44 7.81System Measurements
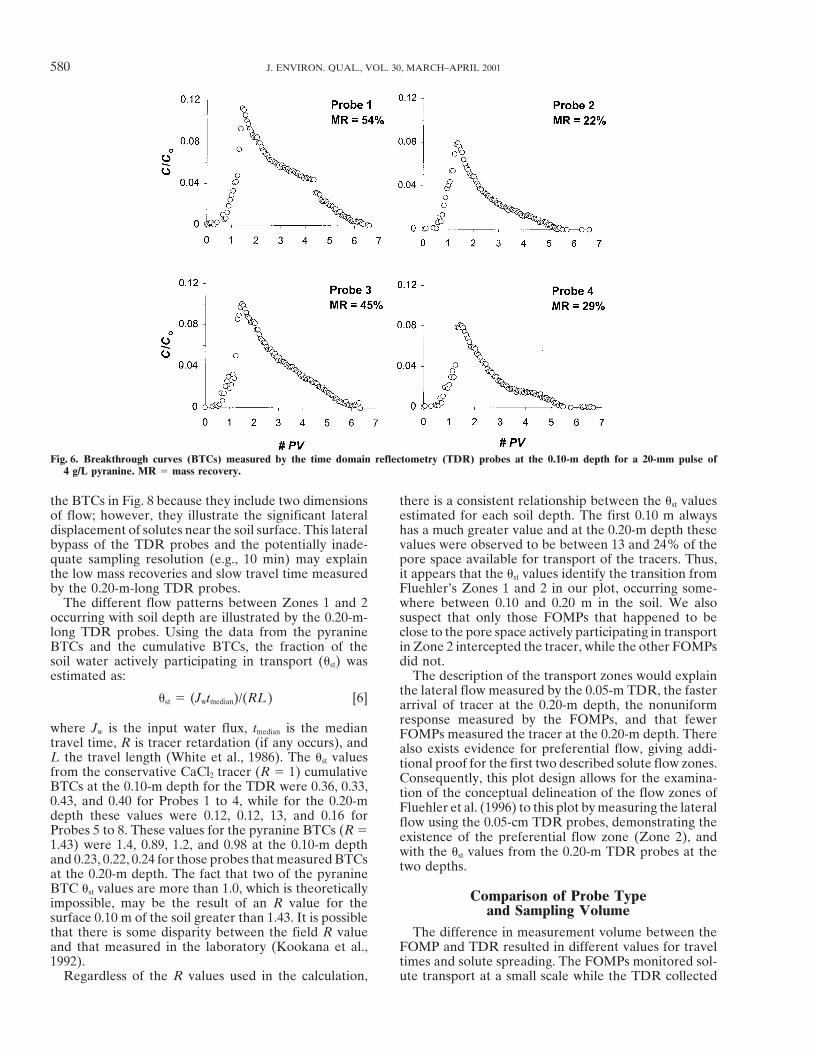
FOMP 0.20 m11 5.82 8.72The TDR probes performed reasonably well in this13 9.24 22.53clay soil. All probes recorded a cumulative BTC of 17 2.43 2.00
CaCl2 during calibration (Fig. 5) and seven of the eight 18 7.01 9.8719 3.27 6.27probes successfully measured the transport of the py-20 3.22 6.47ranine tracer. One probe at the 0.20-m depth had some
† Time domain reflectometry.mechanical problems and reasonable data from the py-‡ Fiber optic miniprobe.ranine pulse were not obtained. It should be noted that
the temperature effect can be significant and is not al-
Fig. 3. Breakthrough curves (BTCs) measured by the fiber optic miniprobes (FOMPs) at the 0.10-m depth for a 20-mm pulse of 4 g/L pyranine.MR 5 mass recovery.
578 J. ENVIRON. QUAL., VOL. 30, MARCH–APRIL 2001
Fig. 4. Breakthrough curves (BTCs) measured by the fiber optic miniprobes (FOMPs) at the 0.20-m depth for a 20-mm pulse of 4 g/L pyranine.MR 5 mass recovery.
ways completely removed by the correction of Heimo- It is possible that the increase in transport velocity atthe 0.20-m depth is the result of tracer funneling intovaara et al. (1995). This should be considered in studies
where diurnal temperature fluctuations are significant, fewer flow pathways. This would lead us to believe thatthere is a two-phase flow system at least at the greaterso that soil and air temperature may be measured and
an empirical correction performed. depth. The shape of the cumulative BTCs in Fig. 5 havea shape that has been suggested by Kutilek and NielsenMass recovery at the TDR probes ranged from 54 to
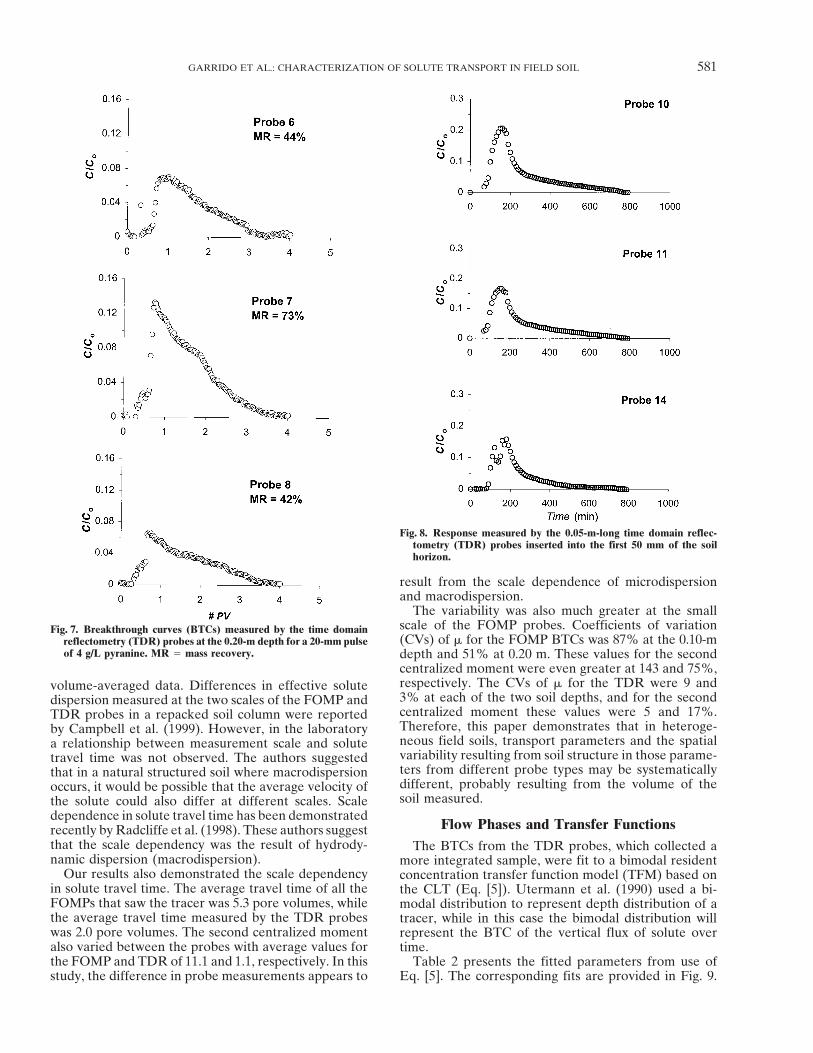
22% at the 0.10-m depth and 73 to 44% at the 0.20-m (1994, p. 292) to indicate more than one flow phase,particularly in Probes 7 and 8. While this is only andepth. The BTCs for the four probes at 0.10 m look
quite similar (Fig. 6), with similar first moments and observational interpretation, we will examine more evi-second centralized moments ranging from 2.1 to 2.8 and dence for the existence of multiple flow phases and the1.3 to 1.5, respectively (Table 3). This demonstrates that differences in flow with soil depth.although the mass moving over each probe varied, the It should be noted that it is possible that the temporalcharacteristics of the transport were consistent at the resolution of 10-min sampling intervals is not enoughsampling volume of the TDR probes. This result is dem- to capture rapid preferential flow. This may be an expla-onstrated again at 0.20 m (Fig. 7), where the first mo- nation for the larger mass recovery with depth and anment and second centralized moment ranged from 1.4 observed average mass recovery for the plot lowerto 1.5 and 0.5 to 0.7. than 100%.
The mean travel time at 0.20 m was much shorterthan at 0.10 m. In fact, the probes at these two depths Flow Regimes in the Soil Profileregistered a response at similar times on an absolute
Fluehler et al. (1996) propose three flow regimes,scale. These results suggest that the tracer moved slowerin the first 0.10 m of the soil and then faster in the next. which they call distribution flow in the attractor zone
GARRIDO ET AL.: CHARACTERIZATION OF SOLUTE TRANSPORT IN FIELD SOIL 579
Fig. 5. Cumulative breakthrough curves (BTCs) of conservative CaCl2 measured during the calibration of the time domain reflectometry(TDR) probes.
sured with 0.05-m-long TDR probes inserted vertically(Zone 1), preferential flow in the transmission zoneinto the soil surface. We suggest that because the tracer(Zone 2), and dispersive flow in the dispersionwas measured at the 0.05-m depth while there was azone (Zone 3). The first flow zone is a relatively uniform0.10-m distance to the nearest tracer drip source, thisspreading of solute, which then converges into preferen-is evidence of significant lateral flow. At times, the tracertial flow pathways in the transmission zone (Zone 2).moved more than 0.10 m laterally before moving 0.10 mIn the transmission zone, a small portion of the totalvertically in the soil. For example, the timing of bothpore space conducts most of the leachate vertically intothe arrival and median of the tracer BTCs measured atthe third zone, where the soil is less permeable andthe 0.05-m probes (Fig. 8) occurs slightly before thelateral mixing occurs again.arrival and median of the tracer measured at the 0.10-mThere is evidence that the soil in this study is re-depth by the 0.20-m-long TDR probes. Thus, the tracersponding in a similar manner. A 0.22-m boundary areaentered the soil and moved laterally 0.10 m to the smallwas included around the active area of the plot in anTDR probes in a shorter time than it took to moveattempt to produce one-dimensional flow, but it was
clearly not completely effective. The tracer was mea- vertically the same distance. It is difficult to interpret
580 J. ENVIRON. QUAL., VOL. 30, MARCH–APRIL 2001
Fig. 6. Breakthrough curves (BTCs) measured by the time domain reflectometry (TDR) probes at the 0.10-m depth for a 20-mm pulse of4 g/L pyranine. MR 5 mass recovery.
the BTCs in Fig. 8 because they include two dimensions there is a consistent relationship between the ust valuesestimated for each soil depth. The first 0.10 m alwaysof flow; however, they illustrate the significant lateral
displacement of solutes near the soil surface. This lateral has a much greater value and at the 0.20-m depth thesevalues were observed to be between 13 and 24% of thebypass of the TDR probes and the potentially inade-
quate sampling resolution (e.g., 10 min) may explain pore space available for transport of the tracers. Thus,it appears that the ust values identify the transition fromthe low mass recoveries and slow travel time measured
by the 0.20-m-long TDR probes. Fluehler’s Zones 1 and 2 in our plot, occurring some-where between 0.10 and 0.20 m in the soil. We alsoThe different flow patterns between Zones 1 and 2
occurring with soil depth are illustrated by the 0.20-m- suspect that only those FOMPs that happened to beclose to the pore space actively participating in transportlong TDR probes. Using the data from the pyranine
BTCs and the cumulative BTCs, the fraction of the in Zone 2 intercepted the tracer, while the other FOMPsdid not.soil water actively participating in transport (ust) was
estimated as: The description of the transport zones would explainthe lateral flow measured by the 0.05-m TDR, the faster
ust 5 (Jwtmedian)/(RL) [6] arrival of tracer at the 0.20-m depth, the nonuniformresponse measured by the FOMPs, and that fewer
where Jw is the input water flux, tmedian is the median FOMPs measured the tracer at the 0.20-m depth. Theretravel time, R is tracer retardation (if any occurs), and also exists evidence for preferential flow, giving addi-L the travel length (White et al., 1986). The ust values tional proof for the first two described solute flow zones.from the conservative CaCl2 tracer (R 5 1) cumulative Consequently, this plot design allows for the examina-BTCs at the 0.10-m depth for the TDR were 0.36, 0.33, tion of the conceptual delineation of the flow zones of0.43, and 0.40 for Probes 1 to 4, while for the 0.20-m Fluehler et al. (1996) to this plot by measuring the lateraldepth these values were 0.12, 0.12, 13, and 0.16 for flow using the 0.05-cm TDR probes, demonstrating theProbes 5 to 8. These values for the pyranine BTCs (R 5 existence of the preferential flow zone (Zone 2), and1.43) were 1.4, 0.89, 1.2, and 0.98 at the 0.10-m depth with the ust values from the 0.20-m TDR probes at theand 0.23, 0.22, 0.24 for those probes that measured BTCs two depths.at the 0.20-m depth. The fact that two of the pyranineBTC ust values are more than 1.0, which is theoretically Comparison of Probe Typeimpossible, may be the result of an R value for the and Sampling Volumesurface 0.10 m of the soil greater than 1.43. It is possiblethat there is some disparity between the field R value The difference in measurement volume between the
FOMP and TDR resulted in different values for traveland that measured in the laboratory (Kookana et al.,1992). times and solute spreading. The FOMPs monitored sol-
ute transport at a small scale while the TDR collectedRegardless of the R values used in the calculation,
GARRIDO ET AL.: CHARACTERIZATION OF SOLUTE TRANSPORT IN FIELD SOIL 581
Fig. 8. Response measured by the 0.05-m-long time domain reflec-tometry (TDR) probes inserted into the first 50 mm of the soilhorizon.
result from the scale dependence of microdispersionand macrodispersion.
The variability was also much greater at the smallscale of the FOMP probes. Coefficients of variationFig. 7. Breakthrough curves (BTCs) measured by the time domain(CVs) of m for the FOMP BTCs was 87% at the 0.10-mreflectometry (TDR) probes at the 0.20-m depth for a 20-mm pulse
of 4 g/L pyranine. MR 5 mass recovery. depth and 51% at 0.20 m. These values for the secondcentralized moment were even greater at 143 and 75%,respectively. The CVs of m for the TDR were 9 andvolume-averaged data. Differences in effective solute3% at each of the two soil depths, and for the seconddispersion measured at the two scales of the FOMP andcentralized moment these values were 5 and 17%.TDR probes in a repacked soil column were reportedTherefore, this paper demonstrates that in heteroge-by Campbell et al. (1999). However, in the laboratoryneous field soils, transport parameters and the spatiala relationship between measurement scale and solutevariability resulting from soil structure in those parame-travel time was not observed. The authors suggestedters from different probe types may be systematicallythat in a natural structured soil where macrodispersiondifferent, probably resulting from the volume of theoccurs, it would be possible that the average velocity ofsoil measured.the solute could also differ at different scales. Scale
dependence in solute travel time has been demonstratedFlow Phases and Transfer Functionsrecently by Radcliffe et al. (1998). These authors suggest
that the scale dependency was the result of hydrody- The BTCs from the TDR probes, which collected anamic dispersion (macrodispersion). more integrated sample, were fit to a bimodal resident
Our results also demonstrated the scale dependency concentration transfer function model (TFM) based onin solute travel time. The average travel time of all the the CLT (Eq. [5]). Utermann et al. (1990) used a bi-FOMPs that saw the tracer was 5.3 pore volumes, while modal distribution to represent depth distribution of athe average travel time measured by the TDR probes tracer, while in this case the bimodal distribution willwas 2.0 pore volumes. The second centralized moment represent the BTC of the vertical flux of solute overalso varied between the probes with average values for time.the FOMP and TDR of 11.1 and 1.1, respectively. In this Table 2 presents the fitted parameters from use of
Eq. [5]. The corresponding fits are provided in Fig. 9.study, the difference in probe measurements appears to
582 J. ENVIRON. QUAL., VOL. 30, MARCH–APRIL 2001
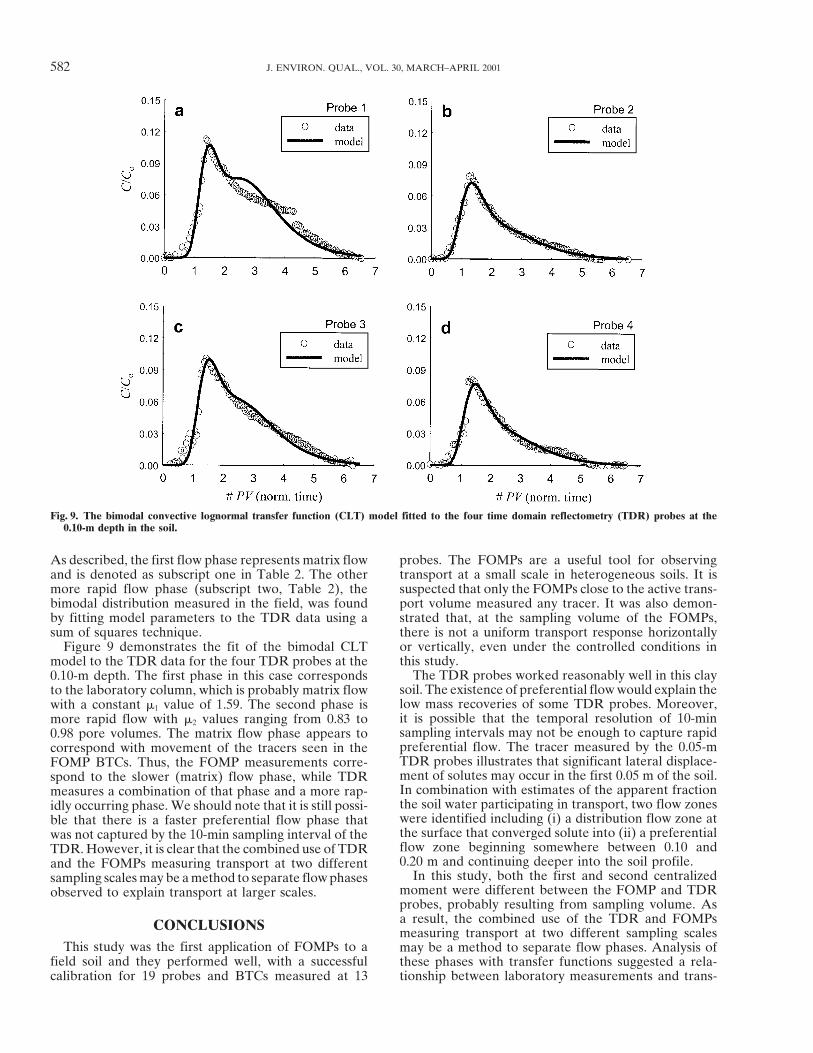
Fig. 9. The bimodal convective lognormal transfer function (CLT) model fitted to the four time domain reflectometry (TDR) probes at the0.10-m depth in the soil.
As described, the first flow phase represents matrix flow probes. The FOMPs are a useful tool for observingtransport at a small scale in heterogeneous soils. It isand is denoted as subscript one in Table 2. The other
more rapid flow phase (subscript two, Table 2), the suspected that only the FOMPs close to the active trans-port volume measured any tracer. It was also demon-bimodal distribution measured in the field, was found
by fitting model parameters to the TDR data using a strated that, at the sampling volume of the FOMPs,there is not a uniform transport response horizontallysum of squares technique.
Figure 9 demonstrates the fit of the bimodal CLT or vertically, even under the controlled conditions inthis study.model to the TDR data for the four TDR probes at the
The TDR probes worked reasonably well in this clay0.10-m depth. The first phase in this case correspondssoil. The existence of preferential flow would explain theto the laboratory column, which is probably matrix flowlow mass recoveries of some TDR probes. Moreover,with a constant m1 value of 1.59. The second phase isit is possible that the temporal resolution of 10-minmore rapid flow with m2 values ranging from 0.83 tosampling intervals may not be enough to capture rapid0.98 pore volumes. The matrix flow phase appears topreferential flow. The tracer measured by the 0.05-mcorrespond with movement of the tracers seen in theTDR probes illustrates that significant lateral displace-FOMP BTCs. Thus, the FOMP measurements corre-ment of solutes may occur in the first 0.05 m of the soil.spond to the slower (matrix) flow phase, while TDRIn combination with estimates of the apparent fractionmeasures a combination of that phase and a more rap-the soil water participating in transport, two flow zonesidly occurring phase. We should note that it is still possi-were identified including (i) a distribution flow zone atble that there is a faster preferential flow phase thatthe surface that converged solute into (ii) a preferentialwas not captured by the 10-min sampling interval of theflow zone beginning somewhere between 0.10 andTDR. However, it is clear that the combined use of TDR0.20 m and continuing deeper into the soil profile.and the FOMPs measuring transport at two different
In this study, both the first and second centralizedsampling scales may be a method to separate flow phasesmoment were different between the FOMP and TDRobserved to explain transport at larger scales.probes, probably resulting from sampling volume. Asa result, the combined use of the TDR and FOMPsCONCLUSIONS measuring transport at two different sampling scales
This study was the first application of FOMPs to a may be a method to separate flow phases. Analysis offield soil and they performed well, with a successful these phases with transfer functions suggested a rela-
tionship between laboratory measurements and trans-calibration for 19 probes and BTCs measured at 13
GARRIDO ET AL.: CHARACTERIZATION OF SOLUTE TRANSPORT IN FIELD SOIL 583
J. Feyen. 1998. Analysis of steady state chloride transport throughport in the field soil. The combined application of thetwo heterogeneous field soils. Water Resour. Res. 34:2539–2550.FOMPs and TDR to observe different flow phases de-
Jury, W.A., and K. Roth. 1990. Transfer functions and solute move-serves further investigation. ment through soil. Birkhauser Verlag, Basel, Germany.Jury, W.A., and G. Sposito. 1985. Field calibration and validation of
ACKNOWLEDGMENTS solute transport models for the unsaturated zone. Soil Sci. Soc.Am. J. 49:1331–1341.Dr. Garrido has been supported by a postdoctoral grant
Kachanoski, R.G., E. Pringle, and A. Ward. 1992. Field measurementfrom the Ministerio de Educacion y Cultura (Spain). The of solute transport travel times using time domain reflectometry.authors also wish to thank the Kearney Foundation of Soil Soil Sci. Soc. Am. J. 56:47–52.Science and the Horton Research Grant administered by the Kladivko, E.J., G.E. Van Scoyoc, E.J. Monke, K.M. Oates, and W.American Geophysical Union for their support. Pask. 1991. Pesticide and nutrient movement into subsurface tile
drains on a silt loam soil in Indiana. J. Environ. Qual. 20:264–270.REFERENCES Kookana, R.S., R.G. Gerritse, and L.A. Aylmore. 1992. A method
for studying nonequilibrium sorption during transport of pesticidesAndreini, M.S., and T.S. Steenhuis. 1990. Preferential paths underin soil. Soil Sci. 154:344–349.conventional and conservation tillage. Geoderma 46:85–102.
Kutilek, M., and D.R. Nielsen. 1994. Soil hydrology. Catena Verlag,Beven, K., and P. Germann. 1982. Macropores and water flow in soils.Cremlingen–Destedt, Germany.Water Resour. Res. 18:1311–1325.
Mallants, D., M. Vanclooster, M. Meddahi, and J. Feyen. 1994. Esti-Beven, K.J., D.Ed. Henderson, and A.D. Reeves. 1993. Dispersionmating solute transport in undisturbed soil columns using time-parameters for undisturbed partially saturated soil. J. Hydrol. 143:domain reflectometry. J. Contam. Hydrol. 17:91–109.19–43.
Mallants, D., M. Vanclooster, N. Toride, J. Vanderborght, and J.Binley, A., S. Henry-Poulter, and B. Shaw. 1996. Examination of soluteFeyen. 1996. Comparison of three methods to calibrate TDR fortransport in an undisturbed soil column using electrical resistancemonitoring solute movement in undisturbed soil. Soil Sci. Soc. Am.topography. Water Resour. Res. 32:763–769.J. 60:747–754.Campbell, C.G., M. Ghodrati, and F. Garrido. 1999. Comparison of
Nadler, A., S. Dasberg, and I. Lapid. 1991. Time domain reflectometrytime domain reflectometry, fiber optic mini-probes, and solutionmeasurements of water and electrical conductivity of layered soilsamplers for real time measurement of solute transport in soil. Soilcolumns. Soil Sci. Soc. Am. J. 55:938–943.Sci. 164:156–170.
Nissen, H.H., P. Moldrup, and K. Henriksen. 1998. High-resolutionDalton, F.N., and M.Th. van Genuchten. 1986. The time domaintime domain reflectometry coil probe for measuring soil waterreflectometry method for measuring soil water content and salinity.content. Soil Sci. Soc. Am. J. 62:1203–1211.Geoderma 38:237–250.
Persson, M., and R. Berndtsson. 1998. Estimating transport parame-Edwards, W.M., M.J. Shipitalo, L.B. Owens, and W.A. Dick. 1993.ters in an undisturbed soil column using time domain reflectometryFactors affecting preferential flow of water and atrazine throughand transfer function theory. J. Hydrol. 205:232–247.earthworm burrows under continuous no-till corn. J. Environ.
Radcliffe, D.E., S.M. Gupte, and J.E. Box, Jr. 1998. Solute transport atQual. 22:453–457.the pedon and polypedon scales. Nutr. Cycl. Agroecosyst. 50:77–84.Fluehler, H., W. Durner, and M. Flury. 1996. Lateral solute mixing
Rhoades, J.D. 1996. Salinity: Electrical conductivity and total dis-processes—A key for understanding field-scale transport of watersolved solids. p. 417–436. In D.L. Sparks et al. (ed.) Methods ofand solutes. Geoderma 70:165–183.soil analysis. Part 3. SSSA Book Ser. 5. SSSA, Madison, WI.Flury, M., H. Fluehler, W.A. Jury, and J. Leuenberger. 1994. Suscepti-
Rudolph, D.L., R.G. Kachanoski, M.A. Celia, D.R. LeBlanc, andbility of soils to preferential flow of water: A field study. WaterJ.H. Stevens. 1996. Infiltration and solute transport experimentsResour. Res. 30:1945–1954.in unsaturated sand and gravel, Cape Cod, Massachusetts: Experi-Garrido, F., M. Ghodrati, and C.G. Campbell. 2000. An in situ methodmental design and overview of results. Water Resour. Res.for field calibration of fiber optic miniprobes. Soil Sci. Soc. Am.32:519–532.J. 64:836–843.
Topp, G.C., and J.L. Davis. 1984. Measurement of soil water contentGarrido, F., M. Ghodrati, and M. Chendorain. 1999a. Small scaleusing time-domain reflectometry (TDR): A field evaluation. Soilmeasurement of soil water content using a fiber optic sensor. SoilSci. Soc. Am. J. 49:19–24.Sci. Soc. Am. J. 63:1505–1512.
Topp, G.C., M. Yanuka, W.D. Zebchuk, and S. Zegelin. 1988. Deter-Garrido, F., M. Ghodrati, M. Chendorain, and C.G. Campbell. 1999b.mination of electrical conductivity using time domain reflectome-Small-scale variability in solute transport processes in a homoge-try: Soil and water experiments in coaxial lines. Water Resour.neous clay loam soil. Soil Sci. Soc. Am. J. 63:1513–1522.Res. 24:945–952.Gee, G.W., and J.W. Bauder. 1986. Particle-size analysis. p. 399–403.
Utermann, J., E.J. Kladivko, and W.A. Jury. 1990. Evaluating pesticideIn A. Klute (ed.) Methods of soil analysis. Part 1. 2nd ed. Agron.migration in tile-drained soils with a transfer function model. J.Monogr. 9. ASA and SSSA, Madison, WI.Environ. Qual. 19:707–714.Ghodrati, M. 1999. “Point” measurement of solute transport processes
Valocchi, A.J. 1990. Use of temporal moment analysis to study reactivein soil using fiber optic sensors. Soil Sci. Soc. Am. J. 63:471–479.solute transport in aggregated porous media. Geoderma 46:Ghodrati, M., F. Garrido, C.G. Campbell, and M. Chendorain. 2000.233–247.A multiplexed fiber optic miniprobe system for measuring solute
Vanderborght, J., C. Gonzalez, M. Vanclooster, D. Mallants, and J.transport in soil. J. Environ. Qual. 29:540–550.Feyen. 1997. Effects of soil type and water flux on solute transport.Ghodrati, M., and W.A. Jury. 1990. A field study using dyes to charac-Soil Sci. Soc. Am. J. 61:372–389.terize preferential flow of water. Soil Sci Soc. Am. J. 54:1558–1563.
Vanderborght, J., M. Vanclooster, D. Mallants, J. Diels, and J. Feyen.Ghodrati, M., and W.A. Jury. 1992. A field study of the effects of soil1996. Determining convective lognormal solute transport parame-structure and irrigation method on preferential flow of pesticides inters from resident concentration data. Soil Sci. Soc. Am. J. 60:unsaturated soil. J. Contam. Hydrol. 11:101–125.1306–1317.Grochulska, J., and E.J. Kladivko. 1994. A two region model of prefer-
White, R.E. 1985. The influence of macropores on the transport ofential flow of chemicals using a transfer function approach. J. Envi-dissolved and suspended matter through soil. Adv. Soil Sci.ron. Qual. 23:498–507.3:95–120.Heimovaara, T.J., A.G. Focke, W. Bouten, and J.M. Verstraten. 1995.
White, R.E., J.S. Dyson, R.A. Haigh, W.A. Jury, and G. Sposito.Assessing temporal variations in soil water composition with time1986. A transfer function model of solute transport through soil.domain reflectometry. Soil Sci. Soc. Am. J. 59:689–698.2. Illustrative applications. Water Resour. Res. 22:248–254.Jacques, D., D.J. Kim, J. Diels, J. Vanderborght, H. Vereecken, and