Saturated and Unsaturated Water Flow in Inclined Porous Media
Modeling the e�ects of nonlinear equilibrium sorption on thetransport of solute plumes in saturated heterogeneous porous media
A. Abulaban *, J.L. Nieber
Department of Biosystems and Agricultural Engineering, University of Minnesota, St. Paul and Army High Performance Computing Research Center,
University of Minnesota, Minneapolis, USA
Abstract
Transport of sorbing solutes in 2D steady and heterogeneous ¯ow ®elds is modeled using a particle tracking random walk
technique. The solute is injected as an instantaneous pulse over a ®nite area. Cases of linear and Freundlich sorption isotherms are
considered. Local pore velocity and mechanical dispersion are used to describe the solute transport mechanisms at the local scale.
This paper addresses the impact of the degree of heterogeneity and correlation lengths of the log-hydraulic conductivity ®eld as well
as negative correlation between the log-hydraulic conductivity ®eld and the log-sorption a�nity ®eld on the behavior of the plume of
a sorbing chemical. Behavior of the plume is quanti®ed in terms of longitudinal spatial moments: center-of-mass displacement,
variance, 95% range, and skewness. The range appears to be a better measure of the spread in the plumes with Freundlich sorption
because of plume asymmetry. It has been found that the range varied linearly with the travelled distance, regardless of the sorption
isotherm. This linear relationship is important for extrapolation of results to predict behavior beyond simulated times and distances.
It was observed that the ¯ow domain heterogeneity slightly enhanced the spreading of nonlinearly sorbing solutes in comparison to
that which occurred for the homogeneous ¯ow domain, whereas the spreading enhancement in the case of linear sorption was much
more pronounced. In the case of Freundlich sorption, this enhancement led to further deceleration of the solute plume movement as
a result of increased retardation coe�cients produced by smaller concentrations. It was also observed that, except for plumes with
linear sorption, correlation between the hydraulic conductivity and the sorption a�nity ®elds had minimal e�ect on the spatial
moments of solute plumes with nonlinear sorption. Ó 2000 Elsevier Science Ltd. All rights reserved.
Keywords: Solute transport; Porous media; Equilibrium sorption; Freundlich isotherm; Particle tracking random walk; Retardation
1. Introduction
The transport equation of a sorbing chemical in-volves several hydraulic and chemical parameters thatcan be spatially and/or temporally variable in naturalsubsurface environments. Detailed evaluation of suchparameters at every point in a ¯ow ®eld is cost prohib-itive, if at all possible, no matter how small the domainmay be. However, such variability plays a primary rolein the behavior of a chemical plume migrating in suchdomains.
Due to the random spatial variability of natural po-rous formations, stochastic methods for handlingparameter ®elds have been more popular among re-searchers in this ®eld [1,11,12,18,16,30,45,47]. The sto-chastic approach of simulation of groundwater ¯ow and
transport assumes that the hydrogeologic parametersare random functions in space (random ®elds) that canbe fully characterized by their statistical moments. In thecomputational area of stochastic analysis, numericalexperiments are carried out on hypothetical ¯ow ®eldswith speci®ed statistics for the hydrogeologic parametersbeing examined [2,6,11±13,18±21,33,34,40,41,47].Among the computational methods used in stochasticanalysis, one of the major developments has been theapplication of the random walk technique for modelingsolute transport in heterogeneous porous media in acomputationally e�cient manner [27,47,50].
In a previous paper, the authors examined the be-havior of nonlinearly sorbing solutes in a homogeneoussaturated ¯ow ®eld [4]. This paper presents simulationresults using the particle tracking random walk (PTRW)technique to analyze the transport of substances withnonlinear equilibrium sorption in 2D heterogeneoussaturated porous media. Heterogeneity of the porousmedium is assumed to be structured, with known
www.elsevier.com/locate/advwatres
Advances in Water Resources 23 (2000) 893±905
* Corresponding author.
0309-1708/00/$ - see front matter Ó 2000 Elsevier Science Ltd. All rights reserved.
PII: S 0 3 0 9 - 1 7 0 8 ( 0 0 ) 0 0 0 1 0 - 5

probability distributions and covariance functions.Emphasis will be placed on the e�ects of randomlydistributed hydraulic conductivity and sorption a�nityparameters on the development of plumes of nonlin-early sorbing solutes. Related studies have beenreported by Tompson [48], who performed 3D simula-tions on a 25 m cube, and Bosma and van der Zee [8],who did 2D simulations on continuously injected sol-utes. In both of those studies, however, only a singleFreundlich isotherm was considered and they both fo-cused on the ®rst two spatial moments of the soluteplume. In addition to the Freundlich isotherm, Tomp-son [48] also considered a case with Langmuir isotherm.More recently, Bosma et al. [9] considered multipleFreundlich isotherms using Monte Carlo simulations topredict average plume behavior in terms of the ®rst twospatial moments.
The objective of this paper is to examine the sensi-tivity of plume behavior to the Freundlich isotherm inthe presence of physical and chemical heterogeneities inthe transport medium. Evaluation is carried out in termsof longitudinal spatial moments, namely mean dis-placement, spread variance, and plume skewness.
2. The transport model
The transport of a sorbing chemical can be describedby the advection±dispersion±sorption equation
oCot�r � �Cv� ÿ r � �D � rC� � q
UoSot� 0; �1�
where C is the concentration in the liquid phase [MLÿ3];S the concentration in the sorbed phase expressed asmass of solute per unit mass of solid [M/M]; v the localvelocity vector [LTÿ1]; q the dry bulk density of theporous matrix [MLÿ3]; U the e�ective porosity �L3=L3�;and t is time [T]. The hydrodynamic dispersion tensor, D
�L2Tÿ1� is de®ned as
D � �aTV � Dm�I � �aL ÿ aT� vv
V; �2�
where Dm is the molecular di�usion coe�cient �L2Tÿ1�; Ithe identity matrix; V the magnitude of the velocityvector, aL and aT are the longitudinal and transversedispersivities [L], respectively; and vv is the diadic of thevelocity vector.
Using the identity r � �D � rC� � rr : �DC� ��rC� � �r �D�; and rearranging terms, Eq. (1) above canbe rewritten in terms of the total solute concentrationand in a form analogous to the Fokker±Planck equationas (see also [47] and [4] for details)
oUCT
ot�r � v�x; t� � r �D�x; t�
R�C; x� UCT
� �ÿrr :
D�x; t�R�C; x�UCT
� �� 0; �3�
where CT is the total mass concentration expressed asmass of solute per unit liquid volume �MLÿ3�; and isde®ned as
CT � C � q�x�U�x� S �4�
and the function R�C; x� is de®ned as
R�C; x� � 1� q�x�U�x�
SC; �5�
which is a concentration- and space-dependent retar-dation coe�cient.
We should note here that there is an issue related tothe existence of the spatial derivatives in the discreteform of Eq. (3). If C, v and D are all at least twice dif-ferentiable, the spatial derivatives in both Eqs. (1) and(3) will be de®ned. If we use a ®nite di�erence scheme,with a piecewise constant representation for C, v and D,the spatial derivatives will be de®ned in Eq. (1), whereasfor this same level of representation, the spatial deriva-tives in Eq. (3) will be unde®ned. In our analysis, we usea particle method with the Langevin stepping equation[4] to solve Eq. (3), rather than using a direct ®nitedi�erence discretization. In the stepping equation, theonly spatial derivative is the term r �D�x; t�. This de-rivative is approximated at cell centers with a forward orbackward di�erence scheme, but it is not de®ned at theinterfaces of computational elements. However, the de-rivatives at an element interface are approximated as theaverage of the derivatives at the centers of the elementson both sides of the interface. While we recognize thestrict mathematical problem associated with existence ofderivatives in Eq. (3), the form of Eq. (3) is the one usedin all the previous applications of the Fokker±Planckequation to solute transport in porous media[4,8,9,47,48]. The issue about the existence of the spatialderivatives in the discrete form of Eq. (3) is outside thescope of this study and will have to be addressed in alater analysis.
Introducing the variables vr�x; t;C� � �v�r �D�=R�C; x� and Dr�x; t;C� � D=R�C; x�, which are the re-tarded (or e�ective) velocity and dispersion tensor, re-spectively, and assuming that the porosity is constant,Eq. (3) can be rewritten as
oCT
ot�r � vr�x; t;C�CT� � ÿ rr : Dr�x; t;C�CT� � � 0: �6�
The transport equation above will be subject to thewidely used Freundlich isotherm expressed as
S�C; x� � Kf�x�Cn; �7�
where Kf�x� ([L3Mÿ1�n] is the sorption a�nity and n isthe Freundlich exponent. The retardation coe�cientthus becomes
894 A. Abulaban, J.L. Nieber / Advances in Water Resources 23 (2000) 893±905
R�C; x� � 1� q x� �U
Kf�x�Cnÿ1: �8�
The value of the Freundlich exponent n depends on thechemical properties of both the solute and the porousmedium. It has been observed to be generally less than1:0, but there have been a few exceptions where it wasreported to be slightly larger than 1:0 [23]. The param-eter Kf is also a function of the chemical characteristicsof the sorbent and sorbate (solid matrix), as well as theenvironment in the system. For a given chemical con-stituent, the magnitude of Kf is in¯uenced by such fac-tors as the availability of sorption sites (surface area ofthe porous medium), organic content, mineral compo-sition of the porous medium, the presence of other ionscompeting for the same sorption sites, temperature, andpH of the system, to name only a few [17,23,26,35,36,38,39,43,52].
The variability of the sorption a�nity is a signi®cantfactor in the distribution of sorbing solutes in ground-water. However, literature on the natural variability ofthe sorption a�nity is scarce. Jackson and Inch [25]studied the behavior of 90Sr in a heterogeneous porousmedia. They investigated the e�ects of the variability ofthe sorption a�nity on the distribution of 90Sr. Theyfound that . . . ``the principal factor a�ecting the distri-bution of 90Sr is the spatial variability in the adsorptiona�nity of the aquifer materials as measured by thespeci®c surface area of the aquifer sediments. E�ects ofionic competition between 90Sr and other ions (Ca2�,stable Sr2�, H�) were less important''. Heterogeneitywas also observed in the sorption a�nity in the Bordensite experiment [31].
In this work, it will be assumed that the limitingfactor a�ecting the variability of the sorption a�nityparameter is the availability of sorption sites. Avail-ability of sorption sites depends on the speci®c surfacearea of the porous medium, which is a function of thegranular size of the aquifer material. The ®ner the sed-iments, the larger the speci®c surface area and thus thelarger the sorption a�nity. Experimental evidence tosupport this hypothesis is limited. Direct evidence isgiven by Jackson and Inch [25], which was quotedabove. Through his work on the adsorption capabilityof activated carbon, Kulkarni [28] showed that equilib-rium concentrations of solute in the ¯uid phase in asolution of activated carbon and water were smaller for®ner carbon particles, and also that equilibrium wasattained faster.
It is well documented that the hydraulic conductivityis a function of the size of the sediment particles [14].Through the dependence of both sorption a�nity andhydraulic conductivity on the size of sediment particles,correlation can be derived between the hydraulic con-ductivity and the sorption a�nity. Assuming hydraulicconductivity to be related to particle size alone for
spherical particles, Abulaban [3] and Garabedian et al.[15] showed theoretically negative correlation betweenthe logarithm of the sorption a�nity and the logarithmof the hydraulic conductivity and found the propor-tionality constant for the derived correlation to be ÿ 1
2.
Negative correlation between retardation characteristicsof porous media and ¯ow velocity was assumed byValocchi [51] and has been observed by Hess et al. [24].Negative correlation between surface area and per-meability has also been discussed in several more recentstudies [5,10,37,42,49].
In the present analysis, the hydraulic conductivity, K(L=T), and thus the sorption a�nity coe�cient, are as-sumed to be log-normally distributed in space. Thismeans that if Y � ln�K=KG�, and W � ln�Kf=KfG�,where KG and KfG are the geometric means of the hy-draulic conductivity and the sorption a�nity coe�cient,respectively, then Y and W will be normally distributed.Correlation between ln K and ln Kf , means that Y can bewritten in terms of W using the following stochasticrelationship:
W � bY � �; �9�
where b is the proportionality constant and � is a zero-mean error whose variability is much smaller than thatof W, i.e., r� � rW ; and is introduced to account forimperfect correlation between Y and W.
In two related studies [9,54], perfect correlation wasassumed and b was chosen to be ÿ1:0. The basis forselecting this value of b was that this led to perfectcorrelation between Y and W. However, this is an in-correct premise because b is not a measure of the degreeof correlation, but only a scaling between the variables.Perfect correlation exists when cov�Y ;W �= �����������
rY rWp �
�1:0, which occurs for any nonzero value of b if andonly if � is constant, not only if b � �1:0.
The negative correlation between hydraulic conduc-tivity and sorption a�nity must be understood in termsof their in¯uence on the e�ective velocity of the solute.Solute e�ective velocity is the ¯ow velocity scaled by theretardation coe�cient. The larger the sorption a�nity,the larger the retardation. Therefore, in a high conduc-tivity zone, the ¯ow velocity will be large, and since thesorption a�nity will be small, retardation will also besmall (but larger than 1:0), and hence the e�ectivevelocity will not be much smaller than the ¯ow velocity.Conversely, in a low conductivity zone the ¯ow velocitywill be small. Due to the negative correlation with thehydraulic conductivity, sorption a�nity will be large,and therefore the retardation coe�cient will be large,producing a retarded velocity that is signi®cantly smallerthan the ¯ow velocity. Depending on the magnitudes of¯ow velocities, this behavior may produce larger varia-tions among the retarded velocities and hence enhanceplume spreading.
A. Abulaban, J.L. Nieber / Advances in Water Resources 23 (2000) 893±905 895
3. Flow and transport problem
The transport problem considered here involves a 2D¯ow domain with mean ¯ow along the principal axis ofthe ¯ow domain. The ¯ow domain is described in ourprevious paper [4]. The hydraulic conductivity ®eld isgenerated using the turning bands method [32,46]. Thelog-hydraulic conductivity ®eld is assumed to be iso-tropic with an exponential auto-covariance function.Log-hydraulic conductivity ®elds were generated forfour values of rln K : 0:25; 0:5; 0:75; and 1:0; and twocorrelation lengths, kln K , of 5 and 10 m. It should benoted that the ®elds corresponding to the same corre-lation length were all generated from one realization ofthe random ®eld and this realization was scaled for thedesired standard deviation. This was done to producesimilar ®elds with peaks and valleys in the same loca-tions so that we avoid variabilities caused by di�erentinitial behavior of the plume, since we are dealing with anonlinear sorption process that is sensitive to plumecharacteristics at early times.
The sorption a�nity ®eld was transformed from thehydraulic conductivity ®eld using the proportionalityconstant of ÿ0:5. Simple analysis shows that rln Kf
�bj jrln K , and thus the standard deviations of the log-
sorption a�nity ®elds corresponding to those of the log-conductivity ®eld were 0:125; 0:25; 0:375; and 0:5. Thecorrelation lengths are the same however. The geometricmeans of the hydraulic conductivity ®eld was 10 m/d.The geometric mean of the sorption a�nity ®eld was2� 10ÿ7 �l=mg�n. Matrix bulk density was 1.75 g/ml andporosity was 0.35, both of which were assumed to beconstant. Longitudinal and transverse dispersivitieswere 0.1 and 0.02 m, respectively. The ¯ow domain wasdiscretized into 1 m square elements. The ¯ow ®eldcorresponds to a mean hydraulic gradient of ÿ0:035which results in a mean pore velocity of 1.0 m/d for theconstant e�ective porosity of 0.35 used in the simula-tions. The ¯ow ®elds corresponding to these conditionswere solved using the ®nite element method.
The transport problem consists of releasing 200 g of asorbing chemical uniformly distributed over a 50 m�10 m rectangular area aligned with the direction of themean ¯ow. Since the total mass is constant, there is adi�erent initial liquid concentration for each Freundlichexponent (see [4] for details). The solute mass is rep-resented with 106 particles of constant mass. Our ap-proach is based on a single realization to observe thelarge time behavior of the solute plume.
4. Results and discussion
Results of the simulations are presented here in termsof concentration distributions, center of mass displace-ment, spread variance, and skewness. Due to the pro-
nounced asymmetry of the plumes it is thought that thevariance is a poor measure of spatial spread, so the 95%range, l95, is also presented as an alternative measure ofspatial spread. The range is de®ned as the distancewithin which 95% of the solute mass is contained. It'slower and upper bounds are the 2:5 and 97:5 percentileof the solute mass, respectively. All the spatial momentsare calculated for the liquid mass concentration. Resultsfor all of these measures are presented along with thosefor the homogeneous ¯ow ®eld for comparison.
4.1. Concentration pro®les
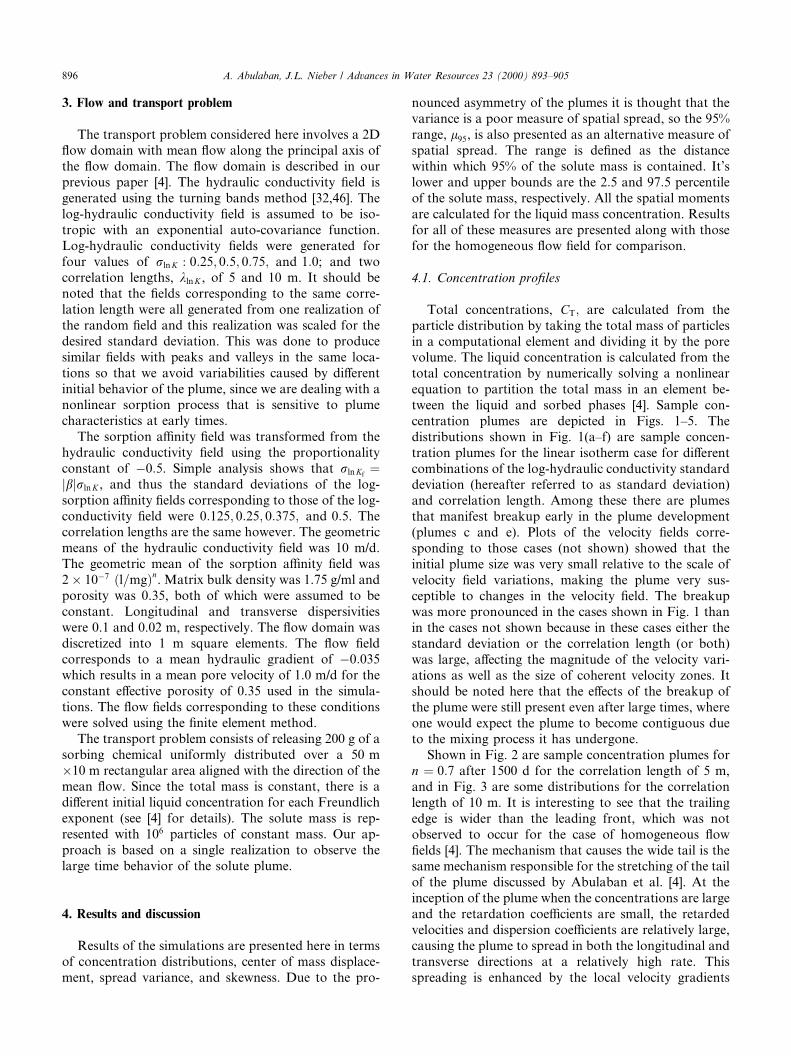
Total concentrations, CT; are calculated from theparticle distribution by taking the total mass of particlesin a computational element and dividing it by the porevolume. The liquid concentration is calculated from thetotal concentration by numerically solving a nonlinearequation to partition the total mass in an element be-tween the liquid and sorbed phases [4]. Sample con-centration plumes are depicted in Figs. 1±5. Thedistributions shown in Fig. 1(a±f) are sample concen-tration plumes for the linear isotherm case for di�erentcombinations of the log-hydraulic conductivity standarddeviation (hereafter referred to as standard deviation)and correlation length. Among these there are plumesthat manifest breakup early in the plume development(plumes c and e). Plots of the velocity ®elds corre-sponding to those cases (not shown) showed that theinitial plume size was very small relative to the scale ofvelocity ®eld variations, making the plume very sus-ceptible to changes in the velocity ®eld. The breakupwas more pronounced in the cases shown in Fig. 1 thanin the cases not shown because in these cases either thestandard deviation or the correlation length (or both)was large, a�ecting the magnitude of the velocity vari-ations as well as the size of coherent velocity zones. Itshould be noted here that the e�ects of the breakup ofthe plume were still present even after large times, whereone would expect the plume to become contiguous dueto the mixing process it has undergone.
Shown in Fig. 2 are sample concentration plumes forn � 0:7 after 1500 d for the correlation length of 5 m,and in Fig. 3 are some distributions for the correlationlength of 10 m. It is interesting to see that the trailingedge is wider than the leading front, which was notobserved to occur for the case of homogeneous ¯ow®elds [4]. The mechanism that causes the wide tail is thesame mechanism responsible for the stretching of the tailof the plume discussed by Abulaban et al. [4]. At theinception of the plume when the concentrations are largeand the retardation coe�cients are small, the retardedvelocities and dispersion coe�cients are relatively large,causing the plume to spread in both the longitudinal andtransverse directions at a relatively high rate. Thisspreading is enhanced by the local velocity gradients
896 A. Abulaban, J.L. Nieber / Advances in Water Resources 23 (2000) 893±905
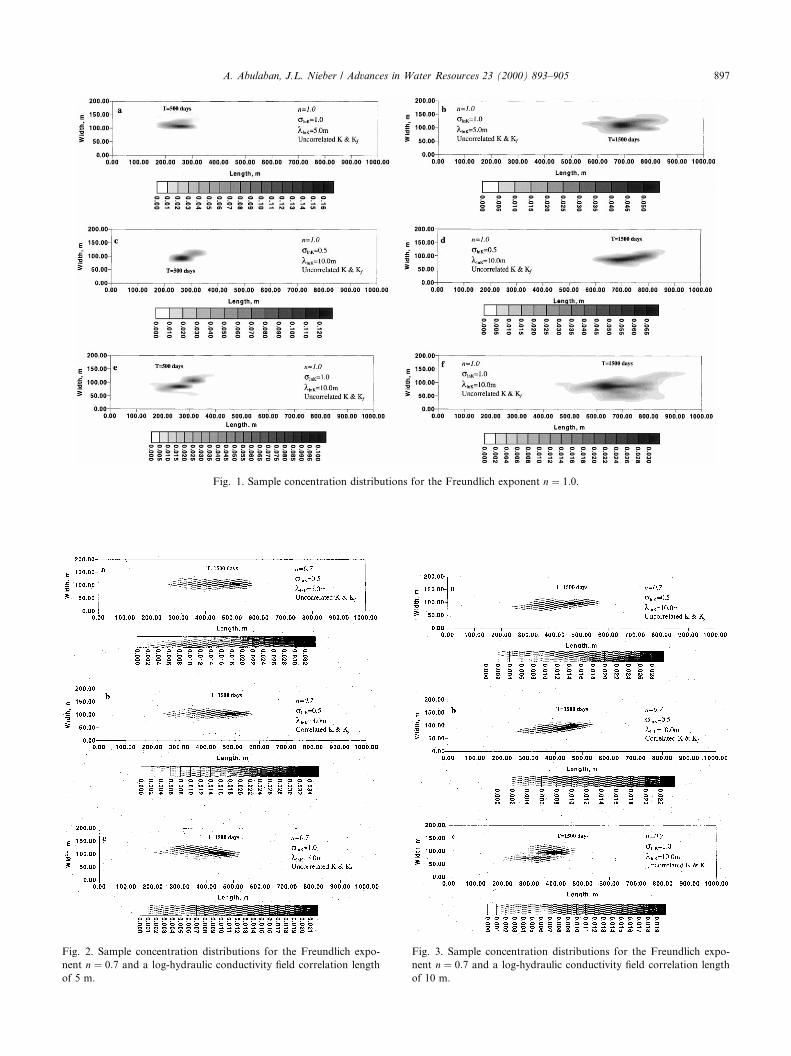
Fig. 1. Sample concentration distributions for the Freundlich exponent n � 1:0.
Fig. 2. Sample concentration distributions for the Freundlich expo-
nent n � 0:7 and a log-hydraulic conductivity ®eld correlation length
of 5 m.
Fig. 3. Sample concentration distributions for the Freundlich expo-
nent n � 0:7 and a log-hydraulic conductivity ®eld correlation length
of 10 m.
A. Abulaban, J.L. Nieber / Advances in Water Resources 23 (2000) 893±905 897
caused by the heterogeneity in the hydraulic conduc-tivity ®eld. Along the trailing edge the large retardationcoe�cients associated with the small concentrationsprevent the solute from receding, thereby producing thewide tail. However, the large retardation on the per-iphery of the leading front hinders the spreading in thetransverse direction.
As we can see from Figs. 2(b) and 3(b), correlation inthe hydraulic conductivity and sorption a�nity ®eldsenhance the narrowing of the leading front of the plume.This behavior a�ects the calculated longitudinal spatialmoments, especially the higher order ones (variance andskewness), because these are determined by the longi-tudinal distribution of the solute. It is apparent from theplumes in Figs. 2(c) and 3(c) where the standard devia-tion is the largest that these plumes experienced break-up.
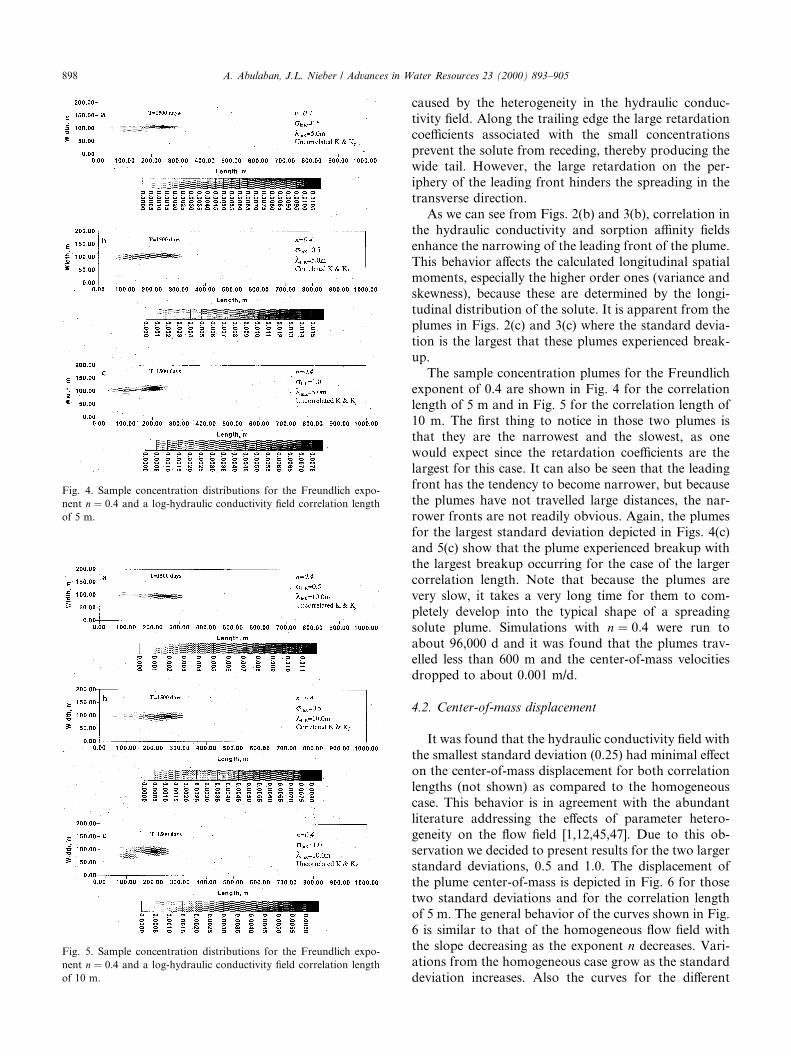
The sample concentration plumes for the Freundlichexponent of 0.4 are shown in Fig. 4 for the correlationlength of 5 m and in Fig. 5 for the correlation length of10 m. The ®rst thing to notice in those two plumes isthat they are the narrowest and the slowest, as onewould expect since the retardation coe�cients are thelargest for this case. It can also be seen that the leadingfront has the tendency to become narrower, but becausethe plumes have not travelled large distances, the nar-rower fronts are not readily obvious. Again, the plumesfor the largest standard deviation depicted in Figs. 4(c)and 5(c) show that the plume experienced breakup withthe largest breakup occurring for the case of the largercorrelation length. Note that because the plumes arevery slow, it takes a very long time for them to com-pletely develop into the typical shape of a spreadingsolute plume. Simulations with n � 0:4 were run toabout 96,000 d and it was found that the plumes trav-elled less than 600 m and the center-of-mass velocitiesdropped to about 0.001 m/d.
4.2. Center-of-mass displacement
It was found that the hydraulic conductivity ®eld withthe smallest standard deviation (0.25) had minimal e�ecton the center-of-mass displacement for both correlationlengths (not shown) as compared to the homogeneouscase. This behavior is in agreement with the abundantliterature addressing the e�ects of parameter hetero-geneity on the ¯ow ®eld [1,12,45,47]. Due to this ob-servation we decided to present results for the two largerstandard deviations, 0.5 and 1.0. The displacement ofthe plume center-of-mass is depicted in Fig. 6 for thosetwo standard deviations and for the correlation lengthof 5 m. The general behavior of the curves shown in Fig.6 is similar to that of the homogeneous ¯ow ®eld withthe slope decreasing as the exponent n decreases. Vari-ations from the homogeneous case grow as the standarddeviation increases. Also the curves for the di�erent
Fig. 5. Sample concentration distributions for the Freundlich expo-
nent n � 0:4 and a log-hydraulic conductivity ®eld correlation length
of 10 m.
Fig. 4. Sample concentration distributions for the Freundlich expo-
nent n � 0:4 and a log-hydraulic conductivity ®eld correlation length
of 5 m.
898 A. Abulaban, J.L. Nieber / Advances in Water Resources 23 (2000) 893±905
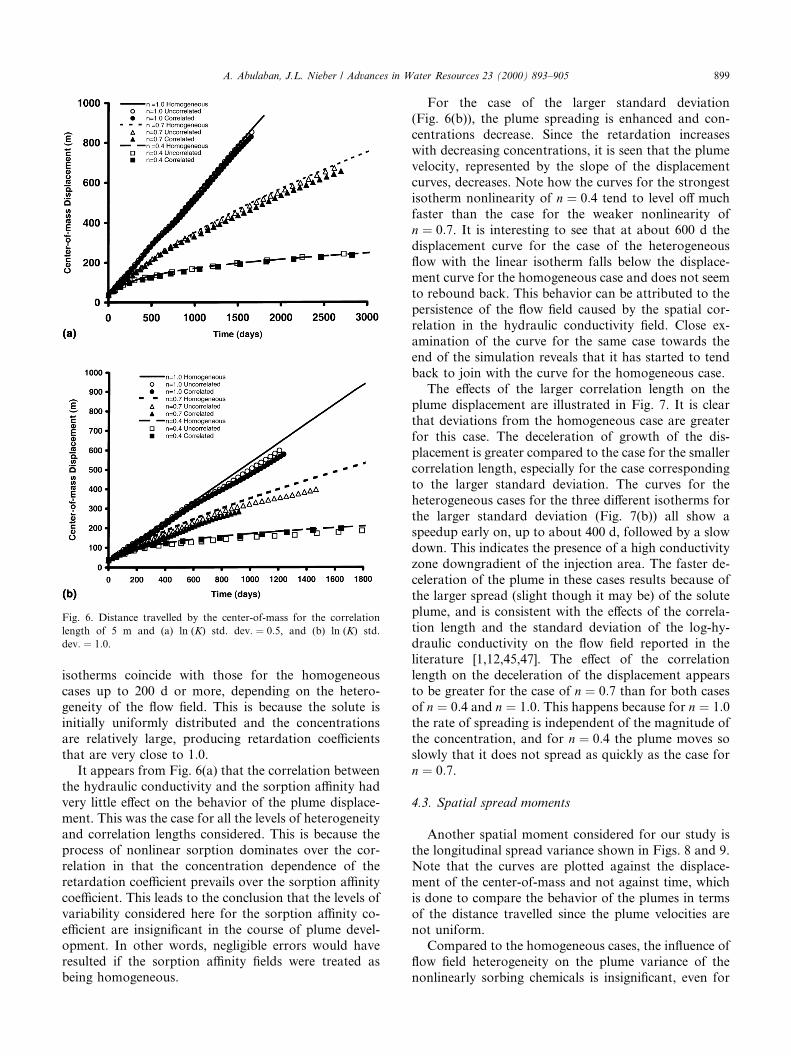
isotherms coincide with those for the homogeneouscases up to 200 d or more, depending on the hetero-geneity of the ¯ow ®eld. This is because the solute isinitially uniformly distributed and the concentrationsare relatively large, producing retardation coe�cientsthat are very close to 1:0.
It appears from Fig. 6(a) that the correlation betweenthe hydraulic conductivity and the sorption a�nity hadvery little e�ect on the behavior of the plume displace-ment. This was the case for all the levels of heterogeneityand correlation lengths considered. This is because theprocess of nonlinear sorption dominates over the cor-relation in that the concentration dependence of theretardation coe�cient prevails over the sorption a�nitycoe�cient. This leads to the conclusion that the levels ofvariability considered here for the sorption a�nity co-e�cient are insigni®cant in the course of plume devel-opment. In other words, negligible errors would haveresulted if the sorption a�nity ®elds were treated asbeing homogeneous.
For the case of the larger standard deviation(Fig. 6(b)), the plume spreading is enhanced and con-centrations decrease. Since the retardation increaseswith decreasing concentrations, it is seen that the plumevelocity, represented by the slope of the displacementcurves, decreases. Note how the curves for the strongestisotherm nonlinearity of n � 0:4 tend to level o� muchfaster than the case for the weaker nonlinearity ofn � 0:7. It is interesting to see that at about 600 d thedisplacement curve for the case of the heterogeneous¯ow with the linear isotherm falls below the displace-ment curve for the homogeneous case and does not seemto rebound back. This behavior can be attributed to thepersistence of the ¯ow ®eld caused by the spatial cor-relation in the hydraulic conductivity ®eld. Close ex-amination of the curve for the same case towards theend of the simulation reveals that it has started to tendback to join with the curve for the homogeneous case.
The e�ects of the larger correlation length on theplume displacement are illustrated in Fig. 7. It is clearthat deviations from the homogeneous case are greaterfor this case. The deceleration of growth of the dis-placement is greater compared to the case for the smallercorrelation length, especially for the case correspondingto the larger standard deviation. The curves for theheterogeneous cases for the three di�erent isotherms forthe larger standard deviation (Fig. 7(b)) all show aspeedup early on, up to about 400 d, followed by a slowdown. This indicates the presence of a high conductivityzone downgradient of the injection area. The faster de-celeration of the plume in these cases results because ofthe larger spread (slight though it may be) of the soluteplume, and is consistent with the e�ects of the correla-tion length and the standard deviation of the log-hy-draulic conductivity on the ¯ow ®eld reported in theliterature [1,12,45,47]. The e�ect of the correlationlength on the deceleration of the displacement appearsto be greater for the case of n � 0:7 than for both casesof n � 0:4 and n � 1:0. This happens because for n � 1:0the rate of spreading is independent of the magnitude ofthe concentration, and for n � 0:4 the plume moves soslowly that it does not spread as quickly as the case forn � 0:7.
4.3. Spatial spread moments
Another spatial moment considered for our study isthe longitudinal spread variance shown in Figs. 8 and 9.Note that the curves are plotted against the displace-ment of the center-of-mass and not against time, whichis done to compare the behavior of the plumes in termsof the distance travelled since the plume velocities arenot uniform.
Compared to the homogeneous cases, the in¯uence of¯ow ®eld heterogeneity on the plume variance of thenonlinearly sorbing chemicals is insigni®cant, even for
Fig. 6. Distance travelled by the center-of-mass for the correlation
length of 5 m and (a) ln (K) std. dev: � 0:5, and (b) ln (K) std.
dev: � 1:0.
A. Abulaban, J.L. Nieber / Advances in Water Resources 23 (2000) 893±905 899
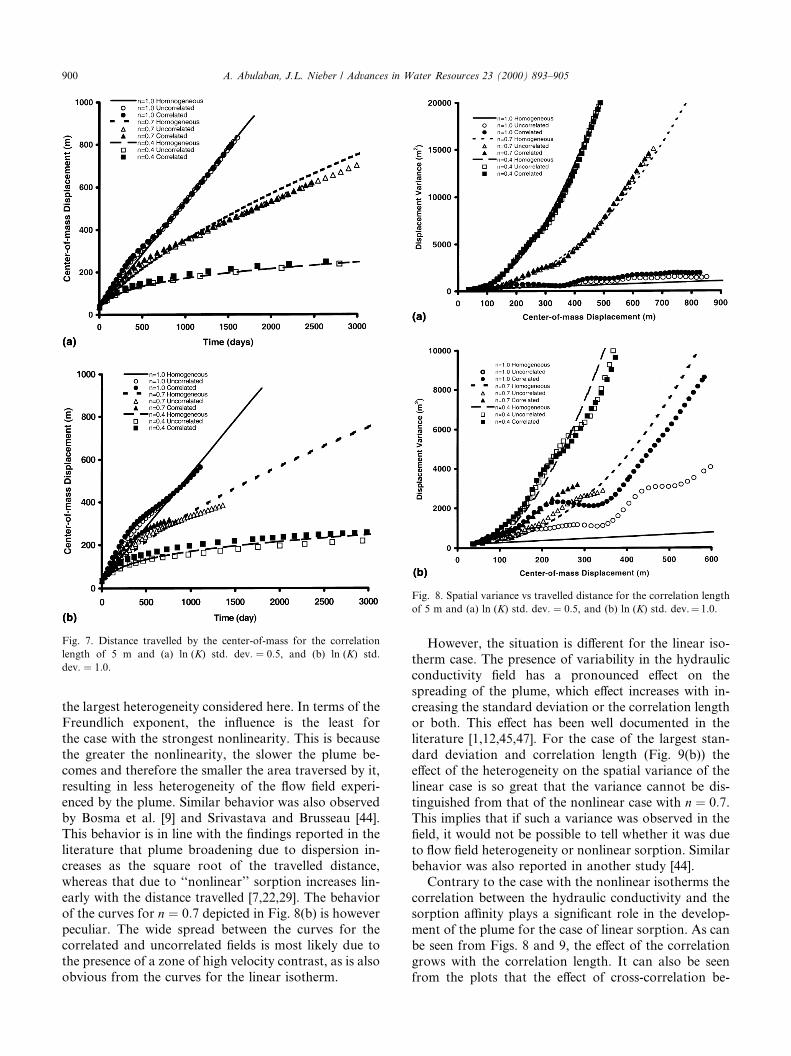
the largest heterogeneity considered here. In terms of theFreundlich exponent, the in¯uence is the least forthe case with the strongest nonlinearity. This is becausethe greater the nonlinearity, the slower the plume be-comes and therefore the smaller the area traversed by it,resulting in less heterogeneity of the ¯ow ®eld experi-enced by the plume. Similar behavior was also observedby Bosma et al. [9] and Srivastava and Brusseau [44].This behavior is in line with the ®ndings reported in theliterature that plume broadening due to dispersion in-creases as the square root of the travelled distance,whereas that due to ``nonlinear'' sorption increases lin-early with the distance travelled [7,22,29]. The behaviorof the curves for n � 0:7 depicted in Fig. 8(b) is howeverpeculiar. The wide spread between the curves for thecorrelated and uncorrelated ®elds is most likely due tothe presence of a zone of high velocity contrast, as is alsoobvious from the curves for the linear isotherm.
However, the situation is di�erent for the linear iso-therm case. The presence of variability in the hydraulicconductivity ®eld has a pronounced e�ect on thespreading of the plume, which e�ect increases with in-creasing the standard deviation or the correlation lengthor both. This e�ect has been well documented in theliterature [1,12,45,47]. For the case of the largest stan-dard deviation and correlation length (Fig. 9(b)) thee�ect of the heterogeneity on the spatial variance of thelinear case is so great that the variance cannot be dis-tinguished from that of the nonlinear case with n � 0:7.This implies that if such a variance was observed in the®eld, it would not be possible to tell whether it was dueto ¯ow ®eld heterogeneity or nonlinear sorption. Similarbehavior was also reported in another study [44].
Contrary to the case with the nonlinear isotherms thecorrelation between the hydraulic conductivity and thesorption a�nity plays a signi®cant role in the develop-ment of the plume for the case of linear sorption. As canbe seen from Figs. 8 and 9, the e�ect of the correlationgrows with the correlation length. It can also be seenfrom the plots that the e�ect of cross-correlation be-
Fig. 8. Spatial variance vs travelled distance for the correlation length
of 5 m and (a) ln (K) std. dev: � 0:5, and (b) ln (K) std. dev.� 1.0.
Fig. 7. Distance travelled by the center-of-mass for the correlation
length of 5 m and (a) ln (K) std. dev: � 0:5, and (b) ln (K) std.
dev: � 1:0.
900 A. Abulaban, J.L. Nieber / Advances in Water Resources 23 (2000) 893±905

tween the two ®elds grows with the standard deviation.This is because the retardation coe�cient depends onlyon the variable sorption a�nity coe�cient and not onthe concentration. As discussed above, negative corre-lation between the hydraulic conductivity and thesorption a�nity coe�cient widens the relative variationsamong the retarded velocities, and this enhances thespreading relative to the uncorrelated case. This is seenhere because of the absence of concentration depen-dence of the retardation coe�cient, which dependencewas seen to dominate the behavior of plumes withnonlinear sorption.
Due to the asymmetry of the solute plumes under-going nonlinear sorption, the variance is deemed to be apoor measure of spatial spread. Sometimes the variancefor an asymmetric distribution can be larger than foranother one that appears to be wider [53]. We proposethat a more intuitive and robust measure of the spatialspread is the range of the distribution. In our analysis,we chose to look at the 95% range as an alternative
measure of spatial spread. The 95% range, l95, is de®nedas the distance between the 2.5 and the 97.5 percentile ofthe solute mass.
The 95% range curves are shown in Figs. 10 and 11.The range is a more well-behaving function than thevariance in that it is more representative of the spatialspread of the plume. As was discussed in our previouspaper [4], the nonlinear sorption process is a counterdispersive one in that it acts against the spreading of theplume front and the nonlinearly increasing variance isdue to the stretching tail, which has larger weight in thecalculation of the variance. We also discussed that be-cause of the self-sharpening e�ect of the nonlinearsorption process the plume is expected to reach a pointwhere the front stops spreading and that the stretchingof the tail would be the primary cause of the increasingvariance. In fact this was shown to be the case in our
Fig. 9. Spatial variance vs travelled distance for the correlation length
of 10 m and (a) ln (K) std. dev: � 1:0, and (b) ln (K) std. dev: � 1:0.
Fig. 10. 95% Longitudinal range vs travelled distance for the corre-
lation length of 5 m and (a) ln (K) std. dev: � 0:5, and (b) ln (K) std.
dev: � 1:0.
A. Abulaban, J.L. Nieber / Advances in Water Resources 23 (2000) 893±905 901
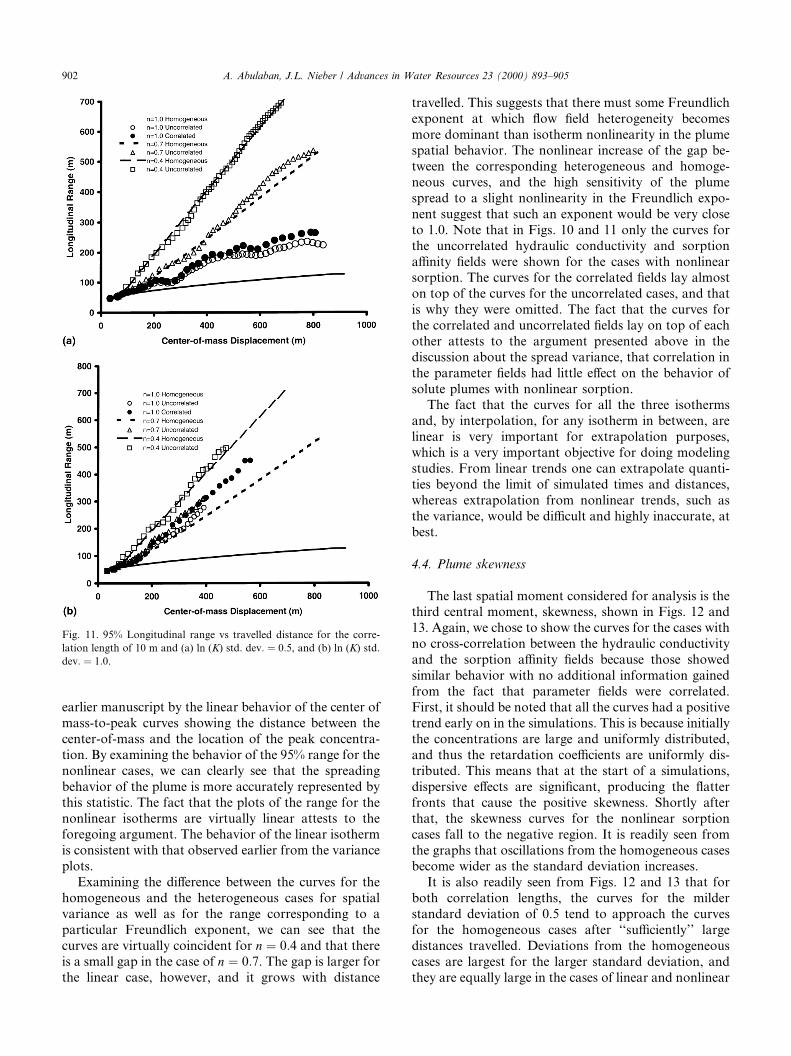
earlier manuscript by the linear behavior of the center ofmass-to-peak curves showing the distance between thecenter-of-mass and the location of the peak concentra-tion. By examining the behavior of the 95% range for thenonlinear cases, we can clearly see that the spreadingbehavior of the plume is more accurately represented bythis statistic. The fact that the plots of the range for thenonlinear isotherms are virtually linear attests to theforegoing argument. The behavior of the linear isothermis consistent with that observed earlier from the varianceplots.
Examining the di�erence between the curves for thehomogeneous and the heterogeneous cases for spatialvariance as well as for the range corresponding to aparticular Freundlich exponent, we can see that thecurves are virtually coincident for n � 0:4 and that thereis a small gap in the case of n � 0:7. The gap is larger forthe linear case, however, and it grows with distance
travelled. This suggests that there must some Freundlichexponent at which ¯ow ®eld heterogeneity becomesmore dominant than isotherm nonlinearity in the plumespatial behavior. The nonlinear increase of the gap be-tween the corresponding heterogeneous and homoge-neous curves, and the high sensitivity of the plumespread to a slight nonlinearity in the Freundlich expo-nent suggest that such an exponent would be very closeto 1.0. Note that in Figs. 10 and 11 only the curves forthe uncorrelated hydraulic conductivity and sorptiona�nity ®elds were shown for the cases with nonlinearsorption. The curves for the correlated ®elds lay almoston top of the curves for the uncorrelated cases, and thatis why they were omitted. The fact that the curves forthe correlated and uncorrelated ®elds lay on top of eachother attests to the argument presented above in thediscussion about the spread variance, that correlation inthe parameter ®elds had little e�ect on the behavior ofsolute plumes with nonlinear sorption.
The fact that the curves for all the three isothermsand, by interpolation, for any isotherm in between, arelinear is very important for extrapolation purposes,which is a very important objective for doing modelingstudies. From linear trends one can extrapolate quanti-ties beyond the limit of simulated times and distances,whereas extrapolation from nonlinear trends, such asthe variance, would be di�cult and highly inaccurate, atbest.
4.4. Plume skewness
The last spatial moment considered for analysis is thethird central moment, skewness, shown in Figs. 12 and13. Again, we chose to show the curves for the cases withno cross-correlation between the hydraulic conductivityand the sorption a�nity ®elds because those showedsimilar behavior with no additional information gainedfrom the fact that parameter ®elds were correlated.First, it should be noted that all the curves had a positivetrend early on in the simulations. This is because initiallythe concentrations are large and uniformly distributed,and thus the retardation coe�cients are uniformly dis-tributed. This means that at the start of a simulations,dispersive e�ects are signi®cant, producing the ¯atterfronts that cause the positive skewness. Shortly afterthat, the skewness curves for the nonlinear sorptioncases fall to the negative region. It is readily seen fromthe graphs that oscillations from the homogeneous casesbecome wider as the standard deviation increases.
It is also readily seen from Figs. 12 and 13 that forboth correlation lengths, the curves for the milderstandard deviation of 0.5 tend to approach the curvesfor the homogeneous cases after ``su�ciently'' largedistances travelled. Deviations from the homogeneouscases are largest for the larger standard deviation, andthey are equally large in the cases of linear and nonlinear
Fig. 11. 95% Longitudinal range vs travelled distance for the corre-
lation length of 10 m and (a) ln (K) std. dev: � 0:5, and (b) ln (K) std.
dev: � 1:0.
902 A. Abulaban, J.L. Nieber / Advances in Water Resources 23 (2000) 893±905
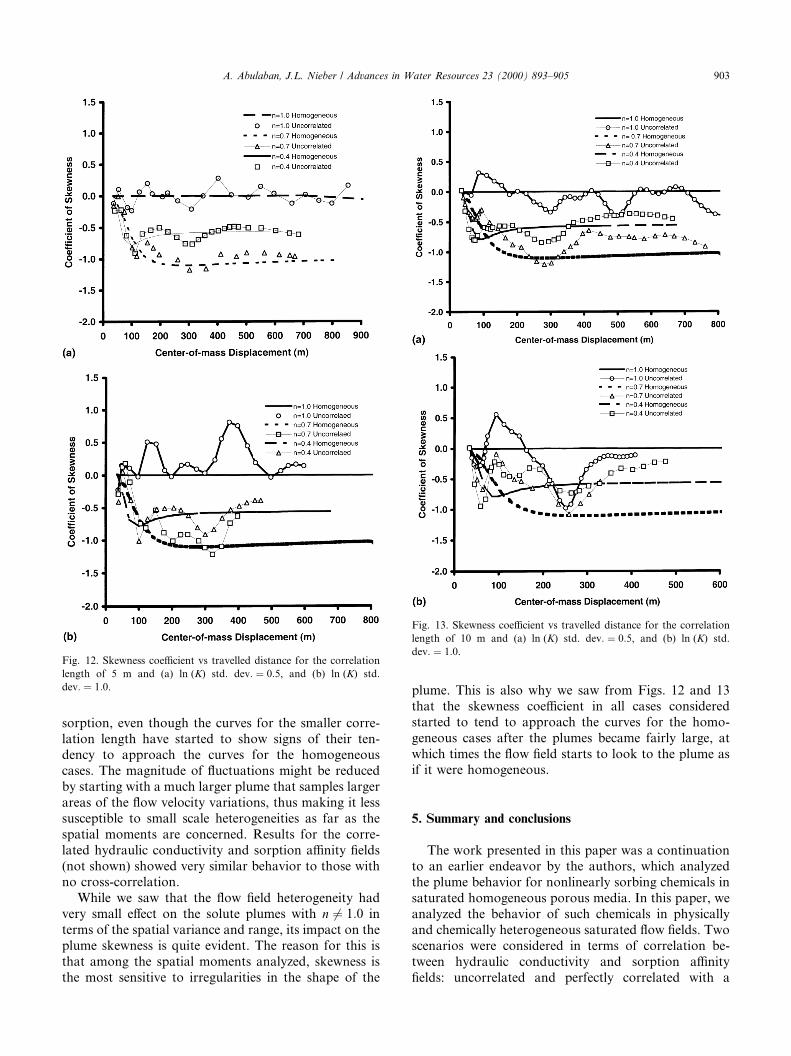
sorption, even though the curves for the smaller corre-lation length have started to show signs of their ten-dency to approach the curves for the homogeneouscases. The magnitude of ¯uctuations might be reducedby starting with a much larger plume that samples largerareas of the ¯ow velocity variations, thus making it lesssusceptible to small scale heterogeneities as far as thespatial moments are concerned. Results for the corre-lated hydraulic conductivity and sorption a�nity ®elds(not shown) showed very similar behavior to those withno cross-correlation.
While we saw that the ¯ow ®eld heterogeneity hadvery small e�ect on the solute plumes with n 6� 1:0 interms of the spatial variance and range, its impact on theplume skewness is quite evident. The reason for this isthat among the spatial moments analyzed, skewness isthe most sensitive to irregularities in the shape of the
plume. This is also why we saw from Figs. 12 and 13that the skewness coe�cient in all cases consideredstarted to tend to approach the curves for the homo-geneous cases after the plumes became fairly large, atwhich times the ¯ow ®eld starts to look to the plume asif it were homogeneous.
5. Summary and conclusions
The work presented in this paper was a continuationto an earlier endeavor by the authors, which analyzedthe plume behavior for nonlinearly sorbing chemicals insaturated homogeneous porous media. In this paper, weanalyzed the behavior of such chemicals in physicallyand chemically heterogeneous saturated ¯ow ®elds. Twoscenarios were considered in terms of correlation be-tween hydraulic conductivity and sorption a�nity®elds: uncorrelated and perfectly correlated with a
Fig. 12. Skewness coe�cient vs travelled distance for the correlation
length of 5 m and (a) ln (K) std. dev: � 0:5, and (b) ln (K) std.
dev: � 1:0.
Fig. 13. Skewness coe�cient vs travelled distance for the correlation
length of 10 m and (a) ln (K) std. dev: � 0:5, and (b) ln (K) std.
dev: � 1:0.
A. Abulaban, J.L. Nieber / Advances in Water Resources 23 (2000) 893±905 903
proportionality constant of ÿ0:5. The simulations in-volved the release of 200 g of a solute represented by 106
particles that were tracked in the ¯ow ®eld using aparticle tracking random walk method. Results werepresented in terms of concentration distributions andspatial moments of the plumes: center of mass, variance,95% range, and skewness. The results for homogeneous¯ow ®elds were also shown for comparison.
Compared to the homogeneous ®elds, ¯ow ®eld het-erogeneities caused more spreading of the solutes, whichresulted in larger retardation in the cases of nonlinearsorption and therefore relatively slower plumes. For thethree log-hydraulic conductivity standard deviations of0:25; 0:5; and 1:0, and the two correlation lengths of 5and 10 m that were considered, the mechanism of non-linear sorption seemed to prevail over the e�ects of ¯ow®eld heterogeneity. Correlation between the hydraulicconductivity and sorption a�nity ®elds did not a�ect theresults in terms of spatial moments for the nonlinearsorption scenarios either. In contrast, for those twofactors, ¯ow ®eld heterogeneity and correlation, signif-icant e�ects were observed on the behavior of theplumes with linear sorption because of the independenceof the retardation coe�cient on the magnitude of thesolute concentration.
While the curves for the spatial spread variance werehighly nonlinear for the cases of nonlinear sorption, thecurves for the 95% range for both linear and nonlinearsorption were linear. Linear trends have a practical ad-vantage for extrapolation beyond the limits of the timesand distances examined in the simulations, while ex-trapolation from nonlinear trends is di�cult and notvery accurate, if at all possible.
Due to the small size of the initial solute plumes rel-ative to the scale of velocity ®eld heterogeneities, it wasobserved that in the cases of the larger heterogeneitiesthe plumes were broken up at the beginning of thesimulations. This caused the spatial moments to oscillateerratically around the values of the moments derived forthe homogeneous ¯ow ®elds. Oscillatory behavior wasespecially prevalent for skewness since it is the momentmost sensitive to any irregularity in the solute distribu-tion.
Acknowledgements
Published as Paper No. 001120039 of the scienti®cjournal series of the Minnesota Agricultural ExperimentStation on research conducted under Minnesota Agri-cultural Experiment Station Project No. 12-047. Thiswork was also supported by the Army High Per-formance Computing Research Center under the aus-pices of the Department of the Army, Army ResearchLaboratory cooperative agreement number DAAH04-95-2-0003/contract number DAAH04-95-C-0008, the
content of which does not necessarily re¯ect the positionor the policy of the government, and no o�cialendorsement should be inferred. CRAY time for nu-merical simulations was provided in part by the Super-computer Institute at the University of Minnesota.
References
[1] Ababou R, McLaughlin D, Gelhar LW, Tompson AFB. Numer-
ical simulation of three-dimensional saturated ¯ow in randomly
heterogeneous porous media. Transp Porous Media 1989;4:549.
[2] Ababou R, Gelhar LW. Self-similar randomness and spectral
conditioning: Analysis of scale e�ects in subsurface hydrology. In:
Cushman JH, editor. Dynamics of ¯uids in hierarchical porous
media, San Diego, CA: Academic Press, 1990.
[3] Abulaban A. Modeling the transport of sorbing solutes in
heterogeneous porous media. Ph.D. Dissertation, Department of
Civil and Mineral Engineering, Minnesota: University of Minne-
sota, Minneapolis, 1993.
[4] Abulaban A, Nieber JL, Misra D. Modeling the transport of
nonlinearly sorbing solutes in saturated homogeneous porous
media. Adv Water Resour 1998;21(6):487±96.
[5] Allen-King RM, Halket RM, Gaylord DR, Robin MJL. Char-
acterizing the heterogeneity and correlation of perchloroethene
sorption and hydraulic conductivity using a facies-based ap-
proach. Water Resour Res 1998;34(3):385±96.
[6] Bakr AA, Gelhar LW, Gutjahr AL, MacMillan JR. Stochastic
analysis of variability in subsurface ¯ows, 1. Comparison of one-
and three-dimensional ¯ows. Water Resour Res 1978;14:263±72.
[7] Bolt GH. Movement of solutes in soils: principles of adsorption/
exchange chromatography. In: Bolt GH, editor. Soil chemistry B
physico-chemical models. second ed. Amsterdam: Elsevier, 1982.
p. 285±348.
[8] Bosma WJP, van der Zee SEATM. Dispersion of a continuously
injected, nonlinearly adsorbing solute in chemically or physically
heterogeneous porous formations. J Cont Hydrology 1995;18:
181±98.
[9] Bosma WJP, van der Zee SEATM, van Dujin CJ. Plume
development of a nonlinearly adsorbing solute plume in hetero-
geneous porous media. Water Resour Res 1996;32:1569±84.
[10] Burr DT, Sudicky EA, Na� RL. Nonreactive and reactive solute
transport in three-dimensional heterogeneous porous media: mean
displacement, plume spreading, and uncertainty. Water Resour
Res 1994;30(3):791±816.
[11] Dagan G. Solute transport in heterogeneous porous formations.
J Fluid Mech 1984;145:151±77.
[12] Dagan G. Statistical theory of groundwater ¯ow and transport:
pore to laboratory, laboratory to formation, and formation to
regional scale. Water Resour Res 1986;22:120S±34S.
[13] Freeze RA. A stochastic-conceptual analysis of one-dimensional
¯ow in nonuniform homogeneous media. Water Resour Res
1975;11:725±41.
[14] Freeze RA, Cherry JA. Groundwater, Englewood Cli�s, NJ:
Prentice-Hall, 1979. p. 604.
[15] Garabedian SP, Gelhar LW, Celia MA. Large scale dispersive
transport in aquifers: ®eld experiment and reactive transport
theory, Report # 315, Ralph Parsons Laboratory, Deptartment of
Civil Engineering, Cambridge, MA: MIT Press, 1988.
[16] Garabedian SP, LeBlanc DR, Gelhar LW, Celia MA. Large-scale
natural gradient tracer test in sand and gravel aquifer, Cape Cod,
Massachusetts, 2. Analysis of spatial moments for nonreactive
tracer. Water Resour Res 1991;27:910±24.
[17] Gasser RPH. An introduction to chemisorption and catalysis by
metals. New York: Oxford University Press, 1985. p. 260.
904 A. Abulaban, J.L. Nieber / Advances in Water Resources 23 (2000) 893±905
[18] Gelhar LW. Stochastic analysis of ¯ow in heterogeneous porous
media. In: Bear J, Corapcioglu M, editors. Fundamentals of
transport phenomena in porous media. Dordrecht: Martinus
Nijhof, 1984. p. 673±717.
[19] Gelhar LW. Stochastic theory of transport in saturated and
unsaturated porous media. In: Bear J, Corapcioglu M, editors.
Advances of transport in porous media. Dordrecht: Martinus
Nijhof, 1987. p. 657.
[20] Gelhar LW, Axness CW. Three-dimensional analysis of macro-
dispersion in aquifers. Water Resour Res 1983;19:161±80.
[21] Graham W, McLaughlin D. Stochastic analysis of nonstationary
subsurface solute transport, 1. Unconditional moments. Water
Resour Res 1989;25:215±32.
[22] Gri�oen J, Appelo CAJ, van Veldhuizen M. Practice of chroma-
tography: deriving isotherms from elution curves. Soil Sci Soc Am
J 1992;56:1429±37.
[23] Hamaker JW, Thompson JM. Adsorption. In: Goring CM,
Hamaker JW, editors. Organic chemicals in the soil environment.
New York: Marcel-Dekker, 1972.
[24] Hess KM, Davis JA, Fuller CC, Coston JA. Spatial variability of
metal-ion adsorption in a glacial outwash aquifer, AGU Spring
Meeting, Abstract, EOS, Trans Am Geophysical Union, Balti-
more, MD, 1993.
[25] Jackson RE, Inch JK. The in situ adsorption of 90Sr in a sand
aquifer at the Chalk River Nuclear Laboratories. J Cont
Hydrology 1989;4:27±50.
[26] Karickho� SW. Organic pollutants in aquatic systems. J Hy-
draulic Eng 1984;110:707±35.
[27] Kinzelbach W. The random walk method in pollutant transport
simulation. In: Custodio E, Gurgui A, Lobo Ferreira JP, editors.
Groundwater ¯ow and transport modeling D. Dordrecht: Riedel,
1988.
[28] Kulkarni SR. Modi®cation of a mathematical model to take into
account particle size distribution in ®xed bed carbon adsorption
systems, MS Thesis, Department of Civil Engineering, Manhat-
tan: Kansas State University, 1983.
[29] Lai SH, Jurinak JJ. Cation adsorption in one-dimensional ¯ow
through soils: a numerical solution. Water Resour Res 1972;8:99±
107.
[30] LeBlanc DR, Garabedian SP, Hess KM, Gelhar LW, Quadri RD,
Stollenwerk KG, Wood WW. Large-scale natural gradient tracer
test in sand and gravel aquifer, Cape Cod. Massachusetts, 1.
Experimental design and observed tracer movement. Water
Resour Res 1991;27:895±910.
[31] Mackay DM, Ball WP, Durant MG. Variability of aquifer
sorption properties in a ®eld experiment on groundwater trans-
port of organic solutes: methods and preliminary results. J Cont.
Hydrology 1986;1:119±32.
[32] Mantoglou A, Wilson JL. The turning bands method for the
simulation of random ®elds using line generation by a spectral
method. Water Resour Res 1982;18:1379±94.
[33] Mantoglou A, Gelhar LW. Stochastic modeling of large scale,
transient unsaturated ¯ow systems. Water Resour Res
1987;23:37±46.
[34] Neuman SP, Winter CL, Newman CM. Stochastic theory of ®eld
scale dispersion in anisotropic porous media. Water Resour Res
1987;23:453.
[35] Nkedi-Kizza P, Rao PSC, Hornsby AG. In¯uence of organic
cosolvents on sorption of hydrophobic organic chemicals by soils.
Environ Sci Technol 1985;19:975±9.
[36] Piwoni M, Banerjee P. Sorption of volatile organic solvents from
aqueous solution onto subsurface solids. J Cont Hydrology
1989;4:163±179.
[37] Rajaram H. Time and scale dependent e�ective retardation factors
in heterogeneous aquifers. Adv Water Resour 1997;20(4):217±30.
[38] Rao PS, Jessup RE. Sorption and movement of pesticides and
other toxic organic substances in soils. In: Nelson DW, Elrick DE,
Tanji KK, editors. Chemical mobility and reactivity in soil
systems, Proceedings of a symposium sponsored by divisions S-1,
S-2 and A-5 of the American Society of Agronomy and the Soil
Science Society of America in Atlanta, GA, 29 November±3
December, 1981, SSSA special pub. # 1983;11.
[39] Schwarzenbach RP, Westall J. Transport of nonpolar organic
components from surface water to groundwater: laboratory
sorption studies. Environ Sci Technol 1981;15:1360±7.
[40] Smith L, Freeze RA. Stochastic analysis of steady state ground-
water ¯ow in a bounded domain, 1. One-dimensional simulations.
Water Resour Res 1979a;15:521±8.
[41] Smith L, Freeze RA. Stochastic analysis of steady state ground-
water ¯ow in a bounded domain, 2. Two-dimensional simulations.
Water Resour Res 1979b;15:1543±59.
[42] Smith L. Theoretical relationships between reactivity and per-
meability for monomineralic porous media, Materials Research
Society Symposia Proceedings, Materials Research Society, Pitts-
burgh, PA, 1996;412:693±700.
[43] Sposito G. The surface chemistry of soils. New York: Oxford
University Press, 1984. p. 234.
[44] Srivastava R, Brusseau ML. Nonideal transport of reactive
solutes in heterogeneous porous media: 1. Numerical model
development and moments analysis. J Cont Hydrology
1996;24:117±43.
[45] Sudicky EA. A natural gradient experiment on solute transport
in a sandy aquifer: spatial variance of hydraulic conductivity and
its role in the dispersion process. Water Resour Res 1986;22:
2069±82.
[46] Tompson AFB, Vomvoris EA, Gelhar LW. Numerical simulation
of solute transport in randomly heterogeneous porous media:
motivation, model development and application, Rep. #36, Ralph
M. Parson Laboratory, Department of Civil Engineering, Mass
Institute of Technology, Cambridge, MA, 1988.
[47] Tompson AFB, Gelhar LW. Numerical simulation of solute
transport in three-dimensional randomly heterogeneous porous
media. Water Resour Res 1990;26:2541±62.
[48] Tompson AFB. Numerical simulation of chemical migration in
physically and chemically heterogeneous porous media. Water
Resour Res 1993;29:3709±26.
[49] Tompson AFB, Jackson, Reactive transport in heterogeneous
systems: an overview, Reviews in Mineralogy, Mineralogical
Society of America 1996;34.
[50] U�nk GJM. A random walk method for the simulation of
macrodispersion in a strati®ed aquifer. In: Dunin FX, Matthess
G, Gras RA, editors. Relation of groundwater quality and
quantity, Proceedings IUGG±IAHS Symposium in Hamburg, vol.
146. Oxfordshire, Wallingford: IAHS, 1985. p. 103±14.
[51] Valocchi AJ. Spatial moment analysis of the transport of
kinetically adsorbing solutes. Water Resour Res 1989;25:273±80.
[52] Weber WJ, Jr., McGinley PM, Katz LE. Sorption phenomena in
subsurface systems: concepts, models, and e�ects on contaminant
fate and transport. Water Res 1991;25:499±528.
[53] Wilson BN. Bayesian estimation of erosion parameters, Part I:
theoretical development. Trans Am Soc Agri Eng 1991;34:809±20.
[54] Yang J, Zhang R, Wu J, Allen MB. Stochastic analysis of
adsorbing solute transport in two-dimensional unsaturated soils.
Water Resour Res 1996;32:2747±56.
A. Abulaban, J.L. Nieber / Advances in Water Resources 23 (2000) 893±905 905
Copyright © 2022 FDOKUMEN