Earnings inequality in Europe: Structure and patterns of inter-temporal changes
38
IZA DP No. 2636 Earnings Inequality in Europe: Structure and Patterns of Inter-Temporal Changes Ioannis Cholezas Panos Tsakloglou DISCUSSION PAPER SERIES Forschungsinstitut zur Zukunft der Arbeit Institute for the Study of Labor February 2007
Transcript of Earnings inequality in Europe: Structure and patterns of inter-temporal changes

IZA DP No. 2636
Earnings Inequality in Europe:Structure and Patterns of Inter-Temporal Changes
Ioannis CholezasPanos Tsakloglou
DI
SC
US
SI
ON
PA
PE
R S
ER
IE
S
Forschungsinstitutzur Zukunft der ArbeitInstitute for the Studyof Labor
February 2007

Earnings Inequality in Europe:
Structure and Patterns of Inter-Temporal Changes
Ioannis Cholezas University of Peloponnese
Panos Tsakloglou
Athens University of Economics and Business and IZA
Discussion Paper No. 2636 February 2007
IZA
P.O. Box 7240 53072 Bonn
Germany
Phone: +49-228-3894-0 Fax: +49-228-3894-180
E-mail: [email protected]
Any opinions expressed here are those of the author(s) and not those of the institute. Research disseminated by IZA may include views on policy, but the institute itself takes no institutional policy positions. The Institute for the Study of Labor (IZA) in Bonn is a local and virtual international research center and a place of communication between science, politics and business. IZA is an independent nonprofit company supported by Deutsche Post World Net. The center is associated with the University of Bonn and offers a stimulating research environment through its research networks, research support, and visitors and doctoral programs. IZA engages in (i) original and internationally competitive research in all fields of labor economics, (ii) development of policy concepts, and (iii) dissemination of research results and concepts to the interested public. IZA Discussion Papers often represent preliminary work and are circulated to encourage discussion. Citation of such a paper should account for its provisional character. A revised version may be available directly from the author.

IZA Discussion Paper No. 2636 February 2007
ABSTRACT
Earnings Inequality in Europe: Structure and Patterns of Inter-Temporal Changes*
The paper provides an analysis of the level, the structure and the patterns of inter-temporal change in hourly earnings inequality in Europe. For the purposes of static inequality decomposition analysis, the data of the ECHP are employed. Considerable cross-country differences are observed across the EU regarding both the level and the structure of earnings inequality. In most countries, of the four factors examined (education, age, sex and sector of employment), education and, to a lesser extent, age are found to be most closely associated with inequality. For the purposes of inequality trend decomposition analysis national data sets for eight European countries are utilised. The results show that in most countries the main factor behind the observed changes in earnings inequality was changes in inequality “within groups” irrespective of the partitioning criterion used, while the effect of changes in group mean earnings was negligible. Finally, changes in the composition of wage and salary earners regarding the four aforementioned factors (education, age, sex and sector of employment) had a relatively large, but not uniform across countries, effect only in a few countries and mainly when the partitioning factor is education. JEL Classification: J31 Keywords: earnings inequality, Europe Corresponding author: Panos Tsakloglou Department of International and European Economic Studies Athens University of Economics and Business 76 Patission Street Athens 10434 Greece E-mail: [email protected] * Earlier versions of the paper were presented and useful comments received from conference participants at the 18th Annual Meeting of the European Society for Population Economics (ESPE) in Bergen, the 2004 Euro Panel Users Network (EPUNet) Conference in Berlin and the 2006 European Association of Labour Economists (EALE2006), in Prague. The final version of the paper was written when Panos Tsakloglou was Visiting Senior Research Fellow at the Hellenic Observatory of the European Institute of the LSE. He wishes to thank the members of the Observatory for their hospitality. Financial support from the European Commission through the EC-IHP project ‘Education and Wage Inequality in Europe – EDWIN’ (HPSE-CT2002-00108) is gratefully acknowledged.

1
1. Introduction
Research on issues of earnings inequality gained a lot of prominence among economist in recent years [see, among others, Murphy and Welch (1992), Katz and Murphy (1993), Machin (1996), Gottschalk and Smeeding (1997), Cohen et al (2002), Acemoglu (2002a, 2003), Mortensen (2003), Leuven et al (2004) and the references cited there]. Although the majority of the relevant empirical studies that can be found in the literature are concerned with the US labour market, a considerable proportion covers European countries. Few of the latter, though, are truly comparative studies. The present paper aims to fill this gap and analyse the structure of earnings inequality as well as the patterns of observed changes in earnings inequality in a number of European countries.
The paper consists of two parts. The first part aims to identify similarities and differences in the structure of hourly earnings inequality across EU member-states using data that are strictly comparable across countries. For the purposes of the analysis of this part of the paper we rely on the data of the European Community Household Panel (ECHP). The aim of the second part of the paper is to identify the factors behind the observed changes in hourly earnings inequality in eight European countries in recent decades, using data sets that are strictly comparable within, but not necessarily across, countries. Each part consists of two sections; the first deals with issues of data and methodology and the second provides the empirical results. In addition, there is a sub-section attempting to identify factors associated with aggregate hourly earnings inequality. Finally, after a concluding section, the Appendix discusses briefly the structure and patterns of inter-temporal changes in monthly rather than hourly earnings inequality in Europe.
2. Structure
2.1 Data and methodology
As noted above, for the purposes of the analysis of the structure of inequality we use the data of the ECHP. The ECHP is an ambitious effort at collecting information on the living standards of the households of the EU member-states using common definitions, information collection methods and editing procedures. It contains detailed information on incomes, socio-economic characteristics, housing amenities, consumer durables, social relations, employment conditions, health status, subjective evaluation of well-being, etc.2 The information used in the paper comes from the last two waves of the ECHP (7th wave, year 2000 and 8th wave, year 2001). More specifically, the income information of the 8th wave which refers to the previous year (2000) is matched with the characteristics of the individual in that year. All “old” EU15 countries are covered, with the exception of the Netherlands and Sweden for which data on the number of months in employment during the previous year is not available in the ECHP (and, hence, monthly and hourly wage rates cannot be computed). Due to data problems with a number of variables in subsequent waves, the data for France and the UK refer to earlier waves (4th for the UK, 5th for France; 1997 and 1998, respectively).
In each of the thirteen countries included in our analysis, the sample consists of all employees aged between 18 and 64 with employment outside the agricultural sector 2 For a detailed description of the ECHP see Eurostat (1996); for a critical appraisal see Peracchi (2002).
2
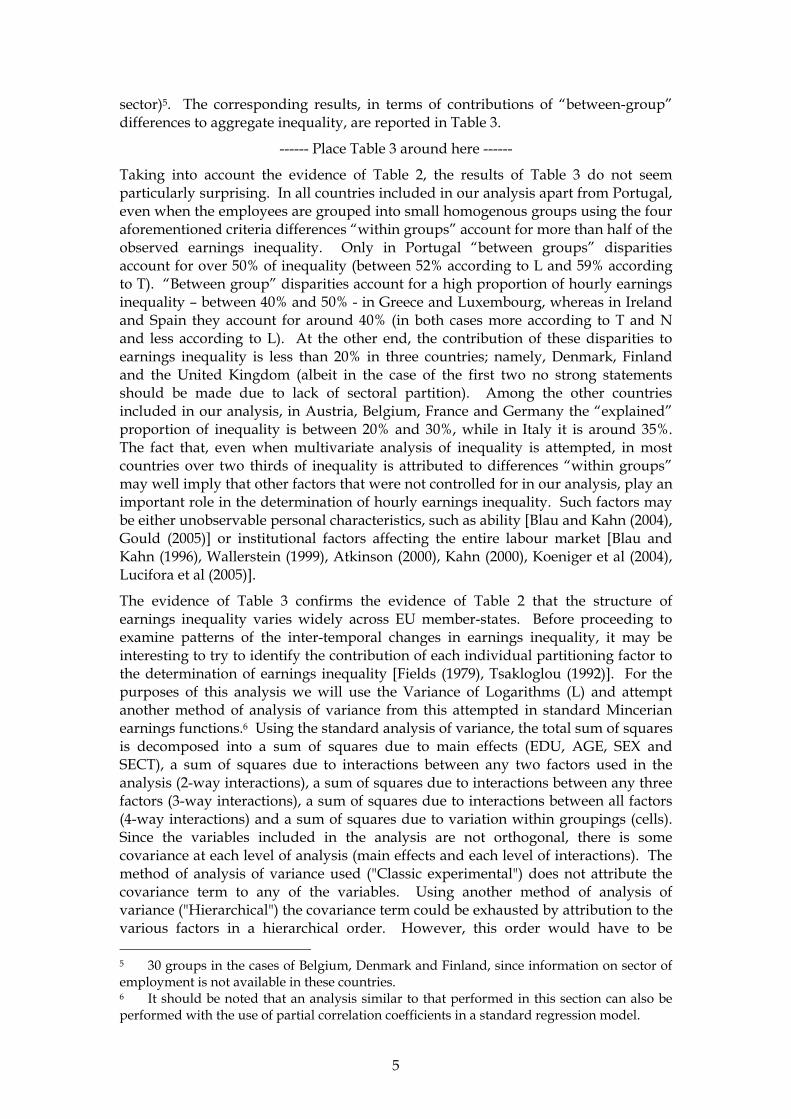
of the economy, working between 15 and 84 hours per week (“regular employment” in ECHP). The sample was truncated in the tails and employees with hourly earnings less than 0.1 or more than 10 times the mean earnings were excluded from the analysis.3 The concept of earnings used in our analysis is net hourly earnings after income taxes and social security contributions in 2000 (“regular earnings” in ECHP). For two countries (France and Finland) the data reported in the ECHP are gross of income taxes. They were converted to net earnings using the net-to-gross factors provided by EUROSTAT with the data of the ECHP.
In order to analyse the structure of earnings inequality we rely on the use of additively decomposable inequality indices. More specifically we use the index of Theil (T), the Mean Logarithmic Deviation (N, also known as the second index of Theil) and the Variance of Logarithms (L) of hourly earnings. The latter is essentially the index used in the analysis of variance of all empirical analyses using the Mincerian approach to the analysis of returns to human capital. Their formulae are given below [Cowell (2000)]
T = n1
⎟⎟⎠
⎞⎜⎜⎝
⎛∑= µµ
in
i
i yy1
ln (1)
N = n1
⎟⎟⎠
⎞⎜⎜⎝
⎛∑= i
n
i yµ
1ln (2)
L = n1 ( )∑
=
−n
iiy
1*lnln 2µ (3)
where yi denotes the hourly earnings of worker i, n the size of the population, and µ and µ* the arithmetic and geometric means of the distribution, respectively.
These indices can be written as the sum of inequalities “within groups” and “between groups”, when the population (employees) is partitioned into J exhaustive and mutually exclusive groups (j = 1, 2, … , J) using an exogenous criterion [Anand (1983), Tsakloglou(1993)]
T = j
J
j
jj Tnn∑
=1 µµ
+ ⎟⎟⎠
⎞⎜⎜⎝
⎛∑= µ
µµµ j
J
j
jj
nn ln
1 (4)
N = j
J
j
j Nnn∑
=1+ ⎟⎟
⎠
⎞⎜⎜⎝
⎛∑= j
J
j
j
nn
µµln
1 (5)
L = j
J
j
j Lnn∑
=1+ ( )2
1*ln*ln µµ −∑
=
j
J
j
j
nn
(6)
where nj, µj, µj*, Tj, Nj and Lj are, respectively, the population size, arithmetic and geometric means of the hourly earnings and the values of indices T, N and L of group j. In each case the first term in (4), (5) and (6) represents inequality that
3 This truncation was essential since some of the inequality indices employed in our analysis are very sensitive to the existence of extreme values. In practice, very few individuals were excluded from our analysis using this restriction.

3
emanates from disparities “within groups” and the second term inequality that is due to disparities “between groups”. Along with these indices in a few cases we also present estimates of the most popular index of inequality; that is the Gini index (G)
G = µnyinn
n
ii 2/)1(211
1∑=
−+−+ (7)
All the indices used in our analysis satisfy the basic axioms of inequality measurement (anonymity, mean independence, population independence and the principle of transfers), with the partial exception of L which violates the principle of transfers in the very unusual case that a regressive transfer takes place between two workers with earnings in excess of eµ*. In such a case L records a decline rather than an increase in inequality [Creedy (1977), Foster and Ok (1999)]. It should be noted that each index of inequality is relatively more sensitive to different types of inequality and, hence, changes in the distribution of earnings. T is relatively more sensitive to changes at the top of the distribution, N and L and more sensitive to changes close to the bottom of the distribution, while G is more sensitive to changes around the median [Cowell (2000), Lambert (2001)].
2.2 Empirical results
Estimates of G, T, N and L for the distribution of hourly earnings in the thirteen countries that are included in our analysis are reported in Table 1. Irrespective of the index of inequality used in the analysis, substantial cross country differences are evident. Moreover, the ranking of the countries does not seem to change dramatically with the index of inequality utilised. Portugal appears to have the most unequal distribution of hourly earnings according to all indices. It is followed by Greece, the United Kingdom and Luxembourg. Due to intersecting Lorenz curves, the ranking of these countries varies, depending on the index used. At the other end and irrespective of the index of inequality used for the rankings, Denmark appears to have the most equal distribution, followed by Belgium and Austria. The rest of the countries lie in intermediate positions. Certainly, based on these results, it is hard to discern a clear pattern linking earnings inequality and labour market organisation or welfare state regime.4
------ Place Table 1 around here ------
For the purposes of the first step of inequality decomposition analysis (one-way decomposition of earnings inequality), the wage and salary earners in each country’s sample are split using four alternative criteria: Education (3 groups: “Less than upper secondary”, “Upper secondary” and “Tertiary”); Age (5 groups: “18-24”, “25-34”, “35-44”, “45-54” and “55-64”); Sex (2 groups: “Males” and “Females”) and Sector (2 groups: “Industry” (including employment in construction and public utilities such as electricity, gas and water) and “Services”). Ceteris paribus, the more homogeneous the groups formed according to each partition of the population and the larger the number of the groups, the higher the share of aggregate inequality that we can anticipate to be attributed to disparities “between groups” according to the corresponding partition of the population. The estimates of the proportion of hourly
4 It should be noted that the estimates of Table 1 are not comparable with inequality estimates such as those reported in OECD (2006, Figure 2.8) since the latter are derived from distributions of total gross earnings for persons working full-time and full-year.

4
earnings inequality emanating from disparities “between groups” are reported in Table 2. It can be noticed that although these estimates differ according to the index of inequality used in the analysis, in most cases the differences across indices are not particularly large.
------ Place Table 2 around here ------
The estimates reported in the first three columns of the table suggest that the importance of education in shaping hourly earnings inequality varies enormously across European countries. On the one extreme, in Portugal between 36.4% and 42.9% (depending on the index of inequality used) of inequality can be attributed to differences between just three educational groups. Differences across educational groups account for between 20% and 30% of total earnings inequality in Luxembourg, Greece and Italy. At the other extreme, in Belgium, Denmark, the United Kingdom and Finland educational disparities account for less than 10% of hourly net earnings inequality, while in the remaining countries they account for 10-20%.
The next three columns of the table report the share of hourly earnings inequality that can be attributed to differences “between” rather than “within” age groups in each country. To some extent, “Age” can be considered as a proxy for potential experience or seniority; variables used extensively in empirical studies of returns to human capital. The results show that, with the exception of Belgium, in all other countries these shares are lower than the corresponding shares reported in the first three columns of the table. Once again, cross-country differences are quite large. Differences across age groups play a rather negligible role in the determination of hourly earnings inequality in Denmark and Finland (less than 5% of total inequality), while they account for around a fifth of the measured hourly earnings inequality in Greece. Shares in excess of 10% are also recorded in Spain, Luxembourg, Belgium, Italy and Ireland.
The last two parts of Table 2 (last six columns) report the shares of earnings inequality that can be attributed to differences across gender groups and – apart from Belgium, Denmark and Finland where this information is not of very high quality in the ECHP – sectors of employment, respectively. With few exceptions, these factors do not seem to be very important in the shaping of hourly earnings inequality. Only in four countries – Germany, Austria, Belgium and Luxembourg – gender differences account for more than 5% of the recorded earnings inequality, while only in Portugal disparities across sectors of employment account for over 5% of the observed inequality.
The results of one-way earnings inequality decomposition reported in Table 2 suggest that the structure of earnings inequality varies widely across EU countries. Naturally, in the next step of our analysis we bring together the four factors used in one-way decomposition analysis and attempt a multivariate decomposition analysis in order to determine the combined effect of these factors on hourly earnings inequality. More specifically, in this case the wage and salary earners in each country’s sample are partitioned into 60 very fine homogenous groups using simultaneously the four grouping factors used in Table 2 (education, age, sex and
5
sector)5. The corresponding results, in terms of contributions of “between-group” differences to aggregate inequality, are reported in Table 3.
------ Place Table 3 around here ------
Taking into account the evidence of Table 2, the results of Table 3 do not seem particularly surprising. In all countries included in our analysis apart from Portugal, even when the employees are grouped into small homogenous groups using the four aforementioned criteria differences “within groups” account for more than half of the observed earnings inequality. Only in Portugal “between groups” disparities account for over 50% of inequality (between 52% according to L and 59% according to T). “Between group” disparities account for a high proportion of hourly earnings inequality – between 40% and 50% - in Greece and Luxembourg, whereas in Ireland and Spain they account for around 40% (in both cases more according to T and N and less according to L). At the other end, the contribution of these disparities to earnings inequality is less than 20% in three countries; namely, Denmark, Finland and the United Kingdom (albeit in the case of the first two no strong statements should be made due to lack of sectoral partition). Among the other countries included in our analysis, in Austria, Belgium, France and Germany the “explained” proportion of inequality is between 20% and 30%, while in Italy it is around 35%. The fact that, even when multivariate analysis of inequality is attempted, in most countries over two thirds of inequality is attributed to differences “within groups” may well imply that other factors that were not controlled for in our analysis, play an important role in the determination of hourly earnings inequality. Such factors may be either unobservable personal characteristics, such as ability [Blau and Kahn (2004), Gould (2005)] or institutional factors affecting the entire labour market [Blau and Kahn (1996), Wallerstein (1999), Atkinson (2000), Kahn (2000), Koeniger et al (2004), Lucifora et al (2005)].
The evidence of Table 3 confirms the evidence of Table 2 that the structure of earnings inequality varies widely across EU member-states. Before proceeding to examine patterns of the inter-temporal changes in earnings inequality, it may be interesting to try to identify the contribution of each individual partitioning factor to the determination of earnings inequality [Fields (1979), Tsakloglou (1992)]. For the purposes of this analysis we will use the Variance of Logarithms (L) and attempt another method of analysis of variance from this attempted in standard Mincerian earnings functions.6 Using the standard analysis of variance, the total sum of squares is decomposed into a sum of squares due to main effects (EDU, AGE, SEX and SECT), a sum of squares due to interactions between any two factors used in the analysis (2-way interactions), a sum of squares due to interactions between any three factors (3-way interactions), a sum of squares due to interactions between all factors (4-way interactions) and a sum of squares due to variation within groupings (cells). Since the variables included in the analysis are not orthogonal, there is some covariance at each level of analysis (main effects and each level of interactions). The method of analysis of variance used ("Classic experimental") does not attribute the covariance term to any of the variables. Using another method of analysis of variance ("Hierarchical") the covariance term could be exhausted by attribution to the various factors in a hierarchical order. However, this order would have to be 5 30 groups in the cases of Belgium, Denmark and Finland, since information on sector of employment is not available in these countries. 6 It should be noted that an analysis similar to that performed in this section can also be performed with the use of partial correlation coefficients in a standard regression model.

6
arbitrarily determined. Obviously, the a priori determination of the importance of the factors by the hierarchical approach affects the results seriously. Hence, it is not used in the present analysis.
------ Place Table 4 around here ------
The results of this type of multivariate decomposition of inequality are reported in Table 4. Naturally, the figures reported in the last column of the table (“Model”) are identical to the figures of the last column of Table 3 in all but four cases (Austria, Germany, Italy and Luxembourg). In these countries, the existence of empty cells does not allow the estimation of some interaction effects and, hence, the figures in Table 4 are lower than the corresponding figures of Table 3. Nevertheless, since in all countries included in our analysis interaction effects account for a small proportion of total hourly earnings inequality, the corresponding differences are pretty small. Only in Ireland the combined impact of interaction effects is above 5% (6.7%). Likewise, in most countries the covariance term of the main effects is not particularly large; only in Austria, Luxembourg and Greece it accounts for around 5% of total inequality. Turning to the main effects, in all but two of the countries examined here, among the factors included in our analysis, education is found to be the factor most closely associated with inequality. Only in Belgium and the United Kingdom, ceteris paribus, age accounts for a higher proportion of hourly earnings inequality than education. Even after controlling for the rest of the factors included in the analysis as well as the interaction and covariance effects, education alone is found to account for over a third of Portugal’s inequality in the distribution of hourly earnings. The corresponding percentages for Ireland, Italy, France, Spain, Greece and Luxembourg are between 15% and 23%. In a similar framework, ceteris paribus, age alone accounts for 18% of earnings inequality in Greece and around 10% in Spain, Belgium, Ireland Luxembourg, Italy and France, while in all countries, the corresponding contributions to inequality of gender and, particularly, sector of employment are quite small.7
2.3 Factors associated with hourly earnings inequality
Before moving to the analysis of inter-temporal trends in inequality, it is interesting to identify factors that may be associated with the aggregate level of hourly net earnings inequality in the sample of countries under examination. Several such factors can be found in the literature and, broadly speaking, they can be grouped into five categories: Returns to education (relative demand and supply of skilled and unskilled labour; particularly important if there is skill-biased technological change) [Acemoglu (2002a), Card and DiNardo (2002), Martins and Pereira (2004), Moore and Ranjan (2005), Lemieux (2006a)], Labour market conditions (ceteris paribus, the tighter the labour market the lower the level of inequality) [Bertola and Ichino (1995), Jackman (1997), Gregg and Manning (1997), Acemoglu (2002b), Ayala et al (2002), Moore and Ranjan (2005)], Labour market institutions (ceteris paribus, the more centralised systems keep inequality lower) [Blau and Kahn (1996), Machin (1997), Gottschalk and Joyce (1998), Card et al (2004), Gosling and Lemieux (2004), Barth and Lucifora (2006)], Economic conditions (growth is likely to affect primarily the quantity of the unskilled labour demanded and only secondarily its price, while the more open the economy the more severe the effects on the price of unskilled labour) 7 It should be noted that the results reported in Table 4 are broadly consistent with the postulates of “Human Capital Theory”.

7
[Neary (2002), Greiner et al (2004), Moore and Ranjan (2005)] and, since our focus is on earnings after income taxes and social security contributions, Tax system (the more progressive the tax system, the lower the level of inequality).
Table 5 reports Pearson correlation coefficients between the level of earnings inequality as measured by the four indices used in our analysis (Gini, Theil, Mean log deviation and Variance of logs) and eighteen such variables. These variables come from a variety of sources and attempt to capture aspects of Returns to education (Returns to Tertiary and Upper Secondary Education), Labour market conditions (Female Labour Force Participation Rate, Part Time Employment Rate, Unemployment Rate, Long term Unemployment Rate), Labour market institutions, (Centralisation, Union Density, Collective Bargaining, Employment Protection, Minimum to Median Wage), Tax system (Tax Progressivity and Average Income Tax Rate – including Employee Social Security Contributions; separately for single persons and married persons with two children) and Economic conditions (Growth Rate and Market Openness).8
------ Place Table 5 around here ------
The results of Table 5 should be interpreted with caution since they are derived from 13 observations only (fewer in the case of variables related to Labour market institutions). Most of the coefficients turn out to have the expected sign but few are statistically significant. The results seem to suggest that in the thirteen countries under consideration, irrespective of the index of inequality used, of the factors examined only returns to education, tax progressivity and centralization are statistically significantly associated with hourly earnings inequality. In the case of returns to education the rationale is obvious. Ceteris paribus, the higher the returns to education the larger the gap between educational groups and the higher the level of inequality. Equally obvious is the negative association between the level of earnings inequality and the progressivity of the tax system (captured by the ratio of the share of income taxes and employee social security contributions in the gross earnings of a worker with a non-working wife and two children with earnings 167% of the average over the same figure for a worker with the same characteristics and earnings 67% of the average). Other things being equal, the more progressive the system the smaller the distance between highly remunerated workers and the rest of the workers and the lower the measured level of inequality. The negative and statistically significant association between earnings inequality and centralization seems to confirm the hypothesis that the more centralised systems manage to keep wage differentials and inequality low.
------ Place Table 6 around here ------
8 The data used in Table 5 come from a variety of sources. Returns to education were estimated by us using simple Mincerian equations on the ECHP data; Labour market conditions variables were taken from EUROSTAT’s – Labour Force Surveys, data on Labour market institutions are from the OECD’s Labour Market Statistics (apart from the Centralisation index that was taken from the site of Torben Iversen http://www.people.fas.harvard.edu/~iversen/index_files/page0009.htm), variables associated with the Tax system are from the OECD’s Taxing Wages database, while the average Growth Rate over the past five years and Market Openness (combined share of imports and exports in GDP) were taken form the OECD’s Macroeconomic Series. Note that information on Labour market Institutions was not available for all countries (and, further, as will be noted even for these countries it was not for all ECHP years, 1993-2000).

8
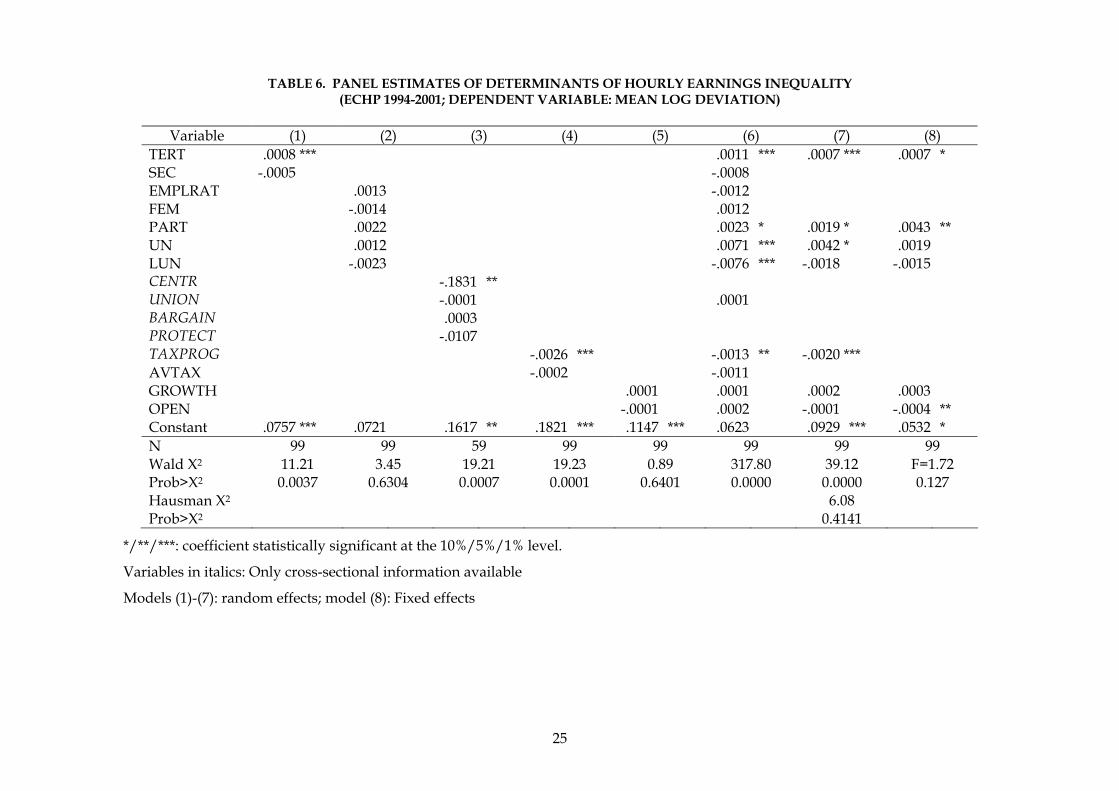
Several of the variables shown in Table 5 are likely to be interrelated. Therefore, it would be interesting to try to disentangle their effects using regression analysis techniques. This is attempted in Table 6, exploiting the panel information of the ECHP. The panel is unbalanced since not all 13 countries participated in the ECHP for eight years. The dependent variable is the mean log deviation of the distribution of net hourly earnings; similar results were obtained when other inequality indices were used instead of it as dependent variable.9 In the first seven columns of the table the estimates are derived using random effects estimation techniques. In the first five columns, each set of variables – capturing, respectively the effects of Returns to education, Labour market conditions, Labour market institutions, Tax system and Economic conditions on hourly earnings inequality - are taken separately as explanatory variables. Due to the short period of the panel, the results should be interpreted cautiously. In line with the results of table 5, only three variables turn out to be statistically significant and have the expected signs in these columns: returns to tertiary education, centralisation and tax progressivity. In column (6) all variables are taken together (dropping variables for which information is not available for all countries), while in column (7), in order to avoid serious misspecification biases we keep only the variables that turned out to be statistically significant at the 25% level. In both cases, the variables included appear to be jointly statistically significant while the individual variables that retain their significance are returns to tertiary education (inequality increasing) and tax progressivity (inequality reducing), as well as the hare of part-time employees among the employees and the rate of unemployment (both inequality increasing).10 The results of the Hausman test reported in column (7) suggest that the estimates of a fixed and a random effects model do not differ systematically. Nevertheless, since there may be systematic country effects, we also estimated a fixed effects model. The results are reported in column (8).11 Returns to tertiary education and the share of part-time employment in total employment retain their significance (but not the rate of unemployment), while openness turns out to be significant but with the “wrong” sign and the F-test rejects the joint significance of the variables. All in all, the results of Tables 5 and 6 seem to suggest that, at least, returns to education, tax progressivity and centralisation are probably systematically associated with inequality in the distribution of net hourly earnings.
3. Patterns of inter-temporal changes
3.1 Data and methodology
Taking into account that the period covered by the ECHP is relatively short (eight waves, or, after bringing incomes and attributes to the same year, seven years), for the examination of patterns of inter-temporal changes we had to rely on national data sets of the countries involved in the EDWIN project. Attention was paid so that the data sets used cover relatively long periods (not the same for every country) and are strictly comparable within countries, although not necessarily across countries. These data sets are the following (longest period covered in parentheses): Finland
9 Results available from the authors on request. 10 Centralisation (CENTR) had to be dropped since information on the index was not available for all countries. 11 Tax progressivity (TAXPROG) had to be removed from the explanatory variables, since only cross sectional information was available for it.

9
(1984-1998): Labour Force Survey; France (1990-2001): Labour Force Survey; Germany (1984-2000): German Socio-Economic Panel; Greece (1974-1999): Household Budget Survey; Italy (1987-2000): Survey of Households’ Income and Wealth; Norway (1980-2000): Level of Living Survey; Sweden (1974-2000): Level of Living Survey; United Kingdom (1994-2003): Labour Force Survey. As in the previous section, the samples consist of employees aged between 18 and 64 with employment outside the agricultural sector of the economy, working between 15 and 84 hours per week, truncated in the tails (employees with hourly earnings less than 0.1 or more than 10 times the mean earnings were excluded from the analysis). However, unlike the previous section, the concept of earnings used in all but two of the countries included in our analysis is gross hourly earnings. Only in Greece and Italy the concept of earnings remains the same as in section 2 (net hourly earnings after income taxes and social security contributions).
During the period under examination, in almost all countries a number of significant changes took place regarding the composition of the labour force. Four of these changes are associated with the variables (partitioning factors) used in section 2; namely, an improvement of the educational qualifications of the labour force, an ageing of the labour force, an increased participation of women in the labour force and a shift in employment from manufacturing to services. Several authors attribute at least part of the changes (mostly increases) in the levels of earnings inequality observed in many industrialised countries in recent decades to changes in one or more of these factors [Nickell and Bell (1996), Gottschalk and Joyce (1998), Card and DiNardo (2002), Autor, Katz and Kearney (2005a, 2005b), Lemieux (2006b), Fernandez-Kranz (2006)].
The aim of the present section is to examine the influence of changes in these factors on hourly earnings inequality using the technique of inequality trend decomposition analysis. Using this technique, the observed change in total earnings inequality can be attributed to changes in inequality “within groups”, changes in population shares and changes in group mean earnings (proxy for changes in inequality “between groups”). All decomposable inequality indices can be used for inequality trend decomposition analysis [Mookherjee and Shorrocks (1982), Tsakloglou (1993), Jenkins (1995)]. Even though the analysis was carried out using all three decomposable inequality indices used in section 2, for reasons of economy of space only results derived using the Mean Logarithmic Deviation (N) are presented below.12 Differentiating (5) and after some manipulations [Tsakloglou (1993)] we derive
∑ ∑ ∑ ∑= = = =
∆−+∆−+∆+∆=∆J
j
J
j
J
j
J
jjjjjjjjjjj wvvwwvNNvN
1 1 1 1
ln)1()ln( µ (8)
where νj = nj/n and wj = µj/µ. The first term on the right hand side of (8) depicts the impact of changes “within groups”, the next two terms the impact of changes in the structure of the population and the last term depicts the impact of changes in the mean earnings of the groups.13 More precisely, the second term depicts the impact of
12 The results derived using either T or L were very similar to those reported below. They are available from the authors on request. 13 Note that if the earnings of all groups grow by the same proportion, this term is equal to zero. Hence, in effect, this term depicts the impact of relative rather than absolute changes in group mean earnings.

10
changes in population shares on “within groups” disparities, while the third term the impact of changes in population shares on group mean earnings.
3.2 Empirical results
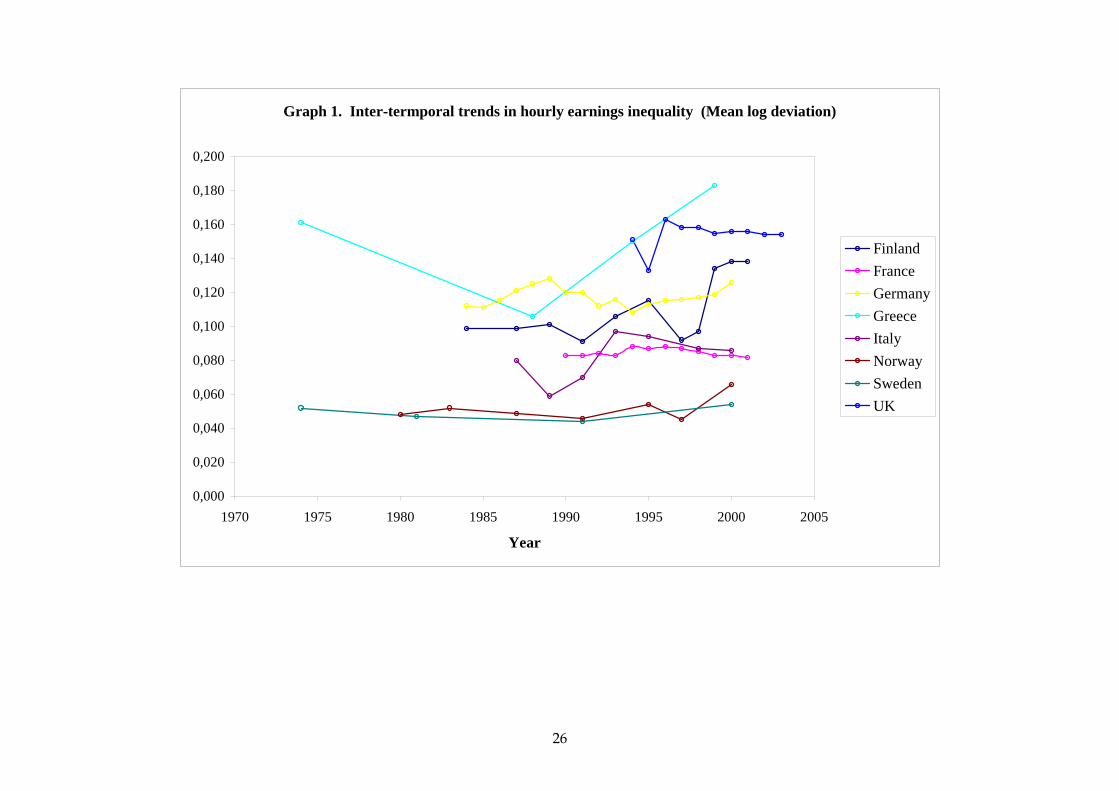
Before proceeding to the trend decomposition analysis, Graphs 1 provides a picture of the changes in hourly earnings inequality in the eight countries under consideration using N, while the first four columns of Table 7 report changes in hourly earnings inequality for the longest period covered for each country using G, T, N and L. Although in no country was the trend of earnings inequality monotonic, according to the indices reported in Table 7 and an analysis of the corresponding Lorenz curves, inequality was higher in the end than in the beginning of the period under examination in four countries (Germany, Greece, Italy and, especially, Norway14), marginally lower in two countries (Finland and France), while in two countries (Sweden and the United Kingdom) due to the existence of intersecting Lorenz curves close to the bottom of the distribution no unambiguous ranking could be achieved. Nevertheless, most of the indices used in Table 7 suggest that hourly earnings inequality rose modestly in these countries, too.
------ Place Graph 1 around here ------
It is interesting to note that the proportional changes in earnings inequality recorded by the various indices differ quite considerably. This should be attributed to the aforementioned property of inequality indices to differ regarding their sensitivity to particular types of changes. In almost all cases, the lowest changes in inequality are recorded by G, which is not as sensitive to changes in the tails of the distribution as the other indices used in our analysis. In comparison to the other indices, T is relatively more sensitive to changes at the top end of the distribution, while N and, particularly L are more sensitive to changes at the bottom end of the distribution. These properties explain some of the results of Table 7 that might seem paradoxical at first sight. For example, in the period under examination the UK experienced an increase in the relative earnings – relative to the mean earnings – of those with very high and extremely low hourly earnings. The first change implies a rise in inequality, while the second a decline. The combined effect in the case of T, that is relatively more sensitive to changes close to the top of the distribution, is an increase in inequality, while in the case of L, that is very sensitive to changes close to the bottom end of the distribution, is a modest decline in inequality. Similar explanations can also be provided for other countries included in our analysis (Sweden: explanation similar to the UK; Germany: changes driven primarily by changes at the top end of the distribution; Greece and Italy: changes driven primarily by changes at the bottom end of the distribution).
------ Place Table 7 around here ------
The last four columns of Table 7 report changes in four of the characteristics of the national samples during the period under examination. Due to the fact that the length of the period covered differs across countries, no cross-country comparisons should be attempted. In all countries the educational qualifications of the labour force improved during the period under examination and this is reflected in the 14 It should be noted, though, that in Norway the baseline level of inequality was very low in comparison with all other countries examined here, apart from Sweden, and remained so even after this substantial, in relative terms, rise in inequality.

11
increased share of tertiary education graduates in the sample of wage and salary earners used in our analysis. Likewise, even in countries that started with high female employment levels, female employment rates rose and this is reflected in the rising shares of female employees in the samples of all countries. In almost all the countries under examination, the average age of the employees in the samples rose during the period under examination and this is partly reflected in the increased share of person aged 45-64 in all but two of the countries included in our analysis. Finally, in all but two of the samples of the countries examined here a shift from industrial employment to employment in services is observed. Therefore, it is interesting to examine the extent to which the changes in hourly earnings inequality recorded in the first four columns of Table 7 can be attributed to changes in these factors rather than changes in earnings inequality “within groups” or changes in group mean earnings. This task can be accomplished using the technique of inequality trend decomposition analysis outlined above and the corresponding results are reported in Table 8.
------ Place Table 8 around here ------
Using the example of Finland in the first line of the table, the estimates reported in Table 8 should be interpreted in the following way. If during the period under examination the educational qualifications of the labour force as well as the average hourly earnings of each educational group relative to the mean earnings had remained unchanged but inequalities “within groups” had changed they way they did, according to N hourly earnings inequality in Finland in the end of the period under examination (1998) would have been 7.4% higher than at the beginning of the period (1984). Likewise, ceteris paribus, changes in the population shares of education groups alone would have reduced inequality by 9.0%, while, other things being equal, the net effect of the changes in group mean earnings would have been a marginal decline in earnings inequality by 0.4%. Naturally, the combined effect of these factors is the corresponding change in hourly earnings inequality reported in Table 7 (-2.0%).
Starting from the last column of the first panel of Table 8, it can be argued that the effect of changes in group mean earnings on inequality were neither large nor uniform across countries. The results of the second column of the same panel suggest that, ceteris paribus, the improvements in the educational qualifications of the labour force led to a substantial decline in hourly earnings inequality in Germany (-24.3%) and Finland (-9.0%), but a rise in inequality in Sweden (10.9%) and Norway (6.3%). The corresponding proportional changes in the other countries under examination were less impressive (lower than 4.0% in absolute terms). In most countries the most significant factor behind the observed changes in earnings inequality was the recorded changes in inequality “within groups”. In all countries apart from Sweden these changes led to increased levels of earnings inequality and in some cases these changes were quite large (especially in Germany, 34.3%, Norway, 31.3% and, to a lesser extent, Greece, 12.8%).
According to the results reported in the second panel of Table 8, with the partial exception of Italy, changes in age group mean earnings had a negligible impact on hourly earnings inequality. Other things being equal, changes in population shares had a strong equalizing effect in Germany (-9.4%) and an inequality-increasing effect in Sweden (6.0%). In the rest of the countries this effect was not particularly large. The results of the first column of the panel show that in half of the countries under consideration (Norway, Germany, Greece and Italy), the main factor behind the

12
observed changes in hourly earnings inequality was the changes that took place “within groups”.15
The estimates of the third panel of Table 8, where the sample is split along gender lines, show that in all countries where a sizeable change in earnings inequality was observed (Norway, Germany, Greece and Italy) as well as in Sweden, the main factor driving this change was the increase in earnings inequality within the groups of male and female workers, whereas changes in population shares and group mean earnings played a negligible role.
Relatively similar results are also reported in the last panel of Table 8, where the wage and salary earners are partitioned according to their sector of employment. Changes in group mean earnings had a very insignificant effect in all countries, while changes in population shares had a relatively strong inequality enhancing effect only in Sweden. Other things being equal, the strongest effects in proportional terms in Norway, Greece, Germany and Italy are accounted by changes in hourly earnings inequality within industry and services.
All in all, the results of Table 8 seem to suggest that the main factor driving changes in hourly earnings inequality in most European countries where substantial changes in earnings inequality were observed was changes in inequality “within groups”, irrespective of the criterion used for the partitioning of the population. Changes in group mean earnings played a minor role, while changes in population shares appear to have had a significant impact only in a few cases and mainly when the partitioning criterion was education.16
4. Conclusions
The paper provided an analysis of the level, the structure and the patterns of inter-temporal change in hourly earnings inequality in Europe. Regarding the level of earnings inequality, considerable cross-country differences were observed across the EU. Furthermore, substantial cross-country differences were also evident in the analysis of the structure of earnings inequality using either single-factor or multivariate techniques. In most countries, of the four factors examined (education, age, sex and sector of employment), education and, to a lesser extent, age were found to be most closely associated with inequality – a result broadly in line with Human Capital Theory. Returns to education (especially tertiary education), tax progressivity and centralisation were found to be the factors most closely associated with aggregate inequality in the distribution of hourly earnings. With respect to the patterns of inter-temporal changes in inequality, the results of trend decomposition analysis demonstrated that in most countries the main factor behind the observed changes in earnings inequality was changes in inequality “within groups”
15 Changes in inequality within age groups were also the main factor behind the observed changes in earnings inequality in Finland and France, but in these countries the corresponding changes were rather small in proportional terms. 16 Naturally, the type of analysis performed in Table 8 is meaningful when relatively large changes in the composition of the sample (structure of employment) are observed. This is the reason that our analysis focused on changes in the longest possible period observed in each country. Nevertheless, where possible, the same analysis was also carried out for shorter sub-periods (1980s and 1990s). The results are available from the authors on request and show that, in the countries where data are available for both the 1990s and the 1980s the most important changes took place in the 1990s.

13
irrespective of the partitioning criterion used, while the effect of changes in group mean earnings was negligible. Finally, changes in the composition of wage and salary earners regarding the four aforementioned factors (education, age, sex and sector of employment) had a relatively large, but not uniform across countries, effect only in a few countries and mainly when the partitioning factor was education.
As noted above, the aim of the present paper was to describe patterns rather than derive detailed policy conclusions. If a policy implication can be derived from its results, it is probably a negative one. Taking into account the heterogeneity of the European countries regarding their level, structure and patterns of inter-temporal trends in hourly earnings inequality, it is rather unlikely that the same type of policies may have very similar effects across countries. Therefore, if – and this is a big “if” - the stated aim of policy is to reduce earnings inequality, different policies are likely to be appropriate in the context of different European countries.
14
REFERENCES Acemoglu D. (2002a) “Technical change, inequality, and the labor market“, Journal of
Economic Literature 40, pp. 7-72.
Acemoglu D. (2002b) “Changes in unemployment and wage inequality: An alternative theory and some evidence”, American Economic Review 89, pp. 1259-1278.
Acemoglu D. (2003) “Cross-country inequality trends”, Economic Journal 113, pp. 121-149.
Anand S. (1983) Inequality and poverty in Malaysia: Measurement and decomposition, Oxford University Press, New York etc.
Atkinson A.B. (2000) “The changing distribution of income: Evidence and explanations”, German Economic Review 1, pp. 3-18.
Autor D.H., Katz L.F. and Kearney M.S. (2005a), “Trends in U. S. wage inequality: Re-assessing the revisionists”, Harvard Institute of Economic Research Working Paper No 2095.
Autor D.H., Katz L.F. and Kearney M.S. (2005b), “Rising wage inequality: The role of composition and prices”, Harvard Institute of Economic Research Working Paper No 2096.
Ayala L., Martinez R. and Ruiz-Huerta J. (2002) “Institutional determinants of the unemployment-earnings inequality trade-off”, Applied Economics 34, pp. 179-195.
Barth E. and Lucifora C. (2006) “Wage Dispersion, Markets and Institutions: The Effects of the Boom in Education on the Wage Structure”, IZA Discussion Paper No. 2181.
Bertola G. and Ichino A. (1995) “Wage inequality and unemployment: United States vs. Europe”, in B.S. Bernanke and J. Rotemberg (eds) NBER macroeconomics annual 1995, pp. 13-54, MIT Press, Cambridge and London.
Blau F.D. and Kahn L.M. (1996) “International differences in male wage inequality: institutions versus market forces”, Journal of Political Economy 104, pp. 791-837.
Blau F.D. and Kahn L.M. (2004) “Do cognitive test scores explain higher US wage inequality? CesIfo Working Paper No. 1139.
Card D. and DiNardo J. (2002) “Skill-biased technological change and rising wage inequality: Some problems and puzzles”, Journal of Labour Economics 20, pp. 733-783.
Card D., Lemieux T. and Riddell W.C. (2004) “Unions and wage inequality”, Journal of Labour Research 25, pp. 519-562.
Cohen D., Piketty T. and Saint-Paul G. (eds) (2002) The economics of rising inequalities, Oxford University Press, Oxford and New York.
Cowell F.A. (2000) “Measurement of inequality” in A.B. Atkinson and F. Bourguignon Handbook of Income Inequality, Vol. I, pp. 87-166, Amsterdam: North Holland.
15
Creedy J. (1977) "The principle of transfers and the variance of the logarithms", Oxford Bulletin of Economics and Statistics 39, pp. 152-158.
Eurostat (1996) The European Community Household Panel (ECHP): Survey methodology and implementation, Theme 3, Series E, Eurostat, Luxembourg.
Fernandez-Kranz D. (2006) “Why has wage inequality increased more in the USA than in Europe? An empirical investigation of the demand and supply of skill”, Applied Economics 38, pp. 771-778.
Fields G.S. (1979) "Income inequality in urban Colombia: A decomposition analysis", Review of Income and Wealth 25, pp. 327-341.
Foster J. and Ok E. (1999) "Lorenz dominance and the variance of logarithms," Econometrica 67 pp 901-907.
Gosling A. and Lemieux T. (2004) “Labor market reforms and changes in wage inequality in the United Kingdom and the United States”, pp. 275-312 in D. Card, R. Blundell and R. Freeman (eds) Seeking a premier economy: The economic effects of British economic reforms, 1980-2000, University of Chicago Press, Chicago and London.
Gottschalk P. and Joyce M. (1998) “Cross-national differences in the rise in earnings inequality: Market and institutional factors”, Review of Economics and Statistics 80, pp. 489-502.
Gottschalk P. and Smeeding T.M. (1997) “Cross-national comparisons of earnings and income inequality”, Journal of Economic Literature 35, pp. 633-687.
Gould E.D. (2005) “Inequality and ability”, Labour Economics 12, pp. 169–189
Gregg P. and Manning A. (1997), “Skill-biased change, unemployment and wage inequality”, European Economic Review 41, pp. 1173-1200.
Greiner A., Rubart J. and Semmler W. (2004),” Economic growth, skill-biased technical change and wage inequality: A model and estimations for the US and Europe”, Journal of Macroeconomics 26, pp. 597-621.
Jackman R. (1997) “Unemployment and wage inequality in advanced industrial (OECD) countries”, in A.R. Khan and M. Muqtada (eds) Employment expansion and macroeconomic stability under increasing globalization, pp. 26-64, Macmillan London.
Jenkins S.P. (1995) “Accounting for inequality trends: Decomposition analyses for the UK, 1971-86”, Economica 62, pp. 29-63.
Kahn L.M. (2000) “Wage inequality, collective bargaining and relative employment from 1985 to 1994: Evidence from fifteen OECD countries,” Review of Economics and Statistics 82 pp. 564-579.
Katz L.M. and Murphy K.M. (1993) “Changes in relative wages, 1963-1987: Supply and demand factors”, Quarterly Journal of Economics 107, pp. 35-78.
Koeniger W., Leonardi M. and Nunziata L. (2004), “Labour market institutions and wage inequality” IZA Discussion Paper No. 1291.
Lambert P.J. (2001) The distribution and redistribution of income: A mathematical analysis, 3rd edition, Manchester University Press, Manchester.

16
Lemieux T. (2006a) “Postsecondary education and increasing wage inequality” American Economic Review 96 (Papers and Proceedings), pp. 195-199.
Lemieux T. (2006b) “Increasing residual wage inequality: Composition effects, Noisy data, or rising demand for skill?”, American Economic Review 96, pp. 461-498.
Leuven E., Oosterbeek H. and van Ophem H. (2004) “Explaining international differences in male inequality by differences in demand and supply of skill,” Economic Journal 114, pp. 466-486.
Lucifora C., McKnight A. and Salverda W. (2005) “Low-wage employment in Europe: a review of the evidence”, Socio-Economic Review 3, pp. 259-292.
Machin S. (1996) “Wage inequality in the UK”, Oxford Review of Economic Policy 12, pp. 47-64.
Machin S. (1997) “The decline of labour market institutions and the rise in wage inequality in Britain” European Economic Review 41 (Papers and Proceedings) pp. 647 -658.
Martins P. and Pereira P.T. (2004) “Does education reduce wage inequality? Quantile regression evidence from 16 countries”, Labour Economics 11, pp. 355-371.
Mookherjee D. and Shorrocks A. F. (1982) "A decomposition of the trend in U.K. income inequality", Economic Journal 92, pp. 886-902.
Moore M.P. and Ranjan P. (2005) “Globalisation vs skill-biased technological change: implications for unemployment and wage inequality”, Economic Journal 115, pp. 391-422.
Mortensen D. T. (2003) Wage dispersion: Why are similar workers paid differently?, MIT Press, Cambridge, Mass.
Murphy K.M. and Welch F. (1992) “The structure of wages”, Quarterly Journal of Economics 106, pp. 285-326.
Neary P.J. (2002) “Foreign competition and wage inequality”, Review of International Economics 10, pp. 680-693.
Nickell S. and Bell B. (1996) “Changes in the distribution of wages and unemployment in OECD countries,” American Economic Review 86 (Papers and Proceedings), pp. 302-307.
Peracchi F. (2002) “The European Community Household Panel: A review”, Empirical Economics 27, pp. 63-90.
Tsakloglou P. (1992) "Multivariate decomposition of inequality: Greece 1974, 1982", Greek Economic Review 14, pp. 89-102.
Tsakloglou P. (1993) "Aspects of inequality in Greece: Measurement, decomposition and inter-temporal change: 1974, 1982", Journal of Development Economics 40, pp. 53-74.
Wallerstein M. (1999) “Wage setting institutions and pay inequality in advanced industrial societies”, American Journal of Political Sciences 43, pp. 649-680.

17
APPENDIX. MONTHLY EARNINGS INEQUALITY
The main aim of the paper is to provide an analysis of inequality in the distribution of hourly earnings in Europe in both a static and a dynamic framework. Apart from hourly earnings inequality, however, a lot of interest presents the analysis of monthly earnings inequality. In the framework of the EDWIN project, an analysis like the one that was presented above for the distribution of hourly earnings was also performed for the analysis of monthly earnings. The main results of this analysis are briefly reported below.
Monthly earnings are, perhaps, more important from a policy point of view since, to a considerable extent, they determine the shape of the overall income distribution, with profound welfare implications. However, the distribution of monthly earnings is the distribution of a product concerning both prices (the wage rate or hourly earnings) and quantities (hours worked per month). Wage rates are determined in the labour market without any influence from individual workers. However, in the institutional settings encountered in European countries, individual workers have some degree of control over the number of hours they work. Therefore, the corresponding results should be interpreted accordingly.
A number of studies in the European literature, mostly concerning the United Kingdom, seem to suggest that there exists a positive correlation between hourly earnings and hours worked. The evidence of Table A1 seems to refute this hypothesis. For the purposes of this table, wage and salary earners in each country were grouped in quintiles according to their hourly earnings and, then, the hours worked per quintile were calculated. In all but one of the countries where the correlation of hours worked and hourly earnings turns out to be statistically significant, it is negative (Belgium, Denmark, Finland, Greece, Ireland, Italy, Luxembourg, Portugal and Spain). Only in Austria the correlation is positive and statistically significant, while no statistically significant correlations are reported in France, Germany and the United Kingdom. In some countries the differences in hours worked across quintiles are not particularly large, in other they are. For example, workers in the bottom quintiles of Greece, Italy and Spain appear to work 8.2, 6.2 and 5.2 hours more per week than workers in the top quintile of the distribution.
------ Place Table A1 around here ------
Prima facie, the evidence of Table A1 would suggest that monthly earnings should be distributed more equally than hourly earnings. However, in many countries the evidence of Table A1 masks considerable re-rankings of many workers, especially close to the tails of the distribution. These re-rankings are especially large among those working part-time. As a result, comparing the estimates of Table A2 with the estimates of its counterpart, Table 1, we observe that in most countries the estimates of the indices of inequality in the distribution of monthly earnings are higher than those of inequality in the distribution of monthly earnings. Only in the four Southern European countries Greece, Italy, Portugal and (according to some indices) Spain we observe the opposite. Substantial re-rankings of countries are also evident. According to all indices, the most unequal distribution of monthly earnings is that of the United Kingdom, followed by a number of countries with intersecting Lorenz curves (Portugal, France, Luxembourg and Ireland). At the other end, Denmark

18
continues to have the lowest indices of earnings inequality, followed by Italy, Finland and Belgium.
------ Place Table A2 around here ------
Furthermore, due primarily to the fact that in almost all countries women work shorter hours than men, when we move to the one-way inequality decomposition of monthly earnings in Table A3, the results are not very similar to the results of Table 2 in the sense that in many countries the largest “between groups” contribution to inequality is observed when the population is partitioned across gender lines (Austria, Belgium, Denmark, Germany, Ireland, United Kingdom). In most other countries, disparities across educational groups have the highest contribution to inequality (Portugal, Luxembourg, Finland, France, Italy), while in Greece and Spain the highest between groups contribution to monthly earnings inequality is recorded when the sample is partitioned according to age.
------ Place Table A3 around here ------
Table A4 is the equivalent of Table 3 and presents the results of multi-variate decomposition of monthly earnings inequality. The proportion of total monthly earnings inequality accounted for by the four factors used in our analysis (education, age, sex, and sector of employment) when the sample is partitioned using all of them simultaneously is higher in Table A4 than in Table 3 – sometimes substantially so – in all but three of the countries under consideration (Portugal, Greece and Italy), with marginal changes in Spain. These are precisely the countries in which inequality declined when we moved from the distribution of hourly earnings to the distribution of monthly earnings.
------ Place Table A4 around here ------
Table A5, which reports the results of the analysis of variance using L, is the equivalent of Table 4. Broadly in line with the results of Table A3, the estimates reported in Table A5 suggest that, leaving aside the covariance term and the interaction effects, in most countries (Belgium, Ireland, Austria, Germany, Denmark, United Kingdom and Finland) the most important factor that contributes to total monthly inequality is sex, while in the remaining countries – apart from Greece, where the main such factor appears to be age – the most important contributions are due to disparities between educational groups.
------ Place Table A5 around here ------
The inter-temporal changes in monthly earnings inequality are reported in Table A6. In all countries an increase in inequality between the base year and the final year is recorded.17 In fact, comparison of the estimates of Table A6 with the estimates reported in Table 5 show that in all countries apart from Norway and according to almost all indices, the recorded increases in inequality in the distribution of monthly earnings are higher than the increases in hourly earnings inequality.
------ Place Table A6 around here ------
Finally, Table A7 reports the results of trend decomposition of monthly earnings inequality. These results are relatively similar to the results of trend decomposition of hourly earnings inequality reported in Table 6. In all countries and almost
17 No information on inter-temporal changes in monthly earnings inequality is available in the case of Sweden.

19
irrespective of the partition of the population the main factor behind the observed increases in monthly earnings inequality was the increase in the level of inequality “within groups”. Changes in group mean earnings had an insignificant effect, while in most cases changes in population shares had an inequality-enhancing impact, although this impact was proportionally large only in a few cases and mainly when the partitioning criterion was education and, to a lesser extent, sector of employment.
------ Place Table A7 around here ------

TABLE 1. INEQUALITY IN THE DISTRIBUTION OF NET HOURLY EARNINGS (ECHP, 7th wave)
Index of inequality Country
Gini (G) Theil (T) Mean log deviation (N) Variance of logarithms (L)
Austria 0.195 [12] 0.065 [12] 0.064 [12] 0.128 [12]
Belgium 0.200 [11] 0.073 [11] 0.069 [11] 0.135 [11]
Denmark 0.161 [13] 0.055 [13] 0.049 [13] 0.092 [13]
Finland 0.225 [9] 0.095 [9] 0.091 [8] 0.184 [8]
France 0.280 [5] 0.142 [4] 0.132 [5] 0.249 [5]
Germany 0.225 [10] 0.086 [10] 0.086 [10] 0.175 [9]
Greece 0.289 [2] 0.147 [3] 0.136 [3] 0.254 [4]
Ireland 0.266 [7] 0.122 [7] 0.116 [7] 0.223 [6]
Italy 0.227 [8] 0.096 [8] 0.089 [9] 0.171 [10]
Luxembourg 0.286 [3] 0.136 [5] 0.132 [4] 0.258 [2]
Portugal 0.326 [1] 0.197 [1] 0.171 [1] 0.293 [1]
Spain 0.267 [6] 0.122 [6] 0.116 [6] 0.221 [7]
United Kingdom 0.285 [4] 0.148 [2] 0.136 [2] 0.256 [3]
4th wave for the UK; 5th wave for France; Ranks in brackets

21
TABLE 2. ONE-WAY INEQUALITY DECOMPOSITION
(proportion of aggregate inequality due to “between-group” disparities)
EDUCATION (3 groups)
AGE (5 groups)
SEX (2 groups)
SECTOR (2 groups)
T N L T N L T N L T N L
Austria 14.0 13.9 11.9 9.4 9.8 8.7 5.6 5.8 5.6 0.3 0.3 0.4
Belgium 6.6 6.9 5.9 11.4 12.3 11.6 4.9 5.2 4.8 na na na
Denmark 6.6 7.5 8.6 2.9 3.4 5.1 3.9 4.4 3.4 na na na
Finland 8.5 8.7 8.6 2.6 2.7 4.7 3.4 3.6 2.8 na na na
France 13.6 14.1 13.3 5.4 6.0 7.0 1.7 1.8 1.9 0.2 0.2 0.0
Germany 12.4 11.9 9.7 5.5 5.9 5.0 6.2 6.3 5.9 0.4 0.4 0.4
Greece 25.3 26.1 22.5 18.8 22.3 21.3 1.6 1.8 2.1 2.2 2.5 1.9
Ireland 18.1 18.1 13.3 11.6 12.8 10.0 4.0 4.2 4.4 1.2 1.2 0.3
Italy 22.1 22.1 18.2 11.9 13.4 12.2 0.4 0.5 0.4 3.7 4.1 3.5
Luxembourg 29.4 29.4 27.6 13.5 14.4 12.6 4.5 4.7 5.6 3.2 3.5 2.1
Portugal 42.9 42.0 36.4 9.6 11.7 8.8 0.1 0.1 0.6 6.9 8.4 4.8
Spain 17.4 18.1 15.4 14.7 16.0 13.1 1.4 1.5 1.9 1.6 1.7 1.0
United Kingdom 6.8 7.4 7.0 4.7 5.5 7.5 2.4 2.6 3.0 0.1 0.1 0.0

22
TABLE 3. MULTIVARIATE DECOMPOSITION OF INEQUALITY
(proportion of aggregate inequality due to “between-group” disparities)
Index of inequality
Theil (T) Mean log deviation (N) Variance of logs (L)
Austria 28.3 27.4 24.6
Belgium 26.9 27.6 26.1
Denmark 14.1 16.0 17.4
Finland 16.6 16.6 17.4
France 27.0 27.2 28.6
Germany 22.9 22.3 19.7
Greece 46.7 49.3 47.4
Ireland 42.4 41.3 36.8
Italy 36.3 36.4 33.0
Luxembourg 48.6 48.6 46.7
Portugal 59.0 57.9 52.1
Spain 42.0 41.8 38.6
United Kingdom 15.6 17.0 18.8

23
TABLE 4. MULTIVARIATE DECOMPOSITION OF INEQUALITY
(proportion of hourly earnings inequality due to “between-group” disparities at each level of analysis – L)
Main effects Interactions Model
EDU AGE SEX SECT Covar. Total 2-way 3-way 4-way
Austria 7.6 4.2 3.7 0.2 5.7 21.4 - - - 21.4
Belgium 9.3 11.7 4.6 na -1.5 24.0 1.7 0.4 na 26.1
Denmark 8.0 4.3 3.7 na 0.6 16.6 0.6 0.2 na 17.4
Finland 7.6 3.6 4.0 na 0.5 15.7 1.2 0.5 na 17.4
France 15.7 9.0 2.4 0.0 -2.3 24.8 2.3 0.8 0.6 28.6
Germany 7.6 2.9 4.0 0.1 3.4 17.9 1.1 - - 19.1
Greece 18.8 18.0 2.4 0.2 4.9 44.2 2.4 0.6 0.1 47.4
Ireland 15.3 10.6 5.2 0.0 -1.0 30.0 4.9 1.4 0.4 36.8
Italy 15.5 9.4 1.4 0.4 3.6 30.3 2.2 - - 32.5
Luxembourg 22.8 9.9 4.4 1.1 5.0 43.3 1.5 - - 44.9
Portugal 34.8 7.6 3.9 0.5 2.0 48.8 2.9 0.4 0.0 52.1
Spain 17.8 13.7 3.3 0.0 -1.1 33.7 3.8 0.8 0.2 38.6
United Kingdom 5.7 7.3 2.1 0.0 1.4 16.6 1.7 0.5 0.1 19.0

24
TABLE 5. PEARSON CORRELATION COEFFICIENTS BETWEEN INEQUALITY IN HOURLY EARNINGS AND OTHER VARIABLES (13 COUNTRIES)
Gini Theil Mean log
deviation Variance of logs
Returns to Tertiary Education (TERT) 0.737 ** 0.758 ** 0.757 ** 0.727 ** Returns to Upper Secondary Education (SEC) 0.692 ** 0.703 ** 0.704 ** 0.677 * Employment Rate (EMPLRAT) 0.077 0.113 0.119 0.122 Female Labour Force Participation (FEM) -0.140 -0.042 -0.074 -0.111 Part time Employment (PART) -0.325 -0.306 -0.332 -0.351 Unemployment Rate (UN) 0.095 0.027 0.057 0.102 Long Term Unemployment (LUN) 0.112 0.036 0.065 0.104 Centralisation (8) (CENTR) -0.841 ** -0.856 ** -0.840 ** -0.806 ** Union Density (UNION) -0.504 -0.432 -0.453 -0.458 Collective Bargaining (10) (BARGAIN) -0.269 -0.391 -0.317 -0.218 Employment Protection (12) (PROTECT) -0.221 -0.141 -0.197 -0.270 Minimum to Median Wage (7) (MINMED) -0.299 -0.361 -0.321 -0.239 Tax Progressivity (single) (TAXPROG1) -0.791 ** -0.742 ** -0.755 ** -0.746 ** Tax Progressivity (married) (TAXPROG2) -0.830 ** -0.752 ** -0.788 ** -0.804 ** Average Income Tax (single) (AVTAX1) -0.709 ** -0.656 * -0.677 * -0.675 * Average Income Tax (married) (AVTAX2) -0.557 * -0.448 -0.502 -0.538 Growth Rate (GROWTH) -0.480 -0.548 -0.521 -0.480 Market Openness (OPEN) 0.102 0.031 0.080 0.132
**(*): Coefficient significant at the 1% (5%) level.
Figures in parentheses denote the number of countries for which the information is available
25
TABLE 6. PANEL ESTIMATES OF DETERMINANTS OF HOURLY EARNINGS INEQUALITY (ECHP 1994-2001; DEPENDENT VARIABLE: MEAN LOG DEVIATION)
Variable (1) (2) (3) (4) (5) (6) (7) (8)
TERT .0008 *** .0011 *** .0007 *** .0007 * SEC -.0005 -.0008 EMPLRAT .0013 -.0012 FEM -.0014 .0012 PART .0022 .0023 * .0019 * .0043 ** UN .0012 .0071 *** .0042 * .0019 LUN -.0023 -.0076 *** -.0018 -.0015 CENTR -.1831 ** UNION -.0001 .0001 BARGAIN .0003 PROTECT -.0107 TAXPROG -.0026 *** -.0013 ** -.0020 *** AVTAX -.0002 -.0011 GROWTH .0001 .0001 .0002 .0003 OPEN -.0001 .0002 -.0001 -.0004 ** Constant .0757 *** .0721 .1617 ** .1821 *** .1147 *** .0623 .0929 *** .0532 * N 99 99 59 99 99 99 99 99 Wald X2 11.21 3.45 19.21 19.23 0.89 317.80 39.12 F=1.72 Prob>X2 0.0037 0.6304 0.0007 0.0001 0.6401 0.0000 0.0000 0.127 Hausman X2 6.08 Prob>X2 0.4141
*/**/***: coefficient statistically significant at the 10%/5%/1% level.
Variables in italics: Only cross-sectional information available
Models (1)-(7): random effects; model (8): Fixed effects
26
Graph 1. Inter-termporal trends in hourly earnings inequality (Mean log deviation)
0,000
0,020
0,040
0,060
0,080
0,100
0,120
0,140
0,160
0,180
0,200
1970 1975 1980 1985 1990 1995 2000 2005
Year
FinlandFranceGermanyGreeceItalyNorwaySwedenUK

27
TABLE 7. INTER-TEMPORAL CHANGES IN HOURLY EANINGS INEQUALITY AND EMPLOYEE CHARACTERISTICS
IN EIGHT EUROPEAN COUNTRIES
Change in hourly earnings inequality according to (%) Change in the sample share of (%)
Country (period)
G T N L Tertiary
education graduates
Employees aged 45-64
Female employees
Employees in services
Finland (1984-1998) -1.3 -2.9 -2.0 -1.5 8.4 11.0 2.9 10.9
France (1990-2001) -1.3 -3.4 -1.2 -1.3 8.4 8.9 2.6 5.2
Germany (1984-2000) 8.8 18.2 12.5 6.9 10.1 0.0 4.9 11.0
Greece (1974-1999) 3.2 9.9 13.7 21.1 12.2 2.1 10.4 -7.1
Italy (1987-2000) 1.8 3.5 7.5 12.6 2.5 4.0 1.8 -5.0
Norway (1980-2000) 13.0 51.0 37.5 32.3 16.5 -8.5 7.3 12.8
Sweden (1974-2000) 1.7 6.9 3.8 -0.1 22.4 7.4 7.9 16.0
UK (1994-2003) 1.3 5.8 2.0 -0.3 22.4 7.4 7.9 16.0

28
TABLE 8. TREND DECOMPOSITION OF HOURLY EARNINGS INEQUALITY
(Index of inequality: Mean log deviation, N)
Change in hourly earnings inequality due to (%)
Country / Grouping criterion Changes in
inequality “within groups”
Change in population shares
Change in group mean earnings
Education group Finland 7.4 -9.0 -0.4 France 1.9 -3.4 0.5 Germany 34.3 -24.3 2.5 Greece 12.8 1.0 -0.1 Italy 6.4 2.3 -1.2 Norway 31.3 6.3 -0.1 Sweden -6.6 10.9 -0.4 UK 3.0 1.9 -2.9 Age group Finland -1.4 -0.7 0.1 France -3.8 2.7 -0.1 Germany 20.8 -9.4 1.2 Greece 12.4 1.0 0.2 Italy 12.2 -0.4 -4.3 Norway 40.0 -3.0 0.5 Sweden -2.3 6.0 0.1 UK 0.5 1.9 -0.4 Sex Finland -0.6 -0.2 -1.3 France -1.0 -0.2 0.0 Germany 13.2 0.0 -0.7 Greece 12.4 1.5 -0.2 Italy 7.4 0.2 0.0 Norway 41.1 -3.0 -0.6 Sweden 5.7 -1.4 -0.4 UK 2.7 -0.1 -0.6 Sector Finland -4.1 2.0 0.1 France -1.9 0.7 0.0 Germany 10.6 1.8 0.1 Greece 16.1 -2.5 0.1 Italy 8.8 -1.4 0.1 Norway 34.9 2.5 0.1 Sweden -1.8 5.4 0.2 UK 1.0 0.9 0.1

29
TABLE A1. WEEKLY HOURS WORKED PER QUINTILE OF THE HOURLY EARNINGS DISTRIBUTION
Quintile Country
1 2 3 4 5 All Ratio 5/1 Correlation
coefficient
Austria 37.7 38.3 38.6 38.4 39.8 38.6 1.06 0.047 *
Belgium 40.8 38.6 38.9 37.7 37.6 38.7 0.92 -0.055 **
Denmark 39.0 36.9 35.9 36.7 37.0 37.1 0.95 -0.052 *
Finland 38.9 38.6 38.7 38.7 37.0 38.4 0.95 -0.077 **
France 37.9 37.5 37.9 38.0 37.7 37.8 1.00 -0.028
Germany 41.1 40.0 38.9 39.4 40.5 40.0 0.98 0.009
Greece 42.9 42.0 40.2 40.2 34.7 40.0 0.81 -0.327 **
Ireland 36.9 36.8 39.2 37.8 35.6 37.3 0.96 -0.086 **
Italy 40.1 38.9 37.6 37.8 33.3 37.5 0.83 -0.295 **
Luxembourg 38.2 37.5 38.6 37.8 37.5 37.9 0.98 -0.080 **
Portugal 41.2 40.4 40.3 40.2 37.6 39.9 0.91 -0.209 **
Spain 43.4 40.6 39.3 38.9 38.2 40.1 0.88 -0.132 **
United Kingdom 39.3 39.5 40.0 40.4 40.8 40.0 1.04 0.033
*/** Coefficient significant at the 5%/1% level

30
TABLE A2. INEQUALITY IN THE DISTRIBUTION OF NET MONTHLY EARNINGS (ECHP, 7th wave)
Index of inequality Country
Gini (G) Theil (T) Mean log deviation (N) Variance of logarithms (L)
Austria 0.238 [9] 0.100 [9] 0.100 [9] 0.206 [9]
Belgium 0.235 [10] 0.099 [10] 0.095 [10] 0.189 [11]
Denmark 0.186 [13] 0.069 [13] 0.063 [13] 0.120 [13]
Finland 0.234 [11] 0.099 [11] 0.098 [11] 0.201 [10]
France 0.300 [3] 0.164 [3] 0.155 [2] 0.302 [2]
Germany 0.251 [8] 0.110 [8] 0.111 [8] 0.231 [6]
Greece 0.256 [7] 0.122 [7] 0.113 [7] 0.215 [8]
Ireland 0.281 [5] 0.133 [5] 0.137 [5] 0.289 [3]
Italy 0.209 [12] 0.087 [12] 0.082 [12] 0.160 [12]
Luxembourg 0.290 [4] 0.139 [4] 0.141 [4] 0.287 [4]
Portugal 0.303 [2] 0.168 [2] 0.152 [3] 0.280 [5]
Spain 0.264 [6] 0.122 [6] 0.117 [6] 0.227 [7]
United Kingdom 0.316 [1] 0.172 [1] 0.170 [1] 0.344 [1]
4th wave for the UK; 5th wave for France; Ranks in brackets

31
TABLE A3. ONE-WAY INEQUALITY DECOMPOSITION OF MONTHLY EARNINGS
(proportion of aggregate inequality due to “between-group” disparities)
EDUCATION (3 groups)
AGE (5 groups)
SEX (2 groups)
SECTOR (2 groups)
T N L T N L T N L T N L
Austria 10.8 10.7 8.6 6.9 6.7 4.5 17.5 18.1 20.4 1.4 1.4 1.8
Belgium 6.6 6.8 6.2 8.1 8.7 7.8 17.1 18.1 19.7 - - -
Denmark 7.0 7.7 8.1 3.1 3.7 5.0 11.9 13.2 12.2 - - -
Finland 11.0 11.0 9.1 5.6 6.0 6.9 7.4 7.5 6.5 - - -
France 13.0 13.2 13.0 5.5 6.1 6.1 6.8 7.3 7.4 0.0 0.0 0.1
Germany 15.0 14.2 11.2 4.0 4.2 3.0 16.9 17.2 17.9 1.1 1.1 1.6
Greece 13.5 14.2 12.4 18.0 20.9 19.4 6.4 7.2 6.5 0.4 0.5 0.6
Ireland 12.4 11.4 9.8 7.6 7.8 4.6 15.3 15.2 16.5 0.1 0.1 0.7
Italy 11.8 11.9 9.1 9.1 10.2 9.3 7.2 7.8 6.8 0.2 0.3 0.2
Luxembourg 27.6 26.8 25.8 13.1 13.3 9.6 11.3 11.7 13.7 1.6 1.6 0.7
Portugal 35.9 34.2 29.5 9.0 10.6 7.7 1.6 1.8 2.7 4.1 4.7 2.3
Spain 13.5 13.9 11.7 14.1 15.3 12.2 5.3 5.6 7.0 0.3 0.3 0.0
United Kingdom 10.0 10.2 10.0 5.0 5.4 4.9 11.6 11.9 14.9 0.3 0.3 1.0

32
TABLE A4. MULTIVARIATE DECOMPOSITION OF INEQUALITY
(proportion of aggregate inequality in monthly earnings due to “between-group” disparities)
Index of inequality
Theil (T) Mean log deviation (N) Variance of logs (L)
Austria 34.5 33.0 32.3
Belgium 36.1 37.3 38.1
Denmark 22.5 25.0 25.5
Finland 25.2 24.9 23.9
France 32.0 31.4 33.2
Germany 34.3 33.2 31.3
Greece 41.4 43.9 41.6
Ireland 45.3 43.1 42.8
Italy 32.5 32.5 29.1
Luxembourg 52.2 50.5 49.8
Portugal 54.1 52.3 46.9
Spain 41.7 42.2 39.9
United Kingdom 26.9 27.9 30.3

33
TABLE A5. MULTIVARIATE DECOMPOSITION OF INEQUALITY
(proportion of monthly earnings inequality due to “between-group” disparities at each level of analysis – L)
Main effects Interactions Model
EDU AGE SEX SECT Covar. Total 2-way 3-way 4-way
Austria 6.3 2.0 15.5 0.2 6.2 30.2 - - - 30.2
Belgium 11.0 6.4 20.4 - -1.9 35.9 1.9 0.3 - 38.1
Denmark 7.4 4.0 12.7 - 0.6 24.7 0.7 0.1 - 25.5
Finland 7.7 5.2 8.5 - 0.7 22.1 1.3 0.4 - 23.9
France 16.1 7.9 7.9 0.0 -2.3 29.6 2.3 0.8 0.5 33.2
Germany 9.1 1.2 13.5 0.1 5.3 29.2 1.5 - - 30.7
Greece 11.9 16.9 6.4 0.1 2.6 37.9 2.9 0.7 0.2 41.6
Ireland 13.3 5.1 16.1 0.4 -0.8 34.1 7.1 1.2 0.4 42.8
Italy 9.9 7.8 8.3 0.0 0.0 26.0 2.1 - - 28.2
Luxembourg 21.2 6.5 11.5 0.7 5.7 45.6 2.8 - - 48.4
Portugal 30.2 6.6 6.9 0.1 -0.4 43.4 2.9 0.4 0.1 46.9
Spain 15.8 12.2 8.1 0.1 -1.7 34.5 4.4 0.9 0.2 39.9
United Kingdom 7.1 4.2 11.2 0.1 4.4 27.0 2.7 0.5 0.2 30.3

TABLE A6. INTER-TEMPORAL CHANGES IN MONTHLY EANINGS INEQUALITY
IN SEVENEUROPEAN COUNTRIES
Change in monthly earnings inequality (%) Country (period)
G T N L
Finland (1984-1998) 9.6 18.9 22.0 25.0
France (1990-2001) 3.5 6.0 5.9 8.2
Germany (1984-2000) 11.2 25.2 19.7 15.5
Greece (1974-1999) 1.4 10.9 15.1 23.5
Italy (1987-2000) 7.3 11.1 17.2 23.1
Norway (1980-2000) 11.3 34.1 24.1 16.0
UK (1994-2003) 2.3 5.6 3.4 1.1

35
TABLE A7. TREND DECOMPOSITION OF MONTHLY EARNINGS INEQUALITY
(Index of inequality: Mean log deviation, N)
Change in hourly earnings inequality due to (%)
Country / Grouping criterion Changes in
inequality “within groups”
Change in population shares
Change in group mean earnings
Education group Finland 15.6 6.4 0.0 France 5.2 0.6 0.0 Germany 32.6 -13.2 0.3 Greece 15.0 0.2 0.0 Italy 9.3 7.7 0.2 Norway 19.5 4.6 0.1 UK 4.0 -0.5 0.0 Age group
Finland 22.2 -0.2 0.0 France 5.7 0.2 0.0 Germany 18.7 1.1 -0.1 Greece 14.7 0.5 -0.1 Italy 17.7 -0.6 0.1 Norway 24.6 -0.2 -0.2 UK 3.2 0.2 -0.1 Sex
Finland 22.4 -0.5 0.1 France 4.2 1.7 0.0 Germany 23.5 -3.9 0.1 Greece 15.1 0.0 0.1 Italy 15.5 1.1 0.5 Norway 23.9 0.1 0.1 UK 0.4 3.0 0.0 Sector
Finland 18.8 3.1 0.1 France 5.1 0.8 0.0 Germany 16.3 3.4 0.0 Greece 16.0 -0.9 0.0 Italy 16.5 0.5 0.2 Norway 18.2 5.9 0.0 UK 1.1 2.3 0.0