EARLY TRANSFERS FROM AFDC TO W-2: THE EXPERIENCES OF 100 DANE COUNTY FAMILIES
39
EARLY TRANSFERS FROM AFDC TO W-2: THE EXPERIENCES OF 100 DANE COUNTY FAMILIES Irving Piliavin Mark Courtney Amy Dworsky Institute for Research on Poverty University of Wisconsin–Madison March 2000 This research was supported by a grant from the Assistant Secretary for Planning and Evaluation, United States Department of Health and Human Services, and the Graduate School of the University of Wisconsin–Madison. We would like to acknowledge the members of the W-2 Management and Evaluation Planning (MEP) Board from whom we received valuable feedback on an earlier version of this report.
-
Upload
independent -
Category
Documents
-
view
2 -
download
0
Transcript of EARLY TRANSFERS FROM AFDC TO W-2: THE EXPERIENCES OF 100 DANE COUNTY FAMILIES

EARLY TRANSFERS FROM AFDC TO W-2:THE EXPERIENCES OF 100 DANE COUNTY FAMILIES
Irving PiliavinMark CourtneyAmy Dworsky
Institute for Research on PovertyUniversity of Wisconsin–Madison
March 2000
This research was supported by a grant from the Assistant Secretary for Planning and Evaluation, UnitedStates Department of Health and Human Services, and the Graduate School of the University ofWisconsin–Madison.
We would like to acknowledge the members of the W-2 Management and Evaluation Planning (MEP)Board from whom we received valuable feedback on an earlier version of this report.

1Family heads were required to attend a W-2 orientation.
EARLY TRANSFERS FROM AFDC to W-2:THE EXPERIENCES OF 100 DANE COUNTY FAMILIES
INTRODUCTION
Between the late 1980s and the mid-1990s, Wisconsin implemented a total of nine waiver-based
welfare demonstration programs, each of which had family economic self-sufficiency as a major goal.
More generous and service-oriented in some respects than the traditional Aid to Families with Dependent
Children (AFDC) program, these waiver-based welfare programs emphasized rapid movement of public
assistance recipients into the paid labor force rather than human capital development through education
or training. The programs were more demanding in terms of their work and other requirements, and
participants who failed to comply faced consequences that were more severe than under AFDC.
On September 1, 1997, Wisconsin began implementing Wisconsin Works (W-2), a
comprehensive welfare reform program. Eligible families on the state’s AFDC caseload at that time
could have their cases transferred to the W-2 caseload if they completed the necessary conversion
process.1 Families applying for assistance on or after that date were added to the W-2 caseload if they
were eligible for the program. Implementation of W-2 was facilitated by the Personal Responsibility and
Work Opportunity Reconciliation Act (P.L. 104-193), the 1996 federal legislation that replaced AFDC
with Temporary Assistance for Needy Families (TANF). Unlike AFDC, W-2 is a nonentitlement, work-
based program that has features of the earlier waiver-based welfare demonstrations as well as new
components. Eligible participants work with a Financial and Employment Planner (FEP) who assigns
them to one of four W-2 employment ladder tiers based on an assessment of their employment and
training needs.
1. Case Management Only (unsubsidized employment): For W-2 participants who either
(a) already have a job when they enter the program, (b) have previous work experience, or (c) move up

2
2A description of the W-2 tiers can be found in the Wisconsin Department of Workforce Development’s1997 publication Building a Better Safety Net. For an overview of the W-2 program, see also Kaplan (1998).
from a lower tier upon becoming employed. In addition to case management services, participants
assigned to this tier may also be eligible for food stamps, Medicaid, child care assistance, the Earned
Income Tax Credit, and job access loans.
2. Trial Jobs (subsidized employment): For W-2 participants who have basic job-readiness skills,
but are lacking in work experience. The W-2 agency contracts with employers to hire participants for
jobs that pay at least the minimum wage and to provide participants with supports during a 3–6-month
trial period. Employers receive a subsidy to help defray their training and other costs with the expectation
that the jobs will become permanent positions when the trial period has ended. Trial job participants may
also be eligible for food stamps, Medicaid, child care assistance, the Earned Income Tax Credit, and job
access loans.
3. Community Service Jobs (CSJ): For W-2 participants who need to develop job readiness skills
and appropriate workplace behaviors. CSJ participants can be assigned to work activities for up to 30
hours per week and to education or training activities for up to 10 hours per week, and are eligible to
receive a maximum monthly grant of $673. They may also be eligible for food stamps, Medicaid, child
care assistance, and job access loans.
4. W-2 Transition (W-2 T): For W-2 participants who face significant barriers to employment.
For example, they may have a disability or other problem that limits their capacity to work, or be needed
at home to care for an ill or disabled family member.
W-2 T participants can be assigned to counseling, rehabilitation, or other treatment activities for
up to 28 hours per week and to education or training activities for up to 12 hours per week, and are
eligible to receive a maximum monthly grant of $628. They may also be eligible for food stamps,
Medicaid, child care assistance, and job access loans.2

3
3The 1997 figure includes not only regular AFDC cases, but also NLRR (non-legally responsible relative)and SSI “child-only” cases that were not eligible for conversion to W-2. Recent estimates suggest that there werebetween 10,000 and 11,000 of these child-only cases in September 1997 (Phillip Klein, Department of WorkforceDevelopment, March 10, 2000, personal communication). The NLRR cases were converted to W-2 Kinship Carecases and SSI cases were converted to Caretaker Supplement cases. Wisconsin had already experienced a significantreduction in its AFDC caseloads prior to the implementation of W-2. Between January 1993, when 81,291 familiesreceived AFDC, and January 1997, Wisconsin caseloads declined 44 percent (U.S. Dept. of Health and HumanServices, 2000a).
The families of participants in the two lower tiers are eligible for monthly cash payments if they
comply with program requirements, which may include mandatory job search, training, or other work-
related activities. The amount of cash paid to W-2 families is based entirely on the number of hours
family heads participate in program activities and the W-2 tier to which participants are assigned; in
contrast to AFDC, the maximum cash payment that families can receive under W-2 does not vary by
family size. Families, including those not eligible for monthly cash payments, may be eligible for other
benefits or services such as child care assistance, job access loans, or case management.
Wisconsin has experienced a dramatic reduction in its public assistance caseloads since W-2 was
implemented. According to the Department of Workforce Development, the W-2 caseload was 11,452
families in June 1999, of which 7,924 were receiving cash assistance. In January 1997, the state’s AFDC
caseload had been 45,586. This represents a caseload reduction of 75 percent.3 Most other states have
experienced similar, although less marked, declines in their caseloads over the past few years (U.S. Dept.
of Health and Human Services, 2000a), raising questions about what has happened to those families that
did not make the transition, for whatever reason, from AFDC to the new state TANF programs. The
federal government, several state governments, and private foundations have funded a number of so-
called “leavers” studies to find out how such families have fared without TANF assistance.
The study to be discussed in this report has a somewhat different focus. As originally designed,
the study would have examined the experiences of 250 families from Dane County, Wisconsin, over a
one-year period. Half of the sample was to be drawn at random from the September 1997 caseload of

4
4Both the NLRR (non-legally-responsible relative) and SSI child-only cases would have been excluded fromthe sample.
5While the latter families would not have been on AFDC just prior to implementation of W-2, they mayhave been on AFDC at some point in the past.
6The University of Wisconsin Survey Center conducted the Wave 1 interviews. Although the majority weredone by phone, some were done in person.
7The Wave 2 interviews were conducted by doctoral students in the social welfare program at the Universityof Wisconsin–Madison.
AFDC families that were identified by the county as potentially eligible for conversion to W-2.4 The
other half of the sample was to be drawn from families newly applying for W-2 assistance at the Dane
County Job Center beginning in February 1998 and continuing until the full quota of new applicant
families had been reached.5 This sampling strategy was chosen to allow us to examine whether W-2
participants who had transferred from AFDC differed from new applicants to the program, and, if so,
how those differences might affect their experiences under W-2.
Sample members were interviewed twice. The Wave 1 interview was brief, lasting no more than
15 minutes, and respondents were paid $10 for their participation. The data collected included basic
demographic information (e.g., marital status, education, number and ages of resident and nonresident
children, etc.), current government program participation (e.g., receipt of food stamps, Medicaid, SSI,
etc.), and prior receipt of AFDC. Respondents were also asked to provide contact information that could
be used to locate them for the follow-up interview in the event that they moved between Waves 1 and 2.6
The Wave 2 interview, completed 12 to 15 months after the Wave 1 interview, was in greater depth,
lasting approximately one hour, and respondents were paid $25 for their participation.7 The questions
asked at Wave 2 focused on respondents’ experiences since Wave 1. The topics covered included
employment history, earnings, and other income; housing and residential mobility; government program
participation; parenting and child care utilization; parental health and well-being; and child health and
well-being. When relevant, sample members were asked about their experiences with the program (e.g.,

5
8Copies of both the Wave 1 and Wave 2 instruments are available from the authors upon request.
9We were unable to interview 63 of the Wave 1 respondents from our AFDC caseload sample. Most of oursample attrition was due to an inability to locate respondents, despite repeated attempts, using the telephone numbersand address information that we had from Wave 1 or the updated telephone numbers and address information wewere given by Dane County. Few of the respondents that we did locate refused to be interviewed.
10Swartz et al. (1999) selected a random sample of 400 Milwaukee families from the August 1997 AFDCcaseload. Interviews were completed with 296 (or 74 percent) of the sampled families.
tier assignments, benefits and services received, barriers encountered, etc.), their reasons for leaving the
program, and their postprogram experiences.8
During the course of Wave 1 data collection, it became apparent that the rate of new applications
to W-2 was much lower than anticipated, and that the limited budget and time constraints of the project
would preclude us from obtaining a sample of new applicant families sufficient in number to permit
meaningful analyses. We have therefore restricted our analysis to the sample of families on the AFDC
caseload in September 1997 that were potentially eligible for conversion to W-2. Initial interviews were
completed with 163 of these families between November 1997 and June 1998. One hundred of these
families (61 percent) were interviewed a second time between February 1999 and June 1999.9 Because
little demographic information was collected during the initial interview, we are unable to determine the
comparability of the two samples other than to note that they were quite similar with respect to marital
status and race/ethnicity. Clearly, this substantial attrition rate raises the possibility that our follow-up
sample is biased, an issue we address in the concluding section of this report.
SELECTED ATTRIBUTES OF RESPONDENTS AT WAVE 2
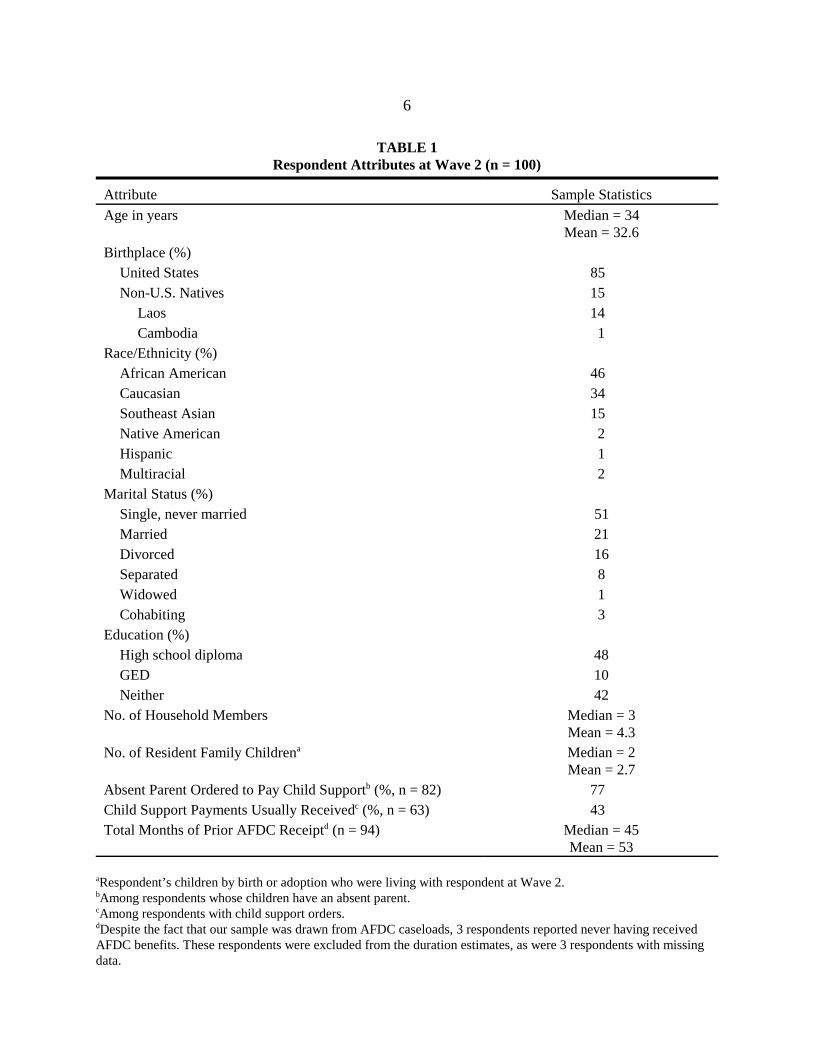
Table 1 presents data on selected attributes of respondents at Wave 2. Although our study was
limited to families in Dane County, the demographic characteristics of our sample were comparable in a
number of respects to the results of a recent study of Milwaukee families reported by Mathematica Policy
Research and the Hudson Institute (Swartz et al., 1999).10 Several features of our sample are interesting
6
TABLE 1Respondent Attributes at Wave 2 (n = 100)
Attribute Sample Statistics
Age in years Median = 34Mean = 32.6
Birthplace (%)United States 85Non-U.S. Natives 15
Laos 14Cambodia 1
Race/Ethnicity (%)African American 46Caucasian 34Southeast Asian 15Native American 2Hispanic 1Multiracial 2
Marital Status (%)Single, never married 51Married 21Divorced 16Separated 8Widowed 1Cohabiting 3
Education (%)High school diploma 48GED 10Neither 42
No. of Household Members Median = 3Mean = 4.3
No. of Resident Family Childrena Median = 2Mean = 2.7
Absent Parent Ordered to Pay Child Supportb (%, n = 82) 77Child Support Payments Usually Receivedc (%, n = 63) 43Total Months of Prior AFDC Receiptd (n = 94) Median = 45
Mean = 53
aRespondent’s children by birth or adoption who were living with respondent at Wave 2.bAmong respondents whose children have an absent parent.cAmong respondents with child support orders.dDespite the fact that our sample was drawn from AFDC caseloads, 3 respondents reported never having receivedAFDC benefits. These respondents were excluded from the duration estimates, as were 3 respondents with missingdata.

7
11Three current participants and 1 former participant had not completed the conversion from AFDC to W-2,but rather, had applied for W-2 assistance at a later date. We retain them in our analysis because they had beenincluded in the sample of potentially eligible families drawn from the September 1997 AFDC caseload.
12As we discuss below in more detail, we identified a small number of respondents whose answers to oursurvey questions about their participation in W-2 were not internally consistent. This inevitably raises questionsabout the reliability of our survey data, at least with respect to respondents’ W-2 participation. Although werecognize that this limits the conclusions we can draw from the results reported here, we emphasize that the DaneCounty study was intended as a pilot study for the much larger research project in which we are currently following1,200 W-2 applicant families in Milwaukee. We have access to the state’s administrative data for our Milwaukeesample.
to note, however. First, 15 percent of the respondents in our sample were born in Southeast Asia,
primarily Laos, which is reflected in the significant number of respondents who identified themselves as
Hmong. Second, less than half of our sample had graduated from high school, and 42 percent had neither
a high school diploma nor a GED. Low educational attainment was a particular problem among
Southeast Asian respondents, a majority of whom reported having no formal education whatsoever
(results not shown). Third, on average, respondents had received AFDC benefits for a total of almost 4.5
years before W-2 was implemented. Finally, although 77 percent of respondents reported that an absent
parent was court-ordered to pay them child support, only 43 percent of those respondents with child
support orders were receiving regular child support payments from the absent parent.
Following Swartz et al. (1999), we divided our sample into three mutually exclusive groups
based on respondents’ self-reported W-2 participation status at Wave 2: those who reported that they
were still participating in W-2 (43 percent), those who reported that they had participated in W-2 but
were no longer participating (42 percent), and those who reported that they had never participated (15
percent).11 Unfortunately, because of funding constraints, we were unable to compare respondents’
answers to questions about their participation in W-2 to the state’s CARES administrative data in any
systematic way.12

8
13Because our survey questions were not explicit as to what did and did not constitute “W-2 participation,”we do not know what respondents meant when they described themselves as participating or not participating inW-2. Of particular concern is whether respondents might have indicated that they were W-2 participants when in factthey were not, particularly given that nonparticipants may be eligible for many of the same benefits (e.g., foodstamps, Medicaid, and/or child care assistance) as participants. Conversely, respondents might have indicated thatthey were not W-2 participants when in fact they were, especially if they were not receiving cash payments from theagency. This ambiguity might account for some of the inconsistencies in our data that we discuss below. W-2participation is more explicitly defined in the instrument we are using in the second wave of our Milwaukee study.
14This might reflect the fact that cooperation with child support enforcement is required of all W-2participants.
15Data presented below suggest that at least some of the respondents who were still participating in theprogram may have been confused about their current tier assignment.
Table 2 presents data on respondents’ attributes separately for these three groups.13 With but one
exception, the three groups were quite similar in terms of the attributes for which we have data. The one
exception to this trend was that both current and former participants were more likely than those who
never participated in the program to report that an absent parent was ordered to pay child support.14
However, among those respondents who had a child support order in place, there was little variation
across the three groups in the likelihood of receiving child support payments. Finally, we note that when
self-reported nonparticipants were asked why they had chosen not to enroll in W-2, their reasons were as
follows: employment (n = 9), receipt of SSI (n = 3), the need to care for an ill spouse (n = 2), and
program “hassles” (n = 1).
SELF-REPORTED W-2 PARTICIPATION AND TIER ASSIGNMENTS
Table 3 shows the current W-2 tier assignment as reported by respondents who were still
participating in the program at Wave 2.15 Although the majority (72 percent) of current participants
reported that they were assigned to the Case Management tier at the time of their second interview, a
significant minority (19 percent) reported that they were assigned to the W-2 Transitions (W-2T) tier.
Only a few respondents reported that their current assignment was either the Community Service Job
(CSJ) or Trial Job tiers.

9
TABLE 2Respondent Attributes by Self-Reported W-2 Participation Status at Wave 2
Demographic Information
Self-Reported W-2 Participation Status
NeverParticipant(n = 15)
CurrentParticipant(n = 43)
FormerParticipant(n = 42)
Age in years Median = 30Mean = 31.2
Median = 36Mean= 35.9
Median = 32Mean = 30.4
Race/Ethnicity (%)
Caucasian (n = 34) 15 47 38
African American (n = 46) 22 33 46
Southeast Asian (n = 15) 0 60 40
Other (n = 5) 0 40 60
Marital Status (%)
Married (n = 21) 5 48 48
Divorced (n = 16) 13 50 37
Never married (n = 51) 20 37 43
Other (n = 12) 17 50 33
Educational Attainment (%)
H.S. Diploma (n = 48) 19 40 42
GED (n = 10) 10 30 60
Neither (n = 42) 12 50 38
No. of Household Members Median = 3Mean = 3.5
Median = 4Mean = 4.5
Median = 3.5Mean = 4.2
No. of Resident Family Childrena Median = 1Mean = 1.8
Median = 2Mean = 3.0
Median = 2Mean = 2.6
Absent Parent Ordered to Pay Child Supportb
(%, n = 82) 54 82 81
Child Support Payments Usually Receivedc
(%, n = 63) 43 52 38
Total No. of Months of Prior AFDC Receiptd
(n = 94)Median = 39Mean = 55
Median = 48Mean = 59
Median = 24Mean = 45
aRespondent’s children by birth or adoption who were living with respondent at Wave 2.bAmong respondents whose children have an absent parent.cAmong respondents with child support orders.dExcludes 3 respondents who reported never having received AFDC benefits and 3 respondents withmissing data.

10
TABLE 3Self-Reported Tier Assignments of Current W-2 Participants at Wave 2
Current Tier Assignment
Current Participants
No. %
W-2 Transition 8 18.6
Community Service Job 3 7.0
Trial Job 1 2.3
Case Management Only 31 72.1
Total 43 100

11
16Unfortunately, because of the way the questions were asked, our data do not allow us to determine thenumber of respondents ever assigned to the Case Management tier and whether or not they were still participating inthe program at Wave 2.
17Respondents were not asked directly whether they were currently assigned to the Case Management tier.Rather, we inferred that respondents were currently assigned to the Case Management tier if they reported that theywere not currently assigned to one of the lower tiers but that they were currently participating in W-2.
18The one group for whom this policy makes an exception are mothers of newborn infants who are assignedto the Case Management tier for the first 12 weeks following the birth of a their child. During this period of time,they receive a monthly cash payment but are not expected to participate in work-related activities.
Whereas Table 3 provides a snapshot of current participants’ self-reported tier assignments at
Wave 2, Table 4 shows the self-reported tier assignments of both current and former participants since
their participation in W-2 began. These data seem to indicate that at least some participants had made
progress toward increasing self-sufficiency, in that more than half of those currently assigned to the Case
Management tier had previously been assigned to one of the lower tiers (i.e., W-2T, CSJ, or Trial Job).
There is also evidence that respondents who were ever assigned to the W-2T tier were less likely to have
left the program by Wave 2 than respondents who were either ever assigned to the CSJ tier, ever assigned
to the Trial Job tier, or never assigned to any of the lower tiers (45 percent).16
We have no reason to believe that respondents intentionally misled us about either their current
or previous tier assignments, but there was, as noted above, some evidence that respondents may have
been confused about the tiers to which they had been assigned and/or the benefits they had received.
Specifically, 17 of the 31 W-2 participants whose responses indicated that they were currently assigned
to the Case Management tier reported that they had never been assigned to any of the lower tiers.17 Yet 6
of these 17 respondents also reported that they had received monthly cash payments at some point in
time, despite the fact that participants assigned to the Case Management tier are generally not eligible for
monthly cash payments.18 A similar inconsistency appears with respect to the former participants. That is,
10 of the 21 former participants who indicated that they had never been assigned to one of the lower tiers
reported that they had received monthly cash payments at one time or another while they were

12
TABLE 4Self-Reported Tier Experience among Current and Former W-2 Participantsa
Program Experience
Self-Reported W-2 Participation Status at Wave 2
Current W-2 ParticipantsSelf-Reported Tier Assignment at Wave 2
Former W-2Participants
All W-2ParticipantsW-2T CSJ
TrialJob
CaseManagement
Only
Ever Assigned to W–2T 8 1 0 3 4 16
Ever Assigned to CSJ 4 3 0 10 16 32
Ever Assigned to TrialJob 0 1 1 5 4 11
Never Assigned to W-2T, CSJ, or Trial Job 0 0 0 17 21 38
Total 8 3 1 31 42 85
aNumbers do not sum to column totals because some respondents had been assigned to several tiers.

13
19Although we thought that “monthly cash payment” was self-explanatory, it is possible that somerespondents did not understand what we meant by this term.
20It is conceivable that some of these respondents had been assigned to one of the two lower tiers but did notreceive any cash assistance because of sanctions for nonparticipation.
21However, the questions about tier assignments did include a description of each tier.
participating in W-2.19 Finally, a small number of both current and former participants claimed never to
have received monthly cash payments despite having been assigned to either the W-2T or CSJ tiers.20
These inconsistencies are illustrated in Table 5.
A number of possible explanations might account for these inconsistencies. One is that
respondents may not have been familiar with the terminology that we used to refer to the different tiers,
and hence, did not reliably report their W-2T or CSJ assignments.21 Alternatively, it may be that
respondents had confused either job access loans or in-kind benefits, such as food stamps and child care
assistance, with monthly cash payments. Still another possibility is that respondents did receive monthly
cash payments for the first three months following the birth of a child. Finally, it always possible that our
interviewers had recorded respondents’ answers incorrectly. Unfortunately, we cannot reconcile these
inconsistencies in respondents’ reports based on the data that we have.
SELF-REPORTED W-2 ACTIVITIES, BENEFITS, AND SERVICES
Table 6 shows the percentage of respondents who participated in various W-2 activities. The
activities most commonly reported by current participants were organized job search, job readiness
training, and life skills training; the activities most commonly reported by former participants were
organized job search, vocational training, and job readiness training. These data are noteworthy in two
respects.
First, participation in educational activities among current participants without a high school
diploma or GED was fairly high. Although nearly half of all current participants (49 percent) had neither

14
TABLE 5Self-Reported Receipt of Monthly Cash Payments, by Self-Reported W-2 Tier Experience
among Current and Former Participantsa
Tier ExperienceReporting CashPayments (%)
Reporting No CashPayments (%) Do Not Know (%)
Current Participants
Ever in W-2T (n = 12) 91.7 8.3 0.0
Ever in CSJ (n = 16) 81.3 18.8 0.0
Never in W-2T or CSJ (n = 17) 35.3 64.7 0.0
Former Participants
Ever in W-2T (n = 4) 100.0 0.0 0.0
Ever in CSJ (n = 16) 75.0 25.0 0.0
Never in W-2T or CSJ (n = 21) 47.6 47.6 4.8
All Participants
Ever in W-2T (n = 16) 93.8 6.2 0.0
Ever in CSJ (n = 32) 78.1 21.9 0.0
Never in W-2T or CSJ (n = 38) 42.1 55.3 2.6
aThe inconsistent cells appear in bold type.

15
TABLE 6Self-Reported Participation in W-2 Activities, by Self-Reported W-2 Participation Status
W-2 ActivitiesCurrent Participants
(%, n = 43)Former Participants
(%, n = 42)All Participants
(%, n = 85)
Organized Job Search 51.2 64.3 57.6
GED Program 14.0 4.8 9.4
ESL Program 18.6 2.4 10.6
Vocational Training 18.6 26.2 22.4
Job Readiness Training1 41.9 21.4 31.8
Life Skills Training2 30.2 11.9 21.2
Mental Health Counseling 4.7 2.4 3.5
Alcohol or Drug Treatment 0.0 2.4 1.2
aJob readiness training was defined as training in how to interact with coworkers and supervisors,learning how to dress for work, learning what will be expected of you from employers, etc.bLife skills training was defined as training in daily living skills such as budgeting your money, managinga checking account, learning how to use public transportation, etc.

16
22It is possible that respondents were receiving mental health counseling from some other source throughMedicaid.
23Although “help finding a job” was not explicitly defined, we did ask respondents about various job searchactivities in which they might have engaged. These data are available from the authors upon request.
24Data about their previous employment history had been collected at Wave 1.
a high school diploma nor a GED, two-thirds of them (a third of current participants) reported that their
W-2 activities included participation in either a GED or ESL program. In contrast, participation in
educational activities among former participants without a high school diploma or GED was less
common. Although more than a third of all former participants (38 percent) had neither a high school
diploma nor a GED, only 18 percent (7 percent of former participants) reported that they had participated
in either a GED or ESL program as one of their W-2 activities. Second, although we found evidence that
many respondents may have suffered from a mental health problem (see Table 17), very few reported that
they had received any type of mental health counseling through the W-2 program.22
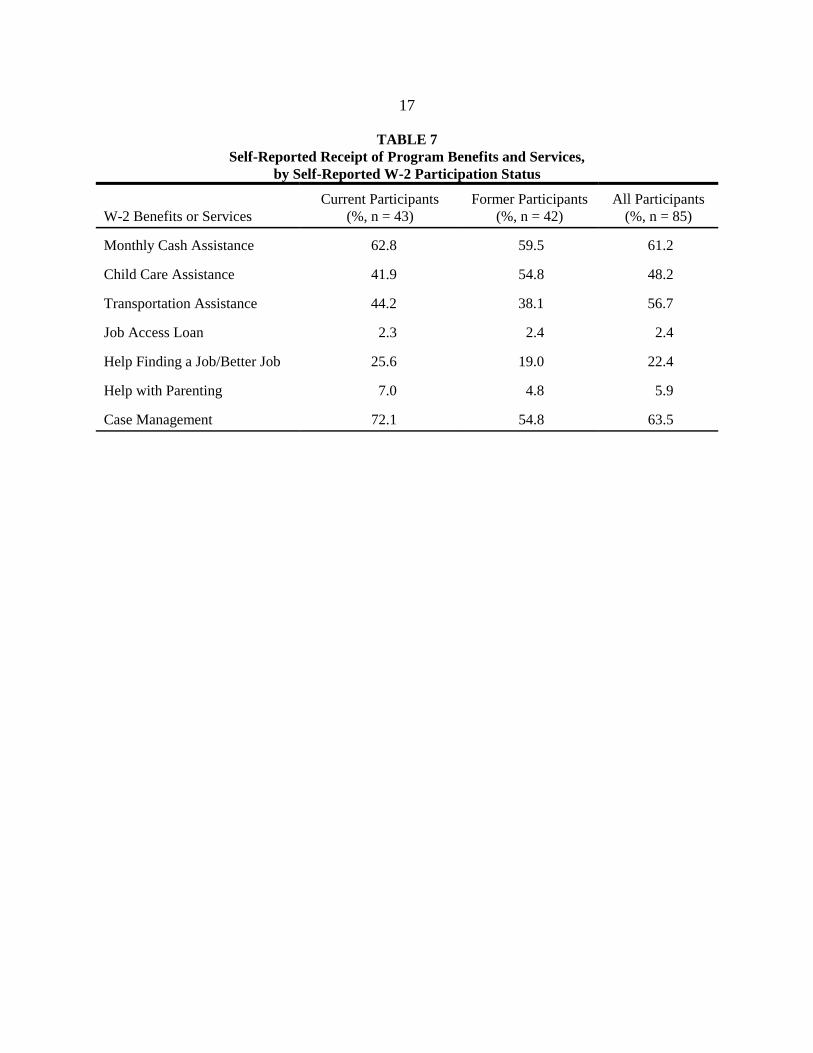
Table 7 shows the percentage of respondents who received various W-2 benefits and services.
Significant numbers of both current and former participants reported that they had received monthly cash
assistance, child care assistance, transportation assistance, and case management. Despite W-2’s
emphasis on employment, only 26 percent of current participants and 19 percent of former participants
reported that they had received help finding a job or, if they were employed, finding a better job.23
EMPLOYMENT AND NONEMPLOYMENT
Employment
At the Wave 2 interview, respondents were asked a number of questions about their current
employment status as well as their employment history over the preceding 12 months.24 In this section we
compare the current employment status and employment history of the three groups identified in Table 2:
respondents who were still participating in W-2 at Wave 2 (n = 43), respondents who had participated in
17
TABLE 7Self-Reported Receipt of Program Benefits and Services,
by Self-Reported W-2 Participation Status
W-2 Benefits or ServicesCurrent Participants
(%, n = 43)Former Participants
(%, n = 42)All Participants
(%, n = 85)
Monthly Cash Assistance 62.8 59.5 61.2
Child Care Assistance 41.9 54.8 48.2
Transportation Assistance 44.2 38.1 56.7
Job Access Loan 2.3 2.4 2.4
Help Finding a Job/Better Job 25.6 19.0 22.4
Help with Parenting 7.0 4.8 5.9
Case Management 72.1 54.8 63.5

18
25Respondents were not counted as employed if they were placed in a community service job, but werecounted as being employed if they were placed in a trial job.
26In fact, 7 of the 15 respondents who reported that they were not employed and not assigned to either theW-2T or CSJ tiers had been assigned to either the W-2T or CSJ tier at some point during their W-2 participation.
W-2 but were no longer participating at Wave 2 (n = 42), and respondents who never participated in W-2
(n = 15). Our findings are summarized in Tables 8 and 9.
Table 8 presents data on respondents who were employed at Wave 2, including hourly wages,
hours worked per week, and days worked at current job. Overall, 54 percent of the respondents in our
sample were employed at the time of their second interview, including approximately two-thirds of both
former participants and those who never participated. The comparatively lower level of employment
among current W-2 participants (39 percent) is due, in part, to the fact that more than a quarter of current
participants were assigned to either the W-2T or CSJ tiers, and hence not “job ready.”25 Moreover,
although only 52 percent of participants currently assigned to the Case Management Tier reported that
they were employed at Wave 2, some of these participants, as already noted, may actually have been
assigned to either the W-2T or CSJ tiers.26
Although there was little difference among the three groups in terms of the number of hours
worked per week, they did differ with respect to their hourly wages and job duration. Former participants
who were employed at Wave 2 reported that they were being paid higher wages and had held their jobs
for a longer period of time than employed respondents who were still participating or who had never
participated in the program. As a result, former participants tended to have the highest estimated monthly
earnings. Whether this finding reflects the effect of services that former participants had received,
preexisting differences between the groups, or some other factor cannot be determined from the data.
Nonemployment
Table 9 presents data on prior year’s work experience and current job search efforts among the
46 respondents in our sample who were not employed at Wave 2. Of these respondents, 43 percent

19
TABLE 8Current Employment and Earnings, by Self-Reported W-2 Participation Status
Employment Measures
NeverParticipants
(n = 15)
CurrentParticipants
(n = 43)
FormerParticipants
(n = 42)
Full Sample
(n = 100)
Currently Employed 66.7% 39.5% 64.3% 54%
Hourly Wagesa Median=$7.55Mean=$8.01
Median=$7.61Mean=$7.85
Median=$8.89Mean=$8.58
Median=$8.13Mean=$8.24
Hours Worked Per Week Median=38Mean= 34.5
Median=40Mean=36.2
Median=40Mean=34.2
Median=40Mean=34.9
Days Worked at Current Job Median=267Mean=299
Median=204Mean=377
Median=364Mean=371
Median=325Mean=360
Estimated Monthly Earningsb Median=$1219Mean = $1203
Median=$1279Mean = $1223
Median=$1313Mean = $1341
Median=$1279Mean = $1277
aAlthough the overwhelming majority of respondents reported their hourly wage rate, hourly wages were computedfor a few respondents, based on either their weekly or monthly earnings and their hours worked per week.bAssumes that respondents were employed for the entire month. Because some respondents had only recently begunworking at their current job, their earnings for that month would have been lower than these figures suggest.
TABLE 9Prior Year’s Employment and Current Job Search among Nonemployed Respondents,
by Self-Reported W-2 Participation Status
NeverParticipants(%, n = 5)
CurrentParticipants(%, n = 26)
FormerParticipants(%, n = 15)
All NonemployedRespondents(%, n = 46)
Ever Employed Past Year 40.0 30.8 66.7 43.5
Currently Searching for a Job 20.0 19.2 53.3 30.4

20
27Respondents often gave more than one reason.
28As noted above, it is also possible that 9 respondents who indicated that they were not in either the W-2Tor CSJ tier had misidentified their current W-2 assignment. This is supported by the fact that all 9 of theserespondents said that they had received or were receiving monthly cash payments from the W-2 program. These dataare ambiguous, however, in that we do not know whether these respondents had only received monthly cash paymentin the past or whether they were still receiving them.
(n = 20) reported that they had held a job at some point during the year prior to their second interview,
which means that 74 percent of our sample were either currently employed at Wave 2 or had been
employed within the past 12 months. In addition, 30 percent (n = 14) of the nonemployed respondents in
our sample reported that they were currently looking for work. Former W-2 participants were more likely
to report that they had had some work experience within the past 12 months and that they were currently
searching for a job at Wave 2 than were respondents in either of the other two groups. Regardless of
respondents’ W-2 participation status, the most common reasons cited for not being employed were their
own or another family member’s disability (n = 23), lack of education or job skills (n = 10), and child
care problems (n = 9).27
We have some data that suggest how the families of the 46 nonemployed respondents were
“getting by.” Among the 26 nonemployed respondents who were participating in the program at the time
of their second interview, 11 were assigned to either the W-2T or CSJ tier, and hence were receiving
monthly cash payments from the W-2 agency.28 Of the remaining 15 respondents, 7 reported (1) that they
were receiving or had family members who were receiving SSI and/or Social Security benefits and/or (2)
that they were living with another family member who had been employed the previous month. Assuming
that these other family members were still employed, 8 of the current W-2 participants were in a very
precarious economic situation; 1 reported no source of stable income, and 7 reported income only from
food stamps.
Among the 20 nonemployed respondents who were not participating in W-2 at the time of their
second interview, 16 reported (1) that they were receiving or had family members who were receiving

21
29Food Stamp eligibility is based on household, not family, income.
SSI and/or Social Security benefits; (2) that they were living with another family member who had been
employed the previous month; and/or (3) that they had been without a job for one month or less.
Assuming that those respondents who had recently been employed would soon be able to find a new job
and that the family members who were employed the previous month were still working, 4 of these 20
respondents also seemed to be in a very precarious economic situation; 3 reported no source of stable
income, and 1 reported income only from food stamps.
GOVERNMENT PROGRAM PARTICIPATION AND FAMILY INCOME
Table 10 shows the percentage of respondents who received benefits from various government
programs during the month prior to the Wave 2 interview (Panel A) and in any month during the
preceding year (Panel B). Only two-thirds of respondents who were not participating in W-2 at the time
of their second interview had ever received food stamps during the past 12 months. This is particularly
puzzling given the high frequency of Medicaid receipt and the relatively low wages which employed
respondents were paid. Even more anomalous is the fact that nearly a quarter of current W-2 participants
reported that they had not received food stamps in the month before they were interviewed. We did not
ask respondents why they were not receiving or had not received food stamps, but several plausible
explanations come to mind. Respondents may have been ineligible for food stamps because of the income
of other household members.29 Employed respondents may have decided that it was no longer worth it for
them to participate in the Food Stamp program, given the effect of marginal tax rates on the amount of
food stamps they could expect to receive, or that the procedural barriers to program participation were

22
TABLE 10Receipt of Government Benefits, by Self-Reported W-2 Participation Status
Government Benefits Received
NeverParticipants(%, n = 15)
CurrentParticipants(%, n = 43)
FormerParticipants(%, n = 42)
Full Sample(%, n = 100)
A. In the Month Prior to the Wave 2 Interview
Medicaid 100 95 74 87
WIC 40 51 45 47
SSI 40 26 17 24
Social Security 13 5 2 5
Unemployment Insurance 13 2 0 3
Food Stamps 47 77 38 56
B. In Any of the Past 12 Months
Medicaid 100 95 86 92
WIC 53 54 45 50
SSI 40 28 19 26
Social Security 13 5 2 5
Unemployment Insurance 13 7 2 6
Food Stamps 67 84 64 73
EITC 40 40 50 51

23
30For example, working parents may be required to recertify their family’s Food Stamp eligibility everythree months.
31Our estimates did not include child care subsidies, housing assistance, or Medicaid benefits.
32Respondents were asked about both state and federal EITC.
too great.30 Finally, some respondents may not have been aware that they were still eligible for food
stamps even if they were working and/or not participating in W-2.
Table 11 presents estimated monthly family income for the month prior to the Wave 2 interview
and estimated annual family income for the preceding year. Monthly income was estimated by summing
the income respondents reported from all of the following sources: W-2 grant, SSI, Social Security,
Unemployment Insurance, child support, food stamps, and earnings from employment for all family
members.31 Annual income was then estimated by multiplying respondents’ estimated monthly income by
12. Table 11, Panel A presents income data for all respondents whereas Panel B is limited to respondents
who were employed at Wave 2. Overall, former participants reported mean monthly incomes 37 percent
higher than current participants and 30 percent higher than those who never enrolled. Among employed
respondents, former participants reported mean monthly incomes 26 percent higher than current
participants and 27 percent higher than those who never enrolled. Some of this difference reflects the
higher hourly wages of former participants, but it seems likely that other sources of income also
contributed. Finally, it should be noted that although we present projected annual incomes both with and
without reported income from the EITC, these estimates assume that respondents had a stable monthly
income throughout the preceding year.32 Although this may not be a reasonable assumption for this
population, we nevertheless thought it useful to estimate the potential effect of EITC income.
The estimated family income data presented in Table 11 indicate that most of the respondents in
our sample, with the possible exception of former W-2 participants who were currently employed at
Wave 2, would be living approximately at or slightly above the 1999 poverty line for a family of three

24
TABLE 11Estimated Monthly and Annual Family Income from All Sources,
by Self-Reported W-2 Participation Status
Estimated IncomeNever
ParticipantsCurrent
ParticipantsFormer
ParticipantsFull
Sample
A. Total Sample (n = 14) (n = 43) (n = 42) (n = 99)
For prior montha Median=$1104Mean=$1134
Median=$966 Mean=$1072
Median=$1454Mean=$1473
Median=$1200Mean=$1248
For preceding 12months, not includingreported EITC
Median=$13,242Mean=$13,610
Median=$11,592 Mean=$12,859
Median=$17,448Mean=$17,671
Median=$14,400Mean=$14,973
For preceding 12months, includingreported EITC
Median=$14,242 Mean=$14,216
Median=$11,592 Mean=$12,928
Median=$17,620Mean=$18,183
Median=$14,550 Mean=$15,305
B. Employed Respondents (n = 10) (n = 17) (n = 27) (n = 54)
For prior montha Median=$1217Mean=$1299
Median=$1250Mean=$1314
Median=$1550Mean=$1650
Median=$1479Mean=$1429
For preceding 12months, not includingreported EITC
Median=$14,598Mean= $15,588
Median=$15,000Mean= $15,764
Median=$18,600Mean= $19,798
Median=$17,148Mean= $17,748
For preceding 12months, includingreported EITC
Median=$14,598Mean=$16,348
Median=$15,000Mean=$15,834
Median=$18,600Mean=$20,211
Median=$17,428Mean=$18,118
aEstimates include reported income from W-2 grant, SSI, Social Security, Unemployment Insurance, child support,earnings from employment, and Food Stamps.

25
33Because we did not ask about economic hardships at Wave 1, we do not know how respondents’experience of economic hardships under W-2 compares to their experience under AFDC.
34Table 13 includes 4 current W-2 participants who used child care but had not been employed within thepast 12 months.
($13,880), but below the poverty line for a family of four ($16,700) (U.S. Dept. of Health and Human
Services, 2000b).
ECONOMIC HARDSHIPS
Table 12 shows the percentage of respondents who had experienced any of a variety of economic
hardships during the past 12 months. Although our sample is too small for confident generalization, these
data do suggest that economic hardships are not uncommon among this population. Overall, respondents
reported having experienced 4 of the 11 economic hardships about which they were asked, although
respondents who had never participated in W-2 tended to report a greater number of hardships than either
current or former participants.33 Our definition of what constitutes a hardship is necessarily somewhat
arbitrary, but the types of problems reported were not trivial.
USE OF CHILD CARE
Table 13 shows the various types of child care that respondents reported using.34 Seventy-seven
percent of the respondents in our sample with a child under the age of 5 (n = 70) and 69 percent of the
respondents in our sample with a child under the age of 13 (n = 90) reported that they had used some type
of child care during the year prior to their Wave 2 interview (Panel A). Among respondents who were
either working at Wave 2 or had worked at some point during the past 12 months, 88 percent of our
sample with a child under the age of 5 (n = 58) and 84 percent of those with a child under the age of 13

26
TABLE 12Economic Hardships Experienced during the Past Year,
by Self-Reported W-2 Participation Status
Hardship
NeverParticipants(%, n = 15)
CurrentParticipants(%, n = 43)
FormerParticipants(%, n = 42)
Full Sample
(%, n = 100)
Not enough money to pay rent ormortgage 47 42 48 45
Not enough money to pay bills 73 61 55 60
Utilities shut off 7 2 14 8
Phone disconnected 40 23 41 33
Evicted 13 2 5 5
Doubled-up because could not affordown housing 13 5 7 7
Homeless 20 9 5 9
Obtained food from food pantry 80 67 57 65
Ate at soup kitchen 27 30 7 20
Ran out of food and had no money tobuy more 67 72 57 65
Belongings repossessed 0 5 5 4
No. of Hardships Experienced
Median 5 4 3 4
Mean 5 4 4 4

27
TABLE 13Type of Child Care Used during the Past Year Among Respondents
Who Used Child Care, by Age of Youngest Childa
Type of Child CareUse by Respondents
w/ Child < 5 (%)Use by Respondentsw/ Child < 13 (%)
A. All Respondents (n = 70) (n = 90)
Day Care Center 64.8 61.3
Care in Someone Else’s Home 63.0 62.9
Care in Own Home 14.8 19.4
Before/After School Care Program 14.8 22.6
Head Start 31.5 30.6
Any Type of Child Care 77.1 68.9
B. Currently or Formerly Employed Respondents (n = 58) (n = 70)
Day Care Center 64.7 61.0
Care in Someone Else’s Home 64.7 64.4
Care in Own Home 15.7 20.3
Before/After School Care Program 11.8 20.3
Head Start 29.4 28.8
Any Type of Child Care 87.9 84.3
aColumn totals exceed 100% because respondents often reported using more than one type of care.

28
35Among respondents with a child under the age of five, child care was used by 88 percent of those currentlyemployed or employed within the past 12 months.
(n = 70) reported that they had used some type of child care (Panel B).35 Regardless of the age of the
respondent’s youngest child or the respondent’s employment status, day care centers and care in someone
else’s home were the most commonly used types of child care.
A significant minority of respondents reported that they had left a child under age 13 at home
alone or in the care of an older sibling who was also under age 13 while they were at work (Table 14). A
few of the children left alone or with a sibling were under 5 years old.
RECEIPT OF CHILD CARE ASSISTANCE
Approximately two-thirds of the respondents in our sample who used one or more types of child
care reported that they had received child care assistance at some point during the past 12 months (Table
15). Although receipt of child care assistance was higher among current than former participants, our
data are ambiguous as to whether (1) respondents were currently receiving child care assistance; and (2)
former participants continued to receive child care assistance once they left the program. With respect to
the latter issue, the fact that respondents who never participated in the program were as likely to receive
child care assistance as respondents in general suggests that at least some former participants had
received child care assistance even after they were no longer on W-2.
CHILD CARE PROBLEMS
Table 16 presents data on the child care problems that respondents reported experiencing during
the year preceding their second interview. The variation in sample cell size reflects the fact that some
problems were only relevant to respondents who met a certain condition (i.e., employed, parent of young

29
TABLE 14Use of Self and Sibling Care for Children Under Age 13
While Parent Was at Work, Among Respondents with a Child Under Age 13a
(n = 70)
Child Stayed Alone 14.3%
Age of youngest child who stayed aloneMed = 10Mean = 9
Range: 3 to 12
Sibling under 13 Provided Child Care 5.7%
Age of sibling who provided careMed = 11
Mean = 10.5Range: 8 to 12
Age of youngest child for whom sibling caredMed = 4Mean = 4
Range: 3 to 5aAmong respondents who were currently employed or had been employed at some point during the past year.
TABLE 15Receipt of Child Care Assistance During the Past Year among Respondents
with a Child Under Age 13 Who Used Child Care,by Self-Reported W-2 Participation Status
Received Child Care Assistance
NeverParticipants(%, n = 9)
CurrentParticipants(%, n = 21)
FormerParticipants(%, n = 32)
Full Sample
(%, n = 62)
Yes 66.7 71.4 62.5 65.6
No 33.3 28.6 37.5 32.8
Missing 11.1 0.0 0.0 1.6

30
TABLE 16Child Care Problems Experienced during the Past Year,
by Self-Reported W-2 Participation Status
Child Care ProblemsNever
ParticipantsCurrent
ParticipantsFormer
ParticipantsFull
Sample
Among Respondents Who Worked or Were Working
Trouble finding child care due to PM or weekendwork hours
40.0%(n = 10)
22.7%(n = 21)
27.7%(n = 35)
27.3%(n = 66)
Trouble finding child care due to variable workschedule
40.0%(n = 10)
33.3%(n = 21)
33.3%(n = 35)
27.3%(n = 66)
Missed work because unable to find child care 60.0%(n = 10)
33.3%(n = 21)
64.0%(n = 35)
43.9%(n = 66)
Missed work due because unable to pay for childcare
30.0%(n = 10)
23.8%(n = 21)
32.0%(n = 35)
24.2%(n = 66)
Missed work due to lack of sick child care 60.0%(n = 10)
81.0%(n = 21)
68.6%(n = 35)
71.2%(n = 66)
Quit job due to lack of child care 20.0%(n = 10)
23.8%(n = 21)
11.4%(n = 35)
16.7%(n = 66)
Trouble finding infant care among respondents withchild younger than 2 years old
100%(n = 4)
25.0% (n = 12)
8.3% (n = 12)
28.6% (n = 28)
Trouble finding care for child with disability amongrespondents with child who has disability
100%(n = 1)
13.3%(n = 15)
28.6%(n = 14)
23.3%(n = 30)
Trouble finding before/after school care amongrespondents with school-aged child
50.0%(n = 4)
4.8%(n = 21)
16.7%(n = 24)
14.3%(n = 49)
Refused job due to lack of child care 40.0%(n = 12)
14.3%(n = 21)
14.3%(n = 35)
18.2%(n = 66)

31
36Twenty-two respondents reported that their ability to work was limited by their own disability, 11respondents reported that their ability to work was limited by another family member’s disability, and 11 respondentsreported that their ability to work was limited by both.
child, etc.). The data also indicate that child care problems are not an uncommon occurrence among this
population; most of the problems were experienced by at least 25 percent of the respondents who met the
necessary condition. Several of the child care problems had potentially serious economic consequences,
including missing work, quitting jobs, and refusing job offers. However, only one respondent indicated
that child care problems accounted for her dismissal from employment (results not shown).
Unfortunately, our data do not allow us to estimate the financial costs of these problems.
PHYSICAL AND MENTAL HEALTH BARRIERS TO EMPLOYMENT
Table 17 shows the percentage of respondents who reported various physical or mental health
problems that might be viewed as barriers to employment and could limit their ability to become self-
sufficient. Two findings, in particular, stand out. First, 44 percent of respondents reported that their
ability to work was limited by their own and/or another family member’s disability.36 Second, many
respondents either reported that they had suffered from a mental health problem during the past year or
scored above the cut-off point indicative of depression on the CES-D scale which has been used to
measure depressive symptomatology in the general population (Radloff and Locke, 1986).
Table 18 presents data on physical and mental well-being by respondents’ employment status.
The data suggest a strong relationship between the two. With the exception of alcohol or drug problems,
respondents who were currently employed were less likely to report problems with their physical or
mental health. Moreover, among those not currently employed at Wave 2, respondents who had been
employed at some point during the previous year were less likely to report physical or mental health
problems than those who were never employed. Although our data are ambiguous whether lack of

32
TABLE 17Reported Physical and Mental Health Barriers to Employment
by Self-Reported W-2 Participation Status
Physical and Mental HealthProblems
NeverParticipants(%, n = 15)
CurrentParticipants(%, n = 43)
FormerParticipants(%, n = 42)
Full Sample(%, n = 100)
Parent Reported Poor Health 20.0 14.0 9.5 13.0
Disability Limits Parent’s Abilityto Work 40.0 39.5 23.8 33.0
Family Member’s Disability LimitsParent’s Ability to Work 6.7 32.6 16.7 22.0
Parent with Mental Health Problem 40.0 41.9 33.3 38.0
CES-D Score of 16 or abovea 33.0 58.0 41.0 47.0
Parent Has Alcohol or Other DrugProblem 13.3 11.6 7.1 10.0
aA CES-D score of 16 or above is generally regarded as an indicator of depression (Radloff and Locke, 1986).
TABLE 18Reported Physical and Mental Health Problems by Employment Status
Physical and Mental HealthProblems
CurrentlyEmployed(%, n = 54)
Not Employed, ButEmployed at Some
Point Past Year(%, n = 20)
Never EmployedPast Year
(%, n = 26)Total Sample(%, n = 100)
Parent Reported Poor Health 7.4 10.0 26.9 13.0
Disability Limits Parent’s Abilityto Work 18.5 35.0 61.5 33.0
Family Member’s DisabilityLimits Parent’s Ability to Work 16.7 10.0 42.3 22.0
Parent with Mental HealthProblem 25.9 40.0 61.5 38.0
CES-D Score of 16 or above 36.0 52.6 86.4 51.6
Parent Has Alcohol or OtherDrug Problem 5.6 20.0 11.5 10.0
aA CES-D score of 16 or above is generally regarded as an indicator of depression (Radloff and Locke, 1986).

33
37It is possible that these findings reflect a problem of recall. However, we have find a similar lack ofaccurate information among the respondents in our Milwaukee sample who were interviewed at the W-2 agency afterthe program had been explained to them by a Resource Specialist.
physical or mental well-being is a cause, a consequence, or simply a correlate of not being employed, the
findings certainly warrant further study.
KNOWLEDGE ABOUT THE W-2 PROGRAM
As noted above, there is some evidence that respondents who participated in W-2 may have been
confused about their tier assignments. Table 19 suggests that many respondents lacked accurate
information about the program.37 As might be expected, respondents who had never participated in the
program were less likely to have accurate information than those who had participated. However, lack of
accurate information was also evident among current and former participants. For example, respondents
lacked basic information, such as whether all W-2 participants receive monthly cash assistance (they do
not) or whether there is a lifetime limit on the number of months of cash assistance a family can receive
(there is). A significant minority of respondents simply did not know about important program
components.
Respondents’ ignorance of the program may also explain some apparent inconsistencies that we
discovered. For example, although almost half of those respondents who had never participated in W-2
stated that W-2 participation was a necessary condition for Medicaid receipt, all of these respondents
reported that they had received Medicaid in the month prior to their Wave 2 interview. Similarly,
although two-thirds of nonparticipants reported that they had received food stamps at some point during
the previous year, 40 percent stated that W-2 participation was a necessary condition for food stamp
receipt.

34
TABLE 19Respondent Knowledge about W-2 Program, by Self-Reported W-2 Participation Status
Statements aboutW-2 Program
Self-Reported W-2 Participation Status
Never Participants(%, n = 15)
Current Participants(%, n = 43)
Former Participants(%, n = 42)
Full Sample(%, n = 100)
Yes NoDon’tKnow Yes No
Don’tKnow Yes No
Don’tKnow Yes No
Don’tKnow
All W-2 participantsreceive monthly cashbenefits* 53 7 40 32 51 14 29 54 17 35 46 19
W-2 cash benefitsincrease with family size* 27 53 20 14 72 14 17 62 21 17 65 18
Missing assigned W-2 activity can result inreduced cash benefits+ 73 13 13 88 5 7 88 0 12 86 4 10
Limit on number ofmonths participant can beassigned to W-2T+ 47 0 53 51 26 23 57 10 33 53 15 32
Limit on number ofmonths participant can beassigned to a CSJ+ 33 0 67 47 19 35 48 12 40 45 13 42
Lifetime limit on monthsof cash assistance+ 47 20 33 56 28 16 69 7 24 58 18 24
W-2 nonparticipant canreceive Food Stamps+ 47 40 13 44 47 9 45 45 10 45 45 10
W-2 nonparticipant canreceive Medicaid+ 53 33 13 54 40 7 62 27 10 57 34 9
Child of W-2nonparticipant canreceive Medicaid+ 67 13 20 72 9 19 62 12 26 67 11 22
*Indicates statement is false, +indicates statement is true.

35
CONCLUSIONS
The small size of our sample and the problems we encountered with sample attrition raise
questions about how far we can generalize our findings to Dane County families that were potentially
eligible to transfer from AFDC to W-2 during the first year of W-2 implementation. Nevertheless, a
comparison of our findings with those reported by Swartz et al. (1999) in their study of Milwaukee
families making the transition to W-2 from AFDC reveals a striking number of similarities. These
similarities exist despite differences in populations sampled, specific questions asked, and research
design.
To summarize some of our major findings:
1. More than half (54 percent) of the respondents reported that they were employed at the time of
their second interview, and another 20 percent reported that they had held a job at some time during the
preceding 12 months. The mean hourly wage reported by those who were working at Wave 2 was $8.24.
This is approximately $0.75 per hour more than the mean hourly wage reported by a similar sample of
Milwaukee families (Swartz et al., 1999), perhaps reflecting the lower unemployment rate in Dane
County (1.7 percent) compared to Milwaukee (5.3 percent).
2. The estimated family income data presented in Table 11 indicate that most of the respondents
in our sample, with the possible exception of former W-2 participants who were currently employed at
Wave 2, would be living approximately at or slightly above the 1999 poverty line for a family of three
($13,880), but below the poverty line for a family of four ($16,700) (U.S. Dept. of Health and Human
Services, 2000b).
3. There was evidence of considerable confusion among respondents in our sample about the
rules and regulations of the W-2 program. Most notably, respondents were confused about whether all
program participants received monthly cash payments, whether the receipt of cash assistance was time-
limited, and whether participation in W-2 was a necessary condition for Food Stamp and/or Medicaid

36
eligibility. It is not clear from our data if lack of accurate information about the program precluded some
families in our sample from receiving benefits or services for which they were eligible.
4. The percentage of the respondents in our sample who had received food stamps in the month
before they were interviewed was much lower than the percentage who had received Medicaid, even
among current W-2 participants. Although the two programs do have different eligibility criteria, it is not
clear that these differences would, by themselves, totally account for our results. It is possible that other
factors, such as marginal tax rates, procedural barriers, or lack of awareness might have played a role.
5. Child care problems were not an uncommon occurrence among our sample of respondents, and
several of the problems reported had potentially serious negative effects on employment. Even more
alarming, perhaps, was our finding that children under 5 years old were being left alone or in the care of
a sibling no more than 12 years old while respondents were at work.
6. A significant number of the respondents in our sample reported that they had experienced one
or more events indicative of economic hardship during the preceding year. These events included not
having enough money to pay for their housing or utilities, running out of food and not having money to
buy more, or going to a pantry or soup kitchen for food. The frequency with which these economic
hardships were experienced by sample members warrants further attention.
7. Twelve percent of the respondents in our sample reported that they were not employed at
Wave 2, had been without a job for at least one month, were not living with another family member who
was likely to be employed, and were not receiving cash assistance from W-2 or other government
programs. Although some of these respondents may have had sources of income that we did not ask
about, it is not obvious from our data how their families were managing to “get by.”
8. Our data seem to indicate that lack of physical and/or emotional well-being are likely to be
major barriers to employment for a substantial number of sample members. Forty-four percent of
respondents reported that their ability to work was limited by their own and/or another family member’s

37
disability. Mental health problems, particularly symptoms of depression, were also prevalent among
respondents. Although our data are ambiguous about the causal relationships between employment and
mental health, emotional well-being tended to be lower among those who were not employed.
Given the limitations of our study, additional research on the experiences of Wisconsin families
under W-2 is clearly needed. Although researchers and policymakers will almost certainly want to know
more about the employment and earnings of both W-2 participants and nonparticipants alike, the data
presented here suggest several other areas for further study. These would include the physical and
emotional well-being of current, former, and potential W-2 participants, the interactions between
participation in W-2 and other government programs such as food stamps and Medicaid, and the survival
strategies of families with no stable income sources. Finally, while the more disconcerting of our findings
should not be viewed as negative “effects” of W-2, an important question to consider is whether and how
the program might be able to address any of the problems to which they point.

38
References
Kaplan, T. 1998. “Wisconsin’s W-2 Program: Welfare as We Might Come to Know It.” Discussion Paperno. 1173-98. Institute for Research on Poverty, University of Wisconsin–Madison.
Radloff, L., and Locke, S. 1986. “The Community Mental Health Assessment Survey and the CES-DScale.” In Community Surveys of Psychiatric Disorders, ed. M. Weissman, J. Myers, and C.Ross. New Brunswick, NJ: Rutgers University Press (pp. 177–189).
Swartz, R., Kauff, J., Nixon, L., Fraker, T., Hein, J., and Mitchell, S. 1999. Converting to Wisconsin Works: Where Did Families Go When AFDC Ended in Milwaukee? Indianapolis, IN:Hudson Institute and Mathematica Policy Research.
U.S. Department of Health and Human Services, Administration for Children and Families. 2000a.Change in TANF Caseloads: Total TANF Families by State. Washington, DC. Retrieved on 9February 2000 from the World Wide Web: <http://www.acf.dhhs.gov/news/stats/aug-sept.htm>
U.S. Department of Health and Human Services, Assistant Secretary for Planning and Evaluation. 2000b.1999 HHS Poverty Guidelines. Washington, DC. Retrieved 21 February 2000 from the WorldWide Web: <http://aspe.hhs.gov/poverty/00poverty.htm>
Wisconsin Department of Workforce Development, Division of Economic Support. 1997. Building aBetter Safety Net. Madison, WI: DES-DWD.