impact of conditional cash transfers on routine childhood ...
77
IMPACT OF CONDITIONAL CASH TRANSFERS ON ROUTINE CHILDHOOD IMMUNIZATIONS IN NORTH WEST NIGERIA FINAL REPORT November 18, 2020
-
Upload
khangminh22 -
Category
Documents
-
view
2 -
download
0
Transcript of impact of conditional cash transfers on routine childhood ...

IMPACT OF CONDITIONAL CASH
TRANSFERS ON ROUTINE CHILDHOOD
IMMUNIZATIONS IN NORTH WEST
NIGERIA
FINAL REPORT
November 18, 2020

Acknowledgements
Our core IDinsight team included: Sophia Schneidewind who led pilots of all endline survey activities,
refined questionnaires and field and data quality protocols for household surveys, and coordinated
household survey fieldwork. Sophia also conducted the analysis and interpretation for report sections
using household data and led the supplementary analysis on self-report data quality; Sebastian Łucek
who refined questionnaires and field and data quality protocols for clinic surveys, coordinated our
clinic survey fieldwork, and conducted the analysis and interpretation for report sections using clinic
data. He also led our in-stride reporting and tracking of data collection activities and our
supplementary analysis of the drivers of control coverage; Zachary Devlin-Foltz who oversaw all
endline activities, ensuring that the team conducted a rigorous endline study on time; Sarah Carson,
Mallika Sobti, and Nyambe Muyunda who prepared for and supported endline fieldwork; Dr. Niklas
Heusch who provided technical inputs and oversight throughout the endline study and data analysis;
and Dr. Alison Connor who provided oversight and guidance throughout the evaluation. This core
team was responsible for writing this report.
Our co-PI, Segun Oguntoyinbo, provided input and guidance throughout the evaluation. Segun also
contributed to the interpretation of the results.
In addition to Segun, several members of Hanovia Limited’s team deserve particular recognition for
their leadership and effort before and during data collection: Kola Durojaye for his leadership and
skillful study-wide coordination. Hashim Hassanu for his logistical efficiency and local wisdom. Dr.
Seye Ajayi, Dr. Usaku Ogunbiyi, and Dr. Musa Yakubu for their expert enumerator training. Sunday
Orinya for his careful data management. Folakemi Omotayo for her tireless and flexible support
keeping the teams paid and sustained. Garba Abdullahi, Emeka Ochije, and Arshad Yakasai for
effectively managing their state teams. Sheni Adejumo for his excellent work in helping with soliciting
feedback from and disseminating study results to stakeholders in Nigeria.
We would also like to acknowledge the work of our field managers: Mariam Bako, Elizabeth Bello,
Sophie Emmanuel, Clara Ibrahim, Saraya Dauda Loya, Charity Usman, and Sandra Wilson – who
advised and accompanied our staff throughout fieldwork - and the work of all Hanovia supervisors,
enumerators, back-checkers, and logistics-support personnel.
We would like to thank our implementing partners for their collaboration and for giving us the
privilege of evaluating their Conditional Cash Transfers for Routine Immunization program: Svetha
Janumpalli, Pratyush Agarwal, Patrick Stadler, Dr. Obinna Ebirim, Nura Muhammad, Mubarak Bawa,
Kennedy Theman, Idoko Paul, Dhanasiddharth Selvam, Rahul Kulkarni, the Field Officers who
dedicatedly served caregivers, Field Managers, and the rest of the New Incentives – All Babies Are
Equal Initiative team. We would also like to thank Anna Heard for her technical input.
Next, we would like to thank the National Primary Health Care Development Agency (NPHCDA), the
Katsina State Primary Health Care Agency, Jigawa State Primary Health Care Development Agency,
and Zamfara State Primary Health Care Board. We also thank Nigeria’s National Health Research Ethics
Committee, Zamfara State Health Research Ethics Committee, Katsina State Health Research Ethics
Committee, and Jigawa State Primary Health Care Development Agency who granted us ethical
approval to conduct this study.
We thank Prof. Beckie Tagbo, Prof. Auwal Umar Gajida, Prof. Aisha Abubakar, Pharm Adamu Gachi,
Dr. Ahmad Abdulwahab, and Prof. Musa Abdullahi for reviewing this report and providing valuable
input.

In addition, we would like to thank our team of GIS specialists for their tireless and timely work
ensuring we had maps ready for surveyors. In particular, Bilal Shah, Jahangir Gulzar, Simonas Valatka,
and Stephen Du Preez helped us refine our systems to ensure representative sampling and efficient
map processing.
We are also grateful to the team at Control Risks for their security advice and commitment to keeping
us both safe and effective in the field.
We would also like to acknowledge the work of our many colleagues at IDinsight who played an
essential role over the course of four years in the conceptualization and execution of this project,
especially: Steven Brownstone and Felicia Belostecinic who spearheaded pre-endline phases of the
project; Radhika Lokur, and Deng-Tung Wang who helped run fieldwork and conduct analysis during
various phases of the project; Jacqueline Mathenge and Michael Henry who remotely oversaw
mapping efforts during fieldwork; and Maureen Stickel, Madga Anchondo, Martin Gould, and Daniel
Stein who helped lead and manage the team during previous phases of the project.
Lastly, we would like to acknowledge the thousands of caregivers and healthcare personnel working
every day to ensure children’s health in Northern Nigeria. Many of them let us into their homes and
workplaces and answer our questions. Without them, none of our work is possible.
About IDinsight
IDinsight uses data and evidence to help leaders combat poverty worldwide. Our collaborations
deploy a large analytical toolkit to help clients design better policies, rigorously test what works, and
use evidence to implement effectively at scale. We place special emphasis on using the right tool for
the right question, and tailor our rigorous methods to the real-world constraints of decision-makers.
IDinsight works with governments, foundations, NGOs, multilaterals and businesses across Africa and
Asia. We work in all major sectors including health, education, agriculture, governance, digital ID,
financial access, and sanitation.
We have permanent offices in Dakar, Johannesburg, Lusaka, Manila, Nairobi, and New Delhi. Visit
www.IDinsight.org and follow on Twitter @IDinsight to learn more.

Final Evaluation Report
page 4
Table of Contents
TABLE OF CONTENTS ......................................................................................................................... 4
ACRONYMS .................................................................................................................................... 5
EXECUTIVE SUMMARY ....................................................................................................................... 7
EVALUATION QUESTIONS AND METHODS .................................................................................................... 7
RESULTS AND RECOMMENDATIONS – IMPACT .............................................................................................. 8
RESULTS AND RECOMMENDATIONS – CONTROL COVERAGE ............................................................................ 9
INTRODUCTION .............................................................................................................................. 10
EVALUATION QUESTIONS ................................................................................................................. 12
METHODS .................................................................................................................................... 14
RESULTS ...................................................................................................................................... 20
EVALUATION SAMPLE ............................................................................................................................. 20
IMPACT ON VACCINATION ....................................................................................................................... 22
IMPACT ON ADDITIONAL OUTCOMES ........................................................................................................ 35
ROBUSTNESS TO ALTERNATIVE ANALYSES .................................................................................................. 40
LIMITATIONS ......................................................................................................................................... 43
CONCLUSION ........................................................................................................................................ 45
SUPPLEMENTARY ANALYSIS FOR GIVEWELL’S COST-EFFECTIVENESS MODEL ................................................. 46
CONTAMINATION AND SPILLOVERS ........................................................................................................... 46
DRIVERS OF CONTROL GROUP COVERAGE.................................................................................................. 49
QUALITY OF SELF-REPORTS ..................................................................................................................... 63
CONCLUSION AND RECOMMENDATIONS FOR GIVEWELL .......................................................................... 74
IMPACT OF NEW INCENTIVES – ALL BABIES ARE EQUAL INITIATIVE CCTS FOR RI PROGRAM ............................... 74
THE COUNTERFACTUAL – AREAS WITHOUT NI – ABAE ................................................................................ 74
SUMMARIZED RECOMMENDATIONS FOR THE CEA ...................................................................................... 75
REFERENCES .................................................................................................................................. 76

Final Evaluation Report
page 5
Acronyms
BCG Bacillus Calmette–Guérin (a tuberculosis vaccine)
CCT Conditional cash transfer
CEA Cost-effectiveness analysis
CHC Child health card
CIR Clinic immunization record
CSS Compact segment sampling
DHS Demographic and Health Survey
fIPV Fractional dose of the inactivated polio vaccine
FSDR Free step-down resampling
HH Household
HIB Haemophilus Influenza Type B
HIV Human immunodeficiency virus
ICC Intracluster correlation coefficient
IPV Inactivated polio vaccine
LGA Local government area
MenA Meningitis A vaccine
NGO Non-governmental organization
NI-ABAE New Incentives - All Babies Are Equal Initiative
OLS Ordinary least squares
PCV Pneumococcal conjugate vaccine
Penta Pentavalent vaccine (diptheria, tetanus, pertussis, hepatitis B, HIB)
RCT Randomized controlled trial
RI Routine immunization

Final Evaluation Report
page 6
Definition of Terms
Any Measles vaccine – Child received at least one dose of the Measles vaccine
Any PCV vaccine – Child received at least one dose of PCV vaccine
Any Penta vaccine – Child received at least one dose of Penta vaccine
BCG vaccine – Child received the BCG vaccine
BCG scar – Child had a scar on her/his arm from receiving the BCG vaccine
Ever vaccinated – Child received at least one injectable vaccine
Fully immunized (loose) – Child received BCG, Penta 1, and Measles 1 vaccines
Fully immunized (strict) – Child received BCG, three doses of Penta, and Measles 1 vaccines
Total (no PCV) - Total number of vaccines received by child (count includes BCG, Penta 1-3 vaccines,
and Measles 1 vaccine; ranges from 0 to 5)
Total (with PCV) - Total number of vaccines received by child (count includes BCG, Penta 1-3
vaccines, PCV 1-3 vaccines, and Measles 1 vaccine; ranges from 0 to 8)
Final Evaluation Report
page 7
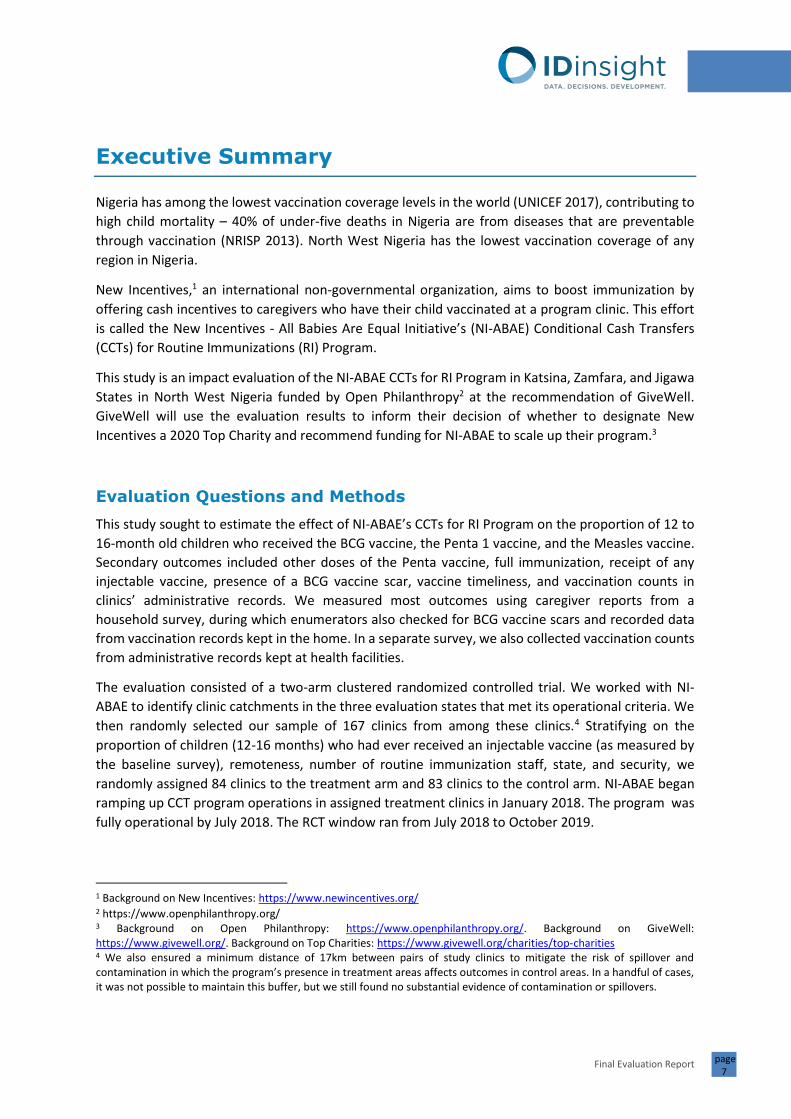
Executive Summary
Nigeria has among the lowest vaccination coverage levels in the world (UNICEF 2017), contributing to
high child mortality – 40% of under-five deaths in Nigeria are from diseases that are preventable
through vaccination (NRISP 2013). North West Nigeria has the lowest vaccination coverage of any
region in Nigeria.
New Incentives,1 an international non-governmental organization, aims to boost immunization by
offering cash incentives to caregivers who have their child vaccinated at a program clinic. This effort
is called the New Incentives - All Babies Are Equal Initiative’s (NI-ABAE) Conditional Cash Transfers
(CCTs) for Routine Immunizations (RI) Program.
This study is an impact evaluation of the NI-ABAE CCTs for RI Program in Katsina, Zamfara, and Jigawa
States in North West Nigeria funded by Open Philanthropy2 at the recommendation of GiveWell.
GiveWell will use the evaluation results to inform their decision of whether to designate New
Incentives a 2020 Top Charity and recommend funding for NI-ABAE to scale up their program.3
Evaluation Questions and Methods
This study sought to estimate the effect of NI-ABAE’s CCTs for RI Program on the proportion of 12 to
16-month old children who received the BCG vaccine, the Penta 1 vaccine, and the Measles vaccine.
Secondary outcomes included other doses of the Penta vaccine, full immunization, receipt of any
injectable vaccine, presence of a BCG vaccine scar, vaccine timeliness, and vaccination counts in
clinics’ administrative records. We measured most outcomes using caregiver reports from a
household survey, during which enumerators also checked for BCG vaccine scars and recorded data
from vaccination records kept in the home. In a separate survey, we also collected vaccination counts
from administrative records kept at health facilities.
The evaluation consisted of a two-arm clustered randomized controlled trial. We worked with NI-
ABAE to identify clinic catchments in the three evaluation states that met its operational criteria. We
then randomly selected our sample of 167 clinics from among these clinics.4 Stratifying on the
proportion of children (12-16 months) who had ever received an injectable vaccine (as measured by
the baseline survey), remoteness, number of routine immunization staff, state, and security, we
randomly assigned 84 clinics to the treatment arm and 83 clinics to the control arm. NI-ABAE began
ramping up CCT program operations in assigned treatment clinics in January 2018. The program was
fully operational by July 2018. The RCT window ran from July 2018 to October 2019.
1 Background on New Incentives: https://www.newincentives.org/ 2 https://www.openphilanthropy.org/ 3 Background on Open Philanthropy: https://www.openphilanthropy.org/. Background on GiveWell: https://www.givewell.org/. Background on Top Charities: https://www.givewell.org/charities/top-charities 4 We also ensured a minimum distance of 17km between pairs of study clinics to mitigate the risk of spillover and contamination in which the program’s presence in treatment areas affects outcomes in control areas. In a handful of cases, it was not possible to maintain this buffer, but we still found no substantial evidence of contamination or spillovers.

Final Evaluation Report
page 8
The endline survey took place from November 2019 to February 2020. We used compact segment
sampling to select approximately 25% of all households in every settlement in the catchment areas of
treatment and control clinics.5 We listed all households in the selected segments to identify children
between 12 and 16 months of age. We then invited all caregivers of these children to complete a
survey on immunization outcomes. We also collected data about immunization services at evaluation
clinics and verified individual immunization status in clinic records. We compared outcomes (from
various data sources) in these areas using both differences in means and multivariate regressions.
Results and Recommendations – Impact
NI-ABAE’s CCTs for RI Program had a large, consistent positive impact on vaccination coverage.
According to both primary and secondary outcomes, NI-ABAE’s CCTs for RI Program had a substantial
positive impact on vaccination coverage. Among children in treatment clinics compared to those in
control clinics, self-reported6 vaccination coverage was 16 percentage points higher for the BCG
vaccine [95% CI: 12, 21], 21 percentage points higher for the Penta 1 vaccine [95% CI: 16, 26], and 14
percentage points higher for the Measles vaccine [95% CI: 10, 18]. All of these increases were
statistically significant. Children in the catchment areas of treatment clinics were also statistically
significantly more likely to have received Penta 2 and 3 vaccines, to be fully immunized, and to have
a BCG vaccine scar compared to children in the catchment areas of control clinics. A higher percentage
of children in treatment areas had received any injectable vaccine compared to children in control
areas, though this increase was not statistically significant using our main definition. NI-ABAE
improved timeliness of some vaccinations, with a large positive effect on timeliness of Measles
vaccination.7
Impact estimates were positive across data sources. BCG vaccine scars and all administrative data
sources showed large, positive impact – similar to self-reports. This suggests that there was a true and
meaningful impact on vaccination not explainable by measurement error.
Plausible assumptions about data quality usually implied upward adjustments. Therefore, based on
self-report error, we recommend GiveWell adjust self-report impact estimates upward for all
vaccines. Making plausible assumptions about self-report measurement error and using them to
adjust coverage and impact always generated positive impact. Most plausible adjustments produced
impact estimates greater than unadjusted self-reports impact estimates, especially if we assumed
measurement error was similar in treatment and control. Using BCG vaccine scars – also adjusted for
5 We divided all settlements in all catchments into segments and randomly selected one quarter of the segments in each settlement to ensure a representative sample of land area. In some exceptional settlements (less than 10%), we surveyed 100% of land area because they were too small to divide. In these cases, we used weights to ensure they were properly represented in our analysis. 6 Self-reported vaccination coverage is based on caregivers’ reports of their child’s vaccination status. 7 The program caused a decrease in the timeliness of BCG vaccinations – these differences were not significant at the 5% level but were notable, nonetheless. However, we suspect they are driven largely by the measure we used, which included only children who received the vaccination. It is likely that many of the infants who receive the BCG vaccination late are those who do not receive the vaccination at all in the absence of the program, perhaps because they are not delivered at health facilities. There was no positive impact on timeliness of the first dose of Penta vaccine when defined as receipt within one month of the recommended age. There was a positive impact, however, when defined as receipt within two weeks of the recommended age.

Final Evaluation Report
page 9
measurement quality – yielded a range for impact on BCG vaccination that was entirely and
meaningfully higher than unadjusted self-report impact. While it is difficult to extrapolate
measurement error from BCG vaccine to other vaccines, we find it likely that impact is similar across
vaccines.
We recommend that GiveWell apply a somewhat larger upward adjustment to Measles vaccine
than to the other vaccines. For Measles vaccine, our impact estimate was higher when restricted to
vaccinations delivered via RI activities (excluding those delivered via periodic campaigns). Given that
large Measles vaccine campaigns appear to occur infrequently (but one did occur just before endline),
it is probable that the program would have a higher impact on Measles vaccine in normal, non-post-
campaign periods.
Results and Recommendations – Control Coverage
Based on self-report error, we recommend GiveWell adjust control coverage estimates downward
for all vaccines.8 Self-reported control coverage was 63% (95% CI: 57%, 69%) for BCG vaccine, 54%
(95% CI: 48%, 61%) for Penta 1 vaccine, and 59% (95% CI: 54%, 64%) for Measles vaccine. Adjusting
control coverage for self-report sensitivity and specificity produced ranges on either side of these
unadjusted self-report estimates. Control coverage according to BCG vaccine scars (adjusted for
scarring probability and scar-recording probability), however, fell well below the self-reports level.9
This suggests that true BCG vaccine coverage in control was likely below that measured by self-
reports. We recommend GiveWell adjust control coverage down for BCG vaccine based on self-report
error. It is difficult to extrapolate this finding to other vaccines, but we would recommend that
GiveWell also assume true coverage for Penta 1 vaccine and Measles vaccine in control is lower than
that found via unadjusted self-reports.
We recommend that GiveWell assume RI coverage for Measles vaccine is roughly 11 percentage
points lower than unadjusted Measles vaccine coverage.
Coverage in control areas at endline was higher than at baseline even after considering the effect of
including Jigawa State and of changes in measurement methods between the two rounds. Campaigns
reported during the study window targeted Measles vaccine but not BCG or Penta vaccines. For
Measles vaccine, we found that control coverage included a non-trivial proportion of campaign-
vaccinators to whom the program might not pay incentives. If GiveWell assumes that NI-ABAE pays
incentives for less than 100% of vaccinations delivered to eligible children via campaigns, then they
should adjust Measles vaccine coverage in control downward before using it to estimate the number
of incentives paid.
8 Our recommendation focuses on control coverage (rather than treatment coverage) for the following reason: For GiveWell’s analysis, the most important parameters are control coverage and the impact estimate. To calculate treatment coverage, GiveWell adds the impact estimate to control coverage. Consequently, if GiveWell decides to revise control coverage downward, then treatment coverage will also be revised downward automatically. 9 We calculated BCG vaccine coverage consistent with a range of scarring and scar-finding probabilities that we believed were plausible based on the literature and our observations in the field. These ranges never produced BCG vaccine coverage in control higher than 50%.

Final Evaluation Report
page 10
Introduction
North West Nigeria has some of the lowest vaccination rates in the world. According to UNICEF’s
immunization coverage estimates for 2019, Nigeria had the tenth lowest estimated coverage (57%)
of the third dose of Diphtheria, Pertussis, and Tetanus vaccine (DTP3), a common indicator of how
effectively countries are providing routine childhood immunization services (UNICEF 2019). These,
low immunization rates are a significant contributor to Nigeria’s high under-five mortality ratio (104
deaths per 1,000 live births, UNICEF 2017)10 – 40% of under-five deaths in Nigeria are from diseases
that are preventable through vaccination (NRISP 2013). Due to its even lower immunization rates, the
region of North West Nigeria is vulnerable to frequent Measles outbreaks (NCDC 2016).
In recent years, the donor community has invested substantially in improving supply-side
infrastructure for routine immunization (NRISP 2013), but coverage rates remain low – the global
immunization coverage target is 90% (WHO 2017).
There are several studies that find that incentives can have a meaningful impact on immunization
coverage, especially in low baseline coverage settings.11 New Incentives,12 an international
non-governmental organization (NGO), aims to boost demand for immunization by offering cash
incentives to caregivers who vaccinate their child at a program clinic.13 This effort is called the New
Incentives - All Babies Are Equal Initiative’s (NI-ABAE) Conditional Cash Transfers (CCTs) for Routine
Immunizations (RI) Program.
NI-ABAE staff accompany local health workers conducting routine immunization activities at clinics
and in communities. After vaccinating a child, health workers direct caregivers eligible for the
incentive to the NI-ABAE staff for enrollment and receipt of the cash payment.14 Figure 1 outlines New
Incentives’ theory of change.
10 Nigeria has the 8th highest rate of under-five mortality in the world (UNICEF 2017). 11 In addition to the research discussed below, see Loevinsohn 1986, Chandir 2010, and Gibson 2017. There is also a broader literature base on conditional cash transfers to encourage health intervention uptake summarized by Lagarde 2007. 12 New Incentives is an international NGO that uses conditional cash transfers to achieve development goals. Since 2014,
New Incentives has provided hundreds of thousands of conditional cash transfers to Nigerian mothers. At first, these
incentivized giving birth in health facilities with the goal of limiting mother-to-child transmission of human
immunodeficiency virus (HIV). After re-evaluating which clinic healthcare service would be most cost-effective to incentivize,
New Incentives shifted focus to routine childhood immunization in 2016. More details on New Incentives can be found on
New Incentive’s website (https://www.newincentives.org/). 13 More details on New Incentives – All Babies Are Equal Initiative can be found in IDinsight’s Baseline Report
(https://files.givewell.org/files/DWDA%202009/NewIncentives/New_Incentives_Baseline_Report_Final_2019_06_03.pdf).
A history of GiveWell’s support to New Incentives is posted on GiveWell’s website (https://www.givewell.org/charities/new-
incentives/all-content). More details on the Nigerian routine immunization system, especially the structure of an average
immunization visit day, can be found in Annex 1 of IDinsight’s Baseline Report and in IDinsight’s February 2017 site visit
report (https://www.givewell.org/research/site-visits/february-2017). 14 To be eligible for first-time enrollment, infants must be able to receive BCG vaccine and be from a program (treatment)
clinic’s catchment area.

Final Evaluation Report
page 11
Figure 1. New Incentives’ Theory of Change for Evaluation Design
Table 1 lists the incentives offered to caregivers by vaccine. The incentive amount for the Measles
vaccine is higher for two reasons. First, NI-ABAE believes that caregivers will need more inducement
to return for the Measles vaccine after the longer time interval following the third Penta vaccination.
Second, evidence suggests that there is greater potential health impact from the Measles vaccine.15
Children do not need to have received the previous vaccine in the schedule to be eligible.16
Table 1. Description & Timing of Vaccinations
Immunization Description Doses Timing (age) for doses
Incentive amount1
BCG vaccine Vaccine against tuberculosis 1 At birth ₦2500
Penta vaccine Five vaccines against: diphtheria, tetanus, pertussis, Hepatitis B and Haemophilus Influenza Type B (HIB)
3 At 6 weeks, 10 weeks, and 14 weeks
₦500 for each dose, when PCV is also received
PCV vaccine Vaccine against pneumococcal bacteria
3 Same as for Penta vaccine
Same as for Penta vaccine
Measles vaccine3
Vaccine against Measles, mumps, rubella, and varicella
1 9 months ₦2000
1 If an infant is eligible for multiple vaccines on a visit, the caregiver will only receive the incentive for the latest vaccine. 2 Nigerian Naira 3 At the time of the study, the Measles 2 vaccine had not yet been introduced in the Nigerian Routine Immunization schedule.
Therefore, the program incentivized only one dose of the Measles vaccine.
15 See IHME data for by-cause mortality: http://ghdx.healthdata.org/gbd-results-tool?params=gbd-api-2017-
permalink/d1a61ecb86c01b9ac1499bd2b718d189 16 Infants on a catch-up schedule - e.g., an unvaccinated infant comes to a clinic at twelve-months and receives BCG vaccine,
PCV 1 vaccine, and Penta 1 vaccine - receive one incentive associated with the most recent vaccination visit. In this case, a
caregiver would receive ₦500.

Final Evaluation Report
page 12
At the time of endline data collection (December 2019), NI-ABAE had operated in 98 health facilities
across Zamfara, Katsina, and Jigawa States. They had dispersed 708,000 cash transfers to 194,000
enrolled children that totaled to 542,000,000 Nigerian Naira.17
GiveWell, a nonprofit dedicated to finding outstanding giving opportunities, identified NI-ABAE as a
potential top charity.18 They identify evidence-backed, underfunded “top charities” by assessing them
according to four criteria: 1) evidence of effectiveness, 2) cost-effectiveness, 3) transparency, and 4)
room for more funding. GiveWell engaged IDinsight19 to conduct an independent impact evaluation
to estimate the impact of the NI-ABAE CCTs for RI Program on coverage of vaccines included in
Nigeria’s routine immunization schedule20 in three states21 in North West Nigeria. GiveWell plans to
translate the coverage increases for each vaccination into estimates of lives saved and illness
prevented to compare the cost-effectiveness of the NI-ABAE CCTs for RI Program to other programs
GiveWell recommends. This evaluation will therefore directly influence GiveWell’s decision to
recommend New Incentives as a top charity.22 This report presents the results from this cluster
randomized evaluation.
Evaluation Questions
The goal of the evaluation was to measure the causal effect of NI-ABAE’s CCTs for RI Program on
coverage for routine childhood vaccines.23
Primary research questions were:24
1. What is the effect of NI-ABAE’s CCTs for RI Program on the proportion of 12 to 16-month olds
in communities served by a study clinic who received BCG vaccine?
17 1,393,987 USD (using xe.com 2 July 2020 exchange rate) 18 GiveWell is closely associated with Open Philanthropy which funds much of GiveWell’s experimental and research work.
GiveWell and Open Philanthropy identify new potential top charities and invest in their development and in further
evaluation of their effectiveness. IDinsight’s evaluation of the NI-ABAE CCTs for RI Program is one such effort and falls under
a broader learning partnership between GiveWell and IDinsight. 19 IDinsight is a client-service organization that helps social sector actors generate and use evidence to inform decisions. Our
team has coordinated over 80 impact evaluations in Africa and Asia using experimental and quasi-experimental
methodologies and works with a wide range of government, not-for-profit, and for-profit organizations. 20 At the beginning of the study period, this included Bacillus Calmette–Guérin (BCG) vaccine for Tuberculosis; Hepatitis B 0;
Oral Polio Vaccine (OPV) 0-3; Pentavalent Vaccine (Penta) 1-3; Pneumococcal Conjugate Vaccine (PCV) 1-3; Measles 1
vaccine; Yellow Fever vaccine; Vitamin A; and Injectable Polio Vaccine (IPV). The Pentavalent Vaccine protects against
diphtheria, tetanus, pertussis, Hepatitis B and Haemophilus Influenza Type B (HIB). Meningitis A Conjugate Vaccine was
added to the schedule part-way through the study period. Diptheria, Pertusis, Tetanus (DPT) vaccine 1-3 were previously
part of the schedule but have not been administered in Nigeria since 2017. 21 This evaluation was conducted in Katsina, Zamfara, and Jigawa States. 22 Top charity status could lead to funding for NI-ABAE in excess of $20 million. 23 Care was taken throughout the evaluation design to ensure that NI-ABAE’s implementation during the RCT reflected their
anticipated implementation at scale. Thus, we expect findings from this study to predict the impact of the NI-ABAE CCTs for
RI Program at scale with reasonable accuracy. 24 The registered pre-analysis plan framed the research questions as the effect of NI-ABAE’s CCTs for RI Program on the probability that a 12 to 16-month old. The wording has been updated here to more accurately reflect that the outcome measure was a proportion, not a probability.

Final Evaluation Report
page 13
2. What is the effect of NI-ABAE’s CCTs for RI Program on the proportion of 12 to 16-month olds
in communities served by a study clinic who received Penta 125 vaccine?
3. What is the effect of NI-ABAE’s CCTs for RI Program on the proportion of 12 to 16-month olds
in communities served by a study clinic who received Measles 1 vaccine?
Secondary research questions were:
4. What is the effect of NI-ABAE’s CCTs for RI Program on the proportion of 12 to 16-month olds
in communities served by a study clinic who are fully immunized (loose and strict)?26
5. What is the effect of NI-ABAE’s CCTs for RI Program on the timeliness of vaccination
among 12 to 16-month olds in communities served by a study clinic?
6. What is the effect of NI-ABAE’s CCTs for RI Program on the average number of vaccines
received per 12 to 16-month old child in communities served by a study clinic?
7. What is the effect of NI-ABAE’s CCTs for RI Program on the proportion of 12 to 16-month olds
in communities served by a study clinic that received at least one injectable vaccine?
8. What is the effect of NI-ABAE’s CCTs for RI Program on the proportion of 12 to 16‑month olds
in communities served by a study clinic who received at least one dose of PCV27?
9. What is the effect of NI-ABAE’s CCTs for RI Program on the change over time in the volume of
BCG, Penta 1, Penta 2, Penta 3, and Measles 1 vaccinations recorded in clinic administrative
records between treatment and control? 28
10. What is the effect of NI-ABAE’s CCTs for RI Program on the proportion of 12 to 16-month olds
in communities served by a study clinic who received non-incentivized immunizations (OPV1-
3, Yellow Fever, and IPV) and vitamin A?
11. What is the effect of NI-ABAE’s CCTs for RI Program on vaccine knowledge and attitudes of
caregivers in communities served by a study clinic?
12. What is the effect of NI-ABAE’s CCTs for RI Program on the frequency of vaccine stockouts in
study clinics? 29
25 The wording from the pre-analysis plan was “at least one dose of Penta”. This has been updated for clarity. 26 Loose: Child received BCG, Penta 1, and Measles 1 vaccines; Strict: Child received BCG, Penta 1-3, and Measles 1 vaccines. While the “strict” definition is closest to the typical definition of full immunization in Nigeria (the Nigerian EPI’s definition includes OPV), we included the “loose” definition of full immunization because we were concerned about the accuracy of self-reported Penta 2 and 3. 27 PCV, while not a primary outcome, is part of NI-ABAE’s incentives conditions and is generally given at the same visits as
Penta vaccine. It is not as prominent in the evaluation in large part because we expected it to be both highly correlated with
and easily confused with Penta vaccine, making self-reported coverage data for it somewhat more difficult to interpret. 28 IDinsight collected these records as part of midline data collection in March/April 2019. We found a robust positive impact
across vaccinations but these results were not for the entire evaluation window, so we also included this at endline. These
administrative records are imperfect, and the program itself may cause them to improve, leading to differential data quality
in treatment and control. Therefore, they should not be used to provide a quantitative impact estimate. However, they
remain an important alternative source that we expect to qualitatively triangulate with self-reported vaccination data. 29 Research questions 10, 11 and 12 were not included in our pre-analysis plan but were added because they were of value to immunization and government stakeholders in Nigeria.

Final Evaluation Report
page 14
Methods
IDinsight conducted a cluster randomized controlled trial (RCT) to assess the impact of NI-ABAE’s CCTs
for RI Program. In 2017, we randomized 167 clinics into a control group (83 clinics) and a treatment
group (84 clinics) after conducting a baseline survey.30 NI-ABAE started its intervention in early 2018,
gradually ramping up operations in all treatment clinics. In June 2018, GiveWell, NI-ABAE, and
IDinsight all assessed that NI-ABAE had reached steady-state operations in all clinics and the “RCT
window” began in July 2018. In December 2019, after NI-ABAE had operated at every clinic for at least
17 months,31 IDinsight conducted an endline household survey to assess the vaccination status of
children in the catchments of study clinics.
This section summarizes the study’s methodology to provide context to the results reported in later
sections. Further details on methodology are in the pre-registered pre-analysis plan32 and the Baseline
Report, while information on the rationale for key design decisions is in various evaluation design
documents published on GiveWell’s website for the evaluation.33
Setting and Selection of Study Clinics
The evaluation took place across three states in North West Nigeria: Katsina State, Zamfara State,
and Jigawa State. NI-ABAE initially chose Katsina and Zamfara States to implement its intervention
after an extensive state selection process that looked at factors such as the presence of other
incentive programs, state responsiveness to research, and vaccination coverage. Jigawa State – a state
that was similar to Katsina State and Zamfara State along these dimensions – was added after the
evaluation baseline was complete to increase the evaluation sample size and mitigate against the risk
of any state-wide effects that might have altered our ability to estimate NI-ABAE’s CCTs for RI Program
at-scale impact at endline (e.g., state-wide strike of healthcare workers, security challenges,
widespread vaccine stock-outs, etc.).
NI-ABAE screened clinics throughout the three states to identify a potential sample of clinics that met
their operational requirements. From this set of clinics, IDinsight drew a sample of clinics for inclusion
into the study.
This sampling process was relatively complex, as it had two goals: 1) to select a sample of clinics that
were representative of NI-ABAE’s expected operations at scale and 2) to ensure that a minimum of
17 kilometers separated any two study clinics, in order to minimize the risk of caregivers from control
30 Each health clinic in Nigeria has a ‘catchment’ area, which contains the population that the clinic is officially designated to
serve. Estimated catchment population sizes in the study area vary from fewer than 2,200 people to over 40,000 people.
These clinic catchments constituted the clusters in our evaluation. 31 Since we planned to survey 12 to 16-month olds at endline, we needed at least 16 months between the time the last program clinic was fully operational and the first day of surveying. 32 The Pre-Analysis Plan is registered with Registry for Development Impact Evaluations
(https://ridie.3ieimpact.org/index.php?r=search/detailView&id=767); ISRCTN (https://www.isrctn.com/ISRCTN10808433);
and clinicaltrials.gov
(https://clinicaltrials.gov/ct2/show/NCT03870061?term=conditional+cash&cond=immunization&draw=2&rank=3) 33 GiveWell’s website for the evaluation: https://www.givewell.org/charities/IDinsight/partnership-with-idinsight/new-incentives-rct

Final Evaluation Report
page 15
clinics visiting treatment clinics (contamination or spillovers).34 IDinsight then ran several automated
and manual iterations to select combinations of clinics that were at least 17 kilometers apart. This
process continued until we identified the maximum number of safe, operable, and well-spaced
clinics.35
The selected clinics covered nearly the entire geography of the three states. In Katsina State, there
were evaluation clinics in 31 out of 34 local government areas (LGAs).36 In Zamfara State, the
evaluation covered all 14 LGAs. In Jigawa State, the evaluation clinics covered 25 out of 27 LGAs.
Randomization
Following the baseline survey,37 we randomly allocated evaluation clinics to a treatment and a control
group. Figure 2 shows the location of those clinics across the three evaluation states. To increase
balance between the treatment and control group, we stratified randomization on five characteristics
of each clinic: the proportion of children (12-16 months) who had ever received an injectable vaccine
(as measured by the baseline survey); variables related to operability (remoteness and number of
routine immunization staff); state; and security.
We conducted randomization in three waves to balance the need to start operations38 while allowing
time for NI-ABAE to reassess the security situation in some clinics. The randomization process is
described in greater detail in IDinsight’s pre-analysis plan.
34 IDinsight, NI-ABAE, and GiveWell collectively decided on a minimum distance of 17 kilometers between clinics. This
distance was chosen based on the local cost of travel and the size of the financial incentive paid by NI-ABAE in treatment
clinics. We deemed that the size of the incentive was unlikely to justify the cost of transport to cover this distance.
Meanwhile, larger minimum distances would rule out too many clinics, producing a clinic sample smaller than we needed
for our desired statistical precision (power). There were five pairs of clinics that ended up closer than our target (i.e., 10-
14km rather than 17km apart). Further, these pairs had a limited number of non-study clinics between them to prevent
direct contamination between treatment and control. Therefore, these pairs were randomized together. While these clinic
pairs were analyzed as a cluster, we expected the intracluster correlation coefficient (ICC) to be low as the clinics were far
enough apart to have distinct catchments. This appears to have been the case: actual ICC for BCG vaccine coverage in the
full sample was 0.13, while ICC in the 10 paired clinics was 0.03. 35 There were some evaluation clinics which shared a catchment area with a non-evaluation clinic or had a poorly defined
catchment border with a non-evaluation clinic within a town. We did not want to exclude these clinics, as this would exclude
clinics that were within a town. Therefore, we suggested that NI-ABAE operates at these “complementary” clinics to ensure
the catchment areas we surveyed were fully treated. For example, if people in a particular neighborhood customarily went
to two clinics, we wanted to ensure both were served by NI-ABAE, even though only one was included in the evaluation. For
clinic-record data collection and clinic-staff surveys, we visited both the study clinic and the complementary clinic. Appendix
J lists all combinations of study and complementary clinics. 36 The selection excluded one LGA because it included NI-ABAE’s CCTs for RI Program pilot sites. The other three LGAs were
excluded by chance given the small size of LGAs in Katsina State. Figure 1 shows roughly even distribution of study clinics
across the state. 37 The baseline survey took place between August 14 and October 17, 2017 in Katsina and Zamfara States. Jigawa State was
added after the baseline was complete to increase the sample size for endline. Piloting activities to assess IDinsight’s ability
to conduct survey operations in Jigawa State took place in February-March 2018. Methods and findings of the baseline study
are written up in IDinsight’s Baseline Report. 38 NI-ABAE gradually ramped up operations in all evaluation clinics between the end of baseline and June 2018. This allowed
them to work out their operational model across all clinics and to get through the initial peak of “catch-up” vaccinations for
children who started their vaccination schedule as a result of the NI-ABAE CCTs for RI Program. This ensured that the endline

Final Evaluation Report
page 16
Figure 2. Map of Evaluation Clinics Across Zamfara, Katsina, and Jigawa States, Nigeria
Note: Clinics in red are treatment clinics and clinics in blue are control clinics The area in southern Zamfara State
with no clinics is an area of high insecurity where many clinics were dropped due to security concerns.
Baseline data showed balance between clinics in both arms (see Appendix A).
Sampling
As it was not financially feasible to create a full population register, we used compact segment
sampling (CSS) to select our evaluation population. CSS avoids the need for a population register by
using geographic area as a primary sampling unit: if we intend to randomly sample 25% of a
catchment’s population, we randomly sample 25% of its geographic area.
Three to four months prior to endline, we confirmed which settlements39 comprised the catchment
area of an evaluation clinic according to that clinic’s routine immunization microplan. We called this
process “map verification.” It involved in-person visits to all study clinics to record the microplan
settlement list, compare it to previous settlement lists collected at baseline or during other data
collection activities, and interview clinic officials to clarify any discrepancies. IDinsight therefore had
settlement lists both from prior to program implementation and from map verification. Generally, the
map verification lists were longer than those collected previously, including some additional
settlements and some settlements that had been split into multiple settlements while maintaining
similar boundaries. After discussions with NI-ABAE, we decided to err on the side of inclusion,
cohort (born in July 2018 or later) received their vaccinations when the NI-ABAE CCTs for RI Program was running as it would
at scale. 39 Within each catchment area, there are one or more ‘settlements.’ In many cases, settlements are defined through the
local political process, typically corresponding to a natural community or geographical boundary. Baseline field work
revealed that these boundaries are sometimes difficult to determine on the ground. IDinsight conducted field work prior to
the endline survey to verify settlement boundaries.

Final Evaluation Report
page 17
surveying at endline those settlements included on the map verification list, even if they were not
included on older lists.40
Each settlement was divided into several equally sized geographic segments (eight for most
settlements, sixteen for larger settlements, four for smaller settlements, and one for settlements too
small to divide).41 We then randomly selected one quarter of these segments in each settlement to
approximate 25% of study area and, on average, 25% of the population.42 We then surveyed all
households that were in that segment to identify eligible 12 to 16-month olds43 (‘household listing’).44
Every eligible child identified through this process was invited to participate in the endline routine
immunization survey. Additional details on the CSS approach are described in IDinsight’s pre-analysis
plan.45
Data Collection
Instruments. Endline data collection used the following survey instruments:
• Household Listing: Collected basic economic and demographic information for the household
and generated a list of its members. It then identified 12 to 16-month old children eligible for
40 NI-ABAE analyzed the lists and determined that they had been operating in the majority of the “new” settlements for a
substantial portion of the study period. IDinsight used GPS survey points from baseline to determine that a large proportion
of the “new” settlements’ land area had been included in the baseline survey area, albeit under different names. Accordingly,
it seemed likely that using the later lists would not add a substantial number of households that had not been served by a
study clinic for most of the study period. As a robustness check, we re-ran our analyses on only settlements listed at baseline
and results were substantively unchanged. 41 When dividing settlement area, we excluded areas that did not appear to have structures according to satellite imagery. 42 For small settlements not divided, we surveyed the entire area and used weights in our analyses to avoid over-representing
them. 43 Only children aged 12 to 16 months were included in the study. In order to accurately measure the program’s impact, it was important to only include children in the study that were born after the program was fully implemented (i.e. children born in July 2018 onwards). The endline survey started in December 2019 - the month during which children born in July 2018 would turn 17 months. Hence, by only including children in our study that were aged 16 months in December 2019, we ensured that all eligible children had been born in or after July 2018. Since we relied on self-reported coverage, we also wanted to minimize the time between receiving the vaccine and our survey. Furthermore, the Measles 1 vaccine, which is the last vaccine that is incentivized by the program, is supposed to be received at age 9 months. As many children often receive the vaccine with a delay, we decided to include a buffer of 3 months for catch-up vaccines. Hence, we decided that a child had to be at least 12 months old to be included in the study. 44 To ensure the correct identification of children aged 12 to 16 months, enumerators conducted a detailed age verification process for all children reported to be under the age of two during the household listing. Enumerators first asked the child’s caregiver about the age of the child in months. They then proceeded to ask the caregiver about the child’s date of birth (caregivers could choose between the English and the Islamic calendar). In many cases, caregivers did not know the exact date of birth of their child. Enumerators used a calendar tool (which contained information on important events, such as religious or national holidays) to help the caregiver remember their child’s date of birth. At the end of the age verification process, the electronic survey automatically compared the information on the age in months and the date of birth provided by the caregiver. If the discrepancy between these two sources was more than 30 days, then the estimate reported as being more accurate by the caregiver was used to determine the child’s eligibility. 45 In 25 settlements, IDinsight accidentally surveyed too many or too few segments in a settlement. Where this occurred,
we used weights to correct for the over- or under-representation of these settlements in our analyses. In 95 settlements,
insecurity prevented surveying at endline. This occurred for 52 settlements in treatment and 43 in control. In control, 27 of
these settlements were in four catchments that could not be surveyed at all due to insecurity. In treatment, the missing
settlements all come from partially surveyed catchment areas. In total, we surveyed 1,877 settlements so these issues
affected a relatively small proportion of our sample.
Final Evaluation Report
page 18
the study by first identifying children under two years of age followed by a detailed age
verification process for those children.
• Routine Immunization (RI) Survey: Collected vaccination information (as reported by the
child’s caregiver and recorded on any child-health records kept at home) and other health-
related outcomes for all children aged 12 to 16 months identified in the household listing.46
• Clinic Staff Survey: Collected information on clinic operations (e.g., number of routine
immunization days per month, monitoring data protocol, number of staff employed, etc.)
from clinic staff.
• Clinic Tally Sheets Survey: Collected monthly vaccination counts kept at clinics in “tally
sheets.”47
• Clinic Record Verification: Checked for vaccination records for all children encountered
during the RI survey by name in clinic immunization registers (CIR), and recorded which
vaccinations children received according to these registers.48 This occurred at study clinics and
at select non-study clinics to which many caregivers reported taking their children for
vaccinations.
Appendix B defines the indicators and covariates collected via these instruments.
Informed consent process. Informed consent was obtained at the community and individual level for
the household surveys. When first arriving in a community, enumerators asked the community leader
for permission to survey in the community. In addition, written consent was obtained separately from
the household listing respondent and from the Routine Immunization survey respondent (usually the
child’s caregiver) at the start of each respective survey. If the respondent was illiterate, a thumbprint
was taken instead. If the respondent refused, the enumerator went to the next household.
Consent was obtained at the health facility level from the facility manager to collect administrative
data from clinic records. For the clinic staff survey, written consent was obtained from the respondent
(usually either the Officer in Charge or the Routine Immunization Focal Person) before the interview.
Field work. Endline field data collection took place from December 2019 to February 2020. The local
research partner, Hanovia Limited,49 provided a team of roughly 175 enumerators, supervisors, back-
46 Whenever possible, the household listing and RI survey occurred on the same visit. In cases where the child’s primary
caregiver was not available, enumerators returned later to re-attempt the RI survey. 47 At midline, tally-sheet data was collected for the period March 2017-February 2019. At endline, tally-sheet data was
collected for the period March 2019-December 2019 (December data is excluded from this analysis since the survey took
place in many clinics during December). Data was collected in 175 clinics at midline and 160 clinics at endline. This includes
all clinics that were reachable and maintained records. The total 175 clinics includes 167 evaluation clinics and eight
complementary clinics. Greater security challenges at endline prevented data collection in some clinics that had been
reachable at midline. 48 This is a change from baseline. At baseline, enumerators only searched for records of children whose caregivers reported a vaccination or who had a BCG vaccine scar. We did this in order to use CIRs to also cross-check cases where caregivers did not report any vaccinations. 49 Hanovia also conducted the baseline data collection.

Final Evaluation Report
page 19
checkers, and support/supervisory personnel to administer all of the above survey instruments across
the study area.
Prior to data collection, IDinsight and Hanovia conducted two weeks of training and several days of
field practice. During data collection, Hanovia and IDinsight conducted backchecks, spotchecks, audio
audits, high-frequency checks, and GPS reviews to monitor and ensure data quality. IDinsight engaged
a team of seven Nigerian field managers, whom we independently managed to provide additional
supervision and data quality assurance (backchecks, spotchecks, audio audits, etc.). Additional details
on our data quality measures are in Appendix C.
Statistical Analysis
For our primary analyses, we used ordinary least squares (OLS) to estimate the probability of an
individual child having a positive self (caregiver) report for a given vaccination. This method provides
easily interpretable results: the coefficient on a variable indicating whether a given child lived in a
treatment catchment or not is the impact estimate; it tells us the change in the probability of positive
vaccination attributable to being in the treatment group. This is equivalent to the increase in coverage
caused by being in treatment (since the average probability of vaccination across the sample is the
same as coverage in the sample). If we only include the treatment variable and an error term in the
OLS regression, this coefficient is also equal to the difference between coverage in treatment areas
and coverage in control areas (difference-in-proportions). For our primary specifications, however,
we included a series of covariates to increase precision. These are defined in detail in Appendix B.
For the primary (child-level) analyses we estimated the below regression specification:50, 51
𝒀𝒊𝒋 = 𝛽0 + 𝛽1 ∗ 𝑇𝑗 + 𝛽2 ∗ 𝐵𝑗 + 𝛽′ ∗ 𝑃𝑖𝑗 + 𝛽′ ∗ 𝛼𝑗+ 𝛽′ ∗ 𝑆𝑗 + 𝜀𝑖𝑗
• 𝑌𝑖𝑗 is the endline vaccination status of eligible infant i in clinic cluster j. We estimated this
regression for each child-level vaccination outcome.
• 𝑇𝑗 is the treatment status of clinic cluster j which includes infant i.
• 𝐵𝑗 is the baseline coverage rate for the outcome among 12 to 16-month olds for clinic cluster j.
For Jigawa State, this variable takes the value of 0 with the variation taken by the state dummy.
• 𝑃𝑖𝑗 is a vector of individual and clinic level covariates. See Appendix B for details on the variables
included.
• 𝛼𝑗 is a vector of randomization strata dummies
• 𝑆𝑗 is a vector of state dummies
• 𝜀𝑖𝑗 is the error term for infant i in catchment j clustered at the clinic cluster-level52
50 See page 13 of the pre-analysis plan. 51 As a result of our sampling strategy – which used maps to randomly select 25% of the land area of each settlement – the
sample is largely self-weighted. Observations from a few settlements (N=210) had to be reweighted as either more than or
less than 25% of the land area was selected for surveying (in most cases these were very small settlements for which IDinsight
could only draw 1 segment, which was surveyed completely). 52 Out of 167 clinics included in the study, ten clinics were randomized as pairs. Standard errors are clustered at the unit of
randomization, i.e. the clinic pair level.

Final Evaluation Report
page 20
There were a few missing values for most of the individual and clinic level covariates (see Appendix B
for more details). In order to avoid excluding these observations from the main specification, we used
the following approach: we coded the covariate as 0 when missing and included a dummy variable for
each covariate taking the value of 1 if the covariate is missing for an observation. We report a
regression excluding missing values as a robustness check (see the Section “Robustness to alternative
specifications”).
We also conducted various analyses using clinic-level administrative data – primarily tally sheets.
Appendix D reports the specifications used for this analysis.
We defined statistical significance as a p-value < 0.05. All statistical analyses were done using Stata 13
SE (College Station, TX, USA).
Ethical Review
This study received ethical approval from Nigeria’s National Health Research Ethics Committee,
Zamfara State Health Research Ethics Committee, Katsina State Health Research Ethics Committee,
and Jigawa State Primary Health Care Development Agency. The study’s pre-analysis plan is registered
at the Registry for International Development Impact Evaluations (RIDIE),53 ISRCTN,54 and
clinicaltrials.gov.55
Results
Endline data was collected between 1 December, 2019 and 19 February, 2020.
Evaluation Sample
We visited 41,987 households across 163 clinic catchment areas in Katsina, Zamfara, and Jigawa
States.56 Of these 41,987 households visited, 1,106 (2.6%) did not have an eligible respondent57 at the
time of the survey and 472 (1.1%) households refused to participate, leaving us with 40,409
completed household listing surveys.
53 https://ridie.3ieimpact.org/index.php?r=search/detailView&id=767 54 https://www.isrctn.com/ISRCTN10808433 55 https://clinicaltrials.gov/ct2/show/NCT03870061?term=conditional+cash&cond=immunization&draw=2&rank=3 56 Note that we ultimately could not survey four catchment areas at endline due to insecurity. 57 To be an eligible respondent for the household listing, a person had to meet the following two criteria:
1.) Be a household member (i.e. residing permanently in the household). 2.) Be knowledgeable about the people in the household (e.g. births, deaths, movement).
Enumerators were required to make up to three visits to a household to find an eligible respondent.

Final Evaluation Report
page 21
The household listing identified 5,438 12 to 16-month old children. Of these, 5,173 (95.1%) completed
the RI survey, while 53 (0.1%) refused, and for 212 (3.9%), we were unable to identify an eligible
respondent after three visits.58
Figure 3 shows the flow of households into the household listing sample and eligible children into the
RI survey sample.
Figure 3. Flowchart for Participant Inclusion
1Kairu PHC was excluded from the main analysis because it was not included in the baseline survey, and, therefore,
was missing data for this covariate.
58 To be an eligible respondent for the RI survey, a person had to be the child’s primary caregiver. If the child’s primary caregiver was not available during the enumerator’s first visit to a household, then the enumerator made up to two follow-up visits to the household. During these follow-up visits, the primary caregiver or the person taking the child to the clinic were eligible respondents. Regardless of the number of the visit, for the self-report vaccination section, enumerators asked for the person taking the child to the clinic to be present to support the primary caregiver in responding to the vaccination questions. In most cases, the primary caregiver and the person taking the child to the clinic were the same person.
• 472 refusals
• 1106 without eligible respondents
5,141 included in the main analysis
5,173 12 to 16-month olds
completed RI survey
5,438 12 to 16-month olds
identified for RI survey
40,409 households
completed household
41,987 households visited
for household listing
• 53 refusals
• 212 without eligible respondents
• 17 in households outside the
selected settlement
• 15 in Kairu PHC1
20,308 households with under-two-year olds for age
verification (25,362 under-two-year-olds)

Final Evaluation Report
page 22
Table 2 provides an overview of the evaluation sample.
Table 2. Evaluation Sample by State
Jigawa State
Katsina State
Zamfara State
Full Sample
Total number of household listings completed
16,078 13,755 10,576 40,409
Total number of RI surveys completed and included in analysis
2,214 1,671 1,271 5,156
Total number of clinics surveyed 61 66 36 163
Total number of settlements surveyed 870 494 381 1,745
Household Listing Sample
Average number of surveys per clinic 263.6 208.4 293.8 247.9
Median number of surveys per clinic 226.0 165.5 277.5 206.0
Minimum number of surveys per clinic 52 55 90 52
Maximum number of surveys per clinic 804 985 577 985
Routine Immunization Sample
Average number of surveys per clinic 36.3 25.3 35.3 31.6
Median number of surveys per clinic 31.0 20.5 32.0 28.0
Minimum number of surveys per clinic 6 1 9 1
Maximum number of surveys per clinic 86 138 94 138
Impact on Vaccination
Primary Outcomes
12 to 16-month olds in the catchment areas of NI-ABAE CCTs for RI Program clinics were statistically
significantly more likely to have received BCG vaccine, Penta 1 vaccine, and Measles 1 vaccine
compared to children in the catchment areas of control clinics. Figure 4 shows self-reported coverage
for the control and treatment groups by vaccine. Coverage of each of the primary outcome vaccines
among children in catchment areas of control clinics ranged from 54% [95% confidence interval, or CI:
48%, 61%] for Penta 1 vaccine to 63% [95% CI: 57%, 69%] for BCG vaccine. Coverage of each of these
vaccines among children in NI-ABAE CCTs for RI Program treatment clinics ranged from 75% [95% CI:
70%, 79%] for Measles 1 vaccine to 83% [95% CI: 79%, 86%] for BCG vaccine.

Final Evaluation Report
page 23
Figure 4. Coverage by Vaccine (Self-Reports, No Covariate Adjustments)
After adjusting for covariates, the treatment effect was largest for Penta 1 vaccine, with the
proportion of children having received Penta 1 vaccine in the treatment group being 21 percentage
points (95% CI: 16, 26, p-value < 0.001) higher than the proportion in the control group, 16 percentage
points (95% CI: 12, 21, p-value < 0.001) higher for BCG vaccine, and 14 percentage points (95% CI: 10,
18, p-value < 0.001) higher for Measles 1 vaccine.59 Table 3 reports these results in detail, showing
both unadjusted coverage in treatment and control and covariate-adjusted treatment effects from
the main regression specification.
Table 3. Primary Outcomes – Means and Multivariate Regression Results
Mean (95% CI) Difference (95% CI)
Outcome Control Treatment Adjusted OLS
Results P-value
Reported BCG vaccine 0.63 0.83 0.16 < 0.001
(0.57, 0.69) (0.79, 0.86) (0.12, 0.21)
Reported Penta 1 vaccine 0.54 0.78 0.21 < 0.001
(0.48, 0.61) (0.73, 0.82) (0.16, 0.26)
Reported Measles 1 vaccine 0.59 0.75 0.14 < 0.001
(0.54, 0.64) (0.70, 0.79) (0.10, 0.18)
Note 1: The treatment and control means are weighted for sampling probabilities but not adjusted for covariates. Adjusted OLS Results are the treatment coefficient from a multivariate regression controlling for the covariates listed in the methods section. Accordingly, the difference between treatment and control means is not equal to the treatment coefficient, though both results show substantial, positive impact. Note 2: The p-values shown have been adjusted for multiple hypothesis testing using the Bonferroni adjustment. All primary and secondary outcomes were included in the adjustment.
59 The treatment effect for Measles vaccine was likely smaller than the treatment effect for BCG and Penta 1 because of Measles vaccine campaigns that occurred in most evaluation clinics just before endline. This is explored further in the Supplementary Analysis section.
63% 54% 59%83% 78% 75%0%
10%
20%
30%
40%
50%
60%
70%
80%
90%
100%
BCG At least one Penta At least one Measles
Control Treatment 95% Confidence Interval

Final Evaluation Report
page 24
Primary Outcomes by State
Children living in treatment catchment areas had statistically significantly higher coverage of Penta
1 vaccine and Measles 1 vaccine compared to children living in the control area in each of the three
study states. The treatment effect was also statistically significant for BCG vaccine in Zamfara and
Katsina States. In each of the study states, the treatment effect was larger for Penta 1 vaccine than
for BCG vaccine. As shown in Table 4, after adjusting for covariates, 12- to 16-month olds in treatment
areas in Zamfara State and Katsina State were both about 25 percentage points more likely to have
received the BCG vaccine than children in control areas. In Jigawa State, the treatment effect was
substantially lower (6 percentage points; 95% CI: 0, 12; p-value = 0.061). Treatment effects in Zamfara
and Katsina States were even larger for any Penta vaccine. In Zamfara and Katsina States, the
treatment effect for Measles 1 vaccine was the smallest of the three primary vaccines, while it was
the largest in Jigawa State.
The treatment effect for BCG vaccine, Penta 1 vaccine, and Measles 1 vaccine was similar in Zamfara
and Katsina States. The treatment effect for BCG vaccine and Penta 1 vaccine was statistically
significantly smaller in Jigawa State than in Zamfara and Katsina States, while the treatment effect
for Measles 1 vaccine was similar across the three states. The difference in the treatment effects
between Zamfara State and Katsina State was never statistically significant. Zamfara State and Katsina
State’s treatment effects for BCG vaccine were 19 (p-value = 0.005) and 20 (p-value < 0.001)
percentage points higher than the treatment effect in Jigawa State. Both of these differences were
statistically significant. Similarly, the difference in the treatment effect on Penta 1 vaccine was 24 (p-
value < 0.001) between Zamfara State and Jigawa State and 18 (p-value < 0.001) between Katsina
State and Jigawa State. These differences were also statistically significant. Neither Zamfara State nor
Katsina State had a statistically significantly higher treatment effect for Measles 1 vaccine than Jigawa
State.
Figure 5. BCG Vaccine Coverage by Treatment Arm and State (Self-Reports, No Covariate
Adjustments)
43% 60% 78%68% 89% 86%0%
10%
20%
30%
40%
50%
60%
70%
80%
90%
100%
Zamfara Katsina Jigawa
Control Treatment 95% Confidence Interval

Final Evaluation Report
page 25
Figure 6. Penta 1 Vaccine Coverage by Treatment Arm and State (Self-Reports, No
Covariate Adjustments)
Figure 7. Measles 1 Vaccine Coverage by Treatment Arm and State (Self-Reports, No
Covariate Adjustments)
Coverage in the control group was highest in Jigawa State and lowest in Zamfara State for all
primary outcomes (BCG vaccine, Penta 1 vaccine, and Measles 1 vaccine), but coverage in the
treatment group was similar in Katsina State and Jigawa State. While treatment effects were similar
between Zamfara and Katsina States, control coverage was lower in Zamfara State than in Katsina
State for each of the primary outcomes. Zamfara State’s control coverage was 17 percentage points
lower than Katsina State’s for BCG vaccine, 24 percentage points lower for Penta 1 vaccine, and 22
percentage points lower for Measles 1 vaccine. While the treatment effects for BCG vaccine and Penta
1 vaccine were larger in Katsina State than Jigawa State, coverage in the treatment group was similar
between these two states: BCG vaccine coverage for the treatment group was 89% and 86% in Katsina
42% 64% 65%54% 81% 81%0%
10%
20%
30%
40%
50%
60%
70%
80%
90%
100%
Zamfara Katsina Jigawa
Control Treatment 95% Confidence Interval
29% 53% 71%59% 85% 83%0%
10%
20%
30%
40%
50%
60%
70%
80%
90%
100%
Zamfara Katsina Jigawa
Control Treatment 95% Confidence Interval

Final Evaluation Report
page 26
and Jigawa States, respectively, and coverage for Penta 1 vaccine was 85% and 83%, respectively.
Coverage of Measles 1 vaccine in both the treatment and the control groups was similar in Katsina
State and in Jigawa State. Tables 4 and 5 report impact estimates and differences by state. Complete
results are in Appendix E.
Table 4. Impact Estimates (Adjusted OLS) for Primary Outcomes by State
Outcome Zamfara
State P-value
Katsina State
P-value Jigawa State
P-value
Reported BCG vaccine
0.25 < 0.001 0.26 < 0.001 0.06 0.061 (0.14, 0.37) (0.20, 0.32)
(-0.00, 0.12)
Reported Penta 1 vaccine
0.33 < 0.001 0.28 < 0.001 0.10 0.005 (0.23, 0.44) (0.23, 0.33)
(0.03, 0.17)
Reported Measles 1 vaccine
0.16 < 0.001 0.15 < 0.001 0.13 < 0.001 (0.08, 0.24) (0.08, 0.21)
(0.08, 0.19)
Table 5. Differences in Impact on Primary Outcomes by State
Differences in impact estimate between states
Outcome Dif ZM-
KT P-
value Dif ZM-
JG P-value
Dif KT-JG
P-value
Reported BCG vaccine
-0.01 0.897 0.19 0.005 0.20 < 0.001
Reported Penta 1 vaccine
0.05 0.374 0.23 < 0.001 0.18 < 0.001
Reported Measles 1 vaccine
0.01 0.812 0.02 0.636 0.01 0.786
Note 1: Wald tests were performed to test whether the impact estimates for each individual state are significantly different from one another. All p-values shown are from the Wald test.
Overall, NI-ABAE’s CCTs for RI Program’s impact on vaccination coverage was higher in study states
with lower control coverage. The similar treatment coverage in Katsina and Jigawa States suggests
that there might be a ceiling to coverage. The self-reported estimates suggest this threshold lies
around 85% to 90%. While it is possible that this result stemmed from imperfect recall,60 it is more
likely that some communities or households face greater barriers to vaccination that a modest cash
incentive cannot fully overcome. These barriers could include the inaccessibility of vaccines as a result
60 If some caregivers of vaccinated children do not recall vaccines correctly, then this implies that self-reported coverage will be less than 100% even in a fully vaccinated population. See the section “Supplementary Analysis for GiveWell’s Cost-Effectiveness Model” for a more detailed discussion on how measurement error might affect coverage and impact estimates.

Final Evaluation Report
page 27
of remoteness or stock outs, a general mistrust of the safety or effectiveness of vaccines, or a lack of
belief in vaccination’s benefits.
Secondary Outcomes
Household-Level Coverage Outcomes
Children in treatment catchment areas were statistically significantly more likely to have received
PCV (Table 6). The average child in treatment catchment areas was 22 percentage points (95% CI: 18,
27, p-value < 0.001) more likely to have received at least one PCV than the average child in control
catchment areas. This effect was similar to that on Penta 1 vaccine (21 percentage point increase),
which we expect since these vaccines are administered at the same visits. As was the case at baseline,
the percentage of caregivers reporting at least one PCV was lower in both groups than the percentage
of caregivers reporting Penta 1 vaccine. PCV is a relatively new vaccine and seemed less salient to
mothers, based on field observations. Additionally, it is given in the right leg along with other vaccines
and so may be more easily confused, while Penta vaccine is the only vaccine administered in the left
leg. Accordingly, it is reasonable to suspect that better recall accounts for much of this difference in
self-reported coverage between Penta vaccine and PCV.
Table 6. Secondary Outcomes – Means and Multivariate Regression Results
Mean (95% CI) Difference (95% CI)
Outcome Control Treatment Adjusted
OLS Results P-
value
Reported at least one PCV 0.50 0.75 0.22 < 0.001
(0.43, 0.56) (0.70, 0.79) (0.18, 0.27)
Fully immunized (loose definition)
0.40 0.68 0.25 < 0.001 (0.35, 0.46) (0.63, 0.73) (0.21, 0.30)
Fully immunized (strict definition)
0.25 0.54 0.27 < 0.001 (0.21, 0.30) (0.49, 0.60) (0.23, 0.31)
Total number of vaccines received (no PCV)
2.46 3.63 1.06 < 0.001 (2.19, 2.72) (3.41, 3.85) (0.86, 1.25)
Total number of vaccines received (with PCV)
3.57 5.55 1.80 < 0.001 (3.14, 4.01) (5.20, 5.91) (1.48, 2.12)
Ever vaccinated 0.86 0.89 0.02 0.114
(0.82, 0.89) (0.86, 0.92) (-0.01, 0.06)
Has a BCG vaccine scar 0.41 0.66 0.22 < 0.001 (0.37, 0.46) (0.61, 0.71) (0.17, 0.26)
Note 1: The treatment and control means are weighted for sampling probabilities but not adjusted for covariates. Adjusted OLS Results are the treatment coefficient from a multivariate regression controlling for the covariates listed in the methods section. Accordingly, the difference between treatment and control means is not equal to the treatment coefficient, though both results show substantial, positive impact.
Note 2: The p-values shown have been adjusted for multiple hypothesis testing using the Bonferroni adjustment. All primary and secondary outcomes were included in the adjustment.

Final Evaluation Report
page 28
Children in treatment catchment areas were statistically significantly more likely to be fully
immunized. When using a loose definition of full vaccination (BCG vaccine, Penta 1 vaccine, Measles
1 vaccine), 12 to 16-month olds in treatment areas were 25 percentage points (95% CI: 21, 30, p-value
< 0.001) more likely to be fully immunized than 12 to 16-month olds in control areas. When using the
strict definition of full immunization (BCG vaccine, Penta vaccine 1-3, Measles 1 vaccine), the
likelihood of being fully immunized was 27 percentage points (95% CI: 23, 31, p-value < 0.001) higher
among children in the treatment areas.
Children in treatment catchment areas received statistically significantly more vaccine doses than those in control areas.61 When considering BCG vaccine, all Penta vaccinations, and all Measles vaccinations, 12 to 16-month olds in treatment areas reported receiving 1.06 more doses (95% CI: 0.86, 1.25, p-value < 0.001) compared to children in the control areas. When adding all PCV vaccinations, this difference was 1.8 doses (95% CI: 1.48, 2.12, p-value < 0.001). Children in treatment catchment areas were more likely to report having received at least one
injectable vaccination. The statistical significance of this outcome varies by the type of metric used.
During the RI survey, caregivers were explicitly asked whether their child had ever received an
injectable vaccination. When using this variable to determine whether a child had ever been
vaccinated (see Table 6), we found only a small difference between treatment and control. Caregivers
of 12 to 16-month olds in treatment were 2 percentage points more likely to report that their child
received an injectable vaccine [95% CI: -1, 6] and this difference was not significantly different from 0
(p-value = 0.114).
However, the magnitude and significance of these results changed if we used other indicators to
measure a child’s injectable vaccination status. Table 7 includes three additional variables which are
based on the caregiver’s answers to the individual vaccination questions. The first variable counts a
child as having received an injectable vaccination if the caregiver responded with “Yes” to at least one
of the injectable vaccination questions included in the RI survey.62 Impact increased to 6 percentage
points and became statistically significant (95% CI: 3, 10, p-value < 0.001). This suggests that some
caregivers might have confused the non-injectable OPV vaccine, or possibly medical treatments
involving an injection (e.g. malaria treatment), with injectable vaccinations when answering our
survey question.63 The impact estimate increased to up to 13 percentage points (95% CI: 9, 18, p-value
< 0.001) if we excluded vaccines that are often received via campaigns (Measles vaccine, Yellow Fever
vaccine, inactivated Polio vaccine or IPV).64 Children that only received one or more of these three
61 The vaccine dose count included BCG vaccine, Penta 1-3 vaccines, and Measles 1 vaccine. Hence, children could receive a maximum of 5 vaccine doses according to this indicator. The second indicator also included PCV 1-3 allowing for a maximum of 8 vaccine doses. 62 In the RI survey, caregivers were asked if their child had received the following injectable vaccinations: BCG vaccine, Hepatitis B vaccine, Penta vaccine 1-3, PCV vaccine 1-3, IPV, At least one Measles-2 vaccine, and Yellow Fever vaccine. 63 It is also possible that some children had received injectable vaccinations about which we did not ask caregivers explicitly in the RI survey. Two injectable vaccinations which were not included in the RI survey but might have been received by some children are: (1) the fractional IPV (fIPV) vaccination, and (2) the Meningitis vaccination (MenA). Based on the reports of our field teams, and the vaccination card data, we know that fIPV and MenA campaigns were carried out in large parts of our study area. As these vaccines should usually have been given out during campaigns, this would still imply that these children did not receive any injectable vaccinations as part of regular RI activities. 64 The majority of study clinics had campaigns shortly before endline. More details are included in the Supplementary Analysis section.

Final Evaluation Report
page 29
vaccines have likely never interacted with the Nigerian RI system, and would not have received any
injectable vaccinations in the absence of campaigns. This allows us to better estimate the additional
share of children whose caregivers decided to take their children for RI vaccinations as a result of the
NI-ABAE CCTs for RI Program.
Overall, these results suggest that the NI-ABAE CCTs for RI Program does motivate caregivers to start
the RI schedule who otherwise would not have. However, a larger part of the program’s impact seems
to be driven by motivating caregivers who start the RI schedule to continue and complete the full
schedule.
Table 7. Alternate Ever-Vaccinated Definitions
Mean (95% CI) Difference (95% CI)
Outcome Control Treatment Adjusted
OLS Results
P-value
Child received at least one injectable vaccine
0.79 0.87 0.06 < 0.001 (0.74, 0.83) (0.83, 0.90) (0.03, 0.10)
Child received at least one injectable vaccine (excluding Measles vaccine)
0.73 0.85 0.10 < 0.001 (0.68, 0.78) (0.82, 0.89) (0.06, 0.14)
Child received at least one injectable vaccine (excluding IPV, Yellow Fever vaccine, and Measles vaccine)
0.68 0.84 0.13 < 0.001 (0.62, 0.74) (0.81, 0.88) (0.09, 0.18)
Note 1: The treatment and control means are weighted for sampling probabilities but not adjusted for covariates. Adjusted OLS Results are the treatment coefficient from a multivariate regression controlling for the covariates listed in the methods section. Accordingly, the difference between treatment and control means is not equal to the treatment coefficient, though both results show substantial, positive impact.
Note 2: The p-values shown have not been adjusted for multiple hypothesis testing.
Household-Level Timeliness Outcomes
Children in the treatment group were slightly less likely to receive BCG vaccine within one month
of birth. This difference was not statistically significant.65 Children in the treatment group were six
percentage points (95% CI: -13, 1; p-value = 0.08) less likely to have received BCG vaccine within one
month of birth compared to those in the control group. This is likely because those who receive BCG
vaccine in the absence of the incentive are those who deliver in a health facility or otherwise interact
65 As outlined in the pre-analysis plan, this analysis was restricted to those children with the vaccination recorded on a vaccination card (CHC or other card, such as a campaign card). We used the date of vaccination and the date of birth from the card. We also ran a robustness check using caregivers’ reports of their child’s age at vaccination (which were available for nearly all children with a positive self-report for a given vaccine) instead of card data. The results confirmed the findings from the card data based analysis presented in this section. We decided to use the card data based analysis as our main specification as we had two major concerns about the quality of the self-reported data on age at vaccination. Firstly, the recommended age of vaccination was included in our questions as a recall aid when asking for caregivers to self-report whether the child had received a given vaccine or not. Secondly, we were worried about differential recall of the age at vaccination in treatment and control as the program might have improved treatment caregivers’ recall.

Final Evaluation Report
page 30
with the healthcare system close to birth. Those who are induced by the incentive to receive BCG
vaccine are likely those who do not interact with the healthcare system at birth.
Children in the treatment group were statistically significantly more likely to have received the first
dose of Penta vaccine within two weeks of the recommended age, but not statistically significantly
more likely to have received it within one month of the recommended age. Timely vaccination using
a two-week cutoff was 9 percentage points (95% CI: 3, 16; p-value = 0.007) higher in the treatment
group than in the control group. Timely vaccination using a one-month cutoff was 4 percentage points
(95% CI: -2, 9; p-value = 0.24) higher in the treatment group than the control group.
The incentive had the largest impact on the timeliness of the Measles 1 vaccine. Children in the
treatment group who received the Measles 1 vaccine were 33 percentage points (95% CI: 28, 38; p-
value < 0.001) more likely to have received the vaccination within one month of the recommended
age (9 months) compared to those who received the Measles 1 vaccine in the control group. Measles
1 vaccinations were also more likely to be timely in the treatment group than in the control group
when using a cutoff of within 2 weeks of the recommended age.
Table 8. Vaccination Timeliness Outcomes – Means and Multivariate Regression Results
Mean (95% CI) Difference (95% CI)
Outcome Control Treatment Adjusted
OLS Results
P-value
Timely BCG vaccine (within 1 month after birth)
0.66 0.62 -0.06 0.079 (0.59, 0.72) (0.56, 0.67) (-0.13, 0.01)
Timely BCG vaccine (within 2 weeks after birth)
0.22 0.17 -0.05 0.091 (0.17, 0.28) (0.13, 0.21) (-0.11, 0.01)
Timely Penta 1 vaccine (+/- 1 month)
0.68 0.72 0.04 0.239 (0.63, 0.73) (0.67, 0.78) (-0.02, 0.09)
Timely Penta 1 vaccine (+/- 2 weeks)
0.49 0.58 0.09 0.007 (0.43, 0.55) (0.53, 0.63) (0.03, 0.16)
Timely Measles 1 vaccine (+/- 1 month)
0.53 0.86 0.33 < 0.001 (0.48, 0.58) (0.84, 0.87) (0.28, 0.38)
Timely Measles 1 vaccine (+/- 2 weeks)
0.29 0.69 0.39 < 0.001 (0.25, 0.33) (0.67, 0.72) (0.35, 0.44)
Note 1: The treatment and control means are weighted for sampling probabilities but not adjusted for covariates. Adjusted OLS Results are the treatment coefficient from a multivariate regression controlling for the covariates listed in the methods section. Accordingly, the difference between treatment and control means is not equal to the treatment coefficient.
Note 2: The p-values shown have not been adjusted for multiple hypothesis testing.
Clinic-level Vaccination Volumes
Vaccination volumes recorded at clinics have experienced statistically significantly larger increases
since baseline in treatment clinics than in control clinics. Using clinic tally sheets (which count
vaccination doses given at each clinic by vaccine and by month), we found that the average increase
in monthly BCG vaccine doses administered between baseline and endline was 17.6 (95% CI: 9.1, 26.2,

Final Evaluation Report
page 31
p-value < 0.001) doses greater in treatment clinics than control clinics. For Penta 1, the difference was
34.4 (95% CI: 23.9, 44.9, p-value < 0.001), and for Measles vaccine, it was 32.3 (95% CI: 23.2, 41.3, p-
value < 0.001). Figure 8 illustrates this these differences while Appendix F reports numeric results.
NI-ABAE was not operating in the study clinics in months prior to Oct 2017 and was fully operational
in all study clinics by July 2018, the beginning of the RCT window.
Figure 8. Clinic Tally Sheets Results66
Note: For each of the graphs, the x-axis represents individual months and the y-axis represents the average
number of distributed vaccines (as recorded) per clinic in each month. The blue line represents the control group,
while the red line represents the treatment group. The vertical red lines represent the start and end of the program
ramp-up phase.
The large differences observed in Figure 8 likely reflect a combination of the NI-ABAE CCTs for RI
Program’s influence on both actual immunization volumes and the quality of clinics’ record-keeping.67
However, the data shows changes in volume so large that we are confident they include meaningful
66 Midline analyzed OPV0. This figure maintains OPV0 for consistency with midline, though endline does not analyze OPV0 in any detail. It is important to note that we would not expect OPV0 and BCG vaccine to have similar volumes as OPV0 is subject to stricter age restrictions – infants receiving catch-up BCG vaccine at older ages will not receive OPV0. At Midline, we found that treatment clinics had similar volumes for other coinciding vaccines as for vaccines for which NI-ABAE pays incentives directly, which is consistent with other results in this report (see Yellow Fever vaccine, for example). 67 It is likely that the presence of NI-ABAE staff in treatment clinics led to better record keeping by clinic staff since clinic staff would administer vaccines and then refer the caregiver to the NI-ABAE staff member for the correlating incentive.

Final Evaluation Report
page 32
impact on actual vaccination volumes, consistent with the positive impact estimates from the
household survey.68, 69
Secondary Outcomes by State
For secondary outcomes, we also found that the treatment effect of the NI-ABAE CCTs for RI
Program was usually higher in Zamfara State and Katsina State than in Jigawa State, and that these
differences were largely statistically significant. Tables 9 and 10 below show the results for secondary
outcomes by state.
Table 9. Impact Estimates (Adjusted OLS) for Secondary Outcomes by State
Outcome Zamfara
State P-value
Katsina State
P-value Jigawa State P-value
Reported at least one PCV
0.35 < 0.001 0.29 < 0.001 0.11 0.002 (0.26, 0.44) (0.24, 0.35)
(0.04, 0.19)
Fully immunized (loose definition)
0.30 < 0.001 0.31 < 0.001 0.19 < 0.001 (0.22, 0.38) (0.25, 0.37)
(0.12, 0.27)
Fully immunized (strict definition)
0.30 < 0.001 0.31 < 0.001 0.24 < 0.001 (0.23, 0.36) (0.24, 0.38)
(0.16, 0.31)
Total number of vaccines received (no PCV)
1.41 < 0.001 1.37 < 0.001 0.68 < 0.001 (1.00, 1.81) (1.10, 1.63)
(0.36, 1.00)
Total number of vaccines received (with PCV)
2.38 < 0.001 2.32 < 0.001 1.17 < 0.001 (1.78, 2.97) (1.89, 2.75)
(0.62, 1.71)
Ever vaccinated 0.07 0.189 0.04 0.028 -0.01 0.724
(-0.03, 0.16) (0.00, 0.08)
(-0.04, 0.03)
Has a BCG vaccine scar
0.20 < 0.001 0.26 < 0.001 0.20 < 0.001 (0.10, 0.31) (0.20, 0.32)
(0.12, 0.27)
68 Note that there is a clear spike in treatment vaccination counts for most vaccines during the ramp-up period. Leading
explanations relate to catch-up vaccinations given to children who were not vaccinated at the recommended age prior to
program ramp-up and came in for vaccination at older ages once the program began. 69 Tally sheets are not directly comparable to the household-level coverage estimates, even if these estimates are converted from coverage into volumes. Tally sheets include a larger population than our coverage survey since they also reflect vaccinations given to infants from outside a clinic’s catchment area and children of all ages eligible for each vaccine. By contrast, the household survey included children between 12 and 16 months of age who lived in official catchment areas. Nevertheless, like household data, tally sheets record a substantial positive impact of the program, corroborating the general, directional results.

Final Evaluation Report
page 33
Table 10. Differences in Impact on Secondary Outcomes by State
Outcome Dif ZM-KT P-value Dif ZM-JG P-value Dif KT-JG P-value
Reported at least one PCV
0.06 0.262 0.23 < 0.001 0.18 < 0.001
Fully immunized (loose definition)
-0.01 0.855 0.11 0.057 0.12 0.017
Fully immunized (strict definition)
-0.01 0.879 0.06 0.227 0.07 0.188
Total number of vaccines received (no PCV)
0.04 0.865 0.73 0.007 0.69 0.002
Total number of vaccines received (with PCV)
0.06 0.871 1.21 0.004 1.15 0.002
Ever vaccinated 0.03 0.628 0.07 0.184 0.05 0.082
Has a BCG vaccine scar -0.05 0.384 0.01 0.894 0.06 0.213
Note 1: ZM = Zamfara State; JG = Jigawa State; KT = Katsina State Note 2: Wald tests were performed to test whether the impact estimates for each individual state are significantly different from one another. All p-values shown are from the Wald test.
The program’s treatment effect on the percentage of children that received at least one injectable
vaccination was larger in Zamfara State and Katsina State than in Jigawa State. The magnitude and
statistical significance of this difference varied based on the metric that was used. The effect of the
program on our main “Ever vaccinated” outcome measure was modest across the three states, and
state differences were not statistically significant. The effect of the program on the percentage of
caregivers who answered “yes” to at least one of the individual vaccine questions was statistically
significantly higher in Zamfara and Katsina States than in Jigawa State. In Zamfara State, children in
treatment areas were 16 percentage points (95% CI: 5, 26; p-value = 0.003) more likely to have
received at least one injectable vaccine than children in control areas. Impact estimates in Zamfara
State and Katsina State are even higher for the other two alternative “Ever vaccinated” outcome
measures. These findings suggest that the program successfully motivated caregivers to start the RI
schedule in contexts where there is still a large number of children not receiving any injectable vaccine
during regular RI activities, and hence substantial room for improvement.
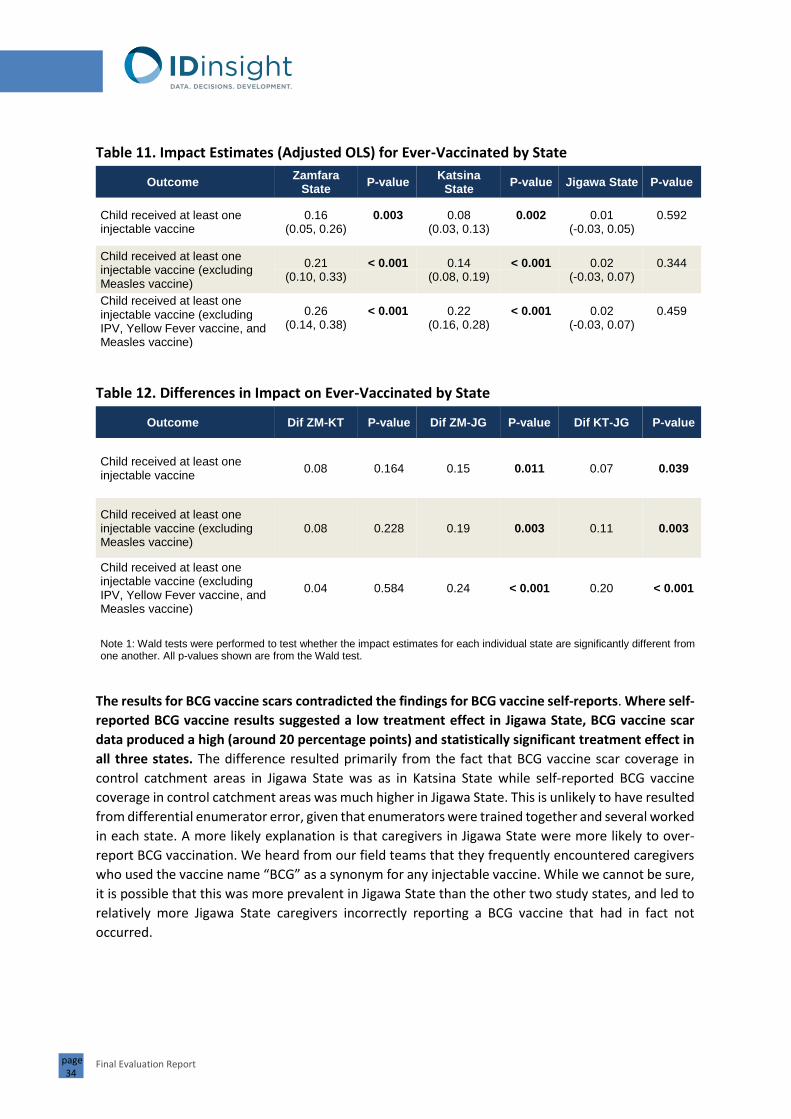
Final Evaluation Report
page 34
Table 11. Impact Estimates (Adjusted OLS) for Ever-Vaccinated by State
Outcome Zamfara
State P-value
Katsina State
P-value Jigawa State P-value
Child received at least one injectable vaccine
0.16 0.003 0.08 0.002 0.01 0.592 (0.05, 0.26) (0.03, 0.13)
(-0.03, 0.05)
Child received at least one injectable vaccine (excluding Measles vaccine)
0.21 < 0.001 0.14 < 0.001 0.02 0.344 (0.10, 0.33) (0.08, 0.19)
(-0.03, 0.07)
Child received at least one injectable vaccine (excluding IPV, Yellow Fever vaccine, and Measles vaccine)
0.26 < 0.001 0.22 < 0.001 0.02 0.459 (0.14, 0.38) (0.16, 0.28)
(-0.03, 0.07)
Table 12. Differences in Impact on Ever-Vaccinated by State
Outcome Dif ZM-KT P-value Dif ZM-JG P-value Dif KT-JG P-value
Child received at least one injectable vaccine
0.08 0.164 0.15 0.011 0.07 0.039
Child received at least one injectable vaccine (excluding Measles vaccine)
0.08 0.228 0.19 0.003 0.11 0.003
Child received at least one injectable vaccine (excluding IPV, Yellow Fever vaccine, and Measles vaccine)
0.04 0.584 0.24 < 0.001 0.20 < 0.001
Note 1: Wald tests were performed to test whether the impact estimates for each individual state are significantly different from one another. All p-values shown are from the Wald test.
The results for BCG vaccine scars contradicted the findings for BCG vaccine self-reports. Where self-
reported BCG vaccine results suggested a low treatment effect in Jigawa State, BCG vaccine scar
data produced a high (around 20 percentage points) and statistically significant treatment effect in
all three states. The difference resulted primarily from the fact that BCG vaccine scar coverage in
control catchment areas in Jigawa State was as in Katsina State while self-reported BCG vaccine
coverage in control catchment areas was much higher in Jigawa State. This is unlikely to have resulted
from differential enumerator error, given that enumerators were trained together and several worked
in each state. A more likely explanation is that caregivers in Jigawa State were more likely to over-
report BCG vaccination. We heard from our field teams that they frequently encountered caregivers
who used the vaccine name “BCG” as a synonym for any injectable vaccine. While we cannot be sure,
it is possible that this was more prevalent in Jigawa State than the other two study states, and led to
relatively more Jigawa State caregivers incorrectly reporting a BCG vaccine that had in fact not
occurred.

Final Evaluation Report
page 35
Impact on Additional Outcomes
Additional Vaccine and Other Health-Service Outcomes
In addition to the primary and secondary outcomes, we also looked at the second and third doses of
Penta vaccine as well as the second and third doses of PCV.70 We also looked at vaccines that are not
directly incentivized by the NI-ABAE CCTs for RI Program (birth dose of Hepatitis B vaccine or HepB,
IPV, and Yellow Fever vaccine). Finally, since the NI-ABAE CCTs for RI Program may generally increase
health service utilization or increase uptake of additional interventions during immunization visits, we
also looked at the non-injectable vaccine outcomes receipt of oral polio vaccine (OPV), at least one
dose of vitamin A, and first-time clinics visits.
The NI-ABAE CCTs for RI Program had a significant positive effect on vaccination coverage for all
major injectable vaccines included in the Nigerian Routine Immunization schedule – including those
vaccines which are not directly incentivized by the program.71 Children in treatment areas were 27
percentage points (95% CI: 23, 32; p-value < 0.001) more likely to have received three Penta
vaccinations, and 25 percentage points (95% CI: 20, 29; p-value < 0.001) more likely to have received
three PCV vaccinations than children in control areas. These impact estimates are higher than for
Penta 1 vaccine. It is likely that this is the result of two effects. First, the program seems to be
particularly effective at ensuring that caregivers complete the full immunization schedule. Second, it
is also likely that caregivers in treatment are better at recalling their second/third Penta/PCV
vaccinations than caregivers in control as the incentive has made the receipt of the vaccine more
memorable.72
Children in treatment areas were statistically significantly more likely than those in control areas to
have received the birth dose of HepB vaccine, IPV, and the Yellow Fever vaccine – three vaccines that
are not directly incentivized by the program but are usually given at the same time as incentivized
vaccines. Children in treatment areas were 16 percentage points (95% CI: 11, 21) more likely to have
received the first Hep B vaccine than children in control areas. This is similar to the impact found for
BCG vaccine, which is also given at birth. IPV is typically given at the same time as Penta vaccine and
PCV 3, but the impact estimate for IPV was lower than for Penta 3 vaccine / PCV3, the co-occurring
incentivized vaccines. This difference could result from poorer recall of IPV; it is administered in the
same leg as PCV so these may be difficult to differentiate. The impact estimate for the Yellow Fever
vaccine was 18 percentage points, and thereby a few percentage points higher than the impact
estimate for Measles 1 vaccine. According to the Routine Immunization schedule, both vaccines
should be administered at the age of 9 months. As we explain in more detail in the section
“Supplementary Analysis for GiveWell’s Cost-Effectiveness Model”, the lower impact estimate for
Measles vaccine than for the other directly incentivized vaccines is likely the result of a large-scale
70 These vaccines were not included as separate primary or secondary outcomes because of concerns that they would be more subject to recall error than the other vaccines. Penta 2 and Penta 3 vaccines were included in the strict definition of “full vaccination”. Both Penta vaccine and PCV 2 and 3 were included in the number of vaccines given. 71 NI-ABAE provides incentives during the routine immunization visits where HepB0, IPV, OPV, and Yellow Fever vaccine are administered. However, these vaccinations are not part of the minimum required vaccines that are required for the incentives to be disbursed. 72 Accordingly, we should not assume that the full difference in effect size between any Penta vaccine and subsequent doses of Penta vaccine is due to real impact on coverage, though the precise size of true impact versus differential measurement error is unclear.

Final Evaluation Report
page 36
Measles vaccine campaign which was conducted by Nigerian authorities and international partners
during November and December 2019.
Table 13. Additional Outcomes, Means and Multivariate Regression Results
Mean (95% CI) Difference (95% CI)
Outcome Control Treatment Adjusted OLS
Results P-value
Reported HepB vaccine 0.49 0.69 0.16 < 0.001
(0.43, 0.56) (0.64, 0.74) (0.11, 0.21)
Reported Penta2 vaccine 0.40 0.69 0.27 < 0.001
(0.34, 0.46) (0.64, 0.74) (0.22, 0.31)
Reported PVC2 vaccine 0.36 0.65 0.27 < 0.001
(0.30, 0.41) (0.60, 0.70) (0.23, 0.32)
Reported Penta3 vaccine 0.30 0.59 0.27 < 0.001
(0.24, 0.35) (0.54, 0.65) (0.23, 0.32)
Reported PCV3 vaccine 0.27 0.53 0.25 < 0.001
(0.22, 0.32) (0.48, 0.58) (0.20, 0.29)
Reported IPV 0.23 0.42 0.18 < 0.001
(0.19, 0.27) (0.37, 0.46) (0.14, 0.22)
Reported Yellow Fever vaccine 0.40 0.58 0.18 < 0.001
(0.36, 0.44) (0.53, 0.63) (0.13, 0.22)
Reported at least one OPV 0.96 0.97 0.01 0.498
(0.95, 0.98) (0.96, 0.98) (-0.01, 0.02)
Reported at least four OPV 0.56 0.65 0.08 < 0.001
(0.52, 0.61) (0.61, 0.69) (0.04, 0.13)
Received at least one VitaminA dose
0.56 0.60 0.00 0.833 (0.50, 0.63) (0.53, 0.66) (-0.04, 0.04)
Ever visited clinic 0.87 0.93 0.05 < 0.001
(0.84, 0.91) (0.91, 0.94) (0.03, 0.08)
Note 1: The treatment and control means are weighted for sampling probabilities but not adjusted for covariates. Adjusted OLS Results are the treatment coefficient from a multivariate regression controlling for the covariates listed in the methods section. Accordingly, the difference between treatment and control means is not equal to the treatment coefficient.
Note 2: The p-values shown have not been adjusted for multiple hypothesis testing.
Note 3: The outcome 'Ever visited clinic' was measured by asking the child's caregiver whether the child had ever been taken to a clinic (for any reason; including vaccinations).
Children in treatment areas were statistically significantly more likely to have received the full
schedule of four OPV vaccines than children in control areas but not more likely to have received
at least one dose of OPV. Nearly all children in our sample (96% in control, and 97% in treatment)
were reported to have received at least one OPV vaccine, so it is unsurprising that the treatment

Final Evaluation Report
page 37
effect was close to zero.73 Coverage of the full course of OPV (four doses) was lower, so there was
more room for improvement in the treatment group. Children in treatment areas were 8 percentage
points (95% CI: 4, 13; p-value < 0.001) more likely to have received at least four doses of OPV.
The program did not have a statistically significant effect on whether the caregiver reported that
their child had received at least one Vitamin A dose. While the share of children with at least one
reported Vitamin A dose is higher in the treatment group, the treatment effect is equal to 0 after
adjusting for covariates.74
The program did have a modest but statistically significant effect on first time clinic visits. Children
in treatment areas were 5 percentage points (95% CI: 3, 8; p-value < 0.001) more likely to have ever
been taken to a clinic than children in control areas.
Knowledge and Attitudes Toward Vaccines
The NI-ABAE CCTs for RI Program had a statistically significant positive effect on respondents’
knowledge of vaccines and the vaccination schedule.75 Respondents in treatment areas were 7
percentage points (95% CI: 2, 12; p-value = 0.005) more likely to report that they knew where to get
their child vaccinated than respondents in control areas. Furthermore, respondents were 6
percentage points (95% CI: 1, 12; p-value = 0.022) more likely to report that they knew at what ages
children should receive vaccines. This was subsequently confirmed by asking caregivers questions to
check their actual knowledge.76 Respondents in treatment were 7 percentage points more likely to
correctly identify the age at which a child should receive the first vaccine, and 5 percentage points
more likely to correctly answer with what age the child should receive the Measles vaccine.
Furthermore, respondents in treatment were 15 percentage points (95% CI: 11, 19; p-value < 0.001)
more likely to know how many times a child should be taken to the clinic for vaccinations before the
child reached the age of one year. This seems logical given that NI-ABAE’s advertisement focuses
heavily on reminding caregivers of the five visits they should make to the clinic. While caregivers in
the treatment group had better knowledge of vaccines and the vaccine schedule, these differences
73 The high coverage of OPV is likely because of oral polio campaign efforts in the study states. 74 One possible explanation for this finding could be that Vitamin A supplements should usually be given at ages 6 months and 12 months, which do not coincide with the receipt of any of the vaccines that are conditions for incentive payments. 75 The data shown in Table 14 was collected as part of the survey’s household listing module. We decided prior to data collection that it would be potentially harmful to the quality of the main results of our study if these questions were included in the Routine Immunization survey which we conducted with caregivers of eligible children. Instead, we asked these knowledge questions to household listing respondents in households without eligible children but at least one child aged 5 to 11 months. In treatment communities, these households should also have been exposed to the NI-ABAE CCTs for RI Program as the program had been continuously operating in treatment communities. In total, responses from 7186 respondents were included. 76 In order to protect the comfort and dignity of the respondents, only respondents who said that they knew at what ages children are supposed to get vaccines were asked the more detailed knowledge questions on first time vaccines and the Measles vaccines. The same approach was used for the questions on the number of times a child should receive vaccines. Responses from respondents who had already said “No” to the initial question that they did not know were coded as “No” for the more detailed knowledge questions. For example, 32% of respondents in control areas said that they knew at what ages children were supposed to get vaccines. These 32% of respondents were then subsequently asked about the age at which a child should receive their first injectable vaccine. 53% of these respondents provided the correct answer (at birth / as soon as possible after birth). Responses from the 68% of respondents who said in the first place that they did not know were coded as “No” leading to a total of 17% (32% * 0.53) of respondents to have responded with the correct answer.

Final Evaluation Report
page 38
were more modest than the differences in actual coverage. This suggests that the NI-ABAE CCTs for
RI Program does more than improving caregiver knowledge about the timing of vaccines; more
importantly, it results in greater action to actually take one’s child for vaccination.
Table 14. Knowledge Outcomes - Means and Multivariate Regression Results
Mean (95% CI) Difference (95% CI)
Outcome Control Treatment Adjusted OLS
Results P-value
Reportedly knows where to get vaccines for the child
0.71 0.77 0.07 0.005 (0.67, 0.75) (0.73, 0.81) (0.02, 0.12)
Reportedly knows at what ages children are supposed to get vaccines
0.32 0.37 0.06 0.022 (0.28, 0.37) (0.31, 0.42) (0.01, 0.12)
Correctly knew at what age a child should receive the first injectable vaccine
0.17 0.23 0.07 0.001 (0.14, 0.21) (0.19, 0.27) (0.03, 0.12)
Correctly knew at what age a child should receive the Measles
vaccine
0.09 0.14 0.05 0.003 (0.07, 0.12) (0.11, 0.18) (0.02, 0.09)
Reportedly knows how many times children should get vaccines
0.25 0.38 0.14 < 0.001 (0.21, 0.29) (0.32, 0.43) (0.09, 0.19)
Correctly knew how many times a child should be taken to the clinic for vaccinations before the age of one
0.11 0.25 0.15 < 0.001 (0.09, 0.14) (0.21, 0.30) (0.11, 0.19)
Knew the answers to all questions listed above
0.03 0.07 0.05 < 0.001 (0.02, 0.04) (0.05, 0.09) (0.03, 0.07)
Did not know any of the answers to the questions listed above
0.27 0.22 -0.07 0.003 (0.23, 0.31) (0.18, 0.25) (-0.11, -0.02)
Note 1: The treatment and control means are weighted for sampling probabilities but not adjusted for covariates. Adjusted OLS Results are the treatment coefficient from a multivariate regression controlling for the covariates listed in the methods section. Accordingly, the difference between treatment and control means is not equal to the treatment coefficient.
Note 2: For the knowledge questions, the following answers by caregivers were counted as correct (based on the Nigerian Routine Immunization schedule): (1) Age at first vaccination: 'At birth, or as close as possible', (2) Age at Measles vaccine: '9 months after birth', (3) Number of times child should be taken to clinic for vaccinations: '5 times'.
The NI-ABAE CCTs for RI Program had some modest effects on caregivers’ attitudes towards
vaccines. Caregivers in treatment were slightly more likely to say that they thought that vaccines were
more beneficial than harmful for children. There were no statistically significant differences for a
question that asked caregivers whether they thought that it was a parent’s responsibility to ensure
that their child got vaccinated.

Final Evaluation Report
page 39
Caregivers in the treatment group were 3 percentage points less likely than caregivers in the control
group to report that it was difficult for their community to vaccinate their children. Caregivers in
treatment were also more likely to report that they had heard positive messages from local leaders.
Nearly no caregiver in both treatment and control areas reported that they had heard negative
messages about vaccines from local leaders.
These effects on attitudes likely reflect a lower bound of the effects that the NI-ABAE CCTs for RI
Program would have at scale. Firstly, NI-ABAE did less sensitization than they would at scale as they
were worried about attracting children from outside of treatment catchment areas to the program.
Secondly, all of the questions shown in table 15 likely suffer from substantial measurement error as a
result of respondents wanting to provide socially desirable answers. This measurement error likely
leads to a downward bias in our impact estimates.77
Table 15. Attitudes Outcomes – Means and Multivariate Regression Results
Mean (95% CI) Difference (95% CI)
Outcome Control Treatment Adjusted OLS
Results P-value
Thinks that vaccines are more beneficial than harmful for children
0.88 0.90 0.02 0.027 (0.86, 0.89) (0.88, 0.92) (0.00, 0.04)
Thinks that it is a parent's responsibility to ensure that their child gets vaccinated
0.79 0.81 0.03 0.185 (0.76, 0.83) (0.78, 0.85) (-0.01, 0.07)
Thinks that it is difficult for their community to vaccinate their children
0.08 0.05 -0.03 < 0.001 (0.07, 0.09) (0.04, 0.06) (-0.05, -0.01)
Has heard positive messages about vaccines from local leaders
0.68 0.72 0.05 0.008 (0.64, 0.72) (0.69, 0.74) (0.01, 0.09)
Has heard negative messages about vaccines from local leaders
0.01 0.01 0.00 0.786 (0.00, 0.01) (0.00, 0.01) (-0.00, 0.00)
Note 1: The treatment and control means are weighted for sampling probabilities but not adjusted for covariates. Adjusted OLS Results are the treatment coefficient from a multivariate regression controlling for the covariates listed in the methods section. Accordingly, the difference between treatment and control means is not equal to the treatment coefficient.
Vaccine Stockouts
The NI-ABAE CCTs for RI Program had a statistically significant impact on reducing the frequency of vaccine stockouts in clinics. Treatment clinics were 18 percentage points (95% CI: 6, 30; p-value = 0.004) more likely than control clinics to report that they had experienced no vaccine stockouts during the 12 months preceding the endline survey. Treatment clinics were also 16 percentage points (95% CI: 1, 30; p-value = 0.033) more likely to report that vaccine stockouts occurred rarely (twice per year or less). Only a very small number of clinics in both the treatment and the control group reported that they had constantly experienced vaccine stockouts during the preceding 12 months. The difference between treatment and control was not statistically significant for this final indicator.
77 Please see our discussion in the section “Supplementary Analysis for GiveWell’s Cost—Effectiveness Model” for more details on how measurement error might be effecting our results.

Final Evaluation Report
page 40
Table 16. Vaccine Stockout Outcomes – Means and Multivariate Regression Results
Our data shows that this significant difference between treatment and control clinics in the frequency of vaccination stockouts did not exist prior to the implementation of the NI-ABAE CCTs for RI Program. This effect is likely observed as a result of NI-ABAE’s staff checking the quality and stock of vaccines on RI day. If vaccine stock is low, NI-ABAE staff encourage clinic staff to procure more vaccines. This finding suggests that the program’s impact goes beyond strengthening the demand for vaccines and includes the reduction of supply side constraints.
Robustness to Alternative Analyses
To test the influence of various analysis choices on our regression results for the primary outcomes,
we carried out several robustness checks:
• Covariates: A first group of checks (“Drop missing”, “No covariates”, “Additional covariates”)
varied the covariates in the regression. The first drops observations with missing covariates,
the second conducts the regression without any covariates, (i.e. estimates simple difference
in means), the third adds additional covariates.78
• Coding of “don’t know” responses: The next check, (“Drop dk”) estimated the primary
specification when coding “Don’t know” outcome responses as missing – and dropping the
respective observations – as opposed to coding “Don’t Know” as 0 (“No”), as we do in the
main analysis.
78 The following additional covariates were included: (1) a binary variable indicating whether the caregiver ever received non-cash incentives for vaccinating; (2) a binary variable indicating whether the caregiver had heard positive messages about vaccinations from local leaders. These covariates were not included in the main specification as they could have been affected by treatment.
Mean (95% CI) Difference (95% CI)
Outcome Control Treatment Adjusted OLS
Results P-value
Clinic reported that no vaccine stockouts occur
0.10 0.27 0.18 0.004 (0.03, 0.17) (0.18, 0.37) (0.06, 0.30)
Clinic reported that vaccine stockouts occur rarely (twice per year or less)
0.59 0.74 0.16 0.033 (0.48, 0.70) (0.64, 0.83) (0.01, 0.30)
Clinic reported that vaccine stockouts occur constantly (almost every week)
0.05 0.05 -0.02 0.586 (0.00, 0.10) (0.00, 0.09) (-0.08, 0.05)
Note 1: The treatment and control means are not adjusted for covariates. Adjusted OLS Results are the treatment coefficient from a multivariate regression controlling for randomization strata and state dummies. Accordingly, the difference between treatment and control means is not equal to the treatment coefficient.

Final Evaluation Report
page 41
• Sample inclusion: Prior to endline, we visited all study clinics to verify which settlements were
included in their catchment areas. While the majority of these settlements overlapped with
the baseline list of settlements, some settlements had been added since baseline and others
were on the settlement lists collected by IDinsight but not those NI-ABAE understood to
define the catchment. This third group of robustness checks (“NI settlements”, “BL
settlements”, and “No Damaga”) explored whether conclusions changed when using different
criteria to define the settlement lists. “NI settlements” includes only observations from
settlements which NI-ABAE recognized as part of treatment catchments (N=5,106). “BL
settlements” includes only observations from settlements on baseline settlement lists
(N=3,390). “No Damaga” drops one Zamfara State clinic in which NI-ABAE was not able to
operate for several months due to security (N=5121).
• Card-based outcomes79: Finally, we calculated the impact estimate for each outcome using
vaccination card data instead of self-reported data. While card data may be more accurate
(since it is not subject to recall error), we did not include this as our primary data source
because of concerns about card retention.80 At endline, we found at least one vaccination
card for 74% of all children in our sample (80% in treatment and 66% in control).81 For those
children without any cards, though, 45% of caregivers in treatment areas and 55% of
caregivers in control areas still reported at least one injectable vaccination. Accordingly, we
would expect card-based coverage to miss a meaningful number of children who were
vaccinated but never received a card, lost their card, or were unable to find it during the
survey for the enumerator to record. We estimated the main regression specification and a
specification without any covariates using only data from CHCs (“CHC main”, and “CHC
none”), as well as using data from all vaccination cards (including CHCs, campaign cards, etc.)
(“Card main”, and “Card none”).82
Overall Trends – A Large, Positive, Stable Treatment Effect
Detailed results for each robustness check are provided in Appendix G.83 Robustness checks confirm
the overall finding that the NI-ABAE CCTs for RI Program had a substantial positive impact on
vaccination coverage. Across all primary vaccination outcomes, the coefficients on the treatment
variable were large and highly statistically significant regardless of specification. These large positive
effects were also relatively stable, ranging from about 15 to 20 percentage points for BCG vaccine,
from about 19 to 23 percentage points for Penta vaccine, and from about 14 to 16 percentage points
79 We also coded outcomes based on BCG vaccine scars, Child Immunization Registers, and various combinations of
measures. We report and analyze these outcomes measures in a separate section on self-report data quality. 80 At endline, child health cards (and other vaccination cards) were available for a much larger share of children than at
baseline: For 61% of all eligible children surveyed at endline at least one child health card was found while at baseline only
12.5% had a child health card. 81 A child health card (CHC) was found for 60.9% of all children (73% in treatment and 44.6% in control). However, caregivers often also had a campaign or other card that also recorded vaccination information. 82 The card data based impact estimates shown here code the response for a child without a child health card / any
vaccination card as not having received a vaccine. IDinsight also ran card based robustness checks which drop children
without a card. The tables showing the outputs of these robustness checks can be found in Appendix G. 83 In addition to these specification-choice robustness checks, Appendix H reports results for outcomes calculated for the average clinic (i.e. giving all clinics average weight, regardless of population).

Final Evaluation Report
page 42
for Measles 1 vaccine. Figures 9a-9c below show specification curves for the three primary outcomes.
For each outcome, we estimate 112 possible regression specifications; these specifications are all
potential permutations arising from the following choices:
• Which variables to include as covariates:
• child and HH-level covariates
• catchment/clinic-level covariates
• state dummies
• baseline coverage
• randomization strata dummies
• Whether to include an observation when a covariate is missing:
• include the observation (with the covariate set to zero, and a corresponding dummy
variable set to 1)
• drop the observation
• How to treat “don’t know” responses in the outcome
• treat as “no”
• exclude from the analysis
Each graph shows the estimated impact of treatment for all specifications, sorted by magnitude (for
each specification, the blue dot indicates the point estimate of the treatment coefficient, while the
violet area above and below indicates the 95%-confidence interval).
Figure 9a. Robustness Check Specification Curves (BCG Vaccine)

Final Evaluation Report
page 43
Figure 9b. Robustness Check Specification Curves (Penta 1 Vaccine)
Figure 9c. Robustness Check Specification Curves (Measles 1 Vaccine)
Limitations
The results presented in this section leave us confident of overall trends – the NI-ABAE CCTs for RI
Program clearly has a large, positive impact on most outcomes. However, these results are subject to
several limitations. Subsequent sections explore three broad categories of limitations –
contamination/spillovers, drivers of control coverage, and self-report data quality – in detail. In
addition to these, there are several limitations whose implications are smaller but still worth noting
here.
Missing Data due to Insecurity
Insecurity at endline prevented enumerators from surveying four catchment areas and a total of 95
settlements (including those in the four missing catchments). Our population estimates suggested

Final Evaluation Report
page 44
that around 267 eligible children lived in the missing areas (146 in treatment and 121 in control). We
would expect coverage to differ in these missing areas relative to the rest of the sample since we
found insecurity to be predictive of coverage during our baseline survey. We cannot be sure, however,
how much it will differ and how it interacts with the treatment effect. However, given the relatively
small number of missing values (267 relative to our overall sample-size of 5,141), we would not expect
this bias to meaningfully alter our results.84
Uncertainty driven by Geographic Sampling
We are confident the segments we selected at endline are a random sample and have no reason to
expect that they departed very far from the 25% of total land area we intended to select (in most
cases). However, we cannot be certain. It is also possible that enumerators systematically failed to
find inhabited structures or eligible children within surveyed segments, though our data-quality
measures suggest this was unlikely.85
While we cannot verify the validity of our sample with 100% confidence (since there is no updated
population register for the study area), we did compare key statistics from our sample to other
sources to check for plausibility. First, we compared the total survey area population implied by our
household survey (1,286,343) to that estimated by the Vaccine Tracking System’s (VTS) population-
prediction algorithm (1,266,369).86 The relatively small difference between these numbers is easily
within a range explainable by random sampling error of our survey and prediction error of the VTS
algorithm. We then compared the birth rate implied by our survey (39 crude births per 1,000 people
per year) to that estimated by the World Bank for Nigeria (38 per 1,000 per year) and Niger (46 per
1,000 per year).87 Again, these numbers are well within a plausible range of each other. This left us
confident that the numbers of people and children identified by our survey are reasonably accurate
and not likely to lead to misleading conclusions.
External Validity
This evaluation estimated the impact of the NI-ABAE CCTs for RI Program on immunization coverage
among 12 to 16 month olds following a ramp-up period of six months. It is possible that the NI-ABAE
program was still refining operations when the study cohort would have been receiving their first
84 Even making extreme assumptions like assigning 0 for all missing outcomes in treatment and 1 for all missing outcomes in control can only shift our impact estimate by a few percentage points given a relatively small number of missing outcomes. We conducted a back-of-the-envelope estimation to confirm this impression. It resulted in bounds of +/- 5 or 6 percentage points on the BCG vaccine impact estimate. These bounds should not be taken literally as they are rough estimates generated by implausible extreme assumptions. Rather, they should reassure GiveWell that bias from insecurity-driven missing data is unlikely to lead them to draw inaccurate conclusions. 85 In the final weeks of endline, for example, field teams found a gradually decreasing number of eligible infants per clinic. This could be due to a number of factors since the order of surveying was non-random (i.e. the survey firm planned when to visit each catchment based on logistical, security, and other constraints). We are confident, however, that our in-field data quality measures (described in Appendix C) would have identified any systematic failure to find eligible infants who actually lived in these catchments. 86 See http://vts.eocng.org/population/LGA?s=&l=&gender=MF&from=0&to=100 for output by administrative division. In practice, we used an associated layer in the open source Geographic Information System program QGIS to generate estimates for the land area we mapped for endline surveying. 87 World Bank Crude Birth Rate Data: https://data.worldbank.org/indicator/SP.DYN.CBRT.IN

Final Evaluation Report
page 45
immunizations. This may underestimate NI-ABAE’s effectiveness (or cost-effectiveness) over time. On
the other hand, caregivers may initially be excited by the novelty of the incentives program and may,
therefore, be more likely to respond to it. Over time, however, caregivers may be less swayed by the
presence of incentives.
Relatedly, other external factors may change over time which can affect the effectiveness of
incentives. These factors include increases in immunization coverage due to other programs, changes
in social norms, or other factors –which may reduce the cost-effectiveness of incentives by reducing
the unvaccinated population available to be incentivized. Similarly shifts in the economic status of
households living in the program areas may change the intrinsic value of the incentive. At the time
that this evaluation report is being written, the world is responding to the COVID-19 pandemic. This
may have dramatic impacts on the health system in Nigeria as well as the population’s trust in it. It is
difficult to anticipate how this will affect NI-ABAE’s impact: it may increase it as the incentive may be
enough to keep caregivers coming for immunization or it may reduce it if the incentive is insufficient
to overcome supply-side challenges or larger demand-side barriers such as fear of contracting COVID-
19. Further, we do not know how long these challenges will last.
Need for Additional Research
This evaluation found that NI-ABAE’s CCTs for RI Program successfully increased immunization
coverage for routine childhood immunizations. Further research is needed to measure the long-term
impacts of CCT programs for immunizations in Nigeria on immunization coverage as well as any effects
(positive or negative) on health service delivery and health service utilization by community members.
CCT programs often invoke questions related to sustainability. More research is needed on the
optimal timing of and approach to phasing out CCT programs once desired coverage levels (or social
norms in favor of immunization) are achieved.
Conclusion
Self-reported and clinic-recorded data show positive, consistent, and significant program impact.
We have seen that the NI-ABAE CCTs for RI Program had a substantial positive impact on both primary
and secondary vaccination outcomes according to both household and clinic data sources. This impact
holds across a range of specifications and is consistently statistically significant. While impact is
smaller for ever-vaccinated outcomes, it is still positive, suggesting that the NI-ABAE CCTs for RI
Program motivates caregivers to start the RI schedule who otherwise would not have but that a larger
part of the program’s impact comes from motivating caregivers who start the RI schedule to continue
and complete it.
To make best use of these results, GiveWell requires additional information to determine whether to
adjust the results presented so far before using them in its cost-effectiveness model. The following
section reports on those analyses and their results.

Final Evaluation Report
page 46
Supplementary Analysis for GiveWell’s Cost-
Effectiveness Model
GiveWell will use the results of this impact evaluation to update their cost-effectiveness analysis (CEA)
for the NI-ABAE CCTs for RI Program, which is a key input to the decision of whether to recommend
NI-ABAE as a ‘top charity’. The self-reported impact and coverage estimates that have been reported
thus far would be the default inputs into GiveWell’s CEA. This section explores potential adjustments
to these estimates that GiveWell might consider making to ensure the CEA’s output is as close to the
NI-ABAE CCTs for RI Program’s true cost-effectiveness at scale as possible. Adjustments are warranted
if there is reason to believe that the default inputs do not reflect what actually happened in the
treatment or control group, that what happened in the control group does not reflect what would
have happened in the absence of the program, or a combination of the two.
Below, we explore three possible reasons why an adjustment might be warranted: 1) contamination
and spillovers, 2) drivers of control coverage, and 3) self-report data quality.
Contamination and Spillovers
Contamination and spillovers both refer to vaccinations that occur in control areas as a result of the
program implemented in treatment areas. Contamination vaccinations happen as a result of children
in control areas accessing the treatment. Spillover vaccinations result from indirect effects of the
program, such as improvements in the state-wide vaccine supply, caregivers valuing vaccinations
more because they heard that some clinics were paying for them, etc.
Both contamination and spillovers bias impact estimates by changing coverage in the control areas as
a result of the program – decreasing its validity as a counterfactual. In our setting, we would generally
expect contamination and spillovers to inflate control coverage (since we conclude that the program
has a positive effect in treatment areas, we would expect it to affect control areas in the same
direction, if it affects them at all). In the context of the CEA, evidence of contamination or spillovers
would also mean the control group overestimates the proportion of the treatment group that are
“always-vaccinators”.88
Contamination
Children from control catchment areas may come to treatment clinics, deceive program staff about
whether they are from the catchment area,89 enroll in the program, and receive vaccinations and
88 “Always-vaccinators” refers to children who would have been vaccinated with or without the existence of the program. Always vaccinators are important for cost effectiveness since they contribute to program costs but the program cannot have an impact on their vaccination status (by definition). Since the program pays incentives to all caregivers of eligible children who are vaccinated in treatment areas, it necessarily pays incentives for always vaccinators as well as for children who are vaccinated because of the program. 89 Clinic staff ask caregivers where they live and are instructed not to refer anyone who lives outside of the catchment area to NI-ABAE. It is possible, however, that caregivers from outside the catchment area know about this rule and, therefore, claim to be from a location within the catchment area.

Final Evaluation Report
page 47
incentives. NI-ABAE has implemented and continues to refine several anti-fraud measures designed
to prevent this from happening and clinic staff support these efforts. However, NI-ABAE admits that
no anti-fraud system is perfect and expects that some out-of-catchment infants still receive
vaccinations at their clinics.90 We looked for evidence that these out-of-catchment infants include
infants from control areas by checking CHCs for NI-ABAE stamps and by checking if caregivers had NI-
ABAE cards (caregivers receive both stamps and cards whenever their child is enrolled in the
program). We also asked caregivers if they had received cash incentives for vaccinations.
There is no substantial evidence of children in control areas receiving the incentive. We found a
negligible number of control households that had either a CHC with a NI-ABAE stamp (n = 2, 0.1%) or
where the caregiver reported receiving cash incentives for vaccination (n = 9, 0.4%). We did not find
any control caregivers with a NI-ABAE card. Accordingly, by these three measures, there is no evidence
that a meaningful number of infants from control areas were enrolled in the program.
Table 16. Indicators of NI-ABAE Enrollment in Treatment and Control
Has a child health card with NI-ABAE
stamp
Has an NI-ABAE card with at least
one vaccine recorded
Caregiver reports receiving cash incentives for vaccination
N (%) N (%) N (%)
Control (N = 2201) 2 (0.09%) 0 (0.00%) 9 (0.42%)
Treatment (N = 2955)
1968 (66.59%) 1839 (62.22%) 2273 (76.91%)
Spillovers
Spillovers also could have improved coverage indirectly in the control group. A potential source of
spillovers was health officials directing campaigns to control clinics to compensate for the lack of the
program. If this occurred, we would expect campaign frequency to have been higher in control than
in treatment clinics. Alternatively, if NI-ABAE CCTs for RI Program staff were particularly effective
advocates for vaccination within the health system, we might expect greater campaign frequency in
treatment than control.
Neither hypothesis is borne out by data from our clinic staff survey. Treatment and control clinics
reported virtually equal numbers of campaigns – each reporting an average of 2.8 campaigns between
June 2018 and December 2019.
Spillovers may also have occurred if caregivers in the control group were under the impression that
they would receive a vaccine at their catchment clinic or if they attempted and failed to enroll at a
90 Out-of-catchment children vaccinated in treatment clinics could be from control clinics or non-study clinics. This section refers only to control clinics, since we did not collect household survey data from non-study clinics. NI-ABAE’s cost and monitoring data would likely be affected by out-of-catchment children from non-study areas. We also expect a much larger proportion of any out-of-catchment vaccinations in treatment clinics to be from non-study clinics as opposed to control clinics. This is because of the 17km buffer we applied to selecting study clinics; there are often several non-study clinics that are meaningfully closer to a treatment clinic than the closest control clinic.

Final Evaluation Report
page 48
treatment clinic but received a vaccination in the process.91 Unfortunately, we cannot test for this
directly. We can, however, examine whether study conditions made various spillover mechanisms
likely or whether evidence from other sources suggests that they occurred.
The evaluation’s primary defense against control caregivers traveling to treatment clinics was
distance. Control surveys occurred an average of 20 kilometers (SD = 6km) from the nearest treatment
clinic - as we would expect given the 17km buffer built into clinic selection. By contrast, the average
control survey took place 2.4km away (SD = 3.4) from the nearest control clinic. This is compared to
the 5km average distance traveled to the clinic reported by caregivers prior to baseline.92
In addition, NI-ABAE limited its community sensitization about the incentive within treatment areas.
To test whether distance worked to limit knowledge, we checked for awareness of incentives given at
other clinics among control caregivers at endline. We found that 13% [95% CI: 11.6%, 14.4%] of
control caregivers reported knowledge of cash incentives for vaccination at other clinics (besides their
own). For spillovers to occur, these caregivers who were aware of incentives at other clinics would
have had to expect that they would also be able to receive them – either because they were also
available at their own catchment clinic or because they could travel to the treatment clinic and obtain
them. This expectation would then have had to induce them to obtain vaccinations they would not
have obtained otherwise. It is unlikely that all 13% of control caregivers who were aware of incentives
also met the other conditions necessary to induce spillovers. Accordingly, while we cannot say
definitively how often this occurred, any spillover effect via this channel was likely small.
One additional potential spillover effect is from the mere presence of the NI-ABAE CCTs for RI Program
in the region. This could have increased overall interest in vaccination both in treatment and control
catchments or led to improvements in vaccine supply at the LGA level or higher, also affecting both
treatment and control. Such general spillovers would lead overall coverage in both treatment and
control to be higher than it would be absent the program. This would bias the estimate of the
program’s impact in a scenario where the program is new (i.e., if the NI-ABAE CCTs for RI Program
scales to a new state). However, NI-ABAE’s scale-up plans include expanding to additional facilities
within the study states – therefore, these new facilities will also exist in areas affected by the current
presence of the NI-ABAE CCTs for RI Program. Accordingly, while we cannot rule out (or in) any of
these generalized spillovers, it is unlikely that they substantially altered the validity of the impact
estimate for GiveWell’s purposes.
Conclusion
We found no substantial evidence of contamination or spillovers that would require an adjustment
before using study results in the CEA. There is no evidence that control caregivers accessed the
program in meaningful numbers nor does it appear likely that control coverage estimates are
91 Children who were turned away for the incentive due to out-of-catchment residence were still offered vaccinations for
which they were eligible at that visit. If large numbers of control caregivers attempted to obtain incentives and failed once
they reached the clinic, then the program could still have increased vaccination coverage in control areas despite low control-
caregiver enrollment. Importantly, this only induces bias in the impact estimate if these caregivers would not have had their
children vaccinated otherwise. 92 See Pre-Analysis Plan, footnote 69

Final Evaluation Report
page 49
meaningfully affected by proximity to treatment clinics or knowledge of the program being
implemented there. While we cannot rule out a set of more generalized spillovers at the regional
level, these are less likely to be of decision-relevant concern to GiveWell, especially if NI-ABAE scales
up in the same states.
Drivers of Control Group Coverage
Control coverage has increased meaningfully since baseline, and the difference is not entirely
attributable to the inclusion of Jigawa State or changes in measurement methods. Campaigns
appeared to contribute a portion (but not all) of the increase for the Measles vaccine; this was not
the case for BCG or Penta vaccines. In addition, it appears that program impact on Measles vaccine
coverage was likely driven downward by campaigns. If GiveWell expects campaigns to remain
relatively irregular in the scale-up context, they should adjust the impact estimate upward for
Measles vaccine.
Our analysis suggests that control coverage for Measles 1 vaccine excluding campaigns is likely lower
than the unadjusted estimate. Our best guess is that that the self-reported RI-only coverage for
Measles 1 vaccine in control is 48% (11 percentage points lower than the actual self-reported rate we
found). If GiveWell expects that NI-ABAE does not pay incentives to a large proportion of children
vaccinated only through campaigns, then they should adjust control coverage downward before using
it as an estimate of the proportion of children who enroll in the program but would have been
vaccinated anyway in its absence.93 Our analysis also suggests that program impact on Measles
vaccine would have been roughly 22 percentage points in the absence of a campaign. Moreover, our
data suggests that large-scale campaigns that meaningfully affect coverage are relatively infrequent.
Accordingly, the scale-up context for the NI-ABAE CCTs for RI Program is likely to be primarily
characterized by time periods without large-scale campaigns. Accordingly, in the interest of making
our impact estimate more generalizable to the scale-up context, we recommend GiveWell use 22
percentage points as the self-reported impact estimate for Measles vaccine.94
93 NI-ABAE staff are uncertain of the proportion of campaign-delivered vaccinations that ultimately lead to caregivers receiving incentives. In most cases, children who would have been eligible for the incentive had they received the vaccination via RI activities but received it through a campaign are eligible to receive the incentive if they provide proof of eligibility and vaccination. However, since campaigns often vaccinate in communities, caregivers would usually have to make an extra trip to the clinic or to the clinic outreach site to receive the incentive. We used vaccination card data to investigate how commonly this seemed to happen. In cases where caregivers did receive the incentive for campaign vaccinations, the child should have an entry for the same Measles vaccine on two different cards: (1) a campaign card, and (2) the CHC (as the CHC would have been filled in retrospectively when the caregiver visited the clinic to obtain the incentive for the campaign vaccine). As we describe in more detail below, we found that only around 12% of children in treatment had a Measles vaccine recorded on both a campaign card and a CHC. Furthermore, we compared the dates on these two cards, and found that in treatment the month/year information on the two cards was only the same for 6% of children with two cards (less than 1% of all children in the treatment group). This leads us to believe that it was not common for caregivers of children in the treatment group who received their first Measles vaccine during a campaign to subsequently claim the incentive. 94 Strictly speaking, even rare campaigns will vaccinate some children who would not be vaccinated in the absence of the program, lowering the program’s potential impact, even at scale. However, not adjusting the impact estimate at all implies assuming that the scale-up context will be like endline – in other words, it will follow a major Measles vaccine campaign. Given that only one campaign of this scale occurred in the 19 months covered by the clinic staff survey, assuming that the average cohort of eligible children is not affected by a major campaign is a better approximation of the truth than is assuming that the average cohort is fully covered by a major campaign. Moreover, RI Measles vaccinations are likely much more timely

Final Evaluation Report
page 50
Change in Vaccination Coverage Since Baseline
Across the study area, coverage in the control group was substantially higher at endline than at
baseline.95 This was true for each of the primary study vaccines, with the largest difference for the
Measles vaccine: 17.8% of children at baseline versus 57.2% of children at endline had reportedly
received Measles 1 vaccine (Table 16). We did not expect a change of this magnitude. Because
particular drivers of control coverage (especially the role of periodic vaccination campaigns) may have
implications for GiveWell’s cost-effectiveness analysis, we conducted a careful examination of control
coverage.
Table 16. Control Group Vaccination Coverage from Baseline to Endline (%)
Outcome Baseline Coverage
Endline Coverage
Endline Coverage (Katsina and
Zamfara States only)
Reported BCG vaccine 0.27 0.63 0.53
(0.22, 0.32) (0.57, 0.69) (0.46, 0.60)
Reported Penta 1 vaccine 0.22 0.54 0.42
(0.17, 0.28) (0.48, 0.61) (0.36, 0.49)
Reported Measles 1 vaccine 0.18 0.59 0.54
(0.14, 0.21) (0.54, 0.64) (0.48, 0.61)
Has a BCG vaccine scar 0.19 0.41 0.37
(0.14, 0.23) (0.37, 0.46) (0.31, 0.44)
Note 1: Coverage estimates are reported as percentages (%) of all respondents. 95% CIs are reported in parentheses. These coverage estimates are not adjusted for any covariates.
Note 2: Baseline coverage rates are calculated by reweighting the baseline sample using endline data. Hence, baseline coverage rates shown are slightly different from the rates included in the Baseline Report.
Evaluation Differences Between Baseline and Endline
Changes between baseline and endline likely reflect actual differences in coverage. Changes in the
evaluation design and survey methodology explain only part of the observed increase in coverage.
The inclusion of Jigawa State – the third study state that was added after baseline – explains some
of the increase between the two survey waves but not all. The third column of Table 16 reports the
coverage estimate in control areas after removing Jigawa State from the endline sample. The
difference between the two surveys is smaller after removing Jigawa State but still substantial;
coverage for each vaccine at endline is still approximately twice what it was at baseline.
than campaign Measles vaccinations - again because campaigns are infrequent. There is - therefore - reason to favor vaccinations delivered via RI, as we do implicitly by using RI impact. This case is stronger when we recall that we found the NI-ABAE CCTs for RI Program to substantially increase the timeliness of Measles vaccinations. 95 Baseline used a sampling approach that resulted in an approximately equal number of children across catchment areas, whereas endline used a sampling approach that resulted in an approximately population proportionate sample of children across catchment areas. For this section, we reweighted the baseline sample using the endline data to ensure that children from a given catchment area were comparably weighted at baseline and endline.
Final Evaluation Report
page 51
Another possible explanation for the increase in coverage is differential measurement error between
the baseline and endline surveys. Changes in the questionnaire or enumerator technique could have
led to increased recording of vaccinations via the survey even if true vaccination coverage had not
changed.96 This could result from either improved recall or increased social desirability, or both. This
hypothesis could explain why we do not see similar increases in clinic tally sheets, which record
relatively stable control-group vaccination volumes between baseline and endline (see Appendix I).
However, we also saw a substantial increase in the percentage of children with a BCG vaccine scar in
Katsina State and Zamfara State from 19% at baseline to 37% at endline. This change is roughly
proportionate to the change in self-reported BCG vaccine coverage in those states (27% to 53%),
making it unlikely that changes in questionnaire wording or enumerator technique explain a large part
of the baseline-to-endline increase in coverage.97
If not explained by changes in methodology, then the change in measured control coverage between
baseline and endline likely reflects a change in true vaccination coverage, which warrants further
investigation.
Vaccine Delivery – Location
More Measles vaccinations occurred outside of clinics at endline than baseline.
We asked every caregiver who reported a vaccination to identify the location at which it occurred.
Figure 10 below decomposes control coverage at baseline and endline by location. For both baseline
and endline, we found that vaccinations were most often given at the clinic, followed by the
settlement. Only a small share of vaccinations was received at home. At both baseline and endline,
the Measles vaccine was more likely to have been received in the settlement than the BCG or the
Penta vaccines.
96 At endline, in addition to using body part and age, we also structured the interview according to vaccination occasions (i.e. clinic visits or in-settlement vaccination activities), with the aim of improving caregiver recall. 97 The share of self-reported Measles vaccinations corroborated by CHC entries was higher at endline. This can be explained by a variety of factors, including changes in card-retention, and is, therefore, not definitive. However, it does not provide evidence of increased false reporting in control at endline relative to baseline.

Final Evaluation Report
page 52
Figure 10. Control Group Vaccination by Self-Reported Location at Baseline and Endline
Note 1: The figure excludes Jigawa State since we do not have baseline numbers for that state.
It is clear from Figure 10 that there was an increase from baseline to endline in the percentage of
vaccines reported as received in the settlement. This increase was modest for BCG and Penta vaccines
with a 3 percentage point and 1 percentage point increase, respectively. The increase for the Measles
vaccine was substantially larger: 43% of Measles vaccinations were reportedly received in the
settlement at endline compared to 17% at baseline (a 26 percentage-point increase). There was also
an increase in the percentage of Measles vaccines received at home.
Overall, there was little baseline-to-endline change in the percentage of BCG and Penta vaccinations
reported as received outside of the clinic, while there was a large increase in the percentage of
Measles vaccinations reported as received outside of the clinic.
Importantly, vaccines delivered outside clinics may be delivered through either RI outreach or
vaccination campaigns. RI outreach refers to clinic staff visits to settlements to provide vaccinations –
either at a central location or door-to-door. Campaigns refer to intensive, short duration vaccination
efforts applying additional staff and resources beyond those engaged in routine healthcare and often
targeting a small number of priority vaccines. Similar to RI outreach, campaigns often deliver
vaccinations directly in communities – also either door-to-door or at central, public locations.98
Campaigns generally involve support from international organizations such as the World Health
Organization (WHO) and the United Nations Children’s Fund (UNICEF) as well as from the Nigerian
federal health system.
98 Some campaigns do occur at the health facilities themselves.
83% 81% 85% 85%78%
47%
9% 12% 9% 10%17%
43%
7% 4% 4% 3% 2% 6%2% 3% 2% 2% 3% 4%
0%
10%
20%
30%
40%
50%
60%
70%
80%
90%
100%
BaselineBCG
EndlineBCG
BaselinePenta
EndlinePenta
BaselineMeasles
EndlineMeasles
Clinic Settlement Home Other/Don't know

Final Evaluation Report
page 53
Vaccine Delivery – Activity
The source of vaccination is relevant for GiveWell’s cost-effectiveness estimate for two reasons.
Firstly, NI-ABAE intends to (and generally does) pay incentives for vaccinations distributed through RI
outreach but likely pays incentives for a smaller share of vaccines delivered via campaigns.99 This
means that vaccinations that occur in the control group only because of campaigns are not always
vaccinations for which New Incentives would pay incentives. Therefore, GiveWell may wish to account
for the portion of vaccinations of this type when using control-group coverage in the CEA as an
estimate of incentives paid to caregivers whose children would be vaccinated in the absence of the
program. Secondly, campaigns may reduce the impact of the program by reaching children in control
areas who would not be vaccinated in the absence of a campaign but would be induced to be
vaccinated by the NI-ABAE CCTs for RI Program. Since large campaigns are relatively irregular, a
control group coverage that excludes those vaccinations that only occur via campaigns is a better
counterfactual for estimating program impact.
We found evidence that a moderate proportion of Measles vaccinations reported in control were
delivered via campaigns. Campaigns did not appear to account for a meaningful proportion of BCG
and Penta vaccinations. We also found evidence that program impact on Measles vaccine was
somewhat higher when excluding campaigns.
There was a large Measles vaccine campaign across the study area immediately prior to endline
data collection. To explore the extent of campaign activity in the evaluation area, we asked clinic staff
about the frequency of campaigns in the period leading up to the endline survey in the clinic staff
survey. Both treatment and control clinics reported that an average of 2.8 vaccination campaigns [95%
CI: 2.6, 3.0] occurred in each catchment area during the 19 months up to and including the first month
of the endline survey. Figure 11 illustrates the incidence of specific vaccines’ inclusion in campaigns
as reported by clinic staff. For most of the study period, clinic staff reported sporadic, small-scale
campaigns targeting a few clinics and vaccines at a time. Just prior to endline, however, nearly all
clinics reported a major campaign targeting Measles vaccine and (usually) Meningitis vaccine
(captured under “other”). Many clinics also reported Yellow Fever vaccine and Polio vaccine (including
fractional IPV, fIPV) campaigns.
99 NI-ABAE staff work hand-in-hand with RI staff and activities and NI-ABAE CCTs for RI Program incentive eligibility is structured to be similar to eligibility for RI vaccinations. Because campaigns are less frequent and have different eligibility criteria, NI-ABAE staff are not always able to integrate enrollment activities with campaign vaccination activities. For example, for the large Measles vaccine campaign in November 2019, NI-ABAE staff – in discussions with campaign officials – decided not to accompany campaign staff to communities as the campaign hoped to vaccinate children whose ages would not make them eligible for NI-ABAE CCTs for RI Program enrollment and who, therefore, might resent the program for enrolling others at the same time.

Final Evaluation Report
page 54
Figure 11. Campaign Incidence by Vaccine (June 2018-December 2019)
In addition, we asked clinic staff to report the incidence of outreach in their clinics, along with the
vaccines distributed in outreach activities. There was an increase in outreach days between baseline
and endline. At endline, staff in control clinics reported an average of 3.5 outreach days in their clinics
per month [95% CI: 3.2, 3.8], an additional 1.5 outreach days per month compared to baseline (95%
CI: 1.2, 1.9, p-value < 0.01). All but one clinic reported distributing Measles vaccines through outreach,
while all but four clinics reported distributing BCG and Penta vaccines during outreach.
We also analyzed household survey data on the activity through which children received vaccinations
(fixed post, outreach, campaign, or other/don’t know). When caregivers reported that their child
received a given vaccine outside a clinic, they were asked whether the vaccination was distributed as
part of a campaign or an RI outreach activity.100
100 Examples of the questions asked to elicit this report can be found in Appendix K.

Final Evaluation Report
page 55
Despite the large Measles vaccine campaign shortly before endline, the majority of caregivers of
children in the control areas who received Measles vaccinations outside of the clinic reported
having received Measles vaccine as part of clinic outreach, as seen in Figure 12. There were
meaningful increases in both reported outreach and campaign vaccinations for Measles between
baseline and endline. Based on caregivers’ self-report at baseline, 11% of Measles vaccines were
administered during outreach (the highest share of all vaccines), and 6% of Measles vaccines were
administered during campaigns. At endline, 30% of Measles vaccines in control were received during
outreach and 12% during campaign activities.
Figure 12. Control-Group Vaccinations by Self-Reported Activity
Note 1: The figure excludes Jigawa State since we do not have baseline numbers for that state.
Note 2: "Don't know" responses include the following scenarios: (1) The caregiver did not know at which location the vaccine
was received, or reported that the vaccine was received at another location (not at a clinic, at home, or in the settlement).
In this case, the questionnaire did not ask the caregiver whether the vaccine received was a campaign vaccine or not. (2)
The caregiver knew at which location the vaccine was received but said that they "did not know" whether the vaccine
received was a campaign vaccine or not.
Importantly, respondents may have confused RI outreach and campaigns since both take place
outside of clinics101 and clinic staff often participate in both.102 The share of outreach vaccinations at
endline had also increased substantially more for Measles vaccine than for BCG vaccine or Penta
vaccine, a surprising result that could have been driven by caregiver misreports. To explore this
possibility further, we analyzed what share of self-reported Measles vaccinations were recorded on
CHCs (which are completed as part of RI activities), and on campaign cards. In total, 53% of all self-
reported Measles vaccines in the control group were corroborated by an entry on a vaccination card
101 Some clinics hold campaigns at the health facility, but this is less common than those that occur in settlements. 102 See Appendix L for additional exploration of the reliability of self-reported vaccination location and activity data.
83% 81% 85% 85%78%
45%
7% 10% 7% 9%11%
30%
1% 2% 2% 1% 6%
12%
9% 7% 6% 5% 5%12%
0%
10%
20%
30%
40%
50%
60%
70%
80%
90%
100%
BaselineBCG
EndlineBCG
BaselinePenta
EndlinePenta
BaselineMeasles
EndlineMeasles
Fixed post Outreach Campaign Don't know

Final Evaluation Report
page 56
(CHC or campaign card).103 If we only consider CHCs, the share was 40%. Hence, for 13% of self-
reported Measles vaccinations the child only had a campaign card record (making it likely that the
vaccination occurred during a campaign). As we discuss in more detail in the next section, this suggests
a non-negligible role for campaigns in driving Measles vaccine coverage. However, the fact that a large
majority of children with a card record of the Measles vaccine had a record on their CHC suggests that
increased RI vaccines (likely via outreach as shown in Figure 12) were also important for driving
Measles vaccine coverage increases.
Estimating Coverage and Impact for RI Vaccinations
We explored several approaches to estimating the percentage of vaccinations that were delivered
through RI (fixed post at clinics or outreach) versus campaigns. While uncertainty remains, these
approaches provide a clearer idea of what Measles vaccine coverage would have been in treatment
and control if there had not been a large-scale Measles vaccination campaign in November and
December 2019.
As discussed in the previous sections, caregivers were asked to report whether they thought that a
given vaccination had been delivered as part of RI or campaign activities. Figure 13 breaks Measles
vaccine coverage in treatment and control into the following categories based on this self-reported
data:104
• At least one RI: The caregiver reported that the child received Measles 1 vaccination at a clinic
(fixed post) as part of RI activities or during RI outreach.
• No RI (only campaign): The caregiver reported that the child only received a Measles
vaccination during a campaign. No Measles vaccinations were reportedly received through RI
activities.105
• Unclear: The caregiver reported receipt of Measles 1 vaccination, however, based on the self-
reported information, we cannot tell it was delivered during RI or campaign activities.
103 As a comparison: for the BCG vaccine, 59% of all self-reported vaccines in the control group were corroborated by an entry on a vaccination card (CHC or campaign card). 104 Detailed RI coverage rates and resulting impact estimates for each of the primary vaccines (BCG vaccine, Penta vaccine, Measles vaccine) are shown in Tables 17-19 below. 105 During fieldwork, we received reports that - in some cases - the recent Measles vaccine campaign had delivered vaccinations at clinics. At that point, we updated the questionnaire section on Measles vaccine. Originally, it had only asked caregivers who received the Measles vaccine outside of the clinic (e.g. in the settlement or at home) whether they had received it through RI outreach or campaign activities. After the questionnaire change, caregivers were also asked this question if they reported that their child had received a Measles vaccination at the clinic. Only 3.5% of all caregivers in the sample who reported Measles 1 vaccination at the clinic and where subsequently asked whether it had been a campaign or RI vaccination responded that it had been a campaign vaccination.

Final Evaluation Report
page 57
Figure 13. Self-Reported RI-Only Coverage for Having Received Measles 1 Vaccine
Note 1: "Unclear" responses include the following scenarios: (1) The caregiver did not know at which location the vaccine
was received, or reported that the vaccine was received at another location (not at a clinic, at home, or in the settlement).
In this case, the questionnaire did not ask the caregiver whether the vaccine received was an RI or a campaign vaccine. (2)
The caregiver knew at which location the vaccine was received but said that they "did not know" whether the vaccine
received was a campaign vaccine or not.
If we define RI Measles vaccines as those that were reported as RI (and exclude vaccines categorized
as “unclear”), then RI Measles vaccine coverage was 47% in the control group and 67% in the
treatment group. If we include the “unclear” vaccines as RI vaccinations, RI Measles vaccine coverage
was 53% in the control group and 72% in the treatment group.
Due to the likelihood that caregivers misreported vaccination activities, we also used vaccination card
data as an additional data source. Enumerators asked caregivers for all cards with health information
on them and recorded the vaccinations shown on these cards. We used the card data to refine our
estimates of RI-only coverage by recoding cases in which cards suggested caregivers had misreported
vaccination activity. We started with self-reported activity and defaulted to the self-report in the
absence of contradictory card data. However, if the only available card data suggested a different
activity than that reported by the caregiver, we recoded the vaccination accordingly. Figure 14
illustrates this approach.
47%
67%
6%
5%
6%
3%
0%
10%
20%
30%
40%
50%
60%
70%
80%
Control Treatment
At least one RI Unclear whether RI or not No RI (only campaign)

Final Evaluation Report
page 58
Figure 14. Re-Classifying Vaccinations as RI and Campaign Based on Card Data
Figure 15 shows results of implementing the previously described approach in terms of coverage. The
left-most bar for control and treatment shows the self-reported RI-only coverage (including “unclear”
responses) broken down based on the card information available on these vaccinations. We see that
in control roughly half of all self-reported RI vaccines are not backed up by any card information (i.e.
enumerators did not find a card at all or the cards they did find did not have any Measles vaccinations
recorded) (yellow bars).
Reported Measles 1 vaccine
Reported at least one RI vaccine
Had vaccine entry on child health card (RI
record)
RI vaccine
Had no vaccine entry on child health (no RI
record)
Had vaccine entry on campaign card
No RI vaccine
Had no vaccine entry on any card
RI vaccine
Reported no RI vaccine (campaign
only)
Had vaccine entry on child health card (RI
record)
RI vaccine
Had no vaccine entry on child health card
(no RI record)
Had vaccine entry on campaign card
No RI vaccine
Had no vaccine entry on any card
No RI vaccine

Final Evaluation Report
page 59
Figure 15. Using Self-Reported and Card-Adjusted Data to Calculate RI-Only Coverage
In treatment, the vast majority of RI Measles vaccines are confirmed by a card record. In most cases,
this record is an RI vaccination card (i.e. a CHC).106 The black bars at the top of each graph illustrate
those children that only had a campaign card despite their caregiver reporting that they had received
the Measles vaccine during RI activities. This share was 7% in control, and 2% in treatment. The card-
adjusted measures reclassify these vaccinations as campaign based on the card.
The second bar to the right of each graph shows the card breakdown for those children for whom
caregivers reported only a non-RI Measles vaccine (i.e. a campaign vaccine). In control, most of these
vaccines are not backed up by any card record. In both treatment and control, we see that a small
share of these children did actually have an RI vaccination card. The card-adjusted measures reclassify
these vaccinations as RI.107
106 6% of children in control, and 11% of children in treatment, had both an RI vaccination card (i.e. CHC) and a campaign card for Measles vaccine (green bar), suggesting they received two Measles vaccinations (one via RI and one via campaign). We checked self-reported data and found these numbers to be reasonable. 7% of caregivers in control, and 12% of caregivers in treatment, reported that their child had received two Measles vaccines. 107 We investigated one possible limitation to our re-classification method. We were initially concerned that a large number of Measles campaign vaccinations might have been recorded on CHCs instead of (or in addition to) campaign cards. If this had been the case, then it would have been inaccurate to use CHC information to recode whether a Measles vaccines was received during RI activities. We investigated this potential limitation by analyzing the distribution of Measles vaccines on CHCs over time using vaccination dates recorded on CHCs. Our analysis showed that there was no spike in Measles vaccinations recorded on CHCs in November or December 2019 (the time period of the large-scale Measles

Final Evaluation Report
page 60
After applying the card adjustments, coverage in control drops to 48%, and coverage in treatment
remains largely constant at 72%.
Table 17 shows treatment and control coverage as well as the impact estimate derived from running
our main specification for the different RI-only variables discussed above. The loose RI definitions
count “unclear” vaccines as RI vaccines. The strict definitions count “unclear” vaccines as non-RI
vaccines. The impact estimate for RI-only Measles vaccines increases to up to 25 percentage points
depending on the definition applied.
Table 17. RI Coverage and Impact Estimates for Measles Vaccinations (Using Various
Measures)
Mean (95% CI) Difference (95% CI)
Outcome Control Treatment Adjusted OLS
Results P-value
Received Measles 1 vaccine (main) 0.59 0.75 0.14 < 0.001
(0.54, 0.64) (0.70, 0.79) (0.10, 0.18)
Received at least one RI Measles vaccine loose (self-report)
0.53 0.72 0.17 < 0.001 (0.48, 0.57) (0.67, 0.76) (0.14, 0.21)
Received at least one RI Measles vaccine strict (self-report)
0.47 0.67 0.19 < 0.001 (0.42, 0.51) (0.62, 0.72) (0.15, 0.23)
Received at least one RI Measles vaccine loose (self-report and card correction)
0.48 0.72 0.22 < 0.001 (0.43, 0.52) (0.68, 0.76) (0.18, 0.26)
Received at least one RI Measles vaccine strict (self-report and card correction)
0.44 0.71 0.25 < 0.001 (0.40, 0.49) (0.66, 0.75) (0.20, 0.29)
Note 1: The 'loose definition' counts all vaccines for which it was unclear whether they were an RI (or a campaign vaccine) as RI vaccines. The 'strict definition' only includes vaccines that were reported to have been RI vaccines (all unclear vaccines are assumed to have been campaign vaccines).
Note 2: The treatment and control means are weighted for sampling probabilities but not adjusted for covariates. Adjusted OLS Results are the treatment coefficient from a multivariate regression controlling for the covariates listed in the methods section. Accordingly, the difference between treatment and control means is not equal to the treatment coefficient, though both results show substantial, positive impact.
Tables 18 and 19 show the RI-coverage and impact results for the BCG and Penta vaccines. BCG
vaccine and Penta vaccine coverage remain basically unchanged when applying the different
adjustments. As a result, the impact estimate also remains largely unchanged.
vaccine campaign). In treatment, only around 12% of Measles vaccinations recorded on CHCs were received in November/December 2019. In control, it was even less (only around 10%). This makes us confident that the vast majority of Measles vaccinations recorded on CHCs are RI vaccinations and not campaign vaccinations.

Final Evaluation Report
page 61
Table 18. RI Coverage and Impact Estimates for BCG Vaccinations (Using Various
Measures)
Mean (95% CI) Difference (95% CI)
Outcome Control Treatment Adjusted OLS
Results P-value
Received BCG vaccine (main) 0.63 0.83 0.16 < 0.001
(0.57, 0.69) (0.79, 0.86) (0.12, 0.21)
Received RI BCG vaccine loose (self-report)
0.62 0.81 0.16 < 0.001 (0.56, 0.68) (0.78, 0.85) (0.12, 0.21)
Received RI BCG vaccine strict (self-report)
0.58 0.79 0.18 < 0.001 (0.52, 0.65) (0.75, 0.83) (0.13, 0.22)
Received RI BCG vaccine loose (self-report and card correction)
0.62 0.82 0.17 < 0.001 (0.56, 0.68) (0.78, 0.86) (0.12, 0.21)
Received RI BCG vaccine strict (self-report and card correction)
0.61 0.81 0.17 < 0.001 (0.55, 0.67) (0.78, 0.85) (0.13, 0.22)
Note 1: The 'loose definition' counts all vaccines for which it was unclear whether they were an RI (or a campaign vaccine) as RI vaccines. The 'strict definition' only includes vaccines that were reported to have been RI vaccines (all unclear vaccines are assumed to have been campaign vaccines).
Note 2: The treatment and control means are weighted for sampling probabilities but not adjusted for covariates. Adjusted OLS Results are the treatment coefficient from a multivariate regression controlling for the covariates listed in the methods section. Accordingly, the difference between treatment and control means is not equal to the treatment coefficient, though both results show substantial, positive impact.
Table 19. RI Coverage and Impact Estimates for Penta Vaccinations (Using Various
Measures)
Mean (95% CI) Difference (95% CI)
Outcome Control Treatment Adjusted OLS
Results P-value
Received Penta 1 vaccine (main) 0.54 0.78 0.21 < 0.001
(0.48, 0.61) (0.73, 0.82) (0.16, 0.26)
Received at least one RI Penta vaccine loose (self-report)
0.53 0.77 0.21 < 0.001 (0.47, 0.60) (0.73, 0.81) (0.16, 0.26)
Received at least one RI Penta vaccine strict (self-report)
0.52 0.76 0.21 < 0.001 (0.45, 0.58) (0.71, 0.80) (0.17, 0.26)
Received at least one RI Penta vaccine loose (self-report and card correction)
0.54 0.77 0.21 < 0.001 (0.47, 0.60) (0.73, 0.81) (0.16, 0.25)
Received at least one RI Penta vaccine strict (self-report and card correction)
0.53 0.77 0.21 < 0.001 (0.47, 0.60) (0.72, 0.81) (0.16, 0.26)
Note 1: The 'loose definition' counts all vaccines for which it was unclear whether they were an RI (or a campaign vaccine) as RI vaccines. The 'strict definition' only includes vaccines that were reported to have been RI vaccines (all unclear vaccines are assumed to have been campaign vaccines).
Note 2: The treatment and control means are weighted for sampling probabilities but not adjusted for covariates. Adjusted OLS Results are the treatment coefficient from a multivariate regression controlling for the covariates listed in the methods section. Accordingly, the difference between treatment and control means is not equal to the treatment coefficient, though both results show substantial, positive impact.
Final Evaluation Report
page 62
Given that the reported campaigns did not usually target BCG or Penta vaccines, these results are
expected. The RI Measles vaccine impact estimate is higher than the RI BCG vaccine impact estimate,
and comparable to the Penta vaccine impact estimate. This is an important result as it suggests that
campaigns explain why the unadjusted impact estimate is lower for Measles vaccine than for BCG
vaccine and Penta vaccine. RI control group coverage for Measles vaccine is also comparable to
control coverage for Penta vaccine, if not a bit lower depending on the definition used.
There remains some uncertainty about true RI Measles vaccine coverage and impact. Caregivers’
recall of the activity via which their child received the vaccination is imperfect. Furthermore,
vaccinations cards were missing for many children (especially in control) implying that the card-based
corrections are imperfect, as well.
Conclusion: Adjusting for the CEA
The increase in coverage in control areas since baseline is not fully explained by methodological
changes or by campaigns. Coverage for all three primary outcomes appears to have increased via
routine immunization activities. For BCG and Penta vaccines, campaigns do not account for any
meaningful proportion of vaccinations in control areas. Accordingly, we would assume that nearly all
of the vaccinations recorded in the control group for BCG vaccine and Penta vaccine represent always-
vaccinators who receive vaccinations through RI activities. If we assume that the NI-ABAE CCTs for RI
Program pays incentives for all RI-delivered vaccinations, then control coverage is a reasonable proxy
for the number of incentives paid to always-vaccinators for BCG and Penta vaccines.
For the Measles vaccine, we expect that control coverage included a non-trivial proportion of
campaign-vaccinators to whom the program may not always pay incentives. There remains
uncertainty about the precise proportion, and our data only allows us to generate approximations.
However, our best-guess is that RI Measles vaccine coverage in control is about 48% (or 11 percentage
points lower than unadjusted self-reports coverage). This value falls in the middle of our various RI-
only coverage estimates, which range from 44% to 53% depending on the adjustments applied.108 If
GiveWell assumes that a large proportion of campaign-delivered vaccinations do not lead to program
enrollment, then GiveWell should make a downward adjustment to control Measles vaccine coverage
before using it as an estimate of enrolled always-vaccinators.109
Similarly, there is evidence that the impact estimate for the Measles vaccine is higher when restricted
to vaccinations delivered via RI activities. Given that campaigns appear to occur infrequently (but one
did occur just before endline), it is likely that the program would have a higher impact on Measles
vaccine in non-post-campaign periods. We recommend that GiveWell considers an upward
adjustment to the Measles vaccine impact estimate. Again, our best-guess would constitute the
108 In addition to its falling in the middle of this range, this value is also that produced by assuming that unclear reports are RI vaccinations and applying card-based adjustments. Most vaccinations in the full sample are RI, so it is likely that most unclear reports are as well. We also expect that cards, when present, are an accurate source for vaccination activity (i.e. a child with Measles vaccine on an RI card probably got Measles vaccine via RI). These factors lead us to choose this estimate as our best-guess. 109 Card data suggests that relatively few campaign vaccinations result in caregivers’ receiving the incentive. However, we recommend GiveWell also discuss this further with NI-ABAE as card data is not perfect and there may be further insights to be gained from process and field observations of program staff.

Final Evaluation Report
page 63
impact estimate of 22 percentage points obtained when using the loose card adjusted RI-only
coverage rates.
In the next section, we will discuss self-reported data quality, which may imply further adjustments
to both control coverage and the impact estimate. We recommend GiveWell to make any such
additional adjustments to the already adjusted Measles vaccine coverage rate and impact estimate
described in this section. This section has tried to quantify the campaign effect on self-reported
Measles vaccine coverage and impact. The next section deals with the wider issue of measurement
error in self-reports which is of substantial importance for the self-reported coverage rates of all
vaccines.
Quality of Self-Reports
There are no perfect measures of vaccination status; even gold-standard tests for biological immunity
include error. Our primary data source for this evaluation was self-reported coverage. However, given
that self-reported data is prone to recall error and social desirability bias, we collected various sources
with the intent of using them to supplement, cross-check, and assess the quality of self-reports.110
Namely, endline provided the following additional imperfect sources of vaccination information: 1)
CHCs and other health cards available at the household; 2) CIRs stored at clinics; and 3) BCG vaccine
scars (for BCG vaccine only). Like self-reported coverage, each of these sources was subject to
measurement error, which can lead to misleading conclusions if not accounted for:
1. Measurement error that is not affected by/correlated with the treatment induces downward
bias in the impact estimate as measured by binary (“yes/no”) variables.111
2. When measurement error is correlated with treatment, it can lead to an upward or downward
bias in the impact estimate.112
3. Measurement error can bias coverage estimates in either direction.
Absent information on whether and the extent to which these effects occurred, we cannot be certain
if our coverage and impact estimates were higher or lower than the truth.113 We can, however,
explore the consistency of results across multiple sources that each measures the same outcome to
110 Importantly, we explored the use of oral-fluid biomarker testing, which ultimately proved infeasible in our context. Even biomarkers, however, are imperfect. Researchers seeking to estimate true immunity are always left with some uncertainty derived from imperfection in the available data sources. 111 In other words, if our measures are imperfect (which we know they are) but are equally imperfect in treatment and
control, then they cause the impact estimate to be smaller than the true impact. 112 For example, if NI-ABAE makes vaccinations more memorable, then more vaccinations will be recorded in treatment than
in control for any true impact, making the impact estimate higher than it would be if recall were equal in the two groups.
Similarly, if the program increases the social desirability of reporting vaccination, then more vaccinations may be falsely
reported in treatment than control, making the impact estimate higher than it would be if social desirability were equal in
the two groups. 113 See Appendix M for additional examples and explanation of the implications of measurement error. See Appendix C for detailed description of in-field data quality measures employed at endline to maximize data quality.

Final Evaluation Report
page 64
shed light on the extent to which measurement error could make our observed results differ from
true coverage and impact.114
Coverage and Impact According to Various Measures
Impact is positive and large regardless of the coverage source analyzed.
We looked at coverage according to each data source we had: self-reports, cards, CIRs, and BCG
vaccine scar (for BCG vaccine only). We should not treat these measures equally as their limitations
differ. Self-reports were subject to recall and social desirability bias, while administrative records
(cards and CIR) were not. Cards and CIR, however, were limited by record keeping quality – clinic staff
may forget to make a record, run out of blank records, lose a record, or invent a record. In the case of
cards, caregivers might lose them or forget to bring them to a vaccination visit. In the case of CIRs,
clinic staff may not update them for vaccinations given outside the clinic or on particularly busy days.
The quality of these measures may also be affected by the program itself, via its awareness activities
and emphasis on record-keeping. BCG vaccine scars, meanwhile, have the advantage of being a
biological marker that is highly unlikely to be affected by treatment status. They are still imperfect,
however; not every child scars, and enumerators may not correctly find and identify every scar.
We might expect cards to be more accurate than self-reports based on the assumption that caregivers
have difficulty recalling all vaccinations, while written records should not be subject to this problem.
This is only true, however, when a card is present for the enumerator to find and record. Card
possession is relatively high in our sample but not perfect and appears to be affected by treatment
status: in the treatment group, 89% [95% CI: 87%, 91%] of children with BCG vaccine scars also had a
vaccination card of any kind while in the control group, 69% of children with BCG vaccine scars had
cards [95% CI: 65%, 74%].115
Figures 16-18 present coverage in treatment and control based on several sources. In each graph, the
bars illustrate coverage for one vaccine as measured by each of self-reports, immunization cards (CHC
and others), and CIRs. For BCG vaccine, the figure also includes BCG vaccine scars and scars plus self-
reports. For each measure, there is a bar showing coverage in treatment and a bar showing coverage
in control. The difference between the two is an impact estimate for the NI-ABAE CCTs for RI Program
according to that data source or combination of data sources.
Impact was positive (and almost always statistically significant) regardless of the source used.
However, precise coverage and impact varied widely depending on the source, largely because of
each source’s limitations. Coverage was generally highest according to self-reports and cards and
lowest according to CIRs. Differences between treatment and control coverage (impact estimates
114 The analysis in this section includes the 15 observations from Kairu PHC, which were excluded from the main analysis due to missing baseline data. As no baseline data is used in this section, we decided to include these additional observations. 115 We limited this analysis to children with BCG vaccine scars as we expected that card possession was affected by
vaccination status. (In the extreme, there is little reason to expect a child who has never been vaccinated to have a card).
Accordingly, any analysis of card possession in treatment versus control must attempt to account for true vaccination –
comparing with BCG vaccine scars was one simple way to do that and had the advantage that we did not expect treatment
to influence.

Final Evaluation Report
page 65
without covariates) according to self-reports were about 20 percentage points for BCG vaccine, 24
percentage points for Penta vaccine, and 16 percentage points for Measles vaccine. According to
cards, impact estimates were much larger: 30 percentage points for BCG vaccine, 30 percentage
points for Penta vaccine, and 34 percentage points for Measles vaccine. This difference is largely
explained by differences in card retention between treatment and control, as explained above.
For CIRs, we had far fewer records in both treatment and control, leading to lower coverage for all
three vaccines. The largest drop-off from card-based coverage to CIR coverage was for Measles
vaccine where treatment coverage was 72% [95% CI: 67%, 76%] according to cards and 28% [95% CI:
24%, 32%] according to CIRs, and control coverage was 37% [95% CI: 32%, 42%] according to cards
and about 15% [95% CI: 12% to 18%] according to CIRs. This may be partially due to campaigns and
outreach, since vaccines given during these activities were less likely to be recorded in CIRs but were
often recorded on cards. It may also be due to the difficulty of both maintaining CIRs (for clinic staff)
and recording them (for enumerators).116 We expected CIR-only coverage to be low for data quality
reasons and, so, expect that true coverage in both the treatment and the control groups is
substantially higher than the CIR-only estimates.
Figure 16. BCG Vaccine Coverage According to Various Data Sources (95% CI)
116 CIRs are difficult to maintain: they require writing in several pieces of information for a child initially and then finding that
child’s record on every subsequent visit to add new vaccinations. CIR booklets are large, so clinic staff may not bring them
to outreach immunization sessions, forcing them to record outreach vaccinations in a separate CIR or update the CIR upon
their return. CIRs are also tied to particular clinics – children who receive vaccinations at a clinic we did not survey will not
show up in CIRs. We visited both study clinics and alternate clinics that a large proportion of caregivers reported visiting for
immunizations – however, there may be alternate clinics we did not visit, causing us to miss records kept there. CIR data
was also challenging for enumerators to record: they had to search through dozens of pages of records and try to match
demographic information from the household survey to that recorded in the CIR. Alternate names, misspellings, typos in
birthdates, and enumerator error or lack of thoroughness could have led to missing a record during data collection.
63% 41% 27% 41% 39%83% 72% 37% 66% 62%0%
10%
20%
30%
40%
50%
60%
70%
80%
90%
100%
Self-Reports Cards CIR Scar Self-reports, Scar
Control Treatment 95% Confidence Interval

Final Evaluation Report
page 66
Figure 17. Penta Vaccine Coverage According to Various Measures (95% CI)
Figure 18. Measles Vaccine Coverage According to Various Measures (95% CI)
Coverage remained high when considering vaccinations reported/recorded by both self-reports and
cards, suggesting a high degree of agreement between these two sources.
For BCG vaccine, coverage according to scars was comparable to coverage according to cards and
lower than that according to self-reports, while impact was higher according to both scars (25
percentage points) and cards (30 percentage points) than according to self-reports (20 percentage
points).
54% 41% 28%78% 71% 37%0%
10%
20%
30%
40%
50%
60%
70%
80%
90%
100%
Self-Reports Cards CIR
Control Treatment 95% Confidence Interval
59% 37% 15%75% 72% 28%0%
10%
20%
30%
40%
50%
60%
70%
80%
90%
100%
Self-Reports Cards CIR
Control Treatment 95% Confidence Interval

Final Evaluation Report
page 67
That all these data sources show large positive impact makes it highly likely that true impact is also
positive.117 This directional agreement is indicative but leaves considerable uncertainty as to specific
coverage and impact. The next section looks more closely at the correspondence among coverage
sources and explores what this reveals about their quality and therefore what they tell us about the
truth.
Correspondence Among Sources and Sensitivity and Specificity of Self-Reports
Given that our primary outcomes were measured using self-reports, this section focuses on assessing
self-report quality using information from other measures.
Measurement error for binary outcomes can be summarized by two statistics: sensitivity and
specificity. Sensitivity is the probability that the measure shows a positive value given that the true
outcome is positive (i.e. the probability of a positive self-report for a truly vaccinated child). Specificity
is the probability that the measure shows a negative value given that the true outcome is negative
(i.e. the probability of a negative self-report given for a truly non-vaccinated child).
Sensitivity of Self-Reports
We investigated the sensitivity of self-reports using the information from card and CIR data, which
was available for all vaccines (BCG vaccine, Any Penta vaccine, and Measles vaccine), and BCG vaccine
scars for BCG vaccine. This data only allows us to draw conclusions if we are willing to make certain
assumptions about the accuracy of vaccine cards, CIRs, and BCG vaccine scars, themselves.
To approximate the sensitivity of self-reports, we first assumed that every child with a positive entry
for the respective vaccine on a CHC (or any other vaccination card), in a CIR, or based on a BCG
vaccine scar was truly vaccinated.118 We then approximated the sensitivity of self-reports as:
Self-report sensitivity = Positive self-report / Positive entry in other measure119
Sensitivity was relatively high for BCG vaccine, Penta 1 vaccine, and Measles 1 vaccine and was
higher in treatment than in control. Sensitivity was highest for BCG vaccine and lowest for any Penta
vaccine (Table 20). BCG vaccine sensitivity was higher when using scars than when using either cards
or CIRs. Overall, these relationships among the estimated sensitivities for the different vaccines were
of reasonable magnitude and in line with expectations. The BCG vaccine commonly leaves a scar and
is also amongst the first vaccines children receive. This should make it relatively easy for caregivers to
remember. We would also have expected that it is easier for a caregiver to remember that their child
117 This is especially true for data sources whose error was less-likely to be correlated, such as CIRs and self-reports or BCG
vaccine scars and CIRs. It is difficult to think of reasons why both a record made at a clinic at the time of vaccination and the
development of a scar several days/weeks after that vaccination would have similar results except if they were both
influenced by a true vaccination. They have little in common other than the truth. 118 Cards + CIR sensitivity calculates the share of positive self-reports out of all children with a positive card and CIR record. We can be very confident that these children were truly vaccinated. 119 Note that we used division to simplify the intuition. The cases in the numerator were restricted to those in which the
denominator took a positive value (i.e. a self-reported vaccination for a child who does not have a positive record on their
card is excluded from the measure altogether). In other words, these measures were bounded by 0 and 1.

Final Evaluation Report
page 68
received Penta 1 vaccination but that it can be difficult to recall the exact number of Penta
vaccinations received. Lastly, that scar-based sensitivity was highest was also unsurprising given that
this measure restricted the sample to those BCG vaccinations that left a physical reminder (the scar)
on the child and tests whether caregivers report them.
Table 20. Self-Report Sensitivity for the Primary Vaccines Based on Other Data Sources
Estimate
(%)
Estimate
(%)
Estimate
(%)
BCG BCG BCG
Control (n = 908) 90 88 93 Control (n = 579) 89 86 93 Control (n = 396) 93 90 96
Treatment (n = 2116) 97 96 98 Treatment (n = 1094) 93 92 95 Treatment (n = 948) 97 96 98
Total (n = 3024) 95 94 96 Total (n = 1673) 92 90 94 Total (n = 1344) 96 94 97
Penta1 Penta1 Penta1
Control (n = 892) 85 80 89 Control (n = 588) 80 75 86 Control (n = 391) 87 83 92
Treatment (n = 2079) 95 93 96 Treatment (n = 1053) 91 88 94 Treatment (n = 914) 95 93 97
Total (n = 2971) 92 90 94 Total (n = 1641) 87 84 90 Total (n = 1305) 93 90 95
Penta2 Penta2 Penta2
Control (n = 834) 69 64 75 Control (n = 540) 65 59 71 Control (n = 356) 72 67 78
Treatment (n = 2059) 86 84 89 Treatment (n = 1022) 84 80 87 Treatment (n = 893) 88 85 91
Total (n = 2893) 82 79 85 Total (n = 1562) 77 73 81 Total (n = 1249) 83 80 86
Penta3 Penta3 Penta3
Control (n = 777) 57 51 63 Control (n = 482) 55 49 61 Control (n = 328) 62 55 68
Treatment (n = 2039) 76 72 80 Treatment (n = 966) 72 67 76 Treatment (n = 844) 76 72 80
Total (n = 2816) 71 67 74 Total (n = 1448) 66 62 70 Total (n = 1172) 72 68 76
Measles Measles Measles
Control (n = 828) 84 80 88 Control (n = 323) 81 76 87 Control (n = 242) 87 82 92
Treatment (n = 2116) 90 87 92 Treatment (n = 832) 88 85 91 Treatment (n = 739) 91 88 93
Total (n = 2944) 88 86 90 Total (n = 1155) 86 83 89 Total (n = 981) 90 88 92
Using cards Using CIR Using cards + CIR
95% CI 95% CI 95% CI
Estimate
(%)
BCG
Control (n = 866) 98 97 99
Treatment (n = 1857) 98 98 99
Total (n = 2723) 98 98 99
Using scars
95% CI

Final Evaluation Report
page 69
This exercise calculated sensitivity of self-reports according to other available data sources. However,
the measure that we ultimately care about is the sensitivity of self-reports according to a child’s true
vaccination status. While we cannot know the true sensitivity of self-reports, based on what we do
know, we believe that sensitivity is likely lower than that calculated according to these measures. This
is based on the assumptions that underlie the measures and the direction and extent to which we
expect reality to depart from those assumptions. Specifically, the calculated sensitivities assume that
the lack of a record means that the child was not vaccinated. This will leave out vaccinations that
occurred but were not recorded from the denominator. For cards, we expect that some caregivers of
vaccinated children never received a card, lost the card, or did not show the card to the enumerator.
For CIRs, we expect that clinic staff failed to record some vaccinations that occurred, that some
children were vaccinated at clinics whose records we did not check, and that enumerators failed to
find some records. For scars, we expect that some portion of children who received BCG vaccine did
not scar and that enumerators failed to find some proportion of scars.
In all of these cases, therefore, our calculated measure will fail to include a true vaccination (since
there is no record of it) in the denominator. The effect this has on the calculated sensitivity (relative
to the true sensitivity) depends on what happens in the numerator. If self-report sensitivity is lower
in cases in which there is no record of the vaccine than in cases where there is a record, then the
calculated measure is higher than the truth. For cards and scars, we would expect the record itself to
aid caregiver recall (since these records are present in the home), meaning that self-report sensitivity
should be lower (fewer true positives to add to the numerators) in this sub-group. For CIRs, our
expectation is less clear but the sample size with positive CIRs is also relatively small, so we hesitate
to draw too many conclusions from it. We expect, then, that our calculated sensitivities are
overestimates of the actual sensitivity of self-report.120
The fact that sensitivity was higher in treatment than in control may suggest that the program’s
awareness-building activities and the act of receiving cash make vaccination more salient and
memorable in caregivers’ minds. If true, this means that the downward bias in the impact estimate
induced by measurement error that occurs in both groups is partially counteracted by an upward bias
induced by improved reporting in treatment relative to control. We explore this further below while
also accounting for specificity.
Specificity of Self-Reports
In addition to sensitivity, we investigated the specificity of self-reports using the same approach.
Determining a reasonable approximate estimate for specificity using card/CIR data is more difficult
than for sensitivity. We have at least some degree of confidence (the exception being falsified cards)
120 Strictly, this is only true if self-report sensitivity is lower in cases in which there is no record of the vaccine than in cases where there is a record. If we knew true vaccination status, we could add the unrecorded vaccinations back in to the denominator of our sensitivity measure. To calculate true sensitivity, we would then also have to add the corresponding self-report to the numerator. For cards and scars, we would expect the record itself to aid caregiver recall (since these records are present in the home), meaning that self-report sensitivity should be lower (fewer true positives to add to the numerators) in this sub-group. For CIRs, our expectation is less clear but the sample size with positive CIRs is also relatively small, so we hesitate to draw too many conclusions from it.

Final Evaluation Report
page 70
that a child that has a vaccine recorded on a vaccination card actually did receive the vaccine.
However, we have less confidence in the related assumption for specificity that a child who did not
have a vaccine recorded (or had no vaccine record at all) did not actually receive the vaccine. A child
may have been missing a record for a variety of reasons that were unrelated to vaccination status.
In this section, we used the percentage of children whose caregiver reported that the child did not
receive the vaccine among children who did not have a given vaccine recorded on a card or CIR (or
did not have a scar in the case of BCG vaccine) as an approximation of the specificity of self-reports:
Self-report specificity = Negative self-report / No positive entry from other source
This treated both children with records that did not have the vaccine recorded and children who did
not have a record at all as “non-vaccinated.”121 In other words, the lack of a positive record of a
vaccination was interpreted as the lack of a vaccination.
Across measures, specificity was much lower than sensitivity by these approximations.122
For BCG vaccine, we found that among the control group, specificity based on scars was higher than
that based on cards or CIRs, while among the treatment group, scar-based specificity fell between the
two records-based measures. As in the case of card/CIR data, we know that at least some children
counted as non-vaccinated by this measure were actually vaccinated but failed to scar. Hence, the
approximate specificity based on scars, like that based on cards and CIRs, is almost certainly lower
than the true specificity.
121 The measure cards + CIR counts a child as unvaccinated only if there was neither a card nor a CIR record of that vaccination. 122 As discussed earlier, we can be confident that a meaningful proportion of these children were actually vaccinated and
simply lost their card or did not get it filled out when the vaccination occurred. The current measure assumes that none of
these cases are truly vaccinated. In cases where one of these children is truly vaccinated and the caregiver reports as much,
the measure counts this as a false positive, reducing specificity. The more cases like this that exist in the data, the higher
would be true specificity relative to this measure.

Final Evaluation Report
page 71
Table 21. Self-Reports Specificity Based on Other Sources
We expect these calculated specificities to be substantially lower than true specificity. This is because
it was very likely that some truly vaccinated children did not have records. When this occurred, the
measure treated them as unvaccinated, incorrectly adding them to the denominator of the calculated
Estimate
(%)
Estimate
(%)
Estimate
(%)
BCG BCG BCG
Control (n = 1293) 56 51 62 Control (n = 1622) 47 40 53 Control (n = 1110) 62 57 68
Treatment (n = 839) 55 49 60 Treatment (n = 1861) 24 19 29 Treatment (n = 693) 60 54 66
Total (n = 2132) 56 51 60 Total (n = 3483) 34 30 39 Total (n = 1803) 62 58 66
Penta1 Penta1 Penta1
Control (n = 1309) 67 61 72 Control (n = 1613) 55 49 62 Control (n = 1112) 73 68 78
Treatment (n = 876) 63 58 68 Treatment (n = 1902) 30 25 35 Treatment (n = 737) 68 63 73
Total (n = 2185) 65 61 69 Total (n = 3515) 42 36 47 Total (n = 1849) 71 67 75
Penta2 Penta2 Penta2
Control (n = 1367) 79 74 83 Control (n = 1661) 69 63 75 Control (n = 1183) 83 79 87
Treatment (n = 896) 73 67 78 Treatment (n = 1933) 39 34 45 Treatment (n = 767) 77 73 81
Total (n = 2263) 76 73 80 Total (n = 3594) 53 48 58 Total (n = 1950) 81 78 84
Penta3 Penta3 Penta3
Control (n = 1424) 85 81 89 Control (n = 1719) 77 72 83 Control (n = 1270) 88 85 91
Treatment (n = 916) 78 73 83 Treatment (n = 1989) 47 41 53 Treatment (n = 794) 81 77 85
Total (n = 2340) 82 79 85 Total (n = 3708) 61 56 66 Total (n = 2064) 85 83 88
Measles Measles Measles
Control (n = 1373) 56 52 60 Control (n = 1878) 45 40 50 Control (n = 1292) 57 53 62
Treatment (n = 839) 64 59 69 Treatment (n = 2123) 31 26 36 Treatment (n = 746) 68 63 72
Total (n = 2212) 59 56 62 Total (n = 4001) 38 34 41 Total (n = 2038) 61 58 64
Using cards Using CIR Using cards + CIR
95% CI 95% CI 95% CI
Estimate
(%)
BCG
Control (n = 1234) 61 55 67
Treatment (n = 970) 48 42 54
Total (n = 2204) 55 50 60
Using scars
95% CI

Final Evaluation Report
page 72
specificity. This then also added their self-reports to the numerator. It is reasonable to assume that
caregivers of truly vaccinated children who are missing records are more likely to report a vaccination
than caregivers of truly unvaccinated children (because true vaccination status does affect self-
reports). Therefore, our calculated measures – by including these cases and treating them as false
positive reports – are likely lower than true specificity.123
While it is also notable that approximate specificity was usually higher for control than for treatment,
these results should be interpreted with substantial caution. There exist several possible
interpretations, not all of which imply that true specificity is lower in treatment. As long as there is
true program impact, we would expect the approximate specificity measure to be higher in control
than in treatment even if card ownership rates and the true underlying specificity are the same in
treatment and control.124
Implications for Impact Estimates and Coverage
Based on other sources, we expect that the true sensitivity of self-reports is less than the roughly 95%
approximation using vaccination cards, though we are unsure by how much. Similarly, we expect that
true self-reports specificity is higher than the roughly 60% approximations using vaccination cards and
CIRs, though we are unsure by how much. With this starting point, we explored the effect of a wide
variety of different assumed sensitivity and specificity on coverage and impact estimates. We found
that adjusted impact was almost always higher than that implied by unadjusted self-reports.125
This result is consistent with that implied by BCG vaccine scars, which – unadjusted – show an impact
of 23 percentage points. We know, however, that BCG vaccine scars are also an imperfect measure,
though their error is highly likely to be similar in treatment and control. Literature suggests that
around 90% of children vaccinated with BCG develop a scar (Dhanawade 2015). We assume, however,
that enumerators failed to find scars in some number of cases so that scar sensitivity is somewhat less
than 90%. Scar specificity should be virtually 100% since a BCG vaccine scar cannot develop without a
BCG vaccination. However, some enumerators may have misidentified birth marks or non-vaccination
scars as BCG vaccine scars. Therefore, we might expect that true scar specificity is slightly less than
100%. Importantly, since we are confident this error is similar in treatment and control, we know it
will bias the impact estimate toward zero. Therefore, we can be even more confident that true impact
is higher than the 25 percentage points found using unadjusted scars.
123 This effect is likely at play for all measures but particularly for CIRs given how difficult it was to match CIR records.
Unsurprisingly, specificity as estimated using CIRs was noticeably lower than that estimated using cards or scars. 124 For example, imagine that there are 100 children each in treatment and control. 60 children in control, and 80 children
in treatment are truly vaccinated. Assume that the sensitivity and specificity of self-reports is 100% - self-reports are
completely accurate. Assume that - in both treatment and control - all non-vaccinated children have no vaccine recorded on
a vaccination card (so 40 children in control, and 20 in treatment). In both treatment and control, 50% of vaccinated children
have a vaccination card with the vaccine recorded on it (so 30 in control, and 40 in treatment). We can now calculate our
estimated specificity measure: Control group: 40 / (40 + 30) = 40/70 = 57%; Treatment group: 20 / (20 + 40) = 20/60 = 33%. 125 For example, assuming BCG vaccine self-report sensitivities between 80% and 97% in treatment and 80% and 90% in control, specificities between 70% and 90% in both groups, and minimal difference between treatment and control in these measures, we found that impact cannot be lower than about 19 percentage points and can be substantially higher. Relaxing the assumption that sensitivity and specificity are similar in treatment and control produced wider bounds, but still usually implied impact estimates greater than the 16.4 percentage points according to unadjusted self-reports.

Final Evaluation Report
page 73
For control coverage, measurement error can theoretically produce an upward or downward bias.
However, when analyzing a large range for scar sensitivity and specificity, we always found control
coverage to be below the 63% measured by self-reports.126 This suggests that control coverage for
BCG vaccine is very likely to be lower than that estimated using self-reports.
Other Vaccines
We do not expect self-report sensitivity and specificity for BCG vaccine to accurately represent other
vaccines. In particular, we expect self-report sensitivity to be higher for BCG vaccine than for other
vaccines (as we see using our approximate measures). However, we would expect that program
impact was similar across vaccines, especially since this was also a trend across sources. We also
expect bias in control coverage as measured by self-reports was broadly similar across vaccines. Given
that true BCG vaccine coverage was almost certainly lower than the self-reports estimate (perhaps
substantially so), this is also likely the case for other vaccines. We therefore recommend that
GiveWell use similar (directional) adjustments for impact estimates and control coverage for BCG
vaccine, Penta vaccine, and Measles vaccines.
126 We allowed scar sensitivity as low as about 79% and as high as about 95% and scar specificity of as low as about 85%
and as high as about 98%. Combinations in these ranges never produced control coverage higher than about 50%

Final Evaluation Report
page 74
Conclusion and Recommendations for GiveWell
Impact of New Incentives – All Babies Are Equal Initiative CCTs
for RI Program
The NI-ABAE CCTs for RI Program had a large, consistent positive impact on vaccination coverage.
According to both primary and secondary outcomes, the NI-ABAE CCTs for RI Program had a
substantial positive impact on vaccination. This impact held across a wide range of specifications and
was consistently statistically significant, usually at better than the 0.1% level.
Based on self-report error, we recommend GiveWell adjust impact estimates upward for all
vaccines.
• Impact estimates were positive across data sources. This suggests that there is a true and
meaningful impact on vaccination not explainable by measurement error alone.
• Plausible assumptions about data quality usually implied upward adjustments. Making plausible
assumptions about self-report measurement error and using them to adjust coverage and impact
always generates positive impact, though with a great deal of remaining uncertainty about its size.
Most of this uncertainty in the upward direction: most plausible adjustments produce impact
estimates greater than unadjusted self-reports impact estimates, especially if we assume
measurement error is similar in treatment and control. Using BCG vaccine scars – also corrected
for measurement quality – yields a range for impact on BCG vaccination that is entirely and
meaningfully higher than unadjusted self-reports. While it is difficult to extrapolate measurement
error from BCG vaccine to other vaccines, we find it likely that impact is similar across vaccines.
We recommend that GiveWell apply a somewhat larger upward adjustment to Measles vaccine
than to the other vaccines.
For Measles vaccine, our impact estimate was higher when restricted to vaccinations delivered via RI
activities. Given that large Measles vaccine campaigns appear to occur infrequently (but one did occur
just before endline), it is possible that the program would have a higher impact on Measles vaccine in
normal, non-post-campaign periods.
The Counterfactual – Areas without NI-ABAE
Based on self-report error, we recommend GiveWell adjust control coverage estimates downward
for all vaccines.
Adjusting control coverage for self-report sensitivity and specificity produced ranges on either side of
the coverage estimate according to unadjusted self-reports. Control coverage according to BCG
vaccine scars (adjusted for scarring probability and scar-recording probability), however, falls well
below the self-reports level. This suggests that true BCG vaccine coverage in control is likely to be
below that measured by self-reports. We recommend GiveWell adjust control coverage down for BCG
vaccine based on self-report error. It is difficult to extrapolate this finding to other vaccines, but we

Final Evaluation Report
page 75
would recommend that GiveWell also assume true coverage for Penta 1 vaccine and Measles 1
vaccine in control is lower than that found via unadjusted self-reports.
We recommend that GiveWell assume RI-only coverage for Measles 1 vaccine is roughly 11
percentage points lower than unadjusted coverage.
Coverage in control areas at endline was higher than at baseline even after considering the effect of
including Jigawa State and changes in measurement methods between the two rounds. Campaigns
reported during the study window targeted Measles vaccine but not BCG or Penta vaccines. For
Measles vaccine, we found that control coverage included a non-trivial proportion of campaign-
vaccinators to whom the program might not pay incentives.
Summarized Recommendations for the CEA
• Adjust self-report impact estimates upward for all vaccines (due to measurement error). Make a
larger upward adjustment for Measles vaccine (due to campaigns)
• Adjust self-report control coverage downward for all vaccines (due to measurement error), with
the largest downward adjustment for Measles vaccine (due to campaigns)

Final Evaluation Report
page 76
References
Banerjee, A.V., Duflo E., Glennerster R., Kothari, D. 2010. “Improving immunization coverage in rural
India: clustered randomized controlled evaluation of immunization campaigns with and
without incentives.” BMJ; 340: c2220
Chandir, S; Khan, A.J., Hussain, H., Usman, H.R., Khowaja, S., 2010. “Effect of food coupon incentives
on timely completion of DTP immunization series in children from a low-income area in
Karachi, Pakistan: A longitudinal intervention study.” Vaccine; 28 pp. 3473-3478.
Dhanawade, S. S., Kumbhar, S. G., Gore, A. D., & Patil, V. N. 2015. Scar formation and tuberculin
conversion following BCG vaccination in infants: A prospective cohort study. Journal of Family
Medicine and Primary Care, 4(3), 384–387.
Gibson, D. G., Ochieng, B., Kagucia, E. W., Were, J., Hayford, K., Moulton, L. H., ... Feikin, D.
R. 2017. “Mobile phone-delivered reminders and incentives to improve childhood
immunization coverage and timeliness in Kenya (M-SIMU): a cluster randomised controlled
trial.” The Lancet Global Health, 5(4), e428-e438.
Lagarde, M., Haines, A., Palmer, N., 2007. “Conditional Cash Transfers for Improving Uptake of
Health Interventions in Low- and Middle-Income Countries”. JAMA; 298, no. 16: 1900-1910
Loevinsohn, B.P., Loevinsohn, M.E., 1986. “Improvement in Coverage of Primary Health Care in A
Developing Country Through Use Of Food Incentives.” The Lancet pp. 1314-1316
National Bureau of Statistics (NBS) and United Nations Children’s Fund (UNICEF). 2017. “Multiple
Indicator Cluster Survey 2016-17, Survey Findings Report.” Abuja, Nigeria: National Bureau of
Statistics and United Nations Children’s Fund.
National Population Commission (NPC) [Nigeria] and ICF International. 2014. “Nigeria Demographic
and Health Survey (DHS) 2013.” Abuja, Nigeria, and Rockville, Maryland, USA: NPC and ICF
International.
National Routine Immunization Strategic Plan (NRISP) Advisory Committee. 2013. “National Routine
Immunization Strategic Plan 2013-2015: Intensifying Reaching Every Ward through
Accountability.” Abuja, Nigeria: Federal Ministry of Health – Nigeria.
Nigeria Centre for Disease Control (NCDC). 2016. “Weekly Epidemiology Report”. Abuja, Nigeria:
Federal Ministry of Health – Nigeria.
UNICEF (United Nations Children’s Fund). 2017. “Child Mortality Report.” Washington, DC: United
Nations Children’s Fund.

Final Evaluation Report
page 77
UNICEF DATA. 2019. Vaccination and Immunization Statistics [Internet]. Available from:
https://data.unicef.org/topic/child-health/immunization/
WHO (World Health Organization). 2017. “GVAP 2017 Coverage Scorecards.” Geneva: World Health
Organization