The Life Experiences of Women With Cerebral Palsy ... - OHSU

Early postnatal hypotension is not associated with indicators ofwhite matter damage or cerebral palsy in extremely lowgestational age newborns
J. Wells Logan, MD1, T. Michael O’Shea, MD, MPH2, Elizabeth N. Allred, MS3,4,5, Matthew M.Laughon, MD, MPH6, Carl L. Bose, MD6, Olaf Dammann, MD, MS7, Daniel G. Batton, MD8,Karl C. Kuban, MD, MS9, Nigel Paneth, MD, MPH10, and Alan Leviton, MD, MS4,5 for theELGAN Study Investigators1 Betty H. Cameron Women’s & Children’s Hospital, Wilmington, NC2 Wake Forest University School of Medicine, Winston-Salem, NC3 Harvard School of Public Health, Boston, MA4 Harvard Medical School, Boston, MA5 Children’s Hospital Boston, Boston, MA6 The University of North Carolina at Chapel Hill, Chapel Hill, NC7 Floating Hospital, Tufts Medical Center, Boston, MA8 Southern Illinois University School of Medicine, Springfield, IL9 Boston University School of Medicine, Boston MA10 Michigan State University, East Lansing, MI
AbstractObjectives—To evaluate, in extremely low gestational age newborns (ELGANs), relationshipsbetween indicators of early postnatal hypotension and cranial ultrasound indicators of cerebralwhite matter damage imaged in the nursery and cerebral palsy diagnoses at 24 month follow-up.
Methods—The 1041 infants in this prospective study were born at < 28 weeks gestation, wereassessed for 3 indicators of hypotension in the first 24 postnatal hours, had at least one set ofprotocol cranial ultrasound scans, and were evaluated with a structured neurologic exam at 24months corrected age. Indicators of hypotension included: 1) lowest mean arterial pressure (MAP)in the lowest quartile for gestational age; 2) treatment with a vasopressor; and 3) blood pressurelability, defined as the upper quartile of the difference between each infant’s lowest and highestMAP. Outcomes included indicators of cerebral white matter damage, i.e. moderate/severeventriculomegaly or an echolucent lesion on cranial ultrasound, and cerebral palsy diagnoses at 24months gestation. Logistic regression was used to evaluate relationships among hypotensionindicators and outcomes, adjusting for potential confounders.
Address for correspondence: J. Wells Logan, Division of Neonatal-Perinatal Medicine, Betty H. Cameron Women’s and Children’sHospital, New Hanover Regional Medical Center, 2131 South 17th Street, Wilmington, NC 28402., [email protected].
Conflict of Interest StatementThis study was supported by a cooperative agreement with the National Institute of Neurological Disorders and Stroke(5U01NS040069-05) and a program project grant from the National Institute of Child Health and Human Development(5P30HD18655). There are no conflicts of interest, and no relationships that would in any way influence or bias this study.
NIH Public AccessAuthor ManuscriptJ Perinatol. Author manuscript; available in PMC 2012 February 01.
Published in final edited form as:J Perinatol. 2011 August ; 31(8): 524–534. doi:10.1038/jp.2010.201.
NIH
-PA Author Manuscript
NIH
-PA Author Manuscript
NIH
-PA Author Manuscript

Results—Twenty-one percent of surviving infants had a lowest blood pressure in the lowestquartile for gestational age, 24% were treated with vasopressors, and 24% had labile bloodpressure. Among infants with these hypotension indicators, 10% percent developedventriculomegaly and 7% developed an echolucent lesion. At 24-months follow-up, 6% haddeveloped quadriparesis, 4% diparesis, and 2% hemiparesis. After adjusting for confounders, wefound no association between indicators of hypotension, and indicators of cerebral white matterdamage or a cerebral palsy diagnosis.
Conclusions—The absence of an association between indicators of hypotension and cerebralwhite matter damage and or cerebral palsy suggests that early hypotension may not be importantin the pathogenesis of brain injury in ELGANs.
Keywordshypotension; mean arterial blood pressure; cranial ultrasound; ventriculomegaly; echolucentlesion; cerebral palsy; extremely preterm infants
IntroductionIn a multi-center study, we found that more than 80% of extremely low gestational agenewborns (ELGANs) were given some treatment to increase blood pressure,1 perhapsbecause it has been posited that hypotension causes brain damage in preterm newborns.2
One indicator of brain damage, cranial ultrasound abnormalities, has been associated withsystemic hypotension in several studies. 3–9 However, the majority of published studiesfound no such association.10–22 Conflicting results have also been obtained from studies ofthe association between hypotension and cerebral palsy.22–25 Moreover, there appears to beuncertainty about whether treatments for hypotension in preterm newborns are beneficial orharmful.9, 21 In summary, the literature is unclear about the relationship between systemichypotension, its treatment, and brain damage in preterm newborns.
The ELGAN Study provided the opportunity to evaluate relationships between threeindicators of hypotension during the first 24 postnatal hours, cranial ultrasound lesionsobserved during initial hospitalization, and a cerebral palsy diagnosis 24 months later.
MethodsThe ELGAN Study was designed to identify characteristics and exposures that increase therisk of structural and functional neurological disorders in ELGANs (Extremely LowGestational Age Newborns).26 During the years 2002–2004, women whose babies weredelivered before 28 weeks gestation at one of 14 participating institutions were asked toenroll in the study. The project was overseen by the National Institutes of Health, theinstitutional review boards of the 14 participating institutions, and an external PerformanceMonitoring and Safety Board (members appointed by the National Institutes of NeurologicDisorders and Stroke) at Children’s Hospital Boston. All variables and outcomes weredefined prospectively. The original ELGAN Study included training for research personnelprior to the start of the study, and multiple training sessions were held to ensure consistentapproaches to data collection. As such, this is a secondary analysis of prospectively acquireddata from the original sample of 1506 infants, born in 14 level III neonatal intensive careunits in the United States.
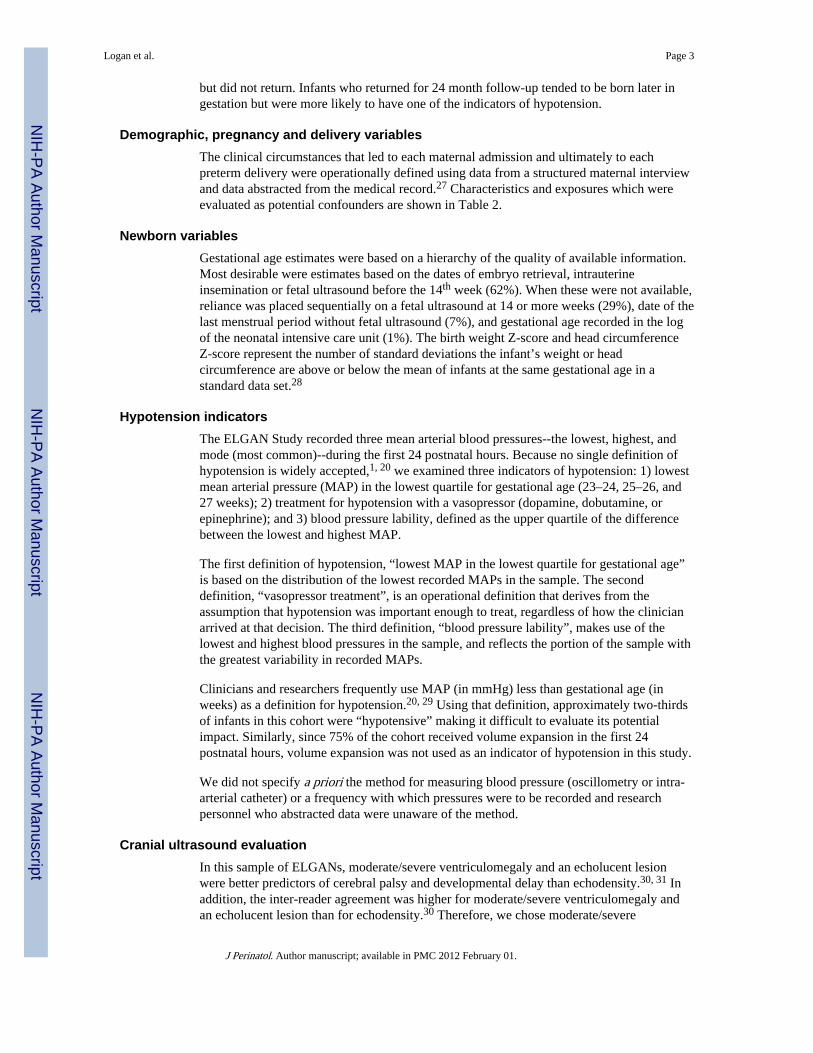
The sample of 1041 infants who are the subjects of this analysis had all three day-1hypotension measures, one or more protocol ultrasound sets, and a neurologic exam at 24months corrected age (Figure 1). To assess bias, we compared characteristics of the infantswho returned for a developmental assessment to those of the 142 infants who were eligible
Logan et al. Page 2
J Perinatol. Author manuscript; available in PMC 2012 February 01.
NIH
-PA Author Manuscript
NIH
-PA Author Manuscript
NIH
-PA Author Manuscript
but did not return. Infants who returned for 24 month follow-up tended to be born later ingestation but were more likely to have one of the indicators of hypotension.
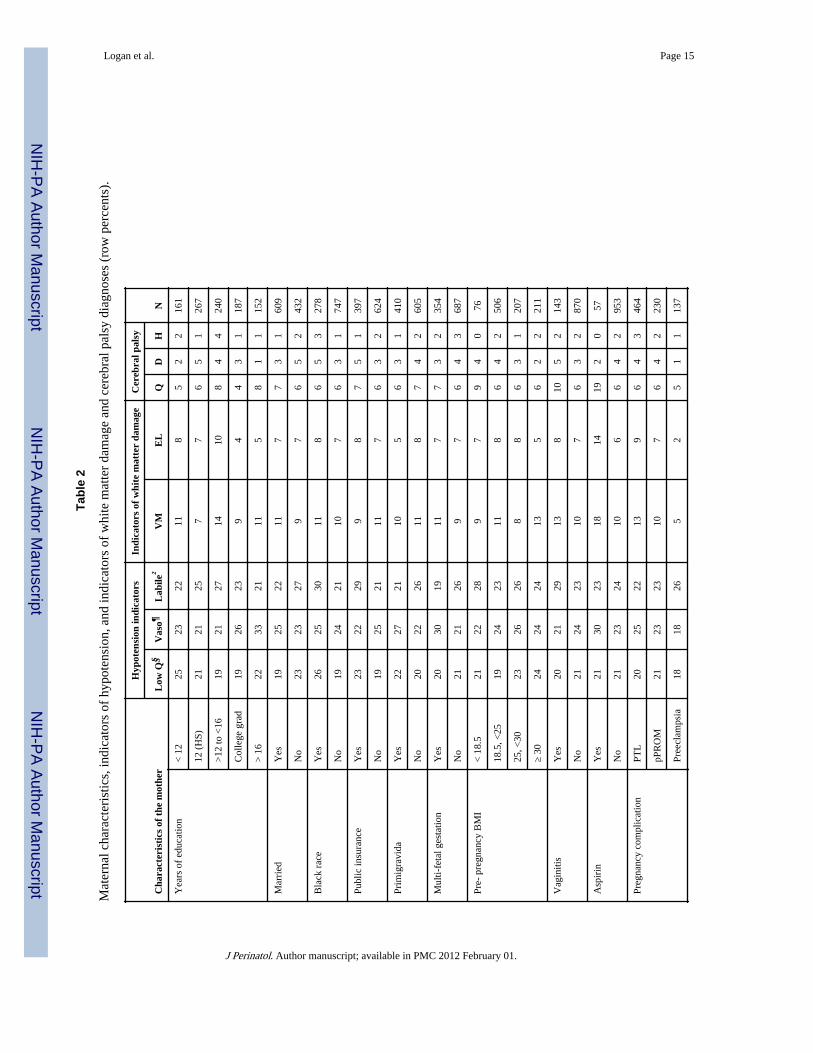
Demographic, pregnancy and delivery variablesThe clinical circumstances that led to each maternal admission and ultimately to eachpreterm delivery were operationally defined using data from a structured maternal interviewand data abstracted from the medical record.27 Characteristics and exposures which wereevaluated as potential confounders are shown in Table 2.
Newborn variablesGestational age estimates were based on a hierarchy of the quality of available information.Most desirable were estimates based on the dates of embryo retrieval, intrauterineinsemination or fetal ultrasound before the 14th week (62%). When these were not available,reliance was placed sequentially on a fetal ultrasound at 14 or more weeks (29%), date of thelast menstrual period without fetal ultrasound (7%), and gestational age recorded in the logof the neonatal intensive care unit (1%). The birth weight Z-score and head circumferenceZ-score represent the number of standard deviations the infant’s weight or headcircumference are above or below the mean of infants at the same gestational age in astandard data set.28
Hypotension indicatorsThe ELGAN Study recorded three mean arterial blood pressures--the lowest, highest, andmode (most common)--during the first 24 postnatal hours. Because no single definition ofhypotension is widely accepted,1, 20 we examined three indicators of hypotension: 1) lowestmean arterial pressure (MAP) in the lowest quartile for gestational age (23–24, 25–26, and27 weeks); 2) treatment for hypotension with a vasopressor (dopamine, dobutamine, orepinephrine); and 3) blood pressure lability, defined as the upper quartile of the differencebetween the lowest and highest MAP.
The first definition of hypotension, “lowest MAP in the lowest quartile for gestational age”is based on the distribution of the lowest recorded MAPs in the sample. The seconddefinition, “vasopressor treatment”, is an operational definition that derives from theassumption that hypotension was important enough to treat, regardless of how the clinicianarrived at that decision. The third definition, “blood pressure lability”, makes use of thelowest and highest blood pressures in the sample, and reflects the portion of the sample withthe greatest variability in recorded MAPs.
Clinicians and researchers frequently use MAP (in mmHg) less than gestational age (inweeks) as a definition for hypotension.20, 29 Using that definition, approximately two-thirdsof infants in this cohort were “hypotensive” making it difficult to evaluate its potentialimpact. Similarly, since 75% of the cohort received volume expansion in the first 24postnatal hours, volume expansion was not used as an indicator of hypotension in this study.
We did not specify a priori the method for measuring blood pressure (oscillometry or intra-arterial catheter) or a frequency with which pressures were to be recorded and researchpersonnel who abstracted data were unaware of the method.
Cranial ultrasound evaluationIn this sample of ELGANs, moderate/severe ventriculomegaly and an echolucent lesionwere better predictors of cerebral palsy and developmental delay than echodensity.30, 31 Inaddition, the inter-reader agreement was higher for moderate/severe ventriculomegaly andan echolucent lesion than for echodensity.30 Therefore, we chose moderate/severe
Logan et al. Page 3
J Perinatol. Author manuscript; available in PMC 2012 February 01.
NIH
-PA Author Manuscript
NIH
-PA Author Manuscript
NIH
-PA Author Manuscript
ventriculomegaly and an echolucent lesion as indicators of white matter damage; hereafter,all references to “indicators of white matter damage” indicate moderate/severeventriculomegaly and/or an echolucent lesion on postnatal ultrasound.
The three sets of protocol scans were defined by the postnatal day on which they wereobtained. Protocol 1 scans were obtained between the first and fourth day (N=784), protocol2 scans were obtained between the fifth and fourteenth day (N=973), and protocol 3 scanswere obtained between the fifteenth day and the 40th week (N=1011). Seven hundred eleveninfants in this sample of 1041 had all three sets of ultrasound studies.
Details about the methods for obtaining ultrasound scans, efforts to minimize observervariability, and strategies aimed at achieving concordance in the reading of the ultrasoundscans are described elsewhere.32 All ultrasound scans were read by two independentsonologists who were not provided clinical information. When the two readers differed intheir recognition of moderate/severe ventriculomegaly or an echolucent lesion, the filmswere sent to a third (tie-breaking) reader who was unaware of the first two sonologistsreports.
Neurologic assessmentA developmental assessment was offered to all survivors at 24 months corrected gestationalage. Of the study participants alive at 24 months, 88% were evaluated with a neurologicexam. The developmental assessment included a 31-item structured neurologic examinationadministered by staff who were trained and certified using a multi-media training video.33
Due to the low frequency of non-spastic cerebral palsy in infants less than 2 years of age, wefocused on the spastic forms of cerebral palsy (quadriparesis, diparesis, or hemiparesis)using a previously published algorithm.34 The referenced algorithm includes monoparesisunder the classification hemiparesis, and triparesis under the classification quadriparesis.
Data analysisWe evaluated the null hypothesis that infants with an indicator of hypotension during thefirst 24 postnatal hours were no more likely than their peers to have an indicator of whitematter damage or a cerebral palsy diagnosis.
To identify potential confounders, we compared the distribution of characteristics andexposures among children who had each hypotension indicator to the distribution amongthose who did not. We then compared the distribution of these characteristics and exposuresamong children who did and did not have each of the outcomes.
Characteristics and exposures of the pregnancy, delivery, and postnatal period were treatedas potential confounders if they had been considered potential confounders previously, orwere associated in this dataset with both the exposure (a hypotension indicator) and theoutcome (a cranial ultrasound lesion or cerebral palsy diagnosis) with a p-value ≤ 0.25. Theonly exception to the foregoing was that we did not treat SNAP-II (Score for Neonatal AcutePhysiology-II) as a potential confounder because lowest MAP in the first 12 hours is acomponent of SNAP-II.35 We fit 15 separate multivariate logistic regression models, one foreach of the five outcomes with each of the three hypotension indicators. In order to study themost homogeneous outcomes, we compared children with each CP diagnosis to thosewithout CP. Each model included a hospital strata term to account for the possibility thatinfants born at a particular hospital were more like each other than like infants born at otherhospitals. We describe the strength of the association between indicators of hypotension andindicators of white matter damage and cerebral palsy diagnosis, by calculating odds ratios(OR) and 95% confidence intervals (CIs), adjusting for confounders.
Logan et al. Page 4
J Perinatol. Author manuscript; available in PMC 2012 February 01.
NIH
-PA Author Manuscript
NIH
-PA Author Manuscript
NIH
-PA Author Manuscript

ResultsFor the parent study sample of 1506 infants, hypotension measures and cranial ultrasoundscans were available for 1411 (94%). At 24 months adjusted age, 1183 (84%) of theseinfants were alive, and 1041 (88%) of these were evaluated with the structured neurologicexam (Figure 1). To evaluate whether there was bias due to the exclusion of the 142 infantslost to follow-up, we compared characteristics of mothers and infants who returned for adevelopmental assessment to those of mothers and infants who were eligible but did notreturn. Infants who returned for 24 month follow-up tended to be born to mothers with atleast a college education, and were more likely to have a hypotension indicator (Table 1).
While the frequency of lowest blood pressure in the lowest quartile was 25% for the entirecohort, it was only 21% in the cohort for these analyses. Twenty-four percent were treatedwith vasopressor, and 24% had labile blood pressure. In the NICU, 10% developedmoderate/severe ventriculomegaly and 7% developed an echolucent lesion. At 24-months,6% had developed quadriparesis, 4% diparesis, and 2% hemiparesis.
Social, demographic, and pregnancy characteristics (Table 2)We created Tables 1 and 2 to examine potential confounders of relationships betweenindicators of hypotension and indicators of cerebral white matter damage and cerebral palsydiagnoses. Black race and public insurance were associated with a slightly higher rate ofblood pressure lability, but infants whose mother had these characteristics were no morelikely than their peers to develop cranial ultrasound lesions or a cerebral palsy diagnosis.Infants of multi-fetal gestation were more likely singletons to receive vasopressors, but wereno more likely than their peers to develop one of the outcomes of interest. Maternal vaginitiswas associated with blood pressure lability and with both ventriculomegaly andquadriplegia. Similarly, infants whose mothers used aspirin were more likely to havereceived vasopressors and more likely to develop ventriculomegaly, an echolucent lesion,and quadriplegia. However, these associations were based only on 57 women-infant dyadsexposed to antenatal aspirin. Infants exposed antenatally to magnesium had lower risks ofblood pressure in the lowest quartile for gestational age, and were less likely to developventriculomegaly, an echolucent lesion, quadriparesis, and hemiparesis.
Infant characteristics (Table 3)Infants of low gestational age were more likely than their gestationally-older peers to receivevasopressors and to have labile blood pressure, and were slightly more likely to developventriculomegaly, an echolucent lesion, or a cerebral palsy diagnosis. A birth weight Z-score< -1 was associated with both labile blood pressure and hemiparesis.
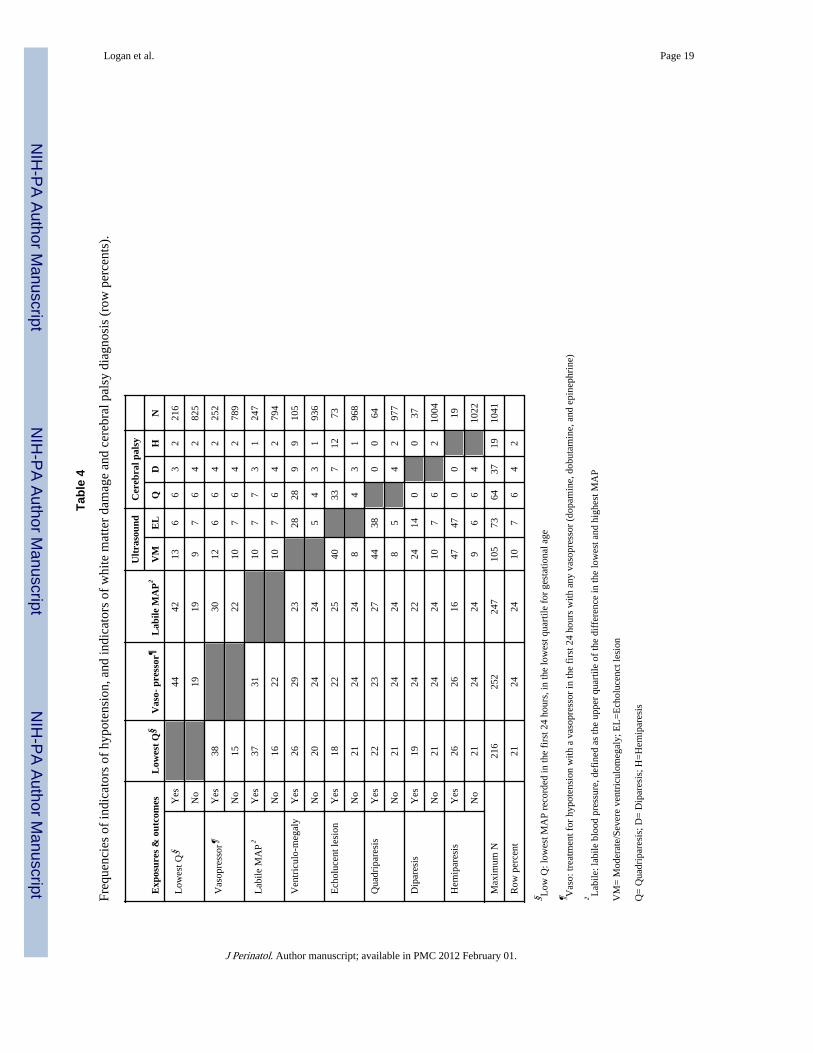
Univariate relationships among hypotension indicators, indicators of white matter damageand cerebral palsy diagnoses. (Table 4)
The indicators of hypotension are highly related. Among children with a lowest bloodpressure in the lowest quartile for gestation, 44% received a vasopressor, and 42% had labileblood pressure. In contrast, among those who did not have a blood pressure in the lowestquartile for gestational age, only 19% received a vasopressor and 19% had labile bloodpressure.
Multivariate relationship (Figures 2 and 3)Univariate analyses (Tables 2 and 3) identified black race, public insurance, primigravida,male sex, gestational age 23–24 weeks, birthweight Z-score < -1, multi-fetal pregnancy,delivery for preeclampsia or fetal indication, receipt of magnesium, and SNAP-II, aspotential confounders. After adjusting for confounders, we found no association between
Logan et al. Page 5
J Perinatol. Author manuscript; available in PMC 2012 February 01.
NIH
-PA Author Manuscript
NIH
-PA Author Manuscript
NIH
-PA Author Manuscript

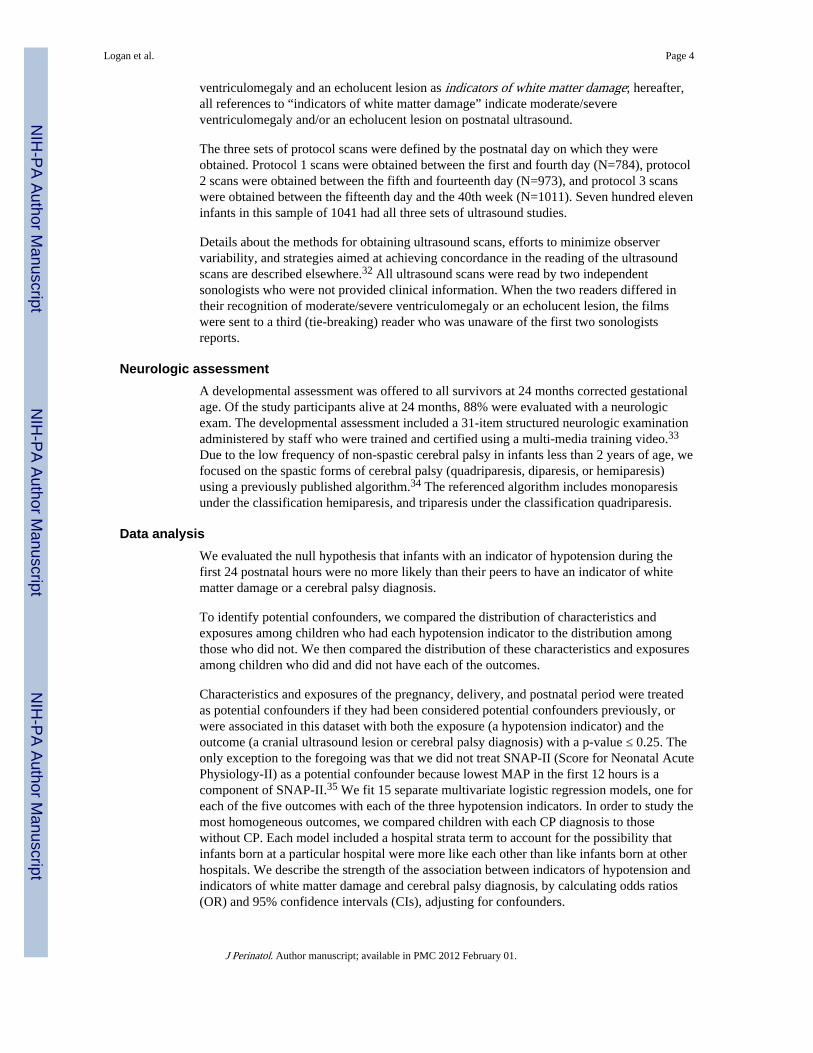
any of the three indicators of hypotension and the two indicators of white matter damage(figure 2) or any of three cerebral palsy diagnoses (figure 3). SNAP-II was not included inmultivariate analyses for the reasons cited in the Data analysis section.
DiscussionIn a large sample of ELGANs, we found little evidence for an association betweenhypotension indicators and indicators of white matter damage or a cerebral palsy diagnosis.Our findings cast doubt on the concept that early postnatal hypotension, in isolation, causesbrain damage in ELGANs. In addition, we did not find support for the notion thatvasopressors benefit preterm neonates with early postnatal hypotension.36
Prior studies favoring an association between hypotension and brain ultrasound lesions3–9
had relatively small sample sizes, decreasing the likelihood that potential confounders couldbe adequately controlled. Most of the studies favoring an association between hypotensionand cerebral palsy acquired data retrospectively, 9, 21, 23, 24 increasing the possibility ofascertainment bias, and the one prospective study with a design comparable to ours failed todemonstrate such an association.25 Our findings are in agreement with the majority ofpublished studies, which found no convincing relationship between hypotension and brainultrasound images10–22 or cerebral palsy.22, 25
The hypothesis that “early postnatal hypotension causes white matter damage in preterminfants” is predicated on two related concepts. The first is that cerebral white matter damageis a consequence of ischemia. The second is that ischemia results from systemichypotension. Since the late 1970s, when Hans Lou published his historically importantstudies of preterm infants, in which early systemic hypotension was correlated with lowcerebral blood flow and brain injury, neonatologists have been concerned about the adverseeffects of early systemic hypotension on the fragile preterm brain.37, 38 Since that time, ithas become increasingly clear that the etiology of brain damage in preterm newborns ismultifactorial.15, 39, 40 Our study and others suggest that systemic hypotension, as anisolated clinical event, is an insufficient indicator of white matter damage in pretermnewborns, and by extension, an insufficient indicator of cerebral ischemia.
We offer a number of possible explanations for why early postnatal hypotension might notincrease the risk of white matter damage or cerebral palsy in extremely preterm infants.First, a relatively low blood pressure on the first day of life might be part of the normalphysiologic transition from intrauterine to extrauterine life. Second, “hypotension”, asdescribed here, might not lead to cerebral ischemia. Third, if “hypotension” does causeischemia, then it does not occur with enough frequency or severity to be associated withwhite matter damage or cerebral palsy at 2 years. Fourth, if hypotension is associated withwhite matter damage, then our crude methods for obtaining blood pressure measurementsare insufficient for clinical decision-making regarding cerebral perfusion.
Our study has several limitations. First, we did not pre-specify a protocol for measuringblood pressure; some measurements were obtained by intra-arterial catheters, while otherswere obtained by oscillometry. Overestimates of blood pressure, which frequentlyaccompany the use of oscillometry, might have attenuated associations between hypotensionindicators and ultrasound lesions or cerebral palsy.41, 42 Second, our findings may have beenconfounded by the frequent use of volume expansion. Any inferences from our findingsshould be limited to cohorts in which volume expansion is used frequently, as three-fourthsof study infants were treated with volume expansion in the first 24 postnatal hours. Third,we might have failed to identify hypotension-related white matter damage because cranial
Logan et al. Page 6
J Perinatol. Author manuscript; available in PMC 2012 February 01.
NIH
-PA Author Manuscript
NIH
-PA Author Manuscript
NIH
-PA Author Manuscript

ultrasound fails to detect some of the white matter damage that is later identified withmagnetic resonance imaging.43
The strengths of our study include the prospective collection of data from a large multicentercohort, defined by gestational age (rather than birth weight).44 This study derives from alarge sample of ELGANs from several regions of the United States, increasing the validityand generalizability of our findings.45, 46 We assessed brain damage using both structuraland functional outcomes that were assessed with a high degree of reliability, enhancing thevalidity of these assessments. In addition, the identification of ultrasound lesions requiredthe agreement of two independent readers, decreasing the likelihood of inter-observervariability. Finally, follow up data were collected by examiners trained in the standardizedadministration of the neurologic exam, and these examiners were unaware of the child’sclinical history.33
Prior studies that provided evidence for an association between low blood pressure andwhite matter damage or cerebral palsy were smaller than ours, and less likely to adequatelyadjust for confounders. This underscores the importance of our findings, as prior “positive”studies, may have created a distorted perception of the strength of antecedent risks.45, 46
Thus, we support the recommendation of others, that randomized trials be used to evaluatethe benefit of treatments to raise blood pressure in extremely preterm neonates.47 Perhapsthe most important implication for clinicians is that our study and others fail to find supportfor the hypothesis that white matter damage is associated with low blood pressure in theearly postnatal period.
In conclusion, in a cohort of preterm infants, the majority of whom were treated withvolume expanders, we found little evidence for an association between early indicators ofpostnatal hypotension and two indicators of cerebral white matter damage and cerebral palsydiagnoses at 24 months corrected gestational age.
Abbreviations
ELGAN extremely low gestational age newborn
IVH intraventricular hemorrhage
MAP mean arterial pressure
CP cerebral palsy
CUS cranial ultrasound
Hypotension.BSID Bibliography1. Laughon M, Bose C, Allred E, et al. Factors associated with treatment for hypotension in extremely
low gestational age newborns during the first postnatal week. Pediatrics. 2007; 119:273–80.[PubMed: 17272616]
2. du Plessis AJ. The role of systemic hemodynamic disturbances in prematurity-related brain injury. JChild Neurol. 2009; 24:1127–40. [PubMed: 19745087]
3. Weindling AM, Wilkinson AR, Cook J, et al. Perinatal events which precede periventricularhaemorrhage and leukomalacia in the newborn. Br J Obstet Gynaecol. 1985; 92:1218–23. [PubMed:3910079]
4. Miall-Allen VM, de Vries LS, Whitelaw AG. Mean arterial blood pressure and neonatal cerebrallesions. Arch Dis Child. 1987; 62:1068–9. [PubMed: 3314723]
5. Watkins AM, West CR, Cooke RW. Blood pressure and cerebral haemorrhage and ischaemia invery low birthweight infants. Early Hum Dev. 1989; 19:103–10. [PubMed: 2737101]
Logan et al. Page 7
J Perinatol. Author manuscript; available in PMC 2012 February 01.
NIH
-PA Author Manuscript
NIH
-PA Author Manuscript
NIH
-PA Author Manuscript
6. Fok TF, Davies DP, Ng HK. A study of periventricular haemorrhage, post-haemorrhagic ventriculardilatation and periventricular leucomalacia in chinese preterm infants. J Paediatr Child Health.1990; 26:271–5. [PubMed: 2265019]
7. Low JA, Froese AB, Galbraith RS, et al. The association between preterm newborn hypotension andhypoxemia and outcome during the first year. Acta Paediatr. 1993; 82:433–7. [PubMed: 7686060]
8. O’Shea TM, Kothadia JM, Roberts DD, et al. Perinatal events and the risk of intraparenchymalechodensity in very-low-birthweight neonates. Paediatr Perinat Epidemiol. 1998; 12:408–21.[PubMed: 9805714]
9. Kuint J, Barak M, Morag I, et al. Early treated hypotension and outcome in very low birth weightinfants. Neonatology. 2008; 95:311–316. [PubMed: 19052477]
10. Trounce JQ, Shaw DE, Levene MI, et al. Clinical risk factors and periventricular leucomalacia.Arch Dis Child. 1988; 63:17–22. [PubMed: 3348645]
11. de Vries LS, Regev R, Dubowitz LM, et al. Perinatal risk factors for the development of extensivecystic leukomalacia. Am J Dis Child. 1988; 142:732–5. [PubMed: 3289372]
12. Bejar RF, Vaucher YE, Benirschke K, et al. Postnatal white matter necrosis in preterm infants. JPerinatol. 1992; 12:3–8. [PubMed: 1560287]
13. Gronlund JU, Korvenranta H, Kero P, et al. Elevated arterial blood pressure is associated with peri-intraventricular haemorrhage. Eur J Pediatr. 1994; 153:836–41. [PubMed: 7843200]
14. D’Souza SW, Janakova H, Minors D, et al. Blood pressure, heart rate, and skin temperature inpreterm infants: Associations with periventricular haemorrhage. Arch Dis Child Fetal NeonatalEd. 1995; 72:F162–7. [PubMed: 7796230]
15. Perlman JM, Risser R, Broyles RS. Bilateral cystic periventricular leukomalacia in the prematureinfant: Associated risk factors. Pediatrics. 1996; 97:822–7. [PubMed: 8657521]
16. Wiswell TE, Graziani LJ, Kornhauser MS, et al. Effects of hypocarbia on the development ofcystic periventricular leukomalacia in premature infants treated with high-frequency jetventilation. Pediatrics. 1996; 98:918–24. [PubMed: 8909486]
17. Baud O, Ville Y, Zupan V, et al. Are neonatal brain lesions due to intrauterine infection related tomode of delivery? Br J Obstet Gynaecol. 1998; 105:121–4. [PubMed: 9442175]
18. Cunningham S, Symon AG, Elton RA, et al. Intra-arterial blood pressure reference ranges, deathand morbidity in very low birthweight infants during the first seven days of life. Early Hum Dev.1999; 56:151–65. [PubMed: 10636594]
19. Dammann O, Allred EN, Kuban KC, et al. Systemic hypotension and white-matter damage inpreterm infants. Dev Med Child Neurol. 2002; 44:82–90. [PubMed: 11852927]
20. Limperopoulos C, Bassan H, Kalish LA, et al. Current definitions of hypotension do not predictabnormal cranial ultrasound findings in preterm infants. Pediatrics. 2007; 120:966–77. [PubMed:17974733]
21. Batton B, Zhu X, Fanaroff J, et al. Blood pressure, anti-hypotensive therapy, andneurodevelopment in extremely preterm infants. J Pediatr. 2008 First published online Nov 192008.
22. Pellicer A, del Carmen Bravo M, Madero R, et al. Early systemic hypotension and vasopressorsupport in low birth weight infants: Impact on neurodevelopment. Pediatrics. 2009; 123:1369–76.[PubMed: 19403504]
23. Goldstein RF, Thompson RJ Jr, Oehler JM, et al. Influence of acidosis, hypoxemia, andhypotension on neurodevelopmental outcome in very low birth weight infants. Pediatrics. 1995;95:238–43. [PubMed: 7530835]
24. Murphy DJ, Hope PL, Johnson A. Neonatal risk factors for cerebral palsy in very preterm babies:Case-control study. BMJ. 1997; 314:404–8. [PubMed: 9040385]
25. Hunt RW, Evans N, Rieger I, et al. Low superior vena cava flow and neurodevelopment at 3 yearsin very preterm infants. J Pediatr. 2004; 145:588–92. [PubMed: 15520755]
26. O’Shea TM, Allred EN, Dammann O, et al. The ELGAN study of the brain and related disorders inextremely low gestational age newborns. Early Hum Dev. 2009; 85:719–25. [PubMed: 19765918]
27. McElrath TF, Hecht JL, Dammann O, et al. Pregnancy disorders that lead to delivery before the28th week of gestation: An epidemiologic approach to classification. Am J Epidemiol. 2008;27:27.
Logan et al. Page 8
J Perinatol. Author manuscript; available in PMC 2012 February 01.
NIH
-PA Author Manuscript
NIH
-PA Author Manuscript
NIH
-PA Author Manuscript

28. Yudkin PL, Aboualfa M, Eyre JA, et al. New birthweight and head circumference centiles forgestational ages 24 to 42 weeks. Early Hum Dev. 1987; 15:45–52. [PubMed: 3816638]
29. Dempsey EM, Barrington KJ. Diagnostic criteria and therapeutic interventions for the hypotensivevery low birth weight infant. J Perinatol. 2006; 26:677–81. [PubMed: 16929346]
30. O’Shea TM, Kuban KC, Allred EN, et al. Neonatal cranial ultrasound lesions and developmentaldelays at 2 years of age among extremely low gestational age children. Pediatrics. 2008;122:e662–9. [PubMed: 18762501]
31. Kuban KC, Allred EN, O’Shea TM, et al. Cranial ultrasound lesions in the NICU predict cerebralpalsy at age 2 years in children born at extremely low gestational age. J Child Neurol. 2009;24:63–72. [PubMed: 19168819]
32. Kuban K, Adler I, Allred EN, et al. Observer variability assessing US scans of the preterm brain:The elgan study. Pediatr Radiol. 2007; 37:1201–8. [PubMed: 17901950]
33. Kuban KC, O’Shea M, Allred E, et al. Video and CD-ROM as a training tool for performingneurologic examinations of 1-year-old children in a multicenter epidemiologic study. J ChildNeurol. 2005; 20:829–31. [PubMed: 16417880]
34. Kuban KC, Allred EN, O’Shea M, et al. An algorithm for identifying and classifying cerebral palsyin young children. J Pediatr. 2008; 153:466–72. [PubMed: 18534210]
35. Richardson DK, Corcoran JD, Escobar GJ, et al. SNAP-II and SNAPPE-II: Simplified newbornillness severity and mortality risk scores. J Pediatr. 2001; 138:92–100. [PubMed: 11148519]
36. Dempsey EM, Barrington KJ. Evaluation and treatment of hypotension in the preterm infant. ClinPerinatol. 2009; 36:75–85. [PubMed: 19161866]
37. Lou HC, Lassen NA, Friis-Hansen B. Low cerebral blood flow in hypotensive perinatal distress.Acta Neurol Scand. 1977; 56:343–52. [PubMed: 920113]
38. Lou HC, Lassen NA, Friis-Hansen B. Impaired autoregulation of cerebral blood flow in thedistressed newborn infant. J Pediatr. 1979; 94:118–21. [PubMed: 758388]
39. Leviton A, Pagano M, Kuban KC, et al. The epidemiology of germinal matrix hemorrhage duringthe first half-day of life. Dev Med Child Neurol. 1991; 33:138–45. [PubMed: 2015981]
40. Collins MP, Lorenz JM, Jetton JR, et al. Hypocapnia and other ventilation-related risk factors forcerebral palsy in low birth weight infants. Pediatr Res. 2001; 50:712–9. [PubMed: 11726729]
41. O’Shea J, Dempsey EM. A comparison of blood pressure measurements in newborns. Am JPerinatol. 2009; 26:113–6. [PubMed: 19021094]
42. Troy R, Doron M, Laughon M, et al. Comparison of noninvasive and central arterial bloodpressure measurements in elbw infants. J Perinatol. 2009; 29:744–9. [PubMed: 19609309]
43. Inder TE, Anderson NJ, Spencer C, et al. White matter injury in the premature infant: Acomparison between serial cranial sonographic and MR findings at term. AJNR Am J Neuroradiol.2003; 24:805–9. [PubMed: 12748075]
44. Arnold CC, Kramer MS, Hobbs CA, et al. Very low birth weight: A problematic cohort forepidemiologic studies of very small or immature neonates. Am J Epidemiol. 1991; 134:604–13.[PubMed: 1951265]
45. Dickersin K. The existence of publication bias and risk factors for its occurrence. Jama. 1990;263:1385–9. [PubMed: 2406472]
46. Hall R, de Antueno C, Webber A. Publication bias in the medical literature: A review by acanadian research ethics board. Can J Anaesth. 2007; 54:380–8. [PubMed: 17470890]
47. Dempsey EM, Barrington KJ. Treating hypotension in the preterm infant: When and with what: Acritical and systematic review. J Perinatol. 2007; 27:469–78. [PubMed: 17653217]
Participating institutions (site principal investigators, sonologists, andneuro-developmental examiners)
Baystate Medical Center, Springfield MA (Bhavesh Shah, Frederick Hampf, HerbertGilmore, Susan McQuiston)
Beth Israel Deaconess Medical Center, Boston MA (Camilia R. Martin, Jane Share)
Logan et al. Page 9
J Perinatol. Author manuscript; available in PMC 2012 February 01.
NIH
-PA Author Manuscript
NIH
-PA Author Manuscript
NIH
-PA Author Manuscript

Brigham & Women’s Hospital, Boston MA (Linda J. Van Marter, Sara Durfee)
Children’s Hospital Boston, Boston MA (Alan Leviton, Kristen Ecklund, Samantha Butler,Haim Bassan, Adré Duplessis, Cecil Hahn, Omar Khwaha, AK Morgan, Janet S. Soul)
DeVos Children’s Hospital, Grand Rapids MI (Mariel Portenga, Bradford W. Betz, StevenL. Bezinque, Joseph Junewick, Wendy Burdo-Hartman, Lynn Fagerman, Kim Lohr, StevePastynrnak, Dinah Sutton)
Floating Hospital for Children at Tufts Medical Center, Boston MA (Cynthia Cole/JohnFiascone, Roy McCauley, Paige T. Church, Cecelia Keller, Karen Miller)
Massachusetts General Hospital, Boston MA (Robert Insoft, Kalpathy Krishnamoorthy)
Michigan State Univeristy, E Lansing MI (Nigel Paneth)
North Carolina Children’s Hospital, Chapel Hill NC (Carl Bose, Lynn A. Fordham, LisaBostic, Janice Wereszczak, Diane Marshall, Kristi Milowic, Carol Hubbard)
Sparrow Hospital, Lansing MI (Padmani Karna, Ellen Cavenagh, Victoria J. Caine, PadmaniKarna, Nicholas Olomu, Joan Price)
University of Chicago Hospital, Chicago IL (Michael D. Schreiber, Kate Feinstein, LeslieCaldarelli, Sunila E. O’Conno, Michael Msall, Susan Plesha-Troyke)
University Health Systems of Eastern Carolina, Greenville NC (Stephen Engelke, Ira Adler,Sharon Buckwald, Rebecca Helms, Kathyrn Kerkering, Scott S. MacGilvray, Peter Resnik)
U Mass Memorial Health Center, Worcester, MA (Francis Bednarek, Jacqueline Wellman,Robin Adair, Richard Bream, Alice Miller, Albert Scheiner, Christy Stine)
Wake Forest University Baptist Medical Center and Forsyth Medical Center, Winston-Salem NC (T. Michael O’Shea, Barbara Specter, Deborah Allred, Don Goldstein, GailHounshell, Robert Dillard, Cherrie Heller, Debbie Hiatt, Lisa Washburn)
William Beaumont Hospital, Royal Oak MI (Daniel Batton, Chung-ho Chang, KarenBrooklier, Melisa Oca)
Yale University School of Medicine, New Haven CT (Richard Ehrenkranz, Cindy Miller,Nancy Close, Elaine Romano, Joanne Williams)
Logan et al. Page 10
J Perinatol. Author manuscript; available in PMC 2012 February 01.
NIH
-PA Author Manuscript
NIH
-PA Author Manuscript
NIH
-PA Author Manuscript

Figure 1.Sample for analyses of hypotension indicators and ultrasound lesions and cerebral palsy
Logan et al. Page 11
J Perinatol. Author manuscript; available in PMC 2012 February 01.
NIH
-PA Author Manuscript
NIH
-PA Author Manuscript
NIH
-PA Author Manuscript

Figure 2.Odds ratios (and 95% confidence intervals) of the risk of indicators of white matter damageobtained with logistic regression models that incorporate indicators of hypotension duringthe first 24 postnatal hours and potential confounders.**Adjustment is made for black race, public insurance, primagravida, male sex, gestationalage 23–24 weeks, birth weight Z-score < -1, multi-fetal gestation, delivery for preeclampsiaor fetal indication and receipt of magnesium. A hospital strata term is included to accountfor the possibility that infants born at a particular hospital are more like each other than likeinfants born at other hospitals.§Low Q: lowest MAP recorded in the first 24 hours in the lowest quartile for gestational age¶Vaso: treatment for hypotension with a vasopressor in the first 24 hours with anyvasopressor (dopamine, dobutamine, and epinephrine)†Labile: labile blood pressure, defined as the upper quartile of the difference in the lowestand highest MAP
Logan et al. Page 12
J Perinatol. Author manuscript; available in PMC 2012 February 01.
NIH
-PA Author Manuscript
NIH
-PA Author Manuscript
NIH
-PA Author Manuscript

Figure 3.Odds ratios (and 95% confidence intervals) of the risk of cerebral palsy types obtained withlogistic regression models that incorporate indicators of hypotension during the first 24postnatal hours and potential confounders.**Adjustment is made for black race, public insurance, primagravida, male sex, gestationalage 23–24 weeks, birth weight Z-score < -1, multi-fetal gestation, delivery for preeclampsiaor fetal indication and receipt of magnesium. A hospital strata term is included to accountfor the possibility that infants born at a particular hospital are more like each other than likeinfants born at other hospitals.§Low Q: lowest MAP recorded in the first 24 hours in the lowest quartile for gestational age¶Vaso: treatment for hypotension with a vasopressor in the first 24 hours with anyvasopressor (dopamine, dobutamine, and epinephrine)†Labile: labile blood pressure, defined as the upper quartile of the difference in the lowestand highest MAP
Logan et al. Page 13
J Perinatol. Author manuscript; available in PMC 2012 February 01.
NIH
-PA Author Manuscript
NIH
-PA Author Manuscript
NIH
-PA Author Manuscript

NIH
-PA Author Manuscript
NIH
-PA Author Manuscript
NIH
-PA Author Manuscript
Logan et al. Page 14
Table 1
Characteristics of mothers and children who survived to 24 months adjusted age, comparing those included inthis study and those not included (column percents).
Maternal or infant characteristic Included in study Not included
Maternal education College or more 34 22
HMO/private insurance Yes 62 54
10+ prenatal care visits Yes 30 27
Conception assistance Yes 22 17
White race Yes 59 54
Antenatal corticosteroid Complete course 65 57
Partial Course 25 35
None 11 7
Cesarean delivery Yes 66 65
Sex Male 52 52
Gestational age (weeks) 23–24 20 23
25–26 46 47
27 34 30
Birth weight (grams) ≤ 750 37 37
751–1000 44 38
> 1000 19 25
Ventriculomegaly Yes 10 8
Echolucent lesion Yes 7 5
Lowest quartile MAP Yes 21 15
Vasopressor Yes 24 21
Labile MAP Yes 24 18
Maximum number of infants 1041 142
§Lowest quartile MAP: lowest MAP recorded in the first 24 hours, in the lowest quartile for gestational age
¶Vasopressor: treatment for hypotension in the first 24 hours, using any vasopressor (dopamine, dobutamine, epinephrine)
†Labile MAP: labile blood pressure, defined as the upper quartile of the difference between the lowest and highest MAP
J Perinatol. Author manuscript; available in PMC 2012 February 01.
NIH
-PA Author Manuscript
NIH
-PA Author Manuscript
NIH
-PA Author Manuscript
Logan et al. Page 15
Tabl
e 2
Mat
erna
l cha
ract
eris
tics,
indi
cato
rs o
f hy
pote
nsio
n, a
nd in
dica
tors
of
whi
te m
atte
r da
mag
e an
d ce
rebr
al p
alsy
dia
gnos
es (
row
per
cent
s).
Cha
ract
eris
tics
of
the
mot
her
Hyp
oten
sion
indi
cato
rsIn
dica
tors
of
whi
te m
atte
r da
mag
eC
ereb
ral p
alsy
NL
ow Q
§V
aso¶
Lab
ile†
VM
EL
QD
H
Yea
rs o
f ed
ucat
ion
< 1
225
2322
118
52
216
1
12 (
HS)
2121
257
76
51
267
>12
to <
1619
2127
1410
84
424
0
Col
lege
gra
d19
2623
94
43
118
7
> 1
622
3321
115
81
115
2
Mar
ried
Yes
1925
2211
77
31
609
No
2323
279
76
52
432
Bla
ck r
ace
Yes
2625
3011
86
53
278
No
1924
2110
76
31
747
Publ
ic in
sura
nce
Yes
2322
299
87
51
397
No
1925
2111
76
32
624
Prim
igra
vida
Yes
2227
2110
56
31
410
No
2022
2611
87
42
605
Mul
ti-fe
tal g
esta
tion
Yes
2030
1911
77
32
354
No
2121
269
76
43
687
Pre-
pre
gnan
cy B
MI
< 1
8.5
2122
289
79
40
76
18.5
, <25
1924
2311
86
42
506
25, <
3023
2626
88
63
120
7
≥ 30
2424
2413
56
22
211
Vag
initi
sY
es20
2129
138
105
214
3
No
2124
2310
76
32
870
Asp
irin
Yes
2130
2318
1419
20
57
No
2123
2410
66
42
953
Preg
nanc
y co
mpl
icat
ion
PTL
2025
2213
96
43
464
pPR
OM
2123
2310
76
42
230
Pree
clam
psia
1818
265
25
11
137
J Perinatol. Author manuscript; available in PMC 2012 February 01.

NIH
-PA Author Manuscript
NIH
-PA Author Manuscript
NIH
-PA Author Manuscript
Logan et al. Page 16
Cha
ract
eris
tics
of
the
mot
her
Hyp
oten
sion
indi
cato
rsIn
dica
tors
of
whi
te m
atte
r da
mag
eC
ereb
ral p
alsy
NL
ow Q
§V
aso¶
Lab
ile†
VM
EL
QD
H
Abr
uptio
n25
2432
61
33
211
3
Cx
insu
ffcn
cy23
3522
97
155
055
Feta
l Ind
icat
n19
2118
1012
102
042
Mod
/sev
ere
chor
ioam
nion
itis
Yes
1920
2312
98
62
343
No
2226
2410
65
22
606
Ant
enat
al s
tero
ids
Yes
2126
249
77
42
672
No
1520
2410
54
33
255
Mag
nesi
umN
o31
2424
1911
84
811
2
Toc
olys
is20
2722
97
53
256
2
Sz p
roph
ylax
2118
286
25
32
133
Max
num
ber
of in
fant
s21
625
224
710
573
6437
1910
41
Row
per
cent
2124
2410
76
42
§ Low
Q: l
owes
t MA
P re
cord
ed in
the
firs
t 24
hour
s, in
the
low
est q
uart
ile f
or g
esta
tiona
l age
¶ Vas
o: tr
eatm
ent f
or h
ypot
ensi
on w
ith a
vas
opre
ssor
in th
e fi
rst 2
4 ho
urs
with
any
vas
opre
ssor
(do
pam
ine,
dob
utam
ine,
and
epi
neph
rine
)
† Lab
ile: l
abile
blo
od p
ress
ure,
def
ined
as
the
uppe
r qu
artil
e of
the
diff
eren
ce in
the
low
est a
nd h
ighe
st M
AP
VM
= M
oder
ate/
Seve
re v
entr
icul
omeg
aly;
EL
=E
chol
ucen
ct le
sion
Q=
Qua
drip
ares
is; D
= D
ipar
esis
; H=
Hem
ipar
esis
PTL
=Pr
eter
m la
bor;
pPR
OM
=Pr
eter
m p
rem
atur
e ru
ptur
e of
fet
al m
embr
anes
J Perinatol. Author manuscript; available in PMC 2012 February 01.

NIH
-PA Author Manuscript
NIH
-PA Author Manuscript
NIH
-PA Author Manuscript
Logan et al. Page 17
Tabl
e 3
Infa
nt c
hara
cter
istic
s, in
dica
tors
of
hypo
tens
ion,
and
indi
cato
rs o
f w
hite
mat
ter
dam
age
and
cere
bral
pal
sy d
iagn
osis
(ro
w p
erce
nts)
.
Cha
ract
eris
tics
of
the
infa
nt
Hyp
oten
sion
indi
cato
rIn
dica
tors
of
whi
te m
atte
r da
mag
eC
ereb
ral p
alsy
NL
ow Q
§V
aso¶
Lab
ile†
VM
EL
QD
H
Sex
Mal
e21
2625
128
74
354
4
Fem
ale
2022
238
65
31
497
Typ
e of
ges
tatio
nSi
ngle
ton
2121
2610
76
42
690
Mul
tiple
2030
2011
77
32
351
Ges
tatio
nal a
ge (
wee
ks)
23–2
419
3528
1410
138
320
9
25–2
620
1224
117
52
248
0
2724
2021
75
33
135
2
Bir
th w
eigh
t (gr
ams)
≤ 75
020
2928
117
95
338
3
751–
1000
2323
238
74
22
458
≥ 10
0018
1818
139
64
120
0
BW
Z-s
core
*<
-2
2521
327
22
05
56
≥ -2
, < -
120
2429
112
63
114
1
≥ -1
2124
227
86
42
844
HC
Z-s
core
*<
- 2
2627
287
25
04
82
≥ -2
, < -
121
2124
86
65
123
4
≥ -1
2024
2312
87
42
690
SNA
P-II
< 2
013
1621
76
52
153
6
20–3
924
2424
108
75
225
6
≥ 30
3544
3117
89
63
232
Max
num
ber
of in
fant
s21
625
224
710
573
6437
1910
41
Row
per
cent
2124
2410
76
42
§ Low
Q: l
owes
t MA
P re
cord
ed in
the
firs
t 24
hour
s, in
the
low
est q
uart
ile f
or g
esta
tiona
l age
¶ Vas
o: tr
eatm
ent f
or h
ypot
ensi
on w
ith a
vas
opre
ssor
in th
e fi
rst 2
4 ho
urs
with
any
vas
opre
ssor
(do
pam
ine,
dob
utam
ine,
and
epi
neph
rine
)
† Lab
ile: l
abile
blo
od p
ress
ure,
def
ined
as
the
uppe
r qu
artil
e of
the
diff
eren
ce in
the
low
est a
nd h
ighe
st M
AP
VM
=M
oder
ate/
Seve
re v
entr
icul
omeg
aly;
EL
=E
chol
ucen
ct le
sion
J Perinatol. Author manuscript; available in PMC 2012 February 01.

NIH
-PA Author Manuscript
NIH
-PA Author Manuscript
NIH
-PA Author Manuscript
Logan et al. Page 18Q
=Q
uadr
ipar
esis
; D=
Dip
ares
is; H
=H
emip
ares
is
SNA
P-II
=Sc
ore
for
Neo
nata
l Acu
te P
hysi
olog
y II
J Perinatol. Author manuscript; available in PMC 2012 February 01.
NIH
-PA Author Manuscript
NIH
-PA Author Manuscript
NIH
-PA Author Manuscript
Logan et al. Page 19
Tabl
e 4
Freq
uenc
ies
of in
dica
tors
of
hypo
tens
ion,
and
indi
cato
rs o
f w
hite
mat
ter
dam
age
and
cere
bral
pal
sy d
iagn
osis
(ro
w p
erce
nts)
.
Exp
osur
es &
out
com
esL
owes
t Q
§V
aso-
pre
ssor
¶L
abile
MA
P†
Ult
raso
und
Cer
ebra
l pal
sy
VM
EL
QD
HN
Low
est Q
§Y
es44
4213
66
32
216
No
1919
97
64
282
5
Vas
opre
ssor
¶Y
es38
3012
66
42
252
No
1522
107
64
278
9
Lab
ile M
AP†
Yes
3731
107
73
124
7
No
1622
107
64
279
4
Ven
tric
ulo-
meg
aly
Yes
2629
2328
289
910
5
No
2024
245
43
193
6
Ech
oluc
ent l
esio
nY
es18
2225
4033
712
73
No
2124
248
43
196
8
Qua
drip
ares
isY
es22
2327
4438
00
64
No
2124
248
54
297
7
Dip
ares
isY
es19
2422
2414
00
37
No
2124
2410
76
210
04
Hem
ipar
esis
Yes
2626
1647
470
019
No
2124
249
66
410
22
Max
imum
N21
625
224
710
573
6437
1910
41
Row
per
cent
2124
2410
76
42
§ Low
Q: l
owes
t MA
P re
cord
ed in
the
firs
t 24
hour
s, in
the
low
est q
uart
ile f
or g
esta
tiona
l age
¶ Vas
o: tr
eatm
ent f
or h
ypot
ensi
on w
ith a
vas
opre
ssor
in th
e fi
rst 2
4 ho
urs
with
any
vas
opre
ssor
(do
pam
ine,
dob
utam
ine,
and
epi
neph
rine
)
† Lab
ile: l
abile
blo
od p
ress
ure,
def
ined
as
the
uppe
r qu
artil
e of
the
diff
eren
ce in
the
low
est a
nd h
ighe
st M
AP
VM
= M
oder
ate/
Seve
re v
entr
icul
omeg
aly;
EL
=E
chol
ucen
ct le
sion
Q=
Qua
drip
ares
is; D
= D
ipar
esis
; H=
Hem
ipar
esis
J Perinatol. Author manuscript; available in PMC 2012 February 01.
Copyright © 2022 FDOKUMEN