Bacillus anthracis Edema Toxin Impairs Neutrophil Actin-Based Motility
Upload
independentCategory
view
4download
0
RESEARCH ARTICLE
Early events of Bacillus anthracis germination identified
by time-course quantitative proteomics
Pratik Jagtap1, George Michailidis2, Ryszard Zielke1, Angela K. Walker3, Nishi Patel1,John R. Strahler3, Adam Driks4, Philip C. Andrews3 and Janine R. Maddock1
1 Department of Molecular, Cellular, and Developmental Biology, University of Michigan, Ann Arbor, MI, USA2 Department of Statistics, University of Michigan, Ann Arbor, MI, USA3 Department of Biological Chemistry, University of Michigan, Ann Arbor, MI, USA4 Department of Microbiology and Immunology, Loyola University Medical Center, Maywood, IL, USA
Germination of Bacillus anthracis spores involves rehydration of the spore interior and rapiddegradation of several of the protective layers, including the spore coat. Here, we examine thetemporal changes that occur during B. anthracis spore germination using an isobaric taggingsystem. Over the course of 17 min from the onset of germination, the levels of at least 19 sporeproteins significantly decrease. Included are acid-soluble proteins, several known and predictedcoat proteins, and proteins of unknown function. Over half of these proteins are small (less than100 amino acids) and would have been undetectable by conventional gel-based analysis. We alsoidentified 20 proteins, whose levels modestly increased at the later time points when metabolismhas likely resumed. Taken together, our data show that isobaric labeling of complex mixtures isparticularly effective for temporal studies. Furthermore, we describe a rigorous statisticalapproach to define relevant changes that takes into account the nature of data obtained frommultidimensional protein identification technology coupled with the use of isobaric tags. Thisstudy provides an expanded list of the proteins that may be involved in germination of theB. anthracis spore and their relative levels during germination.
Received: April 27, 2006Revised: June 1, 2006
Accepted: June 4, 2006
Keywords:
Bacillus anthracis / Germination / iTRAQ / Proteome / Spore
Proteomics 2006, 6, 0000–0000 1
1 Introduction
Bacilli and Clostridia, in response to nutrient deprivation,form spores – cells possessing a series of protective struc-tures that encase the bacterial genome, allowing it to resist awide range of external challenges and remain metabolically
inactive for extended periods of time. Bacterial spores areunique in nature; no other cell types possess their structureor protein composition, nor are as well adapted to dormancy.
In Bacillus anthracis, the outermost structure of the sporeis the exosporium, a pleiomorphic shell of undefined func-tion that surrounds spores of some species, including non-pathogenic organisms such as B. megaterium [1], but notothers. Within this is the coat, a multilayered protein shellthat protects the interior and participates in revival fromdormancy (the germination process) [2–4]. The coat is pres-ent in every species that has been examined [5, 6]. Under-neath the coat is a thick layer of a specialized peptidoglycanknown as the cortex; the cortex directly surrounds the core,the compartment that houses the spore DNA. Germination,which initiates rapidly once nutrient returns to the environ-ment, begins with rehydration of the spore interior andinitiation of degradation of the coat, cortex and proteins in
Correspondence: Dr. Janine Maddock, Department of Molecular,Cellular, and Developmental Biology, University of Michigan,Ann Arbor, MI 48109–1048, USAE-mail: [email protected]: 11-734-647-0884
Abbreviations: DSM, DIFCO sporulation medium; GPR, germina-tion protease; iTRAQ™, isotope tag for relative and absolutequantitation, isotopically enriched forms of N-methylpiperazineacetic acid N-hydroxy succinimide; SASP, small acid soluble pro-tein; SCX, strong cation exchange
DOI 10.1002/pmic.200600314
© 2006 WILEY-VCH Verlag GmbH & Co. KGaA, Weinheim www.proteomics-journal.com

2 P. Jagtap et al. Proteomics 2006, 6, 0000–0000
the core. These steps occur in the absence of any detectablemetabolic activity [7]. Because the early events in germina-tion do not involve gene expression or protein synthesis,analysis of these events is well suited to a proteomicsapproach.
The best understood of the events occurring in the firstfew minutes of germination is the proteolysis of proteinsthat bind the spore chromosome, the small acid solubleproteins (SASP) [8]. These abundant small proteins arerequired for protection of the spore DNA, but must bedegraded for successful transcription of the chromosomeafter germination. SASP degradation not only frees theDNA, but also provides a pool of amino acids to support thesubsequent initiation of metabolism. Less well understoodis the degradation of the cortex. This is accomplished byspore-associated peptidoglycan degrading enzymes, a num-ber of which have been isolated from spores of a variety ofspecies [9]. Less clear is the mechanism by which the coat isshed, something that must occur for the germinated cell toexpand its volume as new cell growth begins. Electron mi-croscopy shows that coat ultrastructure changes as germi-nation proceeds [10]. Fragments of the coat are usuallyabundant in a germinated spore culture, frequently seem-ing to have cracked in half [2], suggesting that the coat har-bors a protease that helps to fragment it without destroyingit. Very little is known about proteolytic events during ger-mination (see, for example, [11]); in particular, the questionof whether coat degradation is targeted to a subset of poly-peptide species remains open. This is an especially difficultquestion to address with non-proteomic approaches, due tothe copious number of both candidate substrates andpotential proteolytic products.
Due to their impregnable nature, decontamination ofspores is a long-standing challenge that has yet to be solvedin an entirely satisfactory manner. Currently used methodsinvolve either extremely harsh approaches that are essen-tially impractical except on a small scale within a laboratory(such as autoclaving), or require evacuation of the con-taminated space and significant amounts of equipment(such as treatment with chlorine dioxide gas). A wide rangeof scenarios in which neither technology is suitable is easy toimagine, particularly in light of the potential use of B.anthracis spores as a biological weapon. One possible route tosuperior decontamination strategies is study of the mechan-ism of spore coat degradation. If this process could bemimicked by application of a reagent such as a proteasecocktail, for example, the spore would be rendered sensitiveto typical bactericidal chemicals such as lysozyme. A first,critical step in understanding coat shedding, therefore, isidentification of proteolytic targets, understanding of the wayin which they are cleaved and identification of the proteasesresponsible. To address these questions, we chose to directlymonitor changes in steady state coat protein levels duringgermination and early outgrowth, using a recently describedtechnique that allows relative quantification of changes inprotein samples, isotope tag for relative and absolute quan-
titation (iTRAQ) [12]. In two independent experiments, welabeled with isobaric tags, individually, tryptic peptides fromB. anthracis spores collected over a 17-min germination timecourse. Our studies demonstrate that the isobaric tagsrepresent an efficient and sensitive method to measure sub-tle changes in protein levels, with the additional advantagethat offline 2-D LC-MS/MS allows thorough analysis ofsamples by permitting the mass spectrometer to re-query thecolumn fractions multiple times. As expected, levels of themajority of proteins did not change over the course of thisstudy. Significantly, however, the levels of 19 proteinsdecreased and the levels of 20 proteins modestly increased.In general, proteins that increased are indicative of entry intovegetative growth. The degraded proteins are of particularinterest as they represent both known and novel targets ofearly proteolysis.
2 Materials and methods
2.1 Sporulation
B. anthracis Sterne (from Paul Jackson, Los Alamos NationalLaboratory, USA) spores were generated after nutrientexhaustion in DIFCO sporulation medium (DSM) [13] asdescribed [14]. Briefly, B. anthracis cells grown on Luriabroth -agar plates supplemented with 5 g/L of nutrientbroth (DIFCO were inoculated in DSM medium at an OD600
of 0.1. The B. anthracis spores were collected post-sporula-tion (after growth for approximately 26 h) in DSM media.The spores were separated from vegetative cells by heattreatment at 657C for 30 min and Renografin gradientseparation, washed three times with MilliQ water and cen-trifuged at 10 0006g at 47C for 10 min. The purity of thespores was .95% as determined by their phase brightness.The spore suspension was stored at 47C for up to a weekuntil further processing.
2.2 Sample preparation
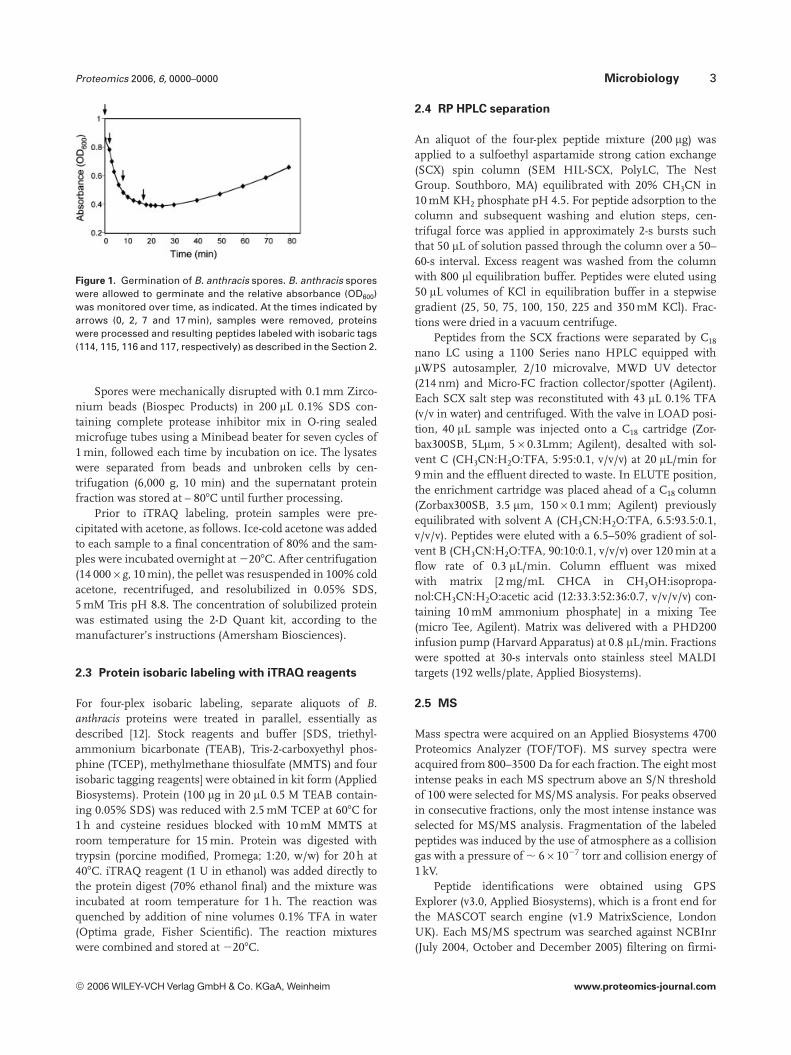
The B. anthracis (Sterne) spores were subjected to heat treat-ment (657C for 30 min) and cooled on ice. For germination,spores were inoculated at OD600 = 1.0 in DSM media at 377Cand the A, OD600, was monitored (Fig. 1). Germinatingspores were collected at 0, 2, 7 and 17 min after inoculation(Fig. 1) and germination was stopped by the addition ofPMSF, 1 mM final concentration), a serine protease inhibi-tor, known to inhibit germination [15–17]. Spores were col-lected by centrifugation (10 0006g, 3 min at 47C) andwashed in 3 mL ice-cold MilliQ water containing 1 mMPMSF and complete protease inhibitor mix (Roche Molecu-lar Biochemicals). The washed pellets were immediately fro-zen using liquid nitrogen and stored at 2807C. Proteins wereobtained and analyzed from two independently obtainedspore preparations.
© 2006 WILEY-VCH Verlag GmbH & Co. KGaA, Weinheim www.proteomics-journal.com
Proteomics 2006, 6, 0000–0000 Microbiology 3
Figure 1. Germination of B. anthracis spores. B. anthracis sporeswere allowed to germinate and the relative absorbance (OD600)was monitored over time, as indicated. At the times indicated byarrows (0, 2, 7 and 17 min), samples were removed, proteinswere processed and resulting peptides labeled with isobaric tags(114, 115, 116 and 117, respectively) as described in the Section 2.
Spores were mechanically disrupted with 0.1 mm Zirco-nium beads (Biospec Products) in 200 mL 0.1% SDS con-taining complete protease inhibitor mix in O-ring sealedmicrofuge tubes using a Minibead beater for seven cycles of1 min, followed each time by incubation on ice. The lysateswere separated from beads and unbroken cells by cen-trifugation (6,000 g, 10 min) and the supernatant proteinfraction was stored at – 807C until further processing.
Prior to iTRAQ labeling, protein samples were pre-cipitated with acetone, as follows. Ice-cold acetone was addedto each sample to a final concentration of 80% and the sam-ples were incubated overnight at 2207C. After centrifugation(14 0006g, 10 min), the pellet was resuspended in 100% coldacetone, recentrifuged, and resolubilized in 0.05% SDS,5 mM Tris pH 8.8. The concentration of solubilized proteinwas estimated using the 2-D Quant kit, according to themanufacturer’s instructions (Amersham Biosciences).
2.3 Protein isobaric labeling with iTRAQ reagents
For four-plex isobaric labeling, separate aliquots of B.anthracis proteins were treated in parallel, essentially asdescribed [12]. Stock reagents and buffer [SDS, triethyl-ammonium bicarbonate (TEAB), Tris-2-carboxyethyl phos-phine (TCEP), methylmethane thiosulfate (MMTS) and fourisobaric tagging reagents] were obtained in kit form (AppliedBiosystems). Protein (100 mg in 20 mL 0.5 M TEAB contain-ing 0.05% SDS) was reduced with 2.5 mM TCEP at 607C for1 h and cysteine residues blocked with 10 mM MMTS atroom temperature for 15 min. Protein was digested withtrypsin (porcine modified, Promega; 1:20, w/w) for 20 h at407C. iTRAQ reagent (1 U in ethanol) was added directly tothe protein digest (70% ethanol final) and the mixture wasincubated at room temperature for 1 h. The reaction wasquenched by addition of nine volumes 0.1% TFA in water(Optima grade, Fisher Scientific). The reaction mixtureswere combined and stored at 2207C.
2.4 RP HPLC separation
An aliquot of the four-plex peptide mixture (200 mg) wasapplied to a sulfoethyl aspartamide strong cation exchange(SCX) spin column (SEM HIL-SCX, PolyLC, The NestGroup. Southboro, MA) equilibrated with 20% CH3CN in10 mM KH2 phosphate pH 4.5. For peptide adsorption to thecolumn and subsequent washing and elution steps, cen-trifugal force was applied in approximately 2-s bursts suchthat 50 mL of solution passed through the column over a 50–60-s interval. Excess reagent was washed from the columnwith 800 ml equilibration buffer. Peptides were eluted using50 mL volumes of KCl in equilibration buffer in a stepwisegradient (25, 50, 75, 100, 150, 225 and 350 mM KCl). Frac-tions were dried in a vacuum centrifuge.
Peptides from the SCX fractions were separated by C18
nano LC using a 1100 Series nano HPLC equipped withmWPS autosampler, 2/10 microvalve, MWD UV detector(214 nm) and Micro-FC fraction collector/spotter (Agilent).Each SCX salt step was reconstituted with 43 mL 0.1% TFA(v/v in water) and centrifuged. With the valve in LOAD posi-tion, 40 mL sample was injected onto a C18 cartridge (Zor-bax300SB, 5Lmm, 560.3Lmm; Agilent), desalted with sol-vent C (CH3CN:H2O:TFA, 5:95:0.1, v/v/v) at 20 mL/min for9 min and the effluent directed to waste. In ELUTE position,the enrichment cartridge was placed ahead of a C18 column(Zorbax300SB, 3.5 mm, 15060.1 mm; Agilent) previouslyequilibrated with solvent A (CH3CN:H2O:TFA, 6.5:93.5:0.1,v/v/v). Peptides were eluted with a 6.5–50% gradient of sol-vent B (CH3CN:H2O:TFA, 90:10:0.1, v/v/v) over 120 min at aflow rate of 0.3 mL/min. Column effluent was mixedwith matrix [2 mg/mL CHCA in CH3OH:isopropa-nol:CH3CN:H2O:acetic acid (12:33.3:52:36:0.7, v/v/v/v) con-taining 10 mM ammonium phosphate] in a mixing Tee(micro Tee, Agilent). Matrix was delivered with a PHD200infusion pump (Harvard Apparatus) at 0.8 mL/min. Fractionswere spotted at 30-s intervals onto stainless steel MALDItargets (192 wells/plate, Applied Biosystems).
2.5 MS
Mass spectra were acquired on an Applied Biosystems 4700Proteomics Analyzer (TOF/TOF). MS survey spectra wereacquired from 800–3500 Da for each fraction. The eight mostintense peaks in each MS spectrum above an S/N thresholdof 100 were selected for MS/MS analysis. For peaks observedin consecutive fractions, only the most intense instance wasselected for MS/MS analysis. Fragmentation of the labeledpeptides was induced by the use of atmosphere as a collisiongas with a pressure of , 661027 torr and collision energy of1 kV.
Peptide identifications were obtained using GPSExplorer (v3.0, Applied Biosystems), which is a front end forthe MASCOT search engine (v1.9 MatrixScience, LondonUK). Each MS/MS spectrum was searched against NCBInr(July 2004, October and December 2005) filtering on firmi-
© 2006 WILEY-VCH Verlag GmbH & Co. KGaA, Weinheim www.proteomics-journal.com

4 P. Jagtap et al. Proteomics 2006, 6, 0000–0000
cutes. The genomes of the Sterne strain and the Ames strainwere also searched in all six reading frames. Trypsin speci-ficity with one missed cleavage was selected. S-mercapto-methylcysteine, as well as the N-terminal and lysine iTRAQlabels were selected as fixed modifications, as both the freeN-terminal amino group and the free -amino group of lysineresidues in proteolytic peptides are derivatized by iTRAQreagents. Oxidized methionine was considered a variablemodification. The precursor tolerance and MS/MS fragmenttolerances were set to 6 0.7 and 6 0.3 Da, respectively.
The peak areas were corrected for overlapping isotopecontributions from the iTRAQ tags according to the certifi-cate of analysis provided by Applied Biosystems. The cor-rected peak areas represent quantitative measurementsobserved at 114.1, 115.1, 116.1 and 117.1 m/z, which corre-spond to 0, 2, 7 and 17 min of germination, respectively.
2.6 Normalization of data
Normalization of raw peak areas was critical to quantifica-tion, as differences in actual, as opposed to theoretical, totalprotein labeled would result in deviations from the expectedratios. In this study, we did not anticipate many changes tooccur during germination and outgrowth and, therefore,normalized the data at the level of the individual peptidepeak areas.
Table 1 shows summary statistics of the peak area meas-urements, at the peptide level, for both biological replicateexperiments. The median peak areas vary from 56 145 to73 591 and 54 108 to 71 616 for first and second replicates,respectively (Table 1). A similar trend is apparent for pep-tides with lower or higher peak areas (first and third quar-tiles) (Table 1). These data indicate that, without normal-ization, the average relative ratios would deviate from 1. Tocorrect for these differences, normalization was accom-plished by matching the quantiles of the distributions of the115, 116, and 117 measurements to the quantiles of the 114measurements using a monotone piece-wise linear function[18]. Summary statistics indicate that, after normalization, allfour measurements are well matched (Table 2).
2.7 Quantitation of differentially expressed proteins
In determining whether a protein was increased ordecreased, we took into consideration the organization of thedata; namely, that each protein can potentially be identifiedby a number of peptides and every peptide can be measuredmultiple times. As previously noted [19], there are cases inwhich the relative expression levels exhibit a relatively highdegree of variability amongst multiple measurements of thesame peptide for a specific protein and, even more impor-tantly, across peptides for the same protein. A simple aver-aging of relative ratios as suggested in the literature [12, 19]ignores (or bypasses) this issue. Our method, however, rig-orously accounts for these two sources of variability (the pa-rameters s2and t2), which are each taken into consideration
Table 1. Average peak areas in the 114.1–117.1 m/z range fromraw data
114 115 116 117
First replicate
First quartile 25 863 29 970 33 953 30 179Median 56 145 64 307 73 591 69 553Third quartile 110 806 126 247 143 206 137 061
Second replicate
First quartile 30 805 35 775 32 668 28 226Median 63 040 71 616 64 213 54 108Third quartile 125 175 137 581 123 324 106 042
Table 2. Average peak areas in the 114.1–117.1 range from nor-malized data
114 115 116 117
First replicate
First quartile 25 863 25 869 25 738 25 982Median 56 145 56 191 55 937 56 185Third quartile 110 806 111 561 111 497 111 523
Second replicate
First quartile 30 805 30 823 30 890 30 810Median 63 040 62 801 62 834 62 960Third quartile 125 175 124 892 124 614 125 252
when calculating the standard error of the ratio R that wasused in the subsequent hypothesis testing procedure forbiological activity (see below). Thus, let r(i,j,k,l) denote theratio of the corrected and normalized peak area of MS/MSspectrum k corresponding to identified peptide j for protein ifor labeled sample l = 115, 116, 117, by the correspondingcorrected and normalized peak area for 114. For ease ofnotation we drop from the subsequent discussion indices iand l, as the proposed model is used for each protein sepa-rately and for each (115–117) labeled sample. We modelthese ratios in a log2 scale, to overcome the fact that the ratioscale is bounded from below by 0, by the following randomone-way analysis of variance (ANOVA) model: log2 (r(j,k)) =R1R(j)1u(j,k), where R is the relative abundance of proteinin the labeled samples (technically, the overall mean of themodeled ratios at the protein level), R(j) is the specific effectof peptide j on the ratio r(j,k), and u(j,k) is an MS/MS spec-trum effect assumed to be normally distributed with meanzero and constant variance s2, where s2 is a random com-ponent. It is also assumed that the peptide effects follow anormal distribution with mean zero and variance t2, where t2
is a random component.. Therefore, the posited modelaccounts for variability of the observed MS/MS measure-ments at the MS/MS level and at the peptide level, allowingevery observed relative peak area ratio to be accounted for bythe overall protein ratio, by a peptide specific value and by anMS/MS specific value. The parameters of the random one-
© 2006 WILEY-VCH Verlag GmbH & Co. KGaA, Weinheim www.proteomics-journal.com

Proteomics 2006, 6, 0000–0000 Microbiology 5
way ANOVA model were estimated by restricted maximumlikelihood method [20]. For a protein identified by a singlepeptide, the estimation of the above model simplifies sig-nificantly as, in this case, R simply corresponds to the aver-age of the corresponding MS/MS ratios.
In terms of biological activity, we are interested in esti-mating and subsequently testing R = 0 vs. the alternative hy-pothesis that R = 0 (as we operate on a log2 scale and log2(1)= 0), where R .0 or R ,0 would indicate an increase or de-crease in the protein level, respectively. To incorporate bio-logical significance, however, we modified the null hypothe-sis as follows: H0: –.23� R �.20, vs. the alternative hypothe-sis HA: R ,-.23 or R ..20 which requires, in the originalscale, an increase or decrease of at least 15% to be deemedsignificant. Hypothesis testing was carried out basically asdescribed [21]. Proteins reported to increase or decrease dur-ing germination met these criteria, unless otherwise indi-cated.
3 Results
3.1 Proteomic analysis of germinating cells
In our initial analysis of B. anthracis germinating spores, weexamined 4486 parent ions and identified 295 unique B.anthracis proteins from 3096 identified peptides (�90% con-fidence). When the experiment was repeated using an inde-pendent spore preparation, we obtained 2559 parent ionsand identified 273 unique B. anthracis proteins from 1879identified peptides (�90% confidence). It is important to
note that the parent ions were obtained using MALDI, atechnique that results in significantly fewer parent ions thanESI-MS/MS. Of the proteins identified, the evidence for 37and 70 protein identifications (first and second replicate,respectively) was marginal, based only on a single measure-ment of a single peptide. As such, these proteins were notsubjected to further analysis with the exception of severalinstances of proteins fewer than 100 amino acids (BAS0043,BAS048S2A, BAS1086, BAS4311, BAS4595 and BAS4644A).The peptide assignment for these proteins was verified bymanual inspection of the MS/MS spectra (SupplementaryFig. S1).
The average numbers of unique peptides/protein were3.7 and 2.8 for proteins with at least 2 peptide measurements(first and second replicate, respectively) (Fig. 2). The dis-tribution of peptides/protein, however, was biased, in thatthe majority (62 and 58%, first and second replicate, respec-tively) was identified by�3 unique peptides (Fig. 2). In manycases, multiple measurements of the same peptide wereobtained, resulting in an average number of total peptidesper protein of 11.7 and 8.9 and median total peptides perprotein of 6 and 5 (first and second replicate, respectively)(Fig. 2). The majority of the proteins (86 and 91%, first andsecond replicate, respectively) had fewer than 20 total pep-tides identified (Fig. 2). A few abundant proteins, however,such as elongation factor Tu, had a large number of identi-fying peptides (22 unique and 104 total, and 13 unique and86 total, first and second replicate, respectively) (Fig. 2). Thelower average of unique and total peptides in the secondreplicate reflects the lower total number of identified pep-tides (1879 vs. 3096 in the first replicate) in this experiment.
Figure 2. Peptide distributionfor identified proteins. Sporeand germinating spore proteinswere subjected to 2-D LC andidentified by MALDI MS/MS asdescribed in Section 2. Onlyproteins with at least two pep-tide measurements at �90%confidence are included. (A, C)The distribution of unique pep-tides/protein in the first and sec-ond replicate, respectively. (B,D) The distribution of total pep-tides/protein in the first and sec-ond replicate, respectively.
© 2006 WILEY-VCH Verlag GmbH & Co. KGaA, Weinheim www.proteomics-journal.com

6 P. Jagtap et al. Proteomics 2006, 6, 0000–0000
Of the 261 and 203 proteins identified with 2 or moreindependent peptide measurements (first and second repli-cate, respectively), a common set of 167 proteins, hereaftercalled the “common spore proteome”, was identified in bothstudies (for gene assignments and peptides used to identifythe proteins, see Supplementary Table S1). Interestingly, al-though the theoretical 2-D representations of the predictedB. anthracis proteome (pI vs. molecular weight of all pre-dicted proteins) indicate a relatively even bipolar distribution(56% of the proteins below and 44% above a pI of 7, http://www.tigr.org/), in the common spore proteome we observeda strong bias towards acidic proteins (72% below pI of 7;Supplementary Table S1), indicating either that acidic pro-teins are present at higher levels than basic proteins in the B.anthracis spore and in germinating cells, or that our meth-odology introduces a bias. Such a bias for acidic proteins haspreviously been reported for B. anthracis spores identified byMudPIT [22].
To provide insight into the spore proteome, we examinedthe functional categories, as defined by the Clusters ofOrthologous Groups classification [23], for the proteinsidentified. The predicted B. anthracis proteome encodes pro-teins that fall into 22 functional categories (http://www.ncbi.nlm.nih.gov/COG/)(Supplementary Fig. S2A,Supplementary Table S1). The common spore proteomecontained proteins representing 17 of these categories (Sup-plementary Fig. S2B). Unsurprisingly, proteins involved indefense mechanisms (V), intracellular trafficking and bio-synthesis (U), and transport and catabolism of secondarymetabolites (Q) were not detected. Protein categories over-represented (�1.5-fold) in the spore and germinating pro-teomes include translation (J; 27%), protein modificationand turnover (O; 6.3%), energy production and conversion(C; 7%) and nucleotide transport and metabolism (F; 4.5%).The categories of proteins that were underrepresented (�1.5-fold) include: replication, recombination and repair (L;2.5%), amino acid transport and metabolism (E; 5%), coen-zyme transport and metabolism (H; 1.2%), signal transduc-tion mechanisms (T; 1.9%), cell membrane and wall biogen-esis (M; 1.9%), lipid transport and metabolism (I; 1.2%),function unknown (S; 3.1%), cell motility (N; 0.6%) andceneral function prediction only (R; 5.7%). These differenceshad been previously noted in other proteomic studies [22]and were not unexpected as the highly specialized spore isvastly different from vegetative cells [24, 25].
3.2 Identification of proteins not annotated in the
B. anthracis Sterne strain
Direct queries of the translated Sterne strain genome (all sixreading frames) revealed several proteins that had not pre-viously been annotated. In all cases, the corresponding geneis present in other B. anthracis genomes (Ames and 2012)and/or in B. cereus, and typically these genes are also presentin at least one other Bacillus species (Table 3). We haveassigned these genes BAS numbers based on their genomic
location (Supplementary Table S1). Significantly, all of theseproteins are small (,10 kDa), and it is not, therefore, unrea-sonable that several of them were identified by only onepeptide measurement (Supplementary Fig. S1) and/or onlyin one replicate study. The levels of several of these proteinsdecreased during germination and outgrowth, includingBAS0469A, BAS0488A and BAS4644A. We include discus-sion of these proteins as they may reflect novel early targetsof proteolysis during germination.
3.3 Relative changes in protein levels during
germination and outgrowth
To examine whether global changes in the relative ratios ofspore coat proteins occurred during germination and out-growth, we analyzed the total datasets for both germinationexperiments separately, at both the peptide and at the proteinlevels. The distributions of the estimated peptide (Fig. 3Aand B) and protein (Fig. 3C and D) ratios (reconverted fromthe log2 scale to the original scale) for the 2- and 7-min timepoints (115 and 116) relative to T0 (114) are centered at 1(range 0.99–1.05) with SD of approximately 0.2 (range 0.16–0.34) (Fig. 3). This distribution indicates that there were fewdifferences in the relative abundance of most peptides andproteins during early germination. It is worth noting that thespread of these distributions at the protein level is signifi-cantly smaller than that seen at the peptide level (compareFig. 3A and B with 3C and D, respectively), due to the dataaggregation process. Moreover, there is a high degree ofreproducibility between the two biological replicates. Thelarger variances in the second experiment could be attributedto the smaller number of MS/MS spectra acquired (about60% of the number obtained in the first experiment). Sig-nificantly, our SD are in agreement with the ones reportedpreviously using a different method of data display (Supple-mentary Fig. S3) [12]. We, however, prefer to visualize thedata using absolute ratios as this provides relationships thatare more meaningful for evaluation of the biology.
In contrast to the earlier time points, the relative ratiodistribution of 17 min/0 min (117/114) is centered at 1.09–1.10 with SD ranging from 0.32 to 0.46, revealing changes inthe relative abundance of peptides (Fig. 3A and B) and pro-teins (Fig. 3C and D) in late germination compared to pre-germination. The shape of the histograms, too, indicateschanges in the relative levels of peptides and proteins.
Based on quantitative data obtained from the iTRAQanalysis, proteins in the common spore proteome were clas-sified as proteins whose levels change during germination(39 proteins) and those that do not (115 proteins). In addi-tion, the ratios for 13 proteins were inconsistent betweendatasets. Of the proteins that showed significant changes at17 min as compared to 0 min, the levels of 19 decreased and20 increased (Supplementary Table S1). Because the numberof proteins whose levels change significantly is much greaterthan that predicted by chance [26], these likely represent bonafide proteomic changes that occur during germination.
© 2006 WILEY-VCH Verlag GmbH & Co. KGaA, Weinheim www.proteomics-journal.com

Proteomics 2006, 6, 0000–0000 Microbiology 7
Table 3. Uncharacterized proteins that decrease during germination
ORF Additional commentsa) Length(aminoacids)
% Gluta-mine
Predictedoperonstructureb)
Potentialregu-lationc)
Homologsd) RNA ex-pressione)
Previouslyidentifiedspore proteinf)
BAS0469Ag Not annotated in 2012 or Sterne.Downstream of ytaF (BAS0469)
52 1.9% BAS0469-BAS0469A (F)
sG Bc, Bt Wave 4 ORF01172
BAS0488Ag Might be cotranscribed with sspK(BAS0488B; 43 bases downstream)also not annotated in Sterne
50 12% BAS0488A(R) Bc, Bsg), Btg) Wave 5 No
BAS0770 In operon with BAS0769, a glycoxy-lase. Divergently transcribedfrom cotJA, cotJB and cotJC
259 2.7% BAS0769-BAS0770 (F)
sG Bc, Bl, Bh, Bt Wave 4 ORF00802
BAS1086 65 13.8% BAS1086 (R) Bc, Bl, Bt Wave 5 ORF00393
BAS1169 143 3.5% BAS1169 (R) sK Bc, Bt ND No
BAS1302 Related to BAS1957, a permease.YqfX-like (35% identical). Notannotated in 2012
123 .08% BAS1302 (R) sG Bc, Bt Wave 5 ORF0106i
BAS1511 Related to YpzA (34% identical) 82 3.6% BAS1514-BAS1515 (F)
Bc, Bt, Gk ND ORF06512
BAS2560 Forespore/cortex related. Relatedto YlaJ, YhcN and YrbB/CoxA.Related to BAS4834 and BAS4323.Transcribed with a hydrolase(BAS2562)
198 4.5% BAS2560-BAS2561-BAS2562 (R)
sE) Bc, Bl, Bs,Bt, Gk
Wave 5 ORF05206
BAS3115 63 14.3% BAS3115 (F) sE) Bc, Bt Wave 5 ORF04501
BAS3634 Related YmfJ and YflH (58 and 40%identical, respectively). In largeoperon
82 7.3% BAS3634 (R) sG Bc, Bh, Bl, Bcl,Bs, Bt, Gk, Oi,
Wave 5
BAS4323 Forespore/cortex related. Relatedto YrbB/CoxA, YlaJ and YhcN.Related to BAS2560 and BAS4834
214 1.4% BAS4323 (R) sG Bc, Bt Wave 5 ORF0385i
BAS4595 92 10.9% BAS4595 (F) Bc, Bl, Bcl, Bs,Bt, Gk, Oi.
Wave 5 ORF02663
BAS4644Ag Transcribed with BAS4645 49 16.3% BAS4644A-BAS4645 (R)
sG Bc, Btg Wave 5 ORF03001
BAS4645 Transcribed with BAS4644A. Similarto YtzC (51% identical)
87 19.5% BAS4644A-BAS4645 (R)
sG Bc, Bl, Bs,Bt, Gk
Wave 5 ORF02605
BAS4870 Spore coat protein F-like. In operonwith BAS4871
82 12.2% BAS4870-BAS4871 (R)
sG Bc, Bt, Cp,Ct, Oi
Wave 5 ORF02319
BAS4871 In operon with BAS4870 61 14.8% BAS4870-BAS4871 (R)
sG Bc, Bt, Cp,Ct, Oi
Wave 5 ORF02318
BAS4993 In operon with spoVAC (BAS4995),spoVAD (BAS4996) and spoVAEBAS4997)
68 20.6% BAS4993-BAS4994-BAS4995-BAS4996-BAS4997-BAS4998-BAS4999 (F)
sE) Bc, Bt, Gk, Oi, Wave 5 ORF02170
a) ORF names starting with Y are in B. subtilis.b) From http://vimss.org/operons [32]. F, forward. R, reverse.c) Upstream region possesses the following sequences: sE, Ata(16–18)cATAcanT; sK, AC(16–17)CATAnnnT; sG, gnaTr 15 cAtnnTA.d) Protein with�45% identity also found in the indicated bacteria. Bc, B. cereus; Bcl, B. clausii; Bh, B. halodurans; Bl, B. licheniformis; Bs, B.
subtilis; Bt, B. thuringiensis; Cp, Clostridium perfringens; Ct, C. tetani; Gk, Geobacillus kaustophilus; Oi, Oceanobacillus iheyensis.e) Expression wave pattern as determined by Liu et al. [22].f) Corresponding ORF number previously found in B. anthracis Ames spore proteome [22]. ND- no data. Protein not annotated in B.
anthracis Ames strain.g) Not annotated in the genome.
© 2006 WILEY-VCH Verlag GmbH & Co. KGaA, Weinheim www.proteomics-journal.com

8 P. Jagtap et al. Proteomics 2006, 6, 0000–0000
Figure 3. Relative distribution ofpeptides and proteins quantifiedwith isobaric tags. Shown arethe distributions of the peptide(A and B; first and second repli-cate, respectively) and protein(C and D; first and second repli-cate, respectively) ratios for2 min/0 min (115/114), 7 min/0 min (116/114) and 17 min/0 min (117/114). For each plot,the mean and SD are given. Thedata in panel (A) are plotted asdescribed [35] in Supplemen-tary Fig. S3.
Typical quantitative data profiles for a protein that decreases(BAS0493, an SASP g-type protein) and one that increases(RplB, a ribosomal protein) are shown in Fig. 4. Averageratios for all proteins and time points are in SupplementaryTable S1.
3.4 Proteins that decrease during germination
We identified 19 proteins that decreased in abundance dur-ing germination in both replicates (SupplementaryTable S1), including SASP, known coat proteins and hypo-thetical proteins. An additional 12 proteins may also de-crease, but were only identified by one peptide or in only one
experiment. We attribute the reduction in protein levels toprotein degradation resulting from the germination process.Consistent with this idea, the majority (17) of these proteinswere identified in a study of the spore proteome [22], whereasonly 3 were identified in the vegetative cell proteome [27],indicating that most, if not all, of these proteins are bona fidespore proteins. Not surprisingly, the vast majority of theseproteins are not assigned a functional category (Supplemen-tary Fig. S2D), indicating that they are either not widelyconserved or are uncharacterized. In addition to proteins inthe common spore proteome, we also include a discussion ofdecreased proteins that were found in only one study (Sup-plementary Table S1).
© 2006 WILEY-VCH Verlag GmbH & Co. KGaA, Weinheim www.proteomics-journal.com

Proteomics 2006, 6, 0000–0000 Microbiology 9
Figure 4. MS/MS spectra and iTRAQ data for selected proteinsthat increase or decrease during germination. Shown are the MS/MS spectra for one peptide whose level (A) decreases (BAS0493,a g-type SASP) and (B) increases (BAS0113, ribosomal proteinRplB). The b and y fragment ions from the MS/MS spectra areindicated. Inset shows the reporter ion region for each peptide.Peptide sequences are indicated.
3.5 SASPs
SASPs are a predominant class of proteins in the spore corecomprising approximately 15% of the total protein content insporulating bacteria such as Bacillus, Clostridium and Ther-moactinomycetes [28]. The Sterne genome encodes 12 anno-tated SASPs and an additional unannotated protein(BAS3059A) that belongs to the a/b family of SASPs. Thea/b type of SASPs bind to the spore core double-strandedDNA, causing a change in DNA from the B-form to the A-form [29]. These SASPs protect the DNA from chemical,enzymatic and UV damage [30–32]. B. anthracis Sterne alsoencodes one g-type SASP (BAS0043). This abundant SASPspecies does not bind to DNA and might have a role inosmoregulation in the spore core [33] and in providingamino acids for protein metabolism in the initial phase aftergermination [34]. The a/b and g SASPs are known to berapidly degraded by the germination-specific protease, GPR,during the first few minutes of germination [35]. GPR isinactive in the dehydrated spore but rapidly activates upon
spore rehydration during germination. The roles of theremaining minor SASPs (SspH, SspI, SspO and Tlp) areunknown but, in B. subtilis, these proteins are not critical forspore generation or germination [36].
In this study, 7 of the 13 B. anthracis SASPs were identi-fied in both replicates and three additional SASPs werefound only in the first replicate (Supplementary Fig. S1). Intotal, we identified 6/7 of the a/b SASPs (BAS0815,BAS1125, BAS1844, BAS2908, BAS2911 and BAS4544), theg-SASP (BAS0493), Tlp (BAS3403) and two minor SASPproteins (BAS0043 and BAS4458). All 6 of the identifieda/b-type SASPs and the g-type SASP have recognizable con-sensus sites for GPR cleavage (data not shown) [28, 37]. Asexpected, all 10 of these SASsP were significantly degradedduring germination (Fig. 5A, Supplementary Table S1). Fur-thermore, during outgrowth, levels of the protease GPR werealso decreased, albeit at a modest level (Fig. 5A), consistentwith the role of proteolysis in activation of GPR (see, forexample, [16]).
We noted that BAS0493, the g-type SASP, possessed twoGPR consensus sequences (Fig. 6). The B. subtilis g-typeSASP, SspE, possesses only one GPR cleavage site. Interest-ingly, it appears that in B. anthracis and other closely relatedBacilli, the g-type SASP resulted from a duplication event(amino acids 13–51 and 52–90 are 87% identical) (Fig. 6). Todetermine whether we could provide experimental evidence
Figure 5. Quantitation of proteins that decrease during sporegermination. The relative ratios (2 min/0 min, light gray; 7 min/0 min dark gray; 17 min/0 min black) of the indicated proteins areshown. (A) SASP and GPR proteins. (B) Unknown proteins. Dataare plotted on a log2 scale. Error bars are SEM. Proteins for whichthere was only one measurement do not have error bars. Anasterisk indicates that the protein was only detected in one ger-mination experiment.
© 2006 WILEY-VCH Verlag GmbH & Co. KGaA, Weinheim www.proteomics-journal.com

10 P. Jagtap et al. Proteomics 2006, 6, 0000–0000
Figure 6. Identification of peptides and GPR cleavage sites for a g-type SASP. The sequence of BAS0493 is shown such that the duplicatedregions (amino acids 13–51 and 52–90) overlay. Amino acid identities and similarities are indicated by : and 1, respectively. The GPR pro-tease cleavage sites are indicated by arrowheads, the positions of the identified tryptic peptides indicated by open boxes, and the proposedGPR protease cleavage peptides by shaded boxes.
for in vivo cleavage at the predicted GPR cleavage sites, we re-queried the MS/MS peak lists for semi-tryptic cleavages(peptides having one tryptic and one non-tryptic cleavagesite). We detected peptides consistent with GPR cleavage fortwo SASPs, BAS0493 and BAS4544 (Fig. 6 and data notshown), direct indication that the GPR protease is involvedin turnover of these proteins.
3.6 Other decreased proteins
Whereas few coat proteins have been characterized in B.anthracis, many have been identified based on sequencesimilarity to B. subtilis coat proteins [14, 38]. In this study, weisolated relatively few of these predicted coat proteins, anexpected result, as our extraction protocol was relatively gen-tle as compared to our previous method (0.1% SDS andmechanical shearing compared to 2% SDS and boiling) [14].Regardless, we identified several proteins that were clearlyspore coat proteins: BAS3957 (Cota), BAS3619 (CotE),BAS3402 (YaaH), BAS0340, BAS0341, BAS2008, BAS2377,BAS3619, BAS4870, cortex related proteins BAS2560 andBAS4323, and exosporium protein BAS1898 (Supplemen-tary Table S1) [14]. Not surprisingly, a number of these pro-teins (BAS2560, BAS3957, BAS4323 and BAS4870) aredegraded during germination and outgrowth (Supplemen-tary Table S1, Fig. 5B). Of note, not all spore coat proteins aredegraded during germination, as CotE, YaaH and the proteinencoded by BAS3619 (in both germination studies) werestable during germination (Supplementary Table S1). Thisdifferential stability suggests that not all spore coat proteinsare early targets of proteolysis and that germination does notinvolve indiscriminate degradation of all coat proteins. Thisobservation is consistent with the observed spore fragmentspresent in germination media [10] and, together with theultrastructural observations of spore cracking [2], suggeststhat selective proteolysis and zonal distribution of spore coatproteins may be responsible.
The vast majority of the uncharacterized decreased pro-teins are found exclusively in sporulating bacteria and havebeen previously shown to be expressed late in sporulation[22] (Table 3), consistent with a spore-specific cellular role. Inmany cases, however, these unknown proteins are onlyfound in the closely related bacterium, B. cereus, and reitera-
tive PSI-BLAST searches, in general, did not reveal sequencefeatures that suggested a function. Particularly striking isthat 12/17 of these unknown proteins are less than 100amino acids in length. Included are 3 proteins whose geneswere previously unannotated in the Sterne genome (Table 3).One of these genes, BAS0488A is also unannotated in the B.subtilis genome. We also note that several of these proteinscontain significant levels of the amino acid glutamine(�10%, Table 3).
To provide clues as to the role of the unknown degradedproteins, we examined the promoter regions for consensusmotifs based on the B. subtilis sigma factor binding sites [39].Spore formation is driven by a cascade of temporally and spa-tially controlled phases of transcription that results in theappearance of specific proteins in the forespore (such as theSASP) and others in the mother cell (such as the coat proteins)[25, 40–43]. These phases of expression are controlled by a se-ries of sigma factors that become active sequentially and inspecific compartments. sF and sG are both active in the fore-spore and are responsible for synthesis of spore-specific pro-teins including the SASPs, and certain proteins involved incortex biosynthesis (such as PbpF and PbpG) [44]. Geneexpression in the mother cell is directed by sE and sK. Theiraction results in the synthesis of proteins involved in cortexproduction and all the coat proteins. DNA array analysis indi-cates that, in B. subtilis, sE directs the expression of 262 genesand that sK activates an additional 121 genes [40–42].
Transcriptional profiling of B. anthracis cells duringsporulation reveals a coordinated temporal expression ofspore mRNA [22], largely consistent with that observed in B.subtilis [40–43]. Thus, although experimental data for the roleof specific mother and forespore sigma factors has not beenreported in B. anthracis, it is likely that the expression of keycore protein genes will be under the control of sF and sG,whereas coat protein encoding genes will be controlled by sE
and sK. Using the consensus sequences Ata(16–18)cATA-canT and AC(16–17)CATAnnnT for sE and sK, respectively,we found perfect sK binding sites in the promoter region ofBAS1169 and perfect sE binding sites in the promoterregions of BAS2560, BAS3115 and BAS4993 (Table 3).Therefore, these genes may encode coat and/or germinationproteins expressed from mother cell-specific promoters.BAS4993 is in an operon with several genes (spoVAC, spo-
© 2006 WILEY-VCH Verlag GmbH & Co. KGaA, Weinheim www.proteomics-journal.com

Proteomics 2006, 6, 0000–0000 Microbiology 11
VAD, spoVAE) whose products, in B. subtilis, are importantfor dipicolinic acid movement across spore membranes dur-ing sporulation and germination [45]. The majority of theremaining proteins that decreased during germination (13)has consensus sequences for sG (Table 3) and, therefore,may be expressed in the forespore. None of the genes had aconsensus sequence for a sF promoter.
3.7 Proteins that increase during germination
Twenty proteins significantly increased, albeit at relativelymodest levels, by 17 min of outgrowth (SupplementaryTable S1). We envision two possible reasons for theirincrease: differential extraction of the protein due to changesin the spore and bona fide increase in gene expression. It iswell documented that germinating spores are tran-scriptionally inert [8]. At 17 min, however, the spores havegerminated, considerable degradation of spore-specific pro-teins has occurred, and are reorganizing their genetic pro-gram to initiate vegetative cell growth (Fig. 1). Not surpris-ingly then, we observed that the majority of proteins whoselevels increase are involved in the cellular reprogrammingnecessary for cell growth (Supplementary Fig. S2C) and,therefore, increases in protein level may represent new pro-tein synthesis. Proteins involved in translation and carbohy-drate transport and metabolism (categories J and G) accountfor over 50% of the proteins that increase late in germina-tion. Notably, 15 proteins that increased are found in thevegetative cell proteome [27], consistent with a transitionfrom spore to vegetative cell. For the most part, the increasedproteins correlate well with the consequences of an increasein cell metabolism.
4 Discussion
Bacterial spores are dormant, highly resistant and, as far ascan be discerned, metabolically inert. Nonetheless, in re-sponse to the presence of nutrient, they are able to germinatein minutes and resume cellular activity. This process initiateswithout any input of energy or detectable metabolism, andvery quickly leads to cell growth and division. The earlyevents in this process are largely undefined. In particular,with the exception of the SASPs, we know very little aboutchanges in spore composition during germination. A betterunderstanding of these changes would provide significantinsight into the ways in which spores control the decon-struction of their protective layers and the methods by whichthey reinitiate metabolism in the most efficient manner. Inthis study, we have begun to address these questions usingquantitative proteomics to describe the changes in proteinlevels during the first few minutes of B. anthracis spore ger-mination.
Two major conclusions can be drawn from our work.First, we have shown that within the first 17 min, whichencompasses the full period of loss of spore refractility and,
therefore, most of the rehydration process, a specific subsetof proteins are significantly reduced in abundance. The deg-radation is rapid and is specific to some, but not all coat pro-teins, the SASPs and a set of heretofore-uncharacterizedproteins. We argue, therefore, that the initial degradationevents target specific spore proteins. Secondly, we found that20 proteins modestly increase in abundance. The majority ofthese proteins are involved in key metabolic processes, aswould be expected for a cell initiating active growth. Al-though we cannot definitively rule out that differential solu-bilization of these proteins occurred, we favor a modelwhereby metabolism has resumed in at least a subpopula-tion of the spores in our experiment. It is reasonable toassume that there is significant evolutionary pressure for avery rapid resumption of metabolism as soon as nutriententers the environment. Given that spores will usually bepresent in an environment with many other organisms (e.g.in the soil), the reintroduction of a food source will spark aperiod of intense competition. Cells that most efficientlyreestablish rapid growth will be most successful in repopu-lating their niches. Thus, there is a significant advantage torapid and efficient dismantling of the spore outer layers anda mechanism of control of protein synthesis that allows theresumption of vegetative growth to occur as rapidly aspossible.
Of high priority is the determination of the cellularfunction of the hypothetical proteins that are degraded dur-ing germination. Of the 19 proteins that decrease in abun-dance identified in both replicates and the 12 found in a sin-gle study, only 1 has been assigned to a COG family (Sup-plementary Fig. S2D) indicating that, in general, theseproteins are not distributed broadly and/or that they areuncharacterized. Not surprisingly, 10 of the decreased pro-teins are SASPs whose rapid degradation during germina-tion is expected, as they play a central role in protection ofspore DNA and presumably interfere with transcription [28,32, 36, 46, 47]. Several of the decreased proteins are likelycoat proteins (BAS2560, BAS3957, BAS4323 and BAS4870).Several others (BAS1169, BAS2560, BAS3115 and BAS4993)may be controlled by sK and sE and, therefore, could be ad-ditional coat proteins.
Intriguingly, more than half of the unknown decreasedproteins identified in this study were quite small (less than100 amino acids; Table 3). Moreover, 3/12 of these smallproteins were previously unannotated in the B. anthracisSterne genome (Table 3), presumably due to their small size.These proteins would have certainly been missed using astandard 2-D gel-based system and, therefore, provide fur-ther rationale for using multiple approaches to study thespore proteome. Many of these small proteins (9) also pos-sess biased amino acid compositions, containing more than10% glutamine residues (Table 3). In B. subtilis, a number ofthe SASPs, including the g-type SASP, SspE, and several ofthe minor SASPs (SspH, SspO and SspI) also possess manyglutamine residues (.10%), raising the possibility that someof these proteins may be heretofore unknown SASPs. Inter-
© 2006 WILEY-VCH Verlag GmbH & Co. KGaA, Weinheim www.proteomics-journal.com

12 P. Jagtap et al. Proteomics 2006, 6, 0000–0000
estingly, based on its predicted operon structure BAS0488Ais likely co-expressed with sspK. Another possibility, however,is that some of these proteins are spore coat proteins. This islikely the case for BAS4870, a CotF-like protein, and may betrue for proteins whose expression may be under the controlof mother cell sigma factors (Table 3).
Although most proteins showed the same trends in bothindependent replicates, 13 proteins displayed appreciabledegradation in one dataset but not the other (SupplementaryTable S1). For a new quantitative technology, a false positiverate of 8% (13/167) would be tolerable. It may be, however,that the difference in the datasets for these specific proteinsreflects experimental differences and not variance in theiTRAQ technology. Whereas most bona fide decreased pro-teins had greater reductions in their iTRAQ ratios withlonger germination times (Fig. 6), nine of these anomalousproteins showed similar low iTRAQ ratios, regardless of thetime examined. Furthermore, we note that 5 of these anom-alous proteins are spore coat and/or surface structure pro-teins, including BAS0340, BAS0341, BAS1898, BAS2008and BAS2377). One possibility, therefore, is that differentialextraction, perhaps due to protein cross-linking, wasresponsible for this anomalous behavior. We hypothesizethat these and other proteins with conflicting iTRAQ ratiosmay also have solubilized differently in the independentlygerminated and processed replicate experiments.
In this study, we obtained direct in vivo evidence for spe-cific degradation events through the identification of pep-tides from cleavage at consensus sites for the GPR protease(Fig. 6). The effects of degradation by the endogenous GPRprotease might be expected to be less obvious in the earlystages of germination because limited proteolysis will intro-duce only a few non-tryptic cleavages. The observation ofreductions in protein levels at the earliest time point, how-ever, indicates that the germinating spore is fully competentfor protein degradation early in the germination process.
One characteristic of Bacillus spore germination is thatthe early stages are pre-transcriptional and apparently pre-translational, limiting direct study to the level of proteins.This characteristic is shared with other systems undergoingextreme dormancy where transcriptional activity is minimalor non-existent. An analysis of early protein changes, how-ever, would be difficult to achieve using classical gel-basedproteomics methods as many of the spore proteins are quitesmall and/or are difficult to solubilize. Previous studies ofspore proteins using 2-DE, for instance, identified only 3degraded proteins that fell within the observable pI and sizerange of 2-D gels [48]. Trypsinization of the spore coat pro-teins, however, results in soluble peptides that are amenableto separation by chromatography as previously shown in anon-quantitative study of B. anthracis spore proteins [22].
This study took advantage of the recently developed iso-baric tag technology [12] to examine the time dependency ofprotein levels in the germinating spore. The data obtainedfrom time courses provide more detailed informationregarding changes in protein levels and a higher degree of
certainty than binary experiments, as proteins can beexpected to exhibit consistent trajectories within the timeframe of this study. A temporal examination of spore germi-nation was feasible because this isotope enrichment methodallows four-plex experiments and quantification to be per-formed in the second stage of a tandem mass spectrometerwith the attendant advantages of that approach. The iTRAQtechnology employed in this study used a standard MudPITapproach [49], with the collection of capillary HPLC fractionsdirectly on a MALDI sample plate. The relatively high massaccuracy and resolution of the TOFTOF mass spectrometercontributes to the accuracy of the protein identifications. Be-cause the capillary HPLC fractions were collected on anMALDI sample plate with inline addition of MALDI matrix,the MALDI TOFTOF could be used for these studies, withthe inherent benefits of being able to re-query the samplesspotted on the MALDI plate. Moreover, the higher collisionenergy of this instrument is well suited for reproducibleanalysis of iTRAQ peptides.
It should be noted that while the iTRAQ data presentedin this manuscript exhibit well-defined precision, theauthors have noted in preliminary studies (Maddock andAndrews, unpublished) that iTRAQ data collected on themodel 4700 appears to be slightly dampened. Initial obser-vations attribute this effect to the large timed ion selectionwindow (ca. 8 Da) on this instrument, that allows significantchemical noise in the form of low level iTRAQ-tagged pep-tides to be included with the parent ion (unpublishedresults). The magnitude of this dampening effect may be aslarge as twofold for some ions based on preliminary studieswith narrower ion selection windows on other models. Thisdoes not significantly affect the precision of the measure-ments, but does affect the accuracy with which the changecan be measured. The changes reported in this study shouldtherefore be considered to be minimal values.
We also describe a robust statistical method for deter-mining the relative changes that occur. Our method takesinto account the complex nature of the data for each protein,which includes both measurements of unique peptides foreach protein and multiple measurements of each uniquepeptide. This redundancy of measurements can greatlyincrease the certainty with which small but significantchanges can be identified. We anticipate that the precision ofthis method and the ability to easily acquire up to four timepoints will allow more detailed studies of protein expressionlevels and more effective correlation with mRNA expressionlevels than other proteomic approaches.
The degree of detail obtained from this quantitative time-course study has significantly increased our understandingof the specific events involved in B. anthracis spore germina-tion. Elucidation of the selective degradation of spore pro-teins, verification of two substrates for GPR protease, andimplication of newly identified ORF in spore germinationwere enhanced by the ability to perform time-course prote-omics with good precision. We anticipate that this approachcould be extended to provide more detailed information
© 2006 WILEY-VCH Verlag GmbH & Co. KGaA, Weinheim www.proteomics-journal.com

Proteomics 2006, 6, 0000–0000 Microbiology 13
about the relative kinetics of the identified substrates for thespore GPR protease and the early translation process duringspore germination.
This work was supported by grants AI053360 (J.R.M.),GM53989 (A.D) and AI53365 (A.D) and NCRR P41–18627(P.C.A) from the National Institutes of Health. The MichiganProteome Consortium is acknowledged for infrastructure support.We are extremely grateful to Sue Sullivan for critical editing ofthis manuscript.
5 References
[1] Vary, P. S., Microbiology 1994, 140, 1001–1013.
[2] Moir, A., Corfe, B. M., Behravan, J., Cell. Mol. Life Sci. 2002,59, 403–409.
[3] Henriques, A. O., Costa, T. V., Martins, L. O., Zilhao, R., in:Ricca, R. E., Henriques, A. O., Cutting, S. M., (Eds.), BacterialSpore Formers: Probiotics and Emerging Applications,Horizon Biosciences, Norfolk 2004, pp. 65–86.
[4] Driks, A., in: Sonenshein, A. L., Hoch, J. A., Losick, R., (Eds.),Bacillus Subtilis and its Closest Relatives, American Societyfor Microbiology, Washington 2002, pp. 527–536.
[5] Aronson, A. I., Fitz-James, P., Bacteriol. Rev. 1976, 40, 360–402.
[6] Holt, S. C., Leadbetter, E. R., Bacteriol. Rev. 1969, 33, 346–378.
[7] Setlow, P., Curr. Opin, Microbiol. 2003, 6, 550–556.
[8] Paidhungat, M., Setlow, P., in: Sonenshein, A. L., Hoch, J. A.,Losick, R., (Eds.), Bacillus Subtilis and its Closest Relatives,American Society for Microbiology, Washington 2002,pp. 527–536.
[9] Makino, S., Moriyama, R., Med. Sci. Monit. 2002, 8, RA119–127.
[10] Santo, L. Y., Doi, R. H., J. Bacteriol. 1974, 120, 475–481.
[11] Chada, V. G., Sanstad, E. A., Wang, R., Driks, A., J. Bacteriol.2003, 185, 6255–6261.
[12] Ross, P. L., Huang, Y. N., Marchese, J. N., Williamson, B. etal., Mol. Cell. Proteomics 2004, 3, 1154–1169.
[13] Cutting, S. M., Vander Horn, P. B., Molecular BiologicalMethods for Bacillus, John Wiley & Sons Ltd., Chichester1990, pp. 27–74.
[14] Lai, E.-M., Phadke, N. D., Kachman, M. T., Giorno, R. et al.,Driks, A., J. Bacteriol. 2003, 185, 1443–1453.
[15] Cortezzo, D. E., Setlow, B., Setlow, P., J. Appl. Microbiol.2004, 96, 725–741.
[16] Nessi, C., Jedrzejas, M. J., Setlow, P., J. Bacteriol. 1998, 180,5077–5084.
[17] Venkatasubramanian, P., Johnstone, K., J. Gen. Microbiol.1989, 135, 2723–2733.
[18] Michailidis, G., Shedden, K., J. Comput. Biol. 2003, 10, 689–698.
[19] Aggarwal, K., Choe, L. H., Lee, K. H., Proteomics 2005, 5,2297–2308.
[20] Snijders, T., Bosker, R., Sage Publications Ltd., London 1999.
[21] Hodges, J. L., Lehmann, E. L., J. Royal Stat. Soc. Series B1954, 16, 261–268.
[22] Liu, H., Bergman, N. H., Thomason, B., Shallom, S. et al., J.Bacteriol. 2004, 186, 164–178.
[23] Tatusov, R. L., Galperin, M. Y., Natale, D. A., Koonin, E. V.,Nucleic Acids Res. 2000, 28, 33–36.
[24] Driks, A., Microbiol. Mol. Biol. Rev. 1999, 63, 1–20.
[25] Piggot, P. J., Hilbert, D. W., Curr. Opin, Microbiol. 2004, 7,579–586.
[26] Benjamini, Y., Hochberg, Y., J. Royal Stat. Soc. Series B,Methodological 1995, 57, 289–300.
[27] Francis, A. W., Ruggiero, C. E., Koppisch, A. T., Dong, J. etal., Biochim. Biophys. Acta 2005, 1748, 191–200.
[28] Setlow, P., Annu. Rev. Microbiol. 1988, 42, 319–338.
[29] Mohr, S. C., Sokolov, N. V., C. M., H., Setlow, P., Proc. Natl.Acad. Sci. USA 1991, 88, 77–81.
[30] Sohail, A., Hayes, C. S., Divvela, P., Setlow, P., Bhagwat, A.S., Biochem. 2002, 41, 11325–11330.
[31] del Carmen Huesca Espita, L., Caley, C., Bagyan, I., Setlow,P., Mutat. Res. 2002, 503, 77–84.
[32] Setlow, P., Ann. Rev. Microbiol. 1995, 49, 29–54.
[33] Cucchi, A., Sanchez de Rivas, C., Curr. Microbiol. 1995, 31,228–233.
[34] Hackett, R. H., Setlow, P., J. Bacteriol. 1988, 170, 1403–1404.
[35] Loshon, C. A., Swerdlow, B. M., Setlow, P., J. Biol. Chem.1982, 257, 10838–10845.
[36] Cabrera-Hernandez, A., Sanchez, S., J. L., Paidhungat, M.,Setlow, P., Gene 1999, 232, 1–10.
[37] Carrillo-Martinez, Y., Setlow, P., J. Bacteriol. 1994, 176, 5357–5363.
[38] Driks, A., Trends Microbiol. 2002, 10, 251–154.
[39] Helmann, J. D., Morgan, C. P. J., in: Sonershein, A. L., Hoch,J. A., Losick, R., (Eds.), Bacillus Subtilis and its Closest Rela-tives, American Society for Microbiology, Washington 2002,pp. 289–312.
[40] Eichenberger, P., Fujita, M., Jensen, S. T., Conlon, E. M. et al.,PLoS Biol. 2004, 2, e328.
[41] Eichenberger, P., Jensen, S. T., Clonlon, E. M., VanOoij, C. etal., J. Mol. Biol. 2003, 327, 945–972.
[42] Steil, L., Serrano, M., Henriques, A. O., Volker, U., Micro-biology 2005, 151, 399–420.
[43] Feucht, A., Evans, L., Errington, J., Microbiology 2003, 149,3023–3034.
[44] McPherson, D. C., Driks, A., Popham, D. L., J. Bacteriol. 2001,183, 6046–6053.
[45] Vepachedu, V. R., Setlow, P., Microbiol. Lett. 2004, 239, 71–77.
[46] Cabrera-Hernandez, A., Setlow, P., Gene 2000, 248, 169–181.
[47] Bagyan, I., Setlow, B., Setlow, P., J. Bacteriol. 1998, 180,6704–6712.
[48] Huang, C. M., Foster, K. W., DeSilva, T. S., Van Kampen, K. R.et al., Proteomics 2004, 4, 2653–2661.
[49] Washburn, M. P., Wolters, D., Yates, J. R. Jr., Nat. Biotechnol.2001, 19, 242–247.
© 2006 WILEY-VCH Verlag GmbH & Co. KGaA, Weinheim www.proteomics-journal.com
Copyright © 2022 FDOKUMEN