Trauma patients with solid organ injury: Results from a Border Town Hospital in Turkey
Upload
independentCategory
view
2download
0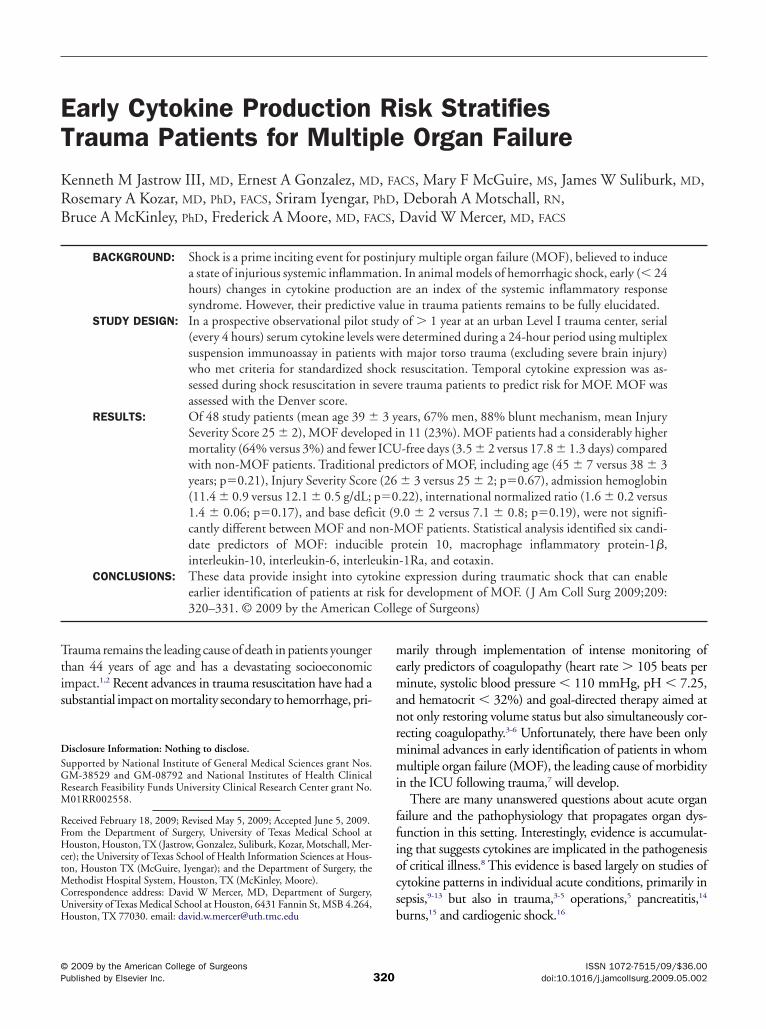
ETKRB
Ttis
DSGRM
RFHctMCUH
©P
arly Cytokine Production Risk Stratifiesrauma Patients for Multiple Organ Failureenneth M Jastrow III, MD, Ernest A Gonzalez, MD, FACS, Mary F McGuire, MS, James W Suliburk, MD,osemary A Kozar, MD, PhD, FACS, Sriram Iyengar, PhD, Deborah A Motschall, RN,ruce A McKinley, PhD, Frederick A Moore, MD, FACS, David W Mercer, MD, FACS
BACKGROUND: Shock is a prime inciting event for postinjury multiple organ failure (MOF), believed to inducea state of injurious systemic inflammation. In animal models of hemorrhagic shock, early (� 24hours) changes in cytokine production are an index of the systemic inflammatory responsesyndrome. However, their predictive value in trauma patients remains to be fully elucidated.
STUDY DESIGN: In a prospective observational pilot study of � 1 year at an urban Level I trauma center, serial(every 4 hours) serum cytokine levels were determined during a 24-hour period using multiplexsuspension immunoassay in patients with major torso trauma (excluding severe brain injury)who met criteria for standardized shock resuscitation. Temporal cytokine expression was as-sessed during shock resuscitation in severe trauma patients to predict risk for MOF. MOF wasassessed with the Denver score.
RESULTS: Of 48 study patients (mean age 39 � 3 years, 67% men, 88% blunt mechanism, mean InjurySeverity Score 25 � 2), MOF developed in 11 (23%). MOF patients had a considerably highermortality (64% versus 3%) and fewer ICU-free days (3.5 � 2 versus 17.8 � 1.3 days) comparedwith non-MOF patients. Traditional predictors of MOF, including age (45 � 7 versus 38 � 3years; p�0.21), Injury Severity Score (26 � 3 versus 25 � 2; p�0.67), admission hemoglobin(11.4 � 0.9 versus 12.1 � 0.5 g/dL; p�0.22), international normalized ratio (1.6 � 0.2 versus1.4 � 0.06; p�0.17), and base deficit (9.0 � 2 versus 7.1 � 0.8; p�0.19), were not signifi-cantly different between MOF and non-MOF patients. Statistical analysis identified six candi-date predictors of MOF: inducible protein 10, macrophage inflammatory protein-1�,interleukin-10, interleukin-6, interleukin-1Ra, and eotaxin.
CONCLUSIONS: These data provide insight into cytokine expression during traumatic shock that can enableearlier identification of patients at risk for development of MOF. (J Am Coll Surg 2009;209:
320–331. © 2009 by the American College of Surgeons)memanrmmi
ffiocs
rauma remains the leading cause of death in patients youngerhan 44 years of age and has a devastating socioeconomicmpact.1,2 Recent advances in trauma resuscitation have had aubstantial impact on mortality secondary to hemorrhage, pri-
isclosure Information: Nothing to disclose.upported by National Institute of General Medical Sciences grant Nos.M-38529 and GM-08792 and National Institutes of Health Clinicalesearch Feasibility Funds University Clinical Research Center grant No.01RR002558.
eceived February 18, 2009; Revised May 5, 2009; Accepted June 5, 2009.rom the Department of Surgery, University of Texas Medical School atouston, Houston, TX (Jastrow, Gonzalez, Suliburk, Kozar, Motschall, Mer-
er); the University of Texas School of Health Information Sciences at Hous-on, Houston TX (McGuire, Iyengar); and the Department of Surgery, the
ethodist Hospital System, Houston, TX (McKinley, Moore).orrespondence address: David W Mercer, MD, Department of Surgery,niversity of Texas Medical School at Houston, 6431 Fannin St, MSB 4.264,
bouston, TX 77030. email: [email protected]
3202009 by the American College of Surgeons
ublished by Elsevier Inc.
arily through implementation of intense monitoring ofarly predictors of coagulopathy (heart rate � 105 beats perinute, systolic blood pressure � 110 mmHg, pH � 7.25,
nd hematocrit � 32%) and goal-directed therapy aimed atot only restoring volume status but also simultaneously cor-ecting coagulopathy.3-6 Unfortunately, there have been onlyinimal advances in early identification of patients in whomultiple organ failure (MOF), the leading cause of morbidity
n the ICU following trauma,7 will develop.There are many unanswered questions about acute organ
ailure and the pathophysiology that propagates organ dys-unction in this setting. Interestingly, evidence is accumulat-ng that suggests cytokines are implicated in the pathogenesisf critical illness.8 This evidence is based largely on studies ofytokine patterns in individual acute conditions, primarily inepsis,9-13 but also in trauma,3-5 operations,5 pancreatitis,14
urns,15 and cardiogenic shock.16
ISSN 1072-7515/09/$36.00doi:10.1016/j.jamcollsurg.2009.05.002

dpIctvscyWc
MPTgcmtS2eHCjp
tttpistbssps
CDasrrchtpcfwwaI(ITwCm
PApdtss34symt2
SSiSoumrtiT(
321Vol. 209, No. 3, September 2009 Jastrow et al Early Cytokine Production and Trauma Patients
Statistical modeling of the body’s response to shock in-icates that there is a considerable change in cytokine ex-ression that occurs at various time points during shock.17
n addition, others have shown that the degree of overallytokinemia is more pronounced in patients with MOFhan in non-MOF patients.9,10,12,13 But, their predictivealue remains to be fully elucidated. Consequently, thistudy was done to examine early cytokine expression inritically injured trauma patients and, using statistical anal-sis, assess their predictive values for development of MOF.e hypothesized that early changes in cytokine production
ould identify patients at risk for MOF.
ETHODSatient populationhis prospective, observational nonrandomized study be-inning January 2005 and ending December 2006 wasonducted in the shock trauma ICU at Memorial Her-ann Hospital, Houston, TX, a Level I trauma center and
he teaching hospital of the University of Texas Healthcience Center at Houston. The protocol (HSC-MS-04-21) was approved by the University of Texas Health Sci-nce Center at Houston Committee for the Protection ofuman Subjects IRB. The Office of Research Supportommittee, as a subset of the Protection of Human Sub-
ects, provided Emergency Research “waiver of consent” asart of the IRB approval and according to its guidelines.Patients were entered into the study after initial evalua-
ion in the emergency room and subsequent admission tohe shock trauma ICU. Patients eligible for inclusion werehose who met criteria for a 24-hour shock resuscitationrotocol with standardized decision making provided us-ng bedside computerized decision support. Criteria forhock resuscitation and for this study included major torsorauma (Injury Severity Score [ISS] � 15) without severerain injury (defined as an abnormal head CT); hypoten-ion (systolic blood pressure � 90 mmHg) or metabolictress (base deficit � 6 mEq/L); and � 1 U transfusedacked RBC. Shock resuscitation protocol has been de-
Abbreviations and Acronyms
IL � interleukinIL-1Ra � interleukin-1 receptor antagonistINR � international normalized ratioIP-10 � inducible protein 10ISS � Injury Severity ScoreMIP-1� � macrophage inflammatory protein-1�MOF � multiple organ failureNPV � negative predictive valuePPV � positive predictive value
cribed previously.18-20 t
linical assessmentata characterizing the degree of acidosis, hypothermia,
nd coagulopathy were obtained prospectively. Shock re-uscitation was begun on ICU admission. As part of theesuscitation process, baseline body core temperature, arte-ial blood gas, and other standard clinical laboratory bloodhemistry analyses (ie, electrolyte, glucose concentration,emoglobin concentration), and coagulation profile (pro-hrombin time, international normalized ratio [INR],latelet count, partial thromboplastin time, and fibrinogenoncentration) were obtained and repeated every 4 hoursor the duration of the 24-hour process. Organ dysfunctionas defined using the Denver MOF scoring system,21-23 forhich four organ systems (ie, pulmonary, hepatic, renal,
nd cardiac) were evaluated daily throughout each patient’sCU stay. Organ dysfunction was graded on a scale from 0best) to 3 (worst).24 Additional data characterizing pre-CU and ICU course were recorded retrospectively in arauma Research Database. This database is maintainedith approval of the University of Texas Health Scienceenter at Houston Committee for the Protection of Hu-an Subjects.
lasma cytokine measurementss part of ICU standard protocol care, arterial blood sam-les were obtained for clinical laboratory analysis in stan-ard sample tubes at start of the resuscitation protocol andhen every 4 hours for the first 24 ICU hours. As part of thetudy, an aliquot of excess volume that was not used fortandard clinical laboratory analyses was transferred to-mL sample tubes, centrifuged at 1,000g for 15 minutes at°C immediately following collection to isolate serum, anderum was stored at �80°C in 350-�L aliquots until anal-sis. Cytokine concentration analyses were done using aultiplex suspension immunoassay according to manufac-
urer’s instructions (Bioplex; Bio-Rad). Concentrations of7 cytokines were measured in each sample (Table 1).
tatistical analysisample time points were adjusted to time elapsed fromnjury, not from time of entry into shock trauma ICU.tatistical analyses were performed on the cytokine databtained during the first 24 hours after traumatic injurysing SPSS for Windows (SPSS, Inc). Cytokine measure-ents were collected every 4 hours from the start of the
esuscitation protocol. The first 24 hours were included inhe study, because the primary focus was on the cytokinesnvolved with the “first response” innate immune system.10
he preliminary cytokine data were organized by outcomesMOF or non-MOF) and stratified by time periods.
There were 11 MOF patients and 37 non-MOF pa-
ients. Because of the small sample size, the nonparametric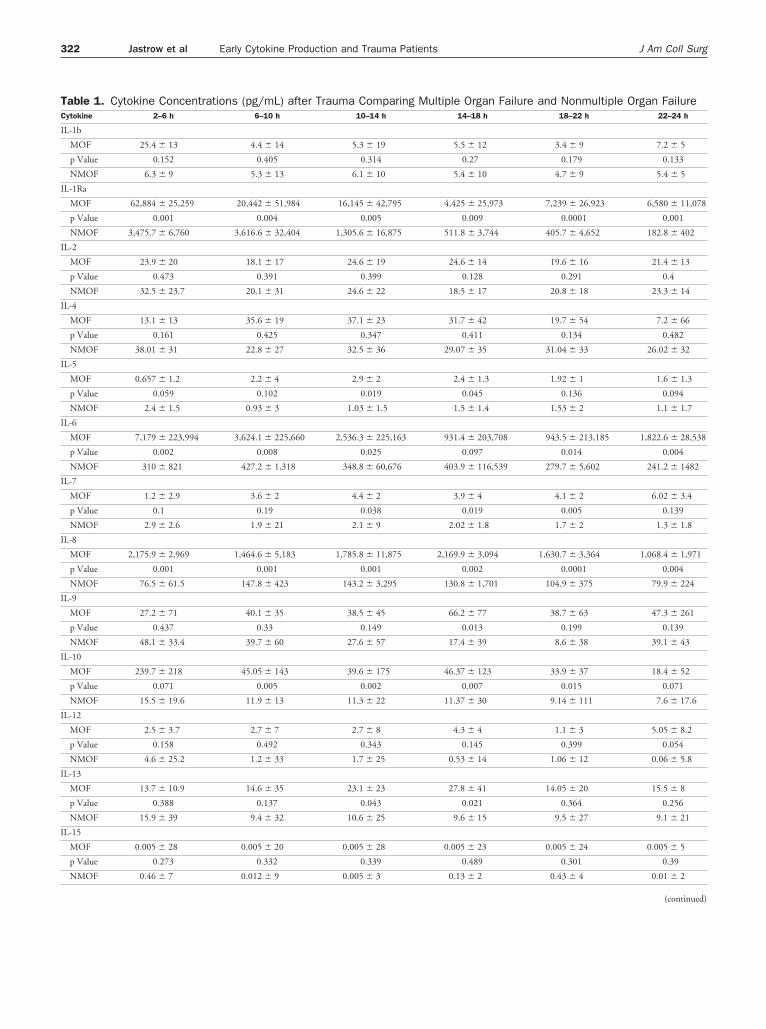
TC
I
I
I
I
I
I
I
I
I
I
I
I
I
322 Jastrow et al Early Cytokine Production and Trauma Patients J Am Coll Surg
able 1. Cytokine Concentrations (pg/mL) after Trauma Comparing Multiple Organ Failure and Nonmultiple Organ Failureytokine 2–6 h 6–10 h 10–14 h 14–18 h 18–22 h 22–24 h
L-1b
MOF 25.4 � 13 4.4 � 14 5.3 � 19 5.5 � 12 3.4 � 9 7.2 � 5
p Value 0.152 0.405 0.314 0.27 0.179 0.133
NMOF 6.3 � 9 5.3 � 13 6.1 � 10 5.4 � 10 4.7 � 9 5.4 � 5
L-1Ra
MOF 62,884 � 25,259 20,442 � 51,984 16,145 � 42,795 4,425 � 25,973 7,239 � 26,923 6,580 � 11,078
p Value 0.001 0.004 0.005 0.009 0.0001 0.001
NMOF 3,475.7 � 6,760 3,616.6 � 32,404 1,305.6 � 16,875 511.8 � 3,744 405.7 � 4,652 182.8 � 402
L-2
MOF 23.9 � 20 18.1 � 17 24.6 � 19 24.6 � 14 19.6 � 16 21.4 � 13
p Value 0.473 0.391 0.399 0.128 0.291 0.4
NMOF 32.5 � 23.7 20.1 � 31 24.6 � 22 18.5 � 17 20.8 � 18 23.3 � 14
L-4
MOF 13.1 � 13 35.6 � 19 37.1 � 23 31.7 � 42 19.7 � 54 7.2 � 66
p Value 0.161 0.425 0.347 0.411 0.134 0.482
NMOF 38.01 � 31 22.8 � 27 32.5 � 36 29.07 � 35 31.04 � 33 26.02 � 32
L-5
MOF 0.657 � 1.2 2.2 � 4 2.9 � 2 2.4 � 1.3 1.92 � 1 1.6 � 1.3
p Value 0.059 0.102 0.019 0.045 0.136 0.094
NMOF 2.4 � 1.5 0.93 � 3 1.03 � 1.5 1.5 � 1.4 1.53 � 2 1.1 � 1.7
L-6
MOF 7,179 � 223,994 3,624.1 � 225,660 2,536.3 � 225,163 931.4 � 203,708 943.5 � 213,185 1,822.6 � 28,538
p Value 0.002 0.008 0.025 0.097 0.014 0.004
NMOF 310 � 821 427.2 � 1,318 348.8 � 60,676 403.9 � 116,539 279.7 � 5,602 241.2 � 1482
L-7
MOF 1.2 � 2.9 3.6 � 2 4.4 � 2 3.9 � 4 4.1 � 2 6.02 � 3.4
p Value 0.1 0.19 0.038 0.019 0.005 0.139
NMOF 2.9 � 2.6 1.9 � 21 2.1 � 9 2.02 � 1.8 1.7 � 2 1.3 � 1.8
L-8
MOF 2,175.9 � 2,969 1,464.6 � 5,183 1,785.8 � 11,875 2,169.9 � 3,094 1,630.7 � 3,364 1,068.4 � 1,971
p Value 0.001 0.001 0.001 0.002 0.0001 0.004
NMOF 76.5 � 61.5 147.8 � 423 143.2 � 3,295 130.8 � 1,701 104.9 � 375 79.9 � 224
L-9
MOF 27.2 � 71 40.1 � 35 38.5 � 45 66.2 � 77 38.7 � 63 47.3 � 261
p Value 0.437 0.33 0.149 0.013 0.199 0.139
NMOF 48.1 � 33.4 39.7 � 60 27.6 � 57 17.4 � 39 8.6 � 38 39.1 � 43
L-10
MOF 239.7 � 218 45.05 � 143 39.6 � 175 46.37 � 123 33.9 � 37 18.4 � 52
p Value 0.071 0.005 0.002 0.007 0.015 0.071
NMOF 15.5 � 19.6 11.9 � 13 11.3 � 22 11.37 � 30 9.14 � 111 7.6 � 17.6
L-12
MOF 2.5 � 3.7 2.7 � 7 2.7 � 8 4.3 � 4 1.1 � 3 5.05 � 8.2
p Value 0.158 0.492 0.343 0.145 0.399 0.054
NMOF 4.6 � 25.2 1.2 � 33 1.7 � 25 0.53 � 14 1.06 � 12 0.06 � 5.8
L-13
MOF 13.7 � 10.9 14.6 � 35 23.1 � 23 27.8 � 41 14.05 � 20 15.5 � 8
p Value 0.388 0.137 0.043 0.021 0.364 0.256
NMOF 15.9 � 39 9.4 � 32 10.6 � 25 9.6 � 15 9.5 � 27 9.1 � 21
L-15
MOF 0.005 � 28 0.005 � 20 0.005 � 28 0.005 � 23 0.005 � 24 0.005 � 5
p Value 0.273 0.332 0.339 0.489 0.301 0.39
NMOF 0.46 � 7 0.012 � 9 0.005 � 3 0.13 � 2 0.43 � 4 0.01 � 2
(continued)
TC
I
E
F
G
G
I
I
M
M
M
P
R
T
323Vol. 209, No. 3, September 2009 Jastrow et al Early Cytokine Production and Trauma Patients
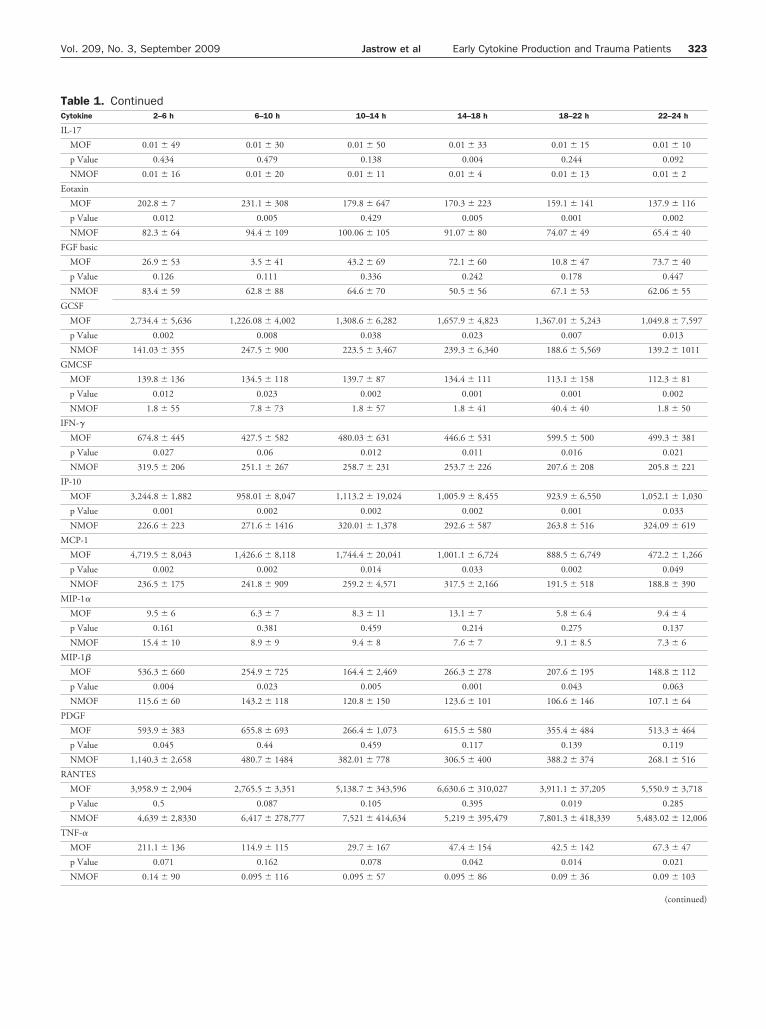
able 1. Continuedytokine 2–6 h 6–10 h 10–14 h 14–18 h 18–22 h 22–24 h
L-17
MOF 0.01 � 49 0.01 � 30 0.01 � 50 0.01 � 33 0.01 � 15 0.01 � 10
p Value 0.434 0.479 0.138 0.004 0.244 0.092
NMOF 0.01 � 16 0.01 � 20 0.01 � 11 0.01 � 4 0.01 � 13 0.01 � 2
otaxin
MOF 202.8 � 7 231.1 � 308 179.8 � 647 170.3 � 223 159.1 � 141 137.9 � 116
p Value 0.012 0.005 0.429 0.005 0.001 0.002
NMOF 82.3 � 64 94.4 � 109 100.06 � 105 91.07 � 80 74.07 � 49 65.4 � 40
GF basic
MOF 26.9 � 53 3.5 � 41 43.2 � 69 72.1 � 60 10.8 � 47 73.7 � 40
p Value 0.126 0.111 0.336 0.242 0.178 0.447
NMOF 83.4 � 59 62.8 � 88 64.6 � 70 50.5 � 56 67.1 � 53 62.06 � 55
CSF
MOF 2,734.4 � 5,636 1,226.08 � 4,002 1,308.6 � 6,282 1,657.9 � 4,823 1,367.01 � 5,243 1,049.8 � 7,597
p Value 0.002 0.008 0.038 0.023 0.007 0.013
NMOF 141.03 � 355 247.5 � 900 223.5 � 3,467 239.3 � 6,340 188.6 � 5,569 139.2 � 1011
MCSF
MOF 139.8 � 136 134.5 � 118 139.7 � 87 134.4 � 111 113.1 � 158 112.3 � 81
p Value 0.012 0.023 0.002 0.001 0.001 0.002
NMOF 1.8 � 55 7.8 � 73 1.8 � 57 1.8 � 41 40.4 � 40 1.8 � 50
FN-�
MOF 674.8 � 445 427.5 � 582 480.03 � 631 446.6 � 531 599.5 � 500 499.3 � 381
p Value 0.027 0.06 0.012 0.011 0.016 0.021
NMOF 319.5 � 206 251.1 � 267 258.7 � 231 253.7 � 226 207.6 � 208 205.8 � 221
P-10
MOF 3,244.8 � 1,882 958.01 � 8,047 1,113.2 � 19,024 1,005.9 � 8,455 923.9 � 6,550 1,052.1 � 1,030
p Value 0.001 0.002 0.002 0.002 0.001 0.033
NMOF 226.6 � 223 271.6 � 1416 320.01 � 1,378 292.6 � 587 263.8 � 516 324.09 � 619
CP-1
MOF 4,719.5 � 8,043 1,426.6 � 8,118 1,744.4 � 20,041 1,001.1 � 6,724 888.5 � 6,749 472.2 � 1,266
p Value 0.002 0.002 0.014 0.033 0.002 0.049
NMOF 236.5 � 175 241.8 � 909 259.2 � 4,571 317.5 � 2,166 191.5 � 518 188.8 � 390
IP-1�
MOF 9.5 � 6 6.3 � 7 8.3 � 11 13.1 � 7 5.8 � 6.4 9.4 � 4
p Value 0.161 0.381 0.459 0.214 0.275 0.137
NMOF 15.4 � 10 8.9 � 9 9.4 � 8 7.6 � 7 9.1 � 8.5 7.3 � 6
IP-1�
MOF 536.3 � 660 254.9 � 725 164.4 � 2,469 266.3 � 278 207.6 � 195 148.8 � 112
p Value 0.004 0.023 0.005 0.001 0.043 0.063
NMOF 115.6 � 60 143.2 � 118 120.8 � 150 123.6 � 101 106.6 � 146 107.1 � 64
DGF
MOF 593.9 � 383 655.8 � 693 266.4 � 1,073 615.5 � 580 355.4 � 484 513.3 � 464
p Value 0.045 0.44 0.459 0.117 0.139 0.119
NMOF 1,140.3 � 2,658 480.7 � 1484 382.01 � 778 306.5 � 400 388.2 � 374 268.1 � 516
ANTES
MOF 3,958.9 � 2,904 2,765.5 � 3,351 5,138.7 � 343,596 6,630.6 � 310,027 3,911.1 � 37,205 5,550.9 � 3,718
p Value 0.5 0.087 0.105 0.395 0.019 0.285
NMOF 4,639 � 2,8330 6,417 � 278,777 7,521 � 414,634 5,219 � 395,479 7,801.3 � 418,339 5,483.02 � 12,006
NF-�
MOF 211.1 � 136 114.9 � 115 29.7 � 167 47.4 � 154 42.5 � 142 67.3 � 47
p Value 0.071 0.162 0.078 0.042 0.014 0.021
NMOF 0.14 � 90 0.095 � 116 0.095 � 57 0.095 � 86 0.09 � 36 0.09 � 103
(continued)

otaMtrsec
CTc6tniiRtA
Ba
RPAai1nnenTnIito((
TC
V
FIid and sf
TV
AIGMAAAIMFPCP
D*†
Bc
324 Jastrow et al Early Cytokine Production and Trauma Patients J Am Coll Surg
ne-sided Wilcoxon rank-sum test15,25 was used to identifyhe significance set of measured cytokines that differenti-ted outcomes of MOF or non-MOF in each time period.edian values were calculated for each cytokine in each
ime period for outcomes of respiratory failure and nonrespi-atory failure. Median values were used as the statistical mea-ure because of the small sample size and to minimize theffect of a few extreme outlier values. A p value of � 0.05 wasonsidered significant.
alculating posttest predictive value for MOFo establish posttest predictive values for the MOF cohort,ytokines were grouped in postinjury time periods, ie, 2 tohours, 6 to 10 hours, 10 to 14 hours, 14 to 18 hours, 18
o 22 hours, and 22 to 24 hours by outcome q (MOF oron-MOF). A significance set, S(t), the statistically signif-
cant cytokines differentiating outcome q, was selected us-ng a 1-sided Wilcoxon rank-sum test, with p � 0.05.eceiver operating characteristic curves for each of the cy-
okines identified a significant difference in MOF patients.pplying a prevalence of MOF at our institution of 18%,
able 1. Continuedytokine 2–6 h 6–10 h 10–1
EGF
MOF 16.04 � 16 23.05 � 25 44.3 �
p Value 0.443 0.271 0.47
NMOF 15.3 � 42 20.5 � 63 37.6 �
GF, fibroblast growth factor; GCSF, granulocyte colony-stimulating factor; GL, interleukin; IL-1Ra, interleukin-1 receptor antagonist; IP-10, induciblnflammatory protein-�; MIP-1�, macrophage inflammatory protein-1�; Merived growth factor; RANTES, regulated on activation, normal T expressedactor.
able 2. Demographic Description of Trauma Patients Meeariable All (n � 48)
ge (y) 39 � 3SS 25 � 1.6ender (% male) 67echanism (% blunt) 85
dmit Hb (g/dL) 12.0 � 0.4dmit BD (mEq/L) 7.7 � 0.8dmit INR 1.4 � 0.1
CU-free days (30-ICU LOS)* 9.3 � 1.2ortality (%) 17
FP 24 hours (U) 16 � 3RBC 24 hours (U) 17 � 2rystalloid fluid 24 hours (L) 13 � 1LT 24 hours (U) 6 � 2
ata are presented as mean � SE unless otherwise indicated.Days of no intensive care during 30 days after hospital admission.Significant difference between MOF and non-MOF subgroups (p � 0.05).D, base deficit; FFP, fresh frozen plasma; Hb, hemoglobin concentration;
ount; PRBC, packed red blood cells.ayesian posttest positive predictive value (PPV), and neg-tive predictive value (NPV) were also computed.
ESULTSatient demographicss shown in Table 2, 48 patients were studied, with a meange of 39 � 3 years, 67% men, 88% blunt mechanism ofnjury, mean ISS 25 � 2, and an overall mortality of6.6%. MOF developed in 11 patients (23%), with a sig-ificant difference in mortality between MOF (64%) andon-MOF patients (3%). MOF patients also had consid-rably fewer ICU-free days during a 30-day period thanon-MOF patients (3.5 � 2 days versus 17.8 � 1.3 days).here were no significant differences between MOF andon-MOF patients for age, gender, mechanism of injury,SS, admission Hb, admission INR, or admission base def-cit. Additionally, there were no significant differences be-ween MOF and non-MOF patients with respect to receiptf crystalloid (p � 0.75), platelet volume administrationp � 0.35), fresh frozen plasma (p � 0.06), or packed RBCp � 0.17).
14–18 h 18–22 h 22–24 h
44.3 � 130 50.07 � 27.6 48.7 � 30
0.151 0.167 0.053
27.9 � 43 27.3 � 40 13.2 � 31
SF, granulocyte-macrophage colony-stimulating factor; IFN-�, interferon-�;tein 10; MCP-1, monocyte chemotactic protein-1; MIP-1�, macrophagemultiple organ failure; NMOF, nonmultiple organ failure; PDGF, platelet-ecreted; TNF-�, tumor necrosis factor-�; VEGF, vascular endothelial growth
riteria for Shock Resuscitation(n � 11) Non-MOF (n � 37) p Value
5 � 7 38 � 3 0.216 � 3 25 � 2 0.6764 68 0.8182 89 0.51
4 � 0.9 12.1 � 0.5 0.220 � 2 7.1 � 0.8 0.196 � 0.2 1.4 � 0.06 0.175 � 2.0† 17.8 � 1.3† 0.00364† 3† 6.88�E�08
8 � 6 13 � 4 0.063 � 5 15 � 3 0.175 � 3 13 � 2 0.759 � 3 6 � 2 0.35
international normalized ratio; MOF, multiple organ failure; PLT, platelet
4 h
281
1
63
MCe proOF,
ting CMOF
42
11.9.1.3.
221
INR,

STfesiT
(sft(wiaticcgd
SBea4ttcosabottpa1tsIpfw0fTwa
MhtpepCasIAwv
itp6oochcth4th
itMPtaasdfd
DMtsrc1M
325Vol. 209, No. 3, September 2009 Jastrow et al Early Cytokine Production and Trauma Patients
erum cytokine production after traumahe numerical values of serum cytokine analysis over time
ollowing trauma are shown in Table 1. Significant differ-nces between MOF and non-MOF were detected forome of the cytokines at various time points. P values forndividual cytokines at varying time points are listed inable 3.Median concentrations of interleukin 1 receptor antagonist
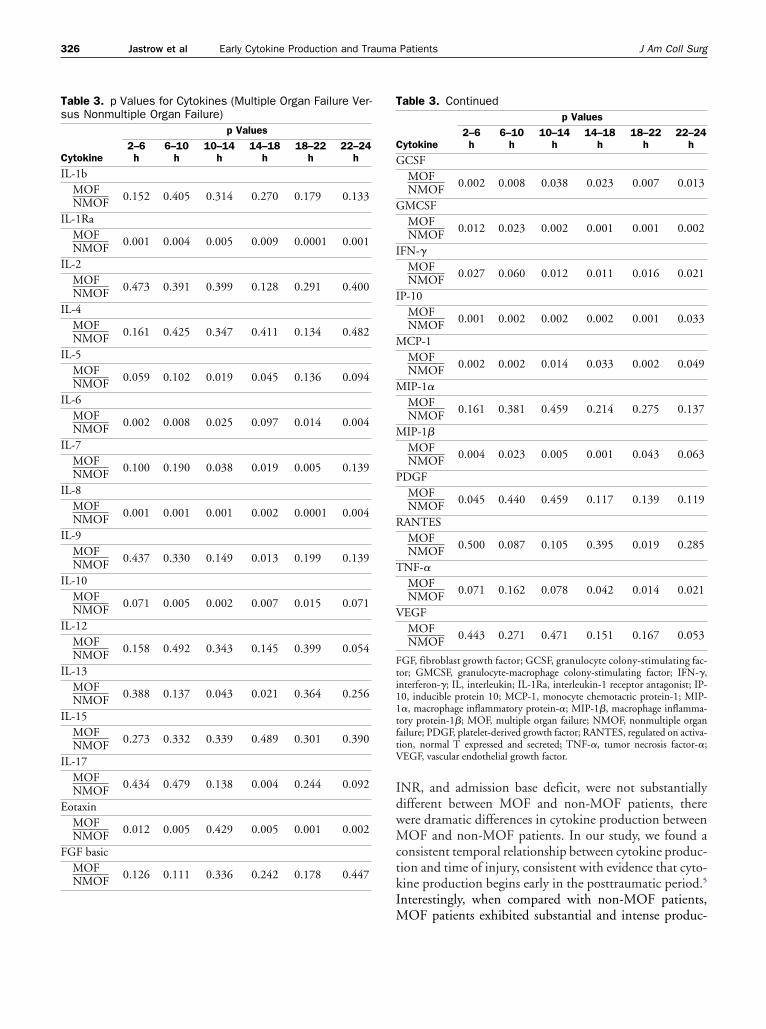
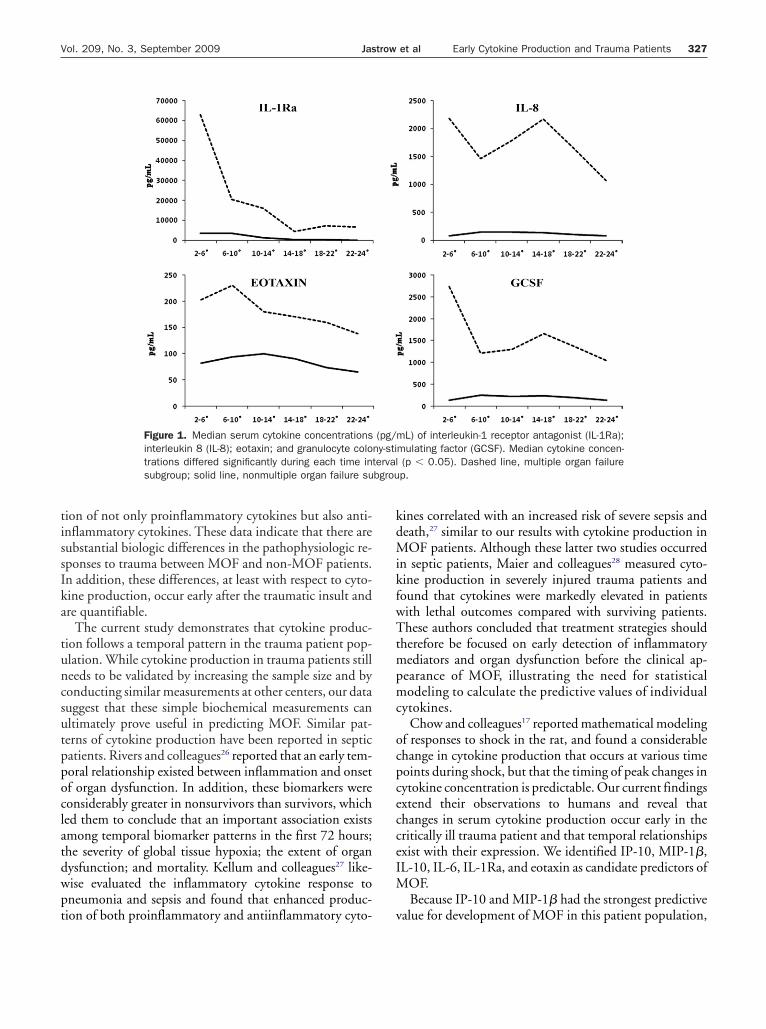
IL-1Ra), interleukin (IL)-8, eotaxin, granulocyte colony-timulating factor, granulocyte-macrophage colony-stimulatingactor, inducible protein 10 (IP-10), monocyte chemotac-ic protein-1, and macrophage inflammatory protein-1�MIP-1�) were significantly greater in the MOF comparedith the non-MOF subgroup at each time interval exam-
ned (Figs. 1, 2). As shown, MOF patients had consider-bly more cytokine production for each cytokine at eachime point when compared with non-MOF patients. Sim-lar time course graphs were constructed for the otherytokines (not shown). Again, although many of the otherytokines demonstrated dramatic differences between theroups at some time points, they were not consistentlyifferent throughout and, therefore, are not shown.
tatistical analysis of early cytokine productionecause we were primarily interested in predicting MOF atarlier time points, we performed additional statisticalnalysis on the subset of patients who had cytokine analysisto 8 hours postinjury. In this subset analysis, 28 (58%) of
he study population had early cytokine data. We foundhat much of the delay for the remaining 20 patients oc-urred as result of prolonged transit time to the hospital,perative delay, or delay in the interventional radiologyuite. As shown in Table 4, 28 patients had early cytokinenalysis, with a mean age of 39 � 3 years, 63% men, 81%lunt mechanism of injury, mean ISS of 25 � 3, and anverall mortality of 25%. MOF developed in 7 (25%) pa-ients. There was a substantial difference in mortality be-ween MOF (86%) and non-MOF patients (4.7%). MOFatients also had considerably fewer ICU-free days during30-day period than non-MOF patients (3 � 2 days versus1 � 2 days). There were no significant differences be-ween MOF and non-MOF patients with regard to admis-ion hemoglobin, admission base deficit, or admissionNR. But the transfusion volumes for MOF when com-ared with non-MOF were significantly higher in freshrozen plasma (33 � 4 versus 9 � 2 U; p � 0.0006) but notith respect to packed RBC (26 � 3 versus 14 � 2 U; p �.06). Of note, 2 of 7 MOF patients received 56 and 68 Uresh frozen plasma as part of their resuscitation efforts.here were no substantial differences in 24-hour volumesith respect to crystalloid and platelet use between MOF
nd non-MOF. i
Six candidate predictors of MOF were identified: IP-10,IP-1�, IL-10, IL-6, IL-1Ra, and eotaxin. MOF patients
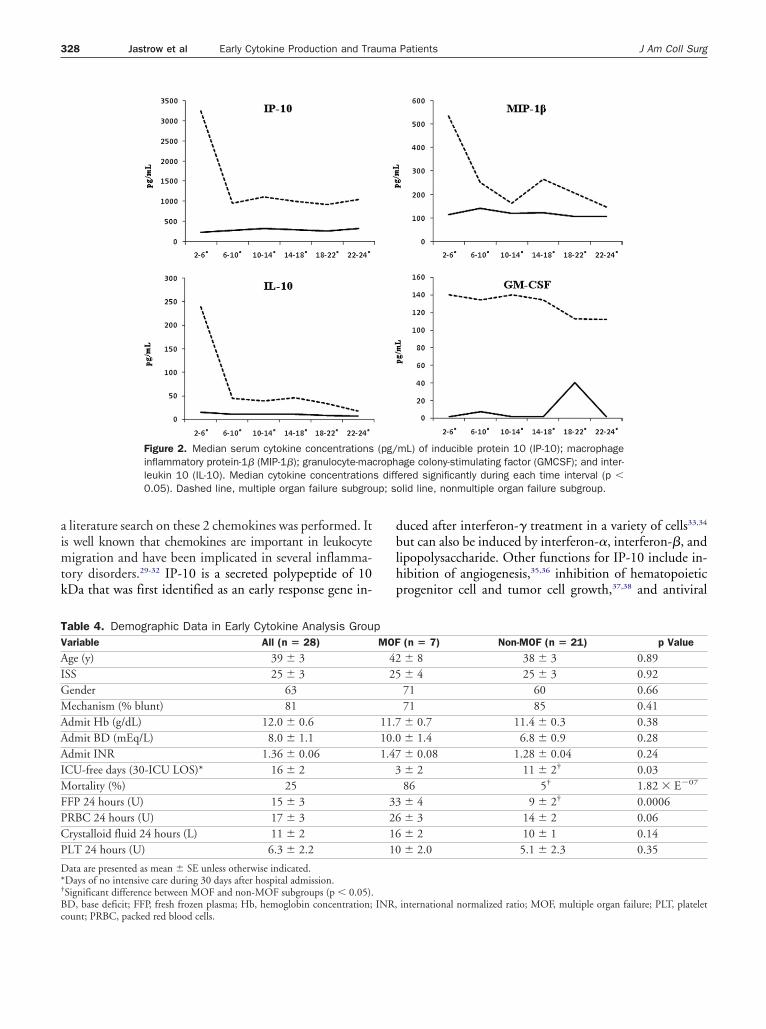
ad substantially greater cytokine concentration during 4o 8 hours postinjury for each of the cytokines shown com-ared with non-MOF patients (Figs. 1, 2). IP-10 had great-st area under receiver operating characteristic curve andositive predictive values (PPV) of these 6 cytokines (Table 5).ut-off values were selected to maximize both sensitivity
nd specificity. Bayesian analysis with cut-off values corre-ponding to sensitivity of 71% found PPV of 100% forP-10, 77% for IL-10 and MIP-1�, and 62% for eotaxin.t cut-off values corresponding to sensitivity 57%, PPVas 100% for IL-6 and 72% for IL-1Ra. At all the cut-offalues, NPVs were � 90%.
Nine MOF patients and 33 non-MOF patients werencluded in the statistical analysis in hours 10 to 14 fromime of trauma. All PPVs decreased from the earlier timeeriod. At the cut-off value corresponding to sensitivity7%, PPV was 62% for IP-10. Bayesian analysis with cut-ff values corresponding to sensitivity of 56% found PPVf 67% for IL-1Ra and 57% for IL-6 and IL-10. At theut-off values corresponding to sensitivity 89%, MIP-1�ad PPV of 33%, and eotaxin had PPV of 29%. At all theut-off values, NPVs were � 90%. Of interest is the facthat the actual cut-off values for IL-1Ra and IL-6 duringours 10 to 14 were 40% and 60% of their values at timeto 8 hours, whereas IL-10 and IP-10 cut-offs during 10
o 14 hours were within 2% of their cut-off values atours 4 to 8.Eight MOF patients and 34 non-MOF patients were
ncluded in the statistical analysis in hours 22 to 26 fromime of trauma: there were 8 MOF patients and 34 non-
OF patients included. No cut-off values with usefulPVs and NPVs were found at hours 22 to 26 from time ofrauma. Comparing the values of area under receiver oper-ting characteristic curve at 4 to 8 hours, 10 to 14 hours,nd 22 to 26 hours, it appears that the cytokines in thetudy, especially IP-10, have greater value as candidate pre-ictors of MOF during the earlier time period. The PPVsor the 6 candidate predictors of MOF showed substantialecrease over time (Fig. 3).
ISCUSSIONOF remains the leading cause of death in the ICU after
rauma. In the current study, 48 patients were enrolled in atandardized 24-hour resuscitation protocol during a pe-iod of 12 months at a Level I trauma center. In this select,ritically injured patient population, MOF developed in1 (23%) of the enrolled patients, and 7 (64%) of theseOF patients died. While traditional predictors of MOF,
ncluding age, ISS, admission hemoglobin, admission
IdwMctkIM
Ts
C
I
I
I
I
I
I
I
I
I
I
I
I
I
I
E
F
NMOF
T
C
G
G
I
I
M
M
M
P
R
T
V
Fti11tftV
326 Jastrow et al Early Cytokine Production and Trauma Patients J Am Coll Surg
NR, and admission base deficit, were not substantiallyifferent between MOF and non-MOF patients, thereere dramatic differences in cytokine production betweenOF and non-MOF patients. In our study, we found a
onsistent temporal relationship between cytokine produc-ion and time of injury, consistent with evidence that cyto-ine production begins early in the posttraumatic period.5
nterestingly, when compared with non-MOF patients,
able 3. Continued
ytokine
p Values2–6h
6–10h
10–14h
14–18h
18–22h
22–24h
CSFMOFNMOF 0.002 0.008 0.038 0.023 0.007 0.013
MCSFMOFNMOF 0.012 0.023 0.002 0.001 0.001 0.002
FN-�MOFNMOF 0.027 0.060 0.012 0.011 0.016 0.021
P-10MOFNMOF 0.001 0.002 0.002 0.002 0.001 0.033
CP-1MOFNMOF 0.002 0.002 0.014 0.033 0.002 0.049
IP-1�
MOFNMOF 0.161 0.381 0.459 0.214 0.275 0.137
IP-1�
MOFNMOF 0.004 0.023 0.005 0.001 0.043 0.063
DGFMOFNMOF 0.045 0.440 0.459 0.117 0.139 0.119
ANTESMOFNMOF 0.500 0.087 0.105 0.395 0.019 0.285
NF-�MOFNMOF 0.071 0.162 0.078 0.042 0.014 0.021
EGFMOFNMOF 0.443 0.271 0.471 0.151 0.167 0.053
GF, fibroblast growth factor; GCSF, granulocyte colony-stimulating fac-or; GMCSF, granulocyte-macrophage colony-stimulating factor; IFN-�,nterferon-�; IL, interleukin; IL-1Ra, interleukin-1 receptor antagonist; IP-0, inducible protein 10; MCP-1, monocyte chemotactic protein-1; MIP-�, macrophage inflammatory protein-�; MIP-1�, macrophage inflamma-ory protein-1�; MOF, multiple organ failure; NMOF, nonmultiple organailure; PDGF, platelet-derived growth factor; RANTES, regulated on activa-ion, normal T expressed and secreted; TNF-�, tumor necrosis factor-�;EGF, vascular endothelial growth factor.
able 3. p Values for Cytokines (Multiple Organ Failure Ver-us Nonmultiple Organ Failure)
ytokine
p Values2–6h
6–10h
10–14h
14–18h
18–22h
22–24h
L-1bMOFNMOF 0.152 0.405 0.314 0.270 0.179 0.133
L-1RaMOFNMOF 0.001 0.004 0.005 0.009 0.0001 0.001
L-2MOFNMOF 0.473 0.391 0.399 0.128 0.291 0.400
L-4MOFNMOF 0.161 0.425 0.347 0.411 0.134 0.482
L-5MOFNMOF 0.059 0.102 0.019 0.045 0.136 0.094
L-6MOFNMOF 0.002 0.008 0.025 0.097 0.014 0.004
L-7MOFNMOF 0.100 0.190 0.038 0.019 0.005 0.139
L-8MOFNMOF 0.001 0.001 0.001 0.002 0.0001 0.004
L-9MOFNMOF 0.437 0.330 0.149 0.013 0.199 0.139
L-10MOFNMOF 0.071 0.005 0.002 0.007 0.015 0.071
L-12MOFNMOF 0.158 0.492 0.343 0.145 0.399 0.054
L-13MOFNMOF 0.388 0.137 0.043 0.021 0.364 0.256
L-15MOFNMOF 0.273 0.332 0.339 0.489 0.301 0.390
L-17MOFNMOF 0.434 0.479 0.138 0.004 0.244 0.092
otaxinMOFNMOF 0.012 0.005 0.429 0.005 0.001 0.002
GF basicMOF 0.126 0.111 0.336 0.242 0.178 0.447
OF patients exhibited substantial and intense produc-
tissIka
tuncsutppoclatdwpt
kdMikfwTtmpmc
ocpcecceIM
bgrou
327Vol. 209, No. 3, September 2009 Jastrow et al Early Cytokine Production and Trauma Patients
ion of not only proinflammatory cytokines but also anti-nflammatory cytokines. These data indicate that there areubstantial biologic differences in the pathophysiologic re-ponses to trauma between MOF and non-MOF patients.n addition, these differences, at least with respect to cyto-ine production, occur early after the traumatic insult andre quantifiable.
The current study demonstrates that cytokine produc-ion follows a temporal pattern in the trauma patient pop-lation. While cytokine production in trauma patients stilleeds to be validated by increasing the sample size and byonducting similar measurements at other centers, our datauggest that these simple biochemical measurements canltimately prove useful in predicting MOF. Similar pat-erns of cytokine production have been reported in septicatients. Rivers and colleagues26 reported that an early tem-oral relationship existed between inflammation and onsetf organ dysfunction. In addition, these biomarkers wereonsiderably greater in nonsurvivors than survivors, whiched them to conclude that an important association existsmong temporal biomarker patterns in the first 72 hours;he severity of global tissue hypoxia; the extent of organysfunction; and mortality. Kellum and colleagues27 like-ise evaluated the inflammatory cytokine response toneumonia and sepsis and found that enhanced produc-
Figure 1. Median serum cytokine concentrationsinterleukin 8 (IL-8); eotaxin; and granulocyte colotrations differed significantly during each time insubgroup; solid line, nonmultiple organ failure su
ion of both proinflammatory and antiinflammatory cyto- v
ines correlated with an increased risk of severe sepsis andeath,27 similar to our results with cytokine production inOF patients. Although these latter two studies occurred
n septic patients, Maier and colleagues28 measured cyto-ine production in severely injured trauma patients andound that cytokines were markedly elevated in patientsith lethal outcomes compared with surviving patients.hese authors concluded that treatment strategies should
herefore be focused on early detection of inflammatoryediators and organ dysfunction before the clinical ap-
earance of MOF, illustrating the need for statisticalodeling to calculate the predictive values of individual
ytokines.Chow and colleagues17 reported mathematical modeling
f responses to shock in the rat, and found a considerablehange in cytokine production that occurs at various timeoints during shock, but that the timing of peak changes inytokine concentration is predictable. Our current findingsxtend their observations to humans and reveal thathanges in serum cytokine production occur early in theritically ill trauma patient and that temporal relationshipsxist with their expression. We identified IP-10, MIP-1�,L-10, IL-6, IL-1Ra, and eotaxin as candidate predictors of
OF.Because IP-10 and MIP-1� had the strongest predictive
mL) of interleukin-1 receptor antagonist (IL-1Ra);mulating factor (GCSF). Median cytokine concen-(p � 0.05). Dashed line, multiple organ failurep.
(pg/ny-stiterval
alue for development of MOF in this patient population,
aimtk
dblhp
up; s
TV
AIGMAAAIMFPCP
D*†
Bc
328 Jastrow et al Early Cytokine Production and Trauma Patients J Am Coll Surg
literature search on these 2 chemokines was performed. Its well known that chemokines are important in leukocyte
igration and have been implicated in several inflamma-ory disorders.29-32 IP-10 is a secreted polypeptide of 10Da that was first identified as an early response gene in-
Figure 2. Median serum cytokine concentrationsinflammatory protein-1� (MIP-1�); granulocyte-maleukin 10 (IL-10). Median cytokine concentration0.05). Dashed line, multiple organ failure subgro
able 4. Demographic Data in Early Cytokine Analysis Grouariable All (n � 28)
ge (y) 39 � 3SS 25 � 3ender 63echanism (% blunt) 81
dmit Hb (g/dL) 12.0 � 0.6dmit BD (mEq/L) 8.0 � 1.1dmit INR 1.36 � 0.06
CU-free days (30-ICU LOS)* 16 � 2ortality (%) 25
FP 24 hours (U) 15 � 3RBC 24 hours (U) 17 � 3rystalloid fluid 24 hours (L) 11 � 2LT 24 hours (U) 6.3 � 2.2
ata are presented as mean � SE unless otherwise indicated.Days of no intensive care during 30 days after hospital admission.Significant difference between MOF and non-MOF subgroups (p � 0.05).D, base deficit; FFP, fresh frozen plasma; Hb, hemoglobin concentration;
ount; PRBC, packed red blood cells.uced after interferon-� treatment in a variety of cells33,34
ut can also be induced by interferon-�, interferon-�, andipopolysaccharide. Other functions for IP-10 include in-ibition of angiogenesis,35,36 inhibition of hematopoieticrogenitor cell and tumor cell growth,37,38 and antiviral
mL) of inducible protein 10 (IP-10); macrophageage colony-stimulating factor (GMCSF); and inter-ered significantly during each time interval (p �olid line, nonmultiple organ failure subgroup.
(n � 7) Non-MOF (n � 21) p Value
� 8 38 � 3 0.89� 4 25 � 3 0.9271 60 0.6671 85 0.41� 0.7 11.4 � 0.3 0.38� 1.4 6.8 � 0.9 0.28� 0.08 1.28 � 0.04 0.24� 2 11 � 2† 0.0386 5† 1.82 � E�07
� 4 9 � 2† 0.0006� 3 14 � 2 0.06� 2 10 � 1 0.14� 2.0 5.1 � 2.3 0.35
international normalized ratio; MOF, multiple organ failure; PLT, platelet
(pg/crophs diff
pMOF
4225
11.710.01.47
3
33261610
INR,

aTieg
ovapmMoagmMlppbiessomt
ri
nBttcatns
isMipaedpti
A
S
AA
D
Fiifloo
TaH
C
IMIIIE
Awssis*rdiIp
329Vol. 209, No. 3, September 2009 Jastrow et al Early Cytokine Production and Trauma Patients
ctions.39 In contrast, MIP-1� modulates macrophage and-cell responses,40 has lymphocyte chemotactic properties,
s a potent pyrogen,41 and has been shown to suppressrythropoiesis.42 The role of these cytokines in the patho-enesis of MOF is unknown.
Limitations of this pilot study include the fact that itnly studies a small sample size, illustrating the need for itsalidation. In addition, cytokines had considerable vari-bility, which could allow for a type II error with only 11atients. In addition, although both pro- and antiinflam-atory cytokine production is dramatically enhanced inOF patients when compared with non-MOF patients,
ur data do not differentiate as to whether these cytokinesre truly pathologic responses that culminate in the patho-enesis of MOF or whether their production is merely aarker of a critically ill patient at risk for development ofOF. Nevertheless, our study does provide pathophysio-
ogic insight into MOF development in critically injuredatients and sets the stage for additional studies. For exam-le, these bedside observations need to be taken back to theench in order to study the pathologic responses to thedentified cytokines and whether their modulation in mod-ls of shock improves outcomes. In a similar way, futuretudies at bedside can examine whether various therapeutictrategies can attenuate cytokine production and improveutcomes or, at the very least, whether these cytokinearkers can be used to predict development of MOF in
rauma patients.Implicit in employing such a strategy is the availability of
apid turnaround cytokine analysis. The technology used
able 5. Area under Receiver Operating Characteristic Curvend Posttest Predictive Values for Candidate Cytokines,ours 4 to 8
ytokineArea underROC curve
Cut-off:positive if >
Sensitivity(%) PPV (%)*
P-10 0.939 889.9 71 100IP-1� 0.871 248.6 71 77
L-10 0.776 38.6 71 77L-6 0.816 4110.2 57 100L-1Ra 0.816 39674.8 57 72otaxin 0.810 193.8 71 62
rea under receiver operating characteristic (ROC) curve for six cytokines,ith most optimal area under ROC curve, with corresponding cut-off values,
ensitivity, and positive predictive value (PPV). ROC curve is a graph of theensitivity versus (1 � specificity) for a binary classifier system, as its discrim-nation threshold is varied. Larger values of the test result variable(s) indicatetronger evidence for a positive actual state.Proportion of patients with positive test results who are correctly diagnosed:eflects probability for the underlying condition of interest, and its valueepends on the prevalence of the disease (18% of multiple organ failure at our
nstitution).L, interleukin; IL-1Ra, interleukin-1 receptor antagonist; IP-10, induciblerotein 10; MIP-1�, macrophage inflammatory protein-�.
n this study was done using a multiplex suspension immu-
oassay according to manufacturer’s instructions (Bioplex;io-Rad). This analysis involves standard sample prepara-
ion, which is currently automated in most clinical labora-ories. Automated cytokine detection and quantitation ofoncentration is provided 3 to 4 hours after blood draw. Inddition, the cost of commercially available analyzers is lesshan that used for other standard analyses. There is tech-ology currently available to make these analyses a part oftandard clinical practice.
In this prospective observational study of 48 criticallynjured trauma patients receiving 24-hour standardized re-uscitation, MOF developed in 11 (23%). Development of
OF carried a mortality rate of 64%. Dramatic differencesn cytokine concentrations between MOF and non-MOFatients were detectable 4 to 8 hours after injury. Statisticalnalysis identified six candidate cytokines, which mightnable earlier identification of patients at greater risk forevelopment of MOF. In addition, use of such biomarkerredictors can elicit development of novel or alternativereatment strategies to decrease the incidence of MOF andmprove outcomes in trauma patients.
uthor Contributions
tudy conception and design: Suliburk, McKinley, Moore,Mercer
cquisition of data: Jastrow, McGuire, Motschallnalysis and interpretation of data: Jastrow, McGuire, Iyen-
gar, Mercerrafting of manuscript: Jastrow, Gonzalez, Kozar, McKinley,
igure 3. Bayesian posttest predictive values for the 6 cytokines:nterleukin-1 receptor antagonist (IL-1Ra); interleukin-6 (IL-6);nterleukin-10 (IL-10); inducible protein 10 (IP-10); macrophage in-ammatory protein-1� (MIP-1�); and eotaxin. Candidate predictorsf multiple organ failure shown over varying time points after injuryccurred.
Moore, Mercer
C
R
1
1
1
1
1
1
1
1
1
1
2
2
2
2
2
2
2
2
2
2
3
3
3
3
3
3
3
3
3
330 Jastrow et al Early Cytokine Production and Trauma Patients J Am Coll Surg
ritical revision: Jastrow, Gonzalez, McGuire, Suliburk, Iyen-gar, McKinley, Moore, Mercer
EFERENCES
1. Baue AE, Durham R, Faist E. Systemic inflammatory re-sponse syndrome (SIRS), multiple organ dysfunction syn-drome (MODS), multiple organ failure (MOF): are we win-ning the battle? Shock 1998;10:79–89.
2. Ulvik A, Kvale R, Wentzel-Larsen T, Flaatten H. Multiple organfailure after trauma affects even long-term survival and func-tional status. Crit Care 2007;11:R95.
3. Martin C, Boisson C, Haccoun M, et al. Patterns of cytokineevolution (tumor necrosis factor-alpha and interleukin-6) afterseptic shock, hemorrhagic shock, and severe trauma. Crit CareMed 1997;25:1813–1819.
4. Neidhardt R, Keel M, Steckholzer U, et al. Relationship ofinterleukin-10 plasma levels to severity of injury and clinicaloutcome in injured patients. J Trauma 1997;42:863–870; dis-cussion 870–871.
5. Roumen RM, Hendriks T, van der Ven-Jongekrijg J, et al. Cy-tokine patterns in patients after major vascular surgery, hemor-rhagic shock, and severe blunt trauma. Relation with subsequentadult respiratory distress syndrome and multiple organ failure.Ann Surg 1993;218:769–776.
6. Gonzalez EA, Moore FA, Holcomb JB, et al. Fresh frozen plasmashould be given earlier to patients requiring massive transfusion.J Trauma 2007;62:112–119.
7. Stewart RM. Injury prevention: why so important? J Trauma2007;62[Suppl]:S47–S48.
8. Oberholzer A, Oberholzer C, Moldawer LL. Cytokine signaling—regulation of the immune response in normal and critically illstates. Crit Care Med 2000;28[Suppl]:N3–N12.
9. Bozza FA, Salluh JI, Japiassu AM, et al. Cytokine profiles asmarkers of disease severity in sepsis: a multiplex analysis. CritCare 2007;11:R49.
0. Hynninen M, Pettila V, Takkunen O, et al. Predictive value ofmonocyte histocompatibility leukocyte antigen-DR expressionand plasma interleukin-4 and -10 levels in critically ill patientswith sepsis. Shock 2003;20:1–4.
1. Livaditi O, Kotanidou A, Psarra A, et al. Neutrophil CD64expression and serum IL-8: sensitive early markers of severityand outcome in sepsis. Cytokine 2006;36:283–290.
2. Oberholzer A, Souza SM, Tschoeke SK, et al. Plasma cytokinemeasurements augment prognostic scores as indicators of out-come in patients with severe sepsis. Shock 2005;23:488–493.
3. Wunder C, Eichelbronner O, Roewer N. Are IL-6, IL-10 andPCT plasma concentrations reliable for outcome prediction insevere sepsis? A comparison with APACHE III and SAPS II.Inflamm Res 2004;53:158–163.
4. Berney T, Gasche Y, Robert J, et al. Serum profiles ofinterleukin-6, interleukin-8, and interleukin-10 in patients withsevere and mild acute pancreatitis. Pancreas 1999;18:371–377.
5. Yamada Y, Endo S, Inada K. Plasma cytokine levels in patientswith severe burn injury—with reference to the relationship be-tween infection and prognosis. Burns 1996;22:587–593.
6. Geppert A, Steiner A, Zorn G, et al. Multiple organ failure inpatients with cardiogenic shock is associated with high plasmalevels of interleukin-6. Crit Care Med 2002;30:1987–1994.
7. Chow CC, Clermont G, Kumar R, et al. The acute inflamma-
tory response in diverse shock states. Shock 2005;24:74–84.8. Marr AB, Moore FA, Sailors RM, et al. Preload optimizationusing “starling curve” generation during shock resuscitation: canit be done? Shock 2004;21:300–305.
9. McKinley BA, Kozar RA, Cocanour CS, et al. Normal versussupranormal oxygen delivery goals in shock resuscitation: theresponse is the same. J Trauma 2002;53:825–832.
0. McKinley BA, Moore FA, Sailors RM, et al. Computerized de-cision support for mechanical ventilation of trauma inducedARDS: results of a randomized clinical trial. J Trauma 2001;50:415–424; discussion 425.
1. Ciesla DJ, Moore EE, Johnson JL, et al. A 12-year prospectivestudy of postinjury multiple organ failure: has anythingchanged? Arch Surg 2005;140:432–438; discussion 438–440.
2. Moore FA, Moore EE, Poggetti R, et al. Gut bacterial translo-cation via the portal vein: a clinical perspective with major torsotrauma. J Trauma 1991;31:629–636; discussion 636–638.
3. Sauaia A, Moore FA, Moore EE, Lezotte DC. Early risk factors forpostinjury multiple organ failure. World J Surg 1996;20:392–400.
4. Sauaia A, Moore EE, Johnson JL, et al. Validation of postinjurymultiple organ failure scores. Shock 2009;31:438–447.
5. Hollander MW, Douglas A. Nonparametric statistical inference.New York: John Wiley & Sons; 1973.
6. Rivers EP, Kruse JA, Jacobsen G, et al. The influence of earlyhemodynamic optimization on biomarker patterns of severesepsis and septic shock. Crit Care Med 2007;35:2016–2024.
7. Kellum JA, Kong L, Fink MP, et al. Understanding the inflam-matory cytokine response in pneumonia and sepsis: results ofthe Genetic and Inflammatory Markers of Sepsis (GenIMS)Study. Arch Intern Med 2007;167:1655–1663.
8. Maier B, Lefering R, Lehnert M, et al. Early versus late onset ofmultiple organ failure is associated with differing patterns ofplasma cytokine biomarker expression and outcome after severetrauma. Shock 2007;28:668–674.
9. Gabuzda D, Wang J. Chemokine receptors and mechanismsof cell death in HIV neuropathogenesis. J Neurovirol 2000;6[Suppl]:S24–S32.
0. Glabinski AR, Ransohoff RM. Chemokines and chemokine re-ceptors in CNS pathology. J Neurovirol 1999;5:3–12.
1. Mennicken F, Maki R, de Souza EB, Quirion R. Chemokines andchemokine receptors in the CNS: a possible role in neuroinflam-mation and patterning. Trends Pharmacol Sci 1999;20:73–78.
2. Asensio VC, Campbell IL. Chemokines in the CNS: plurifunc-tional mediators in diverse states. Trends Neurosci 1999;22:504–512.
3. Luster AD, Ravetch JV. Biochemical characterization of agamma interferon-inducible cytokine (IP-10). J Exp Med 1987;166:1084–1097.
4. Luster AD, Unkeless JC, Ravetch JV. Gamma-interferon tran-scriptionally regulates an early-response gene containing homol-ogy to platelet proteins. Nature 1985;315:672–676.
5. Angiolillo AL, Sgadari C, Taub DD, et al. Human interferon-inducible protein 10 is a potent inhibitor of angiogenesis in vivo.J Exp Med 1995;182:155–162.
6. Strieter RM, Kunkel SL, Arenberg DA, et al. Interferon gamma-inducible protein 10 (IP-10), a member of the C-X-C chemo-kine family, is an inhibitor of angiogenesis. Biochem BiophysRes Commun 1995;210:51–57.
7. Kanegane C, Sgadari C, Kanegane H, et al. Contribution of theCXC chemokines IP-10 and Mig to the antitumor effects ofIL-12. J Leukoc Biol 1998;64:384–392.
8. Sarris AH, Broxmeyer HE, Wirthmueller U, et al. Human
interferon-inducible protein 10: expression and purification of
3
4
4
4
331Vol. 209, No. 3, September 2009 Jastrow et al Early Cytokine Production and Trauma Patients
recombinant protein demonstrate inhibition of early humanhematopoietic progenitors. J Exp Med 1993;178:1127–1132.
9. Mahalingam S, Farber JM, Karupiah G. The interferon-inducible chemokines MuMig and Crg-2 exhibit antiviral activ-ity in vivo. J Virol 1999;73:1479–1491.
0. Oppenheim JJ, Zachariae CO, Mukaida N, Matsushima K.Properties of the novel proinflammatory supergene “intercrine”
cytokine family. Annu Rev Immunol 1991;9:617–648.1. Myers RD, Paez X, Roscoe AK, et al. Fever and feeding: differ-ential actions of macrophage inflammatory protein-1 (MIP-1),MIP-1 alpha and MIP-1 beta on rat hypothalamus. NeurochemRes 1993;18:667–673.
2. Broxmeyer HE, Sherry B, Cooper S, et al. Macrophage inflam-matory protein (MIP)-1 beta abrogates the capacity of MIP-1alpha to suppress myeloid progenitor cell growth. J Immunol
1991;147:2586–2594.JACS ONLINE CME-1 PROGRAMEARN 4 CME-1 CREDITS EACH MONTH
www.jacscme.facs.org
Copyright © 2022 FDOKUMEN