e-Serem – A Web-Based Manual For The Estimation of Emission Reductions From JI and CDM Projects
18
E-SEREM – A WEB-BASED MANUAL FOR THE ESTIMATION OF EMISSION REDUCTIONS FROM JI AND CDM PROJECTS ALEXANDROS FLAMOS, KONSTANTINOS ANAGNOSTOPOULOS, DIMITRIS ASKOUNIS and JOHN PSARRAS School of Electrical and Computer Engineering Decision Support Systems Lab (EPU-NTUA), National Technical University of Athens, Athens, Greece (Received 26 June 2003; accepted in final form 30 October 2003) Abstract. This paper presents e-SEREM (Smart Emission Reduction Estimation Manual), a cost- free, easily accessed and updated, web-based manual for estimating emission reductions from Joint Implementation (JI) and Clean Development Mechanism (CDM) projects. e-SEREM’s main func- tions are the selection of a benchmark for a specific project type in the power or heat sector and the calculation of the annual and cumulative emission reductions accrued by this project for its crediting lifetime. e-SEREM was developed in order to test its applicability and practicality in assisting project developers and evaluators to elaborate baselines easily and calculate the emission credits earned by candidate JI or CDM projects hosted in several countries. Keywords: accounting, baselines, Clean Development Mechanism, Joint Implementation, manual 1. Introduction Once multi-project baseline emission factors have been determined for a particular project category in a host country, baseline scenarios for projects in that category can be determined by multiplying the emissions factors with the projects’ activity levels (e.g. output levels such as MWh for a power sector project). In order to facilitate the process of determining baselines for individual Joint Implementation (JI)/Clean Development Mechanism (CDM) projects using multi-project baseline emission factors, Procedures for Accounting and Baselines (PROBASE) has de- veloped an electronic manual, which guides project developers through a decision tree leading to the most appropriate baseline for their projects. This Smart Emission Reduction Estimation Manual (e-SEREM) is a free-of-charge, easily accessible and regularly updated Internet-based manual. This paper presents e-SEREM and explains the system behind the tool. The system contains several multi-project baselines, which have been determined for different project categories and host countries. The baselines differ from each other in terms of the parameter values used, such as: which fuel technology is the project likely to replace, has the baseline been derived from historic data or expected future additions, for which region has the baseline been determined and are the baseline in co-operation with Sonja Butzengeiger and Wytze van der Gaast Mitigation and Adaptation Strategies for Global Change 9: 103–120, 2004. © 2004 Kluwer Academic Publishers. Printed in the Netherlands.
-
Upload
independent -
Category
Documents
-
view
0 -
download
0
Transcript of e-Serem – A Web-Based Manual For The Estimation of Emission Reductions From JI and CDM Projects
E-SEREM – A WEB-BASED MANUAL FOR THE ESTIMATION OFEMISSION REDUCTIONS FROM JI AND CDM PROJECTS
ALEXANDROS FLAMOS, KONSTANTINOS ANAGNOSTOPOULOS, DIMITRISASKOUNIS and JOHN PSARRAS�
School of Electrical and Computer Engineering Decision Support Systems Lab (EPU-NTUA),National Technical University of Athens, Athens, Greece
(Received 26 June 2003; accepted in final form 30 October 2003)
Abstract. This paper presents e-SEREM (Smart Emission Reduction Estimation Manual), a cost-free, easily accessed and updated, web-based manual for estimating emission reductions from JointImplementation (JI) and Clean Development Mechanism (CDM) projects. e-SEREM’s main func-tions are the selection of a benchmark for a specific project type in the power or heat sector and thecalculation of the annual and cumulative emission reductions accrued by this project for its creditinglifetime. e-SEREM was developed in order to test its applicability and practicality in assisting projectdevelopers and evaluators to elaborate baselines easily and calculate the emission credits earned bycandidate JI or CDM projects hosted in several countries.
Keywords: accounting, baselines, Clean Development Mechanism, Joint Implementation, manual
1. Introduction
Once multi-project baseline emission factors have been determined for a particularproject category in a host country, baseline scenarios for projects in that categorycan be determined by multiplying the emissions factors with the projects’ activitylevels (e.g. output levels such as MWh for a power sector project). In order tofacilitate the process of determining baselines for individual Joint Implementation(JI)/Clean Development Mechanism (CDM) projects using multi-project baselineemission factors, Procedures for Accounting and Baselines (PROBASE) has de-veloped an electronic manual, which guides project developers through a decisiontree leading to the most appropriate baseline for their projects. This Smart EmissionReduction Estimation Manual (e-SEREM) is a free-of-charge, easily accessibleand regularly updated Internet-based manual.
This paper presents e-SEREM and explains the system behind the tool. Thesystem contains several multi-project baselines, which have been determined fordifferent project categories and host countries. The baselines differ from each otherin terms of the parameter values used, such as: which fuel technology is the projectlikely to replace, has the baseline been derived from historic data or expected futureadditions, for which region has the baseline been determined and are the baseline
� in co-operation with Sonja Butzengeiger and Wytze van der Gaast
Mitigation and Adaptation Strategies for Global Change 9: 103–120, 2004.© 2004 Kluwer Academic Publishers. Printed in the Netherlands.
104 A FLAMOS ET AL.
emission factors during the crediting lifetime dynamic or static? These parametervalues have been predetermined in the process of developing the multi-projectbaseline (Rosen et al. 2004).
e-SEREM automatically matches the project-specific data filled in by the pro-ject participants (e.g. region, project type, crediting lifetime, load range) with theparameter values of the baselines in the tool so that the system eventually choosesthe most appropriate benchmark for the project. Additionally added project-specificdata such as output volume and expected emissions of the project itself enablese-SEREM to calculate both a baseline scenario for the project during the credit-ing lifetime chosen and an estimate of the emission reductions. In the context ofPROBASE, the system has been designed for projects in the power or heat sector.
e-SEREM was developed in order to test its applicability and practicality inassisting project developers and evaluators to determine and validate baselineseasily and calculate the emission reduction credits that are earned by candidateJI or CDM projects in different potential host countries. The tool can be used byproject developers to estimate the emission reduction of their JI or CDM projectsprior to the establishment of a baseline methodology. This will assist them in pre-estimating the feasibility of their projects and developing the respective feasibilitystudy.
The system can store baselines for as many countries as necessary and con-tains a wide range of multi-project baselines, including those calculated by thePERSEUS, Reflex and SimBAT energy sector models analysed by PROBASE(Fichtner et al. 2001; Rosen et al. 2004). Finally, different methods for applyingstringency to baselines can be used by the system.
Section 2 of this article describes what parameters values need to be determ-ined for the calculation of multi-project baselines. Section 3 explains how thematching of the project-specific data with the parameter values takes place in thee-SEREM tool, which eventually leads to the most appropriate baseline for theproject. Section 4 contains a conclusion.
2. Parameters for Multi-Project Baselines and Benchmarks
Multi-project (or standardised) baselines are generic baselines derived for applic-ation to multiple projects; a benchmark is a subset of this and is defined as aperformance level generic baseline, which may or may not be single country de-pendent. Benchmarks could assume a particular technical performance in the hostcountry. For example, if for the power sector in a host country it can be reasonablyassumed that under business-as-usual circumstances the power plants had used gas-fired boilers then this would be the technical performance on which to base thebenchmark. The level of aggregation of these benchmarks depends on the projectsituation, but this could vary from aggregating the project technology/fuel situationto the sector and perhaps to the country level. Most technology-based performance
E-SEREM 105
standards will be country dependent but some may even apply across more thanone country.
An early approach to develop multi-project baselines was proposed by Luh-mann et al. (1995) who suggested a filter model through which a default projectcould be developed for a particular sector in a host country. This default projectwould subsequently serve as a standardised reference project for JI projects andwould include a baseline scenario for that type of project. Presenting the defaultbaseline values for the projects or for a particular technology in a systematic wayper sector/technology and host country would lead to matrices of multi-projectbaseline values.
Given the above, a benchmark can be defined as an aggregate business-as-usualGHG emissions factor (carbon dioxide, CO2-eq. emissions per unit of output) fora given country or region and for a given project-type or sector derived from eitherhistorical trends or forecasts of future emission trends in the host country. Mul-tiplying the benchmark emissions factor with the output of the project (assumingequivalence of service) then results in a project baseline scenario.
An important issue with respect to the application of benchmarks for baselinedetermination is on which installations/units the benchmark value should be based.In the literature several methods have been suggested for this, such as:• Recent comparable 5-year benchmarks, which assume that the technology
implemented in the sector in the country during the last 5 years most likelywill also be the technology that would have been implemented in the future inabsence of the project.
• Currently best available techniques benchmarks, which assume that in thefuture the host country would have implemented the best techniques (techno-logies or management programmes, such as demand-side management) avail-able in the country. This method requires an (economic and technical) analysisto determine which techniques are feasible for the host or a policy analysis tofind out what techniques are mandatory by national or international policies.
• Better than average current practice benchmarks, which assume that the coun-try’s or the sector’s average current practice is the most reasonable descriptionof the business-as-usual situation. A project can only be eligible as JI/CDMif its emissions are lower than those corresponding to the average currentpractice in the sector or country.
• Economically most attractive/least cost technology benchmarks, which as-sume that in the country the least cost/economically most attractive techno-logies would have been implemented in the business-as-usual case.
The above benchmark methods to a certain extent overlap. For example, the recentcomparable 5-year and the better than average benchmarks both refer to the cur-rently existing average technologies, as well as to the recent or perhaps soon to beimplemented technological addition. A difference between the two methods is thatthe recent comparable 5-year benchmark focuses on recently installed technologiesand therefore takes into consideration plants installed in the margin, whereas the
106 A FLAMOS ET AL.
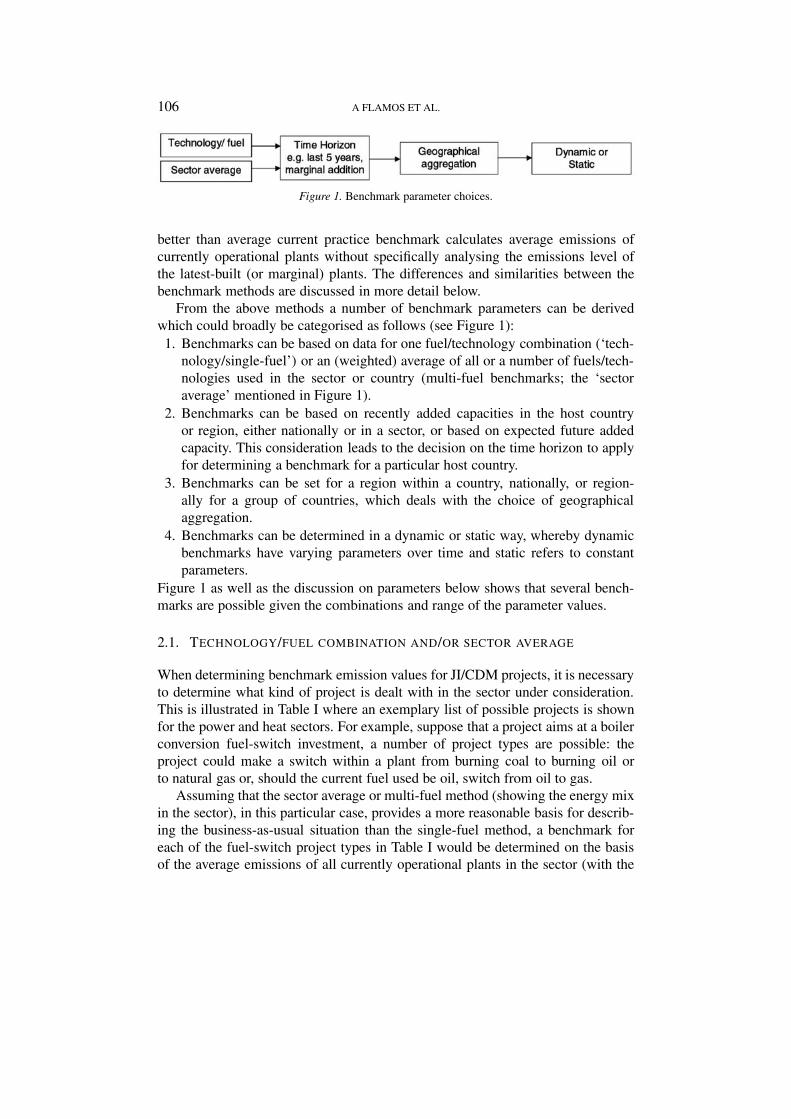
Figure 1. Benchmark parameter choices.
better than average current practice benchmark calculates average emissions ofcurrently operational plants without specifically analysing the emissions level ofthe latest-built (or marginal) plants. The differences and similarities between thebenchmark methods are discussed in more detail below.
From the above methods a number of benchmark parameters can be derivedwhich could broadly be categorised as follows (see Figure 1):1. Benchmarks can be based on data for one fuel/technology combination (‘tech-
nology/single-fuel’) or an (weighted) average of all or a number of fuels/tech-nologies used in the sector or country (multi-fuel benchmarks; the ‘sectoraverage’ mentioned in Figure 1).
2. Benchmarks can be based on recently added capacities in the host countryor region, either nationally or in a sector, or based on expected future addedcapacity. This consideration leads to the decision on the time horizon to applyfor determining a benchmark for a particular host country.
3. Benchmarks can be set for a region within a country, nationally, or region-ally for a group of countries, which deals with the choice of geographicalaggregation.
4. Benchmarks can be determined in a dynamic or static way, whereby dynamicbenchmarks have varying parameters over time and static refers to constantparameters.
Figure 1 as well as the discussion on parameters below shows that several bench-marks are possible given the combinations and range of the parameter values.
2.1. TECHNOLOGY/FUEL COMBINATION AND/OR SECTOR AVERAGE
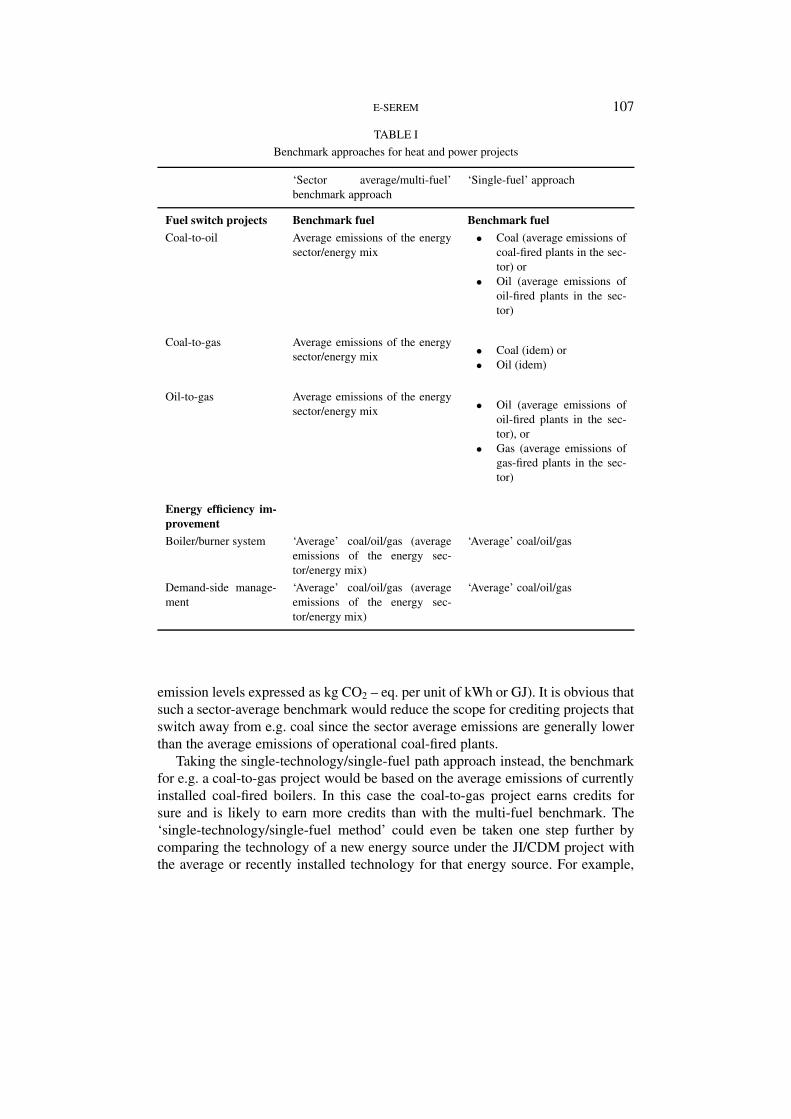
When determining benchmark emission values for JI/CDM projects, it is necessaryto determine what kind of project is dealt with in the sector under consideration.This is illustrated in Table I where an exemplary list of possible projects is shownfor the power and heat sectors. For example, suppose that a project aims at a boilerconversion fuel-switch investment, a number of project types are possible: theproject could make a switch within a plant from burning coal to burning oil orto natural gas or, should the current fuel used be oil, switch from oil to gas.
Assuming that the sector average or multi-fuel method (showing the energy mixin the sector), in this particular case, provides a more reasonable basis for describ-ing the business-as-usual situation than the single-fuel method, a benchmark foreach of the fuel-switch project types in Table I would be determined on the basisof the average emissions of all currently operational plants in the sector (with the
E-SEREM 107
TABLE I
Benchmark approaches for heat and power projects
‘Sector average/multi-fuel’benchmark approach
‘Single-fuel’ approach
Fuel switch projects Benchmark fuel Benchmark fuel
Coal-to-oil Average emissions of the energysector/energy mix
• Coal (average emissions ofcoal-fired plants in the sec-tor) or
• Oil (average emissions ofoil-fired plants in the sec-tor)
Coal-to-gas Average emissions of the energysector/energy mix • Coal (idem) or
• Oil (idem)
Oil-to-gas Average emissions of the energysector/energy mix • Oil (average emissions of
oil-fired plants in the sec-tor), or
• Gas (average emissions ofgas-fired plants in the sec-tor)
Energy efficiency im-provement
Boiler/burner system ‘Average’ coal/oil/gas (averageemissions of the energy sec-tor/energy mix)
‘Average’ coal/oil/gas
Demand-side manage-ment
‘Average’ coal/oil/gas (averageemissions of the energy sec-tor/energy mix)
‘Average’ coal/oil/gas
emission levels expressed as kg CO2 – eq. per unit of kWh or GJ). It is obvious thatsuch a sector-average benchmark would reduce the scope for crediting projects thatswitch away from e.g. coal since the sector average emissions are generally lowerthan the average emissions of operational coal-fired plants.
Taking the single-technology/single-fuel path approach instead, the benchmarkfor e.g. a coal-to-gas project would be based on the average emissions of currentlyinstalled coal-fired boilers. In this case the coal-to-gas project earns credits forsure and is likely to earn more credits than with the multi-fuel benchmark. The‘single-technology/single-fuel method’ could even be taken one step further bycomparing the technology of a new energy source under the JI/CDM project withthe average or recently installed technology for that energy source. For example,
108 A FLAMOS ET AL.
the benchmark for a coal-to-gas project would then be based on the average orrecently installed gas-fired boiler technology, instead of coal-fired boilers. A draw-back of this relatively stringent approach is that it would not really be appropriatefor renewable energy projects. After all, a benchmark for a coal-to-renewables pro-ject would, according to this approach, be based on (average or recent) renewablesand therefore not earn credits, thereby neglecting that those projects lead to themaximum emission reductions possible. A hybrid approach, e.g. that would buildupon a multi-sector approach but allow high carbon intensive projects to use asingle-fuel approach based on the fuel replaced, could also be an option.
It is important to note here that the decision which technology/fuel most reason-ably represents the fuel that would have been replaced by a JI/CDM project largelydepends on whether the project aims at meeting existing energy demand or newdemand. In a situation where the energy demand in a host country is not expected toincrease, the implementation of the project implies its output will replace the outputfrom an existing installation, i.e. the marginal plant. Identifying the marginal plantdepends on the considerations made in the host country for such decisions, butan example could be that the oldest and least efficient plant would be closed first.Alternatively, if a country is largely endowed with coal, but must import naturalgas, it could decide that the marginal plant could be a gas-fired boiler in order tobecome less vulnerable for international gas price increases (see also the exampleof the Surduc project in Begg et al. 2004). This, of course, assumes that the JI/CDMproject does not install a gas-fired boiler itself, but, for instance, a hydro or windenergy plant. Kartha et al. (2002) have identified this determination of a marginalplant under existing demand as the operating margin baseline method.
Next to their operating margin method, Kartha et al. (2002) have also identifiedthe so-called built margin method, which resembles baseline determination for en-ergy projects that meet new energy demand. Assuming that in the existing situationthe production capacity in the host country’s energy sector is fully utilised, baselinedetermination for a JI/CDM project requires the identification of the marginal plantthat would have been built in absence of the project in order to meet the new energydemand, i.e. the built margin plant.1
2.2. TIME HORIZON
The time horizon parameter deals with whether the benchmark will be derivedfrom historic emissions data or from expected and/or planned developments in thefuture. Historic emissions data could be collected for investments in the recent pastor from currently operational plants. Assuming that recently installed plants aregenerally more efficient, a benchmark derived from recent investments would leadto a lower emissions factor than one derived from all currently operational plants
1 In case new demand would arise in a situation with overcapacity in energy production, the newdemand could be met by existing capacity. A JI/CDM project in this context would then, again,replace the operating margin project rather than the built margin project.

E-SEREM 109
as this data set would also contain plants that have been operational for a longerperiod of time than, say, the last 5 or 2 years.
Benchmarks could also be derived from expected future trends and develop-ments taking the relevant present situation as a starting point. For example, relevantpolicy measures that are expected or agreed to take place in the near future wouldhave to be included in the benchmark (e.g. Acquis Communautaire commitmentsfor EU Candidate countries). Also benchmarks can be derived from model projec-tions of a cost-optimal energy mix in a particular host country (see the examples ofthe PERSEUS and Reflex models in Rosen et al. 2004).
The choice whether to apply a historic databased benchmark or a future develop-ment-based benchmark is typically sector or country-specific. With respect to this,the e-SEREM tool contains several variations of benchmarks each representing thespecific characteristic of a particular region or host country.
2.3. GEOGRAPHICAL SCOPE
Multi-project baselines can be calculated for different levels of geographical ag-gregation. The least aggregated multi-project baseline would be the one that coversa particular region within a country. A selection criterion for determining the regionto which a benchmark applies could be the extent to which there are interdepend-encies between different regions. For example, in some large countries (e.g. China,India, Indonesia, Russian Federation) the several different geographical regionshave relatively little interdependencies so that an investment in e.g. a power plant inone region does not affect the energy system in the other regions. When such a con-dition is fulfilled the region could be singled out for which a regional benchmarkis constructed.
In case there exist significant interdependencies between different regions in acountry determining a national benchmark would be a better aggregation option.However, system interdependencies do not always stop at the national border, e.g.in case where the country is part of an international liberalised energy market, sothat for these cases a multi-country benchmark would need to be derived. Finally,as a more abstract line of thinking, determining global scale benchmarks could beconsidered, which take the world average as a basis for multi-project baselines ore.g. select the world’s best region as a reasonable reference case for a project.
An advantage of applying a low aggregation level is that fewer investment op-portunities are missed as the individual situation of each country is described inmore detail. Using national benchmarks will also lead resources to where they aremost effective, i.e. to countries with highly carbon-intensive industries. However,this could result in a loss in environmental integrity since it would imply a smallerfocus on projects replacing sources cleaner than coal and a biased distribution ofinvestments between countries. Moreover, countries that in the past (indirectly)stimulated the use of carbon-intensive fuels, e.g. via coal subsidies, will be rewar-ded with higher baselines resulting in more credits for investors, whereas countries
110 A FLAMOS ET AL.
whose past energy policy has resulted in a less carbon intense production processwill receive relatively little credits.
Using multi-country or even global benchmarks implies that there is no geo-graphical ‘preference’ for investors because a particular project, ceteris paribus,will be rewarded with the same amount of credits irrespective of where it is im-plemented. However, there could be a problem that a global or even a countrybenchmark may not be justifiable for some project types. Moreover, a global,multi-country or even national-scale benchmark may contradict with the Mar-rakech Accords text on baselines which implies that baselines should be sufficientlyproject-specific. Although the latter leaves scope for standardisation options, it re-quires baselines to be derived from the project context (with the exception of small-scale CDM projects) which seems to complicate applying global or multi-countrybenchmarks as these are almost entirely separated from the project context.
2.4. VARIATIONS IN PARAMETER VALUES LEADING TO DIFFERENT
BENCHMARKS
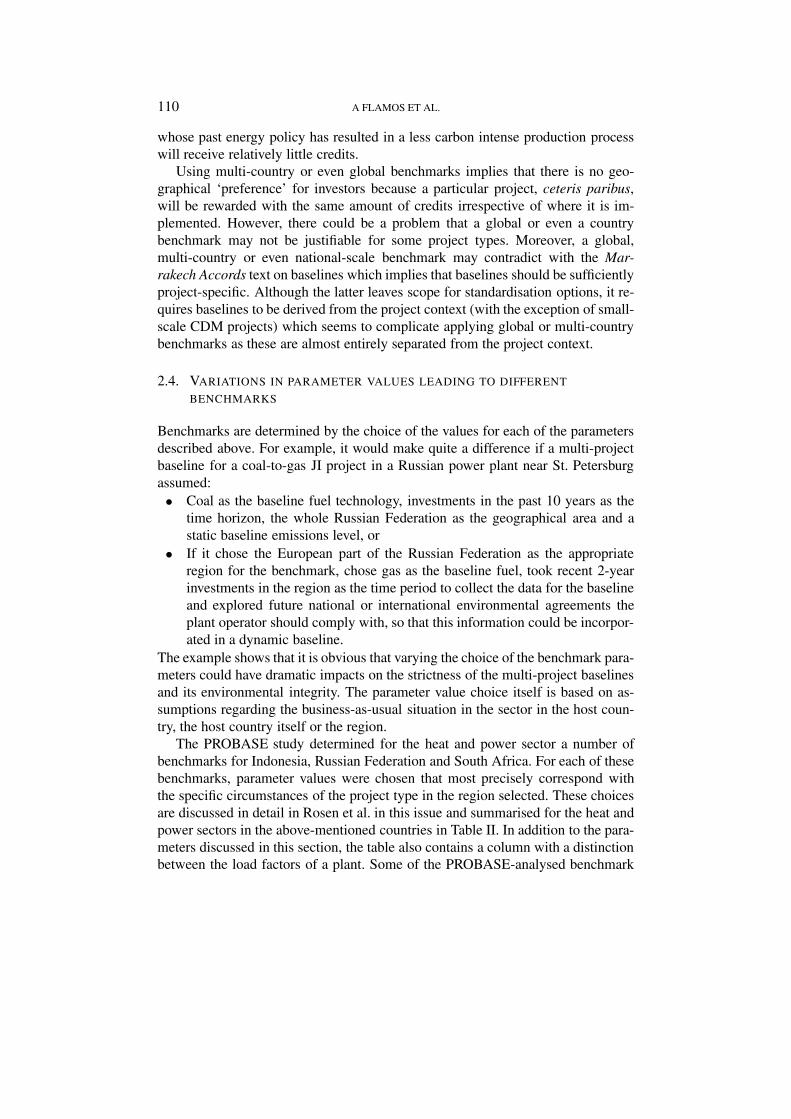
Benchmarks are determined by the choice of the values for each of the parametersdescribed above. For example, it would make quite a difference if a multi-projectbaseline for a coal-to-gas JI project in a Russian power plant near St. Petersburgassumed:• Coal as the baseline fuel technology, investments in the past 10 years as the
time horizon, the whole Russian Federation as the geographical area and astatic baseline emissions level, or
• If it chose the European part of the Russian Federation as the appropriateregion for the benchmark, chose gas as the baseline fuel, took recent 2-yearinvestments in the region as the time period to collect the data for the baselineand explored future national or international environmental agreements theplant operator should comply with, so that this information could be incorpor-ated in a dynamic baseline.
The example shows that it is obvious that varying the choice of the benchmark para-meters could have dramatic impacts on the strictness of the multi-project baselinesand its environmental integrity. The parameter value choice itself is based on as-sumptions regarding the business-as-usual situation in the sector in the host coun-try, the host country itself or the region.
The PROBASE study determined for the heat and power sector a number ofbenchmarks for Indonesia, Russian Federation and South Africa. For each of thesebenchmarks, parameter values were chosen that most precisely correspond withthe specific circumstances of the project type in the region selected. These choicesare discussed in detail in Rosen et al. in this issue and summarised for the heat andpower sectors in the above-mentioned countries in Table II. In addition to the para-meters discussed in this section, the table also contains a column with a distinctionbetween the load factors of a plant. Some of the PROBASE-analysed benchmark
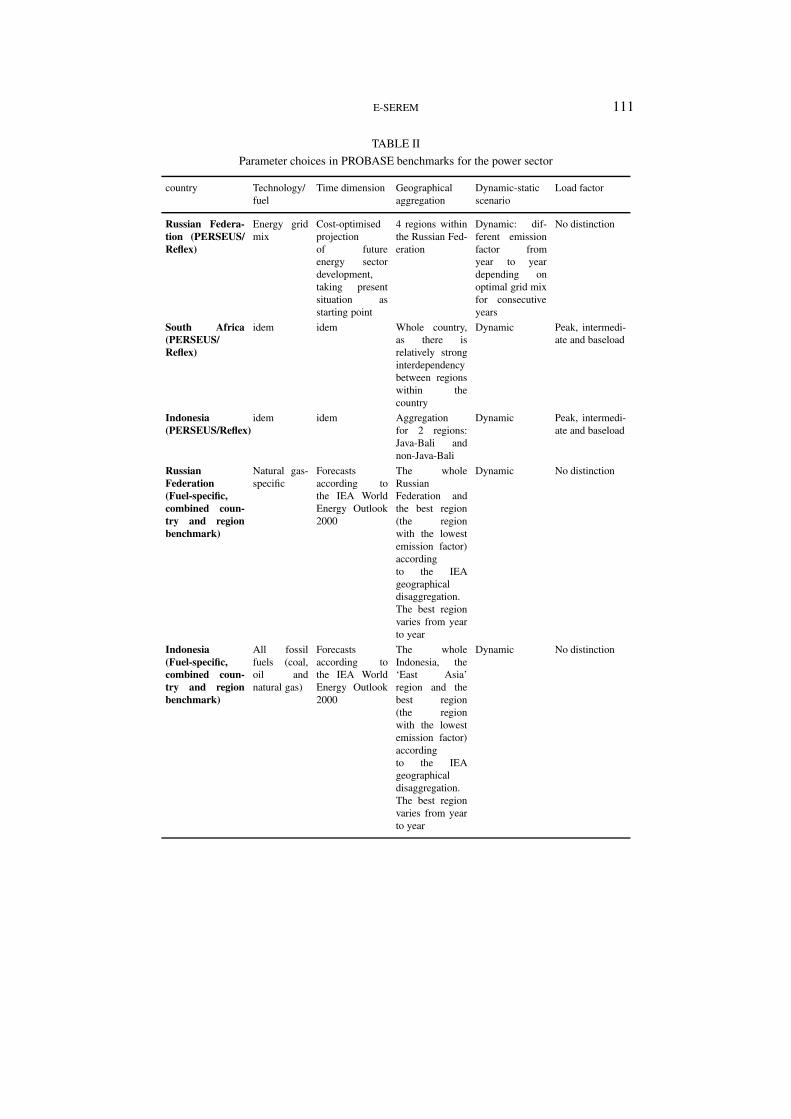
E-SEREM 111
TABLE II
Parameter choices in PROBASE benchmarks for the power sector
country Technology/fuel
Time dimension Geographicalaggregation
Dynamic-staticscenario
Load factor
Russian Federa-tion (PERSEUS/Reflex)
Energy gridmix
Cost-optimisedprojectionof futureenergy sectordevelopment,taking presentsituation asstarting point
4 regions withinthe Russian Fed-eration
Dynamic: dif-ferent emissionfactor fromyear to yeardepending onoptimal grid mixfor consecutiveyears
No distinction
South Africa(PERSEUS/Reflex)
idem idem Whole country,as there isrelatively stronginterdependencybetween regionswithin thecountry
Dynamic Peak, intermedi-ate and baseload
Indonesia(PERSEUS/Reflex)
idem idem Aggregationfor 2 regions:Java-Bali andnon-Java-Bali
Dynamic Peak, intermedi-ate and baseload
RussianFederation(Fuel-specific,combined coun-try and regionbenchmark)
Natural gas-specific
Forecastsaccording tothe IEA WorldEnergy Outlook2000
The wholeRussianFederation andthe best region(the regionwith the lowestemission factor)accordingto the IEAgeographicaldisaggregation.The best regionvaries from yearto year
Dynamic No distinction
Indonesia(Fuel-specific,combined coun-try and regionbenchmark)
All fossilfuels (coal,oil andnatural gas)
Forecastsaccording tothe IEA WorldEnergy Outlook2000
The wholeIndonesia, the‘East Asia’region and thebest region(the regionwith the lowestemission factor)accordingto the IEAgeographicaldisaggregation.The best regionvaries from yearto year
Dynamic No distinction
112 A FLAMOS ET AL.
TABLE II
Continued
country Technology/fuel
Time dimension Geographicalaggregation
Dynamic-staticscenario
Load factor
Panama(Fuel-specific,combined coun-try and regionbenchmark)
All fossilfuels (coal,oil andnatural gas)
Forecastsaccording tothe IEA WorldEnergy Outlook2000
The wholePanama, the‘Other LatinAmerica’ region(Latin Americaexcept Brazil)and the bestregion (theregion withthe lowestemission factor)accordingto the IEAgeographicaldisaggregation.The best regionvaries from yearto year
Dynamic No distinction
Sources: PROBASE, 2003; Rosen et al. in this issue, Anagnostopoulos et al. in this issue.
methods include a possibility to identify which part of energy output is producedunder baseload, intermediate or peak load circumstances. The applicability of sucha load range depends on the region and/or country to which the benchmarks apply.
3. e-SEREM
The steps in the multi-project baseline process including the assessment of para-meter values for baselines as described above have been taken as a basis in PRO-BASE for developing an electronic handbook/manual for baseline determinationand GHG emission reduction accounting. The idea behind the electronic manualconcept is that project developers fill in project-specific values for the above-men-tioned parameters and that the manual calculates, using multi-project baseline val-ues when applicable, the baseline for the project on a year-by-year basis.
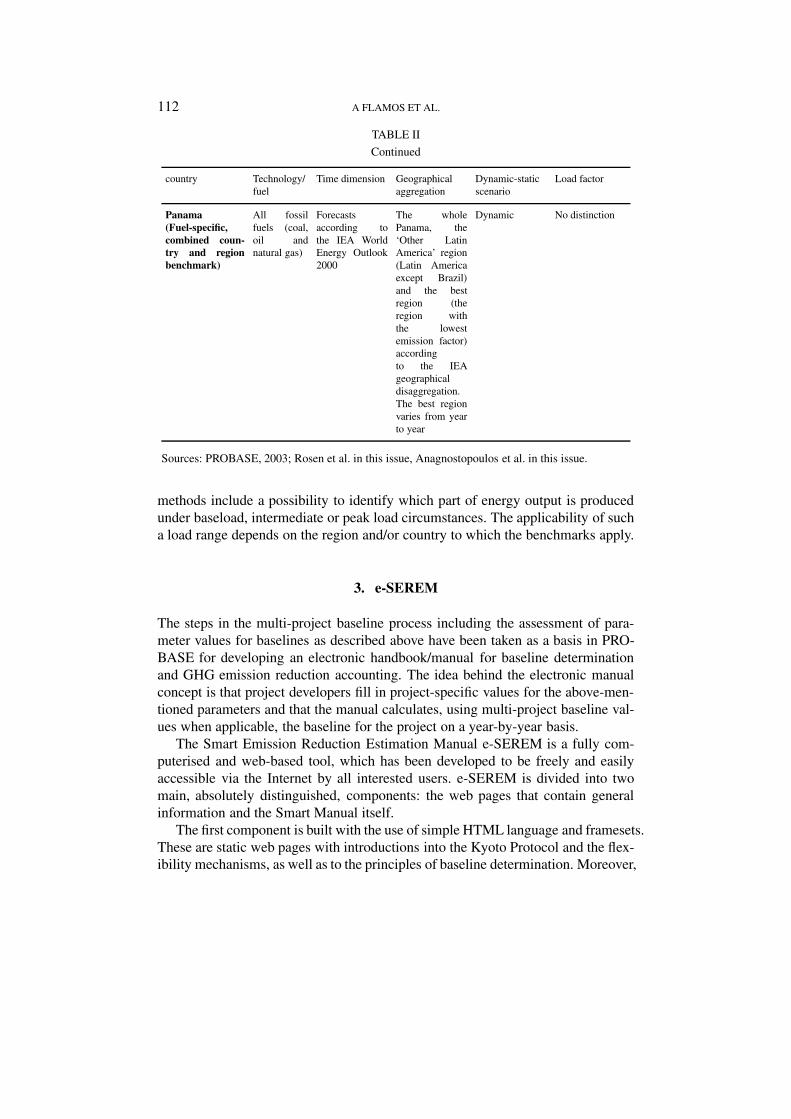
The Smart Emission Reduction Estimation Manual e-SEREM is a fully com-puterised and web-based tool, which has been developed to be freely and easilyaccessible via the Internet by all interested users. e-SEREM is divided into twomain, absolutely distinguished, components: the web pages that contain generalinformation and the Smart Manual itself.
The first component is built with the use of simple HTML language and framesets.These are static web pages with introductions into the Kyoto Protocol and the flex-ibility mechanisms, as well as to the principles of baseline determination. Moreover,
E-SEREM 113
Figure 2. The architecture and the web pages of the first component of e-SEREM.
Figure 3. The architecture of the Smart Manual.
it includes the introductory web page of the Smart Manual and downloadable in-structions for using the Smart Manual. The architecture and web pages of the firstcomponent are presented in Figure 2.
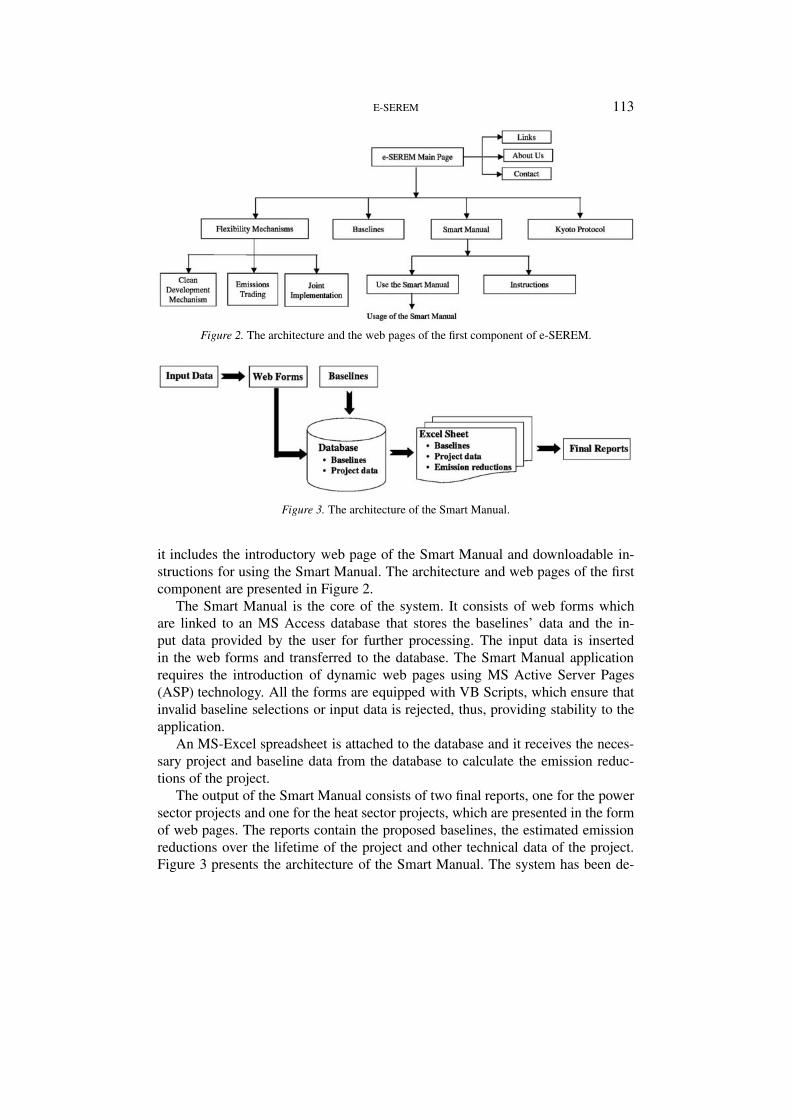
The Smart Manual is the core of the system. It consists of web forms whichare linked to an MS Access database that stores the baselines’ data and the in-put data provided by the user for further processing. The input data is insertedin the web forms and transferred to the database. The Smart Manual applicationrequires the introduction of dynamic web pages using MS Active Server Pages(ASP) technology. All the forms are equipped with VB Scripts, which ensure thatinvalid baseline selections or input data is rejected, thus, providing stability to theapplication.
An MS-Excel spreadsheet is attached to the database and it receives the neces-sary project and baseline data from the database to calculate the emission reduc-tions of the project.
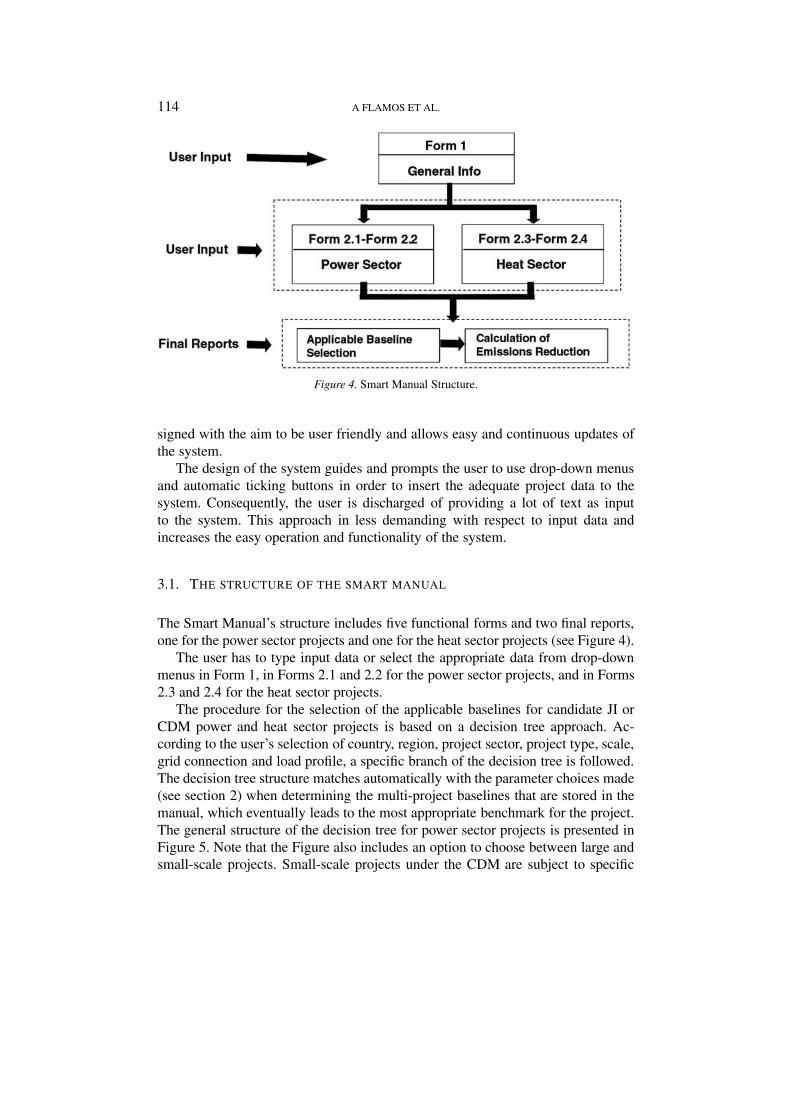
The output of the Smart Manual consists of two final reports, one for the powersector projects and one for the heat sector projects, which are presented in the formof web pages. The reports contain the proposed baselines, the estimated emissionreductions over the lifetime of the project and other technical data of the project.Figure 3 presents the architecture of the Smart Manual. The system has been de-
114 A FLAMOS ET AL.
Figure 4. Smart Manual Structure.
signed with the aim to be user friendly and allows easy and continuous updates ofthe system.
The design of the system guides and prompts the user to use drop-down menusand automatic ticking buttons in order to insert the adequate project data to thesystem. Consequently, the user is discharged of providing a lot of text as inputto the system. This approach in less demanding with respect to input data andincreases the easy operation and functionality of the system.
3.1. THE STRUCTURE OF THE SMART MANUAL
The Smart Manual’s structure includes five functional forms and two final reports,one for the power sector projects and one for the heat sector projects (see Figure 4).
The user has to type input data or select the appropriate data from drop-downmenus in Form 1, in Forms 2.1 and 2.2 for the power sector projects, and in Forms2.3 and 2.4 for the heat sector projects.
The procedure for the selection of the applicable baselines for candidate JI orCDM power and heat sector projects is based on a decision tree approach. Ac-cording to the user’s selection of country, region, project sector, project type, scale,grid connection and load profile, a specific branch of the decision tree is followed.The decision tree structure matches automatically with the parameter choices made(see section 2) when determining the multi-project baselines that are stored in themanual, which eventually leads to the most appropriate benchmark for the project.The general structure of the decision tree for power sector projects is presented inFigure 5. Note that the Figure also includes an option to choose between large andsmall-scale projects. Small-scale projects under the CDM are subject to specific
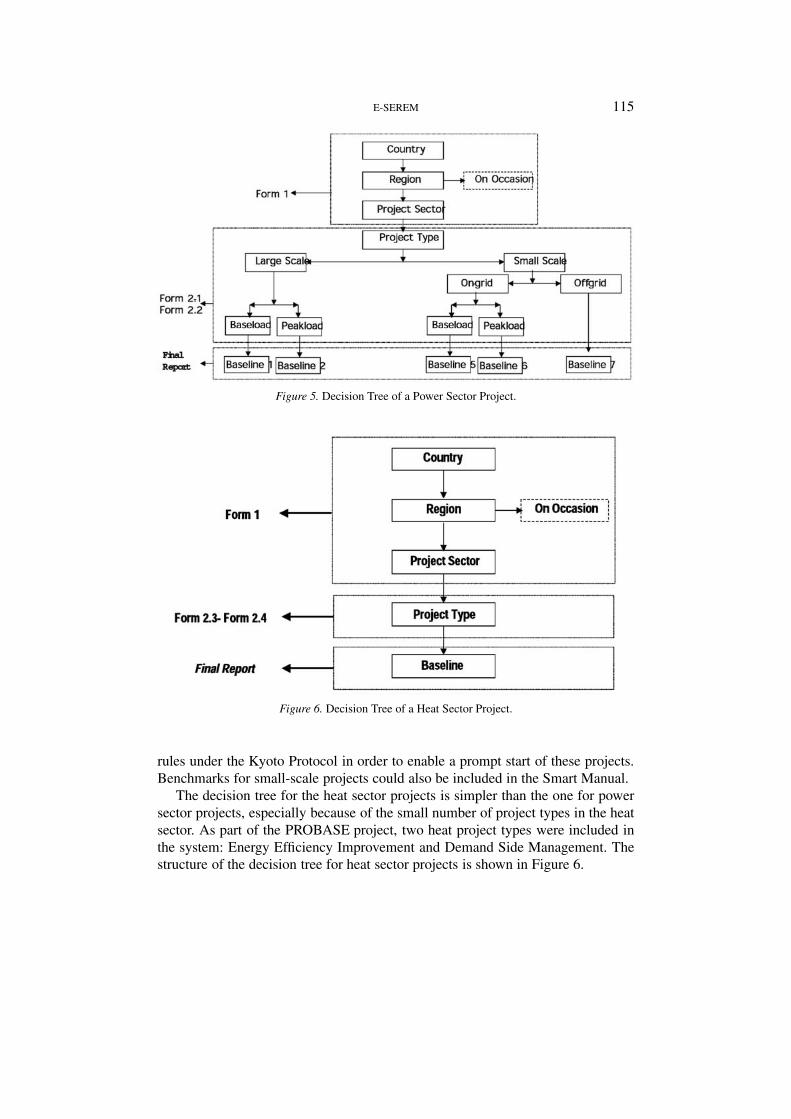
E-SEREM 115
Figure 5. Decision Tree of a Power Sector Project.
Figure 6. Decision Tree of a Heat Sector Project.
rules under the Kyoto Protocol in order to enable a prompt start of these projects.Benchmarks for small-scale projects could also be included in the Smart Manual.
The decision tree for the heat sector projects is simpler than the one for powersector projects, especially because of the small number of project types in the heatsector. As part of the PROBASE project, two heat project types were included inthe system: Energy Efficiency Improvement and Demand Side Management. Thestructure of the decision tree for heat sector projects is shown in Figure 6.
116 A FLAMOS ET AL.
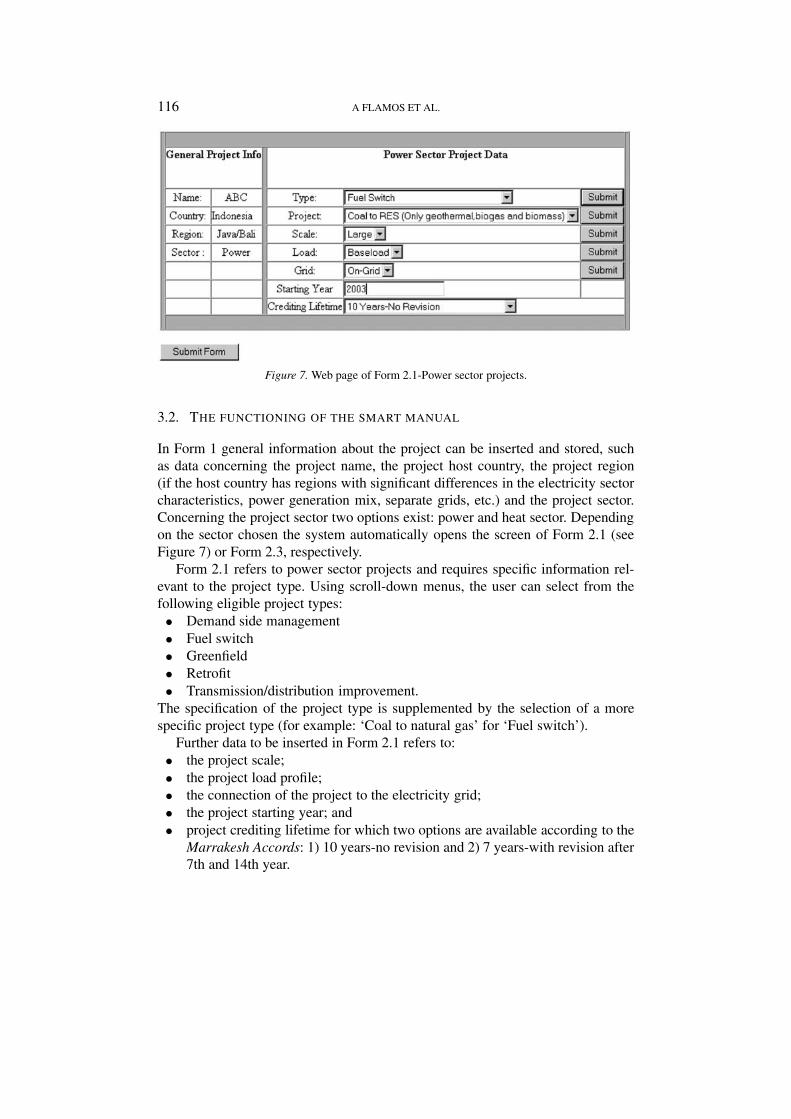
Figure 7. Web page of Form 2.1-Power sector projects.
3.2. THE FUNCTIONING OF THE SMART MANUAL
In Form 1 general information about the project can be inserted and stored, suchas data concerning the project name, the project host country, the project region(if the host country has regions with significant differences in the electricity sectorcharacteristics, power generation mix, separate grids, etc.) and the project sector.Concerning the project sector two options exist: power and heat sector. Dependingon the sector chosen the system automatically opens the screen of Form 2.1 (seeFigure 7) or Form 2.3, respectively.
Form 2.1 refers to power sector projects and requires specific information rel-evant to the project type. Using scroll-down menus, the user can select from thefollowing eligible project types:• Demand side management• Fuel switch• Greenfield• Retrofit• Transmission/distribution improvement.
The specification of the project type is supplemented by the selection of a morespecific project type (for example: ‘Coal to natural gas’ for ‘Fuel switch’).
Further data to be inserted in Form 2.1 refers to:• the project scale;• the project load profile;• the connection of the project to the electricity grid;• the project starting year; and• project crediting lifetime for which two options are available according to the
Marrakesh Accords: 1) 10 years-no revision and 2) 7 years-with revision after7th and 14th year.
E-SEREM 117
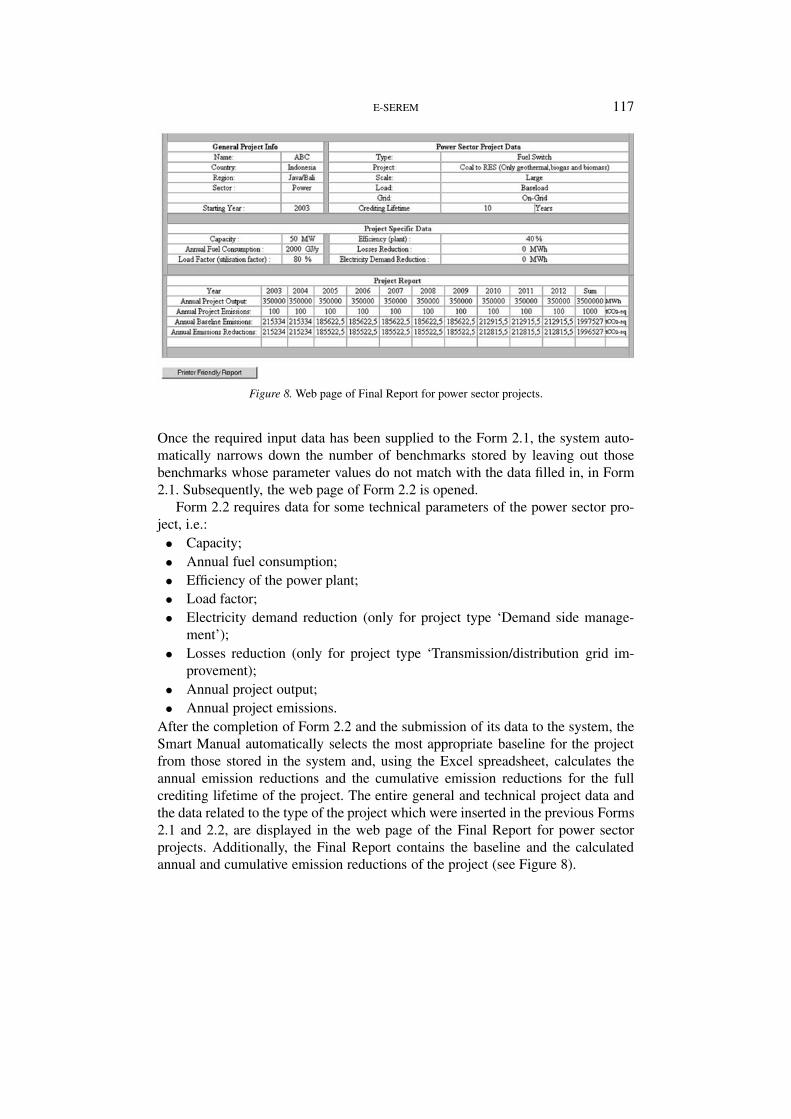
Figure 8. Web page of Final Report for power sector projects.
Once the required input data has been supplied to the Form 2.1, the system auto-matically narrows down the number of benchmarks stored by leaving out thosebenchmarks whose parameter values do not match with the data filled in, in Form2.1. Subsequently, the web page of Form 2.2 is opened.
Form 2.2 requires data for some technical parameters of the power sector pro-ject, i.e.:• Capacity;• Annual fuel consumption;• Efficiency of the power plant;• Load factor;• Electricity demand reduction (only for project type ‘Demand side manage-
ment’);• Losses reduction (only for project type ‘Transmission/distribution grid im-
provement);• Annual project output;• Annual project emissions.
After the completion of Form 2.2 and the submission of its data to the system, theSmart Manual automatically selects the most appropriate baseline for the projectfrom those stored in the system and, using the Excel spreadsheet, calculates theannual emission reductions and the cumulative emission reductions for the fullcrediting lifetime of the project. The entire general and technical project data andthe data related to the type of the project which were inserted in the previous Forms2.1 and 2.2, are displayed in the web page of the Final Report for power sectorprojects. Additionally, the Final Report contains the baseline and the calculatedannual and cumulative emission reductions of the project (see Figure 8).
118 A FLAMOS ET AL.
The processing of heat sector projects starts with the Form 2.3. In this Form, theSmart Manual requires the definition of the project type as well as the specificationof the project starting year and the crediting lifetime. Based on this input Form2.4 opens with which, similarly to power sector projects, project-specific technicaldata can be collected and a baseline selected. The annual and cumulative emissionreductions are calculated and presented in the web page of the Final Report for heatsector projects. The Final Report also displays all the project relevant data.
In all Forms of e-SEREM, the system is designed to present only the optionswhich are relevant to the selected project type. For instance, if the user selects the‘coal to gas’ option for a fuel switch project, the system will automatically displayonly the ‘on-grid’ option in the respective field and only the ‘Large-scale’ optionin the scale field.
The system has been developed with an open architecture that enables it to beeasily updated and extended. The version developed under PROBASE is a pilot,but further expansion of e-SEREM could include more host countries of JI orCDM projects, more sectors and project types as well as more baseline types.As mentioned earlier, the system could significantly reduce transaction costs forproject developers and helps them to estimate the expected emission credits andevaluate the economic feasibility of their projects.
Although the manual should be as simple as possible, for the purpose of trans-parency it is recommended that the underlying data for the baselines included in thesystem and considerations for e.g. regional aggregation, time horizon applied, fueltechnology chosen, etc. are linked to the manual as electronic Portable DocumentFormats.
4. Conclusions
Determining multi-project baselines and/or benchmarks requires making choicesfor a series of parameters the values of which distinguish one benchmark fromanother. The considerations behind each value choice and determination have beendiscussed in this paper. When selecting the most appropriate multi-project baselineto a particular project a similar process must be followed. In this process, projectdevelopers need to explore parameter values for their projects and on the basis ofthat narrow down the number of possible benchmarks.
Such a matching between determining parameter values for a specific projectand the parameter values of different benchmark could be automised by e-SEREM,an electronic, Internet-based Smart Manuel. e-SEREM provides project investorsand developers with an easily accessible and cost-effective tool to test baselinesfor their projects and estimate the amount of emission credits that their projectscould receive. The system has the potential to store a considerable number ofmulti-project baselines for several countries and sectors. Therefore, it disburdensthe project investors and developers from the costs and work effort to find and
E-SEREM 119
process the necessary data in order to elaborate baselines for their projects. A firstversion of e-SEREM has been developed and can be assessed in the web addresshttp://e-serem.epu.ntua.gr.
Acknowledgements
The work in this paper was based on research conducted within the ‘Proceduresfor accounting and baselines for projects under Joint Implementation and the CleanDevelopment Mechanism’ (PROBASE) project of the Fifth Framework Programme‘Energy, Environment and Sustainable Development’ of the European Commis-sion. We wish to acknowledge the participants of the PROBASE project for theirinvaluable contribution to this study with their comments on an earlier draft of thispaper. We would like to express special thanks to Dr Catrinus Jepma, Dr KatherineBegg, Dr Axel Michaelowa, Dr Wolf Fichtner and Johannes Rosen for their help.We are also grateful to the EC for their support. The content of the paper is the soleresponsibility of its authors and does not necessarily reflect the views of the EC.
References
Begg, K. and Van der Horst, D.: 2004. Preserving environmental integrity in standardised baselines:the role of additionality and uncertainty. Mitigation and Adaptation Strategies for Global Change9: 181–200.
Fichtner, W., Goebelt, M. and Rentz, O.: 2001, ‘The efficiency of international cooperation in mitig-ating climate change: analysis of Joint Implementation, the Clean Development Mechanism andEmission Trading for the Federal Republic of Germany, the Russian Federation and Indonesia’,Energy Policy 29, 817–880.
Kartha, S., Lazarus, M. and Bosi M.: 2002, Practical Baseline Recommendations for GreenhouseGas Mitigation Projects in the Electric Power Sector, Paris, OECD and IEA Information Paper.
Luhmann, H.-J., Beuermann, C., Fischedick, M. and Ott, H.E.: 1995, Making Joint ImplementationOperational: Solutions for Some Technical and Operational Problems of JI in the Fossil FuelPower Sector, Wuppertal, Wuppertal Institut.
Marrakech Accords: 2001, Seventh Conference of the Parties (COP-7), Marrakech, Morocco.Rosen, J., Fichtner, W. and Rentz, O.: 2004. Baseline standardisation with optimising energy-system
models. Mitigation and Adaptation Strategies for Global Change 9: 121–146.
Suggested Further Reading
Bosi, M.: 2000, An Initial View on Methodologies for Emission Baselines: Electricity GenerationCase Study, Paris, IEA Information Paper.
Ellis, J. and Bosi, M.: 1999, Options for Project Emission Baselines, Paris, OECD and IEAInformation Paper.
Ellis, J.: 1999, ‘Emission baselines for Clean Development Mechanism projects: lessons from the AIJpilot phase’, Proceedings of Workshop on baseline for CDM, February 25–26, the New Otani,Tokyo, Japan.
120 A FLAMOS ET AL.
Ellis, J.: 1999, Experiences with Emission Baselines under the AIJ Pilot Phase, Paris, OECDInformation Paper.
Friedman, S.: 1999, ‘The use of benchmarks to determine emission additionality in the Clean Devel-opment Mechanism’, Proceedings of Workshop on baseline for CDM, February 25–26, the NewOtani, Tokyo, Japan.
Lazarus, M., Kartha, S. and Bernow, S.: 2000, Key Issues in Benchmark Baselines for the CDM: Ag-gregation, Stringency, Cohorts, and Updating, Tellus Institute, Stockholm Environment Institute,Prepared for US. Boston, EPA.
Lazarus, M., Kartha, S., Ruth, M., Bernow, S. and Dunmire, C.: 1999, Evaluation of Benchmark-ing as an Approach for Establishing Clean Development Mechanism Baselines, Tellus Institute,Stockholm Environment Institute, Stratus Consulting, prepared for US EPA, Boston.
Puhl, I., Hargrave, T. and Helme, N.: 1999, ‘Options for simplifying baseline setting for Joint Imple-mentation and Clean Development Mechanism projects’, Proceedings of Workshop on baselinefor CDM, February 25–26, the New Otani, Tokyo, Japan.