F£JI - World Bank Documents
58
f F£JI FEI3.. RESTRICTED Rep 0 r t No. FE (IDA) la This report was prepared for use within the Association. It may not be pub- lished nor may it be quoted as representing the Association's views. The Association accepts no responsibility for the accuracy or completeness of the contents of the report. INTERNATIONAL DEVELOPMENT ASSOCIATION Z c en r- THE ECONOMY OF TAIWAN 0 (') THE REPUBLIC OF CHINA 5 Z (::- . ",'1, OJ 0 >< It: ,,--) " Depart:ment of Operations Far East August 18, 1961 - AI en m z ..... f c AI Z ..... 0 : » AI (') » :I: (') <: (') m It: en - z 3: (') (') (,J I ("'{. .....10 J N ..t:. 0 W Public Disclosure Authorized Public Disclosure Authorized Public Disclosure Authorized Public Disclosure Authorized Public Disclosure Authorized Public Disclosure Authorized Public Disclosure Authorized Public Disclosure Authorized
-
Upload
khangminh22 -
Category
Documents
-
view
0 -
download
0
Transcript of F£JI - World Bank Documents

f
F£JI FEI3.. RESTRICTED
Rep 0 r t No. FE (IDA) la
This report was prepared for use within the Association. It may not be pub
lished nor may it be quoted as representing the Association's views. The Association accepts no responsibility for the accuracy or completeness of the contents of the report.
INTERNATIONAL DEVELOPMENT ASSOCIATION
Z c en r-THE ECONOMY OF TAIWAN 0 (')
THE REPUBLIC OF CHINA ~ 5 Z
(::-. ~
",'1,
OJ 0 >< It:
,,--)
"
6<~
Depart:ment of Operations Far East
August 18, 1961
- AI en m z .....
f c AI Z ..... 0
: » AI (')
» :I: (') <: (') m It: en -z
3: (')
(') (,J
I ("'{. .....10 J N ..t:. 0
W
Pub
lic D
iscl
osur
e A
utho
rized
Pub
lic D
iscl
osur
e A
utho
rized
Pub
lic D
iscl
osur
e A
utho
rized
Pub
lic D
iscl
osur
e A
utho
rized
Pub
lic D
iscl
osur
e A
utho
rized
Pub
lic D
iscl
osur
e A
utho
rized
Pub
lic D
iscl
osur
e A
utho
rized
Pub
lic D
iscl
osur
e A
utho
rized

CURRENCY EQUIVALENTS
1 U. S. dollar NT$l NT$l, 000, 000
= 40 New Taiwan dollars = US $0.025 = US $25,000

....
TABLE OF COdmi:rTS
BASIC DATA
smJ:iARY AND COl~CLUSION§ • • • • • • • • • • • • • • • • • • •
I.
III.
IV.
V.
VI.
Ai-ITffiX
Introduction • • • • • • • • • • • • • • • • • • •
National Income and Production •• • • • • • • Agriculture • • • • • • • • • • • • • • • • • • • Industry c. ft. • • • • • • • • • • • • • • •
l-Jinin.g • • • • '" • • • • • • • • • • • • • • • • Electric Povrer • • • • • • • • ~ • • • • • • • • Transport and Corrc(lunications •• • • • • • • • •
Internal Finance • • • • . . . . . . . . . . Government Budget • • • • • • • • • • • • • • • • Government Cash Position •• • • • • • • • • • • };oney and Prices •••••••• • • • Price Changes in 1959 and 1960 • • • • • • • • •
External Finance · . . . . • • • • • • • 0 • • •
Economic Planning • • • • • • • • • • • • • • • The First Two Four-Year Plans • • • •• •••• The Accelerated Growth Program • • • • • • • " •
Economic Prospects •••••••• • • • Prospects for Eonetary and Price Stability • • .. Economic Gro1,rth •••••••••••••••• Agriculture and Industry • • • • • • • • • • Foreign Trade Prospects • • • • • • • • • • • • • Possibilities for Reducing Dependence on
External Aid · . . . . . . . . . . . . Conclusions • • • • . . . . . . . . . . . . .
STATISTICAL TABLES (see follo~ling page)
MAP
i-ii
1
2 2 3 1+ 4 4
5 5 6 R 9
11
14 14 14 (
16 16 16 1'7 18
19

Ia.
lb.
II.
.. IV. V .. VI. VII .. VIII. IX. X. XI .. XII. XIII. XIV. XV. XVlo XVII. XVIII. XIX. xx.
Sl'ATISTICAL TABLES
Estimated External Public Debt Outstanding including UndisblITsed as of Decffiaber 31, 1960 Public Debt to U.S. Government Payable in U.S. Dollars or Local Currency Outstanding December 31, 1960 Estimated Contractual Service Payments on External Public Debt Outstanding including Undisbursed as of Deceraber 31, 1960 ~enditure on Gross National Product i~ational Income at Current Prices by Origin, 1952 and 1955-GO Index rhlFlbers of Production Area and Output of Agricultural Crops Output of Selected ::ining and Industrial Products Consolidated Budget of the Central, Provincial and Local Gavermnents Consolidated Statement of Condition of the Monetary System Factors Affecting the Eoney Supply in Hands of PLlblic L'1terest Rat.es Price Indices Volume of Foreign Trade Value of Principal Exports Value of Principal 1l,lports International Transactions Gold and Foreign ~xchange Investmer .. t Plans Selected Production Targets and Performance U.S. Aid Program, FYl95l-l960, FYl96l

BASIC DATA
Area
Population (End 1960)
Gross Hational Product (1959 estirl1ate)
Gross national product 'l'otal available product (.~~;JP '" import surplus) Per capita mTP Per cap:' ta TAP
Production Indexes 1960 (1953 = 100)
Agriculture Industry
Budget: Central and local governments consolidated, 1960/61, est., (nT) millions)
Receipts :Sxpenditures of uhich, defense
Deficit
~ione',r Supply (June 30, 1961)
Outstanding Loans of All Banks (June 30, 1961)
13,886 sqP miles
11,416,000
NT;.~48, 743 million IIT::,52,582 million ~JT$4,411 or US$110 NT$4,758 or US$119
133 197
11,992 12,525 (5,306)
533
NT$6,426 million
IJT$10,675 million
Taipei -1101esale Price Lldex (June 1961j 1956· 100) 143
Balance of Paynents Ii;stimate, 1960 (US millions)
Exports of
Imports sugar
of uhich: U.S. aid imports
'i'rade balance Invisibles
Balance: goods ai1d services U.S. grants and loans Other donations and capital movements Net increase (-) in short-term assets
Official Gold and Foreign Exchange HQldings (net) (Decemuer 31, 1960)
166.3 ( 74.4) 253.4
( en. 7)
-97.1 -11.
-103.8 97.5 32.6
- 20.6

3umrrlary and Conclusions
1. Since the Chinese Government 1'Jithdre,'! from tie malnland to 'aiuan in Dec8i!lber 1:?h9, tile rate of econol.1ic progress in 'fai'.ran has
accelerated. In spite of the c::mtinui1:; ieavy defense burden and a popule.tion gro"Jth exceedin;:; 3/~ per year, a suosta..'1tial amount of ecollort1ic deve10pnent has taken place and national product has increased considerably faster than t:1e population. At the Salne time inflationary pressures, uhich Here very great a decade aZo, hc.:.ve been substantially reduced.
2. progress attributa'.Jle lar:.:;ely to t11e deterLlined efforts of the Chinese Government a.l.C~. people, sUP91ej,lented by a large U. S. program. It Has made possible 'oy the fact that a hiSh developr:le~1t hac~ alreaclsr l:::ee,1 reached prior to the return of the to C:1ina, a:la t:1is provided a ~;ood foundation :£'Qr t:1e development of the 1950 IS. Thus there Has already a dezree of literacy, 1ivell developed agricultural skills 2.:1d institutions, good trcl1sportatlon and pOlITer facil-
and the beginninGs of industry. l';oreover, the experienced Japanese ac1ninistrators aDd _"a1azers ';JhQ depal'tec!. il1 19l..!.5 uere replaced 'Ii thin a le1) years by ex)erience(:. Chinese from. t:;e r(!ainland.
3. recent years ap·::>roxirrrately 10,) of Gd? has i:lee~:1 utilized for defense, 80)0 for civilian consulilption and 105" has been saved. U.S. aid, averaging about ii.S •. ,90 million per year, excludinG military l,ard:uare items, has suppleHentec1. domes·Gic savings a1d made possiLlG tl'e financing :)f gross capital formation equivalent to about 17-18;1 of GiJP. Some 30~J to 40~; of total ililports have been covered the 2-id probrar,1.
to In the process of developilent the 10rTi18r agric\)ltur~l.l economy shifted tOl1ard 2. sei~i-industriali:?ied economy. ;.:,_gricultural output
risen fa.irly rapidly, but industri21 ex;x:msion has faster. As a result the contrJ."Dlltion of industr} to tot2.1 n8.t10n8.1 out)ut has risen to (;'(18 point Hhere it is nou approxir,lat r'ly to t:1e contribution of agriculture.
5. rrhe COITiposi tion of exports and ir.lports als;:, reflects t~le trGl1d to':T.s.rd inc1Gstrialization. Until about 1957 sugar and rice cccou!lted for sane 70;~ of exp::.>rt eaY.lings. 3ubsequentl/, ean1ings fell dve to a d2cline in the TTorld )rlCe for sugar anti. a d_ccline in .. :Jth price anc\ volUl11e of rice e::ports. In 1960 rice export.s virtually cee.secliJecc:mce of continued rJ_se in c.omes"liic cons,-'m:cyc,ion and ratl"er poor harvests in 1959 and 1960__'he decline in frJiH sug,')r aild exports ~!as 0':fS8C, hOl>T-ever, l.Jf a rapid increase in e;::;.:'orts of !,:'3nufacturcd articlss, led by cotton texc,iles, and in 1960 total eJC~)ort earnings;assed the peak.
6.~'here h8s bee;l a suostantial lnf'lation in Taiua:1 durtng the last decade. ~,'rolil the end of 19 jOi..o the e'1d of 1>,1]0 the lion8/ sUl)ply iacrec:ced tenfold aad ':holesa1e more threefold. l'11e eJ~chane;e rate for the >Te'>J 'l'ai-.:ran c:oll2.r chaJ1t;;ed frml 5 per 00 dollar to 40 per dollar. Hm"Jcver, the ini'lc.tio:1 has oee'1 much let,s severe recent1;y thall in t~·le earl:i_er years. rate increase in r,loc18f sloned cloun COi1sidcrably during

- ii -
t.he> 1950 1:;; thE: :.i.Ylcrease of about 9':'; per year in 1959 and 1>,60 in 'P2'Y':·j.(,1..c!1...Y'
T·'as much less than in previous The price level has Generally moved ::"u the Sdme direction 8.S the money sU'lply but has tended to increase at a slo1;ver rate. In 1959 and 1960, hOlt'ever, ~·!:ith a jump 0" more than 50;1, in rice prices, the general price level rose somE'l·!hat More t} an the l;JOney supply. dev'elopment Fas "lue in large part to a shortage of' foodstuffs, particularly rice, phich occurred follolJiW; serious floods in 1959 and three rathe r poor rice harvests. Hm~ever, a record rice crop "ras harvested in late 1960 and prices have since been practically stable.
7. The Government has stated its intention to achieve and maintain monetary stability and to achieve as rapid economic development as possible consistent vith this ~·021. It has also stJ.tea. that it intends to fol1m·; a policy of maintaining defense expenditures at a constant level so that their burden on the economy l!Jill gradually diminish as GNP increa3es. The Unit,ed States has agreed, providing the Chinese Government follmvs sound economic policies, to support a pro;:;ram to speed TaiFan's economic grouth.
8. In light of the above policies and the possibilities Cor conti-Ylued U.S. aid, and considering the actual achiever:ents oc the last 10 years, the prospects for the economy appear generally favorable. GNP should continue to increase at a rate 'Hell in excess of population groHth, and there should be a further increase in the re12tive importance of industry in the economy. EJ.:ports should continue to rise as r"pidly as in the past (average 4: to 5% per year), and this rr:aypermit a gra:1,l1al reriuction in the import surplus nOH financed by aid. It!ith a gradual decline in the defense burden, additional domestic resources should become available for investment, and the need for external aid to maintain an adequate rate of economic grouth should gradually diminish.
9. the above result could ,·:ell mnterialize, it is by no IT.eans assured since there are a number of uncertainties It!hich could have a substantial effect on future developments. '\s long as the present political and military situation exists, recurring crises could occur ana lead to intermi ttent periods of monetarJ and price instability. It is also conceivable that circm'1stances mi 7ht arise "lhich ",auld lead to an increase in milit~r;l outlays despite the Goverfr~ent's policy to avoid such an increase. Another uncertainty arises from the fact that a '3ubstantial amount of China's pre-Har and 1Jar-tiJne external debt not being serviced at present. Although it is unlikely that the burden of this debt lArill be borne by 'Tai1-mn, the possibility of reaching settlements leaves the future debt burden in doubt.
10. In conclusion, despite a very heavy defense burden, has made substantial progress du1'i111£; the last decade in reducing inflationary pressures and expanding national output; and it is rer:.csonable to assume that the G.)verrun.ent and people Hill continue striving tOHard a stable and viable econo:T.Y. H01-leVer, there is a considerable distance to go to aC!1ieve this goal with a number of uncert"cinties c:long the "ray.

THE ECONOl'lY OF TAT1tJAN ---------------------I. Introduction
l. Taiwan is a semi-tropical island situated about 100 miles off the south coast of mainland China" It is 240 miles long from north to south and about 85 miles at its greatest width. Mountain ranges with peaks exceeding 12,000 feet divide the rocky and rugged e~st coast from the fertile plains of the west.
2. The island was a province of China prior to 1895 when it was ceded to Japan at the end of the first Sino-Japanese ~·Jar. Fifty years later, at the end of Hcrld War II, it was returned to China, and in December 1949 it became the seat of government of the Republic of China when civil war forced withdrawal from the mainland. Since that time, although actual fighting has been limited, the Government has considered it necessary to maintain a high state of preparedness o Consequently, the Taiwan economy is carrying a heavy defense burden, even after allowing for the large UoS a military aid program. The last major military crisis was in August, 1958 when the mainland opened a massive artillery bombard~ ment of the "off-shore" islands.
3. With a population of over 11 million, the population density is 920 per square kilometer of arable land, or only slightly below that of such heavily populated countries as Jap9.I1, Switzerland and The Netherlands.. The natural rate of population growth, exceeding 3% per year, is also among the h.ighest in the \.)'orld. Of the total population some 80% are of Tahmn origin and 20~~ 'arc Chinese Chinese from the mainland.
!+~ During the Japanese rule, Taiwan was developed as a major producer of l'vod and raw material for Japan. Sugar and rice were the most important export items. An extensive system of railways and highways was constructed on the island. In addition, although the economy remained essentially agricultural, povler generating facilities and a number of industries were developed, particularly in the years just before and during 1rlorld \'Tar II. Among the larger indllstries vIere an aluminum plant and an oil refinery, both based on imported raw mat.erials.
5. Economic recovery was rather slow in the years immediately following 1rlorld 1;Jar lIe Recovery was hindered by shortages of equipment and materials to repair damaged industrial, power and transportation facil:i.ties, by the departure of Japanese administrators, managers and technicians, and by the disruption of trade 'li'rith Japano Inflationary pressures developed which were multiplied when the Central Government moved to Taiwan.
6, In spite of the heavY defense burden the pace of recovery quickened fol101.)"lng the arriva.l of t.he Central Gov,,' ;::'00 the sub's8guent econOlnic progress has been greater than ma.'1Y people expected. Hi th the help of substan'tial military and economic aid from the United States, national income has risen faster than population; and inflationary pressures, although not yet eliminated, .beve been considerably reduced. In the early 1950 1 s main emphasis 1-laS placed on agricultural developmento Since about 1953, however, while a strong agricultural. program has been reaintained, increasing stress haa been given to development of industry. As a result t.he former agricultural economy has shifted tOviard a semj~, industrialized economy in which agriculture and industry each contribute appro.iC.imately equal shares to the total national productQ

..
- 2 -
II. National Income and Production
7. Over the past decade the economy has been characterized l!;::.r a rate of real grouth substantially in excess of population, an import surplus financed by U.S. aid, and an proportion of national product originating in the industrial sector. In the five years from 1954 to 1959, G:1P increased at about 6.5;~ per year in real terms, and preliminary information jndicates that about the srulle rate ~Jas achieved in 1960. Per capita GNP has risen an average 3% per year and reached the equivalent of about US~110 in :!..959. In pre-lila::- days the :'ai\·mn economy 1-JaS characterized by an export surplus, and thus per capita availability of goods and serv-ices today reflects not only the groHth of GUP but also the change from export to import surplus. Despite a population increase of more than 80%, per capita G:JP in real terms vIas l3}'; higher than in 1937 but per capita total available product, ioe. Qi-.JP plus the net import of goods and services, had 42%. 7.he trends in national production and total available resources are indicated in the follo1:Jing table.
National Output and Total lable f(esources e/
1937 r.-'4 ;;1 :l 1956 1959~1 Gross National Product 11. 7 07 18<.9 21.1 25.9 plus: Net Imports of
Goods and Services - 1.4 0.8 1.6 1 .. 8 3.8
Total Available Product 10.3 16.5 20 .. 5 22.9 29 .. 7
Per Capita GlJP 2,067 1,810 2,016 2,099 2,31+0
Capita T'"W .H.J. 1,892 1,896 2,186 2.1 272 2,691
a/ In billions of 1952 ITT dollars, ex:cept for the per capita data vJhich are in 1952 NT dollars.
bl Preliminary.
8. Since 1952 output in the agricultural sector has increased at the rapid rate of about 5/s per annum. hanuiacturing output has, h01'trever, increased at about 12;~, and thus agriculture's contribution to national income declined from 357.> in 1952 to 30~~ in 1959 \1hile industry's rose from 22/~ to 28%. Goverru"ent' s including defense, has rema:L'1ed a.t about 12;; ..
9. A major land reform carried out betvJeen 1950 and IS'53 resulted in 85~; of privately O1·med cultivated land being olmed by the tillers and provided the incentive for increased production frou. reGources lfJhich had been vJell utilized before ~!orld;~ar II. '1.1here lIas SOT,le slovJing dOl:1n in the rate of grouth in 1959 and 1960, but this Has due in large part to poor weather and other tempor&ry factors.

..
- 3
;~J.i::':lough t::e:1 e Gas been no net addition to the <,rea of J.·":.l~] e crop production has increased about 4% a year since 1952.
mult.icropping practices, improved and increased use of fertilizer resulted in yields ia excess ;)f pre-~Jar peaks, and tot2,1 production
of almost all i\'Tlportant cro;?s - sUGar is an excep~:'ion - is nO~J ly above pre-1mr levels. Ihce, Taiuan's most important crop, has increased at an average rate of aL~ost 3~ 1950's, reaching 1.9 million tons in 1960. \;lith domestic consumption increasing more than 50,000 tons a year, honever, the groHth has not sufficient to permit maintenance of exports. AlthouGh Tailfan exported 180,000 tons of rice in 1958, over half of this carne from government stocks, and. after three poor harvests
1959 and 1960, 'rahran became a net importer of rice. A second crop in 1960 has jmproved the situation. 0uGar production in
Has 30):; ~JeloH the 1939 level significant i.'11provements in , but at 966,000 metric tons Has adequate to meet dOlnestic cons·;J.:m~:::tj.:on
and permit exports at the quota authorized by the Inter!1ational Agreement and the United States.
11. Fl'om 1952 to 1')60 production increased at an averaGe of per year, and the total catch of about 2uO,800 tons in 1960 uas more
than tU'ice the pre-Har peak. Development of pond, coastal and have all contributed to favorable result. The grovrth in tilnb2:i'
production has averaged about year since 1952 and the pre-l·rar peak was passed in 1958. H01rever, t!le fact that 55% of is covered by forests, the rate of has remained beloH expectatio':f. iurong the rea80n5 for this poor sho"Jing are (1) many of's timber varieties are not T-Jell krwlm, (2) exploitat~on is relatively expensive because of unfavorable terrain al"d (3) f;overnr:ent interference and admin-
red tape have at tilrles obstacles. Livestoci{ production has increased at only about 3% per year in recent :rears. Hm:ever, hog production has risen rapidly enough to provide a gro':ing export
Industry ... 12~ The grovrth of the industrial sector has been characterized by the rapid grmJth of p?:'ivate manufacturing, the increasing importance of the export market, and the increasing diversification in manufact'l1ring.a Industry consists mainly 01 small-scale private enterprises, but the Government still controls the relatively fell larger jndustries l"Jh:ich it inherited from the Japanese. The Government's share of industrial production has declined from to 40% of gross output, but the Government still remains the dominant producer in public ,. utili ties . fertilizer, petroleum refining, alumim.un, centrifugal sugar, foresil'Y, and metal mining~
13" Post-war rehabilitation of industry \'las cOllpleted by 1953, and since then the index of industrial production - including manufacturing, mining, building construction and public utilities - has increased at an average rate of over 10% per annum~ Anong the existing industries reeistering substantial increases in production have been cotton textiles, fertilizers, refined petroleum products, pl;;,7itTood, paper, cement c8l1..'1ed pineapple and vrheat flour. Among the nevr undertakings started jn recent years have been the manufacture of plate glass, electrical products) po:~rvinyl chloride (PVC) plastic, rayon filament, alumin'lJll foil 3r.O. aJs2xbly of mot.or vehicl(.s~

- 4 -
1~. ':!:'his :pI'egress has been based upon a literate, hard-wor-kir~ a:rc1 d:iapt-a'')le lCl.bor force, encouraged by government policies Hhich have become il1cre3.sir:e·· ly favorable to private investment. A gro.dng domestic Ir.arket and improved opportunities for export have encouraged entrepreneurs. Government measures to eacourage industr'J have included the expansion of the infrastructure, the adjustment of economic controls, and the providilLg of tax incentives" FiJ.1811ce on reasonable terms continues to be a principal handicap despite lCA loans under a small industry loan program and the establishment in 1959 of the China Development Corporation to provide medium-term financing.
Hining
15. Taiwan is not uell-endoued uith proven mineral resources.. There are deposits of coal, sulphur, pyrites, copper, gold, mica, talc, salt, and petrolet'u-. and natural gas. Except for coal and sulphur, hOvlever, proven reserves are limited. Hith production of 3.5 million tons in 1960, coal alone acco-..ll1ted for 80% of gross value of the mining sector.
Electric POi-Ier
l6~ Electric pmver production in Tai \lan has increazed from 1.1420 million blh in 1952 to .3,600 million in 1960, an average annual growth of l2.5;b T,Jhich has provided Tahran with a per capita production second only to that of Japan in the Far East. Sales have increased at an average rate of 14.5;-:; per annum during the past four years, reaching .3,100 million blh in 1960. The governl1lsnto'lrmed Tai-t..ran PO't-Jer Corporation operates a fully integrated system of 27 hydro aGd 10 thermal pouer stations ldth installed capacity of 709,000 ktfo The 1960 peak load of 63.3,000 kH Has some 3! times the highest pre-war peak. Expansion of generating capacity has kept pace with the most essential needs, although pOl'ler still can be supplied to some customers only on an interruptible basis during the Hinter dry season, and there are a nlL'TIber of industrial establishments 1ilhich cannot be served at all by the P01.-Jer Corporation.
'I'ransport and Communications
17. The transport sector contributes some 6;; of GNP. From 1952 to 1960 freight traffic increased at an annual rate of 6.5;~ by rail and 17~~ by highlfay" Hovrever, despite the more rapid increase in highuay traffic, railvray traffic in 1960 uas still some seven times as large as the highvray freight traffic. Raihi.:;:: service has improved vJith procurement of 52 diesels, nev1 passenger cars and freight cars, replacement of rails and installation of automatic blocl\: signallin;~ Hight-ray development has included completion of a trans-island highvray to link the relati\rely underdeveloped east coast \-dth the 'l:Jestern p2.rt of the island. Except for shipments from the east coast, it is difficult for coastal shi.pping to compete Hith inland transport mainly because of the relatively short hauls and transshipment charges. The groVlth in tonnages handled by the main harbors of Kaohsiung and Keelung from 4 .. 5 million tons in 1956 to 6~3 million tons in 1960 Has due largely to the grovrth in foreign trade.
18. The Chinese brought from the mainland a considerable shipping fleet, but the scrappj.ng of 145,000 d1-rt of over-aged ships in 1958 and 1959 left only 40 ocean going vessels totalling 345,OCO dwt still operable by mid-1960; of t.hese only four VIere less than four years old.. The average age of the 25,000 dwt 0:;: coastal and near-sea going vessels is more tban 20 years 0
III. Internal ~inance
Government Budget
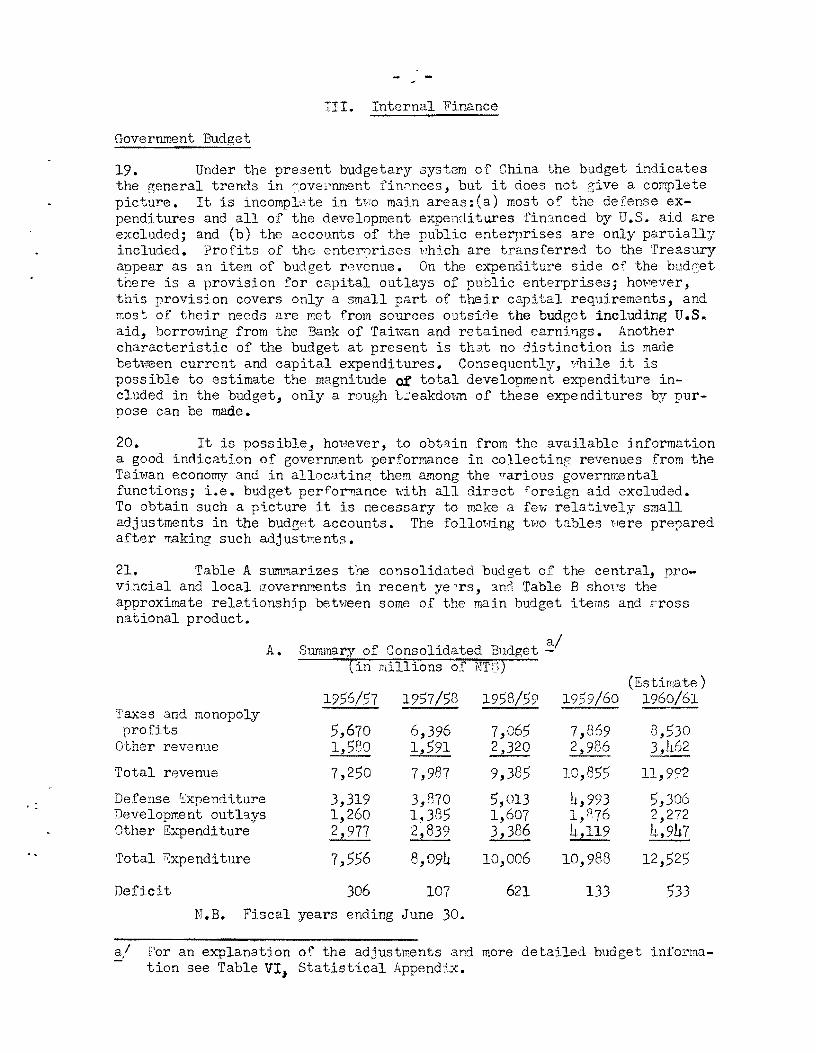
19. Under the present budgetary system of China the budget indicates the general trends in ~ovel'nment fin:->nces, but it does not e;ive a complete picture. It is incompl"ote in tvo main areas:(a) most of the defense expendi tures and all of the development expenclitures fin'mced by U.S. aid are excluded; and (b) the accounts of the public enterprises are only partially included. Profits of the enterprises v:hich are transferred to the Treasury aupear as an item of budget r<2venue. On the expenditure side of' the budc;et there is a provision for capital outlays of public enterprises; h01·rever, this provision covers only a small part of their capital requirements, and most of their needs are met from sources outside the budget including U.S~ aid, borrol-ring from the 13ank of Taii-ran and retained earnil1gs. Another characteristic of the budget at present is that no distinction is made between current and capital expenditures. Consequently, Fhile it is possible to estimate the magnitude of total development expenditure included in the budget, only a rough L.::eakdmm of these expenditures by purpose can be made.
20. It is poss ibIe, hOl-Jever, to obtain from the available information a good indication of government performance in collectin~ revenues from the TahJan economy and in allocating them among the "arious governn:ental functions; i.e. budget performance with all direct foreign aid excluded. To obtain such a pi.cture it is necessary to mc.;,ke a fevJ relatively small adjustments in the budget accounts. The folloHing tHO tables Fere prepared after ~aking such adjustments.
21. Table A summarizes the consolidated budget of the central, pro-vincial and local G:overnments in recent ye 'rs, :lnrl Table B Sh01:S the approximate relationship betvJeen some of the main budget items and [TOSS national product.
A. Summary of Consolidated Budget !::,/ ( in mi.llions of NT:::;)
(Estimate) 1956/57 1957/58 1958/59 1959/60 1960/61
Taxes and monopoly profits 5,670 6,396 7,065 7,869 8,530
Other revenue 1,580 1,591 2,320 2,9e.6 3,462
Total r8venue 7,250 7,987 9,385 10 SSS , , 11,992
Defense ~xpenditure 3,319 3,870 5,013 4,993 5,306 Development outl~ys 1,260 1.385 1,607 1,P76 2,272 Other EApenditure 2,977 2~839 3,386 4,119 4,947
Total "Sxpenditure 7,556 8,094 10,006 10,988 12,525
Deficit 306 107 621 133 533 N.B. Fiscal years ending June 30.
~./ For an explanation 0<: the adjustments and more detailed budget infol"Tnntion see Table VI, Statistical Appendix.

I
- 6
B4 RCitio of Selected Budget Items to GilP (PercentaGes)
Tax and LOl1opoly Profits Total Revenue
Defense:;xpenditure Dcv310pment Outlays
1956L57
16 21
9 4
1957/5~ 1958/59
16 16 20 21
10 11 3 4
14 20
9 3
e7 'l'he 1959/60 G'? data are provisional and may be too high; as a consequence the ratios ShOW.1 for that year may be too 10H.
22. Doth reVGnues and expenditures ~1ave risen quite rapidly - approx-imately at the same rat,e as Gl'JP in current prices. Although dei'icits have been incurred in each year, they have been relatively small, ranginG bet1'reen about l~S (in 1957/58) a.id 6;; (in 1958/59) of total expenditures.
23. '1:'he ratios to GiJP of total revenue "LId tax revei1Ue (includlng the profits from the Hine, tobacco and salt r,lOnopolies VJhic~1 are similar in effect to indirect taxes) compare favorably Hith stmilar ratios in other countries, and they indicate ti1at tile Government has illade an effective effort to obtain a reasonable proportion of the national re3011rces for its O':!l1 needs. On the other hand, the ratio of defense expenditures to G,JP (avera;::;ing about 101~) compares very unfavorauly c:rith that in other countries. There are very feVI countries uhich carry a defense burden of this magnitudeo Lmon.~ t.le underdeveloped countries the tjpicd ratio is 5;; or less. In connection with China's defense burden, it should also be notE:d that the budget figures probably understate the 1'08.1 position, 0ecause a munGer of goods and services (such as rice su~)plies 8 .• 1d railFay transportation) have been supplied to the armed f0rces at less t1-12;1 cost. Beginning in the current fiscal year this practice is supposed to be abolished. ~lso at the beginning of the current year a pay increase Has granted to both the armed forces and the civil service. The pay r2.ise, although it uas probably Hell justified in viev! of the rise in the Drice level in recent years, has increased t~le defense burden.
24. The pay raise is primarily responsible for the expected increase in the budget deficit in 1900/61. Lnother contriD-ctlng factJr is the granting of substantial tax ince.ltives to private investors in order to encourage industrial developi>le:lt. It has been est:Lilated by the r'Iinister of Finance that about three years uill be required for revenues to gro--;·J sufficiently to offset these factors.
Government Cash Position
25.. The cash position of t~1e Govermlent, as reflected in the accounts of the banking system, is considerably different from the position shmm in the ~Jt.dget accounts. '1here are ti1ree main reasons for this difference:
(a) TM budget accou:1ts include accrued revenues and expenditures as Hell as cash transactions.

- 7 -
(b) Actual expsD.di ture by t.he various Fiinistrie s dues 1.to::' (:th71.YS
coincide uith the drauing d01m of their budget appro:)l'iatior~e Thus the ministries may dratf dOi'Jl1 their appropriations, 1\1hich are thus reflected as an expenditure in the budget. accounts, but fail to spend the entire amount. The ullspent balances are deposited in bank accounts separate fro:m the General Treasury balances. At other times the ministries, by dralling on ti:1ese separate bank accounts, may spend more than is indicated in the budget accounts.
(c) loans and deposits of the public enterprises are reflected in the accounts of the banking system, but cio not appear in the budget accounts. The public enterprises have had over-all cash deficits ranging from I'IT$200 million to nT$300 million in recent years.
26, As indicated i~l the follouing table the general goverm,lent finances have sho~m suings betvJeen fairly modest surpluses and deficits. If the deficitf of the government enterprises are included, hOl,iever, there has been an over-aLi deficit in each fiscal year.
Estimated Government Cash Position (in millions of NT$)
1st half 1st p~,lf 1956/57 1957/58 1958/59 1959/60 1959/60 1960/61
General Government Changes in: Treas. deposits -18 -2 33.3 49 -191 -358 Deposits of Gov't agencies 358 10 -64 / 363 168 8 Less: Bank borr01ungs 336 250§:/ 435~ 238 138 484 A. Surplus (+ ) or deficit (-) +4 -242 -166 +174 -161 -834
Public ~,terprises Changes in: Deposits 89 95 97 109 95 -:) '7"1 --,,-I.. Less: Bank borrouings 338 397 306 376 494 £93
E. Deficit (- ) -249 -302 -209 -267 -399 -322
c. Over-all Deficit (A + B) -245 -544 -375 -93 -560 ... 1,156
§.7 In the above table government borrmJing from the banldng system has been adjusted upHard by ;'JT$221 million in FY 1958 and HT$425 million in FY 1959 to cor,lpensate for the use of the bookkeeping profits resulting from t'VJO official devaluations of the NeH Tahran Dollar.
27.. The sharp increase indicated above in the cash deficit in the first half of 1960/61 is mainly a reflection of the recent decisions to adjust pay scales and grant tax relief. The pay adjustment alone is 8stlinated to cost NT$ 1 .. 4 billion in the year 1960/61. The monetary implications of the large increase in the cash deficit are discussed below (see paragraph 35)0

. I
- 8 -
l'ioney and ~'rices
28.. Inflation has been almost continuous in Taivran since 1949, although it has been much less severe in recent years. In 1950, the first year follm;ring the move of the Central Government to TahJan, the money supply doubled and the index of 'Vlholesale prices quadrupled. In the period from 1954 to 1958 money supply increased at an average rate of 25:: per ~rear and Hholesale prices at about per year. In the last two years (1959-60) the increase in money supply averaged about 9j; and the average increase in wholesale prices \.-las about 12~~. I'Iearn'lhile, ir:terest rate charged by corrnnercial banks for secured loans repaya.ble I·ri thin one year, has come down from 8. h% month at the end of 1949 t@ 1 .. 35;; per l,onth :?t present.. The e:.::cI1angG ra'ce ror tlle .:e~r 'i'ai~T3.n dollar has changed from 5 per u.s. dollar in late 1949 to 40 per u.s. dollar at present.
29. Credit expansion to both the public and private sectors has been the factor primarily responsible for the rapid increase in money supply. In the 1950 l s credit to public sector increased more rapidly than that to the private sector. more recent years the o~posite has tended to prevail.
30. For a short period in 1957-1958 the inflation came almost to a halt. Hainly because of a reduced rate of credit expansion the gro"\·rth in money supply in 1957 fell below 20% for the first time since 1950, and in the first half of 1958 the money supply increased by only 3%. At the same time there was an ample supply of goods available in the market. Domestic supplies wer2 adequate and ;'lith the help of U.S. aid, imported goods - machinery, ral\T materials and consumer goods -1-Jere in fairly good supply. f1eamlhile domestic manufacturing capacity in some lines, such as cotton textiles, had been expanded beyond the needs of the domestic market and difficulties Nere being experienced in competing in export markets. In these circumstances the price level becar.le practically stable during 1957 and the first half of 1958, and domestic traders and industrialists 1rrhose costs and operations 'Here geared to inflation found themselves in financial difficulties. Consequently the number of business failUres incre8,sed, Hith the result that private money lenders lost confidence in t':1e market and transferred a substantio.l a..'11ol1nt of funds to deposits VIith corrmercial banks.
31. \lith a Vie1rl to retaining the deposits transferred from the free market and attractirlg additional funds, the Bank of Taivran and the con!le:~c:'...al
banks subsequently established a system of savings accounts on which interest rates for one, t"JO and three year deposits were set respectively at 1.42%, 1.58% and 1. 75~b per month (a compound rate of approximately 19%, 21%, and 23;~ per year). This policy appears to have been successful as indicated by ~he contL~ued rapid increase in time and savings deposits uhich has tnken place.
, .
- 9 -
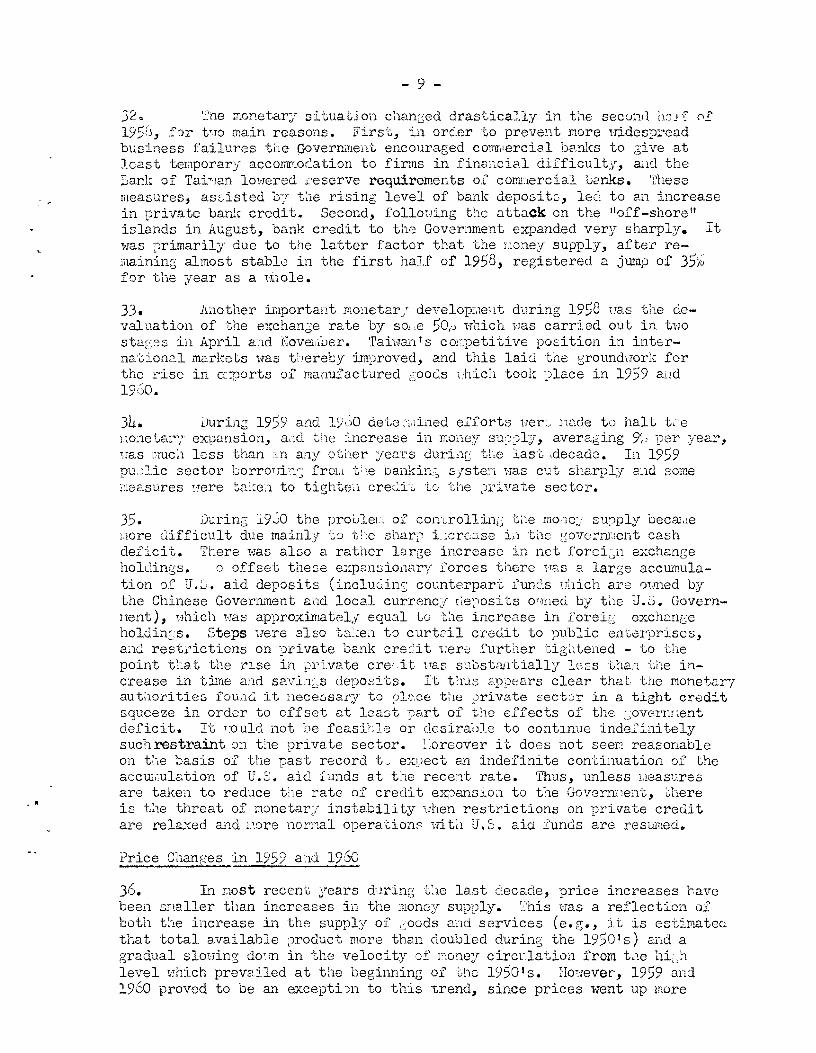
32Q ?ne .:noT"et.ar;'l situation chanESed drastically in the secul'lll h::J f ("If 195rj, f')r t~ro main reasons. First, in order to preve:1t more lJidesp:.'ead business failures tile OOvern,llent encourar:;ed comr,lercial !).:mks to ~~ive at least tenporary accomr'1o(~ation to firms in finaj:Lcia.l difficulty, a111 the :Sanl~ of Tai'lan lm·Jerecl reserve requirements of comnercial ba,nks. '1'hes(3 measures, as[isted b7 tile rising level of ba'lk deposit"" lec~ to an increase in private banl~ credit. Second, follo'Ping the attack on the "off-shore" islands in August, bank credit to tl1G Government expanded very sharply. It vIas ~')rimarily due to the latter factor tl1at the r::o'1.ey supply, after relilaining almost sta.b10 in the first half of 1958, registered a jump of 35/'"' for the year as a lJbole.
33. Ai10ther important monetar/ develop;,lent during 1958 \Tas the de-valuation of the exchan6e rate by SOlle 50/) ,·rhich uas carried out in t'JJO sta;::;3s in April a-,1d HOVel.ib8r. Tail-Jan's cor~.petitive position in interna'cion2.l me.rkets was tbereby im~lroved, and this laid the grounduork for the rise in e::ports of manufactured gooG.s t!hich took :llace in 1959 alld 19'~0.
34. Jurinb 1959 and 1900 dete":'i,',ined efforts ver:.- r,1ade to halt t,ce l,:oi1eta17 expansion, a,1d the increase in m0l1e3' su):)ly, averaging 9~) per year, ,ras mucil less than :in any other yem"s durii1[;; tl~,e last ,decade. In 1959 pu,)lic sector borroT;Ll:~ frOl,l t: ,elJai1.kin;; s {stec':l Has cut sharply a~1d some ineasures ~rere tal~(n to tightei.l creG.iG to the )l'ivate sector.
35. During :1.900 the proulel,-, of con'Lrolling t;le mow:· supply beCal,le I>lOre difficult due mainly t:::J t~le shari) i:lcreo.se i~l tile g':)verru~Jei1.t cash deficit. There Has also a rather large increase in net i'orci':'ll exchange holdings. 0 offset these expc::.n:.:;ionary forces there vas a large accumulation of U.S. aid deposits (incluclinS counterpart" func1s uhich are ouned by the Chinese Government B.l'ld local currency Lle:")osi ts o1med t;le U . .s. Govern-ment), lJhich "JaS approximately equal to t:le increase in l'oreig exchange holdi~1:':s. Steps Here also ta:~el1 to curt2il credit to public enterprises, a~1d rest:cictions on l)rivate bank cre::.~i t iJere further tig~1tened - to the point e:at the rlse in private cre,._it uas substantially less than tl:e increase in time and s<:'.vin;:,s deposi.ts. It thus E,ppears clear that the monetarr autl1oritie::. fOli:ld it. nece::,sary to the ~Jrivate sect::;r in a tight credit squeeze in order to offset B.t least ~Jd.rt of the effects of the :~ov8rnr:ent deficit. It T;ould not be feasE:,l,,;;; or desirable to continue indefinitely such restraint em the private sector. Loreover it does not Beein reasonable on the '!:lasis of the past record t~ expect an. indefinite continuation of the acclL,',ulation of U. S. aid funds at the recent rate. Thus, unless l.leasures are taken to reduce t:le rate of crec1i t expanS:LOl1 to the Govern:1ent, ~here is t~1e threat of m::metar;r instability i:Then restrictions on private credit are relB.xed and nore nOrY'1al operation:::: In til U. S. aid funds are resumed ..
Price Chant;es in 1959 an,d 1960
36. In I.10St recent years during t:1e last decade, price increases have been SIilaller than increases in the money supply. 't'his lIaS a reflection of both the increase in the supply of ;:oods 2.11d services (e.g., it estimated that total available ~)roduct more than doubled durine; the 1950' s) aiid a gradual slotTing dOem in the velocity <)1' ;,:.oney circrlation from t~ .. e hi~)h level 1.:hich prevaHed at the beginning of t.he 1950' s. Ho~'mver', 1959 and 1960 proved to be an excepti)n to this trend, since prices went up lnore

. ,
- 10 -
-rapidly t1::an t:1e money supply. Although prices of most goods S:lC1ie'~ 1;)::;1,13
i.ncre.8se during this perioU., food prices rose more sharply than IIlOSt Oti18J.~
;,Jrices. Since the ,\1hole8ale and retail price indexes are heavily 1rJeighted by the food prices, both indexes reGistered ratller l<:rGe increases in 1959 and 1900. The follol:ring table compares tne percentage increase in the money supply and 'Jholesale and consumer prices durinG 1959 &'1d 19~0.
Ilone~r 3upply ilfuolesale Prices Consumer Prices General Food General Food"
Index Index Index Indez - -1959 +9 +11 +13 +11 +ll 1960 +10 +14 +21 +18 +24
37. Part of the price increases, particularly in 1959, "Taa prooably the result of the If'.rge rise 05%) in money supply l:rhich occured in 1958; part of the increase also t'Tas due to the increased locel currencJ cost cd imported c,oods resulting from the 1958 devaluation. HOH8ver, supply shortages of all impo:ctallt food items - including rice, s~N'eet pO"Gatoes, meat, poultry, eggs and fish - uere reported after the J.ugust 1959 typhoon and floods. Probably due in larGe part to the floods, a rather small rice crop ,las harvested in the f811 of 1959. This 1.-JaS follmJecl "uy another rather poor crop in -!':'he sprin~ of 1960 (reportedly due to drought). The situation \:Jas <l£,gravated by continued rice exports during 1959 and early 1900. .\s a result, t.~le first serious rice sllOrtabe in recent years developed and prices increased sharply. In the latter part of 1960 some rice VIas :i.mported ai1d the rice crop ilarvested in t::e fall of 1960 HGS reported to be 2. record high. rLesponcing to tile improved supply situation, the price indexes leveled off in Septem;..;er-October 1960 and have remained fairly st/eady since then •

, r
... 11 ..
IV. External Finance
38. TahJan's foreign trade expanded fairly rapidly from 1950 through 1957. Foll01ring a dip in 1953 and 1959 it recovered to a neH high in 1960. The average rate of grouth from the early 1950 l s to 19'5O has been about 4.5% for exports and 4.0% for imports. ~he trade deficit has averaged about ;;80 million. HOHever, U.S. aid has financed some 40;; of total imports, and this has been more than sufficient to cover the deficit.
Tailvan t s Foreign Trade (millions of U.S.~~)
1952 1953 1956 1957 1958 1959 1960 -EJ...rports 120 130 130 168 164 160 170 Imports 207 191 228 252 238 244 252 Balance -87 -61 -98 -84 -73 -84 -82 u. ,;. aid imports 89 84 96 99 87 73 91 d /CJ of total
imports 43 44 42 37 39 30 36
39.. The pattern of exports remained quite constant throuGh 1957, vlith agricultural products accounting for some 90% of the total. Sugar, l.\::.i'Han IS
leading export, and rice together provided 68-78~~ of all export earnings in this period, "ltrhile gains in c~:ch oth8r crops as tea, ba..""1anas, ar'ld pineapples helped maintain ag;riculture's total share. 'The gener~l patterl1 changed radically after 1957. .lith sugar anl~ rice prices declining and "Ji th the virtual cessation of rice export5 in 1900, their share of export earnings fell to 46% in the latter year. These losses uere offset by textile exports, uhich increased from ,;,J million in 1957 to ",21 million in 1960, and lIother" industrial products Hhich rose from ::,8 million to ,,)25 million.
40. TahJan 1 s sugar exports are detennined primarily by quotas assigned by the International Sugar Agreement. In addition Tahvan has been assigned a small annual quota - 3,600 metric tons - for export to the United States market. ,~xcept in 1959 ':i:'aivJan 1 s adjusted quotas have been in e~~cess of 750,,000 tons. Due to the uncertainties of the Horld sugar situation and United States policy, the final ISA quota for 1961 has not as yet been set, but 'L'aiuan I s adjusted quota is nO"t'1 nearly 619, 000 tons. i'ahmn t s regular quota for the U.S. marlcet has for 1961 been supplemented by a special authorization of some 170,000 tons, but future levels uill depend upon the neH U.S. sugar policy still in t:1e stages of preliminary debate. harkets for 'i'aiuan sugar have been subject to considerable annual change, and her dependence on the Japanese narket appears to have declilled sOIr1evrhat, although Japan still took nearly 50% of the total in 1959. Iran, Halaya and Iraq purchased over 50,000 tons each in the first ten months of 1900.
41. The composition of imports has changed si~nificantly since 1952. Imports of consumer [:;oods have declined from 50;~ to 30% of total imports, vJhile the relative importance of rae'J materials and Cai)ital ~oods has increased. The increase in the latter has been especially marked since 1957, rising from 315~ to 42i;. Since 1957 tile total value of U.S. aid imports has been substantially less than the value of l'ahran t s capital goods imports.

• I
- 12 -
42.. Japan is Tahran t s principal trading part'1"3r, accountiuc; for 5=>me 45% of her e)"-ports a_,d 50;; of non-aid imports. 2ighty percent of aid :L"llports have originated in the United States. increase in Tahran I s textile and handicraft exports uas primarily responsible for exports to the United States· reaching ',:i20 million in 1960 compared to :,15 r.lillion in 1959 and;~5.3 million in 1957. Tail'Jan has continued to maintain her only bilateral payments agreement uith Japan, althouGh a neu treaty ca.lls for its termination in September 1961 and settle;.:ent of outstanclin~ balances by Larch 1962. '.i'he payment agreements provided for a svung balance of US$lO million, but the balance vJas perrnitted to reach $32 million in favor of Japan at the end of 1959. China's trade surplus in 1960 plus a $9 million cash payment reduced the outstanding balaDce to $14 million at the end of 1960.
43. Substantial progress has been made in liberalizing trade and exchange controls during the last three years. An exchange reform tvas carried out in 1958 and this was supported by appropriate credit policies. It then became possible to ease direct import controls. ~~ecent policies have also encouraged exports.l'he 1958 exchange rate adjustment vIas one of the primary factors in the recent increase in exports of manufactured products. Other measures have included reduced interest rates for export credit, tax incentives and government market promotion.
44. From the inception of the neF 'l'c.iuan cmrency in 1949 to ti:e exchange reform of 1958, TahJan t s foreign exc hange situation 1:Jas characterized by frequent but often inadequate official devaluations coupled ,11th development of an ad hoc complex of multiple rates. In ~Jovember 1958 an official rate of NT$36.08 \Jas established. Subsequently, houever, the official rate became nominal, since all transactions Here condu.cted at t,he mar1<:et rate, t..rhich has been stable at about i·IT$40 per U.S. dollar since early 1950. Effective June 1, 1961, the official rate uas changed to ~\rT$40 per U.S. dollar.
45. Typically, Taiuants trade deficit has been increased by a deficit on invisibles, and the total deficit on goods and services account has varied betueen ~~80 and $130 million. Receipts from dOi1ations, exclusive of U.S. aid, rose from insignificance in the early 1950 ' s to $14 million by 1958. Private capital imports also rose in 1958. r1'he remaining deficit nas, over the decade, more than covered by U.S. grants and loans of betueen $85 to $98 million per annum, although in 1954, 1956 and 1959 small deficits remained.
Goods and services
Summary Balance of' Payments (millions of U.S. dollars)
1952 1953 1957 1958
-100 -81 -96 -125 Ilisc. dg;ations and capital 5 14 6 52 Balanceb -92 ::t;tr -92 ""':b6 U.S. loans and grants 94 85 97 88 lJet monetary movements
(increase - ) -2 -17 -5 -22
a7 Estimate. y Including errors and omissions.
1959
-123 23
-100 86
13
1960~/ --109
33 -77
98
-22

- 13 -
h6. i 'aj.nJy as ti18 resu:::.t of U.S. aid financing in excess of the deficit on !;oods and services account" gros~ holdings of [;old and foxeign ex~hange doubled bet1rJeen 1952 and 1960" from US\~75 million to US:.,152 millL'lL At the same time, hOtvever, the foreign lialJilities of the Bank of Tah/an increased someHhat, due mainly to the shift in the balance of the ChinaJapai1 payments agreement. Consequently, the net gold and foreign excbange reserves showed a somewhat smaller absolute increase from US .)51 million to US,illl million.

- 14 -
v. Economic Planning
The First Tuo Four-Year Plans
47. The magnitude of the problems confro!1ting the National Govermnent after the evacuation of the mainland, the need to prepare an investment p:L'ogram for purposes of requestL~g U.S. aid, and the necessity 01 coordinating projects within sectors necessitated the formulation of development plans. These plru1s have been, hot-v-ever, of rather limited scope, and coordination as among the various sectors has been rather "reak. Hevertheless, in viell of the growth in GNP at an average rate of 6% to 7% over the last several years, it may be concluded that government development policies on the 1-1hole have been sound.
48. From 1949 to 1953 the Central Government stressed agricultural re-form, 1Jith the Sino-American Joint COlamission for Rural Reconstruction leading a vigorous and comprehensive progran to increase agricultural production, including the all important land reform. Concurrently rehabilitation of existing plant 'VJaS also undertaken and the stage thus set for the first four-year plan, 1953-56, the declared purpose of which Has to maintain a high rate of 6rovJth 1'lhile improving the budgetary situation and decreasing dependence on U.S. aid. The plan was in fact little more than a collection of priority projects and an assignment of investment funds betueen agriculture, 1"1hic11 received 30%, and industry, ""1hich received 70;~. In effect this reflected a decision to push agricultural production as fast as technological improvements 11Duld alloll, short of heavy investment in co stly irrigation schemes. The balance of available investment funds and, therefore, the Plan's enphasis Has assigned to industry. The second plan" 1957-60, continued t~'1is emphasis, vD. th 76% of comparable investment funds assigned to industry. The scope of the second plan 't"laS broadened, hot-rever, to include the transportation sector and to make allowance for investment in public works, @ducational and health institutions, arn housing not covered under the major headL1gs.
49. Comparison of actual results with original targets is not too meaning-ful. The plan targets 1-Jere changed ye<:'.r ly, usually after the budget for the fiscal year had been pronulgated. The targets as revised thus tend to be little more than statements of short-run eJ~ectations. 11 The Accelerated GroHth Program
SO. Early in 1960 and in anticipation of the formulation of a neu ':-our-year plan, the United States announced that, providing the Government of China undertook to folloirT suitable economic policies, the United States lTould support her effort to achieve "accelerated growth. II The Chinese Government drew up a1d the U.S. accepted a progran of 19 points to form the basis of an acceptable economic policy. The basic economic policies outlined in the 1119 poL'1ts" may be divided ll1tO four groups - economic development, budget improvement, baru(ir,g reform, and foreign trade. Essential to the achievement of rapid grol~h of the four-year plan are those points facilitating a higher rate of private domestic saving and those attempting to hold military expenditures at the current absolute level. (The 1119 points II are lis ted in the Annex).
rl In Table XVII a comparison of targets and results has, houever, been provid8d,

- 15 -
51. After agreement on the tl19 points" the Chinese Governrl1ent ci.l'alted its third. four-year plan, 1961-64, to implement the accelerated grouth progr5,;"11 and to provide a basis for estimat"ing the level of foreign aid. required to reach and m~;dntain a planned 0;; rate of G~jP grouth ..
52.. The third four-year plan calls for a total investment in terms of 1959 prices of NTCi49 billion compared to l'lT(;i35 billion of the previous feur-year plan. This implies an increase in the average rate of investment from sone 177~ to more than 20~~ of GNP, or, given the Plan's assumed rate of fo:::eign aid, an increase in domestic savings from approximately 10% in 1960 to an average of J,::~ of GNP during the ne"r plan period. The sources of finance for the pla:'1 would be 30% private, 29% government and 41/~ foreign aid, 1Jhich are aJJnost the same proportions as in the second pla'1. The nelT plan calls for U.S. financing of general commodity imports, ioe., non-project aid, to remain at about usU60 million per year, ar.d for project assistance Of.:i70 million, an increase of about US':)40 million over recent levels.
53. The projected rate of grm·Jth for agriculture of 5.4% is someuhat higher than the grmfth during the last plan period. It is based upon ~.:;,he
success of recent experimentation uith neu and the cont~llUed development of other cOimHercial crops, the exploitatbn of "narginal" foothill land especially for livestock, and a more rapid development of water resources.
54.. Of the total investment of :jT~;23 billion :mdustry, 55% has been allocated to manufa8turing, 40% to pouer and 6% to mining. The bulk of investment in manufacturing, intended to pernit a 16>; rate of br01·Jth, is to come from the private sector. The plan emphasizes ci.evelopment of categories of industry - those using Taiuan raIl materials, e.g., sugar, l)ineapple, petrochemicals; those processing :linported rmr nate rial for e.:qlort, e.g., plYl-IOod, tm ... -tiles, and pharmaceuticals; and service industries, including pOlIer, coal, metals, and machinery. Projection in this sector is difficult, because the Go'vernment is depending largely on private investment. The plan targets, therefore, are based on such factors as past perfoIT.lance and the best estimate Hhich the authorities can make regarding the effects of recent or planned changes in government policies, probab le further improvements in technolog~l a.'1d management, etc. In pOl"Ter, demand forecasts project a grOlrth in sales of 14% - sliGhtly less than over the past decade - and installed c apaci ty is scheduled to reach 1,250 thousaYld kilo'Hatts with a generatint:; capacity of 7,180 million kuh. These developments uill require expansion of both the pri.rnary transmission system and the secondary transmission and distribution systen.
55. The over-all priorities for the third plan 'Here set by the cabinet and are being supervised b;{ the 11inistr"J of 2conomic Affairs a..'1d the Council for U.S. Aid (CUSA).. Nevertheless, formal planning coordination among sectors is still lacking, although ui thin the three maj or sectors - agriculture, transportation, ru1d i...'1dustry - priority determination has improved considerably. Thus, the third plan continues the pattern of its predecessors and remains, in effect, a series of sector and project plans rather than a slngle COI.lP1'8-
hensive economic plan.
..
--16 -
VI. Economic Prospects
56. During the past decade notellorthy progress has been made in 'l'aiuan in increasing agricultural and industrial production and in reducing inflation during a period of po Ii tical and military uncertainty. HOlr!ever, uhile progress has been substantial, the country is still facing t'HO basic problems Hhich it vlaS facing ten years ago: a continuation of the political and military uncertainties and a large population increasing at a rate in excess of 3;;. Despite these and otl1er proble,ls, hOli8ver, the prospects for further progress t01'Tard economic stadli ty and viability are ,: enerally good, although some delays a:~1d difficulties are likely to be encountered before these goals are achieved.
Prospects for Monetar"r a..'1d Price Sta-oility
57. As long as tbe uncert2.in political and 1,lili tary situation continues, recurring crises could occur and lead to intermittent periods of nonetary and price ins taiJ ili ty. ' Thile it is impossible to predict the frec:uency, severity or duration of those periods, there appears little likelihood of a "runalrray" inflation developing. On the contr'ary it is reasonable to assune that despite the temporary periods of instabi::'it~,·, tile average increase in money supply and prices ,Jill be less in the next feu years than in the ;Jast. .tS previously noted, the rate of increase in "1:,;18 i,lOne] su)ply declined during t:le 1950 I s, and a particularly sharp drop occurred during the la.st t 1!ITO years. 'ihe price level has follovJed the same General pattern as the money supply e:~cept in the last t'.'JO years, "I'7hen tJrice increases have been due largely t) shortages of foodstuffs r2cther than to ex,:'2.i1sionarf l'lonet2.l7 policies. Honever, the price situation should ir:11JrOVe in the near future as a result of the adjustl11ent of exports and ii,~ports of foodgrains to compensate for changes in domestic j)roduction and consumption.
Economic GrovTth
58. The t~lird four year plan seer,lS generally Hell 80nc'c~ived to fit the needs of t~le Tail-JEm economy, although the tar[e;et of an 8;~ 2.nnual grovJth in G;P probably uill not be achieved. Grot'Jth raks of Gi', and Y,10re 'Jere recorded in t,le early 1950' s but -this uas s\:,ill essentially a time of recovery and rehaui1itat.:Lon '>J11en sizecb1e amounts of unuti1ized resources could be b:cought into ?rodu_ction fairly q0.ickly aild cheaply. Since 1954 the rate has remained bel'J'! 3/0 aEd in the five years 1954 throuGh 1959 it averaged about 6.5%.
59. AchieveI,lent of the -J" ra-~e also ir,lIJlies an increase in -~he rate of savings frol~' a:)O'-1t 10% of niT? at present to 13;; during the plcl.~1 :')criod. '.hile S01,le increase in the savings rate La; nell take place, such 2, large increase does not appear lilcely in the short-run.
60. Finally,. the third pla,1 assumes a substantial increase in U. s. aid over recent levels. Although the size of ti,e aid proGram has tencled to fall since tr.1e mid-1950 I s, the United States h8.S agreed under cerkin conclitions (laid dmm in the 19 foints) to support a prC)gra.m to speed econor,lic gr01Jth.

- 17 -
Houever, there may be difficulties in implementing this agreement. For instence, circulllstances might prevent the C111.11e6e Govern.'1lent from achieving the policy objectiyes desired by the U.S.; &.F1.d cli.fficulties might be encountered uith respect to the IIbuy IL"'":lerican tl policy under the U.S. aid program, It muld thus appear prudent to assume that U. S. aid may continue at around the present ,level during the ne::;ct, feN years rather than ShO't'l a major increase.
61. It appears likely therefore that GNP growth will be less than the plan target o However, with aid at approximately the present level, and barring a substantial increase in the defense burden, and considering the prospects for further agricultural and industrial development, it is reasonable to expect GNP to continue growing considerably faster than the population, or perhaps near the recent rate of 6.5% per year~
Agriculture and Industry
62. As noted previously, the agricultural resources of the island are already quite intensively exploited, and as time passes an increasing amount of investment is likely to be required in order to maintain the same rate of growth in output as has been achieved in the past. However, there are still a few opportunities where high returns on investment may be expected, the out-·· standing one being the tapping of groundwater resources for irrigation. There are also still possibilities to raise production through such measures as increased use of fertilizer and improved seed varieties and development of marginal lands.
630 Considering these and other possibilities it is reasonable to expect a continued growth of agricultural production at about the recent rate of 4% to 5% per year, as compared to the third four-year plan target of 5.4% per year.
64. During the period of the second four-year plan the index of manufac-turing production increased a.t an average annual ra.te of nearly 13%, and the target of the third plan is to increase the rate to 16%. The new target does not seem unreasonable, particularly in view of the recent measures which have been taken to encourage industry, such as establishment of the China Development Corporation to provide medium-term finance; allOl-ling tax holidays; permit," ting revaluation of assets in line with changes in the price level; and establishment of the :ndustrial Development and Investment Committee to provide informa.tion and assistance to potential investors, both foreign and domestic. On the other hand, there are some less favorable factors~ For instance, it might be argued that the favorable rate of growth in the past has been based to a large extent on the development of industries which already existed in Taiwan or with which the mainland Chinese had had considerable experience; for example, aluminium and cotton textiles. It is likely that by now most of the tleasyll projects have been carried out and that future growth will depend increasingly on the more difficult task of developing new industries o Another consideration is that the domestic market for many lines is saturated, which implies that future expansion Hill depend to a growing extent on exports where competition may become increasingly severe. It is true that good progress h~\s been made in expanding exports of manufactures, particularly in the last year

- 18 -or two, but Taiwan is 8tHl a relative new comer in this field a..."1d i.er abiJit.y to sustain a rapid rate of export expansion over the long run has still to be provedD For instance, her competitive position has probably deteriorated significantly in the past year because the index of wages in manufacturing industries, responding to the increase in cost of living, rose by 18% in the year ending Nove~ber 1960. On the basis of these considerations, but without
f • denying the possibility of a higher rate of growth, it appears prudent to assume that the future rate of industrial expansion is likely to be closer to the actual rate in the last few years (12%-13%) than to the 16% target of the third plan.
Foreign Trade Prospects
65. The outlook for Taiwan's two largest traditional exports, sugar and rice, is not particularly bright. In the short-run there may be a windfall increase in sugar exports by obtaining a share, at least temporarily, of the UoS. market. In the longer run, however, only a very gradual growth is expected in sugar exports to the world free market, and Taiwan should participate in this growth with the other members of the International Sugar Agreement~ Hith regard to rice it seems clear, in retrospect, that domestic cons1.ill1ption has risen more rapidly than production, with the result that the export surplus gradually declined during the 1950's. Even without the rather poor harvests in 1959 and 1960, the time was probably not far distant when the surplus "JOuld have disappeared. In the future it is possible that there may be occasional small export surpluses, but the probable trend will be a gradual rise in im·· ports of rice resulting from domestic consumption increasing slightly faster than production.
66. The outlook for the smaller agricultural exports is somewhat more favorable. l'Jithin this group the prospects for canned pineapple, which is reported to be competing successfully with Ha"t;aian pineapple in European markets, appear particularly encouraging.
67. The best hope for export growth, however, is in manufactured articles~ As 'rloted earlier, there has been a rather remarkable rise in these exports during the past two years, led by cotton textiles, chemicals, plywood, paper and pulp and light machinery. Although the increase in exports of industrial products has been quite rapid, they are in most cases still relatively small in relation to Taiwan1s total exports, in relation to the world markets and in relation to the production potential which could be developed by enlarging Taiwan's productive facilities. On the other hand, the markets for many of the items are highly competitive, and Taiwan must sell in competition with such well established suppliers as Japan and Hong Kong. This points up the importance once again of maintaining monetary and price stability a.t home in order to prevent rising costs from making Taiwan's goods non-competitive. However, considering the success in expanding industrial exports in the recent past, and assuming that appropriate monetary policies are folloFed, it is poasib:;'e to foresee'::. con·tinl:e-:: r:--'~'<.d Cro'Jth in e::-:~)crts of· T.'l8.nufact;Ul'fX: .~ ocds. ~'his ic r 2."arl:- E. and ['~r)prQpr:i.&te for the cOttr:t.r;'i:;o ~.'€ moving .::.t ·the preise::1t stage of eco':'.:mlic .-r:'Ij,lent, and aol1,ieverr:ent of this Goal w~,rr",:lts the hOf''V'l emp!1afj:l~ 'u~ing: placed on it by the platlJling authorit.iesv

. "
- 19 -
68~ Taking jnto accoQ~t the foregoing elements, Taiwan shovld h0 a~l~ to sustain an average export grotvth of 4% to 5% per year. In the short. run the increase might be somewhat larger due to sugar exports to the U .. 3. -vJith this prospective growth in exports, and assuming a fairly stable level of U~3o aid, imports could increase at about the same rate as in the past (average of 4% per year over the past seven years) and there would be the possibility of a very gradual reduction in the import surplus ..
Possibilities for Reducing Dependence on External Aid
69.. It is quite possible that Taiwants dependence on external aid could be substantially reduced over the next decade. This may be demonstrated by a simple model giving the approximate position in 1960 and then projecting from this to a 1970 position on the basis of a few specified assumptions.
70~ In 1960, GNP was utilized roughly as follows: civilian consumption 80%; defense 10%; savings 10%. Foreign aid was equivalent to about 7% of GNP and this together with the domestic savings made possible a level of gross capital formaticn of 17% of GNP. For purposes of the projection, which is intended to be purely illustrative and not a forecast, the followlllg dSSumptions are made: (a) GNP will grow at an average rate of 6% in real terms, (b) defense expenditure in real terms will remain constant, (c) civilian consumption will continue to account for 80% of GNP, and (d) a rate of capital formation equivalent to 17% of GNP will be maintained. As indicated in the table belm-I, the results would show a decline in the defense burden to 6% of GNP ~ an increase in savings to 14% and a fall in the dependence on external aid to an amount equivalent to 3% of GNP ..
Illustrative Projection ..... 1960 1970
Billion NT!) % of GNP Billion NT~ % of GNP
Civilian Consumption 48 80 86 80 Defense 6 10 6 6 Savings (A) 6 10 15 14
GNP 60 100 107 100
Net Imports (Aid) (B) 4 7 3 3
Capital Formation (A+B) 10 17 18 17
71" This projection can be regarded only as an illustration because each one or all of the components could develop in a considerably different manner from that assumed for the purposes of the projection. However, it may be concluded from the illustration that ui-ch continued determined efforts to .follou sou:{ld policies, Taiuanls dependence on e:~ern..al aid could decline sig.l1ificantly over the next decade.
Conclusions
72. There are good prospects that national output will continue to in~ crease at a rate considerably faster than population grOlith.. It is also

- 20 -
reasonable to expect gradual progress toward economic viability~ Ten years hence the need for external aid to maintain an adequate growth rate should be considerably less than at present. HOl-lever, this outcome is by no means assured, since there are a number of uncertainties which could have a substantial effect on future development. Some of the uncertainties are listed below.
(1) The greatest uncertainty surrounds the political and milita~J situation. As noted above this could lead to periods of rr.onetary instability which would have adverse effects on economic growth. It is conceivable also that circumstances could develop which 'l.1l'ould lead to an increase in defense outlays, despite the Government's stated policy to avoid such an increase.
(2) The level of future U.S. aid to China is not absolutely assured. Although the stated policy of the United states is to support China's development effort, the actual level of aid is subject to variation as a result of annual foreign aid appropriations as vJell as the U. S. assessment of China's progress in carrying out the economic policies covered by the 19 Points.
(J) In addition to the usual uncertainties \-Ji th respect to exports, such as possible future changes in world demand and prices, there is the additional uncertainty in the case of Taivmn's exports related to possible future military emergencies. If such emergencies arise exports may be adversely affected in tl.JO '-Jays: first by increased domestic consumption of items t-Ihich would othervdse be exported, and second, by a deterioration in Taiuan's competitive position in international markets due to inflationary pressures in the domestic economy.
(4) Another uncertainty concerns the external debt. As of the end of 1960 China's total external public debt amounted to about uS$563 million equivalent. Some US$35 million of this debt was being serviced. This represented all the debt contracted since the lTational Government moved to Tailvan as vJell as tv10 loans obtained from U.S. Government agencies in 1946 and 1947~ Peak service on this debt is in 1962 and is estimated at about 5% of Taiwan's 1960 export earnings. Besides this debt, there was outstanding scme US$89 million the repayment terms of 1-Jhich had not been decided and US$439 million of debt contracted before the move to Tahran (vlhich \-Jas used largely for the purchase of assets left on the mainland) which was not being serviced. (See Tables Ia and il, Statistical Appendi:~.) The Government acknoHledges all of the above debt but has stated that the Republic of China is in a position to service only those loans for equipment actually brought to Tail-Ian. Consistent vdth this policy, the Governr~ent has expressed its l-Jillingness to enter into discussions vrith a vieH to reaching possible settlements, and an agreement was in fact reached \'lith the Export-Import Bank in July 1961 to resume service on portions of three pre-1949 loans used for purchase of equipment 'liV'hich Has

... 21 -
transferred to Taiuan. The agreement provides for the settlement of $2.6 million of principal plus interest (both arrears and current) in semi-annual :L"1stallments over 10 years .. The timing or terr::s of any further settlements cannot be predicted, B.l1d consequently the future debt burden remains in doubt.
73. L"1 conc1.usion, despite a very heavy defense burden, the progress made by Tail-ian during the last decade has been impressive in reducing inflationary pressures and expanding national output; and it is reasonable to assume that the Government and people vdll continue to strive tOlTard a stable and viable econOIW.. Hm-lever, tilere is still a considerable distance to go to achieve this goal with a number of uncertainties along the "JaY.

Ai'rNEX
The 19-Point Economic Reforn Program
In order to maximize sound economic gr01.rth and to promote maximum development of privatE) enterprise the Government of the Republic of China contemplates to undertake a nUr.lber of specific measures to ensure $llooth implementation of the accelerated program:
1. To encourage savings and curtail consumption.
2. To establish a capital ::'Iarlcet.
3. To L':1prove the climate for private invest-,lent.
4. To proraote and assist private industries.
5. fro offer to [)rivate investors a va.riety of facilities and incentives Hith respect to financing, tax payments, and foreign exchange and trade regulations.
6. 'i'o initiate an extensive study of laHS and re::;ulations governinG the processing of investment projects, exit and entry procedures, procurerLe::l.t of land for plant site, establish.rnent and operation of i)roQuctive facilities, ot~ler related matters.
7. To make full use of t:le equipnent and fac ili ties of all public enterprises, including manufacturinG plants operated by the r.lilitar'J.
8. To -vrorl{ out a long-terra solution to the prooleiil of establishing public utility rates.
9. To continue its policy of stressi..rlg the quality of its amed forces, and discharge of sc:rvicemen: to lriaintain its defense expenditures at the current level, at least in the immediate:future.
10. To reform its tax ::. tructure a.."1.d ta.x administration.
11. To effect further improvClilents of its budget system and to gradua.lly bring into use the system of performance budget.
12. To abolish hidden subsidies in government and defense budgets and in the prices of products a_ld services of public enterprises a,)d utilities.
13. '£0 make an appropriate adjustr:1.ent in t:le pay scale of civil service, to do a;.-,ay 'tuth all forr.1S of subsidy" and to institute a retire1:lent plan.
14. To scrutinize defense expenditures more closely.

- 2 -
IS. 1'0 establish an effect.ive ce:-ltr2.l ba~ll{ systerl! to be responsible for the adjustment of interest rates and credit controle Immediate steps ,Jill be taken to bring about a more strict segregation of the operations of the Bank of Tai~,an as agent of the Central Bank of China from its other operations as a bank.
16. To include all financial institutions H:1ich accept deposits and extend loans into the banking system and to subject them to the control of the Lank of Tahran, acting in behalf of the Central Bank.
17. To strengthen its supervlslon of the operations of various types of banl{s, so as to ensure that each bank , .. ill adhere strictly to the purposes for ~·Jhich it J.s chartered in its activities and develof)ment.
18. To continue its ei.':Zort tOiIJard the establishment of a unitary rate of foreign exc;'lange. It ll1ill also continue to liberalize its trade controls to t:1G maximum extent that is possible in consideration of its balance of international pa~~lents.
19. To continue to promote the developr;le .. lt of trade, especially export trade" by providing laOre incentives, simplifying the procedures for export and forci~'1 exc;1ange settlement, and broadening overseas cOl1'u,:ercial contacts.

STATISTICAL TABLES
..
Table Ia
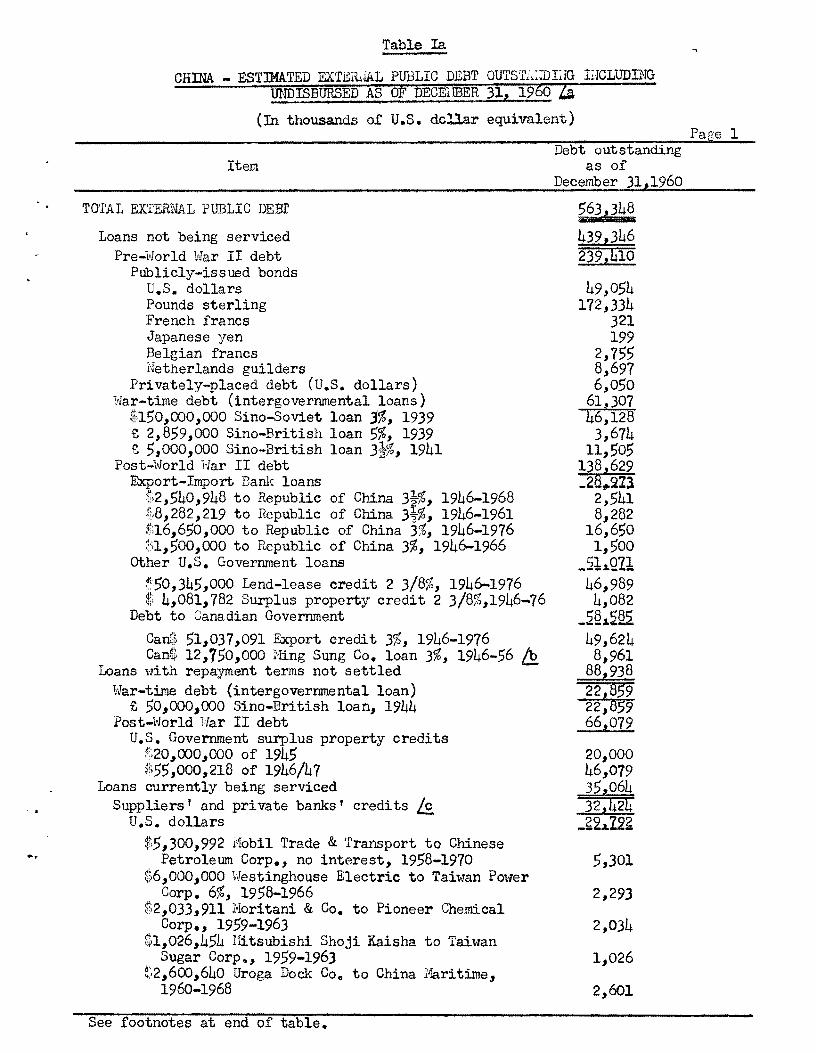
CHDlA - EST mATED EXTE...l.J.lAL PIf.t3LIC DEBT OUTSTi.:IT)I~jG ErCLUDING IDIDISBURSED AS OF DECElIBER 31, 1960 Zi
(In thousands of U.S. dcllar equivalent)
Item
TOTAL EXTERNAL PUBLIC DEB!'
Loans not being serviced Pre-World Har II debt
PUblicly-issued bonds U.S. dollars Pounds sterling French francs Japanese yen Be Igian francs j\4etherlands guilders
Privately-placed debt (U.S. dollars) Har-time debt (intergovernmental loans)
$150,000,000 Sino-Soviet loan 3%, 1939 £ 2,859,000 Sino-British loan 5%, 1939 £ 5,000,000 Sino-British loan 3i%, 1941
Post-"\rJorld l~ar II debt Export-Import Bank loans
!;2,540,948 to Republ~c of C~na 3t%, 1946-1968 .,li8, 282,219 to RepublJ.c of China 31"%' 1946-1961 Sil6,650,000 to Republic of China 3%, 1946-1976 ~:il,500,000 to Republic of China 3%, 1946-1966
other U.S. Government loans ~:'50,345,000 Lend-lease credit 2 3/8%, 1946-1976 *i; 4,081,782 Surplus property credit 2 3/8%,1946-76
Debt to Canadian Government
Canl& 51,037,091 Export credit 3%, 1946-1976 Can$ 12,750,000 Ivring Sung Co. loan 3%, 1946-56 I:E.
Loans 't-Jith repayment terms not settled lvar-time debt (intergovernmental loan)
£ 50,000,000 Sino-British loan, 1944 Post-1nlorld liar II debt
U.S. Government surplus property credits ;:;20,,000,,000 of 1945 ~55,000,,218 of 1946/47
Loans currently being serviced Suppliers' and private banks' credits L£
U.S. dollars $5,300,992 i10bil Trade & Transport to Chinese
Petroleum Corp., no interest, 1958-1970 ~~6,000,000 '\:Jestinghouse Electric to Taiwan PQl.ver
Corp. 6%, 1958-1966 :f:;2,033,911 l''Ioritani & Co. to Pioneer Chemical
Corp., 1959-1963 $1,026,454 Hitsubishi Shoji Kaisha to Taiwan
Sugar Corp" 1959-1963 ~;2,600,640 Uroga Dock Co .. to China l~ritime,
1960-1968
See footnotes at end of table.
Debt outstanding as of
December 31,1960
563,348
439,346 239,410
49,054 172,334
321 199
2,755 8,697 6,050
61,307 46,128 3,674
11,505 138,629 _2a~273
2,541 8,282
16,650 1,500
_2!l.Q11 46,989 4,082
_!2§:L!2~ 49,624 8,961
88,938 22,859 22,859 66,079
20,000 46,079 35,064 32,424 _~~12~
5,301
2,293
2,034
1,026
2,601
Page 1

Table Ia (continued)
(In thousands of U.S. dollar equivalents)
Item
Loans currently being serviced (Cont.) Suppliers and private banks f credits L£ (Cont.)
U.S. dollars (Cont.) t,2,600,640 Hitsui Shipping Co. to China Union
Line, 1960-1968 other miscellaneous
Pounds sterling
Deutsche marks
Other loans ~;.16,387 ,000 Haritime Administration 3t%, 1947/48-1965 $4,243,750 Export-Import Bank to Republic of
China, 3~%, 1946-1968 other miscellaneous
Debt outstanding as of
December 31,1960
2,601 13,936 ____ 2§~ 2 044 .. _-.1---2,640 2,033
481 126
Page 2
~ Excludes debt repayable in U.S. dollars or local currency at debtor option (See table Ib) Q
Ib Debt guaranteed and repaid by Canadian Government. 7c Debt guaranteed by the Bank of China and/or the Bank of Taiwan.
IBRD - Economic Staff August 11, 1961

~ ,
Table Ib
. CHIi.:rA. - EXTERNAL PUBLIC DEBT TO U.S. GOVERdl-!El:T PkYABLE Tif U.S. DOI.J..ARS
OR LOCAL CURRENCY OUTSTANDInG I;'CLUDING UEDISDTJRSED AS OF DECEMBER' 3:1, 1960 PLUS l'IA.JO~ REPOHTED ADD~lO~~S TO JULY 15,. 1961
(In thousands of U.s. dollar equivalents)
OUtstanding Major Reported Item as of Additions
____________________ De.:....c;...;;.--=:;.;31;;;..L., }960 Jan l-~uly 1521961
TarAL
Payable in U.S. dollars or local currency $20,000,000 lCA loan 3 or 4%, 1955-1995 La $20,000,000 ICA loan 3 or 4%, 1956-1980 La ~~20,OOO,000 lCA loan 3 or 4%, 1957-1997 Za ~ 1,000,000 lCA loan 4%, 1959-2001 $ 1,940,000 rCA loan 4%, 1961
Payable in local currency Development Loan Fund loans
~21,500,000 to Republic of China 3~%, 1958-1993
$ 3,200,000 to Republic of China 3!%, 1958-1969
$ 6€6,000 to Land Bank 5%, 1959-1964 $ 1,350,000 to Taiwan Aluminum Corp.
5i%, 1959-1964 $ 5,900,000 to Republic of China, 3i%,
1960-1971 $ 2,000,000 to Taiwan Telecommunications
Administration, 3!%, 1960-1970 $20,500,000 to Taiwan Power Co. 3~%.t
1960-1980 $40,000,000 to Taiwan Power Co. 3!%,
1960-1990
1551660
60,790 19,970 19,995 20,000
825
94,870
21,425
3,049 646
1,350
5,900
2,000
20,500
40,000
1,940
1,940
1,940
La The contracts for these loans provide that any installment of principal and interest may be paid in U.S. dollars or local currency at the option of the debtor. Interest is payable at the lower of the two rates shown if paid in U.S. dollars.
Source: IBRD - Economic Staff August 11, 1960

,
Table II
CHINA - ESTINATED CONTRA.CTUfi.L SLRVICE PAYl1EHTS ON EXTBillTAL PUBLIC DEBT OU'rSTA~mV1G INCLUDING UNDISBURSED AS OF DECE1YlBER 31, 1960
Debt Being Serviced as of December 31, 1960 and Payable in Foreign Currencies (In thousands of U.S. dollar equivalents)
Debt out- Debt out-standing Payments during year standing Payments during year
Year
1961 1962 1963 1964 1965 1966 1967 1968 1969 1970
1961 1962 1963 1964 1965 1966 1967 1968 1969 1970
plus un-disbursed January 1
35,064 30,062 21,522 15,610 12,556 10,126 8,127 6,980 5,917 5,614
2,640 1,421
357 288 224 160 96 32
IBRD - Economic Staff
lunorti- In-zation terest Total
Total debt
7,589 340 7,929 8,540 407 8,947 5,912 324 6,236 3,054 269 3,323 2,430 220 2,650 1,999 173 2,172 1,147 130 1,277 1,063 118 1,181
303 107 410 5,614 97 5,711
Other external debt
1,219 1,064
69 64 64 64 64 32
79 1,298 41 1,105 11 80 10 74 7 71 6 70 2 66 1 33
plus un-disbursed Amorti- In-January 1 zation terest Total
Privately-placed debt
32,424 6,254 172 6,426 26,170 7,238 194 7,432 113,932 5,596 150 5,746 13,336 2,734 105 2,839 10,602 2,102 67 2,169 8,500 1,661 31 1,692 6,839 800 1 801 6,039 738 738 5,301 5,301 5,301 5,301

Table III
EXPF.lJl2,ITURE O~I GROSS ~1ATIOH~ PRODUCI
I. At Current Prices
Unit: Billion N. T .7~
1952 1955 1956 1957 1958 1959
A. Consureption ZXpenditure 13,647 24,677 29,164 34,119 37,!114 43,364 1. Private 10,954 19,885 23,032 26,994 28,818 33,721 2. Government 2,693 4,792 6,132 7,125 8,296 9,643
B. Gross Capital FOTI,lation 2 887 4 264 4 853 6 253 7z574 9,218 (Percent of GNP)% (19,,33) (15.29) (15.04) (lt46) (15.18) (18.91) (Percent of TAP)~ (17.46) (14.73) (14.28) (15.49) (16.95) (17.53)
1. Fixed Capital Forma-tion 2,019 3,487 4,007 5,044 6,381 7,740
a. Private (1,107) (1,756) (1,777) (2,089) (2,531) (3,140) b. Government
F.nterprise (532) (1,201) (1,581) (2,011) (2,578) (3,004) c. General Covernment (380) (530) (649) (944) (1,272) (1,596)
2. Inventory Accumulation 868 777 851 1,209 1,193 1,478
c. Expenditure on Tot21 Avail-able Product (I+B) 16,534 28 ,~)41 34,022 40,372 44,688 52,582
D. Net Imports of (, oods fl·· Services 773 1,114 1,667 2,323 3,093 4,451
E. Net Factor Income Paid to Abroad 3 4 5 63 23 22
F. llicpenditure on GNP(C-D-E)2l5,747 27,R85 32,297 37,986 41,650 48,743
G. Per Capita TAP (H. T .::\) 1,R96 2,973 3,381 3,895 4,171 4,758
H. Per Capita GNP (F.T.~~) 1,810 2,865 3,209 3,665 3,888 4,411
I" Total Population (1,000) 8,695 9,733 10,064 10,364 10,713 11,051
II. Lt Constant(1952) Prices • 29, 733E1 A~ Total Available Product 16,534 21,311 22,862 25,119 26,840
B., Gross National Product 15,747 20,314 21,129 22,596 24,074 25,864
c. Per Capita TAP 1,896 2,190 2,272 2,424 2,505 2,691
D. Per Capita GNP 1,810 2,087 2,099 2,180 2,247 2,340
a/ Including statistical discrepancy 0/ Constant price data is pre1imina~J for 1959
Source: Diroctorate General of Budget and Statistics (DGBAS)

TavIe IV
NATIONAL INCONE AT Ct:iUENT PRICES BY ORIGIN 2 1952 '\.J ~l\ 1955 - 60
(net national Pro~luct at factor cost)
(l1li1lions of l'JT Dollars) (Per Cent of Total) 1952 1~56 1957 ~l)58 1959 1952 1956 1957 1958 1959
Agriculture, forestry, Lunting and fishing h,595 8,557 9,625 10,403 11,773 35.2 32.0 32.1 31.7 30.39
i'lining and quarrying 273 598 716 890 95G 2.1 2.3 2.4 2.7 2.47 l"ianufacturing 1,935 4,468 5,456 5,7513 7 ,LJ3 14.8 17 .1 18.2 17.5 19.19 Construction 634 1,338 1,459 1,545 1,,s21 ~,.8 5.1 4.9 4.7 4.70 E1ectrici ty, gas, 1clater,
alid sanitary services 88 242 326 3)5 46) 0.7 0.9 1.1 1.2 1.20 Transportation, storage and communication 591 1,110 1,381 1,L~75 1,662 4.5 L.3 4.6 4.5 4.29
',ho1esa1e and ret9.il trade 2,190 4,296 4,921 5,187 6,195 16.8 16.5 16.4 15.8 15.99
Banking, insurdnce and real estate 164 4'72 552 715 624 1.2 1.8 1.8 2.2 2.13
Public aciministr!J..tion ,,;Tid defense 1,489 3,202 3,555 4,026 4,713 11.4 12.3 11.9 12.3 12.16
uther services 1,091 1,763 2,054 2,456 2,900 8.3 0.0 6.8 7.5 7.48 l~et factor income to
(-) rest of the Horld -3 -5 -63 -23 -22 -0.2 -0.1
--Total 13,047 26,041 29,982 32,827 38,720 100.0 100.0 100.0 100.0 100.0
Sourr:e: DGBAS

,Table V
INDEX NUMBERS OF PRODUCTION . (]§53 = 100)
A. Agriculture '1eneral
Index .'\.gricu1 ture lorestry Fishery Livestock
1950 79 85 71 65 60 1951 82 81 80 73 97 1952 91 88 97 92 103 1953 100 100 100 100 1 ') 1954 101 99 103 116 102 1955 104 98 104 137 10~ 1956 III 105 111 146 113 1957 121 115 125 155 123 1958 129 121 155 174 125 1959 131 123 171 185 129 1960 133 124 161 195 122
B. Industry
General Building Public Index Hanufacturing I lining Construction ~lity
1950 54 49 66 75 1951 64 58 78 88 1952 81 75 105 93 1953 100 100 100 100 100 1954 107 107 100 106 115 1955 119 120 114 145 123 1956 125 125 120 105 135 1957 142 143 134 118 149 1950 153 153 144 177 162 1959 173 175 155 118 182 1960 1°7 / I 200 174 13h 207
Source: Ministry of Economic Affairs

}...?1;>le~ Yl AREA AND OUTPUT OF AGRICULTURAL CHOPS
(area in thousand hectares, output in thousand lnetric tons)
Rice Sugar Cane.@./ Sueet potatoes Soybeans Tea Tobacco Area Output Area Qutput Area Output Area Output Area Output Area Output
i re-wa:~
peak 625 1,402 162 1,419 139 1,770 17.7 10.8 1+5.2 1702 5.5 9.8
1950 770 1,421 122 626 233 2,201 20.3 12.5 42.0 906 5.5 603 1952 786 1,570 98 528 234 2,090 24.3 14.6 44.1 11.6 5~5 9.0 1953 Tl8 1,642 113 901 238 2}277 28~2 17.4 41+.7 11.9 5.5 9.9 1954 777 1,695 96 713 248 2,557 30.0 20.3 46.2 13.0 5.6 9.7 1955 751 1,615 78 748 246 2,437 34.5 24.2 47.0 14.7 6.2 11.6 1)56 784 1,790 91 787 230 2,568 37.5 26.4 4706 13 .1-t 803 15.2 1957 783 1,839 98 861 229 2,693 41.0 33.1 L~IJ .0 15.0 9.7 18.7 1958 778 1,894 101.5 913 229 2,958 L~7 .9 41. 7 48.3 15.8 8.8 16.2 1959 776 1,855 99.2 966 226 2,894 53.8 44.4 48~4 16.5 8.4 16.4 196012/ 1,902 791 2,949 59.9 18 t o 15.9
, l?eanuts Bananas PineaEEle Citronella Citrus fruit Vegetl'\.bles Area Output Area Output Area OutEut Area Output Area Output Area Output
p 4 re-Kar peak 31.5 31.7 21.3 219 10.4 146 4.3 45 504 38.7 42.5 440
1950 8304 57.1 14~7 117 5.0 46 14,6 79 4.7 28.3 74.3 591 1952 81.0 60.0 15 __ 7 107 5.,8 63 25.9 148 4.6 27.8 77Q3 619 195J 82 .. 6 60.1 12.7 96 5.7 68 24.2 150 4.8 29.4 77 .. 2 623 195~ 94.0 65.9 1205 98 5.5 66 19.8 86 4.8 2".8 79.0 636 1955 96,0 66.6 10.7 85 5.7 70 13.9 76 5.2 30.2 80.4 648 1956 98.3 81.8 9.6 59 6.4 83 16.1 99 5.8 35.3 81.9 670 1957 10) .. 6 93.7 11.3 92 7.2 99 17.8 92 6.2 39.0 84.2 705 1958 103.6 96,,4 13.8 III -8.4 137 19.1 100 7.0 41.8 87.3 741 19591>/ .1 97.0 13.0 104 8.9 146 15.7 84 7 .. 4 42.6 88.3 749 1960 103.1 107 161 81 49.8 760 iJ Cror:- Y8ar ending in the calendar year indicated; output refers to sugar content of the sugar cane. ~/ PreJjjninar·y. Area figures not available. IJ, B, '.!'ne sum of aboye prea f'i~ur8s exceeds the total f;111tJ vl;ltr.:d JanrJ "l"'8a due to muJ Tiple rr. ppi.:1C;.
S01.:C'cc l\~i~l~_-;;I-,ry of 1i:coromic .4.::"rirs au-a rahn'1 Provi,;~-Lal j1p:!J::l",tmer":c ot'l\"crjc~1Jlt'-t':"n Cl.f'd Fo"-·esr.ry.

Table VII
OUTPUT OF E!EL;CTED ML~L;G l.~ID I·D1LTdI;~L prODUCT.::; ~------Gn--:thoUS'3~;-ci.s of uni t i..ldi(;atedY~----
Item Unit 1952 1956 1957 -}iining:
Coal }i~ T. 2,286 2,529 2,916 C"PP0r l"i. T. 0 .. 7 105 1 .. 7 Salt 1'1.T 330 328 387 N",.tural Gas Hil1ion m3 17.3 27.2 28.8
Electric Power mn.K.U.H. 1,420 2,250 2,555
l"~rmfact,uring : '~<Sugar (Centri-
fugal) !1 HoT. 624 776 918 Sugar, brown h.T. 11 20 25 CA.nned Pineapple case 490 1,132 1,143 Cotton Yarn 1,·i. T. 14 25 28 Cct.t0n Fabrics mn .. m 88 142 156 PIYl<Jood sq. m. 1 4 4 Lagasse Board piece 740 1,579 2,919 P~per L. T. 28 49 60 Picycle Tires piece 332 526 649 (.<.:.'lwtic Soda LT. 9 20 25 Soda Ash h.T~ 1 2 3 .ilJ:'monium Sulphate 11. T {j 6 7 13 Ca~ . .(;ium Super-
phosphate L.T~ 62 101 104 I-:astics Kg. 115 1,432 2,103 Poly Vinyl
Ch:!..oride Kg .. 1,064 C:~.f:(lline K.L. 81 163 187
K.L. 46 112 137 K.L. no 322 308
f2.ate Glass case 162 182 CPlllent lie T. 445 .. 6 59102 604 Pig Iron l'i.T. 10 18 20 3·\:'eel Rods, Ears
2nd Slabs 1h T. 18 79 89 11.1 uminum Ine;ot L.T. 4 9 8 Alumim.:l1l Sheet h.T~ 2 3 6 Bicycles piece 4 34 42 E:c>~t.ric Fans piece 10 < 82 103 E2.ectric Leters piece 11.5.·2 ~O.O
a/ Crop yel'?rs endine in year I'l'i yen.
11. T. :::; metric ton sq .. m. :::; square meter; m3 = cubic meters K.L. kiloliter
0('I...:'ce: binistry of Economic Affairsv
1958 1959
3,182 3,563 1.7 1 .. 8
444 430 26 .. 2 26 .. 3
2,880 3,213
867 888 20 25
1,744 1,731 28 31
147 156 7 9
2,128 2,242 72 86
722 883 26 29 3 5
17 22
104 119 3,215 4,257
1,457 2)350 202 231 157 182 283 352 162 230
1,015 IJ067 17.1 33
107 159 9 7 4 4
31 36 104 169 122.1 147
1960 -3,962
1.8 441
2>04
3,628
846 18
2,219 40
176 10
2,549 97
708 33 11 21
121 6;266
3,408 298 207 412 469
1,183 24
2CO 8 6
34 204 218

I12::¥2.,X.II1
CONSOLIDATK;D BUDGFT OF TH~ CLNTRAL, PROVINCI·,'L AND LOCAl, GOVERNI1ENTS
Rece~Ets
Taxes 'lonopoly Profits Profits of Public
Enterprises Otller Receipts
Total Reoeipts
Exp~nditures
Defense Intern"ll Security Administration Other Non-de-velopment
Expenditures Development Outlays
Total Expenditures Surplus (+) or Deficit (-) Not3S:
1954/55
3,197 820
75 786
4,878
2,241 288 748
959 661
4,897 - 19
(in millions of NT dollars)
1955/56 1956/57 1957/58
3,992 1,060
232 650
5,934
2,759 475 884
1,037 624
5,979 - 45
4,340 1,330
546 1,034 7,250
3,319 668
1,037
1,272 1,260
7,556 - 306
4,977 1,419
708 883
7,987
3,870 445
1,097
1,297 1,385 --8,094 - 107
1. The following adjustments were made in the budget accounts:
1958/59
5, 1,661
755 1,565
9,)85
5,013 333
1,197
1,856 1,067
10,006 - 621
1959/60
6,006 1,063
1,121 1,865
10,855
4,993 424
1,398
2,297 1,876
10,998 - 133
1960/61
6,294 2,236
1,253 2,209
11,992
5,306 442
2,439
2,066 2,272
12,525 - 533
a) The only reflection of U.S. aid in the budget is some transfers from counterpart funds which are used to finance certain defense iterns; in the above table both the counterpart transfer and the
. defense outlays ",hich they finar!ced have been deducted. b) "Bqokeeping profi ta" arising from devaluc'.tion of the exchange rate were deducted from revenues for
St)urct? :
1956/57, 1957/58 and 1958/59. 2. Figures' for 1954/55 through 1957/)8 ~'.re actuals for the Central and Provincial Governments and budget
estimatep for the local governments; 1958/59 figures are actuals for the Central Government and budget estimateS' for the other levels of government; 1959/60 figures are provisional Rctual for the Central Government, and budget estimates for the other levels; 1960/61 figures are budget estimates for all levels of government.
Rased on :'nforrrat~(m 0bt·Ol.il1Brl frt')~1! the Hi'!-i.~·!J.r.." of Fi..LE~[',,~ <

Table !X --CONSOLIDATED STATENENT OF CONDITION OF THE HONETARY SYSTEH
(In millions of NT dollars)
1952 1954 1956 1957 1958 1959 1$60
A.3sets -Foreign Assets 376 476 1,181 1,646 3,706 4,736 4~ 743
Claims on Govennment 962 1,619 2,155 2,493 2,~63 2,651 3,235 Claims on Government Enterprises 1,112 1,703 2,716 3,120 3,569 3,926 4,501
Claims on Pri va,te Sector 671 1,294 2,385 3,363 4,615 6,320 7,286 Unclassified Assets 1~264 1,465 1,563 2,040 3,143 2,766 3,550
Total Assets 4,385 ~ 10,006 12,0b3 17,496 20,399 23-;3E
liabilities - .lJ]oney Supply 1,286 2,128 3,229 3,789 5,129 5,570 6,107 Treasury Deposits 89 106 125 247 230 398 280 Deposits of Gov1t Agencies 370 676 1,153 1,478 1,446 1,566 1,769 Time and Savings Deposits 632 1,114 1,461 2,013 3,435 4,536 6,018 UoS o Aid Deposits 353 630 1,485 1,678 1,623 1,835 2,624 Foreign Liabilities 234 342 652 994 1,998 2,274 1,465 Unclassified Liabilities
and Capital Account 4,4g5 1 561 1,895 2,464 3,635 4,220 5z052 Total Liabilities ,3 () ;557 10,000 12,663 17,496 20,399 23,315
3·:,u:.:ce: Bank of Taiwan, Tait.van Financial Statistics lfionthly.
-'

1 .
fable X .
FACTORS AFFECTING TJ:lE HONEY SUPPLY IN HANDS OF PUBLIC
(in millions of NT dollars)
Pu.blic Sector
A. Gross Credit General government Public enterprises
B. Increase in Balances Treasury Government agencies U.S. Aid Deposits
C. Net Effect (A-B)
Private Sector
D. Gross Credit to Private Sector
"~
£1_ Increase in Bank Liabilities and Ca,pi tal
Time and savings deposits Capital and net unclassified liabilities
F. Net Effect (D-E)
G. Total Domestic Credit Expansion (C+F)
Hoi Increase in i'let Foreign Assets
I. " Increase in Aoney Supply (G+H) (Percentage Increase)
19.57 19.58
71.5 1,023 311 ~a/ 404 449 -
602 - 136 133 13 303 - .51 166 - 98
113 1,11.59
98.5 1,267
6.5.5 1,t61 m 1, 21
102 40
330 -194
443 96.5
129 ~.2I
.572 .b)28 (18%) (35%)
-
19.59
614 m 3.57
.570 lOb 182 282
44
1,679
1,098 1,101
-3
.581
62.5
-184
~.! ( 9J1\ 10 )
1960
lz~~~ .57.5
874 - 118
203 789
28.5
966
1,.530 1,482
48
-.564
-279
816
~"l (Ie
:;i IbrJ1lding use of bO(")1<:kdt'ping rrofits from d.E..VaL16~~"on.--·-·f/ Exo:!.uding b0')kkee~i'1:; rrcf~t'3 frcm de~raJ.1'2'"i''=L 30 u.(',Je: Bank (If Tah;,n, Tahmil r,inar':.:;_ja~_§.~~-:tis~i:::£ rJTo~tt,l;":; !J20) 1960

, ..
Loans (per cent per month)
Secured Loans
to 1 year Free market Bruikol Uther Taipei Taiwan Banks
19i~9 3.90 8.40 15.0 19SC 1.80 3.30 10.5 19;;1 LBO 4.50 9.0 1952 1.S0 3.00 5.5 1953 1.20 2.25 3.5 1954 .99 1.95 3.1 1955 .99 1.80 3.6 1956 .99 1.80 3.3 1957 .99 1 .. 65 3.0 1958 .99 1.65 3.0 , () c;o .99 1.50 3.3 ...... ..1'/"
1960 .99 1.50 3.3 lC)'.' (T'r'e) 1..35 1.35 2.7 J ,,-.-~ ~, '.:
E~TEHEST RATES
Time and Savings Deposits ~ (per cent per annum)
3 month 6 month 1 year 2 year
54.0 27.0 27.0 21.6 12.6 10.8 10.8
10.2 13.8 10.2 13.8 9.0 12.6 18.5 20.75 9.0 12.6 1B.5 20.75 7.2 10.;~< 15 • .3 ' c; 6 .......... ...;. ~,.\
'3.,' interest has not been paid on demand deposits since 1957.
S;)u'ce: Bank of Taiwan.
.3 year
23.0 23.0 1(') • .3

Table XII
PRIC:C INDICES 1960 1961
End Period 1952 1956 1958 1959 1960 I II III IV 1"0b.
A", (1953 .,. 100) Cost of living 85 119 135 150 177 161 175 186 187 189 lfuolesale prices 92 128 143 159 181 172 179 182 187 186
B., (1956 a 100) 1. Wholesale prices,
Taipei 100 III 123 140 138 139 146 145 145 food 100 114 130 156 152 154 167 164 165 rice 100 liO 118 161 147 166 179 174 185
clothing 100 96 105 107 108 108 106 106 106 electricity 100 106 120 130 130 130 130 130 130
2. Consumers' prices, ma.jor cities 100 114 126 149 140 150 160 156 160
food 100 114 127 :157 145 158 172 Ib2 166 staples 100 112 119 170 160 175 189 180 188
clothing 100 108 116 122 122 123 122 122 122 housing 100 li6 124 128 127 128 130 130 126
Sources: A. IFS. B. Revised indices of Provincial Government, in Industry of Free China.

...
XUI
VOLill1E OF FOREIGN TRADE
A. Volume indices (1953=100) 1952 1953. 1956 .!9~~ 1958 1959
Exports 67 100 83 97 118 111 Imports 81 100 94 102 113 125
B. Principal exports (thousands of metric tons)
Sugar 460 875 600 748 817 733 Rice, polished 105 59 109 122 179 160 pineapple, canned 5 8 20 16 28 36 tea 9 10 11 12 12 14 bananas 42 23 20 25 41 45 cotton piece goods 1 2 1 6 salt 181 174 197 201 290 288 cement 11 48 ~I el 268 115
c. Selected Imports 1',heat 6 64 211 144 224 170
. :;:3H cotton 12 26 22 31 28 30 chemical fertilizer 403 252 314 218 536 606 crude oil (incl. diesel fuel) 167 286 489 971 696 696
fl.1 for volume indices, first three quarters averaged; for volume of principal exports and imports, total for first 10 months.
'f2/ 1..888 tkn .5 thousand metric tons.
;::";;'ncp~; : r... IF..> ~ B. and C. .~nd·tlstry of Free China.
1960:Y
108 135
686 30 31 10 42 1
214 27
209 72
373 839

Sugar 6907 ?i.ice 23.2 Subtotal 92.9
Tea 5~7 Citronella oil 2.4 Banana 6,,6 Pineapple (canned) 2.0 other agriculture Subtotal 16.7
Salt 2.5 Paper and pulp 0.1 Ghemica1s and cosmetics 0.2 eres, meta1s,machinery 0.7 Lumber, timber & manufactures 0.5
'.:'extile fibers &. manufactures
Cement 0.3 Other 5~6 Subtotal 9.9
Total Exports 119.5
Of ,Thich: rice f, sugar % 78
Oth:;r ar;ricul tura.1 % 14
,)thC)r exports c' 8 10
pi ASS11med unchanr."ed • ... _' ,~)
Table XIV
VAL1.TE OF Pl1I. CIPAL EXP~RTS (million of U.S. ~?)
90 ... .3 76 .. 1 110.8 11.4 12.8 21.2
101.7 Bd.9 132.0
6 .. 8 5:.>1 5.8 2.2 5.1 3.6 3.4 3.1 3.8 2.6 6.1 4.4 0.2 1 •. 4 1.1
15.2 20.8 18.7
1.7 2.3 2.3 0.2 0.7 0.5 0.4 1.1 1.6 1.0 4.4 2.2
0.3 o Q .0 0.8
3.1 2.8 1.0 8.] 8.0 7.6
12.9 20.4 17.8
129.8 130.1 168.5
78 68 78
12 16 11
10 16 11
Source: Exchange settlement data of BOT.
1958 19~9 1960 -84.7 65.9 74.4 28.6 23.5 4..3
133.3 E9:4 78.7
6.8 7.1 6.3 3.5 3.2 3.4 6.2 6.6 5.9 7.4 8.] 8.5 2.3 5.1 3.4
26.2 30.3 27.5
2.4 2.3 2.5 0.8 2~7 2.5 I
1.7 3.0 (3.0)~/1 2.2 3.9 (3.9)~i
3.3 5.5 5.5
2.1 12.1 20.6 1+.9 2.4 1.1
.L.2 8.9 "4 ' ~
24.9 40.8 63.7
164.4 160.5 169.9
69 56 46
16 19 16
15 25 38

•
T~p •. htRlQl al VALUE OF PRmGIPAL n!fPOHTS--
(in millions of U.S. dollars)
1952 19')3 U.S. otfi:elS Total U.S. Others Aid Aid
t'1achlt'~eI"J and Tools 2.6 10.3 1209 4.8 11.2 Ores, l'fetals and Mrs. 5,,2 lL6 16.8 7.0 11.,9 Vehicles, Vessels and Parts 0.7 3.8 4.5 3.6 3.5 riaw Cot ton 11.,4 1.8 13.2 14.3 3.3 '.Jheat, Flour and Cereals 5.5 7.9 13.4 12.5 5.6 /Jeans and Peas 0.,3 0.3 0.2 Chemical Fertilizer 2238 12.7 35.5 7.8 10.6 Crude and Fuel Oil 9.1 0.9 10 .. 0 3c2 4.4 Electrical materials bl 441 2.5 Chemicals Og9 1,,4 :203 0.8 2.2 Pharmaceuticals 1.8 6.9 8.7 1.3 5.8 Oil and Fax 2.9 2.7 5.6 1.5 2.7 Rubber and Products 0.4 3.4 3.8 0.6 3.3 Logs, lumber & wood l:'J.frso bl 0,,7 0.9 Others 25.,8 54.2 80:0 21.8 38.5
Total 8901 117.9 207.0 84.0 106.6
~ Exchange settle .. lent data. atld U.S. aid arrivals £1 I!1c~uded with lother~1
Total
16.0 18.9 7.1
17.6 18.1 0.2
18.4 7.6 6.6 3.0 7 .. 1 4.2 3.9 1.6
60.3
190#6
Source: Jank of Tahlan and Council for U.S. Aid (eLISA)
lq~6 ~
U.S. Aid
18.5 8,,7 3.7
15.4 13.7 9 .. 4 0.1 4.2 2.5 2.8 3.0 5.6 0.9
... O~9 7.1
96.5
1957 Otrlers Total U.S. ---Others Tot.al - Aid
16.6 35.1 21.8 20.9 42~7 19.7 28.4 7.1 24.7 31.8
7.0 10.7 3.1 9.8 12.9 4.3 19.7 18.4 1;5 19.9
13.7 17.2 0.7 17.9 O~l 9.5 11.5 1.3 12 0 8
22.6 22.7 26.0 26.0 14.0 18.2 -4.9 20.2 15,,3 3.7 6.2 2.5 5.2 7,:( 4.6 7 .. 4 1.7 5.2 6.9 3.6 6.6 1.6 5.1 6.7 0.9 6.5 2.7 1.4 h.1 3.8 4.7 0.9 4.3 5.2 2.4 3.3 1.3 1.4 2.7
28.4 35.5 13.8 25.8 39.6
131.7 228G2 98.7 153.5 252.2
(Continued on next page)

•
TaLle rv (continued)
1958
u.s. Aid Others Total
]I';achinery and Tools 17.9 21 .. 3 39.2 Ores: i lleta1s and i·1frs. 2.7 21.7 24.4 Vehicles, Vessels and Parts 3<::6 11.9 15~5 RaH' Cotton 16.5 1.6 lS.l l~heat j P10ur and Cereals 17,,0 17.0 :aea:1s and Peas 9.6 1.1 10.7 8l1emica1 I·'ertilizer 19.5 19.5 Crude and Fuel Oil 0,'1 15.4 16.1 Electrical materials 2.8 3.7 6.5 C'lemicals 0,,5 6c7 7.2 Pharmaceuticals 0.5 7.4 7.9 Oil and lvax 3,,6 2.9 6.5 .K.llbber and Products 0.6 4.5 5.1 Logs, l~~ber & wood i~rs. 1 .. 6 1.9 3.5 Others 4.7 30.9 35~6
Total 82 .. 3 l)'Oe;:- 232~8
al Exchange settlel,1ent data and U.S. aid arrivals c/ Included with 'others'
,3 ('\!lrce; Bank of Tahlan and GUSA
1959
u.s. Aid Others
13G3 24.9 5.2 27.7 5.1 17 .5
13.6 5.5 14.4 0.4 6.6 1.3
22.2 13.6
5~1 4.8 1.1 5.1 3.0 4.6 2.7 4.1 0.3 3.8
4.1 3.0 31d,
73,4 17100
1960
u.s. Total Aid Others Total -
38.2 14.0 22.1 36.1 32.9 11.3 2406 35.9 22.6 S.6 12.4 21.0 19.1 13.0 7.2 20.2 14n8 16.2 0.8 17 .0
7.9 10.2 6.8 17.0 22.2 1.3 14.3 15.6 13.6 11.1 11.1 9.9 3.4 4.3 7.7 6.2 2.7 4.9 7.6 7.6 2.2 5.0 7.2 6.8 1.4 4.2 5.6 4.1 1.9 2.9 4,S 4.1 2.,7 2.7
34.2 4.6 38.0 42 .. 6
244t,4 90.9 161.3 252,,2

A. Goods and Services ~xports f.o.b. £I Imports mainly c. Lf. d/
Trade balance
J'Jon.l1onetary gold Transportation and in
surance Government, n.iae. Otner services
Total
Tl. i1iscellaneous Donations and Capital P:'i vate donations :E-':,ivate capital
1952
119 .. 5 -208~.3
- 88.8 1.9
- 100 - 7.8 - 3.8 - 99->
1.8 401
O~ficials loans received e/ Of:2icial repayments - 1. 2 Other 0.7
Total 5.4
~'0J(;._.!L[
Il~TER;\]ATI01~AL TRAj~SACTIONS y'
(In millions of U.S. dollars)
1953
128.6 -192.9 ---- 64~3
1.6
- 6.4 - 8.3 - 3.5 - 80.9
2.4 9.9 5.5
- 3.3
14.5
1956
124,,1 -22201 - 93.0
1.4
- o.L - 5.2 - 5.4 -107.6
- 0.4 5.0
- 1.6 0.2 3.2
1957
148,,3 -244.7 - 96.4
0.9
6.2 - 1.2 - 5~8 - 96."3
0.1 9.1
- 3.5
5.7
1958
155.8 -273.5 -117.7
1.3
1 7
- 7.9 -124.9
14.4 35.9 4.5
- 6.0 3.2
52.0
1959
156.9 -,264.0 -107,,1 - 2.1
2.5 - 9.7 - 6.6 -123.0
9.S 13.5 0.9
- 1.5 0.2
22.9
First Half
1959 1960 £/
94 -132 - 38 - 2
2 - 6 - 4 :-fi9
7 - 1
- 1
5
86 -134 - 47
2 - 3 - 5 ::-s4
3 10
- 2
11
c. Net Errors and Omissions - 2.1 - 1.7 - 7.9 - 0.9 6.2 0.5
D. T)+,2.:. tl1rOugh C) .0 - 67.7 -112.3 - 91.5 - 66.7 - 99.6 - 43
49 E. U, S. Grants and Loans !.I li'. IlIon '::!tary i'1ovem~nts
S'l::n't··term li&1lbili ties Sh"):.~t-term assets (in-
93.9
- 0.5
,.,.~",.\<-\".) or' ......... -"' ..... 'oJ..... .:;
,Ii gold (i.hl1crease-) = .. 1.9 ~0tal 1~9
84.7
- 15.0 - 1.6 ':-fb.-ci
97 .3
20.2
3.6 1,6
~()
96.9
13.2
- 17.7 0.9
-r" .4
88.2 86.2
0.1 2.2 - 18
- 20 .. 3 9.2 E,/ 10 1.3 2.0 2 :Co ')' --l.:{_~ '---"6
([)b8 ';\:to'vncl1:,r=.S Oil next
- 42
50
- 18
11
., I

Table XVI - FOOTl'lOTES
a/ No indicates credit.; minus sign indicates debit. 15/ Prelininary. s/ :SXports for 1952, 1955, and 1956 are based on the exchange settlements
data; those for later periods are oased on the trade retlIrns. d/ Imports for 1952, 1955, and 1956 are based on the exchange record. - Imports for later periods are based on trade returns. e/ Loans recei'led under official guarantee by Tail-Jan POHer Company and - Chinese Petroleum Company from U.S. companies. f/ The data include ECA/iiBA/FOA/ICA grants, U.S. Government loans out
of the proceeds of sales of surplus agricultural cornrr,oditics for j\Je1V Taiwan dollars ($20,,0 million for 1956, $38 .. 0 million for 1957, $37 ... 1 million for 1958 and ::)9.7 million for 1959), and increases in liabilities on account of U.S. holdings of NelJ TaiVJan dollars acquired through sales of surplus agricultural comrnodities ((:;12 .. 1 million for 1956, ~~0.3 million for 1957, $6.2 million for 1958, and $5~0 million for 1959).
g/ Includes a decrease in portfolio security holdings (credit of - :!)1.4 million) Q
Source: International Honetary Fund.

y •
Table xvn . -
GOm MID FOREIGI'J EXCHANGE
(millions of U.S. dollars)
1952 1953 1954 1955 1956 1957 1958 1959 1960
,Job 36.3 37.9 39.3 38.8 40.4 41.4 42.3 40.2 40.2 Foreign eych~nge (~ros5) 3B.4 54.2 29 .. 0 54.7 70.0 97 .8 10B.5 112.2 111.8 Tota:!.: gold and gross
fo:"'eign exchange re-se:-ves 74,,7 92.1 68.2 93.5 110.4 139.1 150.8 152.4 152.0
Less: Dank of T~iwan foreign excl1ange lia-bilities 23.2 23.3 22.0 23.6 41.9 63.9 55.4 63.0 40.6
Total: gold and net 51.5 68~8 46.3 69.9 68.5 75.2 95.4 89.4 111.4 foreign eXChange re-serves
Changee- in total gold and not foreign eXchange rese:t'Ves 17.3 ~22.5 23.6 -1.4 6.7 20.2 -6.0 22.0
~'OUl'C''::: ."~inistry of :i'im,nce ;nd :entr.::;.l S,1nk oJ.' Chlnh .•

1 .,
Table XV-III
HJVESV.lENT PUl.NS
A. Inv.jstment recpirements Second Four-Year Plan Period a/ Third Four-Year Plan ~19~6"""'1'-----:l;r9"'6'-;;2~---1963 1961± -'IOtaL
B.
1959 1960 Total
1. ~lnount ( I'Iillion at 19.59 prices)
Agriculture 1,309 1,316 1,620 1,784 6,029 1, .570 1,890 2,231 2,63.5 8,325 Industry 3,006 3,922 4,220 4,713 1.5,861 .5,336 .5,736 .5,972 .5,838 22,882 Transportation 798 1,038 1,070 1,107 4,013 1,7.58 1,664 1,784 1,922 7,128 ot.hers 1,913 2..z.!1:§ 2z038 2z.540 8:877 2.t .552 2,800 2,800 2,860 11,012 Total 7,026 8,392 9, 21'S 10,ltIi" '34,7~0 11,216 12,090 12,787 13,8~ 49,3Iie
2. Percentage Agriculture 18063 1.5.68 17 • .57 17 • .59 17.34 14.00 1.5.63 17.4.5 19.88 16. Industry 42.78 46.73 4.5.78 46.46 45.60 47 • .58 47.4.5 46.70 44.04 46.37 Transportation 11.36 12.37 11.61 10.91 11 • .54 15.67 13.76 13.9.5 14.50 lb" Ot.lers 27.23 2.5.22 2.5.04 2.5.04 2.5 • .52 22.7.5 23.16 21.90 21..58 22.32 Total 100.00 100.00 100.00 100.00 100.00 100.00 100.00 100.06 106-.00-106;00
Investment sources
1. ~,r.:!.0unt ( l'Ii11ion at 19.59 prices)
Private Public & Government U~S. Aid & Others Total
2. Percentage Fii'ivate :2u1)lic & Government UoS. Aid & Others '1'ota1
1,960 2,.50.5 2,678 2,994 10,137 3,192 3,477 3,766 4,239 14,674 2$364 2,602 2,700 2,9.50 10,616 3,183 3,4.50 3,734 3,909 14,216 2,702 3,28.5 3,840 4,200 14,027 4,841 .5,163 .5,287 .5.107 20~398 7,026 8,392 9,218 10,144 34,780 11,216 12,090 12,787 13,255 49,34d
27.9 29.9 29.1 29 • .5 29.2 28.4 28.8 29 • .5 32.0 29.8 33.6 31.0 29.3 29.1 30 • .5 28.4 28 • .5 29.2 29 • .5 2{),9 38 • .5 39.1 41.6 41.4 40.3 43.2 42.7 41.3 38 • .5 41.3
100.0 100.0 100.0 100.0 100.0 100.0 100.0 100.0 -100.0 10c.6
<i/ 195'7-1957, actuaL 1960 cstiITl5.ted. Jourc(~ : G~JSA.

Table Xll
SELECTBD PRODUCTI j,J Ti_RGETS A~;D ? ;rtFOttii.'~jCE
% of original
1964W 1957 1958 1959 1960 19bO target -r..ice (million HT) original target 1.9 1.95 2.0 2.05 . 2.3
$ revised target 1.9 1.95 2.0 2.0 97.5 actual output 1.8 1.89 1.8 1.9 92.6
.!< S'lrJeet Potato (million NT) original and revised targets 2.6 2.6 2.6 2.6 3.1 actual output 2.7 3.0 2.9 2.9 " .. 11.;;
lJhea t (thousand 11T) original target 25 26 28 31 91 revised target 28 39 50 63 203.2 actual output 36 40 43 46 148.3
Goybeans (thousand -I'T) original target 30 34 38 42 105 revised target 30 34 42 51 121.4 actual output 33 42 44 56 133.3
bl Sugar - (crop year) ( thousand !'iT)
original target 800 850 850 850 870 revised target 800 850 u55 857 100.8 actual output 033 894 940 774 91.0
~imber (1,000 m3) original target 740 P50 950 1060 1,llO revised target 740 850 879 950 89.6 actual output 577 719 818 770 72.6
Coal (million HI') original target 3.1 3.6 3.9 4.4 4.6 revised tarFet 3.1 3.3 3.1 3.5 80.0 actual ontput 2.9 3.2 3.6 4.0 90.9
nanned pineapple (million cases) original tarp:et 1.25 1.5 1.75 2.0 3.5 revised target 1.25 1.5 1.70 2.0 100 . - <'ctual output 1.14 1.7 1.73 2.2 110
~-Cotton yarn (thousand cubes) original and revised targets 158 172 lr5 199 350 actual production 154 153 170 207 104.1
fye plastic (thousand ]lIT) 0riginal target 1.4 3.7 5.6 8.0 20 revised target 1.4 1.6 2.0 3.0 37.5 r>ctual output 1.1 1.4 2.4 3.4 42.5
(Continued on next page)

,
Table XIX jG0nt ... )
1957 1958 1959
Cr"'J.de through put (million ) 0:ciginal target .8 .9 1.0 r--:;vised target .0 .9 1.0 dctual output na na 1.2
:'\.luminll.."!l ingots (1,')00 ET) ul'iginal target 8.0 10.0 16.0 :ce-rised tar"'et 8.0 9.0 9.3 actual output 8.2 8.6 7.5
H;lectric fans (1,000 sets) original target 60 80 100 .l.'2 vised target 60 80 100 actual output 103 104 169
P0Ker generated (billion KiNH) 0!'iginal target 2.7 3.2 3.6 revised tar€:et 2.7 3.0 3.h '1ctual output 2.6 2.9 3.2
a/ Original targets for the third four-ye'1r plan. ~/ Centrifugal only.
Source: CUSA
if of 1°
original a/ 1960 19bO target 196b. -
1.1 1.6 1.3 118.2 1.2 109.1
19.0 20 9.3 L8.9 8.3 43.6
100 230 150 150.0 204 204.0
3.9 6.1 3.7 9h.R 3.6 92.3

T •
Tab:!..;). XX ... ---~ ..
U.S. HID ?HOGRNvl! FY1951-1960 , FY1961
(expenditures in millions of U.S. dollars)
1951-53 1954
A. Defense sup-~)ort Sec. 402 commodities 1.8 Other non-project 175.9 53.0 Total: non-project 175.9 '~4 () ~j •
Pro.ject 42.1 26.4 Total: defense support 218.1 01.2
B. TeChnical Cooperation
C. Direct Forces support Non-project t.:.I 43.8 21.8 Project 5.B 5.1 Total : Direct Forces support 49.7 20.9
D. Total (A +B+C ) 267.8 108.1
E. P/L 480 Title I 'Ti tle II
Fo Total non-military aid 267 . i3 108.1
G. D.L.F. disbursements
a7 rroe:rarllmed as of April 30, 1961. 5/ After 1955 principally Sec. 402 COl11lHodi ty sales ~/ 'Phrough Hay 1961
1955 1956 1957 1958
27.8 31.0 26.8 27.1 41.1 19.0 10.9 6U.9 50.0 37.7 27 .1 28.6 24.7 39.7 26.8 97 .5 7L.7 77.L 53.9
2.4 3.3 3.4 3.1
2L~.4 9.6 6.5 7.f3 5.1 .8 .2
2).5 10.£1 6.7 708
129.5 88.3 (37.5 .9
9.3 11.8
129.5 88.3 96.8 76.6
Note: For explanation of terms see Glossary of Aid Terms on the following page.
ICA.
.. ",.
1961~ Total
1959 1960 FY1951-66
32.5 24.8 171.8 7.6 25.2 11 332.7
40.1 50.0 it] 50G.5 21.4 7.8 7 217.5 01.5 57.1) 50 722.0
2.5 2.4 2.1 17.1
6.4 3.8 124.1 17 .1
6.4 3.B 141.2
70.5 64.0 52 880.6
19.2 9.7 50.0 2.) 2.9
.6 76.6 70 933.3
1.9 9.L 12.6 ~ 11.3

• '* "
. -
':;;'3..b1e XX (cont:iIui"ed)
Glossary of Aid Terms
Defense Support - Aid designed to permit the economy to support an agreed level of defense expenditure, but for which the IVdnistry of National Defense is not specified as end-user ..
Direct Forces Support - Aid ai.'Ililllr to SUP?8tt that its end-user the Ministry of National Defense.
Non-project Aid - Aid in the form of financing either of general coml1odities or of specific items designed to be used in projects not under ICA supervision~
Sec .. 402 Commodities - Surplus agricultural cOl'lmodities imported under nonproject aid but forming an integral pa.rt of the ICA program and defined as goods normally required by the countr;;r.. These items are sold for local currencYQ
Project Aid - Aid the end-use of which is in a project sponsored by ICA"
Technical Cooperation - Technical aid not directly related to an ICA-financed project,; sometimes referred to as "Point 4.1!
Public Law 480 Title I - Import for sale of surplus agricultural commodities --considered in excess of the previous requirements of the
country and not considered part of the ICA aid program proper. Title II - Imports of surplus agricultural commodities under
emergency situations.
Development Loan Fund - Aid based upon a specifically approved project-type loan of the DLF ..

CHINA
• () Toiwon
PHILIPPINES
f
• .. -_ t
, .. !l
SOUTH CHINA.
SEA
MAY 1961
PHILIPPINE SEA
TA IWAN REPUBLIC OF CHINA
I I I I I I I I I I I Railroads
Main Roads Mountainous areas of 3000 feet and over
o 5 10 15 20 25 30 Mil ••
I I I I I I I
IBRD 633