An analysis of a herd-based lactation curve reveals ... - ThaiJo
Upload
khangminh22Category
view
0download
0
E-05 Herd Management Plan - West Elk Mountains -
Game Management Units 53, 54, & 63
Draft: February 22, 2018
Colorado Parks and Wildlife
300 W. New York Ave.
Gunnison, CO 81230
Prepared by:
Kevin Blecha (Terrestrial Biologist: Area 16)
1
Table of Contents
Executive Summary ....................................................................................................................................... 2
Introduction and Purpose ............................................................................................................................. 4
Description of Herd ................................................................................................................................................... 4
Combining E-41 and E-52 to a single West Elks herd (E-05) ...................................................................................... 4
Herd Population Dynamics and Hunting History .......................................................................................... 5
Population Estimation Methods................................................................................................................................ 5
Population History ..................................................................................................................................................... 6
Harvest Management History ................................................................................................................................. 10
Herd Distribution and Carrying Capacity .................................................................................................... 12
Elk Distribution ........................................................................................................................................................ 12
Vegetation Characteristics ...................................................................................................................................... 13
Habitat Capability and Condition ............................................................................................................................ 14
Conflicts with Agriculture ........................................................................................................................................ 16
Anthropogenic Development .................................................................................................................................. 16
Public Involvement ..................................................................................................................................... 18
Open Comment Period on Draft Plan ..................................................................................................................... 20
Stakeholder Meetings ............................................................................................................................................. 20
Proposed Management Objective Alternatives .......................................................................................... 21
Preliminary Preferred Management Objective Alternatives ...................................................................... 23
Implementation .......................................................................................................................................... 24
Appendix 1: Evaluation of merging E-41 with E-52 as a single herd (E-05). ............................................... 25
Population history comparison between E-41 and E-52 ......................................................................................... 26
Social comparison between E-41 and E-52 ............................................................................................................. 31
Appendix 2: Population Estimation Methods ............................................................................................. 32
Appendix 3: Elk movement studies ............................................................................................................. 33
Appendix 4: Discussion on E-05 Carrying Capacity ..................................................................................... 37
Appendix 5: Public Input Results ................................................................................................................ 41
Section 1: Scoping meeting live audience polling ................................................................................................... 41
Section 2: Randomized hunter and landowner online survey ................................................................................ 42
Section 3: General public online survey .................................................................................................................. 50
Section 4: Attached Comment Letters .................................................................................................................... 56
References .................................................................................................................................................. 67

2
Executive Summary DAU E-05: West Elk Mountains Elk Herd (formerly E-41 and E-52)
Game Management Units: 53, 54 & 63 Landownership: 27% private & 73% Public Post-hunt population size (2016): 7150 elk Post-hunt sex ratio (bulls:100 cow): 29 (modeled 3 yr avg.) Prior herd plan objectives: 5200 – 5900 elk, 18-23 bulls:100 cows 2017 herd plan objectives (Preliminary Preferred): 7800-8800 elk, 23-28 bulls:100 cows (modeled 3 yr avg.)
This E-05 plan reflects the merging of E-41 (GMU 54) and E-52 (GMU 53 & 63). Combining these into a
single “West Elk Mountains Elk Herd”, will allow the elk population to be managed at a biologically
appropriate scale given CPW’s management by objective approach. The E-05 GMUs are managed with a
partially limited licensing strategy to provide ample elk hunting opportunity.

3
The management alternatives selected in this plan will ultimately be used on an annual basis for setting
license number allocations. Formation of the primary objective (population size) is made considering the
partially limited licensing strategy, stakeholder input, and carrying capacity history. Formation of
secondary objectives (bull ratio and license allocation strategy) should consider the population size
alternatives. The bull ratio objective cannot be modified considering the over-arching strategy to
manage for ample hunting opportunity in this herd. The spatial license allocation strategy objective was
formed based on desires of stakeholders and the need to actively manage the inter-GMU spatial
distribution of elk. The following set of objectives and corresponding alternatives were examined:
Objective Alternatives
Population Size #1: 6600 - 7600 elk (status quo)
#2: 7800 - 8800 elk (CPW staff preferred)
#3: 8500 – 9500 elk
Bull Ratio #1: 18-23 bulls:100 cows (E-52 former status quo objective)
#2: 23-28 bulls: 100 cows (E-41 former status quo objective, CPW staff preferred)
Spatial License Allocation Strategy
#1: Cow licenses are allocated disproportionally among GMUs to manipulate elk distribution (CPW staff preferred)
#2: Cow licenses are allocated spatially among the GMUs according to the 2006-2017 inter-GMU proportions.
Desires of stakeholders were characterized through an extensive public input gathering process that
included: a public scoping meeting, a survey of a randomized set of elk hunters and landowners, a
survey open to the public, and a 30-day public comment period. The CPW staff preferred alternatives
identified in the table above best reflect the desires measured in the public input process.
Stakeholder desires must be balanced with the carrying capacity of the landscape in E-05. In the past
(i.e., prior to 2007), E-05 rangelands have experienced over-grazing by wild and domestic ungulates.
Wild ungulate numbers (mule deer and elk) have been decreased by CPW in response to the overgrazing
issue. Current (>2010) surveys indicate that vegetation has likely recovered. E-05’s historic population
size and habitat condition history were considered in range of population size alternatives. However, the
distribution of elk within E-05, rather than the overall population size, underlies most of E-05’s current
elk management issues. As indicated by CPW data on elk movements and public opinion surveys, elk
distribution is currently skewed toward lands where elk hunting pressures are low. This distribution
issue will be ever-evolving (and possibly increasing) as other pressures (highway traffic, recreation, land
management practices, spruce beetle) further redistribute elk. Monitoring of elk movements via GPS
collar studies are helping managers better understand the relative importance of each elk distribution
driver.
The CPW staff preferred population size alternative is #2; an approximate 17% increase (from 7150 to
7800-8800 elk). The Bull ratio alternative preferred by CPW staff is #2 (23-28 bulls:100 cows), which
most closely represents the bull ratio objective in the former E-41 (GMU 54) plan. The preferred spatial
license allocation strategy alternative is to allocate cow licenses disproportionally among the three
GMUs to spatially distribute elk relative to stakeholder desired population size change in each GMU.
Future management actions may consider manipulating elk distribution through annual license
allocations and hunt code manipulations (i.e., sub-unit and special seasons) to increase hunter
encounters with elk and discourage elk utilization of lands where rangeland conflicts are most
pronounced.

4
Introduction and Purpose Colorado Parks and Wildlife (CPW) manages wildlife for the use, benefit and enjoyment of Colorado’s
people and visitors. Management of big game wildlife populations is conducted with a “Management by
Objective” approach, in which each big game population is managed to achieve objectives for its defined
herd. Defined herds are bound geographically as Data Analysis Units (DAU) which delineates a grouping
of animals that has little spatio-temporal overlap with neighboring herds. Ideally, it delineates where
most animals in the herd birth, live, and die. A herd is often divided into several game management
units (GMUs) to distribute hunters and harvest within the herd. The term “Data Analysis Unit Plan” was
abandoned in January 2018 for “Herd Management Plan” in order to improve the line of communication
between biologist, the public, and other CPW staff.
The primary purpose of a herd management plan is to establish management objectives pertaining to a
DAU. For herd E-05, the plan establishes management objectives in terms of a desired elk population
size range (primary) and sex ratio range (secondary). Management objectives established in this plan
must abide by statutes and policies set forth by the CPW’s Big Game Season Structure, CPW’s Strategic
Plan, Parks and Wildlife Commission, and the Colorado State Legislature. E-05 is currently designated by
the Colorado Parks and Wildlife Commission as a partially unlimited license unit for providing hunter
opportunity. Thus, a mixture of limited licenses, over-the-counter bull licenses, and antler point
restrictions, are used to provide ample opportunity for bull hunters, while allowing some control over
bull ratios. Herd management plans also identify and carefully consider issues and topics important to
big game management, which are broadly categorized as those pertaining to herd population dynamics
and hunting history (pp. 6-12) or herd distribution and carrying capacity (pp. 12-18). Herd management
plan objectives are established by considering the best available scientific data along with the desires of
stakeholders through a public input gathering process (pp. 19-20 and Appendix 5).
The alternatives selected in this plan will drive annual elk license setting decisions, which are designed
to maintain or modulate the elk population and meet the objectives established in this plan. The plan
also describes additional strategies and techniques that will be used to achieve the herd objectives.
Description of Herd
E-05 is located in southwest Colorado and spans northwestern Gunnison county, eastern Delta county,
and northeastern Montrose county. It consists of Game Management Units 53, 63, and 54 (Fig. 1),
covering 1351 square miles. The West Elk Mountains, the predominant land feature, is in the center of
E-05. A description of the current vegetation can be found in the herd distribution and carrying capacity
section below.
Landownership is dominated (72.6%) by public lands managed by the United States Forest Service
(USFS), Bureau of Land Management (BLM), National park Service (NPS), and the state of Colorado
(Colorado Parks and Wildlife and State Land Board) (Fig. 1). 6.7% of the land is private land protected
with conservation easements. The remaining (20.6%) are privately owned and managed lands.
Combining E-41 and E-52 to a single West Elks herd (E-05)
Prior to the creation of this plan, E-05 was composed of two DAUs, E-52 and E-41. E-52, (which was
denoted as the Coal Creek/ Fruitland Mesa Herd), was comprised of GMU 53 and 63. E-41, (denoted as
the Sapinero Herd), was comprised solely of GMU 54. A complete discussion of the process and

5
justifications taken into consideration for merging the E-41 and E-52 DAUs as DAU E-05 (West Elk
Mountains Herd) is discussed in Appendix 1.
Figure 1. Location of DAU E-05, GMU 53, 54, and 63 boundaries, public land ownership (shaded), private
land (un-shaded), cities, and major roads.
Herd Population Dynamics and Hunting History
Population Estimation Methods
Estimating numbers of wild animals over large geographic areas is a difficult and approximate science.
Colorado Parks and Wildlife recognizes the difficulties of estimating the size of big game populations as a
challenge in managing populations. The agency utilizes flexible population estimates that incorporate
the latest technologies available and complimenting data sources. As additional years of data are added,
the accuracy of prior year estimates are improved, thus ultimately improving current estimates.
The population objective range depends on the population estimate derived at the time the herd
management plan was being created. However, population modeling is an evolving process whereby
modeled estimates can change over time based on additional data or improved modeling methodology.
CPW managers have conducted two major revisions in the E-41 population model since the 2001 herd
management plan and one major revision in the E-52 population model since the 2005 plan. These
changes ultimately improved the model, but also resulted in a large increase of the estimated
population size at two points in time (post-hunt 2004 and 2010) (Fig 2). No actions were taken
concerning elk license allocations when these changes in population estimation methods occurred; an
actual population change on the ground did not occur. An adjustment, or index, to the population size

6
objective can be calculated by examining the difference observed in the published population estimate
at the time of the herd management plans creation and the retrospective population size estimates
derived with the most recent population model (June 2017). To account for uncertainty in this disparity,
we computed the average difference in annual population size estimates originating from the two
models during 1999-2003 for E-41, and 2000 – 2005 for E-52. The retrospective estimates of population
size were on average a factor of 1.26 and 1.72 (1.39 combined) times higher than what was generated
and published on an annual basis for E-41 and E-52 respectively. Thus, the revised population size trend
(Fig. 2) is the best information CPW has available; past published population estimates for a particular
year are less accurate. If the population objective of 5550 elk (midpoint determined by the 2001 E-41
and 2005 E-52 plan) was adjusted retrospectively in accordance with the two herd’s adjustment factors,
an adjusted objective of 7812 elk would be realized (Fig. 2). Given this information, the 2016 E-05
population estimate is actually just under the relative population objective desired in the prior herd
management plans.
Population objective adjusting with an amendment is a concept that has been extensively discussed, but
rarely officially implemented by CPW. In situations where population models are updated with new data
(as done annually in E-41 and E-52) or with new parameters that result in more accurate population
estimates, an existing herd plan could be modified with a simple amendment. As demonstrated in the
2001 – 2016 example expressed above, population adjusting with an adjustment factor could be
conducted by examining the change in population size of a new population model compared to the
existing model. If functional changes to the model in the future result in changes in the population
estimate, but not changes in management, the population objective can be modified with a short herd
management plan amendment. Failing to adjust population size objectives when model changes occur,
or after several years of data has been collected, can mislead annual harvest management decisions to
the extent of bringing the population out of line with stakeholder desires or is sustainable by the land.
Simply stated, an amendment would not change the number of animals on the ground. An amendment
is intended to sync the most up-to-date population estimate with the current herd management plan
objectives. This in turn, will help substantiate annual management prescriptions.
Population History
Examining the E-05 herd retrospectively with the most current population model indicates that E-05
experienced three major population size trajectories (changes) since 1980 (Fig. 2):
1) 1980-1989. During this period, the population grew rapidly. Elk harvest ranged from 200-500
cows annually, representing a 6% harvest of the pre-hunt cow elk population segment.
2) 1990 – 1998. The population was decreased intentionally in response to high elk numbers the
prior decade. Elk harvest averaged 830 cows annually, representing a 14% harvest of the pre-hunt cow
elk population segment.
3) 1999 – 2016. The population was decreased again (primarily in E-41), but at a slower rate with
approximately 650 cows harvested annually. This represents a 13% harvest of the pre-hunt cow elk
population segment.
Bull ratios (bulls per 100 cows) experienced an overall increase since 1980 (Fig. 3). Contributions to this
increase include changes in bull ratio objectives, a 4-point antler restriction implemented in 1986, and

7
an overall high cow harvest. Given the partial over-the-counter licensing strategy used in E-05, the
actual bull harvest in a given year cannot be fully controlled by license allocations in these units.
Figure 2. Population size trend estimates and corresponding herd management objectives. Current
(2017) best estimates (blue) are more realistic and have smoother estimates over estimates published
annually (yellow). The indexed objective (dotted red line) is the old combined population objectives (solid
red line) of the prior E-41 and E-52 plans, scaled by an average factor of 1.39 to reflect the revised
retrospective population estimate.
Since the 1980s, the E-05 herd has experienced a decline in calf ratios (calves per 100 cows; Fig. 4). Calf
ratios measured post-hunting season are a partial measure of reproductive performance. Calf ratios
have declined gradually from 47 to 38 calves:100 cows since 1980 (Fig. 4). This decline in calf ratios is
likely contributing to a declining percentage in the pre-hunt cow harvest segment needed to maintain
this herd. This decline is also observed in many other Colorado Elk herds, with the steepest declines in
the more southerly latitudes. E-05’s calf ratio currently approximates Colorado’s statewide five-year
average calf ratio of 39:100.

8
Figure 3: Modeled (red) and observed (blue) bull ratio estimates (bulls:100 cows) and corresponding 95%
confidence intervals (blue and red shading). Previous herd plan objectives (gray) were not published as
ranges, but as a single fixed point objective. Objective range is shown corresponding to +/- 15% of this
fixed objective. Annual management decisions consider the modeled bull ratio and running three-year
average observed (green) bull ratio.

9
Figure 4. E-05 observed calf ratios (post-hunt calves per 100 cows) 1980 – 2016 (black line). Smoothed
trend and 95% confidence interval of calf ratio (blue line and gray shading).
The predominant driver of elk population size in this unit appears to be adult female harvest and natural
calf survival. A variety of non-harvest related mortality factors can influence population growth rates,
depending on whether they are compensatory or additive. Cow and calf natural mortality rates (deaths
unrelated to hunter harvest) measured with VHF telemetry in 2000 – 2001, across the Gunnison Basin,
found that annual and over-winter survival rates were high, but comparable to other studied
populations (Freddy 2002). Given the 98% annual survival rate and 84% calf survival rate measured, only
a small number of mortalities were found and investigated. They found that the proximate cause of
death for 21 collared calves included predation (53%), malnutrition (24%), and other sources (23%).
Given the high elk population size at that time (Gunnison Basin wide), predation and malnutrition were
likely compensatory mortality factors with each other. Habitat quantity and quality are recognized by
wildlife managers as being the predominant driver of non-hunting mortality and reproduction in elk
populations. Stakeholders also appear aware; public input surveys indicate that habitat quantity/quality
are of a high to moderate level of concern (Appendix 5, Section 2, Question 11).
The effects of wild predators are not always clear. Whether predators are severely limiting elk depends
on how close the elk population is to carrying capacity. At relatively high elk population sizes (closer to
carrying capacity), predation likely has little additive effect. Predation could be more concerning if the
elk population size is low (well below carrying capacity). Carrying capacity can change depending on
rapidly changing ecological conditions (i.e., extreme winter or drought). Prior to concluding that high
predation rates have an impact on elk population growth, it should be determined whether predation is
the ultimate or proximate cause of death. Ultimate causes of death, such as from the contraction of a
fatal disease or poor body condition, must be considered when the cause of mortality appeared to be
predation. Public input surveys indicate that predator impacts to populations of deer and elk are of a
moderate to low level of concern (Appendix 5, Section 2, Question 11).
Diseases can ultimately decrease population growth rates if ever established at a sufficient high
prevalence. Currently, the influence of disease presence (CWD, adenovirus, EHD or blue-tongue) on the
E-05 population size is unknown given the lack of standardized disease surveillance. It is noted that EHD

10
has been detected opportunistically in wild ungulates inhabiting E-05. While very little rigorous CWD
prevalence monitoring has occurred in the West Elk Mountains, CWD has been detected in wild
ungulates of neighboring vicinities (GMU 64, 65, and 521). Given that aggregations of ungulates on the
landscape can increase transmission rates of diseases like CWD (Farnsworth et al. 2005), areas where elk
seek refuge from hunters are of special concern. Public input surveys indicate that disease impacts to
deer and elk populations of are of a high level of concern (Appendix 5, Section 2, Question 11).
CPW is currently monitoring the survival rates of adult female elk with GPS collars throughout the
Gunnison Basin GMUs and North Fork GMUs 53 and 63. Results of this study can help discern sources of
mortality and provide additional information for the estimation of elk population sizes.
Harvest Management History
Carefully regulated harvest of the elk population’s cow segment is the primary tool to maintain or drive
an elk herd’s size to the management plan’s established objectives. Elk harvest regulations have
changed over time. The following chronology of regulations have occurred for most over-the-counter elk
units across Colorado.
- 1986: 4-point antler restrictions put into place for 1st and 2nd rifle seasons.
- 1996: 4-point antler restrictions put into place for all elk seasons
- 2000: 1st rifle seasons became limited
- 2005: 4th rifle season became limited
- 2010: Muzzleloader season became limited
Manipulating population sizes is done by providing a certain number of hunters with the opportunity to
harvest cows via licenses. The number of licenses allocated in a particular season is based on the prior
year’s data of 1) licenses allocated by CPW, 2) number of hunters that went afield, 3) number of elk
harvested. Hunter success rates can be measured as either elk harvested per licenses allocated or by the
number of hunters afield. The number of harvests per the total hunters afield is the metric published
annually by CPW (Fig. 5), and is most important to a hunter’s experience in terms of hunter crowding
levels. However, harvest success rates per licenses allocated are most important metric for the annual
license allocation process. Given that success measures vary annually with response to weather and
survey error, a three-year average harvest success rate is actually used. Overall (1980-2016) harvest
success for seasons with limited licenses averaged 19% ranging between 12.9 and 29.6% (Fig. 5).
While a majority of the harvest management strategy focus in E-05 the past two decades has been
placed on lowering the overall elk population size, a few harvest strategies have been implemented to
manipulate elk distribution in order to 1) help address agricultural conflicts, and 2) hold elk on public
lands to provide hunter opportunity.
In 2010, a limited licenses regulation was placed on GMU 54’s archery season to reduce hunting
pressure on elk summer range that could be causing elk to seek refuge on lower elevation private lands.
Other strategies implemented over the past decade to help manipulate elk distribution and reduce
overall numbers included:
- Either sex licenses in place of bull only licenses
- Either sex, Over-the-counter licenses with caps for 2nd season.
- Expanded late rifle seasons

11
- List B cow licenses
- List C Private-land-only cow licenses
- Sub-unit hunts targeting conflict areas like Ohio Creek (GMU 54) and areas west of Hwy 92
(GMU 63)
Manipulating bull ratios in E-05 toward a target objective is not straightforward given the partially OTC
licensing strategy. Overall, regulations regarding limited licensing and 4-pont restrictions have
contributed the most to manipulating bull ratios. Given the partial over-the-counter licensing strategy
used in E-05, the actual number of bull-hunters in the field in a given year cannot be controlled.
Manipulating bull ratios based solely on the current limited licenses (1st and 4th rifle seasons) may have
some influence on bull ratios in certain years. However, any modulation in the bull ratio composition
perceived by hunters on the ground will likely result in short term changes in OTC bull harvest success,
by attracting more or less OTC bull hunters in future years.
Figure 5. E-05 estimated number of hunters (black) and hunter success rates by the percentage of
hunters afield (red) 1980-2016.
The number of hunters afield is important to consider for hunter crowding issues, when hunter numbers
are considered in relation to GMU size, elk distribution, and accessibility. Hunter numbers, and the
distribution of hunters, influences elk distribution on the landscape. Various studies indicate that elk
movement rates increase with response to hunting pressure (Johnson et al. 2002, Rumble et al. 2005,
Cleveland et al. 2012). Speculations are also made that elk may decrease home range sizes during
hunting seasons, thus requiring hunters to traverse more area before encountering an elk. Decreases in

12
home range size during the hunting season may contradict the effect of increased elk movement rates
on hunter-elk encounterability. Elk hunter density must also be considered in conjunction with human
pressures outside of the control of this plan. Hunters seeking other game (mule deer, bear, bighorn,
dusky grouse) and non-hunting recreation pressures in E-05 should be considered when developing
management plans for those species. Public input surveys indicate that human pressures on elk
distribution, whether they are from hunters or non-hunters, are of a moderate level of concern
(Appendix 5, Section 2, Question 11).
Herd Distribution and Carrying Capacity
Elk Distribution
Throughout the year, elk can potentially occupy any locality within E-05. However, the spatial
distribution changes throughout the annual cycle. No quantifiable data has been collected on the
spatial-temporal heterogeneity in E-05 elk density. Elk generally follow a typical seasonal migration
pattern in E-05, with the utilization of higher elevations in the summer, and lower elevations in the
winter. However, in some cases, elk wintering in GMU 54 move to a nearly equal elevation for summer
range; migration appears to be driven partially by moisture availability in the northern West Elk
Mountains. In GMU 53, the knowledge of elk distribution is limited to data collected on elk collared on
winter ranges of neighboring GMUs and a small telemetry study in the early 1990s, in addition to expert
opinion maps of elk winter range, critical winter range, and severe winter range (Fig. 6).
Figure 6. Polygon range maps derived by CPW staff depicting elk winter range (light blue shading), elk
winter concentration areas (medium blue shading), and elk severe winter range (dark blue shading).
13
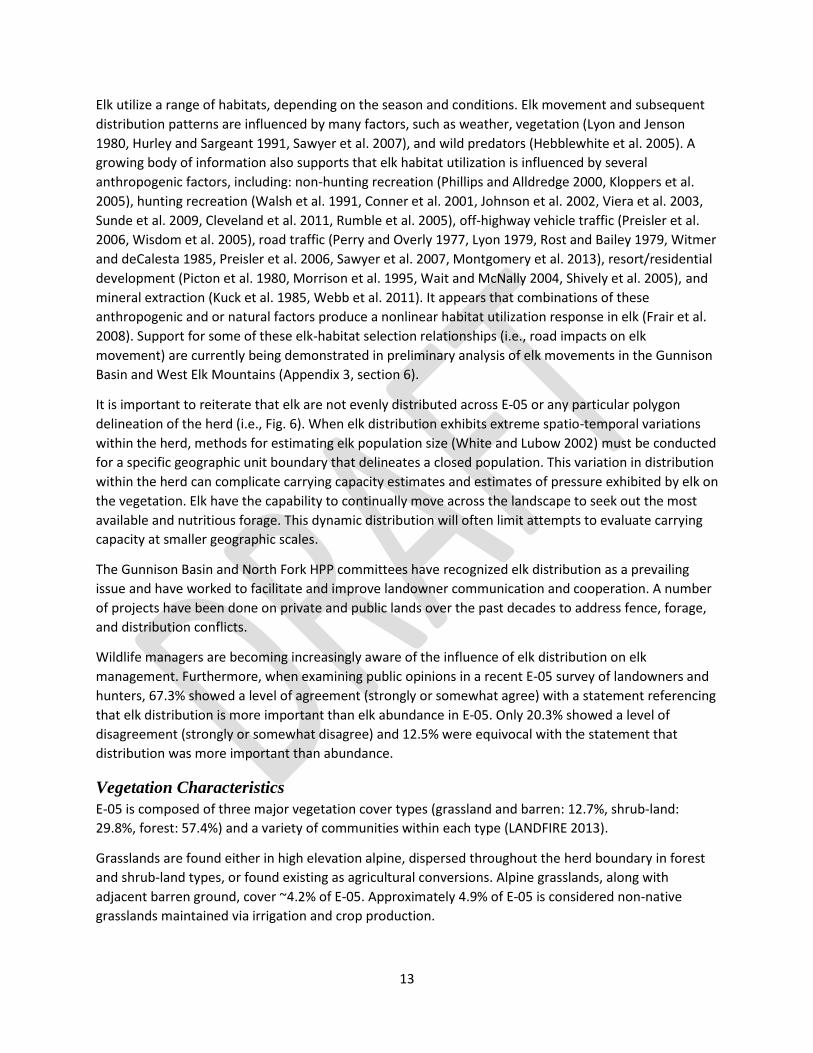
Elk utilize a range of habitats, depending on the season and conditions. Elk movement and subsequent
distribution patterns are influenced by many factors, such as weather, vegetation (Lyon and Jenson
1980, Hurley and Sargeant 1991, Sawyer et al. 2007), and wild predators (Hebblewhite et al. 2005). A
growing body of information also supports that elk habitat utilization is influenced by several
anthropogenic factors, including: non-hunting recreation (Phillips and Alldredge 2000, Kloppers et al.
2005), hunting recreation (Walsh et al. 1991, Conner et al. 2001, Johnson et al. 2002, Viera et al. 2003,
Sunde et al. 2009, Cleveland et al. 2011, Rumble et al. 2005), off-highway vehicle traffic (Preisler et al.
2006, Wisdom et al. 2005), road traffic (Perry and Overly 1977, Lyon 1979, Rost and Bailey 1979, Witmer
and deCalesta 1985, Preisler et al. 2006, Sawyer et al. 2007, Montgomery et al. 2013), resort/residential
development (Picton et al. 1980, Morrison et al. 1995, Wait and McNally 2004, Shively et al. 2005), and
mineral extraction (Kuck et al. 1985, Webb et al. 2011). It appears that combinations of these
anthropogenic and or natural factors produce a nonlinear habitat utilization response in elk (Frair et al.
2008). Support for some of these elk-habitat selection relationships (i.e., road impacts on elk
movement) are currently being demonstrated in preliminary analysis of elk movements in the Gunnison
Basin and West Elk Mountains (Appendix 3, section 6).
It is important to reiterate that elk are not evenly distributed across E-05 or any particular polygon
delineation of the herd (i.e., Fig. 6). When elk distribution exhibits extreme spatio-temporal variations
within the herd, methods for estimating elk population size (White and Lubow 2002) must be conducted
for a specific geographic unit boundary that delineates a closed population. This variation in distribution
within the herd can complicate carrying capacity estimates and estimates of pressure exhibited by elk on
the vegetation. Elk have the capability to continually move across the landscape to seek out the most
available and nutritious forage. This dynamic distribution will often limit attempts to evaluate carrying
capacity at smaller geographic scales.
The Gunnison Basin and North Fork HPP committees have recognized elk distribution as a prevailing
issue and have worked to facilitate and improve landowner communication and cooperation. A number
of projects have been done on private and public lands over the past decades to address fence, forage,
and distribution conflicts.
Wildlife managers are becoming increasingly aware of the influence of elk distribution on elk
management. Furthermore, when examining public opinions in a recent E-05 survey of landowners and
hunters, 67.3% showed a level of agreement (strongly or somewhat agree) with a statement referencing
that elk distribution is more important than elk abundance in E-05. Only 20.3% showed a level of
disagreement (strongly or somewhat disagree) and 12.5% were equivocal with the statement that
distribution was more important than abundance.
Vegetation Characteristics
E-05 is composed of three major vegetation cover types (grassland and barren: 12.7%, shrub-land:
29.8%, forest: 57.4%) and a variety of communities within each type (LANDFIRE 2013).
Grasslands are found either in high elevation alpine, dispersed throughout the herd boundary in forest
and shrub-land types, or found existing as agricultural conversions. Alpine grasslands, along with
adjacent barren ground, cover ~4.2% of E-05. Approximately 4.9% of E-05 is considered non-native
grasslands maintained via irrigation and crop production.

14
Shrubland communities, comprising almost one third of E-05, exist as: Gambel oak shrubland alliance
(42%), Inter-mountain basin big sagebrush shrubland (24.3%), Rocky Mountain lower montane foothill
shrubland (20.4%), and inter-mountain basins mixed saltbrush shrubland (4.1%) other types include
various sagebrush alliances, greasewood flat, and gambel oak alliances.
Conifer forest make up 60.7% of the all forest types in E-05. Forests are comprised of aspen or aspen-
conifer mixed woodlands (37.9%), spruce-fir forest and woodlands (32.5%), pinyon-juniper woodland
(14.1%). The remaining woodland types are Douglas-fir associations (9%), lodgepole pine (3.78%),
riparian woodland/shrubland mixes (1%), and agricultural-orchards (0.02%). Aerial survey data indicates
that approximately 60.2 square miles of forest in E-05 have been affected by an ongoing spruce beetle
epidemic in E-05 between 2006 and 2016 (Fig. 7). This impacted area is approximately 13% of all conifer
forest types mapped and 24% of all spruce-fir forest and woodlands in E-05. Most of the impacted areas
are in GMU 54, but it appears that beetle impacted areas continue to grow.
Figure 7: E-05 spruce beetle affected areas by year: 2006 – 2013 (gray shading), 20013-2015 (brown
shading), 2016 (red shading).
Habitat Capability and Condition
Several factors influence how many animals can be supported on a landscape. Habitat or biological
carrying capacity is a landscape’s ability to provide food and shelter for a particular species. Biological
carrying capacity is an important variable when recognizing density dependent population responses.
Given a finite level of food and cover resources, an ungulate population can become self-limiting under
certain conditions; rates of survival and reproduction will decline as population density reaches habitat
carrying capacity. Definitive estimates of carrying capacity are not available in E-05; capacity can vary
spatially and temporally in response to weather, site history, and inter-specific competition. For a long-

15
lived species, such as elk, fluctuations in weather patterns from year to year make it difficult to manage
toward the higher carrying capacities afforded in years of good forage availability and fair weather.
Social carrying capacity is also important, as it is the number of animals that human society may accept
or desire on the landscape. Social carrying capacity does not have any intrinsic effects on elk population
size, such as the way biological carrying capacity would. Social carrying capacity is determined by the
public input process discussed in this plan.
A particular focus of current vegetation monitoring by land managers has been placed on monitoring
sagebrush habitats for Gunnison Sage-grouse (GUSG), a threatened species protected under the federal
Endangered Species Act. GUSG habitats are also important areas for elk winter range (Fig. 6). Thus far,
no research has been conducted to examine direct impacts of elk populations on the GUSG. Speculation
has existed that impacts to vegetation in and around grouse nests can occur in areas heavily used by
wild and domestic ungulates. Recent GUSG studies conducted specifically in the Gunnison Basin, during
a period when vegetation characteristics were within the optimal range, found that changes within that
optimal range were not strongly indicative of GUSG nest success (Stanley et al. 2015, Davis et al. 2015).
However, any extreme deviations in vegetation height outside the optimal range should be cautioned
against (Davis et al. 2015). Managers should be cognizant of any ungulate mediated decreases in
sagebrush cover below 10% (at the 1-2 acre scale), as this appears to influence GUSG nest site selection
(Oyler McCance et al. 2001, Aldridge et al. 2012) and is the minimum of the GUSG Rangewide
Conservation Plan guidelines (GSRSC 2005).
While large spatial and temporal scale quantitative information on carrying capacity is unavailable,
various vegetation assessments and surveys have been conducted on smaller spatio-temporal scales
(relative to E-05’s extent) that offer land managers clues on the overall wild and domestic animal
carrying capacity in E-05. Information from 17 projects are summarized in Appendix 4 to help provide
discussion and justification for the elk population objective alternatives considered in this plan. Based on
this information, relative to the mid-1990’s to mid-2000’s, E-05 has shown an overall improving trend in
range condition over the past 10 years. While sagebrush habitat characteristics of GMU 54 are within
guidelines for GUSG habitat (GSRSC 2005), certain localities within GMU 63 are well below. It is
undocumented whether a full recovery in all shrub species (serviceberry, mountain mahogany, and
antelope bitterbrush) has occurred E-05 wide. Recent vegetation measures collected on elk winter range
by the BLM AIM monitoring program indicate that BLM lands within the Gunnison Basin are currently
meeting GSRC (2005) guidelines for sage-grouse (Appendix 4). Other similar vegetation measurement
projects collecting data for GUSG monitoring purposes (Summarized in Appendix 4 - Williams and Hild
2012: 2011, Davis et al. 2015: 2005-2010) indicated that Gunnison Basin vegetation from 2005 through
2011 was within the GSRC (2005) guidelines. During this 2005-2011 period, approximately 30-40% more
elk were present on GMU 54 winter-range (Figure A1.1: E-41 population trend) than are present at the
time of this elk plan’s development, thus elk are not currently considered a limiting factor for GUSG
within GMU 54.
It is recognized that managing a wild population to a size that is well below carrying capacity of the
habitat results in the highest reproductive rates. Managing a population toward high elk population size
objectives can occur in fair weather years with good forage. However, years of extreme winter weather
or extended drought may result in an abnormally low biological carrying capacity for all ungulates (wild
and domestic). These temporary, but extreme, weather events can negate managers’ efforts to maintain

16
high wild animal populations. For instance, even during years of above average range quality, a winter
with abnormally high snow depths can physically limit ungulate’s ability to access the available
vegetation.
The E-05 public appears to be at least partially aware of issues involving carrying capacity for ungulates.
When asked in a recent survey of hunters and landowners opinions, habitat quality and quantity ranked
as one of the top issues concerning deer and elk management (Appendix 5, Section 2, question 11).
The degree of range overlap among other wild ungulate species (i.e. mule deer) must also be considered
for understanding carrying capacity. A detailed discussion of ungulate habitat carrying capacity in
reference to mule deer can be found in Diamond (2013).
Conflicts with Agriculture
Agricultural activities consist of rangeland grazing by cattle and sheep, hay production (grass and
alfalfa), and hobby livestock interests. It is estimated that ~5% areal coverage of E-05 is croplands
consisting of irrigated hay meadows and terraces planted with annually harvested non-native forage,
with smaller concentrations of row crops and orchards in GMU 53 and 63. Most agricultural interests in
E-05 are based on private cow-calf operations that utilize federal (BLM and USFS) grazing allotments
during the spring and summer. However, domestic sheep grazing occurs within GMU 53 and 63 on
public lands in both the winter and summer.
Efforts to resolve conflicts between elk and agricultural producers have been an ongoing issue in E-05.
Since 1997, 30 elk damage claims, totaling $42,184 have been paid by CPW to ag-producers for conflicts
with elk on private lands in E-05. CPW has implemented various management actions in order to
alleviate forage competition on public lands, along with actions meant to reduce ag/elk conflicts on
private lands. These efforts include: overall elk population size reductions, manipulating animal
distribution through road closures (County Road 77 – GMU 63) and habitat treatments, improving
forage quality through fertilizer purchases (HPP), hay stack-yard construction, and providing fencing
materials (HPP). Agricultural economic losses from wild ungulates are one of the least concerning issues
to respondents of a recent survey of E-05 stakeholders (Appendix 5, section 2, question 11). Despite the
low level of public concern, CPW must remain cognizant of conflicts between elk and ag producers.
Besides CPW being financially responsible for conflicts resulting in game damage claims, private lands
provide habitat for elk at certain times of the year, especially for transitory and winter elk range.
Anthropogenic Development
Elk have been shown to be negatively influenced by residential development (Wait and McNally 2004).
Exurban (1.7 – 40 acres per housing unit) and suburban housing densities (<1.7 acres per housing unit)
have a combined 2.1% areal proportion of the E-05 land area (Bierwagen et al. 2010). Rural developed
private lands (>40 acres per housing unit) cover approximately 16.3% of E-05. Census data of E-05
indicate a 2010 human population size of 14,143 and a housing unit count of 7,587 (US Census Bureau).
80.8% of these housing units have full-time occupancy. Between 1980 and 2010, the amount of E-05
land area characterized as exurban and suburban has increased by 91.6% (Bierwagen et al. 2010). This
has been accompanied by a 55.6% increase in total population size across the counties of Gunnison,
Montrose, and Delta from 1980 (56,266 people) to 2010 (87,552 people) (US Census Bureau).

17
The tourist based economy of E-05 ultimately results in an effectively higher degree of human presence.
In E-05, 81% of the housing units in 2010 were occupied, with 11% indicated as being used for seasonal
living (US Census Bureau). Thus, there are periods of the year (i.e., likely summer) when the actual
human population size inhabiting E-05 is much higher than the 14,143 counted in the 2010 census.
E-05 housing developments are clustered. The historic human settlement patterns and public land
configuration (Fig. 1) result in this spatial clustering of residential areas to occur primarily in long linear
patterns along roadways and drainage bottoms (Fig. 8). Most housing developments have occurred on
elk winter range (Fig. 8). It is possible that areas of rural density will be eventually converted to exurban,
and exurban converted to suburban densities. If housing densities increase in the areas already
characterized as rural development, winter range will likely become more fragmented, inhibiting the
ability of elk to move across larger expanses of traditional winter range.
A variety of elk studies have indicated that elk distribution, movements, and behavior are influenced by
vehicle traffic. Various studies indicate elk respond to vehicle traffic (OHV and highway vehicles) at
distances up to 1000 m away (Rost and Baily 1979, Preisler et al. 2006). However, the influence of roads
on elk is conditional upon several factors, such as vegetation composition (Lyon 1979, Rost and Bailey
1979) and road type (Montgomery et al. 2013). Highway vehicle traffic volumes have likely increased
since 1980 because of the human population growth. Off-highway vehicle utilization has likely increased
given that CPW’s statewide off-highway registration sales have increased by ~115% from 2001 to 2015.
Recently implemented travel management plans by the USFS and BLM will likely redistribute human
recreation activities away from certain areas, but possibly concentrate human activity in others. It is
uncertain how this redistribution of roads and traffic influences elk movements and hunter access.
Other human development activities that can be potentially negative to elk carrying capacity in E-05 are
row-crop agricultural fields and mineral extraction. While these types of developments cover a relatively
low amount of land area of E-05, they exist in a clustered pattern along the North Fork of the Gunnison
River in GMUs 53 and 63.
There are several notable examples in E-05 where private lands serve as refuges to elk during the
hunting seasons. Like many places in Western Colorado, these situations tend to occur when
landowners or land managers do not impose significant hunting pressure, essentially protecting elk.
Related to this issue, is the increasing housing density in rural and exurban areas, in which hunting
activities with firearms are often unable to be conducted safely. While a full analysis has not been
conducted of the ongoing Gunnison Basin elk movement study, cursory inspection (Appendix 3, section
5) indicates that private land refugia are present, or are becoming more prevalent. As human residential
development activities continue to expand, management techniques, policies, and regulations must
adapt to take account of this refuge behavior in elk. A recent public input survey indicated that the
highest concern for GMU 54 hunters and the third highest concern for GMUs 53 and 63 hunters was
having land accessible for hunting (Appendix 5, section 2, question 11). The same public input survey
indicated that 29% of E-05 landowners do not allow any hunting on their property (Appendix 5, section
2, question 5).

18
Figure 8. Address points (yellow dots) derived by Gunnison, Montrose, and Delta Counties overlaid on E-
05 elk winter range (blue shading).
Public Involvement CPW staff conducted an extensive public outreach effort in the development of this plan. This included a
set of public scoping meetings, a suite of three public input surveys, and an open public comment period
on a draft of the plan. The specific surveys included:
Survey 1: Public scoping meetings were held in Gunnison (to cover GMU 54) and Paonia (to cover GMU
53 & 63) in early July 2017. An audience of 19 and 25 people signed in at the Gunnison and Paonia
meetings respectively. Following an information presentation on elk population history and elk
distribution, attendees of the meeting were questioned via live audience polling. This small sample size
(43) of participants precluded a detailed quantitative analysis by stakeholder type. Given the small
sample size from the live audience polling, results from the two public meetings were combined.
Detailed results of the live audience polling can be found in Appendix 5 (section 1). A majority (58%) of
the participants represented the interest of elk hunters (Appendix 5, section 1, question 1). Overall, a
majority (66%) of the participants were in favor of some increase in elk population size from the current
level (Appendix 5, section 1, question 4). 32% of the participants were satisfied with the number of bulls
encountered while hunting, while 51% were unsatisfied with the number of bulls encountered while
hunting (Appendix 5, section 1, question 5).
Survey 2: The second survey effort reached out to landowners and hunters. This involved a pool of elk
license applicants that had applied in either GMUs 54, 53, or 63 and a pool of randomly selected
landowners holding at least 20 acres of land within 54, 53, and 63, overlapping elk range. The randomly
selected hunters or landowners received post cards directing them to a web-link hosting an online

19
survey (Survey Monkey, Inc, Palo Alto, CA, USA). A total of 609 people responded with interest in elk
management. A wide variety of questions were asked in order to help categorize respondents by
stakeholder groupings (i.e., hunters, landowners, GMU, residency, method of take) to allow results to be
analyzed by stakeholder group. Detailed results of this survey can be found in Appendix 5 (Section 2).
Most hunters, by a small majority (47.1%) indicated that they were satisfied, while 40.6% indicated they
were not satisfied with their elk hunting experiences for elk in these units, 12.2% were neither
unsatisfied nor satisfied. This satisfaction trend held true for all stakeholder groups.
Respondents were given a choice between having a future elk population size change of +35%, +17%,
0%, -17%, -35% with respect to the most current 2016 post-hunt elk population estimate. These percent
changes would correspond to a population size of 9650, 8360, 7150, 5930, and 4650 respectively
assuming the current modeled E-05 population size of 7150. Respondents were provided with a detailed
discussion (Appendix 5, Section 2, Question 9) providing anticipated outcomes and the various tradeoffs
associated with decreasing or increasing the elk population size. Given that relative differences were
equal among the incremental population size choices in the provided scenarios, a desired population
size change was calculated, based on a weighted average, for each of the stakeholder groups.
Given the various stakeholder groups examined, no majority of any group wanted to decrease or
maintain the current population size; the majority in each group wanted some type of increase in elk
population size. Landowners with ag interests (n = 61) desired an average increase of 9.1% while
landowners without ag interests (n = 110) desired a 14.4% increase. Non-landowners (hunters without
land in the West Elks; n = 438) desired a 16.2% increase from the current population size. No major
differences were found between non-resident hunters and resident hunters. Major differences did exist
among the various GMUs. The smallest change in population size desired (a 1.9% increase) was voiced
by landowners with ag interests identifying themselves as having specific interests in GMU 63. The
largest desired change in elk population size was voiced by non-landowners (a.k.a., hunters) of GMU 54
(a 19.2% increase). This contrasted with GMU 63 non-landowners, who desired only an 8.1% increase.
GMU 53 respondents desired a moderate percent increase in population size that fell between that of
GMU 54 and GMU 63 desires. A full breakdown of the weighted percent change in population size
desired can be found in the table of Appendix 5, Section 2, Question 9.
Respondents were also asked about their desired bull ratio. A tradeoff was presented, with a note that
higher bull ratios would equate to having more and potentially older aged bulls, along with fewer
hunters on the landscape. However, having a higher bull ratio also means that hunting opportunity must
be decreased. Overall, with all stakeholder groups combined, 38% of respondents favored a bull ratio
increase, while 47.9% desired to stay the same, and 6.1% desired a decrease in bull ratio. Stakeholder
groups varied with respect to increases in bull ratios; 51.1% of the landowners with ag-interests desired
an increase in bull ratio, while only 30.1% of the respondents interested in GMU 63 desired an increase
in bull ratio.
Survey 3: The third survey consisted of an online survey (Survey Monkey, Inc, Palo Alto, CA, USA) that
was made available to the general public in August 2017. The survey was advertised in local media
outlets, and advertised on CPW insider and the CPW web page. Anyone with access to the internet was
allowed to participate. A total of 103 people responded to the survey. Results from this survey were not
considered as rigorous as Survey 2, as respondents were not chosen in a randomized or representative
strategy. Although not as rigorous, this survey was especially important for gathering written comments

20
from members of the public that may not have been randomly selected in Survey 2. Detailed results can
be found in Appendix 5 (section 3).
Open Comment Period on Draft Plan
In October and November 2017, a draft of the plan was presented to the public for a 30-day
commenting period. An announcement of the 30-day comment period was placed in the local
newspapers, the CPW insider email list, followed by a notification sent to all scoping meeting attendees
and online survey respondents that provided their email address. Organizations and agencies receiving
notification of the comment period include: The Gunnison and North Fork Habitat Partnership Program
Committees, Montrose board of county commissioners, Delta County commissioners, Gunnison County
commissioners, Gunnison BLM field office, Montrose BLM field office, Paonia USFS ranger district,
Gunnison USFS ranger district, and the Gunnison County Stock Grower’s Association. Comment letters
were accepted until December 21, 2017. Comment letters were submitted by 18 entities that reflected a
wide variety of stakeholder interests.
- 9 letters contained content that expressed the distribution issue of disproportionally more elk on
private land than public land during the hunting season
- 6 letters contained content supportive of an increase in elk population size
- 5 letters contained content expressing concerns of predator impacts on elk
- 4 letter contained content expressing concerns of an elk population increase causing more elk-ag
conflicts on private lands
- 4 letters contained content expressing concerns of elk refuging on Black Canyon National Park lands.
- 3 letters contained content supportive of a decrease in elk population size
- 2 letters contained content desiring an increase in bull ratios or the numbers of trophy bull elk
- 2 letters contained content expressing concerns of too many elk in the western portions of GMU 63
and the potential impacts on competition with other wild/domestic ungulates and sage grouse.
- 2 letter contained content expressing concerns that increasing the elk population will increase the
hunter crowding (through more cow harvest required to maintain population).
- 2 letters contained content expressing concerns of the lack of access to huntable lands due to roads
not being traversable or available
- 1 letter contained content expressing concerns of the declining calf:cow ratio
- 1 letter contained content expressing the concern of an increase of 17% in elk population increasing
the risk of disease spread
Stakeholder Meetings
In addition to the two public scoping meetings, five additional meetings were held with various
stakeholder groups. This included the: Gunnison County Stock-growers Association, Gunnison Basin
Habitat Partnership Committee, North Fork Habitat Partnership Committee, U.S. Forest Service
Gunnison Ranger District, and the Gunnison Basin Sage-grouse Strategic Committee. Less formal one-on-

21
one meetings were conducted, when requested, by the Crawford Area Gunnison Sage Grouse Working,
landowners, and hunters.
Proposed Management Objective Alternatives The primary focus of this plan is to develop management alternatives for population size. Historically,
controlling bull:cow ratios in E-05 is difficult given partially unlimited licensing strategy (bull licenses are
over-the-counter in 2nd and 3rd seasons). In addition, the techniques used to estimate bull:cow ratios are
imprecise and biased to some degree, based on behavioral differences between bulls and cow/calf
groups, seasonal sexual segregation, winter conditions, and survey detectability. The long-term
population and sex ratio objectives for this herd is managed as ranges, rather than point values.
Objective ranges better reflect the uncertainty inherent in wildlife population estimates. Also, having
the flexibility to manage this elk herd within a range is more fitting to annual variability in ecological
conditions.
Proposed Population Objective Alternatives
Reference to status quo in these alternatives are based on the 2016 post-hunt population size estimates
(Fig. 2). CPW only suggests alternatives for a practical population size objective. Practical population
sizes are those that are well below carrying capacity (i.e., E-05’s late 1980’s estimate of 14,000 elk).
Other alternatives are not listed here but were considered, such as decreasing the elk population size.
However, decreasing elk population size received minor to no public support during public scoping
meetings or during the public surveys.
Population Objective Alternative 1: 0% change 6600 – 7600 elk (Status Quo)
Assuming status quo bull ratios, population vitality measures, hunter success, maintaining the status
quo population size will likely result in no changes to hunter experience or opportunity and the
potential for conflicts with other wildlife and domestic animals would likely not change.
Population Objective Alternative 2: 17% increase; 7800 – 8800 elk
This alternative represents the objective population size derived from extensive hunter and
landowner input, but also aligns the best with current estimates of the landscapes carrying capacity.
Assuming status quo bull ratios, and constant population vitality measures, hunter success, and
license demand measures, increasing the population size by 17% (from status quo) to the mid-point
of this objective range will likely:
- Immediately decrease hunting opportunity for cow elk, and increase cow elk license
demand rates.
- In the long-term, increase hunting opportunity and crowding, and decrease license demand
rates.
- Compared to the status quo, the potential for competition with other wildlife and domestic
animals must be considered for certain areas.
Population Objective Alternative 3: 35% increase; 8500 – 9500 elk

22
Assuming status quo bull ratios, and constant population vitality measures, hunter success, and
license demand measures, increasing the population size by 35% (from status quo) to the mid-point
of this objective range will likely:
- Immediately decrease hunting opportunity for cow elk, and increase cow elk license
demand rates.
- In the long-term, increase hunting opportunity and crowding, and decrease license demand
rates.
- This alternative has the highest potential for elk degradation of certain vegetation
communities during extreme winters and drought years.
Proposed Bull Ratio Objective Alternatives
Bull ratio alternatives considered the tradeoffs between hunting opportunity (the ability to draw a
license) and hunter crowding (the number of hunters required in the field). Bull ratio alternatives must
be considered in context of a population size because it is a proportion of an absolute number; the same
bull ratio of a smaller population results in a smaller number of bulls, whereas the same ratio of a large
population results in a higher number of bulls that must be managed. The combination of former E-41
and E-52 allows bull ratios to be estimated more accurately than before. A status quo objective is not as
readily defined, given that the E-41 and E-52 had differing sex ratio objectives (20:100 and 25:100
respectively). Furthermore, no range on the bull ratio was provided in the former E-41 plan (Masden
2001).
Bull Ratio Objective Alternative 1: Range of 18-23 (midpoint = 20) bulls:100 cows (E-52 former
objective)
This bull ratio is more similar to that selected in the former E-52 (GMU 53 & 63) plan (Diamond
2005). Assuming the population size is status quo (population size alternative 1), this bull ratio
objective range will likely result in greater hunting opportunity for bulls, but add some additional
hunter crowding.
Assuming an overall elk population increase (population size alternatives 2 or 3), maintaining the
proportion of bulls E-05 wide will potentially:
- Immediately result in a slight decline in the bull ratio as overall population is increasing,
assuming bull license allocations are held at status quo during the period of population
building. If bull license allocations are decreased, the ratio will be maintained.
- Long term result in no to little change in the opportunity to hunt bulls, as the influence of
an increased population size will ultimately influence the opportunity to draw bull licenses
and encounter bulls when hunting.
Bull Ratio Objective Alternative 2: Range of 23-28 (midpoint = 25) bulls:100 cows (Status quo)
This bull ratio is more similar to that selected in the former E-41 (GMU 54) plan (Masden 2001).
Assuming the population size is status quo (population size alternative 1), this bull ratio will likely
not change bull hunting opportunity or hunter crowding.

23
Assuming a population size increase (population size alternatives 2 or 3), increasing the proportion
of bulls E-05 wide will potentially:
- Immediately result in no change to bull ratio as overall population is increasing
- Long term result in the same opportunity (as status quo) to hunt bulls, as the influence of
increased population size will ultimately increase the opportunity to draw bull licenses and
encounter bulls when hunting.
Proposed License Allocation Strategy Alternatives
The spatio-temporal distribution of elk is just as important to elk managers as the population size, thus
the following alternatives are considered for how the distribution of elk is to be managed across the
three GMUs.
License Allocation Objective Alternative 1: Cow licenses are allocated disproportionally among the
three GMUs to redistribute elk to GMUs desiring higher elk population sizes (CPW staff preferred)
Across the three GMUs, a proportionally higher number of limited cow elk licenses will be
allocated in GMU 63, in which stakeholders wanted the smallest increase, while proportionally
fewer cow licenses will be allocated in GMU 54 (stakeholders wanted the highest increase). This will
attempt to redistribute elk into these areas where stakeholders desired the highest increases (per
2017 stakeholder survey).
License Allocation Objective Alternative 2: Cow licenses are allocated spatially among the GMUs
according to 2006-2017 inter-GMU proportions (Status quo).
Across the three GMUs, the proportional change in limited cow licenses will be equal to that
allocated in 2006 – 2017. Any changes in elk population distribution within the E-05 population will
likely be equal.
Preliminary Preferred Management Objective Alternatives
Population Size Objective Alternative:
CPW staff preliminarily recommends Alternative 2, which represents a 17% increase given the 2016-
post-hunt estimates (7800 – 8800 elk). Alternative 2 is preferred over other alternatives as it best
reflects the desired population size increase of the E-05 stakeholders (hunters and landowners), while
maintaining the elk population size well below ecological and social carrying capacity, thus reducing the
probability of rangeland conflicts and competition with other wildlife and domestic animals.
Bull Ratio Objective Alternative:
CPW staff preliminarily recommends Alternative 2, which represents the status quo post-hunt bull ratio
estimate (modeled estimate) of 23-28 bulls:100 cows for E-41. Given the combination of the former E-41
and E-52 herds into a new E-05 herd designation, and given the current elk migratory patterns between
these two former herds, managers will need to recognize that post-hunt measures of bull ratios are
most reflective of the latest hunting seasons (4th season rifle) and less reflective of earlier seasons (1st

24
season rifle). It is recognized that a reliable distinction in bull ratio estimates between the three GMUs
cannot be accomplished.
License Allocation Alternative:
CPW staff preliminarily recommends Alternative 1, which dictates that the limited cow licenses will be
allocated in a manner congruent with GMU specific stakeholder desires for population size. Assuming a
total elk population size increase is selected, elk license allocations will be reconfigured from the prior
2006-2017 license allocations. GMU 63 will receive the highest cow hunting pressure in order to not
exert additional elk grazing pressures on rangelands in the west side of GMU 63. GMU 54 will receive
the least cow hunting pressure in order to redistribute elk back to the unit during the fall hunting
season. Changes in GMU 53 cow tag allocations will be held mid-proportional to GMU 54 and 63.
Implementation Assuming the preliminary preferred population size alternative (Alternative 2) is approved by the CPW
Commission, CPW staff will take measures in the near future to reach or maintain the objective. In order
to achieve the 17% increase in elk population size, it is currently unknown if and how cow license
numbers from the prior years will need to be modified. Compared to the prior decade, the 2016 and
2017 cow license numbers were decreased in order to transition to a management strategy that
stabilizes the elk population size, rather than one that has been continually decreasing the elk
population size. Other factors (calf mortality rates, adult mortality rates, and hunter success rates) also
have an influence in changing elk population sizes, and must be considered in addition to cow license
numbers. The relative distribution of elk across the three GMUs (License Allocation Strategy Alternative
1) would be manipulated by modifying cow license allocations to ensure the largest increase of elk
occurred in GMU 54, while a small increase would occur in GMU 53, and no to little increase in GMU 63.
An outpouring of comments were received in all stages of the public input process that indicated CPW
needs to do more about managing the localized distribution of elk; a concern expressed by hunter and
agricultural producing stakeholders. Manipulating elk distribution for the benefit of elk hunters
throughout E-05 is best achieved by increasing the segment of the elk population utilizing GMU 54
public lands in the summer and fall. However, it is recognized by CPW that shifting elk to be
proportionally distributed across private and public lands is not currently possible without an overall
increase in elk population size. If the population is held at status quo (Population Size Alternative 1),
shifting the distribution of elk from private to public lands will not occur without a substantial increase
in hunting pressure on all lands where elk seek refuge (i.e., private lands, National Park lands). However,
CPW cannot manipulate the hunting pressure on the private or National Park lands that are currently
receiving little to no elk hunting pressure. Concerns do exist that an overall elk increase will only add to
the number of elk utilizing private lands. Recent attempts to increase the number of available private
land only tags have not always resulted in more elk hunting pressure on private lands; the current
demand for private land only tags appear to be already satisfied given the current grazing pressures elk
exhibit on private lands. If elk start to exert additional pressures on private lands in E-05, additional
private land only licenses (through special seasons or damage hunts) will be made available.

25
Manipulating the elk distribution should be done in a manner that encourages recruitment and
recolonization of major drainages of the southern side of GMU 54 which holds a large core of highly
accessible public land. Research data from GPS collared elk in the Gunnison Basin is indicating that elk
hunting activities during Archery, Muzzleloader, First Rifle, and Second Rifle seasons are occurring while
a majority of GMU 54 wintering elk are still on their summer ranges in neighboring units (i.e., GMU 53
and 63) (Appendix 1, Section 6). GMU 54 license allocations during these four hunting seasons should be
reduced to discourage late summer and early fall mortalities of elk on public lands within GMU 54.
Additional hunting pressure in GMU 53 and 63 should be limited in the high elevations of the early
seasons to ensure elk are not pushed on to private lands to the west and north sides of E-05. Ample
early season opportunities for hunting should be placed on lower elevations of GMU 53 and 63. Future
issue papers will likely need to be produced and presented to the CPW commission to address these elk
distribution issues.
Appendix 1: Evaluation of merging E-41 with E-52 as a single herd
(E-05). The elk herd in GMUs 53 and 63 were historically managed as separate herds consisting of E42
(GMU 53) and E44 (GMU 63). These two herds were merged in the 1995 E-52 DAU plan based on inter-
herd movements documented between GMU 53 and 63 (Appendix 3, section 1). Managing GMU 54 (E-
41), and GMU 53/63 (E-52) as a single herd (E-05) has been considered for some time by managers given
anecdotal information derived by six studies of radio-collared elk in the West Elk Mountains indicating a
large amount of seasonal migratory movement across these units (Appendix 3). However, it was only
determined recently (Fall 2014-2016) that many of these fall migrations are occurring after the hunting
season period; GMU 54 wintering elk are not completely available to GMU 54 hunters in the fall
(Appendix 3, Section 6). Former E-41 and E-52 have exhibited similar population characteristics
(population size, bull ratios, calf ratios) and harvest history (harvest rates and hunters afield) (see
below). Furthermore, the public stakeholders of these two herds have similar opinions when it comes to
desires and concerns for elk management (see below). Combining E-41 and E-52 as a single DAU (E-05)
has several benefits enumerated below:
Benefit 1: Population size and bull ratio estimates will improve over the long run, especially in the
event that winter habitat capabilities change between the North Fork and Gunnison Basin side
of the herd. CPW staff confidence level in population estimates will be greater for this larger
herd, than the smaller former herd boundaries.
Benefit 2: Unfortunately, elk management objectives in terms of population size and bull ratios for
the former E-41 and E-52 herds are not mutually exclusive, given the elk spatio-temporal
distribution and hunting season structure. Previously, population characteristics surveyed in the
annual post-hunt survey were potentially not reflective of what was experienced by hunters in
earlier hunting seasons. For instance, the bull ratios experienced by hunters in the fall, while elk
were still on summer ranges, were potentially different than the bull ratios surveyed on winter
ranges in the post-hunt period (late December through January). Also, wintering elk herd bull
ratios observed in the west end of GMU 63 can be influenced by hunter activities in GMU 54.
Benefit 3: GMU boundaries are designed to distribute hunters within a broader herd boundary (the
DAU). Allowing multiple GMUs (GMU 53, 54, & 63) to occur within the larger herd, allows
managers to distribute hunters more strategically in order to potentially change the elk

26
distribution within the larger West Elks DAU when needed. CPW managers will be more readily
able to adjust the recommended tag allocations to better manipulate the elk distribution.
Benefit 4: Allowing the DAU to be spatially centered on summer range allows inter-year changes in
winter range usage to be more readily accounted for. Preliminary examination of recent GPS
collar information (Appendix 3, section 6) is indicating that an individual elk’s choice of winter
range is more flexible than its choice of summer range; an individual elk appears to consistently
utilize the same summer range, but not always the same winter range.
Population history comparison between E-41 and E-52
Elk in the former E-41 and E-52 have remarkably similar population characteristics, that may be partially
due to the high summer range overlap of these herds. The population history section of this
management plan highlights various population parameters of interest for the new E-05 herd as a whole
after combining the historic data for these two herds. Population size estimates from these two herds
are currently similar with approximately 3500 elk estimated in E-41 and 3700 elk in E-52. Both E-41 and
E-52 have exhibited a declining trend since the late 1980s (Fig. A1.1). Both herds are at or above the
2001 (E-41) or 2005 (E-52) management plan established objective, but both slightly below the adjusted
(indexed) objective. Bull ratios have exhibited an increasing trend from 1980 to 2016 in both E-41 and E-
52, with the most notable increases following the 4-point antler restriction put in place in the 1980’s
(Fig. A1.2). However, the former bull ratio objective for E-41 (25:100) was higher than the former E-52
objective (20:100). Post-hunt calf ratios (calves per 100 cows), a measure of calf elk survival the first six
months of life, are exhibiting similar trends in E-41 and E-52. From 1980 to 2016, a decline from 47 to 37
calves per 100 cows is apparent in both E-41 and E-52 (Fig. A1.3). Hunter success rate (percent of
hunters afield successfully harvesting elk) is similar between E-41 and E-52 with a 36-year average of
18.4% and 19.1% respectively (Figure A1.4). The estimated number of hunters-afield vary greatly across
the 36-year time period, but show a similar trend between E-41 and E-52 (Fig. A1.4).

27
Figure A1.1. Post-hunt population size history (1980-2016) for E-41 (top pane) and E-52 (bottom pane).
The revised retrospective post-hunt estimate is depicted in blue, while the annually published estimate is
in orange. The previous herd management plan objective post-hunt size is the red solid line, with the
indexed objective in the dotted line.

28
Figure A1.2. Post-hunt bull ratio history (1980-2016) for E-41 (top pane) and E-52 (bottom pane).
Modeled bull ratio (red line) and observed bull ratio (blue line) is depicted with the 95% confidence

29
interval (red and blue shading respectively). Observed 3-year average bull ratio is also overlaid (green
line).

30
Figure A1.3. Post-hunt calf ratio history (1980-2016) for E-41 (top pane) and E-52 (bottom pane).
Observed calf ratio (black line) is overlaid by the smoothed trend line based on a linear regression model
(blue line) and 95% confidence interval (gray shading).

31
Figure A1.4. Hunters afield (black line) and hunter success (red line) estimates (1980-2016) for E-41 (top
pane) and E-52 (bottom pane). Hunters afield only account for limited licenses (i.e., 1st rifle season) and
not for the over-the-counter seasons (i.e., 2nd rifle).
Social comparison between E-41 and E-52
The former E-41 and E-52 herds can be characterized similarly in terms of human-wildlife relationships,
given shared physiography. E-41 is approximately 585 square miles and E-52 is slightly larger at 765
square miles. Both units share a central mass of mountains (the West Elk Mountains) that serve as a
common summer range for the two sub-herds, and is dominated by the same public land management
entity (USFS). On the periphery of the West Elk Mountains are private lands, which have greater overlap
with elk winter and transitory ranges. The percentage of private land is 21.5% and 32.7% in E-41 and E-
52 respectively. GMU 54 (E-41) and GMU 63 (of E-52) are similar in terms of private lands occurring in
many of the elk transitory ranges (GMU 54: Ohio Creek, GMU 63: Crystal Creek & Hwy 92), which are
accompanied by larger tracts of public lands in the lower elevation winter ranges (GMU 54: North side of
Blue Mesa Reservoir. GMU 63: Fruitland Mesa, Gunnison Gorge & National Park Service Lands). Based
on radio collar information and various comments received in the public input surveys, GMU 54 and 63
elk appear to be utilizing large tracts of lands, characterized by little or no human hunting pressures, as
refuge during the fall seasons. All GMUs experience conflicts between elk and agriculture operations in
the form of elk utilizing hay fields, unprotected hay stacks, or cattle feed-lines.
CPW reached out to a sample of hunters and private landowners/land managers in a public input survey
(Appendix 5, section 2). Results are described for each question asked, separated by results for E-41
(GMU 54) and E-52 (GMU 53 and 63 combined):
- Respectively, 24.2% and 23.3% of E-41 and E-52 landowners/land-managers responded they had
experienced significant loss from deer and elk in the past 10 years (Appendix 5, section 2,
question 3). However, the landowners differ by the level of hunting pressure allowed; 43.9% of
E-41 landowner/land-managers do not allow hunting, while only 16.8% of E-52 landowners do
not allow hunting (Appendix 5, section 2, question 5).
- When asking hunters the reason for hunting elk, the answers were very similar. The answer of
“spending time in nature and/or enjoy the time with family and friends” received a ranked score
of 76.9% in E-41 and 80.5% in E-52. “Obtaining wild game meat” received a ranked score of
63.5% and 63.4% in E-41 and E-52 respectively. “Obtaining a trophy” received scores of 43.4%
and 40.0% in E-41 and E-52 respectively (Appendix 5, section 2, question 6).
- When asking hunters their satisfaction level with their experience while hunting elk in these
units, 45.6% of E-41 hunters and 46.9% of E-52 hunters showed some level of overall
satisfaction (Appendix 5, section 2, question 7).
- When asking respondents “how do you want the elk population size to be managed?”, a
majority of survey respondents in both E-41 and E-52 want some type of increase. However, E-
41 and 52 respondents differed in the weighted average wanted in elk population size,
corresponding to a 19% and 11% increase respectively (Appendix 5, section 2, question 9). This
was accompanied by 41.9% and 33% of E-41 and E-52 (respectively) respondents wanting an
increase in bull ratios (Appendix 5, section 2, question 10).
- When asking respondents how they feel about the statement of “the problem isn’t with too
many or too few elk in GMU 53 or 63, it is the distribution (where elk occur) that is a problem”

32
(Appendix 5, section 2, question 12), 28.4% and 35.5% of E-41 and E-52 (respectively) responded
they strongly agree with the statement. 33.2% and 44.7% somewhat agree. 10.5% and 10.5%
indicated they somewhat disagree. Finally, 10.9% and 8.6% of E-41 and E-52 (respectively)
indicated they strongly disagree; the number of elk needs to be changed.
Appendix 2: Population Estimation Methods Estimating numbers of wild animals over large geographic areas is a difficult and approximate science.
CPW recognizes the difficulties of estimating the size of big game populations as a challenge in managing
populations and that estimating populations of wild animals provides inexact measures of abundance.
The agency utilizes flexible population estimates that incorporate the latest technologies available and
complimenting data sources. As additional years of data are added, the accuracy of prior year estimates
are improved, thus ultimately improving current estimates.
Population estimates are derived from computer assisted population models that integrate multiple
biological factors, such as initial population size, mortality rates, reproductive rates, hunter harvest
numbers (Steinert et al. 1994), post-harvest sex ratios, and wounding loss. Annually, a suite of
biologically plausible models is constructed and ranked based on a score that minimizes the difference
between observed and predicted sex ratios. Initial models of the early 1970s were constructed with ONE
POP software. In the early 1980s, POP II software was implemented (Bartholow 2000). Post-1999,
spreadsheet models replaced POP II. In 2009, the spreadsheet model was standardized based on newer
mathematical models (White and Lubow 2002). This continual process of updating the model: 1) allows
past and current estimates of population size to be more accurate, 2) dampens annual variation that
reflects sampling variability, 3) provides a better representation of population trend (long term relative
changes in population size). Model realism is further diagnosed by examining the various biological
parameters derived by the model. In addition to annual updates to the model, a revision to the model is
made when a DAU plan is updated; an expanded suite of models is constructed and the best model is
selected.
Actual counts or extrapolation-based sampling of elk population size are not conducted in E-05. Instead
multiple sources of information are gathered during: 1) aerial elk age/sex classification surveys and 2)
elk harvest mortality surveys. The elk age/sex classification surveys provide an estimate of the number
of males and number of young of the year per 100 females. Bulls:100 cow ratios include bulls > 1 year of
age. Current aerial survey methodologies underestimate the bulls:100 cow ratio, as larger groups of
animals, primarily represented by females and calves, are easier to detect than bull groups. Habitat
utilization differences between bulls and cows further complicates the technique. Given that bulls have
a lower probability of detection than cows, a sightability factor is incorporated into the model to provide
a more realistic representation of the bulls:100 cows. This modeled bull ratio estimate is utilized when
making management decisions concerning allocation of licenses.
Finally, anecdotal information gathered from hunter and landowner contacts made by CPW field staff is
considered for model evaluation and final license allocations. While field observations are used to help
ground-truth the model, it is recognized that using population estimates based entirely on sportsmen’s
observations has produced biased results. For instance, a study (Freddy et al. 2004) was conducted in D-
6 (GMU 10) to assess whether estimates of population size derived from CPWs mathematical models,
was in line with those made by a local sportsmen group, and that of a more rigorous (and more
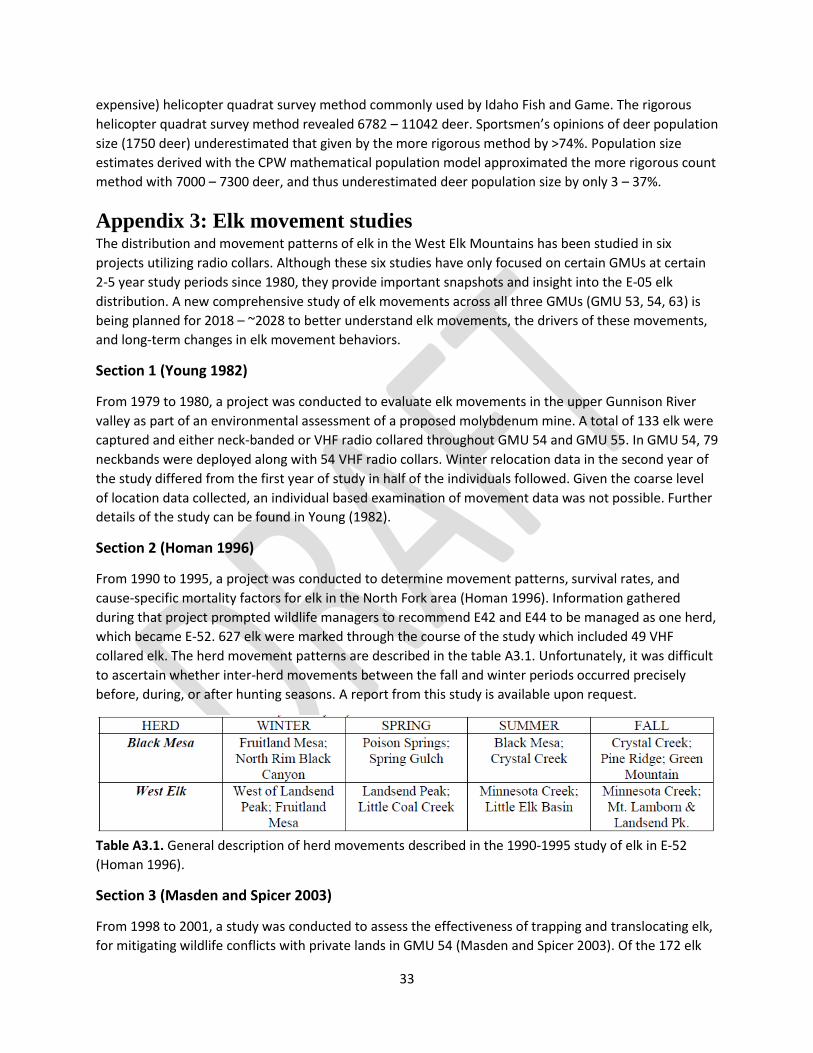
33
expensive) helicopter quadrat survey method commonly used by Idaho Fish and Game. The rigorous
helicopter quadrat survey method revealed 6782 – 11042 deer. Sportsmen’s opinions of deer population
size (1750 deer) underestimated that given by the more rigorous method by >74%. Population size
estimates derived with the CPW mathematical population model approximated the more rigorous count
method with 7000 – 7300 deer, and thus underestimated deer population size by only 3 – 37%.
Appendix 3: Elk movement studies The distribution and movement patterns of elk in the West Elk Mountains has been studied in six
projects utilizing radio collars. Although these six studies have only focused on certain GMUs at certain
2-5 year study periods since 1980, they provide important snapshots and insight into the E-05 elk
distribution. A new comprehensive study of elk movements across all three GMUs (GMU 53, 54, 63) is
being planned for 2018 – ~2028 to better understand elk movements, the drivers of these movements,
and long-term changes in elk movement behaviors.
Section 1 (Young 1982)
From 1979 to 1980, a project was conducted to evaluate elk movements in the upper Gunnison River
valley as part of an environmental assessment of a proposed molybdenum mine. A total of 133 elk were
captured and either neck-banded or VHF radio collared throughout GMU 54 and GMU 55. In GMU 54, 79
neckbands were deployed along with 54 VHF radio collars. Winter relocation data in the second year of
the study differed from the first year of study in half of the individuals followed. Given the coarse level
of location data collected, an individual based examination of movement data was not possible. Further
details of the study can be found in Young (1982).
Section 2 (Homan 1996)
From 1990 to 1995, a project was conducted to determine movement patterns, survival rates, and
cause-specific mortality factors for elk in the North Fork area (Homan 1996). Information gathered
during that project prompted wildlife managers to recommend E42 and E44 to be managed as one herd,
which became E-52. 627 elk were marked through the course of the study which included 49 VHF
collared elk. The herd movement patterns are described in the table A3.1. Unfortunately, it was difficult
to ascertain whether inter-herd movements between the fall and winter periods occurred precisely
before, during, or after hunting seasons. A report from this study is available upon request.
Table A3.1. General description of herd movements described in the 1990-1995 study of elk in E-52
(Homan 1996).
Section 3 (Masden and Spicer 2003)
From 1998 to 2001, a study was conducted to assess the effectiveness of trapping and translocating elk,
for mitigating wildlife conflicts with private lands in GMU 54 (Masden and Spicer 2003). Of the 172 elk

34
trapped near Flat Top Mountain, 62 were released with VHF radio collars. The project report (Masden
and Spicer 2003) states a known return rate of 17.2% to Flat Top Mountain. However, this percentage is
likely biased low based on: 1) VHF tracking data relying upon collecting only one location data point, 2)
elk VHF collars were only tracked for 2-3 years post translocation, 3) dispersing elk (i.e., calves) do not
appear to be censored from the return rate calculations despite calves and yearlings comprising 42% of
the translocated elk, 4) no elk were captured, collared, and released at the conflict site as a control
group. Therefore, translocation as a management strategy has not been advised as a viable strategy
since this study. Fall location data collected on these radio collared animals indicated that elk relocated
from Flat Top Mountain readily utilized GMUs 53 and 63. However, this anecdotal movement
information must consider that these elk were translocated distances of 18 – 28 miles from the Flat Top
Mountain conflict site to vicinities near GMU 63.
Section 4 (Freddy 2002)
From 2000 to 2002, location data from a sample of adult female and calf elk outfitted with VHF collars
were collected opportunistically in conjunction with an ongoing survival monitoring study (Freddy 2002).
While focus was on the Gunnison Basin winter range as a whole, a sample of 61 elk represented the
herd wintering in GMU54 (formerly E-41). Examination of the coarse spatio-temporal data indicates that
11 of 23 elk tracked over at least one annual cycle, conducted seasonal migrations to summer range
outside of GMU 54. Unfortunately, it is difficult to ascertain whether these collared elk migrated back to
GMU 54 winter range before, during, or after hunting seasons. These migrations out of the former E-41
boundary can be difficult to account for when estimating population size if the migrant individuals are
not available for hunter harvest in E-41. This coarse location data is depicted in the Fig. A3.1. No detailed
information on movements and habitat utilization patterns were documented in this study.

35
Figure A3.1. Coarse location information for GMU 54 gathered from the study of elk movements in the
Gunnison Basin depicting seasonal movements outside of GMU 54 (Freddy 2002).
Section 5 (Ouren 2007)
From 2005 to 2007, a study of elk habitat usage patterns in GMU 63 were conducted by a cooperation of
USGS and Colorado Parks and Wildlife. The focus of this study was placed on understanding how elk are
influenced by road traffic volumes, and whether management strategies could be implemented to
reduce landowner conflicts in the Montrose County portion of that unit. A sample of 31 adult female elk
were captured in GMU 63 winter range and fitted with GPS collars. Preliminary results of this study are
indicating that elk are indeed responding to roadway traffic (Doug Ouren: Personal Communication).
Aside from the roadway utilization analysis, another examination of this GPS collar information indicates
that ~15-20% of elk wintering in GMU 63 migrate into neighboring GMU 54 (herd E-41) for the summer
season (Fig. A3.2). This dataset also revealed a portion (~15-20%) of GMU 63 wintering elk occasionally
utilize GMU 64 (west of GMU 63) at certain times of the winter (Fig. A3.2). This sample of elk did not
show any significant utilization of the neighboring GMU 53 to the north, despite earlier information
(Homan 2006) indicating interchange had been occurring. This lack of interchange being detected in this
latter study may be due to elk monitoring efforts being focused solely on GMU 63 wintering elk, rather
than both GMU 53 & 63.

36
Figure A3.2. Occupancy (proportion of elk) collared on GMU 63 winter range that are actually present in
GMU 63 for each day of the year (x axis: Julian day 1 = Jan 1, Julian day 365 = Dec 31) for 2005-2007.
Gray shading indicates 95% confidence intervals.
Section 6 (CPW 2017)
In January 2014, a sample of elk (25 adult females) were collared on GMU 54 winter range to initiate a
larger Gunnison Basin wide study utilizing GPS satellite collar technology. This long-term study focuses
on the spatio-temporal dynamics of elk movements with a component of the project examining
movements across GMU and DAU boundaries. GPS collars are currently being used to collect real-time
elk locations at a 13-hour temporal interval. This study is focusing not only on large scale movements
(i.e., migrations) but on the drivers of smaller scale (i.e., <1 day) movements and the resulting habitat
selection patterns. Preliminary analysis is indicating that a large proportion of elk, that utilize the former
E-41 winter range, migrate to summer ranges in the former E-52 (GMU 53 & 63) and beyond (i.e., GMU
521). A majority of these migrators are currently not available to hunters in GMU 54 until the third and
fourth rifle seasons (Fig. A3.3). Data collected from this sample in GMU 54 and in neighboring GMU 55,
is indicating that individual elk show site fidelity to their respective summer range (summer range usage
is consistent from year to year), but winter range usage is inconsistent from year to year; elk may
change what winter range is utilized from one winter to the next. Furthermore, spring and fall migration
paths do not always appear to be followed consistently for an individual elk.

37
Figure A3.3. Occupancy (proportion of elk) collared on GMU 54 winter range that are actually present in
GMU 54 for each day of the year (x axis: Julian day 1 = Jan 1, Julian day 365 = Dec 31) for 2014-2017.
Gray shading indicates 95% confidence intervals.
Appendix 4: Discussion on E-05 Carrying Capacity The following 13 bullets provide a summary of various pieces of information that can be used as
justification and discussion for where E-05 stands in relation to biological carrying capacity of the land
and vegetation resource.
1) 1985-2017 -All of E-05: Examining elk population history provided in a prior section, revised elk
population models are revealing that elk numbers peaked in 1980 at approximately 14,000 elk.
In the subsequent 26 years, the population was intentionally reduced in half to the current 2016
post-hunt elk population of ~7000.
2) 1999 – Gunnison Basin wide: Winter range condition assessments in the Gunnison Basin
determined that winter range forage resources were not in good condition, suggesting that the
wild/domestic ungulate populations had been exceeding winter range carrying capacity (Roath
et al. 1999). These assessments indicated that the health and productivity of sagebrush species
was low, in which little annual growth and new leaders occurred. Additionally, bitterbrush and
mountain mahogany showed excessive usage by ungulates.
3) 2001 – GMU 54: A Land Health Assessments (LHA) conducted by the BLM for the McIntosh
Mountain Allotment showed excessive deer and elk browsing. Line transects in this LHA found
that sagebrush and bitterbrush types were lacking forb cover, forb diversity, and grass diversity;

38
dead and decadent sagebrush and bitterbrush was little to moderate. Hedging on shrubs and
aspen shoots was rated as little-to-severe. Grazing in the allotment was rested from 1999-2003.
4) 2001 – GMU 63: An LHA was conducted by the BLM for the Gunnison Gorge area (~110,000
acres), which overlapped much of the elk winter range of GMU 63. It was found that just under
half was meeting rangeland health standards for “Standard 3” (healthy native vegetative
communities), and half were meeting “Standard 3 but had isolated problem areas”,
approximately 5% were not meeting Standard 3. Problem areas were noted as having extensive
exotic and noxious plant invasions and low shrub vigor.
5) 2003 – GMU 54: An LHA conducted by the BLM for the Steuben Creek Allotment showed that
much of the allotment was not meeting range standards. Past usage by livestock and big game,
in combination with an ongoing drought, resulted in hedged and decadent shrubs (serviceberry,
bitterbrush, and sagebrush), grass mortality, and low forb/grass cover.
6) 2005 – 2010 - Gunnison Basin Wide: Vegetative structure habitat measures were collected at
177 Gunnison sage-grouse nests by Davis et al. 2015. Measures of shrub cover, shrub height,
grass cover, and grass height indicated that measures collected at most of the nest sites met the
guidelines of the GSRCP (2005). While this data is not representative of all sagebrush habitat, it
does indicate that suitable nesting sites were available. In addition, vegetation structure had no
influence on the success of GUSG nests in this study.
7) 2006 – Gunnison Basin Wide: BLM conducted repeat visits to survey plots established in 2001, in
shrub communities, to measure average degree of hedging, plant volume, and percent dead.
Focus was placed on serviceberry, mountain mahogany, and antelope bitterbrush. Over the five-
year period, the degree of hedging increased, plant volume decreased, and the percent dead
increased in shrubs (United State Department of Interior 2006). Shrub health in this study was
likely influenced by a combination of ungulate usage and a drought spanning 2000 – 2004.
8) 2006 – GMU 53 & 63: CPW’s Habitat Partnership Program (HPP: North Fork Committee) and
Colorado State University developed a habitat assessment model for the North Fork HPP
jurisdiction, which overlapped GMU 53 & 63. The model suggested that this area was being
grazed by domestic/wild ungulates at or near carrying capacity.
9) 2007 – GMU 53 & 63: BLM conducted a LHA for the North Fork of approximately 65,000 acres of
BLM lands, of which some overlapped GMs 53 and a small portion of GMU 63. It was
determined that a minority (29%) of the areas examined met “Standard 3” (healthy native
vegetation communities), while 41% were “meeting Standard 3 but had problem areas”, and
24% were not meeting range standards (Fig. A4.1). Most notable was the 1) prevalence of exotic
and noxious weeds, 2) problems with shrub hedging occurring across the unit, with particularly
severe hedging south east of Paonia, 3) habitat changes due to an increasing wildland-urban
interface.

39
Figure A4.1. Reprinted image from BLM-UFO (2007) indicating areas meeting, meeting with
problems, or not meeting range health for Standard 3.
10) 2008 – GMU 54: USFS conducted an Environmental Assessment (USFS 2008) for grazing
allotments that overlapped much of GMU 54. The analysis indicated that aspen stands,
especially in the Carbon allotment were generally in poor condition, with younger stands being
highly browsed by wildlife in winter/spring. Sagebrush communities were determined to be at a
lower seral successional stage due to heavy big game utilization. Soap Mesa and Cow Creek
allotments showed high wildlife impacts to many shrub species such as mountain big sagebrush
and service berry. It was noted that heavy elk utilization on Carbon and Soap Mesa allotments
was preventing willow reestablishment.
11) 2010-2011 - Gunnison Basin wide: CPW and the University of Wyoming used a series of 392 line
transects, randomly placed across ecological types most utilized by GUSG (Dry Mountain Loam
and Mountain Loam), to measure vegetation characteristics (sagebrush, grass, and forb height
and cover percentages) of the sagebrush community. This effort found that the GUSG
Rangewide Conservation Plan guidelines were being met in terms of vegetation cover and
heights (breeding, summer/fall) for sites overlapping GMU 54 (Williams and Hild 2012).

40
12) 2011 – GMU 63: An LHA was conducted by the BLM for the Gunnison Gorge area (~110,000
acres), which overlapped much of the elk winter range of GMU 63. It was found that over half of
grazing allotment areas (60%) met rangeland health standards for “Standard 3” (healthy native
vegetative communities), and a moderate amount (21%) were meeting “Standard 3 but had
isolated problem areas”, approximately 9% of the area was not meeting Standard 3. Standard 4
(Special Status Species, including GUSG) found that 50% of the area met, approximately 33%
met standards but had problem areas (low forb cover, poor shrub vigor and old aged
vegetation), and 12% of the area did not meet standards.
13) 2011-2013 – GMU 54 & 63: National Park Service transect data was collected in sagebrush
habitats on the north rim of the Black Canyon of the Gunnison National Park and in Currecanti
National Recreation Area. Overall, this monitoring indicated that the sagebrush habitats met the
minimum habitat guidelines for the GUSG Rangewide Conservation Plan.
14) 2013-2017 – GMU 63: BLM has been conducting vegetation monitoring of suitable habitat
within occupied GUSG range. Overall, the average sagebrush cover and height is just below the
minimum guidelines for breeding habitat, while forb cover is within the guidelines, and grass
cover is above the guidelines (BLM 2015))
15) 2015-2017 – Gunnison Basin wide: The Gunnison BLM office initiated a new monitoring effort
focused on vegetation monitoring of rangelands under the BLM’s nationwide Assessment,
Inventory, and Monitoring (AIM) program (BLM 2011). From 2015 to 2016, rigorous methods
were used to measure vegetative structural characteristics of shrubs, forbs, and grasses at 78
sites. A summary of the data indicates that the average metrics from these sites are meeting the
GRCP (2005) structural guidelines (Table A4.1)
Table A4.1. Summary of BLM AIM terrestrial vegetation measurements for the Gunnison Basin plots
overlaying elk winter range collected in summer of 2015 and 2016. BLM AIM measurements of
vegetation structure met the guideline ranges identified in the GSRCP (2005).
16) 2016 – E-05 USFS rangelands: In GMU 54, range conditions appear to be most favorable,
followed by GMU 53, and 63. On suitable livestock range in GMU 54, range trend is relatively
stable, with condition being good to excellent (personal communication: USFS Gunnison Range

41
District), which is likely due to improved grazing management practices (USFS 2008) and long-
term decreases in wild ungulates. A majority of USFS rangelands in GMU 53 and 63 appear to be
in fair condition but are improving overall.
17) 2016 – E-05 beetle kill: USFS aerial detection surveys is revealing that 60 square miles of spruce-
fir forest types (LANDFIRE 2013) has been touched by the ongoing spruce beetle die off (Fig. 7).
As ecological succession unfolds, it is expected that elk will ultimately benefit in terms of
increased availability of summer habitat quantity and quality.
Appendix 5: Public Input Results
Section 1: Scoping meeting live audience polling
Results of the live audience polling conducted at the two public meetings (Gunnison and Paonia: July
2017) are shown in the following tables. Given the small sample size (43 total respondents) at the two
separate meetings, results were pooled.
Question 1: Choose the option that best represent your interests in this elk herd:
Count responding (% of respondents)
Ag operator/landowner or land manager 7 (16%)
Business owner 1 (2%)
Elk Hunter 25 (58%)
Hunting Guide/Outfitting service industry 4 (9%)
Other 1 (2%)
Wildlife Watcher/non-hunting recreationist 4 (9%)
BLANK 1 (2%)
Question 2: Which season do you prefer to hunt elk? Count responding (% of respondents)
Archery 16 (37%)
Muzzleloader 5 (12%)
Rifle 21 (49%)
BLANK 1 (2%)
Question 3: Rank the top 3 items most concerning to you in GMU 53 & 63, with 1 being the most important.
Score (#1 = 3 points, #2 = 2 points, #3 = 1 point)
% of potential score
Habitat quantity and/or quality 44 18%
Impacts of hunting recreation pressure on elk distribution 43 17%
Land being inaccessible to hunting (i.e. places where hunting is not allowed) 41 17%
Impact of non-hunting recreation on elk distribution 39 16%
Predators 36 15%
Conflicts between elk/ agriculture production 25 10%
Disease (i.e. CWD) 10 4%
Other 8 3%
Question 4: How would you like the elk population size to be managed over the next 10-15 years?
Count responding (% of respondents)
A: Increase back to 2000-2009 level 11 (26%)

42
B: Increase, but not as much as Option A 17 (40%)
C: Maintain current size 4 (9%)
D: Continue Decreasing 7 (16%)
BLANK 4 (9%)
Question 5: How satisfied are you with the number of bulls encountered when hunting (pick one)
Count responding (% of respondents)
Very Satisfied 1 (2%)
Satisfied 13 (30%)
Somewhat unsatisfied 16 (37%)
Very unsatisfied 6 (14%)
I don't hunt 3 (7%)
BLANK 4 (9%)
Section 2: Randomized hunter and landowner online survey
For the second survey, a randomly drawn set of hunters who recently applied for deer or elk hunting
licenses (2013, 2014, 2015, and 2016 hunting seasons) were invited to partake in an internet based
survey in August 2017. In addition to the sample of license applicants, a sample of landowners were
drawn from county parcel data. Post-cards were sent out to a total sample of 4935 potential survey
respondents for solicitation to take an online survey (Survey Monkey, Inc, Palo Alto, CA, USA). Of the
pool of land-owners available, only those holding a cumulative land area greater than 20 acres were
sent post-cards. 2.5% of the post-cards sent were returned as having undeliverable recipient addresses.
Because the survey specific to GMUs 53 & 63 was also directed to those interested in deer management
issues for a similar DAU planning process, respondents indicating they were solely interested in deer
were filtered from the survey when applicable. Methods were established during survey development to
ensure that unique responses were obtained (i.e., a respondent could only complete the survey once).
Removing respondents specific to the ongoing deer management plan survey for GMU 53 and 63,
the overall response rate to the survey was 17.1% with surveys being completed by 609 individuals
interested in elk management. Response rates varied slightly (9.8% - 24.8% depending on the
respondent type and GMU:
The survey asked the following list of questions (1-16). Results and/or summary for each of the
questions are also provided following each question:
Survey 2, Question 1. Which of the following best describes you:
(a) Have hunted elk GMU 53, 54, or 63*, (b) Have applied for elk/deer licenses, but not yet had
the opportunity to hunt in GMU 53, 54, or 63*, (c) Involved in the hunting service industry
(hunting guide/outfitter) in GMU 53, 54, or 63, (d) Own or Manage private land in GMU 53, 54,

43
or 63*, (e) Agricultural producer, (f) Wildlife watcher, (g) Other business owner, (h) Non-hunting
outdoor recreationist (e.g., ATV/OHV rider, hiker, skier, mountain biker, antler collector)
*Answer choices stating the GMU only contained the GMU(s) that the pool (GMU 53 & 63
pool and the GMU 54 pool) belonged to.
The respondents’ answers were summarized in the following table based on raw number and
percentage of respondents. However, this information was primarily used for characterizing
the various stakeholders answer choices and summaries in subsequent questions.
Survey 2, Question 2. Which unit are you most interested in:
(a) GMU 53*, (b) GMU 63*, (c) GMU 54**
*respondents from GMU 53 & 63 pool had opportunity to select both 53 and 63. The GMU
54 answer choice did not appear to those respondents in the GMU 53 & 63 pool of hunters
and landowners.
**This question did not appear to the GMU 54 pool of respondents, as a separate survey
instrument was available to those hunters and landowners.
The respondents’ answers were summarized in the following table based on percentage and
raw number (in parenthesis) of respondents. However, this information was primarily used
for characterizing the various stakeholders answer choices and summaries in subsequent
questions.
Survey 2, Question 3. Have you experienced any significant loss (i.e., fence damage, forage loss, hay
loss, orchard loss, etc) from deer or elk in the past 10 years?*
(a) YES, from deer**, (b) YES, from elk, (c) YES, from both deer and elk**, (d) NO
*Only respondents who chose answer choice D (own or manage private land) from question
1 were allowed to answer.

44
**respondents from GMU 54 pool were not presented with answer choices pertaining to
deer
Summary by percentage (and count) of landowner respondents
Survey 2, Question 4. If you answered YES to previous question, what has been the solution for
solving these agricultural damage issues?
(a) I generally tolerate the damage, (b) Submitted claims to the CPW Game Damage Program, (c)
Applied for special hunts, (d) Sought help from the CPW Habitat Partnership Program, (e)
Developed my own agricultural protection measures, (f) Increased hunting pressure during
hunting seasons, (g) Other (please specify)
*Only respondents who chose answer choice D (own or manage private land) from question 1
were allowed to answer:
Survey 2, Question 5. Which of the following best describes hunting activities on your owned or
managed property in GMU 53, 54, or 63? (Choose all that apply)
(a) No hunting is allowed, (b) Only myself, family and or friends are allowed to hunt, (c) Land is
leased to outfitter/guide or we outfit guide on property, (d) Public is allowed to hunt with
permission, trespass fee required, (e) Public is allowed to hunt with permission, no trespass fee
is required, (f) Other (please specify)
*Only respondents who chose answer choice D (own or manage private land) from question 1
were allowed to answer:
All Combined GMU 53 GMU 63
GMU 53 & 63
Combined GMU 54
No Hunting Allowed 25.9% (51) 30% (12) 6% (3) 16.8% (22) 43.9% (29)
Me, Friends & Family Only Allowed 50.3% (99) 50% (20) 62% (31) 56.5% (74) 37.9% (25)
Leased for Hunting 4.6% (9) 0% (0) 8% (4) 6.1% (8) 1.5% (1)
Trespass Fee Required 1.5% (3) 5% (2) 2% (1) 2.3% (3) 0% (0)
Open to the Public With Permission 8.6% (17) 7.5% (3) 14% (7) 9.2% (12) 7.6% (5)
Other 9.1% (18) 7.5% (3) 8% (4) 9.2% (12) 9.1% (6)

45
Survey 2, Question 6. How important to you is each of the following reasons to hunt deer/elk in GMU
53, 54, or 63?*
(a) To spend time in nature and/or enjoy the time with family and friends, (b) To obtain wild
game meat, (c) To contribute to wildlife management and conservation, (d)To contribute to the
local community (e.g., financial benefits from hunters), (e ) To obtain a trophy
*Answer choices could pertain to both deer and/or elk in the GMU 53 & 63 pool of
respondents. Deer was not described in the GMU 54 survey answer choices, and thus GMU
54 respondents answers only applied to elk.
Answer choices were ranked by calculating a weighted percent (Not important = 0 points,
Slightly important = 1 point, Moderately important = 2 points, Very important = 3 points) for
each reason independently. A weighted score was calculated by multiplying the number of
respondents times the degree (points 0 – 3) they answered for. A total count was created by
multiplying 3 times the total number of respondents answering. Dividing the weighted score
by the total possible count produced the percentages presented below. 0% would indicate all
respondents in the survey indicated that a particular reason was “Not Important”, while a
100% would indicate the particular reason was “Very Important”.
Survey 2, Question 7. Overall, how satisfied were you with your experience while hunting elk in GMU
53, 54, or 63?
(a) Very unsatisfied, (b) Somewhat unsatisfied, (c) Neither unsatisfied nor satisfied, (d)
Somewhat satisfied, (e ) Very satisfied

46
Survey 2, Question 8. Which method of take have you preferred when hunting elk in GMU 53, 54, or
63?
(a) Archery, (b) Muzzleloader, (c) Rifle, (d) No preference
Survey 2, Question 9. The historic trend of the elk population size in GMU 53 & 63 follows the black
line in the chart below. Manipulating the elk population size can have short and long term effects,
several of which are provided below:
Please read the scenario descriptions before answer the following question.
***Disclaimer: Several of the "anticipated outcomes" listed below assume that elk biological variables, bull ratios,
hunting success rates, and license demands do not change.***
INCREASING elk population size can have these anticipated outcomes:
Short-term:
- Cow elk licenses decrease dramatically for the next ~5 years
- Reduces hunter crowding
Long-term:
- Cow licenses increase after objective is reached.
- More cow hunters will be required to maintain the elk population, thus more hunter crowding may occur.
- A greater opportunity to harvest bulls and cows may occur.
- Competition between other range-land animals may likely occur (domestic livestock, mule deer, sage grouse).
- Conflicts with landowners and agricultural operators may be more likely to occur.
Maintaining the elk population size (NO CHANGE) can have the following anticipated outcomes:
Short-term:
- Cow licenses may decrease slightly in order to make the current elk population trend stable.
Long-term:
- Competition between other range-land animals (domestic livestock, mule deer, sage grouse) may still occur and vulnerability
of range-lands to drought and severe winter may still occur.
DECREASING elk population size will have these anticipated outcomes:
Short-term:
- Cow licenses increased for the next ~5 years

47
- Increases hunter crowding
Long-term:
- Cow licenses increase after objective is reached; fewer cow hunters may be required to maintain the elk population
- Very little hunter crowding may occur.
- Opportunity to harvest bulls and cows may be the least.
- Competition between other range-land animals may be less likely occur (domestic livestock, mule deer, sage grouse).
- Conflicts with landowners and agricultural operators will be less likely to occur
Given the above scenarios and descriptions of anticipated outcomes: during the next 10 years
(2018 – 2029), how do you want the GMU 53, 54, & 63 elk population size to be managed?
(a) increase by ~ 35%, (b) increase by ~17%, (c) Do not change, (d) Decrease by ~17%, (e )
Decrease by ~35%
Answer choices by percent of respondents and respondent type:
The following table shows n weighted average percent change in elk population size desired for
each respondent type and GMU of interest. Overall, the public desired a positive percent change
(increase in elk population) regardless of respondent type; a majority of the respondents wanted
some increase in elk.
The weighted average percent change was calculated by multiplying the number of respondents
for each of the five letter options above, by the desired percent change they desired (+35%,
+17%, 0%, -17%, -35%). Those indicating no-preference were removed from the analysis.

48
Survey 2, Question 10. High bull ratios often equate to having more older aged bulls and fewer other
hunters on the landscape. However, having a higher bull ratio also means that hunting opportunity is
decreased. During the next 10 years how would you like the bull ratio to be managed in GMU 53 &
63?
(a) Increased (want less hunting opportunity, but potentially more/larger bulls, less crowding),
(b) Stay the same, (c) Decreased (I want more hunting opportunity, but potentially
fewer/smaller bulls, more crowding), (d) No preference
Answer choices by percent of respondents and respondent type:
Survey 2, Question 11. How concerned are you about the following items:
(a) Habitat quantity or quality (not having enough habitat for deer and/or elk, other wild
species, and/or domestic livestock), (b) Potential for deer and/or elk to starve during the winter,
(c) Economic losses due to deer and/or elk (i.e., ag-production, gardens, fences), (d) Land not
being accessible for hunting (i.e., places where elk hunting is not allowed), (e) Impacts of
hunting recreation pressure on the distribution of deer and/or elk, (f) Impacts of non-hunting
recreation (i.e., ATVs hikers, camping, antler collecting) on the distribution of deer and/or elk,
(g) Disease (i.e., Chronic Wasting Disease) negatively effecting deer and/or elk populations, (h)
Disease (i.e., Chronic Wasting Disease) transmission potential from wildlife to humans, pets, or
livestock, (i) Predators effecting deer and/or elk populations, (j) Vehicle collisions with deer
and/or elk
*Answer choices could pertain to both deer and/or elk in the GMU 53 & 63 pool of
respondents. Deer was not described in the GMU 54 survey answer choices, and thus GMU
54 respondents answers only applied to elk.

49
Answer choices were ranked by calculating a weighted percent (Not at all concerned = 0
points, Slightly concerned = 1 point, Moderately important = 2 points, Very concerned = 3
points) for each issue independently. A weighted score was calculated by multiplying the
number of respondents times the degree of concern (points 0 – 3) they answered for. A total
count was created by multiplying 3 times the total number of respondents answering.
Dividing the weighted score by the total possible count produced the percentages presented
below. 0% would indicate all respondents in the survey indicated that a particular issue was
“Not at all concerning”, while a 100% would indicate the particular issue was “Very
concerning”. Issues were ranked from 1 – 10 (second column) for each of the respondent
types, with the most concerning issue highlighted in yellow.
Survey 2, Question 12. Tell us how you feel about the following statement: “the problem isn’t with
too many or too few elk in GMU 53 or 63, it is the distribution (where elk occur) that is a problem”
(a) I do not agree or disagree, (b) Strongly agree, (c) Somewhat agree, (d) Somewhat
disagree, we should probably change the number of elk, (e) Strongly disagree, the
number of elk needs to be changed!, (f) No opinion or none of the above

50
Answer choices by percent of respondents and respondent type:
Survey 2, Question 13. What is your zip-code (please enter 5-digit zip)?
Respondents represented a variety of geographies, that were also captured a-prior in the list of
post-card addresses solicited. Future analysis may utilize these addresses to extract geographic
attributes of respondents.
Survey 2, Question 14. In what year were you born? (please enter 4-digit year)
Survey 2, Question 15. Would you like to receive updates on this plan? (i.e., when a draft is released
for public comment, notice of the plan’s final approval) If so, please enter your email address here:
A total of 477 respondents (71% of those interested in elk) provided email addresses for notifying
them on the updates of the plan.
Survey 2, Question 16. Please use the space below to provide any additional comments you may have
about deer or elk management in GMUs 53, 54, and 63.
A total of 366 respondents (55% of those interested in elk) took the opportunity to provide
written comments. These comments were all read and reviewed to glean any additional ideas for
elk management strategies potentially implemented in this plan and for outside of this plan.
Section 3: General public online survey
Results of the third survey, “general public online survey” (Survey Monkey, Inc, Palo Alto, CA, USA)
are summarized below in the following tables. Because the survey specific to GMUs 53 & 63 was also
directed to those interested in deer management issues for a similar DAU planning process, respondents
indicating they were solely interested in deer were filtered from the survey when applicable. Results of
this survey are considered less rigorous, as it may not be representative of all interests or proportionally
representative of any particular stakeholder group.
Survey 3, Question 1: Answer choices by percent of respondents and respondent type:

51
Survey 3, Question 2: Answer choices by percent of respondents and respondent type:
Survey 3, Question 3*:
*respondents from GMU 53 & 63 pool had opportunity to select both 53 and 63. The GMU 54 answer
choice did not appear to those respondents in the GMU 53 & 63 pool of hunters and landowners.
**This question did not appear to the GMU 54 pool of respondents, as a separate survey instrument was
available to those hunters and landowners.
The respondents’ answers were summarized in the following table based on percentage and raw number
(in parenthesis) of respondents. However, this information was primarily used for characterizing the
various stakeholders answer choices and summaries in subsequent questions.
Answer choices by percent of respondents and respondent type:
Survey 3, Question 4:
*Only respondents who chose answer choice D (own or manage private land) from question 2 were
allowed to answer.
**respondents from GMU 54 pool were not presented with answer choices pertaining to deer
Summary by percentage (and count) of landowner respondents

52
Survey 3, Question 5:
Survey 3, Question 6:
*Only respondents who chose answer choice D (own or manage private land) from question 2 were
allowed to answer.
**respondents from GMU 54 pool were not presented with answer choices pertaining to deer
Summary by percentage (and count) of landowner respondents
Survey 3, Question 7:
*Answer choices could pertain to both deer and/or elk in the GMU 53 & 63 pool of respondents. Deer
was not described in the GMU 54 survey answer choices, and thus GMU 54 respondents answers only
applied to elk.
Answer choices were ranked by calculating a weighted percent (Not important = 0 points, Slightly
important = 1 point, Moderately important = 2 points, Very important = 3 points) for each reason
independently. A weighted score was calculated by multiplying the number of respondents times the
degree (points 0 – 3) they answered for. A total count was created by multiplying 3 times the total
number of respondents answering. Dividing the weighted score by the total possible count produced the
percentages presented below. 0% would indicate all respondents in the survey indicated that a particular
reason was “Not Important”, while a 100% would indicate the particular reason was “Very Important”.

53
Survey 3, Question 8: Answer choices by percent of respondents and respondent type:
Survey 3, Question 9:
The below graph categorized question 8 into three broad categories.
Answer choices by percent of respondents and respondent type:
Survey 3, Question 10: Answer choices by percent of respondents and respondent type:
Survey 3, Question 11: Respondents were presented with the discussion and the different tradeoffs
when managing the elk population size certain ways. See question 9 of section 2 in this appendix for the
graphs and discussion provided.
Answer choices by percent of respondents and respondent type:
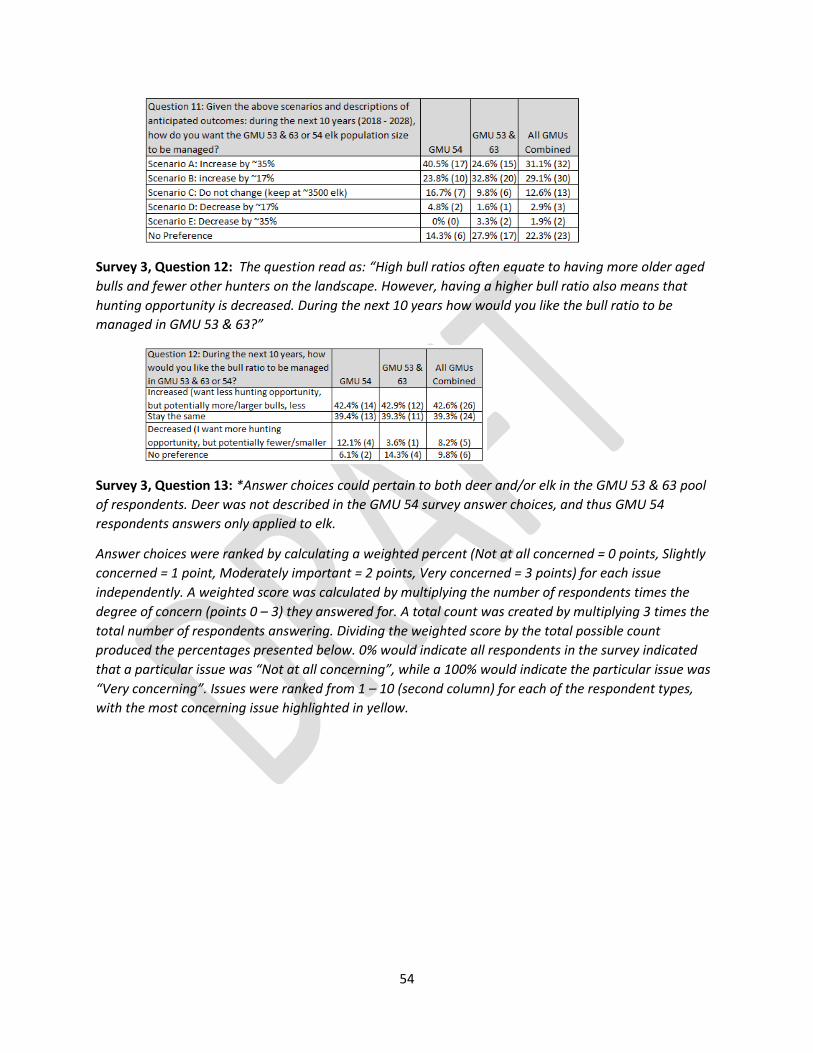
54
Survey 3, Question 12: The question read as: “High bull ratios often equate to having more older aged
bulls and fewer other hunters on the landscape. However, having a higher bull ratio also means that
hunting opportunity is decreased. During the next 10 years how would you like the bull ratio to be
managed in GMU 53 & 63?”
Survey 3, Question 13: *Answer choices could pertain to both deer and/or elk in the GMU 53 & 63 pool
of respondents. Deer was not described in the GMU 54 survey answer choices, and thus GMU 54
respondents answers only applied to elk.
Answer choices were ranked by calculating a weighted percent (Not at all concerned = 0 points, Slightly
concerned = 1 point, Moderately important = 2 points, Very concerned = 3 points) for each issue
independently. A weighted score was calculated by multiplying the number of respondents times the
degree of concern (points 0 – 3) they answered for. A total count was created by multiplying 3 times the
total number of respondents answering. Dividing the weighted score by the total possible count
produced the percentages presented below. 0% would indicate all respondents in the survey indicated
that a particular issue was “Not at all concerning”, while a 100% would indicate the particular issue was
“Very concerning”. Issues were ranked from 1 – 10 (second column) for each of the respondent types,
with the most concerning issue highlighted in yellow.

55
Survey 3, Question 14: Answer choices by percent of respondents and respondent type:
Question 15: What is your zip-code (please enter 5-digit zip)?
Respondents represented a variety of geographies, that were also captured a-prior in the list of post-card
addresses solicited. Future analysis may utilize these addresses to extract geographic attributes of
respondents.

56
Question 17: Would you like to receive updates on this plan? (i.e., when a draft is released for public
comment, notice of the plan’s final approval) If so, please enter your email address here:
A total of 55 respondents (54%% of those interested in elk) provided email addresses for notifying them
on the updates of the plan.
Question 18: Please use the space below to provide any additional comments you may have about
deer or elk management in GMUs 53, 54, and 63.
A total of 40 respondents (39%% of those interested in elk) took the opportunity to provide written
comments. These comments were all read and reviewed to glean any additional ideas for elk
management strategies potentially implemented in this plan and for outside of this plan.
Section 4: Attached Comment Letters
Letters received from the Gunnison County Stock Growers Association (8/2/2017), Montrose BLM Field
Office (11/17/2017), Habitat Partnership Program (combined letter from North Fork and Gunnison
Committees: 12/18/2017), Gunnison County Stock Growers Association (1/8/2018), and USFS Gunnison
Ranger District (2/20/2018) are attached below.
Gunnison County Stock Growers Association, Inc letter #1 (page 1 of 1)

57
Montrose BLM field office letter (page 1 of 3)

58
Montrose BLM field office letter (page 2 of 3)

59
Montrose BLM field office letter (page 3 of 3)
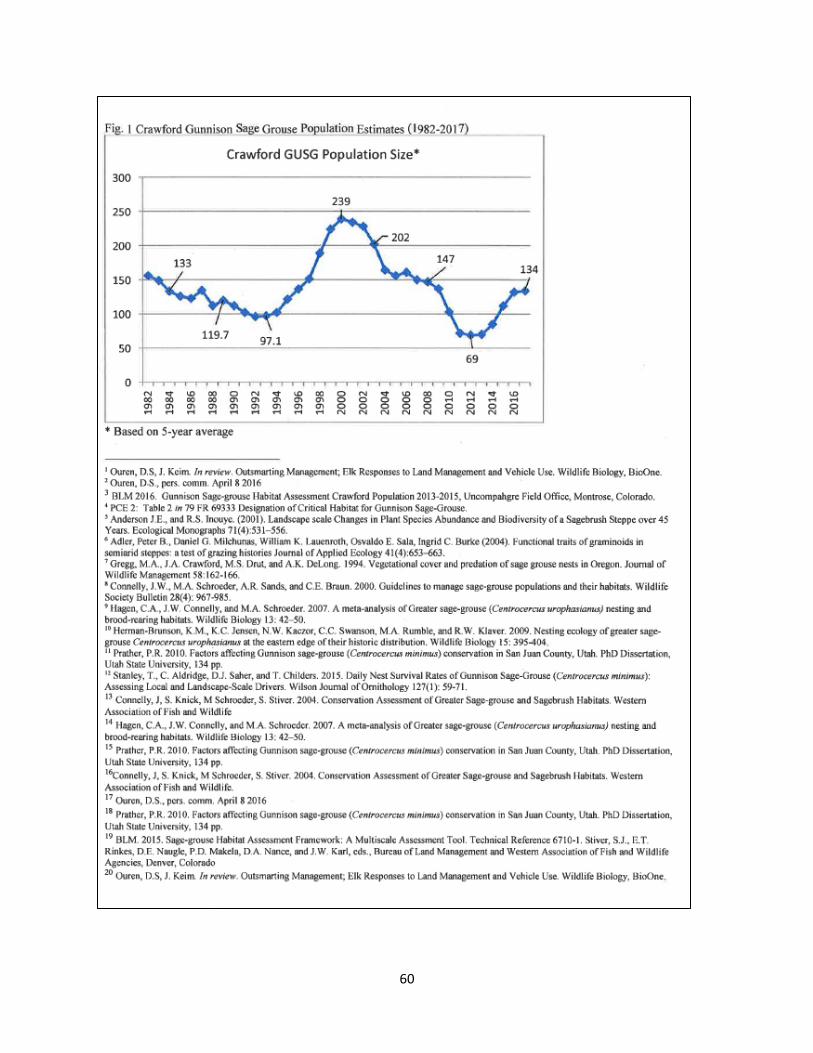
60

61
Habitat Partnership Program Committee letter (page 1 of 2)

62
Habitat Partnership Program Committee letter (page 1 of 2)

63
Gunnison County Stock Growers Association, Inc letter #2 (page 1 of 2)

64
Gunnison County Stock Growers Association, Inc letter #2 (page 1 of 2)
USFS – Gunnison Ranger District letter (page 1 of 1)

65

66
USFS – Gunnison Ranger District letter (page 2 of 2)

67
References Aldridge, C.L., D.J. Saher, T.M. Childers, K.E. Stahlnecker, and Z.H. Bowen. 2012. Crucial nesting habitat
for Gunnison sage-grouse: a spatially explicit hierarchical approach. Journal of Wildlife Management
76:391-406.
Bierwagen, B.G, D.M. Theobald, C.R. Pyke, A. Choate, P. Groth, J.V. Thomas, and P. Morefield. 2010.
National housing and impervious surface scenarios for integrated climate impact assessments.
Proceedings of the National Academy of Sciences 107:20887-20892.
Bartholow, J. 2000. Pop-II for Windows, Version 1.0. Fossil Creek Software, Fort Collins, CO, USA.
BLM. 2011. Assessment, inventory and monitoring strategy for integrated renewable resources
management. U.S. Department of Interior, Washington, D.C. Website: aim.landscapetoolbox.org
BLM. 2015. Gunnison sage-grouse habitat assessment. Crawford Population 2013-2015. Uncompahgre
Field Office, Montrose, CO.
Cleveland, S.M., M. Hebblewhite, M. Thompson, and R. Henderson. 2012. Linking elk movement and
resource selection to hunting pressure in a heterogenous landscape. Wildlife Society Bulletin 36:658-668
Conner, M.M., G.C. White, and D.J. Freddy. 2001. Elk movement in response to early-season hunting in
northwest Colorado. Journal of Wildlife Management 55:396-400.
Davis, A.J., M.L. Phillips, and P.F. Doherty. 2015. Survival of Gunnison sage-grouse Centrocerucs minimus
in Colorado, USA.
Diamond, B. 2013. Mule Deer Herd Management Plan Data Analysis Unit D-21 West Elk Herd, Game
Management Unit 54. Colorado Parks and Wildlife.
Frair, J.L., E.H. Merrill, H.L. Beyer, and J.M. Morales. 2008. Thresholds in landscape connectivity and
mortality risks in response to growing road networks. Journal of Applied Ecology 45:1504-1513.
Freddy, D.J. 2002. Estimating calf and adult survival rates and pregnancy rates of Gunnison Basin Elk.
Colorado Division of Wildlife, Wildlife Research Report. Project: W-153-R-14, 15
Freddy, D.J., G.C. White, M.C. Kneeland, R.H. Kahn, J.W. Unsworth, W.J. deVergie, V.K. Graham, J.H.
Ellenberger, and C.H. Wagner. 2004. How many mule deer are there? Challenges of credibility in
Colorado. Wildlife Society Bulletin 32:916-927.
GSRSC (Gunnison Sage-grouse Rangewide Steering Committee. 2005. Gunnison sage-grouse rangewide
conservation plan. Colorado Division of Wildlife, Denver, Colorado, USA.
Hebblewhite, M. C.A. White, C.G. Nietvelt, J.A. McKenzie, T.E. Hurd, J.M. Fryxell, S.E. Bayley, and P.C.
Paquet. 2005. Human activity mediates a trophic cascade caused by wolves. Ecology 86: 2135-2144.
Hurley, M.A., and G.A. Sargeant. 1991. Effects of hunting and land management on elk habitat use,
movement patterns, and mortality in western Montana. Pages 94−98 in A.G. Christensen, L.J. Lyon, and
T.N. Lonner, editors. Proceedings of the elk vulnerability symposium. Montana State University,
Bozeman, Montana, USA.

68
Homan, D. 1996. Report to North Fork Habitat Partnership Program Committee on Elk Migration and
Distribution in the North Fork Valley. February 1996. Colorado Division of Wildlife.
Johnson, B.K., A.A. Ager, J.H. Noyes, N. Cimon. 2002. Elk and Mule Deer Responses to Variation in
Hunting Pressure. Transactions of the 69th North American Wildlife and Natural Resources Conference.
625-640.
Kloppers, E. L., C. C. St. Clair, and T. E. Hurd. 2005. Predator-resembling aversive conditioning for
managing habituated wildlife. Ecology and Society 10(1): 31. [online] URL:
http://www.ecologyandsociety.org/vol10/iss1/art31/
Kuck, L., G. H. Hompland, and E. H. Merrill. 1985. Elk calf response to simulated mine disturbance in
southeast Idaho. Journal of Wildlife Management 49:751-757.
LANDFIRE. (2013, January - last update). [Homepage of the LANDFIRE Project, U.S. Department of
Agriculture, Forest Service; U.S. Department of Interior], [Online]. Available:
http://www.landfire.gov/index.php [2013, February 8].
Lyon, J.L. 1979. Habitat effectiveness for elk as influenced by roads and cover. Journal of Forestry
77:658-660.
Lyon, J.L., and C.E. Jenson. 1980. Management implications of elk and deer use of clear-cuts in Montana.
Journal of Wildlife Management 44:352-362.
Masden, D. 2001. Sapinero E-41 Elk Management Plan, Game Management Unit 54. Colorado Division of
Wildlife.
Masden, D. and L. Spicer. 2003. Flat Top Elk Relocation Project Game Management Unit 54. Internal
Report, March 2003, 7 pp.
Montgomery, R.A., G.J. Roloff, and J.J. Millspaugh. 2013. Variation in elk response to roads by season,
sex, and road type. Journal of Wildlife Management 77:313-325.
Morrison, J.R., W. J. Devergie, A.W. Alldredge, A.E. Byrne, and W.W. Andre. 1995. The effects of ski area
expansion on elk. Wildlife Society Bulletin 23:481-489.
Oyler-McCance, K.P. Burnham, and C.E. Braun. 2001. Influence of changes in sagebrush on Gunnison
sage-grouse in southwestern Colorado. The Southwestern Naturalist 56:323-331.
Perry, C., and R. Overly. 1977. Impact of roads on big game distribution in portions of the Blue
Mountains of Washington, 1972-1973. Washington Game Department Report, Olympia, WA. 38 pp.
Phillips, G.E., and W.W. Alldredge. 2000. Reproductive success of elk following disturbance by humans
during calving season. Journal of Wildlife Management 64:521-530.
Picton, H.D. 1980. Land-use impacts on elk in the Gallatin Valley. Journal of Soil and Water Conservation
35:93-95.
Preisler, H. K., A. A. Ager, and M. J. Wisdom. 2006. Statistical methods for analyzing responses of wildlife
to human disturbance. Journal of Applied Ecology 43:164-172.

69
Roath, R. et al. Gunnison Basin Habitat Assessment Project. Report to Gunnison Basin Habitat
Partnership Committee. January 1999.
Rost, G. R., and J.A. Bailey. 1979. Distribution of mule deer and elk in relation to roads. Journal of
Wildlife Management 43:634-641.
Rumble, M.A., L. Benkobi, and S.R. Gamo. 2005. Elk response to humans in a densely road area.
Intermountain Journal of Science 11:10-24.
Sawyer, H., R.M. Nielson, F.G. Lindzey, L. Keith, J.H. Powell, and A.A. Abraham. 2007. Habitat selection of
Rocky Mountain elk in a nonforested environment. Journal of Wildlife Management 71:868-874.
Shively, K. J., A. W. Alldredge, and G. E. Phillips. 2005. Elk reproductive response to removal of calving
season disturbance by humans. Journal of Wildlife Management 69:1073-1080.
Stanley, T.R., C.L. Aldridge, D.J. Saher, and T.M. Childers. 2015. Daily nest survival rates of Gunnison
Sage-grouse: assessing local and landscape scale drivers. The Wilson Journal of Ornithology 127:59-71.
Steinert, S.F., H.D. Riffel, and G.C. White. 1994. Comparisons of big game harvest estimates from check
station and telephone surveys. Journal of Wildlife Management 58:335-340.
Sunde, P., C.R. Olesen, T.L. Madsen, & Lars Haugaard. 2009. Behavioral responses of GPS-collared female
red deer (Cervus elaphus) to driven hunts. Wildlife Biology 15:454-2009.
United States Department of Interior. Bureau of Land Management. Impacts of Wintering Game on
Shrubland Communities in the Gunnison Basin, Summary of Key Points and Results. Gunnison. 2006.
Viera, M.E.P., M.M. Conner, G.C. White, and D.J. Freddy. 2003. Effects of archery hunter numbers and
opening dates on elk movement. Journal of Wildlife Management 67:717-728.
Wait, S., and H. McNally. 2004.Selection of habitats by wintering elk in a rapidly subdividing area of La
Plata County, Colorado. Proceedings of the 4th international Urban Wildlife Symposium, Shaw et al. Eds.
200-209.
Walsh, N.E., G.C. white, and D.J. Freddy. 1991. Responses of bull elk to simulated elk vocalizations during
rut. Journal of Wildlife Management 55:396-400.
Webb, S.L., M.R. Dzialak, S.M. Harju, LD. Hayden-Wing and J.B. Winstead. 2011. Effects of human activity
on space use and movement patterns of female elk. Wildlife Society Bulletin 35:261-269.
White, G.C., and B.C. Lubow. 2002. Fitting population models (Quattro) (Excel) to multiple sources of
observed data. Journal of Wildlife Management 66:300-309.
Williams, M.I., and A.L. Hild. 2012. Characteristics of Gunnison sage-grouse habitat in dry mountain loam
and mountain loam ecological sites of the Gunnison Basin. Report to the Colorado Division of Parks and
Wildlife. Department of Ecosystem Science and Management, University of Wyoming, Laramie. [Online].
https://www.western.edu/sites/default/files/page/docs/Williams.gunnison-final-report-2012.pdf
Wisdom, M. J., A.A. Ager, H.K. Preisler, N.J. Cimon, and B.K. Johnson. 2005. Effects of Off-Road
Recreation on Mule Deer and Elk. Pages 67-80 in Wisdom, M. J., technical editor, The Starkey Project: a
synthesis of long-term studies of elk and mule deer. Reprinted from the 2004 Transactions of the North

70
American Wildlife and Natural Resources Conference, Alliance Communications Group, Lawrence,
Kansas, USA.
Witmer, G.W., and D.S. deCalesta. 1985. Effects of forest roads on habitat use by Roosevelt elk.
Northwest Science 59:122-125.
Young, S. 1982. Migration patterns of the upper Gunnison river elk herd. Colorado State University, Fort
Collins, CO. M.S. thesis. 104 pp.
Copyright © 2022 FDOKUMEN