The Loma Prieta (Santa Cruz mountains), California ...
168
-
Upload
khangminh22 -
Category
Documents
-
view
1 -
download
0
Transcript of The Loma Prieta (Santa Cruz mountains), California ...


.

SPECIAL PUBLICATION 104
PHYSICAL SCIENCES |
LIBRARY
UC DA
I
D CALIFORNIADEPARTMENTOF CONSERVATION
Division of Mines and Geology
(
THE RESOURCES AGENCYGORDON K. VAN VLECK
SECRETARY FOR RESOURCES
STATE OF CALIFORNIAGEORGE DEUKMEJIAN
GOVERNOR
DEPARTMENT OF CONSERVATIONRANDALL M.WARD
DIRECTOR

DIVISION OF MINES AND GEOLOGYJAMES F. DAVIS
STATE GEOLOGIST
Cover Photo:
View to the south of Hazel Dell Road, located in the Santa Cruz
Mountains about 8.5 kilometers north of Watsonville. The large
fissures in the road were caused by lateral spreading due to lique-
faction of saturated sediments in Simas Lake and intense shaking
associated with the fVL 7.1 Loma Prieta earthquake (note leaning
telephone pole). Simas Lake, located just west of Hazel Dell Road,
is a closed depression formed by recurring surface fault rupture
along the San Andreas fault. Photo by W. A. Bryant, 10/18/89.

irf . y//V
THE LOMA PRIETA
(SANTA CRUZ MOUNTAINS), CALIFORNIA,
EARTHQUAKE
OF
17 OCTOBER 1989
Edited by
Stephen R. McNutt and Robert H. Sydnor
Special Publication 104
1990
Department of Conservation
Division of Mines and Geology
1416 Ninth Street, Room 1341
Sacramento, CA 95814

3
.- v«^
C3Mte* * it * Si J1
.' r- f %lti' i--' /J'" ''*
'-%J.
#•
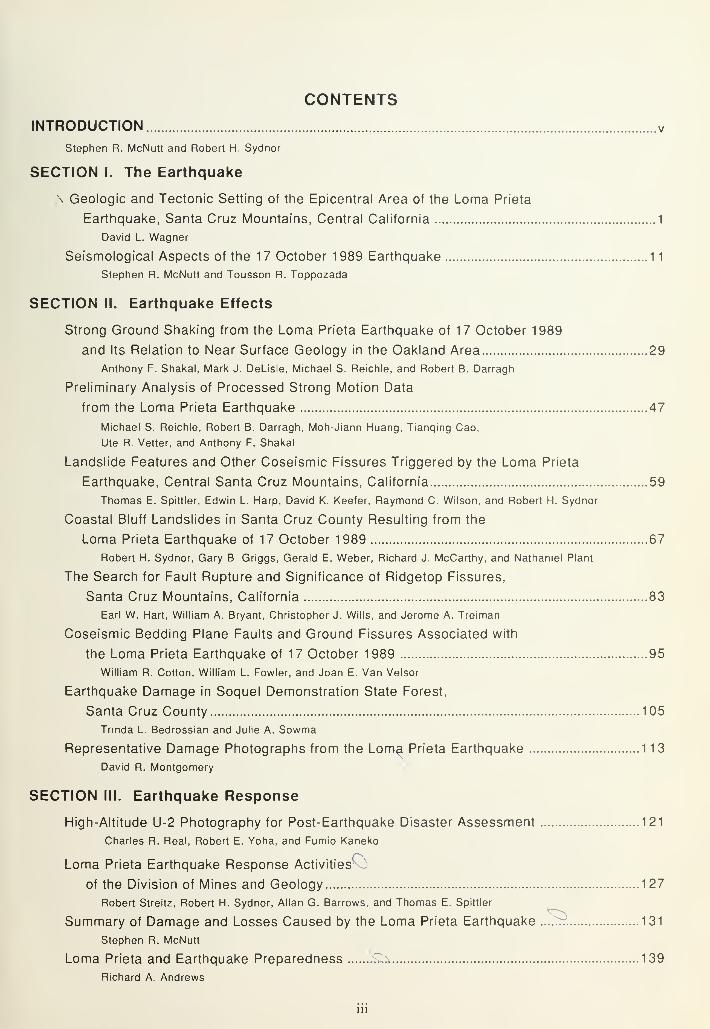
CONTENTS
INTRODUCTION v
Stephen R. McNult and Robert H. Sydnor
SECTION I. The Earthquake
\ Geologic and Tectonic Setting of the Epicentral Area of the Loma Prieta
Earthquake, Santa Cruz Mountains, Central California 1
David L. Wagner
Seismological Aspects of the 17 October 1989 Earthquake 1
1
Stephen R. McNutt and Tousson R. Toppozada
SECTION II. Earthquake Effects
Strong Ground Shaking from the Loma Prieta Earthquake of 17 October 1989
and Its Relation to Near Surface Geology in the Oakland Area 29
Anthony F. Shakal, Mark J. DeLisle, Michael S. Reichle, and Robert B. Darragh
Preliminary Analysis of Processed Strong Motion Data
from the Loma Prieta Earthquake 47
Michael S. Reichle, Robert B. Darragh, Moh-Jiann Huang, Tianqing Cao,
Ute R. Vetter, and Anthony F. Shakal
Landslide Features and Other Coseismic Fissures Triggered by the Loma Prieta
Earthquake, Central Santa Cruz Mountains, California 59
Thomas E. Spittler, Edwin L. Harp, David K. Keefer, Raymond C. Wilson, and Robert H. Sydnor
Coastal Bluff Landslides in Santa Cruz County Resulting from the
Loma Prieta Earthquake of 17 October 1989 67
Robert H. Sydnor, Gary B. Griggs, Gerald E. Weber, Richard J. McCarthy, and Nathaniel Plant
The Search for Fault Rupture and Significance of Ridgetop Fissures,
Santa Cruz Mountains, California 83
Earl W. Hart, William A. Bryant, Christopher J. Wills, and Jerome A. Treiman
Coseismic Bedding Plane Faults and Ground Fissures Associated with
the Loma Prieta Earthquake of 17 October 1989 95
William R. Cotton, William L. Fowler, and Joan E. Van Velsor
Earthquake Damage in Soquel Demonstration State Forest,
Santa Cruz County 105
Trinda L. Bedrossian and Julie A. Sowma
Representative Damage Photographs from the Loma Prieta Earthquake 1 13
David R. Montgomery
SECTION III. Earthquake Response
High-Altitude U-2 Photography for Post-Earthquake Disaster Assessment 121
Charles R. Real, Robert E. Yoha, and Fumio Kaneko
Loma Prieta Earthquake Response Activitiesv;
of the Division of Mines and Geology 127
Robert Streitz, Robert H. Sydnor, Allan G. Barrows, and Thomas E. Spittler
Summary of Damage and Losses Caused by the Loma Prieta Earthquake ...... 131
Stephen R. McNutt
i Prieta and Eartl
Richard A. Andrews
Loma Prieta and Earthquake Preparedness ..o. 139
in

Digitized by the Internet Archive
in 2012 with funding from
University of California, Davis Libraries
http://archive.org/details/lomaprietasantac104cali
INTRODUCTION
by
Stephen R. McNutt and Robert H. Sydnor
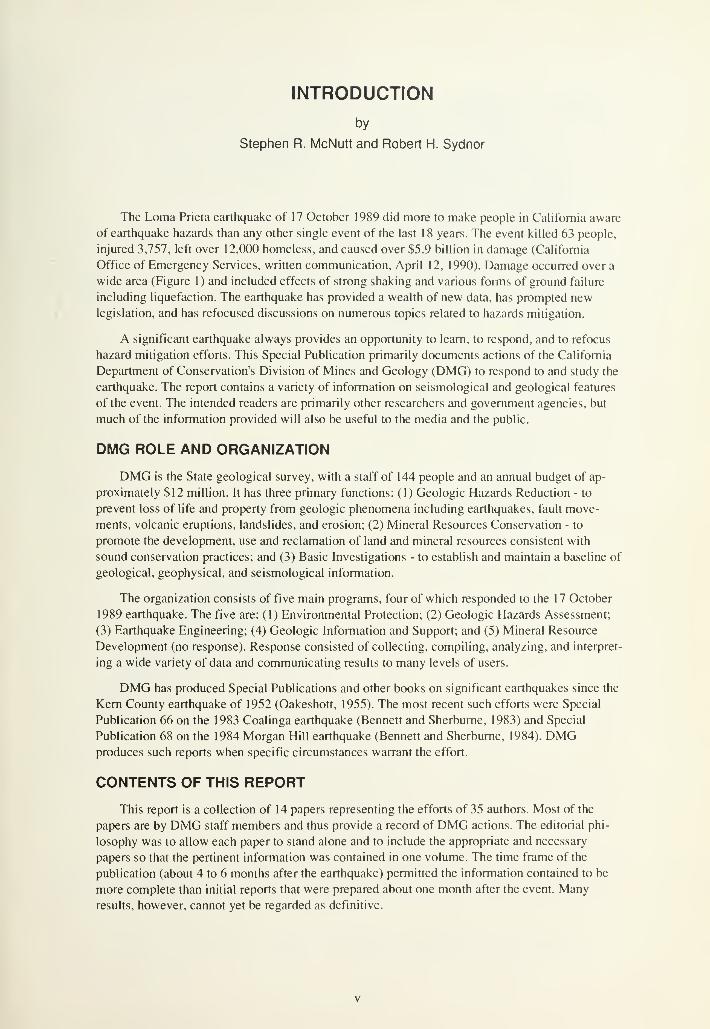
The Loma Prieta earthquake of 17 October 1989 did more to make people in California aware
of earthquake hazards than any other single event of the last 18 years. The event killed 63 people,
injured 3,757, left over 12,000 homeless, and caused over $5.9 billion in damage (California
Office of Emergency Services, written communication, April 12, 1990). Damage occurred over a
wide area (Figure 1) and included effects of strong shaking and various forms of ground failure
including liquefaction. The earthquake has provided a wealth of new data, has prompted new
legislation, and has refocused discussions on numerous topics related to hazards mitigation.
A significant earthquake always provides an opportunity to learn, to respond, and to refocus
hazard mitigation efforts. This Special Publication primarily documents actions of the California
Department of Conservation's Division of Mines and Geology (DMG) to respond to and study the
earthquake. The report contains a variety of information on seismological and geological features
of the event. The intended readers are primarily other researchers and government agencies, but
much of the information provided will also be useful to the media and the public.
DMG ROLE AND ORGANIZATION
DMG is the State geological survey, with a staff of 144 people and an annual budget of ap-
proximately $ 1 2 million. It has three primary functions: ( 1 ) Geologic Hazards Reduction - to
prevent loss of life and property from geologic phenomena including earthquakes, fault move-
ments, volcanic eruptions, landslides, and erosion; (2) Mineral Resources Conservation - to
promote the development, use and reclamation of land and mineral resources consistent with
sound conservation practices; and (3) Basic Investigations - to establish and maintain a baseline of
geological, geophysical, and seismological information.
The organization consists of five main programs, four of which responded to the 17 October
1989 earthquake. The five are: (1) Environmental Protection; (2) Geologic Hazards Assessment;
(3) Earthquake Engineering; (4) Geologic Information and Support; and (5) Mineral Resource
Development (no response). Response consisted of collecting, compiling, analyzing, and interpret-
ing a wide variety of data and communicating results to many levels of users.
DMG has produced Special Publications and other books on significant earthquakes since the
Kern County earthquake of 1952 (Oakeshott, 1955). The most recent such efforts were Special
Publication 66 on the 1983 Coalinga earthquake (Bennett and Sherburne, 1983) and Special
Publication 68 on the 1984 Morgan Hill earthquake (Bennett and Sherburne, 1984). DMGproduces such reports when specific circumstances warrant the effort.
CONTENTS OF THIS REPORT
This report is a collection of 14 papers representing the efforts of 35 authors. Most of the
papers are by DMG staff members and thus provide a record of DMG actions. The editorial phi-
losophy was to allow each paper to stand alone and to include the appropriate and necessary
papers so that the pertinent information was contained in one volume. The time frame of the
publication (about 4 to 6 months after the earthquake) permitted the information contained to be
more complete than initial reports that were prepared about one month after the event. Manyresults, however, cannot yet be regarded as definitive.
122° 30 122° 00' 121°30'
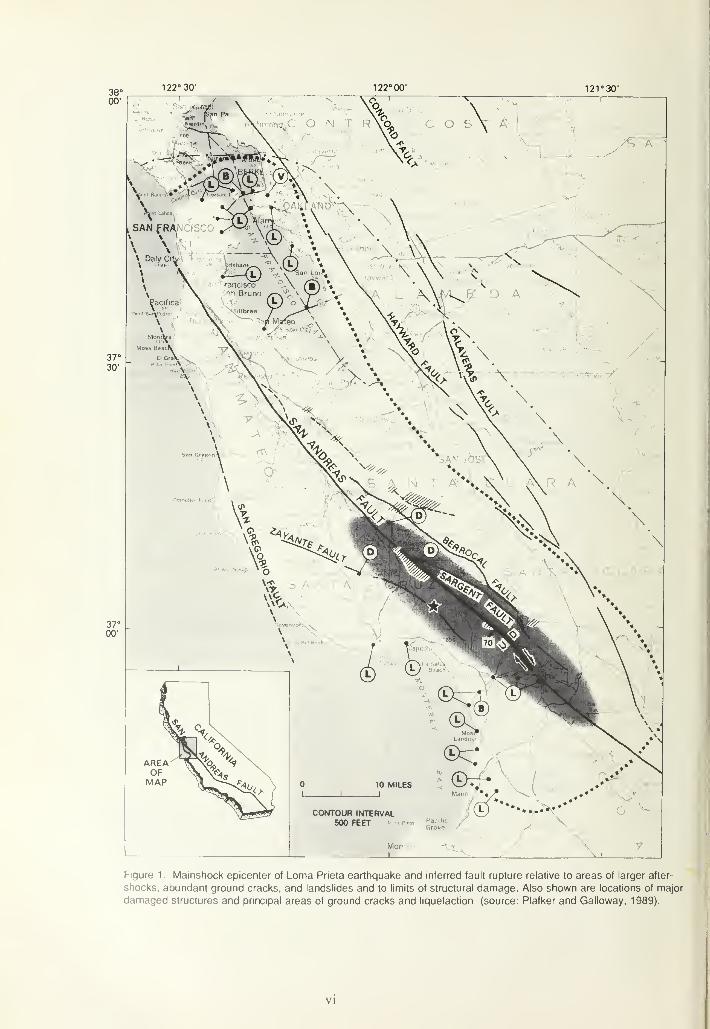
Figure 1 . Mainshock epicenter of Loma Prieta earthquake and inferred fault rupture relative to areas of larger after-
shocks, abundant ground cracks, and landslides and to limits of structural damage. Also shown are locations of major
damaged structures and principal areas of ground cracks and liquefaction (source: Plafker and Galloway, 1989).
VI

EXPLANATION
DFault rupture of Loma Prieta earth-
quake-Arrows show relative horizon-
tal movement; small arrow and
numeral show direction and amount
of dip; U, upthrown side;
D, downthrown side
u 1 —70
Fault -Dashed where approximately
located
* Main shock epicenter
mm Area of aftershocks and abundant land-
slides
/////// Area of ground cracks possibly related
to faulting
Approximate limit of major structural
damage
Approximate limit of landslides
© Prominent area of liquefaction
® Damaged bridge
® Damaged dam
® Damaged two-story viaduct
Figure 1. Continued
This Special Publication is divided into
three sections. The first focuses on the earth-
quake itself and its geologic and seismologic
setting. The second section focuses on selected
effects of the earthquake and study by several
DMG programs. Key contributions are those on
strong ground motion, landslides, and fault
evaluation. The third section focuses on
response and evaluation.
Special effort has gone into providing
many high quality figures and complete tables
throughout the publication. This was done to
make the volume useful as a reference work on
the Loma Prieta earthquake and on related
geologic phenomena. For example, much of
the information contained in the volume will be
useful as background information when the
next M> 7 earthquake strikes California.
The choice of topics was made to highlight
DMG activities and to provide balance. How-ever, it was not possible to cover every aspect
of the earthquake. For example, liquefaction
and several engineering aspects of the event
have received only limited attention here. These
have received adequate attention elsewhere
(e.g., Plafker and Galloway, 1989).
GENERAL INFORMATION
The Loma Prieta earthquake epicenter is located in the Laurel quadrangle, U.S. Geological Survey
7.5-Minute Series (Topographic), and immediately adjacent to the Loma Prieta quadrangle of the same series.
The epicenter was located in the Forest of Nisene Marks State Park. The event occurred in the southern Santa
Cruz Mountains, a physiographic feature which appears in most world atlases; Loma Prieta is the highest
peak in these mountains and is located just a few kilometers from the epicenter.
Under contract from the California Coastal Commission, the Division of Mines and Geology and the
U. S. Geological Survey have cooperatively prepared a comprehensive set of seven regional geologic maps
which cover the entire California continental margin at a scale of 1 :250,000. Map area 5, covering the Santa
Cruz and Monterey Bay area, is scheduled to be published in mid- 1990; see Cockerham and others (1990)
and McCulloch and Greene (1990).
The new 1 :750,000-scale State Fault Activity Map (Jennings, 1991, in preparation) will delineate active
faults in California using a five color classification scheme for recency of faulting.
Metric units have been used throughout most of this volume, reflecting standard scientific practice world-
wide. An exception is found in the article by Real and others; both photography and aviation use English
units as standards. (One kilometer is equal to 0.62 miles, or conversely one mile equals 1.61 kilometers. One
meter is equal to 39.4 inches, or one foot equals 0.30 meters).
The earthquake occurred on October 17, 1989 at 5:04 p.m. Pacific Daylight Time (PDT, local time). This
has created some confusion because it occurred on October 18, 1989 at 00:04 Greenwich Mean Time (GMT;
also cailed Universal Time Coordinated or UTC). Further, a local time change occurred on October 29, 1989.
Up until October 29, GMT was equal to local time (PDT) plus 7 hours; after October 29, GMT was equal to
local time (PST) plus 8 hours.
Additional copies of this publication and other maps and publications of DMG may be obtained by
writing to the Publications and Information Office, Division of Mines and Geology, 660 Bercut Drive,
Sacramento, CA 95814-0131.
vn

REFERENCES
Bennett, J.H., and Sherburne, R.W., eds., 1983, The 1983 Coalinga, California Earthquakes: California
Division of Mines and Geology, Special Publication 66, 335 p.
Bennett, J.H., and Sherburne, R.W., eds., 1984, The 1984 Morgan Hill, California, Earthquake:
California Division of Mines and Geology, Special Publication 68, 271 p.
Cockerham, R. S., McCulloch, D. S., and Greene, H. G., 1990, Earthquake epicenters and selected fault-
plane solutions of the central California Continental Margin: California Division of Mines and
Geology, Geology of the California Continental Margin Geologic Map Series, Map 5-B, Sheet 2 of 4,
scale 1:250,000.
Jennings, C. W., compiler, 1991 (in preparation). State Fault Activity Map: California Division of Mines
and Geology, Geologic Data Series, Map No. 6, scale 1:750,000.
McCulloch. D. S., and Greene. H. G., 1990, Geologic map of the central California Continental Margin:
California Division of Mines and Geology, Geology of the California Continental Margin Geologic
Map Series, Map 5-A, Sheet 1 of 4, scale 1:250,000.
Oakeshott, G.B., ed., 1955, Earthquakes in Kern County California during 1952: California Division of
Mines and Geology Bulletin 171, 283 p.
Plafker, G., and Galloway, J. P., eds., 1989, Lessons learned from the Loma Prieta, California, earth-
quake of October 17, 1989: U. S. Geological Survey Circular 1045, 48 p.
ACKNOWLEDGMENTS
The editors would like to thank all of the authors for their contributions and for cooperat-
ing with our rapid publication schedule. The DMG Publications group performed admirably
throughout the preparation of this document In particular, we thank Robert Streitz, Jeff
Tambert, Ross Martin, Carol Allen, Dinah Maldonado, Joy Sullivan and Margaret Walker for
their efforts in drafting and production.
Finally, we thank all the reviewers and proofreaders. In addition to those persons listed at
the end of each paper, we thank Michael Reichle, Anthony Shakal, James Davis, Joseph
Ziony, Terry Lawler, and Alison Kenward.
VIM

SECTION I
The Earthquake

GEOLOGIC AND TECTONIC SETTING OF THE EPICENTRAL AREA
OF THE LOMA PRIETA EARTHQUAKE,
SANTA CRUZ MOUNTAINS, CENTRAL CALIFORNIA
by
David L. Wagner 1
ABSTRACT
Movement along the San Andreas fault in the southern Santa Cruz Mountains caused the Loma Prieta earthquake
of October 1 7, 1 989. The San Andreas fault bisects the Santa Cruz Mountains in a northwesterly direction and is a
boundary between two large crustal plates, the Pacific plate to the west and the North American plate to the east.
Movement of the Pacific plate relative to the North American plate has juxtaposed geologically different basement
terranes as well as sedimentary cover.
West of the San Andreas fault, continental granitic basement of the Salinian block is overlain by marine sedimentary
and volcanic formations. East of the fault the basement is a heterogenous assemblage of oceanic rocks of the
Franciscan Complex. Tertiary sedimentary and volcanic formations that overlie Franciscan basement superficially
resemble those immediately across the fault but detailed studies show that they originated far apart.
Displacement along the San Andreas fault in central California has been variable over the past 30 million years.
Changes in direction and rate of relative movement between the North American and Pacific plates are responsible
for sedimentation patterns and tectonic events in the Santa Cruz Mountains. During periods of rapid plate movementthat is oblique to the plate boundary, folding, reverse faulting, and uplift occur. When plate movement is slow, normal
faulting occurs and sedimentary basins form. For about the past 3 million years the plate movement has been
relatively rapid and there is a significant component of compression in a NE-SW direction, normal to the San Andreas
fault. As a result, reverse faulting and uplift are occurring, typified by the 1989 Loma Prieta earthquake.
INTRODUCTION
The Loma Prieta earthquake of October 17, 1989 was the latest
increment of displacement along the San Andreas fault that has been
occurring over the last 30 million years. During this span of geologic
time, distinctive rock types and geologic features have been offset
300 to 330 km along the San Andreas fault in central California
(Nilsen and Clarke, 1975; Graham and others, 1989). The rocks,
structure, and geomorphology of the Santa Cruz Mountains are a
direct consequence of movement and associated deformation along
the San Andreas fault.
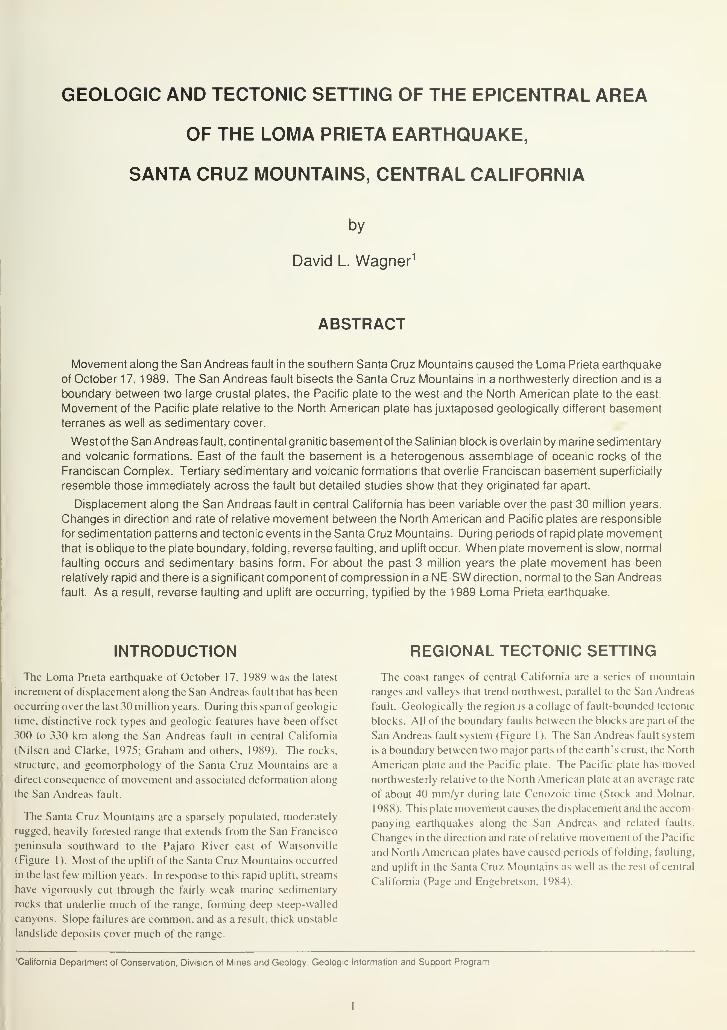
The Santa Cruz Mountains are a sparsely populated, moderately
rugged, heavily forested range that extends from the San Francisco
peninsula southward to the Pajaro River east of Watsonville
(Figure 1). Most of the uplift of the Santa Cruz Mountains occurred
in the last few million years. In response to this rapid uplift, streams
have vigorously cut through the fairly weak marine sedimentary
rocks that underlie much of the range, forming deep steep-walled
canyons. Slope failures are common, and as a result, thick unstable
landslide deposits cover much of the range.
REGIONAL TECTONIC SETTING
The coast ranges of central California are a series of mountain
ranges and valleys that trend northwest, parallel to the San Andreas
fault. Geologically the region is a collage of fault-bounded tectonic
blocks. All of the boundary faults between the blocks are part of the
San Andreas fault system (Figure 1 ). The San Andreas fault system
is a boundary between two major parts of the earth's crust, the North
American plate and the Pacific plate. The Pacific plate has moved
northwesterly relative to the North American plate at an average rate
of about 40 mm/yr during late Cenozoic time (Stock and Molnar,
1 988). This plate movement causes the displacement and the accom-
panying earthquakes along the San Andreas and related faults.
Changes in the direction and rate of relative movement of the Pacific
and North American plates have caused periods of folding, faulting,
and uplift in the Santa Cruz Mountains as well as the rest of central
California (Page and Engebretson. 1984).
'California Department of Conservation, Division of Mines and Geology. Geologic Information and Support Program

DIVISION OF MINES AND GEOLOGY SP104
Map Area
CALIFORNIA
20KmJ
Figure 1.Map of the San Francisco Bay area showing faults that make up the San Andreas fault system.

1990 THE LOMA PRIETA EARTHQUAKE OF 17 OCTOBER 1989
GEOLOGY OF THE SANTA CRUZMOUNTAINS
Movement along the San Andreas fault juxtaposes tectonic blocks
of distinctly different basement lithologies in the central California
coast ranges (Figure 2). Northeast of the fault Cenozoic sedimentary
and volcanic rocks overlie a basement of heterogenous, highly de-
formed oceanic rocks of the Mesozoic Franciscan Complex. South-
west of the fault the basement is, for the most part, continental crust
of granitic and metamorphic rocks known as the Salinian block
(Figure 2). Although the San Andreas is the boundary between Fran-
ciscan rocks and the Salinian block, in places Franciscan rocks do
occur west of the fault. The Pilarcitos block (Figure 3 ) is a sliver of
basement rocks of the Franciscan Complex west of San Andreas.
These rocks are thought to be evidence that Franciscan rocks underlie
part of the central Santa Cruz Mountains (Stanley, 1985).
Rock Units Southwest of the San Andreas Fault. The part of the
Salinian block that underlies the Santa Cruz Mountains was subdi-
vided into sunblocks by Stanley (1985) as shown on Figure 3. Twoof these subblocks, the La Honda block and the Ben Lomond block,
underlie the epicentral area of the Loma Prieta earthquake. The La
Honda block is composed of the bulk of the Tertiary formations of
the central Santa Cruz Mountains (Figures 3 and 4). These forma-
tions were deposited in the La Honda basin (Cummings and others,
1962). To the southwest, the La Honda basin was bounded by the
Ben Lomond block, a granitic highland that provided sediment to the
La Honda basin (Graham and others, 1989; NilsenandClarke, 1975).
Cretaceous granitic rock
Franciscan Complex
1
N
Figure 2. Map of California showing the distribution of contrasting basement rock types in parts of central and northern California.
Movement along the San Andreas fault has juxtaposed the Salinian block composed of Cretaceous-age granitic rock with basement
composed of rocks of the Franciscan Complex. Modified from Page (1981).

DIVISION OF MINES AND GEOLOGY SP 104
N >.

1990 THE LOMA PRIETA EARTHQUAKE OF 17 OCTOBER 1989
COz<I-zZ>o
N=>tr
o<HZ<CO
UJ
Hco<UJ
UJUJ z UJ
DWER IDDL lOCE
zUJoo
_l K 5 5 UJo1^-
cn
z Zh3 o o <zUl
_l
3<UlCI
<5trou.
<ce
<_lo
z
zo
<CE
OU.
QUJOIT
ONTEREY
FORMATION
ADERA
SANDSTONE
4GE
MILL
BASALT
55trou.
_i_i
iVUJ
to
co 5CJ Ulzco<<or enU-
< Ul ICO 5 S _i a 5
0) m(fi ira <pc t
o H(n CO
a c_
n !)
til
n ra
ac
fc
bi
)
o c5 CL
'1!
a> ra. -aCLZJ
0)
r ra
TO scj tou CTj
ra
CD aia CD
innvd svBdaNV nvs
ra~
£" 3i^ ra
2^C ra
.o 2S "oto cm <
1 ™ra W_* a>
^o *-
O o
CO
<I-zo
NZ)cro
?z<CO
<ITHZUlo
UJ UJ o
PEROCE
j or ui ui
Q U03Q CL O O
CL — _l Ul — OCL — Ul35 a co 5 1-3 5 CO
5 o
UJUl o
ry ^Z Z^ -JUjUJUJ Q^35 QOO--LUJI-55to
zo UJ
5zot-co
tr Qo zU. <>- CO
UJtr oiii oi- 0.zo 5
o
Ul
UJ ££z tr 5ujUl Ul (j 3o 5 o oo oo - UJ111 I- J 5f)
O CO
_1< CO
nCO z< <CO CO
o UlC3 1-Ul ZO <s V
<:> INJ
UJ <Z UJ
I- <Q UJ
z 9< CO(/) Q
o|tr >UJ UJ
< '-
>
z !=o z
< z oto 3 tr
to _l ujOUl jcr tr jzUJ 3 CO3 < <OJO< I I
> , I
I 5
§££22£o <" <->
z§££s °
o <" °9 uj _i-1 O CO
z tr;< >
CO I ,
ui uj
co ct
g <Z CD< OCOg.
Z UlUJ oo zO UJUl 3-I O< UlCL CO
Hg5o,
z, o ° °ujyz -i
5CQ^C0CO Q 3 5< Z QCOgl-Z5Z0— —
' UJ <Z^C0_lz<-I Ul CO H<co o
trUJz co cr
UJ
EREY
SHALE
(OR
EREY
FORMATION
CO
SANDSTONE
BASALT
S
SANDSTONE
SANDSTONE
ATIO MEMEMBE z
COf-
z<mo"3
FOR
MAT
10
RUZ
MUDST
ARGARITA
ONE
Ul_i<1to
ENZO
FORM
MUDSTONE
R
SHALE
M Ulz
coQZ<co
<cr
u.
1j
zUl
Ul
r- cr 5 s h5 co1- O g uj ^ to S O _i <
CT) CO~ a
tr 0: h- UJ 8 Ul CO.7; < < aJ2 1- 1- z £z E
o s
UJCD
Ul ui 23 <-J og z
< <~z tr z z < z ? z tr 1- O <CO < 3 < < to - < < < 1 ,3 O
CO 0. to CO 5 _i _J 5 > Nl CO . , CO 3 z< *CO <
_l
<_l to
UlUJUl z<->Z UlZ
ce ui oUJ
UlUlO
Ul z z_l UJ UJQUO
UJUl (J
UJ r, ^ Zz tr ui ui
Z UJ
ui zO UJ
UJ o 3 UJ uj u ^ UJ 30- -0 QOO o^Soo _l Oa. — -iui — — UJ 00 - UJ < Ul3 5 1- 0- co SStn ui 1 1 5 to 0. to
O) o3 -°
s§CD 0)
m &o E>• CD
"§•?ro o
§5ra c
«8JC id
^ §M> ra
£ E*- oto"-<X) oo c— ra
>, 3
C CD
ra ^=
. ra
w £l"Sc -o
ra en
c CCO gCD = ~-c= 2 cr cd s
1113 » O
"raffO CD „_
g> c S
i«i•<* ^ oCD ° §
If £

DIVISION OF MINES AND GEOLOGY SP104
Stanley (1985) modified the Tertiary formations described by
previous authors (Cummings and others, 1962; Brabb, 1970; Clark,
1981) into five "depositional sequences" (Figures 3 and 4): (1) a
Paleocene sequence, (2) an Eocene to lower Miocene sequence, (3)
a lower to middle Miocene sequence, (4) a middle to upper Miocene
sequence, and (5) an upper Miocene to Pliocene sequence. Bounda-
ries between each of the five sequences are unconformities.
The Paleocene sequence consists of the Locatelli Formation.
Patches of sandstone, mudstone, and conglomerate of the Locatelli
Formation rest unconformably on granitic basement of the Ben
Lomond block. The Locatelli Formation has not been positively
identified on the La Honda block.
The Eocene to lower Miocene sequence consists of the Butano
Sandstone, the San Lorenzo Formation, the Vaqueros Sandstone, the
Zayante Sandstone, the Mindego Basalt, and the Lambert Shale.
These units account for the bulk of the sedimentary fill of the La
Honda basin.
The Eocene Butano Sandstone is the oldest formation of the
Eocene to lower Miocene sequence. It overlies the granitic Ben
Lomond block but its base has not been observed on the La Honda
block. The Butano Sandstone is correlated with the Point of Rocks
Sandstone of the Temblor Range (Clarke and Nilsen, 1973), 300 to
330 km to the southeast across the San Andreas fault. This indicates
that the La Honda basin was continuous with the San Joaquin basin
prior to the existence of the modern San Andreas fault (Stanley,
1985; Graham and others, 1989).
The San Lorenzo Formation, the Vaqueros Sandstone, and the
Zayante Sandstone overlie the Butano Sandstone and are widespread
on the La Honda block. These units are stratigraphically complex
and are described in detail by Stanley (1985).
The Mindego Basalt was erupted into the La Honda basin from
about 20 to 25 Ma (Stanley, 1985). Flows, tuffs, breccia, pillow
lavas, and intrusive rocks were erupted from submarine vents, proba-
bly near the center of the La Honda basin. Overlying the Mindego
Basalt is the Lambert Shale, a unit that is widespread on the La Honda
block but not known on the Ben Lomond block.
The middle Miocene sequence of the Santa Cruz Mountains is
represented by the Lompico Sandstone and the Monterey Formation.
The Monterey Formation consists of siliceous and calcareous shale,
mudstone, and sandstone. Patches of Monterey Formation are
present throughout the Santa Cruz Mountains suggesting it was once
much more extensive than it is today (Stanley, 1985).
An angular unconformity separates the lower Miocene sequence
from the upper Miocene sequence. The upper Miocene sequence
consists of the Santa Margarita Sandstone and the Santa Cruz
Mudstone. The thickest part of the lower Santa Margarita Sandstone
apparently was deposited in an 8- to 10-km-wide seaway that con-
nected the San Joaquin basin to the Pacific Ocean (Phillips, 1983).
Large cross beds in the sandstone were formed by strong tidal
currents in the northeast-trending seaway that, eventually, was trun-
cated by displacement along the San Andreas fault. The overlying
Santa Cruz Mudstone was deposited in deepening water caused by
marine transgression (Phillips, 1983).
The upper Miocene to upper Pliocene Purisima Formation is the
youngest and most widespread Tertiary formation in the Santa Cruz
Mountains. The Purisima is present throughout the Santa Cruz
Mountains and is widespread offshore (Greene, 1977). Quaternary
deposits including the Aromas Sand, marine and fluvial terrace
deposits, and alluvium overlie the Purisima Formation.
Rock Units Northeast of the San Andreas Fault. Northeast of the
San Andreas fault is the San Francisco Bay block (Figure 3). Hetero-
genous sedimentary, igneous, and metamorphic rocks of the Francis-
can Complex form the basement of the San Francisco Bay block.
Tertiary and Quaternary sedimentary rocks overlie the Franciscan
basement.
Rocks of the Franciscan Complex include graywacke, shale, al-
tered basaltic rock (greenstone), chert, limestone, conglomerate, and
metamorphic rocks which are Late Jurassic through Late Cretaceous
in age. Associated with the Franciscan Complex, is green to black
serpentine, which has been incorporated into the Franciscan by com-
plicated tectonic processes. Franciscan rocks have diverse geologic
and geographic origins; they came together when the Farallon plate
was subducted (underthrust) beneath the North American plate
(Figure 6).
The Tertiary formations that overlie the Franciscan are superfi-
cially similar to those of the La Honda basin west of the San Andreas
fault so the same stratigraphic nomenclature is common to both areas
(Dibblee, 1966). However, Beaulieu( 1970) compared the stratigra-
phic units on either side of the San Andreas and found significant
differences in age and environment of deposition and renamed some
of the formations (Figures 3 and 4). He concluded that the formations
were deposited at sites far apart and were subsequently juxtaposed
by movement along the San Andreas fault.
Landslides. Landslides are a common geologic feature of the
Santa Cruz Mountains on both sides of the San Andreas fault. The
mountain range has been uplifted rapidly over the last two to three
million years, and as a result, the slopes are steep and prone to
landsliding. Some coalescing landslides may cover entire slopes that
are many square kilometers in extent (see Spittler and others, this
volume).
FAULTING AND FOLDING IN THE SANTACRUZ MOUNTAINS
Faults and folds in the Santa Cruz Mountains (Figure 5 and Brabb,
1989) are the result of wrench tectonics caused by interaction of the
North American plate with the Pacific plate and the now subducted
Farallon plate (Figure 6). Consequently most of the faults and folds
trend northwest, parallel to the plate boundary.
San Andreas and Related Faults. Large-scale lateral displacement
along the San Andreas fault was first recognized by Hill and Dibblee
( 1 953) who documented 500 to 600 km of right-lateral displacement
since the Late Cretaceous. They also presented data that suggested
that displacement decreased with decreasing age of the offset geo-
logic features. Thus, Hill and Dibblee treated the San Andreas as a
continuous fault zone along which movement occurred at a consis-
tent rate. Subsequent studies (Crowell, 1962, Nilsen and Clarke,
1 975; Dickinson and Snyder, 1 979) have shown that the San Andreas
is a complex system of related faults. Evidence for episodic, not con-
tinuous, activity along the San Andreas fault is abundant (Sims,
19X9).

1990 THE LOMA PRIETA EARTHQUAKE OF 17 OCTOBER 1989
zi — o
<III
" CO <_- —* —2 =
CO
m <S Q
mNz<-i < Q< zo: eo ouj q xz _jUJ o <OIL J
S o
raCDT3 c<d ro
0) co*2 co
8 Jo y~ co co
co ra
2?. o
~<
— <-1 "3
m<l>
<i> <)iv
CO
CO
r Ira Craoo ro
ICD <
00 a> c2? I w
co o <S
o « >~ C5 ?PAffl© co os a >TD - >O H •
c c a>
0) TOCD
C<
Z>
OTO
>
ra TD c</) <)
CD En
co-L co
i >a CO
CD
5
CDm<r
c
CD TO
3 TO <-ra CO Jo 2>C0m
u v aTO CO cb SICI)
Nra
E oO NC CC
CD ra n(') O -J
in 2toCD => CO
CD •
• COUj < _lLL CD CO

DIVISION OF MINES AND GEOLOGY SP104
Atwater (1970) first applied plate tectonic theory to the San
Andreas fault. She showed that San Andreas is a boundary between
plates of the earth's crust and that movement along the fault system
is a result of interaction between the plates. The plate tectonic model
was later refined (Carlson, 1982) to show three stages of the San
Andreas fault system since Late Cretaceous time (Figure 6). The first
stage, prior to 42 Ma, was the subduction of the Farallon plate
beneath the North American plate. Oblique convergence in this stage
resulted in right- lateral displacement along an ancestral San Andreas
fault. During this stage, the parts of the Salinian block that would
eventually be the basement of the Ben Lomond and La Honda blocks
were juxtaposed in what is now the Santa Cruz Mountains. During
the second stage, 42 to 30 Ma, convergence between the Farallon
plate and the North American plate was normal to the plate boundary
so there was no right-lateral displacement between the two plates. By
30 Ma, the Farallon plate was entirely consumed by subduction,
marking the birth of the San Andreas transform system (Atwater,
1970), and resumption of right-lateral displacement along the San
Andreas fault in central California. Sims (1989) has provided
evidence that the rate of move-nent along the San Andreas fault has
varied. During the past five million years, the rate of slip along the
San Andreas fault has averaged about 33 mm/yr
according to Sims, greater than any time since
its inception 30 million years ago.
At present, the Pacific plate continues to move
rapidly past the North American plate at a rate
of 48 mm/yr (DeMets and others, 1987). How-
ever, in the Santa Cruz Mountains, the San
Andreas fault accounts for about 13 mm/yr of
this movement (Minster and Jordan, 1987).
Additional movement is accommodated by other
faults in the San Andreas system, notably the
San Gregorio - Hosgri as well as some deforma-
tion east of the Coast Ranges. Graham and
Dickinson ( 1 978 ) showed that geologic features
have been offset 1 1 5 km along the San Gregorio
- Hosgri fault since the Miocene. According to
Minster and Jordan ( 1 987), there is a significant
component of compression, about 9 mm/yr, in a
northeast-southwest direction across the San
Andreas fault. This is consistent with the sub-
surface movement during the Loma Prieta earth-
quake. Movement was in a reverse oblique
sense, along a fault plane that dips 70° to the
southwest (Plafker and Galloway, 1989). Right-
lateral displacement was calculated to be 1 .6 ±
0.3 m (5.3 ft), reverse slip was 1 .2 ± 0.3 m (3.9
ft), and Santa Cruz Mountains were uplifted
about 36 cm ( 14 in) according to Lisowski and
others ( 1 990) and Plafker and Galloway ( 1 989,
p. 6).
Other Faults in the Santa Cruz Mountains.
Between the San Andreas and the San Gregorio-
Hosgri fault zones there are several predomi-
nantly dip-slip faults (Figure 5). These are the
Zayante-Vergeles, Ben Lomond, Butano, La
Honda, and Pilarcitos faults. East of the San
Andreas fault is the Sargent- Berrocal fault
zone.
The Zayante-Vergeles fault may have developed about the same
time as the San Andreas and profoundly affected the sedimentary
history ofthe Santa Cruz Mountains (Clark and Rietman, 1973). This
fault is considered to be a normal fault by Clark and Rietman ( 1 973),
but it could be a strike-slip fault (Stanley, 1985). Fault-related
features and the occurrence of small earthquakes may suggest that
Zayante-Vergeles fault is an active branch of the modern San
Andreas system (Coppersmith, 1979). The epicenter of the LomaPrieta earthquake coincides with the mapped surface trace of the
Zayante-Vergeles fault, but the mainshock and the aftershock se-
quence do not coincide (Plafker and Galloway, 1989, p. 7).
The Ben Lomond, Butano, La Honda, and Pilarcitos faults are
poorly exposed and little is known about them. The Ben Lomondfault is a curved fault and may have been active into Pleistocene time
(Stanley and McCaffrey 1983). Little is known about the Butano and
La Honda faults. The Pilarcitos fault could be an inactive abandoned
trace of the San Andreas.
East of the San Andreas fault, faulting is dominated by reverse
faults of the Sargent-Berrocal fault zone (McLaughlin, 1974). The
Sargent fault is a reverse fault that dips steeply to the west (McLaugh-
, NORTH\ AMERICA
30 m.y. ago
» N. \ modern
\^\^ San Andreas\ / fault
to present:
RIGHT-SLIPPACIFIC
PLATE
^ NORTH\ AMERICA
FARALLON
^ inactive^« \ < fault
\ \
42 to 30 m.y. ago:
NORMALPLATE >• subduction
\» \ J^ zone CONVERGENCE
\ \
prior to
42 m.y. ago:
OBLIQUECONVERGENCE
FARALLONPLATE
\v NORTH
\\\ AMERICA
N^ >v proto-San
^^ \^ C Andreas fault
'VI >v \ subduction
/ \__ \.3 zone
Figure 6. Schematic illustration of the three-stage history of plate interactions in the development of the
San Andreas fault, modified from Carlson (1982) by Stanley (1985).

1990 THE LOMA PRIETA EARTHQUAKE OF 17 OCTOBER 1989
lin, 1974; McLaughlin and others, 1989). The Sargent fault is
seismically active (McLaughlin, 1974) and shows evidence of sur-
face movement during Holocene time (Bryant and others, 198 1 ), but
its relationship to the San Andreas fault is unknown. To the north is
the Berrocal fault zone, a complex thrust fault that dips 5°-75° to the
southwest beneath the Santa Cruz Mountains and is vertical in some
places (McLaughlin, 1 974). Franciscan rocks may be thrust as much
as 2.3 km eastward overCenozoic rocks along the Berrocal fault zone
(McLaughlin, 1974).
Folds in the Santa Cruz Mountains. Northwest trending folding is
a conspicuous feature of the Santa Cruz Mountains, particularly on
the La Honda block (Figure 5). Folds on the La Honda block are
isoclinal and overturned in contrast to the broad folds on the Ben
Lomond block. Stanley ( 1 985 ) attributes this to the proximity of the
La Honda block to the San Andreas and the rigid granitic rock of the
Salinian basement.
During Cenozoic time, episodes of folding and uplift have alter-
nated with episodes of subsidence, basin formation, and marine
transgression in Santa Cruz Mountains. These episodes have been
related to changes in rates and direction of plate movement (Page and
Engebretson, 1984). During periods of rapid plate movement that is
oblique to the plate boundary, folding, reverse faulting, and uplift
occur. During periods of slow plate movement, rifting causes sedi-
mentary basins to form, and marine transgression occurs.
ACKNOWLEDGMENTSEarly versions of this paper were reviewed by John D. Sims. Charles W. Jennings,
George J. Saucedo, and Robert H. Sydnor. Their comments are greatly appreciated. The
figures were prepared by Dinah Maldonado, and Heidi Kruger typed the manuscript.

10 DIVISION OF MINES AND GEOLOGY SP104
REFERENCES
Atwater, T., 1970, Implication of plate tectonics for the evolution of western
North America: Geological Society of America Bulletin, v. 81, p. 3513-
3536.
Beaulieu, J.D., 1970, Cenozoic stratigraphy of the Santa Cruz Mountains
(Ph.D. thesis): Stanford University, 202 p.
Brabb, E.E., 1970, Preliminary geologic map of the central Santa Cruz
Mountains, California: U.S. Geological Survey Open-File Map, scale
1:62,500.
Brabb, E.E., 1989. Geologic map of Santa Cruz County, California: U.S.
Geological Survey Miscellaneous Investigations Series Map 1-1905, scale
1:62,500.
Bryant, W.A., Smith, D.P.. and Hart, E.W., 1981, The Sargent, San Andreas,
and Calaveras fault zones: evidence for recency in Watsonville East,
Chittenden, and San Felipe quadrangles, Monterey, San Benito, Santa
Clara, and Santa Cruz counties, California: California Division of Mines
and Geology Open-File Report 81 -7.
Carlson, R.L., 1982, Cenozoic convergence along the California coast: a
qualitative test of the hot-spot approximation: Geology, v. 10, p. 191-196.
Clark, J.C., 1981, Stratigraphy, paleontology, and geology of the central Santa
Cruz Mountains, California Coast Ranges: U.S. Geological Survey
Professional Paper 1 168, 51 p.
Clark, J. C, and Brabb, E. E., 1978, Stratigraphic contrasts across the San
Gregorio fault, Santa Cruz Mountains, west central California, in Silver, E.
A., and Normark, W. R., eds., San Gregorio-Hosgri fault zone, California:
California Division of Mines and Geology Special Report 137, p. 3-12.
Clark, J.C., and Rietman, J.D., 1973, Oligocene stratigraphy tectonics, and
paleogeography southwest of the San Andreas fault, Santa Cruz
Mountains and Gabilan Range, California Coast Ranges: U.S. Geological
Survey Professional Paper 783, 18 p.
Clarke, S.H., Jr., and Nilsen, T.H., 1973, Displacement of Eocene strata and
implications for the history of offset along the San Andreas fault, central
and northern California, in Kovach, R.L., and Nur, A., eds., Proceedings of
the conference on the tectonic problems of the San Andreas fault system:
Stanford University Publications in Geological Sciences, v. 3, p. 368-367.
Coppersmith, K.J., 1979. Activity assessment of the Zayante-Vergeles fault,
central San Andreas fault system, California (Ph.D. thesis): University of
California, Santa Cruz, 333 p.
Crowell, J.C., 1962, Displacement along the San Andreas fault, California:
Geological Society of America Special Paper 71 , 61 p.
Cummings, J.C.. Touring, R.M., Brabb. E.E., 1962, Geology of the northern
Santa Cruz Mountains, California, in Bowen, O.E., Jr., ed.. Geologic guide
to the oil and gas fields of northern California: California Division of Mines
and Geology Bulletin 181, p. 179-220.
DeMets, C, Gordon, R.G., Stein, S., and Argus, D.F., 1987, A revised
estimate of Pacific-North American motion and implications for western
North America plate boundary zone tectonics: Geophysical Research
Letters, v. 14, p. 911-921.
Dibblee, T.W., Jr., 1 966, Geologic map and sections of the Palo Alto 1 5-
minute quadrangle, Santa Clara and San Mateo counties, California:
California Division of Mines and Geology Map Sheet 8, scale 1 :62,500.
Dickinson, W.R., and Snyder, W.S., 1979, Geometry of triple junctions related
to San Andreas transform: Journal of Geophysical Research, v. 84, p
561-571.
Graham, S.A. and Dickinson, W.R., 1978, Apparent offsets of on-land
geologic features across the San Gregorio-Hosgri fault trend: California
Division of Mines and Geology Special Report 137, p. 13-23.
Graham, S.A., Stanley, R.G., Bent, J.V., and Carter, J.B., 1989, Oligocene
and Miocene paleogeography of central California and displacement along
the San Andreas fault: Geological Society of America, v. 1 01 , p. 71 1 -730.
Greene, H.G., 1977, Geology of the Monterey Bay region: U.S. Geological
Survey Open-File Report, 77-718, 314 p.
Hill, M.L., and Dibblee, T.W., Jr., 1953, San Andreas, Garlock, and Big Pine
faults, California — a study of the character, history, and tectonic
significance of their displacements: Geological Society of America
Bulletin, v. 64, p. 443-458.
Lisowski, M., Prescott, W.H., Savage, J.C., and Svarc, J.L., 1990, A possible
geodetic anomaly observed prior to the Loma Prieta, California, earth-
quake: Geophysical Research Letters, v. 1 7, p. 1211 -1 21 4.
McLaughlin, R.J., 1974, The Sargent-Berrocal fault zone and its relation to the
San Andreas fault system in the southern San Francisco Bay region and
Santa Clara Valley, California: U.S. Geological Survey Journal of
Research, v. 2, p. 593-598.
McLaughlin, R.J., Clark, J.C., and Brabb, E.E., 1989, Geologic map and
structure sections of the Loma Prieta 7.5-minute quadrangle, Santa Clara
and Santa Cruz Counties, California: U.S. Geological Survey Open-File
Report 88-752, scale 1 :24,000.
Minster, J.B., and Jordan, T.H., 1987, Vector constraints on western U.S.
deformation from space geodesy, neotectonics, and plate motions:
Journal of Geophysical Research, v. 92, p. 4298-4304.
Nilsen, T.H., and Clarke, S.H., Jr., 1975, Sedimentation and tectonics in the
early Tertiary continental borderland of central California: U.S. Geological
Survey Professional Paper 925, 64 p.
Page, B.M., 1981, The Southern Coast Ranges, in Ernst, W.G., ed., The
geotectonic development of California, Rubey Volume I: Prentice-Hall,
Englewood Cliffs, New Jersey, p. 329-417.
Page, B.M., and Engebretson, DC, 1984, Correlation between the geologic
record and computed plate motions for central California: Tectonics, v. 3,
p. 133-156.
Phillips, R.L., 1983, Late Miocene tidal shelf sedimentation, Santa Cruz
Mountains, California, in Larue, D.K., and Steele, R.J., eds., Cenozoic
marine sedimentation Pacific Margin, U.S.A.: Society of Economic
Paleontologists and Mineralogists, Pacific Section, p. 45-61.
Plafker, G. and Galloway, J. P., eds., 1989, Lessons learned from the Loma
Prieta, California, Earthquake of October 17, 1989: U.S. Geological
Survey Circular 1045, 48 p.
Sims, J.D., 1989, Chronology of displacement on the San Andreas fault in
central California: Evidence from reversed positions of exotic rock bodies
near Parkfield, California: U.S. Geological Survey Open-File Report 89-
571, 43 p.
Spittler, T. E., Harp, E. L, Keefer, D. K„ Wilson, R. C, and Sydnor, R. H.,
1990, Landslide features and other coseismic fissures triggered by the
Loma Prieta earthquake, central Santa Cruz Mountains, California: this
volume, p. 59-66.
Stanley, R.G., and McCaffrey, R., 1983, Extent and offset history of the Ben
Lomond fault, Santa Cruz County, California, in Anderson, D.W., and
Rymer, M.J., eds., Tectonics and sedimentation along faults of the San
Andreas system: Society of Economic Paleontologists and Mineralogists,
Pacific Section, p. 79-90.
Stanley, R.G., 1985, Middle Tertiary sedimentation and tectonics of the La
Honda basin, central California: U.S. Geological Survey Open-File Report
85-596, 271 p.
Stock, J.M., and Molnar, P., 1988, Uncertainties and implications of the late
Cretaceous and Tertiary position of North America relative to the Farallon,
Kula, and Pacific plates: Tectonics, v. 7, p. 1339-1384.

SEISMOLOGICAL ASPECTS OF THE 17 OCTOBER 1989 EARTHQUAKE
by
Stephen R. McNutt 1 and Tousson R. Toppozada 1
INTRODUCTION
On Tuesday. 17 October 1989, at 5:04:15.21 p.m. PDT, a magni-
tude 7.1 earthquake occurred on the San Andreas fault 16 kmnortheast of Santa Cruz (Figure 1). This was one of the largest
earthquakes to occur in California since 1906. The event was respon-
sible for 63 deaths and at least $5.9 billion of damage, making it the
biggest dollar-loss natural disaster in United States history.
Just after the earthquake occurred, there was an extremely high
demand for information about this earthquake and about earthquakes
in the Bay area, in general. Since this was the first M>7 earthquake
to occur within California in 38 years, there was also a demand for
information about whether this earthquake was typical of what to
expect in future events of the same size. With this in mind, the
purposes of this article are: ( 1 ) to describe the seismological features
of the earthquake; (2) to review the earthquake history of the Bay
area; (3) to compare this earthquake with a similar 1 865 event in the
same area; and (4) to compare the event with earthquakes of similar
size in other areas. This article has been prepared mainly as a
summary paper, but we have gone into greater detail on several
topics, so the article is also a source of information for the emergency
response community, the media, and other researchers interested in
hazards assessment. We have attempted to compile and summarize
the best available information at the time of writing ( 1 5 March 1 990),
but anticipate that further research may refine or modify some of the
conclusions presented here.
EARTHQUAKE HISTORY
Moderate and Large Earthquakes Statewide
Earthquakes of magnitude near that of the Loma Prieta event occur
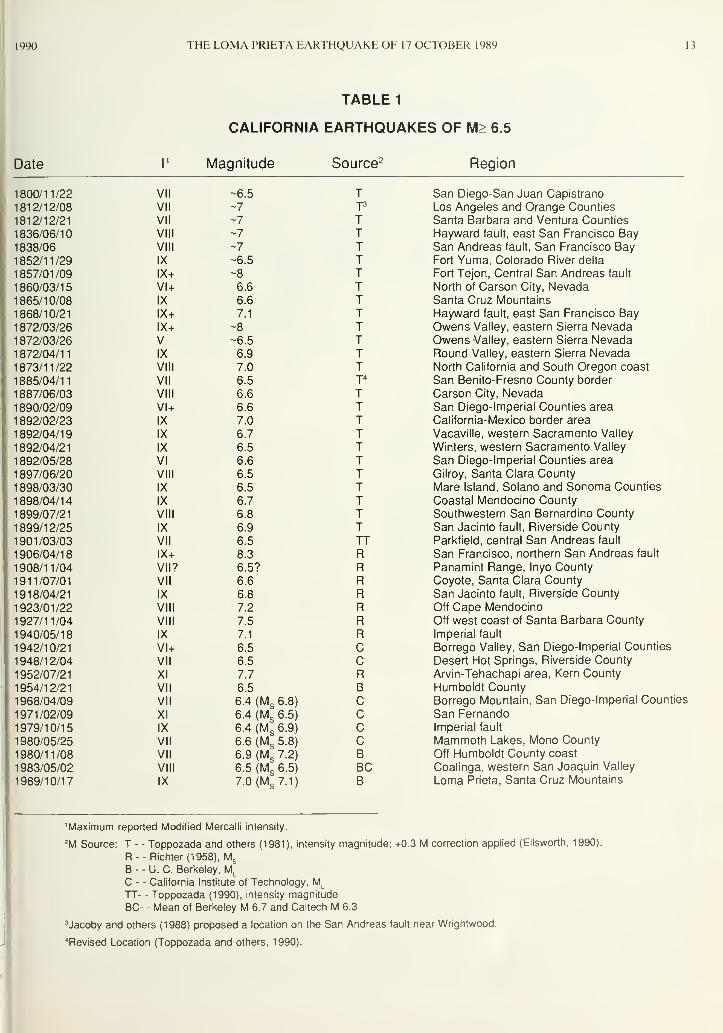
infrequently in California. Table 1 lists the 45 known events with
M>6.5 in California and within 50 km of its borders. The areas
damaged by these earthquakes were outlined by Toppozada and
others (1986). The occurrence of 45 events in 190 years suggests a
statewide recurrence period of about 4 years, but the occurrence rate
varies greatly with time and location. For example, the rate was high
from 1892 through 1906 when 10 events occurred in 15 years (1.5
year recurrence). The record is probably incomplete before 1850
(Table 1).
Smaller earthquakes in urban areas can cause significant damage.
A recent example is the 1 987 Whittier Narrows earthquake ofML5.9
that occurred east of Los Angeles, causing S358 million damage
(FEMA, 1987). The statewide rate of occurrence ofdamaging events
(M> 5.5) is about eight times that of the M> 6.5 events, or on average
about two events per year. As another example, an M 5.5 earthquake
occurred on 28 February 1990 near Upland, 30 miles east of Los
Angeles and caused at least $20 million damage (San Francisco
Chronicle, 1990). The Earthquake Epicenter Map of California
(Real and others, 1978) lists 452 events of M> 5 over a 75-year
period, or an average of six events per year of M> 5.
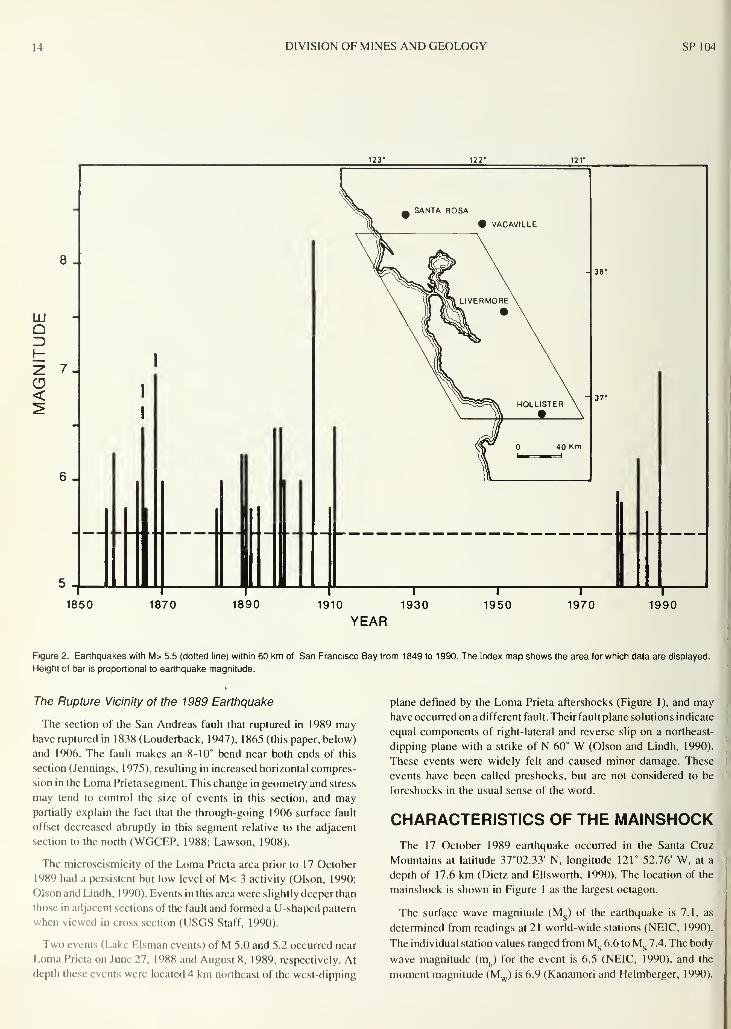
Earthquakes of M> 5.5 within 60 km of San Francisco Bay
Thirty M> 5.5 events have occurred within 60 km of San Francisco
Bay since 1850 (Figure 2). Before that time the record of M> 5.5
events is incomplete. However, two earthquakes ofM~ 7 are known
to have occurred in 1 836 and 1 838 on the Hayward and San Andreas
faults, respectively. Before 1942, when U.C. Berkeley started deter-
mining magnitudes instrumentally, magnitudes were generally esti-
mated from the size of the areas shaken at various levels of intensity
(e.g., Toppozada, 1975).
Figure 2 shows that the occurrence rate in the Bay area was high
until 1906, with 23 events occurring in 51 years. Since the largest
known (M$8.3) Bay area event in 1906, only seven events with M>
5.5 have occurred. This suggests a period of stress buildup mani-
fested by the high seismicity that culminated with the 1906 earth-
quake, and a period of recovery following this massive release of
stress. Ellsworth and others (1981) proposed such an earthquake
cycle that is controlled by the great 1906 event. The period of low
seismicity and stress recovery may have ended in 1979. with the
occurrence of five events of M> 5.5 from 1979 to 1989. This decade
marks the end of a 68-year period (191 1-1979) devoid of M> 5.5
activity that suggests a return to the higher pre- 1 906 seismicity. The
historical record is less than one cycle long, however, so thai this
inference is not certain.
Smaller earthquakes (M< 5.5) have also occurred in the Bay area,
but they are not shown in Figure 2 because their record is not
complete before 1900 and because they represent only a minor part
of the seismic energy released. One of these smaller earthquakes in
1957 caused more than $1 million damage in San Francisco (Oake-
shott, 1 959). Tocher ( 1 959) and Jaume and Sykes ( 1 990) noted that
the occurrence of M> 5.0 earthquakes in the Bay area increased after
1955.
The increased seismicity in recent years, including the Ms
7.1
event of 1989. should not be viewed as a "safetj valve" against the
occurrence of further destructive earthquakes. In the past. M 6.5 to
'California Department of Conservation, Division of Mines and Geology, Geologic Hazards Assessment Program
11
12 DIVISION OF MINES AND GEOLOGY SP 104
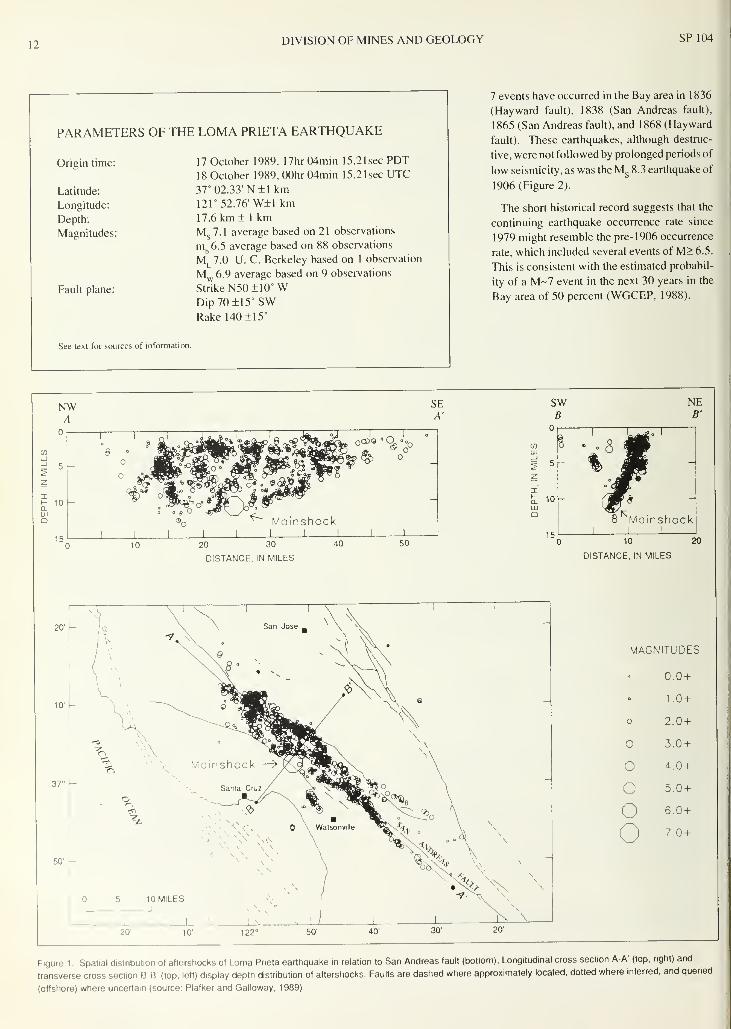
PARAMETERS OF THE LOMA PRIETA EARTHQUAKE
Origin time:
Latitude:
Longitude:
Depth:
Magnitudes:
Fault plane:
17 October 1989, 17hr04min 15.21sec PDT18 October 1989, 00hr04min 15.21sec UTC37° 02.33' Nil km121° 52.76' Wil km17.6 km i 1 kmM
s7.1 average based on 21 observations
mb6.5 average based on 88 observations
ML7.0 U. C. Berkeley based on 1 observation
Mw 6.9 average based on 9 observations
Strike N50ilO°WDip70il5°SWRake 140 i 15°
See text for sources of information.
7 events have occurred in the Bay area in 1836
(Hayward fault), 1838 (San Andreas fault),
1865 (San Andreas fault), and 1868 (Hayward
fault). These earthquakes, although destruc-
tive, were not followed by prolonged periods of
low seismicity, as was the Ms8.3 earthquake of
1906 (Figure 2).
The short historical record suggests that the
continuing earthquake occurrence rate since
1979 might resemble the pre- 1906 occurrence
rate, which included several events of M> 6.5.
This is consistent with the estimated probabil-
ity of a M~7 event in the next 30 years in the
Bay area of 50 percent (WGCEP, 1988).
NWA
SEA'
5 -
10
15
O>Q°O^o
10 20 30
DISTANCE, IN MILES
50
DISTANCE, IN MILES
MAGNITUDES
• 0.0 +
• 1.0 +
2.0 +
O 3.0 +
o 4.0 +
o 5.0 +
o 6.0 +
o 7.0 +
Figure 1 . Spatial distribution of aftershocks of Loma Prieta earthquake in relation to San Andreas fault (bottom). Longitudinal cross section A-A' (top. right) and
transverse cross section B-B' (top, left) display depth distribution of aftershocks. Faults are dashed where approximately located, dotted where inferred, and queried
(offshore) where uncertain (source: Plafker and Galloway, 1989).
1990 THE LOMA PRIETA EARTHQUAKE OE 17 OCTOBER 1989 13
TABLE 1
CALIFORNIA EARTHQUAKES OF M> 6.5
Date Magnitude Source 2 Region
1800/11/22 VII -6.5 T1812/12/08 VII -7 T3
1812/12/21 VII -7 T1836/06/10 VIII ~7 T1838/06 VIII ~7 T1852/11/29 IX -6.5 T1857/01/09 IX+ -8 T1860/03/15 VI+ 6.6 T1865/10/08 IX 6.6 T1868/10/21 IX+ 7.1 T1872/03/26 IX+ ~8 T1872/03/26 V -6.5 T1 872/04/1
1
IX 6.9 T1873/11/22 VIII 7.0 T1885/04/11 VII 6.5 T4
1887/06/03 VIII 6.6 T1890/02/09 VI+ 6.6 T1 892/02/23 IX 7.0 T1892/04/19 IX 6.7 T1892/04/21 IX 6.5 T1892/05/28 VI 6.6 T1897/06/20 VIII 6.5 T1898/03/30 IX 6.5 T1898/04/14 IX 6.7 T1899/07/21 VIII 6.8 T1899/12/25 IX 6.9 T1901/03/03 VII 6.5 TT1906/04/18 IX+ 8.3 R1908/11/04 VII? 6.5? R1911/07/01 VII 6.6 R1918/04/21 IX 6.8 R1923/01/22 VIII 7.2 R1927/11/04 VIII 7.5 R1940/05/18 IX 7.1 R1942/10/21 VI+ 6.5 C1948/12/04 VII 6.5 C1952/07/21 XI 7.7 R1954/12/21 VII 6.5 B1968/04/09 VII 6.4 (M
s 6.8) C1971/02/09 XI 6.4 (M
s 6.5) C1 979/1 0/1
5
IX 6.4 (Ms6.9) C
1980/05/25 VII 6.6 (Ms5.8) C
1980/11/08 VII 6.9 (Ms7.2) B
1983/05/02 VIII 6.5 (Ms 6.5) BC
1989/10/17 IX 7.0 (Ms7.1) B
San Diego-San Juan Capistrano
Los Angeles and Orange Counties
Santa Barbara and Ventura Counties
Hayward fault, east San Francisco BaySan Andreas fault, San Francisco BayFort Yuma, Colorado River delta
Fort Tejon, Central San Andreas fault
North of Carson City, NevadaSanta Cruz MountainsHayward fault, east San Francisco BayOwens Valley, eastern Sierra NevadaOwens Valley, eastern Sierra NevadaRound Valley, eastern Sierra NevadaNorth California and South Oregon coast
San Benito-Fresno County border
Carson City, NevadaSan Diego-Imperial Counties area
California-Mexico border area
Vacaville, western Sacramento Valley
Winters, western Sacramento Valley
San Diego-Imperial Counties area
Gilroy, Santa Clara County
Mare Island, Solano and Sonoma Counties
Coastal Mendocino CountySouthwestern San Bernardino County
San Jacinto fault, Riverside County
Parkfield, central San Andreas fault
San Francisco, northern San Andreas fault
Panamint Range, Inyo County
Coyote, Santa Clara County
San Jacinto fault, Riverside County
Off Cape MendocinoOff west coast of Santa Barbara County
Imperial fault
Borrego Valley, San Diego-Imperial Counties
Desert Hot Springs, Riverside County
Arvin-Tehachapi area, Kern County
Humboldt CountyBorrego Mountain, San Diego-Imperial Counties
San FernandoImperial fault
Mammoth Lakes, Mono County
Off Humboldt County coast
Coalinga, western San Joaquin Valley
Loma Prieta, Santa Cruz Mountains
'Maximum reported Modified Mercalli intensity.
2M Source: T - - Toppozada and others (1981), intensity magnitude; +0.3 M correction applied (Ellsworth. 1990).
R-- Richter(1958), Ms
B - - U. C. Berkeley, ML
C - - California Institute of Technology, ML
TT- - Toppozada (1990), intensity magnitude
BC- - Mean of Berkeley M 6.7 and Caltech M 6.3
3Jacoby and others (1988) proposed a location on the San Andreas fault near Wrightwood.
"Revised Location (Toppozada and others, 1990).
14 DIVISION OF MINES AND GEOLOGY SP 104
123* 122°
8 .
LUQ=)
O<
6 .
1
—
1910 1930
YEAR
—1—1950
~~1
—
1970 19901850 1870 1890
Figure 2. Earthquakes with M> 5.5 (dotted line) within 60 km of San Francisco Bay from 1849 to 1990. The index map shows the area for which data are displayed.
Height of bar is proportional to earthquake magnitude.
The Rupture Vicinity of the 1989 Earthquake
The section of the San Andreas fault that ruptured in 1989 mayhave ruptured in 1838 (Louderback, 1947), 1865 (this paper, below)
and 1906. The fault makes an 8-10° bend near both ends of this
section (Jennings, 1975), resulting in increased horizontal compres-
sion in the Loma Prieta segment. This change in geometry and stress
may tend to control the size of events in this section, and maypartially explain the fact that the through-going 1906 surface fault
offset decreased abruptly in this segment relative to the adjacent
section to the north (WGCEP, 1988; Lawson, 1908).
The microseismicity of the Loma Prieta area prior to 17 October
1989 had a persistent but low level of M< 3 activity (Olson, 1990;
Olson and Lindh, 1 990). Events in this area were slightly deeper than
those in adjacent sections of the fault and formed a U-shaped pattern
when viewed in cross section (USGS Staff, 1990).
Two events (Lake Elsman events) of M 5.0 and 5.2 occurred near
Loma Prieta on June 27, 1988 and August 8, 1989, respectively. At
depth these events were located 4 km northeast of the west-dipping
plane defined by the Loma Prieta aftershocks (Figure 1 ), and may
have occurred on a different fault. Their fault plane solutions indicate
equal components of right-lateral and reverse slip on a northeast-
dipping plane with a strike of N 60° W (Olson and Lindh, 1990).
These events were widely felt and caused minor damage. These
events have been called preshocks, but are not considered to be
foreshocks in the usual sense of the word.
CHARACTERISTICS OF THE MAINSHOCK
The 17 October 1989 earthquake occurred in the Santa Cruz
Mountains at latitude 37*02.33' N, longitude 121° 52.76' W, at a
depth of 17.6 km (Dietz and Ellsworth, 1990). The location of the
mainshock is shown in Figure 1 as the largest octagon.
The surface wave magnitude (Ms) of the earthquake is 7.1, as
determined from readings at 21 world-wide stations (NEIC, 1990).
The individual station values ranged from Ms6.6 to M
s7.4. The body
wave magnitude (mb) for the event is 6.5 (NEIC, 1990), and the
moment magnitude (Mw ) is 6.9 (Kanamori and Helmberger, 1990).

STRONG GROUND SHAKING FROM THE LOMA PRIETAEARTHQUAKE OF 17 OCTOBER 1989, AND ITS RELATIONTO NEAR SURFACE GEOLOGY IN THE OAKLAND AREA
modified from:
A PRELIMINARY REPORT TO:
GOVERNOR'S BOARD OF INQUIRY ON THE 1989
LOMA PRIETA EARTHQUAKE
by
Anthony F. Shakal 1
, Mark J. DeLisle 1
, Michael S. Reichle 1
, and Robert B. Darragh 1
DESCRIPTION OF THE EARTHQUAKEThe Loma Prieta earthquake occurred on the San Andreas fault ap-
proximately 16 km east of Santa Cruz and 33 km southwest of San
Jose. The map in Figure 1A shows the San Andreas fault, the
earthquake epicenter and cities of central coastal California. The
stippled line on the San Andreas fault between San Juan Bautista and
.Lexington Dam indicates the approximate extent of the aftershock
zone and, by inference, the extent of fault rupture during the main-
shock. The locations of Strong Motion Instrumentation Program
(SMIP) stations that recorded the strong shaking during the earth-
quake are shown by solid symbols, and the peak horizontal accelera-
tion recorded at each station is given near the symbol. Stations in the
Oakland/San Francisco area are repeated in Figure IB.
The earthquake hypocenter, where the fault rupture initiated, is at
37°02"N, 121°52'W at a depth of 18 km. This depth is greater than
Jthe 12-15 km maximum depth typical for hypocenters on the San
Andreas fault. Fau lt rupture did not reach the surface, which is
unusual for an event of this magnitude on the San Andreas; this fact
may be related to the greater depth oj the hypocenter or the local
k.,uim. legune.
The local, or Richter, magnitude of the event is 7.0 (U.C. Berkeley).
The surface wave (long-period) magnitude is 7.1 (NEIC, 1989).
The source mechanism of the event was a combination of strike-
slip faulting, common on the San Andreas, and thrust faulting, which
is more unusual. The coastal block on the west side of the San
Andreas moved to the north and upward relative to the east side of
the San Andreas. Estimates by the USGS (Lisowski and others,
1990) are that the coastal block moved approximately 1.6 + 0.3 m to
the north and 1.2 ± 0.3 m upward.
OBSERVED STRONG GROUND MOTION
Recorded peak horizontal acceleration values from SMIP stations
for the Loma Prieta earthquake are plotted on the map in Figure 1 A.
The maximum horizontal acceleration recorded at each station is
given near each station. Stations in the epicentral area have accel-
erations as high as 0.64 g. The most distant station triggered in Santa
Rosa (175 km) recorded about 0.05 g. Peak values at stations in the
San Francisco/Oakland area (95 km) are shown on a map with an
expanded scale in Figure IB. The lowest values, near 0.06 g, were
recorded at stations sited on rock in San Francisco, on Yerba Buena
Island and in Berkeley. The highest values were recorded at the San
Francisco airport and other soil sites in the Bay Area.
The peak horizontal acceleration values are plotted against dis-
tance in Figure 2. A curve of the predicted ground motion using a
standard relationship (Joyner and Boore, 1981) is also shown for
reference. It is obvious that most of the data are above the median
curve, and in fact much of the data are above the + 1 sigma curve for
an event of this magnitude. In general, peak horizontal acceleration
values at distant stations are higher than would be expected; several
stations, including stations in Oakland, had accelerations between
two and three standard deviations above the median value.
Selected accelerograms of particular interest are shown in Figure
3. Figure 3A includes two records from the epicentral area. One
record is from a station (Corralitos) very close to the San Andreas
fault; the other record (Capitola) is from the coastal area extending
from Santa Cruz to Watsonville in which damage was extensive.
Figure 3B shows records from a rock/soil pair near San Francisco.
Yerba Buena Island is a rock outcrop in the middle of the San
Francisco Bay, and Treasure Island is a nearby manmade island.
These records are presented to illustrate the levels of shaking on rock
and soil in the San Francisco-Oakland area, about 95 km from the
epicenter.
California Department of Conservation, Division of Mines and Geology. Strong Motion Instrumentation Program
29

DIVISION OF MINES AND GEOLOGY
Figure 1 A. Map of central coastal California showing the San Andreas fault, the epicenter and aftershock zone of the Loma Prieta earthquake, and the locations of
SMIP stations that recorded the strong shaking. Peak horizontal accelerations recorded at each station appear next to the station. The San Francisco/Oakland area
is repeated in Figure 1B at larger scale.

1990 THE LOMA PRIETA EARTHQUAKE OF 17 OCTOBER 1989 31
Figure 1 B. San Francisco/Oakland area showing strong motion stations that recorded the Loma Pneta earthquake and the peak acceleration values
recorded at SMIP (Shakal and others, 1989) and USGS (Maley and others, 1989) stations.

32 DIVISION OF MINES AND GEOLOGY SP104
1.0g
<o 0.1g
O.Olg
.472•224
1.0 10.0
Distance (km)
100.0
Figure 2. Peak horizontal acceleration values (PGA) versus distance (to the surface
trace of the fault over the aftershock zone) for strong motion data from SMIP
stations for the Loma Prieta earthquake. The solid and dashed curves are the
median and one standard deviation curves, respectively, from the Joyner-Boore
attenuation relationship (EERI, 1989). The numbered symbols are for Oakland
stations discussed in the text.
Surficial Geology in the Vicinity of the
Cypress Structure, Oakland
The geology of the San Francisco Bay area has been well studied.
Figure 4 is an illustration from a study of San Francisco Bay geology
(Helley and others, 1979) which focused on bay mud and other
flatland deposits in the Bay area. The map in Figure 4 shows that the
bay mud (shaded area) is widespread in the coastal areas. The
thickness of the bay mud is highly variable, however. Contours of
the thickness of the bay mud are shown in Figure 5 (from Goldman,
1 969). The maximum thickness ofthe bay mud is about 1 20 feet. The
thickness near Treasure Island is about 20 feet and at the eastern
approach to the Bay Bridge in Oakland the thickness is about 40 feet.
Farther east, toward the Cypress Street Structure (Interstate 880), the
bay mud decreases in thickness.
In addition to bay mud, other geologic units are important in the
Oakland area. As shown on the map in Figure 6 (from Radbruch,
1957), they include artificial fill, Merritt Sand and the Temescal
Formation. The Temescal Formation grades laterally into the Merritt
Sand Formation. The Merritt Sand is a well-sorted fine-grained sand
to clayey sand with lenses of sandy, silty clay. The Temescal
Formation consists of poorly-sorted, irregular interbedded clay, silt,
sand and gravel.
Although no strong motion stations recorded the motion
on or near the Cypress Structure during the Loma Prieta
earthquake, the motion was recorded at stations about 2
km to the west, east and north. The horizontal components
of the records from these three stations are shown in
Figure 7. The peak horizontal accelerations at the three
stations are very similar (0.26 to 0.29 g). The station at the
Oakland wharf (SMIP Station 472) recorded a maximumacceleration of 0.29 g. Figure 6 indicates that the wharf
is located in an area of bay mud. However, the soil profile
in Figure 7 shows that the total depth of the fill and bay
mud is only about 1 2 feet, and that Merritt Sand lies below
the bay mud. The station in Emeryville (USGS Station
1662) lies about 2 km north of the structure. This station
is on about 10 feet of fill. The underlying formation at this
station is the Temescal formation. The third station in the
set (SMIP Station 224) is in Oakland about 2 km east of
the Cypress structure. The soil profile shows that there is
no bay mud but a few feet of fill at the site. The fill overlies
the same formation as at the wharf station (Merritt Sand).
The soil profile at locations along the Cypress Structure
is shown in the profile in Figure 8, which was developed
from borings performed by the California Department of
Transportation (Caltrans) preparatory to construction.
These borings show that the bay mud at the Cypress
Structure, where present, is less than 20 feet thick. The
pile-tip depths (from Caltrans) are also shown in Figure 8.
In the section where the bay mud is 20 feet thick, the piles
extend to a depth of about 60 feet. The formation under
the northern part of the structure (Temescal Formation) is
similar to that underlying the Emeryville station.
The records from the stations at the wharf, at Emeryville and near
Lake Merritt (Figure 7) are all quite similar in peak values and
predominant frequency despite the differences in the near-surface
geologic conditions and depths of fill and bay mud. This suggests
that the specific near-surface geology at the Cypress Structure did not
cause significantly different motion than that shown by the records
in Figure 7.
As another example, Treasure Island was created in 1936-1937 by
placing up to 35 feet of hydraulic fill over sand and bay mud deposits
near Yerba Buena Island (Lee, 1969). The record from a station on
Treasure Island is similar in frequency content, though somewhat
lower in amplitude (0. 1 6 g, Figure 3B) than the Oakland area records.
The strong motion data from the Oakland area does indicate that
amplified levels of motion occurred at the Cypress Structure. How-
ever, the amplification effect occurs throughout the flat-lying por-
tions of Oakland, not just in a localized zone near the Cypress
Structure. To observe the amplification at the Oakland stations,
compare the peak motion at the Oakland stations discussed above to
the motion at Berkeley or Piedmont (0.08 - 0. 1 3 g; Figure 1 B), or at
Yerba Buena Island (0.06 g; Figure 3B). The amplification in the
flat-lying areas is also apparent in Figure 2 - the data points for the
Oakland area (designated 472 and 224) are well above the predicted
values, and in fact are the farthest above the median curve. Whatever
factor is causing increased shaking levels in Oakland appears to
extend throughout the flat-lying areas, and is not limited to areas of
bay mud.

1990 THE LOMA PRIETA EARTHQUAKE OF 17 OCTOBER 1989 33
X oD O3<C
x oo o3<
CJ> CT> wh» o •*-«i- CO lO
o o o
T3
coCJ
r^-
u oj* oa) r-i— «-i
UJ O•—
*
1 -»-«
oCO -•-^
o CO
ni—
i
" * 3u COu ol_
oo
o
oCM
co—"1
-•-'IT)
o Csl
-t-f r—
(n r~~*0)
t-
<>
u. *-*
o1
«"*
CO
nnMo 3
«-' CO—
•
OCLoo
oCsl

34 DIVISION OF MINES AND GEOLOGY SP104
Q>
X oo o2<
CJ>
CO CMO0>
X OD O2-C
tootoo too
aolO
ac c
oa—* -*-.
tn oI—
i
-•-^
tocu
L_ Q_HH3 ^S
in U~l
D O01
o ototo
oCM
00Io
I-
toto
-o «-C COD "">
o o
CD tO
3 „mO C/0
-£3 Oa>>-
oCM
O ototo

THE LOMA PRIETA EARTHQUAKE OF 17 OCTOBER 1989 15
Surface cracksshowing direction
of movementSAN ANDREAS FAULT
Direction of
plate
movement
/ V - rupture
Fault slip^
at depth in
this earthquake
Hypocenter
Figure 3. Schematic diagram showing inferred motion on the San Andreas
fault during the Loma Prieta earthquake Vertical and horizontal slip on the
buried fault and vertical surface deformation were determined from geodetic
data (source: Plafker and Galloway, 1989).
Local magnitude (M, ) estimates were 6.7 (CIT) and 7.0 (UCB). The
local magnitude scale (ML
) developed by Richter begins to saturate
in the range of 6.5 to 7 (e.g., Kanamori, 1 983). Thus, for earthquakes
of this size and larger, the surface wave magnitude (M ) or moment
magnitude (Mw) usually is a better estimate ol size than local mag-
nitude (M[
). Standard errors in magnitude determinations are typi-
cally about 0.2 units for both Msand M, (Bonilla and others, 1984;
Darraghand Bolt, 1987).
Figure 3 shows a block diagram of the motion on the San Andreas
fault during the earthquake. These motions were calculated from
geodetic measurements made in the region the day after the earth-
quake occurred and include data measured by Geodolite, H-P 3808,
the Global Positioning System, and the Very Long Base Line array
(Prescott and others, 1990). The slip during the event was inferred
to be 1.6 + 0.3 m of right-lateral strike slip and 1.2 ±0.3 m of reverse
dip slip on the fault surface between depths of 5 and 1 8 km (Lisowski
and others, 1 990). These values decrease rapidly through the volume
of crust adjacent to the fault so that only 36 cm of uplift was observed
at the earth's surface (Plafker and Galloway, 1989; USGS Staff,
1990).
The fault plane solution for the mainshock, based on 267 P-wave
first motion readings at epicentral distances ranging from 1 .6 to 562
km, is shown in Figure 4 A (Oppenheimer, 1990). The mechanism
is oblique right-lateral strike-slip with about equal parts strike-slip
and thrust motion. The preferred mechanism has a strike of N 50° ±
10°W, a dip of 70°± 15° SW, and a rake of 140°± 15°. The strike
agrees well with the surface trace of the San Andreas fault in the
vicinity of the epicenter.
A = COMPRESSIONALX = DILATATIONAL
a = NODAL
UP OWNO O DILATATION
+ + COMPRESSION
Figure 4 A. Lower hemisphere plot of fault-plane solution for the Loma Prieta main shock, based on data from 267 local and regional stations and the velocity model
of Dietz and Ellsworth (1990). Circles and pluses indicate dilatational and compressional first motions, respectively. "T" is tension axis and "P" is pressure axis
(source: Oppenheimer, 1990). B. Lower hemisphere nodal plane and nodal surface solutions for the main shock based on decomposition of the moment-tensor
solution. Data from 15 worldwide stations were modelled to obtain the moment tensor. "T" is tension axis and "P" is pressure axis (source: S. Sipkin. NEIC, 1990).

16 DIVISION OF MINES AND GEOLOGY SP104
In addition to obtaining the standard fault plane solution, other
attempts were made in near real-time to determine the earthquake
mechanism and moment tensor from analyses of longer period waves
recorded at regional and teleseismic distances (see discussion by
McNally and others, 1989). Most results are in good agreement with
the mechanism shown in Figure 4 A. For example, the NEIC ( 1 990)
moment tensor solution is shown in Figure 4 B. The moment tensor
gives a better characterization of the entire fault rupture, as opposed
to the fault plane solution of Figure 4 A that characterizes only the
rupture initiation.
Several broadband estimates of the source mechanisms, as well as
the geometry of the aftershock zone with respect to the mainshock
hypocenter (Figure 1 ), indicate that rupture during the event was
bilateral. The rupture initiated at the hypocenter and propagated
along the fault to the southeast and northwest and upward. Using the
rupture time of 1 seconds (see below) and a rupture extent of 20 kmin each direction (Plafker and Galloway, 1989) yields a rough esti-
mate for the average rupture velocity of 2 km/sec.
Preliminary estimates of the seismic moment range from 1 .9 to 1
1
x 1026 dyne-cm. We computed a stress drop of 33 bars using the value
of 3.0 x 1026 dyne-cm (which corresponds to the Mw of 6.9), rigidity
= 3 x 10" dyne-cm, w - 12 km, and L = 40 km in the relation of
Kanamori and Anderson (1975, p. 1091) for strike-slip faults. The
stress drop is about average for strike-slip faults. Estimates of
centroid depths (center of moment release) range from 8-15 km. Es-
timates of the source-time function fall into two groups: 10 seconds
or less (Choy and others, 1990; Nabelek, 1990; Romanowicz and
others, 1990; Wallace and Lay, 1990; Woods and others, 1990;
Salzberg and others, 1990; USGS Staff, 1990), and 20 seconds or
longer (Widmer and Masters, 1990; Romanowicz and others, 1990;
Choy and others, 1990; NEIC, 1989). Two or three distinct bursts of
energy, or sub-events, have been used in preliminary models of the
shorter source time functions, with the last of these sub-events the
largest (Choy and others, 1990; Nabelek, 1990; Wallace and Lay,
1990).
Based on the above preliminary results, the earthquake appears to
have been relatively rich in short-period and long-period (mantle)
energy, but relatively deficient in the intermediate periods. The
enriched long-period energy of the earthquake and the discrepency
in displacement directions for crustal and mantle components of the
easternmost Pacific plate lead Furlong and others (1990) to suggest
possible decoupling of the crust and mantle at depth.
THE AFTERSHOCK SEQUENCENumerous smaller earthquakes - aftershocks - occur after every
moderate or large earthquake. These are of special concern for
hazards assessment because they may cause deaths, injuries, or
further damage to structures already damaged by the mainshock. For
example, people were killed during aftershocks of the Kern County
earthquake of 21 July 1952(Oakeshott, 1955). Also, there have been
instances where people died from heart attacks during aftershocks
(e.g., 1980 Campania, Italy earthquake; NEIS, 1980).
For the Loma Prieta earthquake, there were two aftershocks of M5.0 and larger, and 48 ofM 4.0 and larger as of March 1 , 1 990 using
combined data from all sources. The number of M> 4 shocks varies
somewhat with reporting source as follows: UCB (43), USGS (32),
and NEIC (28). Table 2 lists the M> 4.0 aftershocks. USGS locations
are listed where available because of the greater USGS station
density in the vicinity of the epicenters and hence better location
control. U.C. Berkeley magnitude values are preferred because
Berkeley operates Wood-Anderson torsion seismographs, similar to
the instruments used by Richter in developing the magnitude scale.
Figure 5 shows the number of aftershocks per day from 17 October
1989 to 10 February 1990, clearly showing the characteristic decay
proportional to one divided by time.
The sequence was statistically consistent with the "generic Cali-
fornia" sequence of Reasenberg and Jones (1989; see also Reasen-
berg and Matthews, 1990), with the exception that either the b-value
was low or the a-value was low. (The b-value reflects the ratio of
large to small events, the a-value reflects the productivity, and the p-
value reflects the rate of activity.) Preliminary parameters for the
sequence are p=1.19, a=-1.67, andb=0.75, so that all are within one
standard deviation of the respective generic values (Reasenberg and
Jones, 1 990). The remaining variable, c, is held constant at 0.05 days
(Reasenberg and Jones, 1989). Based on the generic sequence, but
updating the parameters with preliminary results from monitoring
the first 4 days ofLoma Prieta aftershocks, it was estimated that there
was a 1 2 percent chance of an aftershock ofM> 6 in the two months
following October 21, 1989.
The main part of the aftershock zone for the 1 7 October earthquake
was 53 km long after the first four days (USGS written communica-
tion, 1989; Figure 1 ofMcNutt, 1 990) and 66 km long by 3 1 October
(Figure 1; USGS Staff, 1990). It is commonly observed that after-
shock zones tend to grow larger with time. For example, the after-
shock zone of the Ms6.8 Borrego Mountain earthquake of 1 968 grew
from 42 km in the first 22 hours to 64 km one year later (Allen and
Nordquist, 1972).
Figure 1 also shows cross-sectional views of the aftershock zone.
The aftershocks define a plane dipping about 70° southwest, consis-
tent with the fault plane solutions of Figure 4. The San Andreas fault
in this region is not vertical, as previously supposed, but dips at a
steep angle. This is the reason that the epicenter does not plot on the
surface trace of the fault. The earthquake hypocenter occurred at a
depth of 17.6 km on the southwest-dipping San Andreas, and thus is
located to the southwest of the surface expression of the fault. Also,
note in Figure 1 that there is a cluster of events off the main fault to
the southwest; one of the M 5 aftershocks occurred in this off-fault
cluster. Such clusters are common in aftershock zones, and are
explained by an increase in shear stress resulting from the fault slip
(Das and Scholz, 1981; Stein and Lisowski, 1983), or an increase in
pore pressure (Li and others, 1987). Clearly, however, most of the
aftershocks are located within about 2 km of the main fault.
There is considerable variety in the fault plane solutions of the
aftershocks, including thrust, normal, right-lateral, left-lateral, and
oblique mechanisms (Branch of Seismology, USGS, 1990; Oppen-
heimer, 1 990). The diversity of aftershock mechanisms suggests that
the majority of the aftershocks occurred off the main fault plane, and
that the stresses in the aftershock zone underwent a major reorgani-
zation. Also, the aftershock zone is about 3 km wide, much larger
than the relative horizontal location errors of about 0.3 km (Dietz and
Ellsworth, 1990), giving additional support to this interpretation. It
appears that the mainshock involved almost complete stress drop on

1990 THE LOMA PRIETA EARTHQUAKE OF 17 OCTOBER 1989 17
TABLE 2
LOMA PRIETA AFTERSHOCKS OF M>4.0
MAGNITUDELatitude 1 Lonq itude
1 Depth' BRK USGS 2 NEIC 3 NEIC 3
Month Day Time (UTC) Deg Min Deg Min (km) M, M mb
ML
10 18 00:04:15 37 02 121 53 18 7.0 7.1M- 6.610 18 00:07:15 37 13 121 57 12 4.7 4.6
S
10 18 00:07:43 36 57 121 48 18 4.7 4.9
10 18 00:08:204 37 02 121 52 00 4.4
10 18 00:08:54 36 57 121 46 13 4.3 4.1
10 18 00:09:55 37 01 121 46 08 4.0 4.010 18 00:11:45 37 09 122 01 06 4.2 4.0
10 18 00:12:02" 37 02 121 52 00 4.5
10 18 00:12:42 37 07 122 01 04 4.6 4.5
10 18 00:13:08 37 10 122 03 11 4.1
10 18 00:1 5:14 37 02 121 52 00 4.4
10 18 00:16:54 37 05 121 56 04 4.1 4.1
10 18 00:17:26" 37 02 121 52 00 4.0
10 18 00:19:17 37 09 122 00 10 4.0 4.0
10 18 00:23:37 37 01 121 47 03 4.0
10 18 00:25:04 37 01 121 48 07 4.8 4.8 5.0
10 18 00:30:40 37 05 122 00 01 4.2 4.2
10 18 00:38:28 37 10 122 01 08 4.3 4.3
10 18 00:41:24 37 10 122 03 11 5.1 5.2 4.8
10 18 00:45:37 36 55 121 43 01 4.0 4.0
10 18 02:15:49 37 04 121 44 16 4.5 4.5 4.4
10 18 02:26:03 37 01 121 46 01 4.2 4.2 4.1
10 18 03:23:575 37 10 122 00 22 4.0
10 18 04:16:32 37 03 121 54 10 4.1 4.1
10 18 04:50:26 37 08 122 03 06 4.3 4.3 4.6
10 18 05:18:34 37 01 121 51 13 4.2 4.2 4.5
10 18 06:39:1 5 36 56 121 43 12 4.3
10 18 10:22:04 36 59 121 51 08 4.4 4.5 4.3
10 19 03:55:005 36 59 121 49 19 4.0
10 19 08:45:49 36 57 121 51 06 4.0 4.3 3.7
10 19 09:53:50 36 55 121 41 06 4.5 4.5 4.3
10 19 10:14:34 36 57 121 50 07 4.6 5.0 4.6 4.3
10 19 12:25:33 36 55 121 41 04 4.0 3.8
10 20 00:1 8:206 37 06 121 57 12 4.3 7 3.9
10 20 08:1 2:545 37 11 122 05 16 4.0
10 21 00:49:42 37 01 121 53 09 4.6 4.3 4.5
10 21 22:14:56 37 03 121 53 11 4.9 4.6 4.5
10 22 14:24:375 36 59 121 48 15 4.1
10 25 01:27:26 37 05 121 56 09 4.7 4.5 4.6
10 25 13:00:42 36 53 121 39 09 4.0
10 25 22:01:49 36 59 121 47 14 4.0
10 26 09:01 :29 6 37 03 121 54 14 4.07
10 30 11:17:13 37 04 121 49 13 4.0 3.7
11 02 05:50:10 37 03 121 48 09 4.7 4.3 4.6
11 05 01:30:42 37 05 121 56 15 4.0
11 05 13:37:34 37 03 121 53 10 4.2 4.0
11 07 23:42:37 37 13 122 02 08 4.2 4.2 4.4
12 02 20:02:006 37 12 122 03 11 4.07
02 07 14:12:14 36 56 121 42 03 4.0 4.2
'USGS preliminary locations, except where noted (F. W. Lester, written communication, 1990).
2Duration magnitudes from low-gain instruments (J. P. Eaton, personal communication).
3National Earthquake Information Center, Preliminary Determination of Epicenters, Weekly.
4U. C. Berkeley locations assigned to be the same as the mainshock location; depth not assigned.
5U. C. Berkeley preliminary locations (R. A. Uhrhammer, written communication, 1990).
6NEIC preliminary locations.
7BRK magnitude given in NEIC (Preliminary Determination of Epicenters, Weekly).

18 DIVISION OF MINES AND GEOLOGY SP104
400
350
5Q 300
ccwQ.
COI-zUJ>UJ
occUJm5
250j
200
150^
100 .:
50j
LOMA PRIETA AFTERSHOCKS
10 20October 1989
10 20November
t M10 20December
10 20January 1990
10
Februar
Figure 5. Preliminary histogram of the number of aftershocks per day. Earthquakes had locations determined using at least 5-phase readings and had RMS time
residuals of 0.35 sec or less. Solid part of bars indicates aftershocks with M>4.0 (source: modified from figure provided by F. W. Lester, USGS).
the main fault plane so that most of the aftershocks represent redis-
tributed stresses off the fault (Oppenheimer, 1990). In contrast, the
mechanisms of aftershocks of many moderate strike-slip events,
such as the 1979 M(
5.9 Coyote Lake earthquake (Reasenberg and
Ellsworth, 1982) agree more closely with the mechanism of the
mainshock.
INTENSITY PATTERN
Damage from the Loma Prieta earthquake was fairly widespread.
A number of lifelines were affected, notably Interstate 880 (Nimitz
Freeway), the San Francisco - Oakland Bay Bridge, and Highway
180 (Embarcadero Freeway) (see Figure 1 of McNutt and Sydnor,
this volume;. Numerous oilier bridges and roads were damaged.
Most ol San Francisco fared well during the earthquake whose
epicenter was about 90 km away, although damage to the various
highways and to structures in the Marina district was extensive. Most
damage was located in isolated pockets and was severe only in old
structures. In Santa Cruz, Watsonville, and Los Gatos, by compari-
son, a much higher percentage of structures were affected; these
cities were located within 23 km of the epicenter.
Intensities from the earthquake reached VIII on the Modified
Mercalli intensity (MM) scale (see Montgomery, this volume)
throughout much of the epicentral area (Figure 6 A; Stover and
Others, 1990). Isolated instances of MM IX are assigned to the
collapse of the elevated section of the Interstate 880 (Nimitz Free-
way) in Oakland, to the damaged Highway 480 (Embarcadero
Freeway) in San Francisco, and to the Marina district of San Fran-
cisco. Some areas of San Francisco underlain by thick deposits of
Quaternary bay mud and eolian sand dunes show intensity levels one
to two MM units higher than the central part of the city underlain by
rock (Figure 6A; Stover and others, 1990).

Iwo THE LOMA PRIETA EARTHQUAKE OF 17 OCTOBER 1989 19
122°00' 30'
l*J \ !
~SP=T
VI 5.(<^c?---i|8o_^\y
(j] Bl;hmond
/
\vi«
7 \y
/ q;
VII
V
VI
°""vtr\^
'GVIII
©
EXPLANATION
yf Epicenter
8 Fell at intensity 8
20 KIIOMEIERS
O
Figure 6. A. Isoseismal map for the San Francisco Bay region for the Loma Prieta earthquake of 1 7 October 1 989. Locations that also reported the 1 865
earthquake are circled, and are listed in Table 3 (source: Stover and others. 1990).
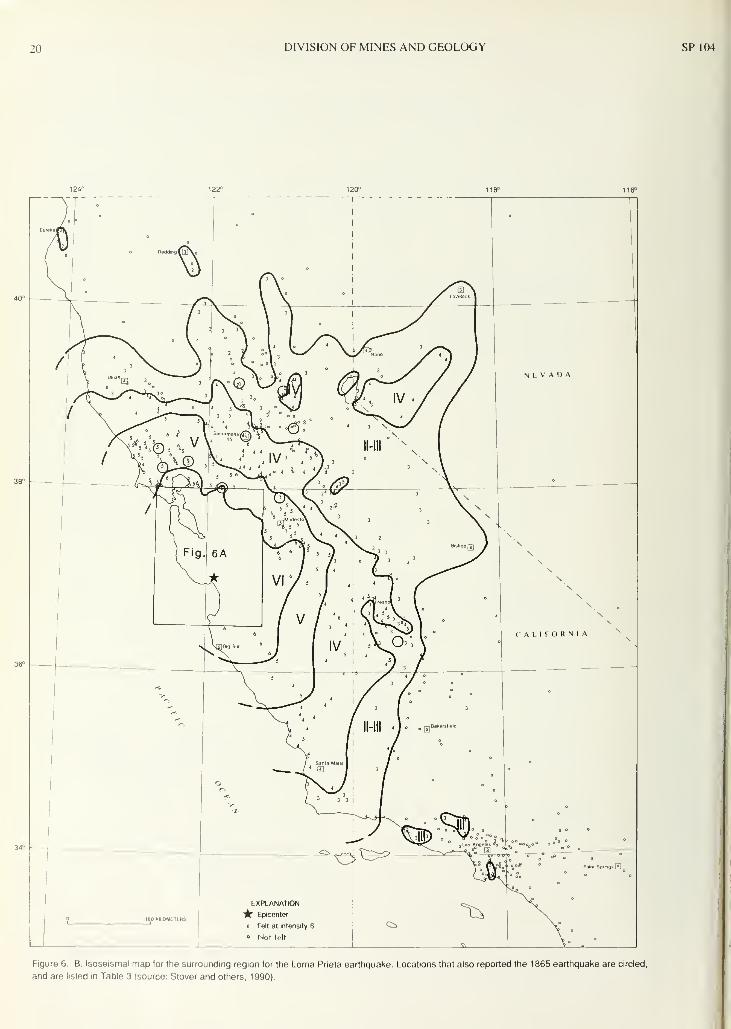
20 DIVISION OF MINES AND GEOLOGY SP 104
124° 122° 120° nff 116°
21EurekaP\
•
I°
ReddinguS\e
•xJ
|3\ °
40f> f -L
I 3
3 ^\ ]J
I ^//"N '
/"""
—
/X
° ^N 3 s / J NEVADA
/Y5SS^/>^V-^ \ . Kl Ti/. IV 4/ // <JJ^ZTt\ •S.^-V. *^\ / /
/
« 3 VS^ /
Il-lll '\ 1
X \3
A38° —Xj /6 Hu) s 5 *X»_^' .
./9 °
/
V s"Tv \. 3 ^V ,3=
3 \N55
5 \ \ 3 X smMod^l'A 3 i X
^N*. 4*
3 \ <
3 2 \
\. lBishopm )
s
) F'g. 6A 6 6I 5 5) ^"n3 ]
, y/3 o / 3 4
3 ^^S N
• vi 7 5
/ V
5// 4
/ 6
13 ^^^^^
A R^ 3°i\ 1
\\\\
\ * 6F
3*
4 V" ^v^ CALIFORNIA\ NfflBig Suf * 1
5
s\0 >', V S
36?X>^ -"St- ' 5
JJ°
4y 3 /
-i
\ 5' -5 ^
4/-- 5
^r 3 / ° °
"V \ 5.^^ / f ° ° °O1— ^n 7 1
'
/ 3 3
-r.4
r-i
/ 5
o p^
Sanla Maria 1
a 1
Il-lll «)° „B,K„ S„.«
.
o \ ^*v *S I o
& 1 3 j',ST ^N > o-^
%> .. . •. o o
34°
\
<\ , . ^_ ^^^^;riiiV^_l^^—^^y vV or 'J,
*' ° PalmSpungsS
OsB^'r °° °
^fl °
^^\o °
EXPLANATION
iookhomi rens"X" Epicenter
6 Felt at intensity 6Y o
» Not felt
^ \. . °
Figure 6. B. Isoseismal map for the surrounding region for the Loma Prieta earthquake. Locations that also reported the 1865 earthquake are circled,
and are listed in Table 3 (source: Stover and others, 1990).

1990 THE LOMA PRIETA EARTHQUAKE OF 17 OCTOBER 1989 21
The area shaken at intensity VII or greater, which can cause sig-
nificant damage to structures, was 4,300 km 2 on land (Figure 6 A).
This compares well to the intensity VII or greater area of 4,100 knr
on land of the 1865 event discussed below. By comparison, the area
shaken at MM VII or greater in the 1906 San Francisco earthquake
was 48,000 knr on land (Toppozada and Parke, 1982).
One of the most surprising features of the earthquake was the lack
ofprimary surface rupture representing the faulting motion (Hart and
others, this volume). The impressive cracks shown in the news media
were mostly superficial features secondary to the faulting at depth.
Numerous ground failures occurred over an area 100 km long by 40
km wide, stretching from San Gregorio to Hollister, with additional
coastal bluff landslides occurring in a narrow strip along the coast all
the way up to Marin County (Plant and Griggs, 1990; Sydnor and
others, this volume). Ground failures included landslides, debris
slides, rockfalls, and bedrock slides (Spittler and others, this vol-
ume). Liquefaction phenomena were widespread, occurring from
Oakland to Salinas, and produced numerous sand boils and mudvolcanoes (Figure 1 of McNutt and Sydnor, this volume).
STRONG SHAKING
Most people in the vicinity of the earthquake felt about 10 to 15
seconds of strong ground shaking. The P wave was felt first, then the
strong shaking was associated with the S waves and surface waves.
In addition to being felt by millions of people, the earthquake was
recorded by 93 strong motion accelerographs operated by the Divi-
sion of Mines and Geology Strong Motion Instrumentation Program
(Shakal and others, 1989; Shakal and others, this volume; and
Reichle and others, this volume). Data from these instruments show
about 1 0-1 5 seconds of shaking stronger than 0.1 g. This corresponds
to the duration of shaking that was felt by most people. The strongest
shaking recorded in the near field at a ground-response site (a site not
located in or near a building or bridge) was 0.64 g horizontal. It was
noted by field observers that damage near this particular site (Cor-
ralitos) was relatively minor, whereas damage nearby, particularly
on ridges, was extensive. This may suggest that shaking on the ridges
and throughout much of the epicentral area was stronger than 0.64
g (Spittler and Sydnor, 1990).
COMPARISON TO THE 1865
EARTHQUAKEOn 8 October 1 865 an earthquake caused structural damage from
Watsonville to San Francisco and major damage in the Santa Cruz
Mountains. The isoseismal map of Toppozada and others (1981)
shows the epicenter at 37.2°N, 1 2 1 .9°W on the northern flank of the
Santa Cruz Mountains. Stover and others (1990) compared the
intensity of the Loma Prieta event to that reported by Toppozada and
others ( 1 98 1 ) for the 1 865 earthquake at 1 3 places that reported both
events. We have reviewed and revised the comparison at these 13
places and compared 15 additional places that reported both events.
Places that reported both the 1865 and 1989 events are circled in
Figures 6A and 6B.
Table 3 shows the comparison at the 28 sites that reported both
earthquakes. The table is arranged by increasing distance from the
Loma Prieta epicenter and, hence, generally by decreasing intensity.
San Francisco had anomalously high intensities in both events. MMIX damage in San Francisco in 1 989 was to freeways and to the sandy
fill areas of the Marina District, neither of which existed in 1865.
Note that in the comparison in Table 3, we had no 1989 reports for
three localities that reported the 1865 event, so we compared them
to intensities from neighboring localities. There is good agreement
at all places that reported both earthquakes, with differences of a
whole intensity unit at only five places (footnote 4 in Table 3). This
remarkable agreement in the effects of both earthquakes spans the
entire range of intensities reported, from MM I (not felt) to MM VIII,
and from distances of 8 to 390 km. Further, Townley and Allen's
(1939) descriptions of the 1865 earthquake as being felt for 10 to 15
seconds in San Francisco, being most severe at Santa Cruz and near
Watsonville, and causing people to feel nausea in Sacramento, are
analogous to the effects of the 1989 event.
There is a suggestion from the pattern of intensity distribution that
the 1865 event was located somewhat northward of the 1989 event
because it had higher intensities at New Almaden and had lower
values at Corralitos and Soquel (Table 3). This is marginally signifi-
cant, however, because in the same general north-south trend, San
Francisco, San Leandro, and Watsonville do not show systematic dif-
ferences between the two earthquakes. No significant intensity
differences are apparent from Table 3 and Figure 6, indicating that
the difference in location between the 1865 and 1989 events is less
than 25 km.
We infer that the magnitudes of the two earthquakes are also very
similar. Toppozada and others ( 1 98 1 ) originally estimated M 6.3 for
the 1865 event using Toppozada's 1975 equations relating isoseis-
mal areas to magnitude. These equations were found by Ellsworth
( 1 990) to underestimate M by 0.3 unit, which changes the magnitude
from 6.3 to 6.6. The similarity over all intensities of the 1865 and
Loma Prieta events suggests a magnitude for the 1 865 earthquake
even closer to Loma Prieta's M 7.1.
When Toppozada's (1975) relation is applied to the intensity VI
areas in 1 865 (2 1 ,000 km 2) and in 1 989 (22,000 km 2
), the results are
M 6.25 and M 6.3, respectively. When the relation is applied to the
intensity VII areas in 1865 (4,100 km 2) and in 1989 (4,300 km2
) the
results are M 6.6 and M 6.65, respectively. This confirms that the
1865 and 1989 events had similar magnitudes, and it also indicates
that the 1975 relations may underestimate M by about 1/2 unit in the
Bay area. This is because the relations are based on earthquakes
located primarily outside the Bay area. The 1989 event is the first
earthquake located in the Bay area or vicinity having an instrumen-
tally determined magnitude in the M 7 range. A magnitude of about
7 for the 1 865 earthquake estimated by comparing it to the 1 989 event
is better than that derived from relations based on earthquakes
located outside the Bay area where crustal conditions are different.
In summary, intensity comparisons indicate that the 1989 earth-
quake is almost a duplicate of the 1865 event. The epicentral
locations are less than 25 km apart and the magnitudes are within 0.
1
to 0.5 unit. If the 1865 event occurred on the San Andreas, this
suggests that the 1865 and 1989 events may be characteristic earth-
quakes for this segment of the fault. It is possible, however, that the
1865 earthquake occurred on a neighboring fault, as did the M 5.0
and M 5.2 events of June 1988 and August 1989 about 10 km north
of the Loma Prieta epicenter. In either case, the region has generated
four earthquakes of M~ 7 or greater (1838, 1865, 1906, and 1989),
more than almost any other area in California in the short historical
record.
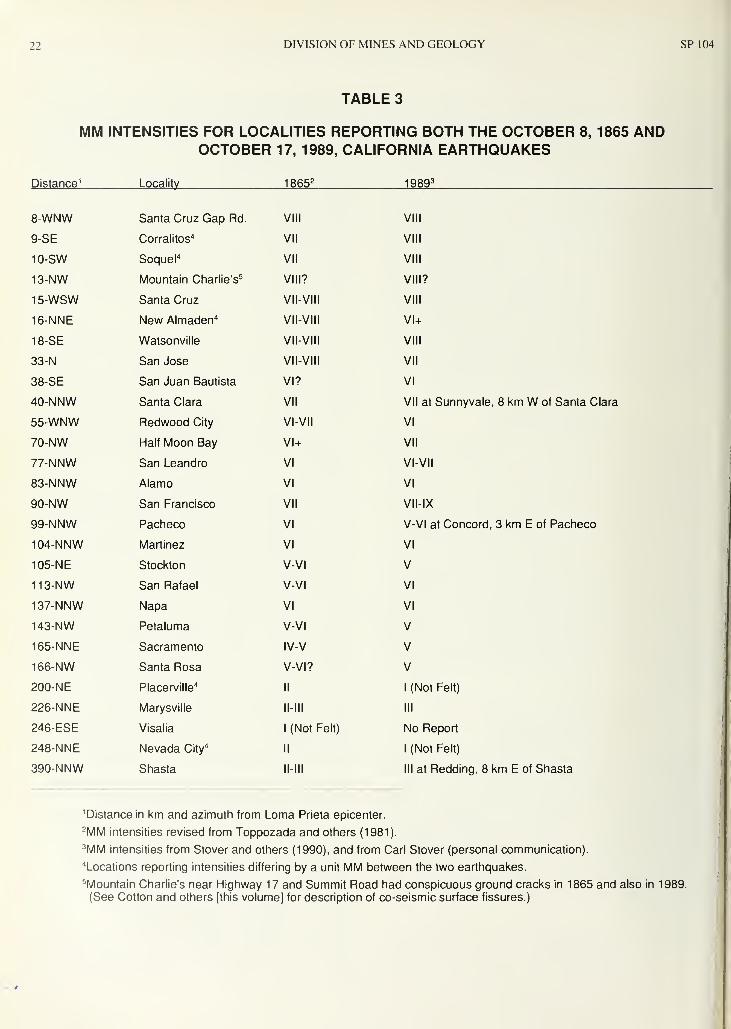
22 DIVISION OF MINES AND GEOLOGY SP104
TABLE 3
MM INTENSITIES FOR LOCALITIES REPORTING BOTH THE OCTOBER 8, 1865 ANDOCTOBER 17, 1989, CALIFORNIA EARTHQUAKES
Distance 1 Locality 1865 21989
'
8-WNW Santa Cruz Gap Rd. VIII VIII
9-SE Corralitos4 VII VIII
10-SW Soquel 4VII VIII
13-NW Mountain Charlie's5 VIII? VIM?
15-WSW Santa Cruz VII-VIII VIII
16-NNE New Almaden 4VII-VIII VI+
18-SE Watsonville VII-VIII VIII
33-N San Jose VII-VIII VII
38-SE San Juan Bautista VI? VI
40-NNW Santa Clara VII VII at Sunnyvale, 8 km W of Santa Clara
55-WNW Redwood City VI-VII VI
70-NW Half Moon Bay VI+ VII
77-NNW San Leandro VI VI-VII
83-NNW Alamo VI VI
90-NW San Francisco VII VII-IX
99-NNW Pacheco VI V-VI at Concord, 3 km E of Pacheco
104-NNW Martinez VI VI
105-NE Stockton V-VI V
1 13-NW San Rafael V-VI VI
137-NNW Napa VI VI
143-NW Petaluma V-VI V
165-NNE Sacramento IV-V V
166-NW Santa Rosa V-VI? V
200-NE Placerville4 II I (Not Felt)
226-NNE Marysville ll-lll III
246-ESE Visalia I (Not Felt) No Report
248-NNE Nevada City4 II I (Not Felt)
390-NNW Shasta ll-lll III at Redding, 8 km E of Shasta
'Distance in km and azimuth from Loma Prieta epicenter.
?MM intensities revised from Toppozada and others (1981).
3MM intensities from Stover and others (1990), and from Carl Stover (personal communication).
"Locations reporting intensities differing by a unit MM between the two earthquakes.
5Mountain Charlie's near Highway 17 and Summit Road had conspicuous ground cracks in 1865 and also in 1989.
(See Cotton and others [this volume] for description of co-seismic surface fissures.)

990 THE LOMA PRIETA EARTHQUAKE OF 17 OCTOBER IMS') 23
COMPARISON TO OTHER M 7
EARTHQUAKES
Earthquakes of M~7 occur infrequently in California. Conse-
quently it is instructive to examine earthquakes of this size that
[coined elsewhere. The purpose of this section is to learn ifthe 1 989
;arthquake is typical of other events of this si/e and to obtain some
amiliarity with expected features of large earthquakes. We empha-
ize the size and distribution in space and time of aftershocks since
nese are of great concern to the emergency response community. In
articular, the largest aftershocks are the ones most likely to cause
iurther damage.
Parameters of eight earthquakes including the Loma Prieta event
re shown in Table 4. The events were selected mainly on the basis
{"magnitude and data quality, and because they occurred on land.
ive of these events are within 0.2 magnitude units of the Loma Prieta
vent, and the other two are included because they are well known:
Armenia (1988) and Kern County (1952). The tabulated parameters
iclude several that are not routinely reported: aftershock zone
ength, magnitude difference between the mainshock and largest
tershock, time to largest aftershock, distance to largest aftershock,
id number of M>4.0 aftershocks. When compared to the other
vents, the Loma Prieta earthquake has a roughly median aftershock
one length, a larger than average magnitude difference between the
,iainshock and largest aftershock, a median time from the mainshock
) the largest aftershock, a roughly median distance to the largest af-
;rshock, and a slightly higher than average number of M>4 after-
hocks (although there were fewer large aftershocks). The Loma
rieta earthquake is similar to the 1980 Campania, Italy earthquake
ot only in most of the listed parameters but in its rupture extent,
epth. and geometry as well (Deschamps and King, 1983).
If suitable measurements were made on the mainshock and data on
ther similar events were readily available, then it might be possible
) predict spatial and temporal features of the aftershock sequence,
.easenberg and Jones (1989) considered mainshock magnitude and
ased temporal probability estimates for large aftershocks on evalu-
tion of a 'generic California' sequence, updated with preliminary
leasurements of the sequence in progress. Such estimates were used
y the emergency response community and by field geologists fol-
>wing the Loma Prieta earthquake. In general, however, this ap-
roach is limited by the fact that stochastic or random variability far
utweighs measurement errors in terms of quantifying earthquake
arameters. Especially for large earthquakes, therefore, it may be
•rudent to base short-term aftershock hazard assessments on upper
mges of parameters, rather than on average values.
The process which gives rise to aftershocks is not uniform from
lace to place nor even necessarily uniform at the same place at
ifferent times. Rather, many random processes in the earth, about
;hich we know relatively little, act to modify aftershock sequences.
There is probably about an order of magnitude variability in some ol
the parameters listed in Table 4 which would be nunc apparent if
many more events were added to the sample. Bonilla and others
( 1984), for example, found this range of variability when comparing
earthquake magnitude to rupture length lor strike-slip faults (pre
liminary data show that rupture length is about two-thirds ol aftei
shock /one length I. Singh and Suarez ( 1 988) showed that the number
of M>5 aftershocks (compared to our number of M> 4) of M>7 sub-
duction zone events varied by a factor of 40 (!), but included
systematic regional variation. Doser (1990) found that the timing of
the largest aftershock was less than 24 hours 60 percent of the time
for M> 5.5 earthquakes within the western Cordillera, but nearly one-
third occurred more than one week after their mainshocks (similar
to Table 4). Each of these studies tried to minimize measurement
errors by judicious selection of data and measurement techniques,
yet stochastic variability still dominates any simple trends.
Based on the selected parameters of the sample above, the Loma
Prieta earthquake appears to be fairly typical of events of its size.
However, the duration of the main rupture was less than usual
because rupture was bilateral rather than unilateral. The size of the
fault surface that ruptured may have been somewhat smaller than
usual, although the aftershock zone length in Table 4 does not appear
to be anomalous. Most earthquakes of the same size tend to have
more large aftershocks. Large ranges in parameters are to be ex-
pected, in general, since stochastic variability is greater than meas-
urement error. This indicates the need for caution when using the
Loma Prieta earthquake or any other single earthquake as a model
for future M 7 events in California.
PROBABILITIES
The Loma Prieta earthquake occurred on a fault segment that had
been identified in several studies as having a relatively high proba-
bility for an earthquake ofM 6.5 to 7 (WGCEP, 1988;Lindh. 1983;
Sykes and Nishenko, 1984). In the 1988 study, the probability was
estimated at 30 percent over the 30-year period from 1988 to 201 8.
The Loma Prieta earthquake occurred in the correct area and within
the forecast si/e range. The segment of the San Andreas fault imme-
diately to the north of the Loma Prieta segment was identified in the
same study as having a 20 percent probability of producing an event
of M 7 in the next 30 years. Two segments of the Hayward fault in
the East Bay also were identified as each having a 20 percent chance
of producing an M 7 event in the next 30 years (WGCEP, 1988).
An earthquake of M~ 7 similar to the Loma Prieta event located
closer to San Francisco and Oakland, would be much more destruc-
tive than the Loma Prieta event. A major earthquake (M 7.0-7.5) in
the East Bay could be as destructive to the whole Bay area as a larger
(Ms
8.3) earthquake on the San Andreas fault (Steinbrugge and
others, 1987).

24 DIVISION OF MINES AND GEOLOGY SPIO
to
ooXtoQCUJHU.
<
UJXI-
oz<
UJ CO
u.oenUJ
<OXI-
<Ul
QUJh-OUJ_iUJCO
oo0)otzz
2
CC
_,. to —^ti -^ -cAl O -^ O
O _CD
o xtz <
cz
O
<f>
CD 0) OO CD OCZ CD XZ
2 co ^CO _| CD
Q o $
o w o
g PB.2 co <d
CJ) •
co Sz
2 Q
CD
5"§4C
— owCD -
CO CD TO
co —
'
CD <$
5r5
CD xzC Q_O CD
1 Q^_T "Dro cz—
1
CO
CDOJOo_ B
- COCD Q-5 CZ CO
COIVa>t_
co"
CDXI
O
czCO
00
CD
cz mCO
E_0)
BXZo
X if
E
E
CM
LO
iri
e|
Si
oCO CO
Oco
en IVen
<y>
zf - 5 >> y~ >• .
inin
co 2
OECOczCO
CDXZ
O nd
Ami
(month
others,
(month others
IT)
*" O
M "DC ra o> Do"gCO 3 ^
Q)—
rag ro
,_- XZm CO
CO
CO
cco
ECD
rford
IS,
1Iding
.y co 1c CO LU 3 LU .9>
ceo co X H
>4.4)
N m z >-
CM 2CO in *- co
CM WoE
CO
CO CO CO cnCO 00 00 CD °° /-^
C7> en o> 00 °> S"~ ,-_
O) «— cn. cn
ifIt
dKing
onthly)
others
CO 2 co ^ -
CD
£c»
-CZ
cz
o Gallow
(weekl;
Isworth
£ E "oco ,~, cz
O CO E
5 °> cow ro
9-oo oc ,_
oo "o cn luCO ,s co cz oo _
o _
co (/)
chanr
S,
19Pezz
c "2O CD
E^.b o
en
O ker
a
C,
19
z
anc
WQj W —CD UJ CD LU "TO LU CD
-jz Z D (f) CO Z o_ z b
E
co
cz
Eco
CO
CO
E >.* mo •
CJ) H-
z ?- o - CMt CO cn ot o m oo m <n o cn nCM r-
I -t -^|
CO t- I CO i- 1
>NCD
>NCO co
§ CO CM> CO»-
co fzin o c I
s-o O >- o
CD £ d C-2CMQ-^ <t 11 ^ mc COEq cn mmen
oCM
E
cn
co
CM
Ocd
E
COCM
E
00en
co
E
CMCM
00
'a
E
COCO 3 COZ5 O >No -C co^ oo TJCO >— CM
CM
•r-mCM
CD COCO £t
2 E
m
CO tJ- o CO O)^ in in in ^
CO _J St CO .o22 E 2 E
cE
d
cn
in
EE
in
CO
E>«
C5rvm in
E
CMen
CO>,CO
in
CO
E
COCM
CZ
Etvco
t- CO
iri -<t
_i st
2 E
ooJZCO
CD
3'Ecn
t-; r>. rv cm CM ^ CO LO CM O) CM czn o 00 CO T o inc I
s- CD Is- rv" h~-' to |v cri N CD CD CD co' CD CD |v |^ id
(0 CO
2CO _122 CO _l22 CO c,
2 ECO SI
2 ECO -I s,22 E
CO -O
2 ECO £>
2 ECO -1 J22 E
E§^ Eco C
z? z5Z LU Z LL Z . Z UJ Z LL Zm . in . m . co E
00 CJ E d CM IV T- E co co E o CM E CM m _*o ino o o
CMo E O o
o Tf o ooo o
Oo ^- «>
t Ol o co i
—
r- CM O) o in co i
—
""t O |v cm rv'
co in CO o co
c3O S
* T- <* "* CO
N, o O CO 00 CO (v COrv
"co
CM E(0 d
~ O
11q .55
'ccoQ.E >-
CMCO
qc\i
CDco *~.
"E ocCDCO c
cCO
<CO
CD d00 dCO
d00
'cCD
EDC
cri
oo'00
CO
E£ ro O) en 3 3= CJ) ™ CO en en o ro enO -i= LU < X O O xi < V. _i O ^
CD
E
CD
CO
CD
2CD>Oo
COQ.CO
OCD
JC CO
o 3jxi
oJZ s
8 CO CDXI
JZ CDCO *r UJ
CDCD c
(1)
roCO0>
>CD
JXL x: cooJZ
CO
c 3o
CO CD cz
CZ E J£
CD
E Eo
oc
E -fc £ T3o CD ro 2^r O CO CD
0)
cs -g E
E V)CD CO
P b Q UJ
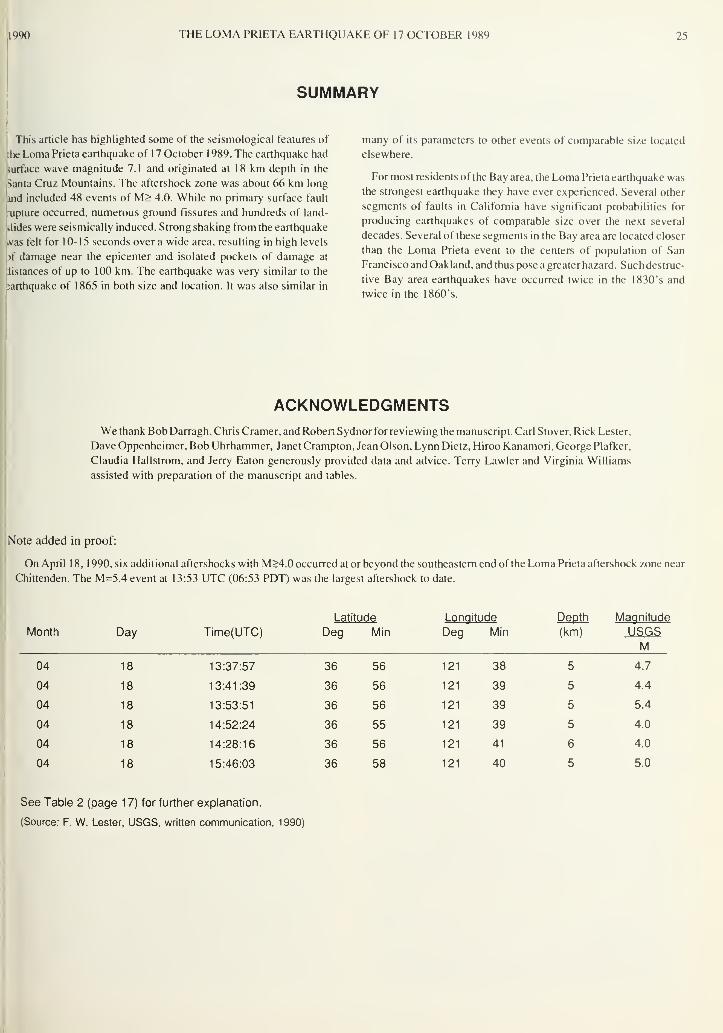
.1990 THE LOMA PRIETA EARTHQUAKE OF 17 OCTOBER 1989 25
SUMMARY
This article has highlighted some of the seismological features of
;he Loma Prieta earthquake of 1 7 October 1 989. The earthquake had
surface wave magnitude 7.1 and originated at 18 km depth in the
Santa Cruz Mountains. The aftershock zone was about 66 km long
ind included 48 events of M> 4.0. While no primary surface fault
-upture occurred, numerous ground fissures and hundreds of land-
slides were seismically induced. Strong shaking from the earthquake
>vas felt for 10-15 seconds over a wide area, resulting in high levels
jf damage near the epicenter and isolated pockets of damage at
iistances of up to 100 km. The earthquake was very similar to the
earthquake of 1865 in both size and location. It was also similar in
many of its parameters to other events of comparable size located
elsewhere.
For most residents of the Bay area, the Loma Prieta earthquake was
the strongest earthquake they have ever experienced. Several other
segments of faults in California have significant probabilities for
producing earthquakes of comparable size over the next several
decades. Several of these segments in the Bay area are located closer
than the Loma Prieta event to the centers of population of San
Francisco and Oakland, and thus pose a greater hazard. Such destruc-
tive Bay area earthquakes have occurred twice in the 1830's and
twice in the 1860's.
ACKNOWLEDGMENTSWe thank Bob Darragh, Chris Cramer, and Robert Sydnor for reviewing the manuscript. Carl Stover, Rick Lester,
Dave Oppenheimer, Bob Uhrhammer, Janet Crampton, Jean Olson, Lynn Dietz, Hiroo Kanamori, George Plafker,
Claudia Hallstrom, and Jerry Eaton generously provided data and advice. Terry Lawler and Virginia Williams
assisted with preparation of the manuscript and tables.
Note added in proof:
On April 18, 1990, six additional aftershocks with M>4.0 occurred at or beyond the southeastern end of the Loma Prieta aftershock zone near
Chittenden. The M=5.4 event at 13:53 UTC (06:53 PDT) was the largest aftershock to date.
Month Day Time(UTC)
Latitude
Deg Min
Longitude
Deg Min
Depth
(km)
Magnitude
USGSM
04 18 13:37:57 36 56 121 38 5 4.7
04 18 13:41:39 36 56 121 39 5 4.4
04 18 13:53:51 36 56 121 39 5 5.4
04 18 14:52:24 36 55 121 39 5 4.0
04 18 14:28:16 36 56 121 41 6 4.0
04 18 15:46:03 36 58 121 40 5 5.0
See Table 2 (page 1 7) for further explanation.
(Source: F. W. Lester, USGS, written communication, 1990)

26 DIVISION OF MINES AND GEOLOGY SP104
REFERENCES
Allen, C.R., and Nordquist, J.M., 1972, Foreshock, main shock,and larger
aftershocks of the Borrego Mountain earthquake: U.S. Geological Survey
Professional Paper 787, p. 16-23.
Bonilla, M.G., Mark, R.K., and Lienkaemper, J.J., 1984, Statistical relations
among earthquake magnitude, surface rupture length, and surface fault
displacement: Bulletin of the Seismological Society of America, v. 74, no.
6, p. 2379-2411.
Borcherdt, R.D., ed., 1989, Results and data from seismologic and geologic
studies following earthquakes of December 7, 1988, near Spitak, Armenia
S.S.R.: U.S. Geological Survey Open-File Report 89-163A, 188 p.
Branch of Seismology, USGS, 1990, Seismogenic structure and seismicity of
the 1989 Loma Prieta, California sequence: EOS, Transactions of the
American Geophysical Union, v. 71 , no. 8, p. 291,(abstract).
Burford, R.O., Harsh, P.W., and Espinosa, A.F., 1981, Last October [1980] 7.3
quake in Algeria reviewed: Geotimes, v. 26, no. 5, p. 18-20.
Choy, G.L., Boatwright, J., Lavonne, C.K., Needham.R.E., and Zirbes, M.,
1990, Source characteristics of the Loma Prieta Earthquake of October 17,
1 989 from broadband seismograms: EOS, Transactions of the American
Geophysical Union, v. 71, no. 8, p. 287, (abstract).
Darragh, R.B., and Bolt, B.A., 1987, A comment on the statistical regression
relation between earthquake magnitude and fault rupture length: Bulletin of
the Seismological Society of America, v. 77, no. 4, p. 1479-1484.
Das, S., and Scholz, OH., 1981, Off-fault aftershock clusters caused by shear
stress increase?: Bulletin of the Seismological Society of America, v. 71
,
no. 5, p. 1669-1675.
Del Pezzo, E., lannaccone, G., Martini, M., and Scarpa, R., 1983, The 23
November 1980 Southern Italy earthquake: Bulletin of the Seismological
Society of America, v. 73, no. 1 , p. 1 87-200.
Deschamps, A., and King, G.C.P., 1983, The Campania-Luciana (southern
Italy) earthquake of 23 November 1980: Earth and Planetary Science
Letters, v. 62, p. 296-304.
Dietz, L.D., and Ellsworth, W.L., 1990, The October 17, 1989 Loma Prieta,
California, earthquake and its aftershocks: geometry of the sequence from
high-resolution locations: Geophysical Research Letters, v. 17, p. 1417-
1420.
Doser, D.I., 1990, Foreshocks and aftershocks of large (M > 5.5) earthquakes
within the western Cordillera of the United States: Bulletin of the
Seismological Society of America, v. 80, no. 1, p. 110-128.
Ellsworth, W.L., 1990, (in press), Earthquake history 1769-1989: in Wallace,
RE., ed., The San Andreas fault system: U.S. Geological Survey
Professional Paper 1515.
Ellsworth, W.L., Lindh, AG., Prescott, W.H., and Herd, D.G., 1981, The 1906
San Francisco earthquake and the seismic cycle, in Simpson, D.W., and
Richards, P.G., eds., Earthquake Prediction - An International Review:
American Geophysical Union, Washington, DC, p. 126-140.
FEMA (Federal Emergency Management Agency), 1987, The Los Angeles-
Whittier Narrows earthquake of October 1, 1987: Federal/State hazard
mitigation survey team report, Publication no. FEMA-799-DR-CA
Furlong, K.P., Langston, C.A., Ammon, C.J., Clouser, R.H., Vogfjord, K.S.,
and Wagner, G.S., 1990, Seismic rupturing in the lower crust along the
San Andreas?: lessons from Loma Prieta: EOS, Transactions of the
American Geophysical Union, v. 71, no. 8, p. 288, (abstract).
Haghipour, A., and Amidi, M., 1980, The November 14 to December 25, 1979
Ghaenat earthquakes of northeast Iran and their tectonic implications:
Bulletin of the Seismological Society of America, v. 70, no. 5, p. 1751-
1757.
Hart, E.W., Bryant, W.A., Wills, C.J., and Treiman, J.A., 1990, The search for
fault rupture and significance of ridgetop fissures, Santa Cruz Mountains,
California: this volume, p. 83-94.
Hileman, J.A., Allen, C.R., and Nordquist, J.M., 1973, Seismicity of the
southern California region 1 January 1932 to 31 December 1972:
Seismological Laboratory, California Institute of Technology, 488 p.
Ishida, M., and Kanamori, H., 1980, Temporal variation of seismicity and
spectrum of small earthquakes preceding the 1952 Kern County,
California, earthquake: Bulletin of the Seismological Society of America, v.
70, no. 2, p. 509-527.
Jacoby, G.C., Jr., Sheppard, PR., and Sieh, K.E., 1988, Irregular recurrence
of large earthquakes along the San Andreas fault: Evidence from trees:
Science, v. 241, p. 196-199.
Jaume, S.C., and Sykes, L.R., 1990, Seismicity changes in the San Francisco
Bay region before the Loma Prieta earthquake of 1989: EOS, Transac-
tions of the American Geophysical Union, v. 71 , no. 8, p. 288, (abstract).
Jennings, C.W., 1975, Fault map of California: California Division of Mines
and Geology, Geologic Data Map no. 1 , scale 1 :750,000.
Kanamori, H., 1983, Mechanism of the 1983 Coalinga earthquake determined
from long-period surface waves: California Division of Mines and Geology
Special Publication 66, p. 233-240.
Kanamori, H., and Anderson, D.L., 1975, Theoretical basis of some empirical
relations in seismology: Bulletin of the Seismological Society of America, v.
65, no. 5, p. 1073-1095.
Kanamori, H., and Helmberger, D.V., 1990, Semi-realtime study of the 1989
Loma Prieta Earthquake using teleseismic and regional data: EOS,
Transactions of the American Geophysical Union, v. 71, no. 8, p. 291,
(abstract).
Lawson, A.C., ed., 1908, The California Earthquake of April 18, 1906: Report
of the State Earthquake Investigation Commission, Carnegie Institution of
Washington, Publication 87, v. 1 , 451 p.
Li, V.C., Seale, S.H., and Cao, T., 1987, Postseismic stress and pore pressure
readjustment and aftershock distributions: Tectonophysics, v. 144, p. 37-
54.
Lindh, A.G., 1983, Preliminary assessment of long-term probabilities for large
earthquakes along selected segments of the San Andreas fault system in
California: U.S. Geological Survey Open-File Report 83-63, 15 p.
Lisowski, M., Prescott, W.H., Savage, J.C., and Svarc, J.L., 1990, A possible
geodetic anomaly observed prior to the Loma Prieta, California, earth-
quake: Geophysical Research Letters, v. 17, p. 1211-1214.
Louderback, G.D., 1947, Central California earthquakes of the 1830's: Bulletin
of the Seismological Society of America, v. 37, p. 33-74.
McNally, K.C., Lay, T., Protti-Quesada, M., Valenise, G., Orange, D., and
Anderson, R.S., 1989, Santa Cruz Mountains (Loma Prieta) earthquake:
EOS, Transactions of the American Geophysical Union, v. 70, no. 45, p.
1463-1467.
McNutt, S.R., 1990, Loma Prieta Earthquake, October 17, 1989, Santa Cruz
County, California: California Geology, v. 43, p. 3-7.
McNutt, S.R., and Sydnor, R.H., 1990, Introduction: this volume, p.v-viii.
Montgomery, DR., Representative damage photographs from the LomaPrieta earthquake: this volume, p. 113-120.
Nabelek, J., 1990, Broadband teleseismic body wave analysis of the October
18, 1989 Loma Prieta earthquake: EOS, Transactions of the American
Geophysical Union, v. 71, no. 8, p. 289, (abstract).
NEIC (National Earthquake Information Center), 1988, Preliminary Determina-
tion of Epicenters, U.S. Geological Survey.
NEIC (National Earthquake Information Center), 1989, Preliminary Determina-
tion of Epicenters, U.S. Geological Survey.
NEIC (National Earthquake Information Center), 1990, Preliminary Determina-
tion of Epicenters, U.S. Geological Survey.
NEIS (National Earthquake Information Service), 1979, Preliminary Determi-
nation of Epicenters, U.S. Geological Survey.
NEIS (National Earthquake Information Service), 1980, Preliminary Determi-
nation of Epicenters, U.S. Geological Survey.
Oakeshott, G.B., ed., 1955, Earthquakes in Kern County California during
1952: California Division of Mines Bulletin 171, 283 p.

[ 990 THE LOMA PRIETA EARTHQUAKE OF 17 OCTOBER 1989 27
Dakeshott. G. B., ed.. 1959, San Francisco earthquakes of March 1957:
California Division of Mines Special Report 57, 127 p.
Dlson, J., and Lindh, A., 1990, Seismicity preceding the Loma Prieta
Earthquake: EOS, Transactions of the American Geophysical Union, v.
71. no. 8, p. 289, (abstract).
Dppenheimer, D.H., 1990, Aftershock slip behavior of the 1989 Loma Prieta,
California earthquake: Geophysical Research Letters, v. 17, p. 1 199-2002.
'lafker, G., and Galloway, J. P., eds., 1989, Lessons learned from the Loma
Prieta, California, earthquake of October 17, 1989: U.S. Geological
Survey Circular 1 045, 48 p.
>lant, N., and Griggs, G.B., 1990, Coastal landslides caused by the October
17, 1989 earthquake, Santa Cruz County, California: California Geology,
. v. 43. no. 4, p. 75-84.
'rescott, W.H., Lisowski, M., Johnston, M.J.S., Schulz, S.S., Savage, J.C.,
and Clark, T.A., 1990, Deformation before, during and after the Loma
Prieta earthquake of October 1989: EOS Transactions of the American
Geophysical Union, v. 71 , no. 8, p. 291 , (abstract).
leal, C.R., Toppozada, T.R., and Parke, D.L., 1978, Earthquake epicenter
map of California: California Division of Mines and Geology, Map Sheet 39.
teasenberg, P. A., and Ellsworth, W.L., 1982, Aftershocks of the Coyote Lake,
California, earthquake of August 6, 1979: A detailed study: Journal of
Geophysical Research, v. 87, p. 10,637-10,655.
teasenberg, PA, and Jones, L.M., 1989, Earthquake hazard after a
' mainshock in California: Science, v. 243, p. 1 1 73-1 1 76.
teasenberg, P. A., and Jones, L.M., 1990. California aftershock hazard
forecasts: Science, v. 247, p. 345-346.
teasenberg, P. A., and Matthews, M.V., 1990, California aftershock model
uncertainties: Response: Science, v. 247, p. 343-345.
Seichle, M.S., Darragh, R.B., Huang, M., Cao, T., Vetter, U. R., and Shakal,
: A.F., 1990, Preliminary analysis of processed strong-motion data from the
Loma Prieta earthquake: this volume, p. 47-57.
.lichter, C.F., 1958. Elementary seismology: W.H. Freeman and Company,
i San Francisco, California. 768 p.
lomanowicz, B., Caen, H.L., and Deschamps, A., 1990, The Loma Prieta
Earthquake of October 18, 1989: preliminary results using teletransmitted
data from the Geoscope Network: EOS, Transactions of the American
Geophysical Union, v. 71, no. 8, p. 290, (abstract).
lalzberg. D.H., Carabajal, C.C., Barker, J.S., and Wu, FT.. 1990, Preliminary
source characteristics of the October 18, 1989 Loma Prieta mainshock
based on teleseismic P and S waveforms: EOS, Transactions of the
American Geophysical Union, v. 71, no. 8, p. 290, (abstract).
>an Francisco Chronicle, 1990, L.A. Quake Damage Estimates Rise: San
Francisco Chronicle, San Francisco, California, March 2, 1990. p. A-1
,
i A-26.
.ihakal, A.F., DeLisle, M., Reichle, M.S., and Darragh, R., 1990, Strong
ground shaking from the Loma Prieta earthquake of 17 October 1989, and
its relation to near surface geology in the Oakland area: this volume,'
p. 29-46.
Ihakal, A.F., Huang, M. J., Reichle, M.S.. Ventura, O, Cao, T., Sherburne,
R.W., Savage, M., Darragh, R., and Petersen, C, 1989, CSMIP strong-
motion records from the Santa Cruz Mountains (Loma Prieta), California
earthquake of 17 October 1989: California Division of Mines and Geology,
Report No. OSMS 89-06. 196 p.
iimpson, D., Cranswick, E., Andrews, M., and Glassmoyer, G., 1989,
Preliminary aftershock locations (December 21, 1988 - January 4, 1989):
U.S. Geological Survey Open-File Report 89-1 63A, p. 75-85.
imgh, S.K., and Suarez, G., 1988, Regional variation in the number of
aftershocks (mfe
> 5) of large, subduction-zone earthquakes (Mw> 7.0):
Bulletin of the Seismological Society of America, v. 78, no. 1 , p. 230-242.
ipittler, T.E., Harp. E.L., Keefer, D.K., Wilson, R.C.. and Sydnor, R.H., 1990,
Landslide features and coseismic fissures triggered by the Loma Prieta
earthquake, central Santa Cruz Mountains, California: this volume,
p. 59-65.
Spittler, T.E., and Sydnor. R.H., 1990, Landslides and ridge-top failures
associated with the epicentral area of the Loma Prieta earthquake of
October 17, 1989, Santa Cruz County, California: EOS Transactions of the
American Geophysical Union, v. 71, no. 8, p. 290, (abstract).
Stein. R.S., and Lisowski, M.. 1983, The 1979 Homestead Valley earthquake
sequence, California: Control of aftershocks and postseismic deformation:
Journal of Geophysical Research, v. 88, no. B8, p. 6477-6490.
Steinbrugge, K.V., Bennett, J.H., Lagorio, H.J., Davis, J.F., Borchardt, G., and
Toppozada, T.R., 1987, Earthquake planning scenario for a magnitude 7.5
earthquake on the Hayward Fault in the San Francisco Bay area:
California Division of Mines and Geology, Special Publication 78, 243 p
Stover, C.W., Reagor, B.G.. Baldwin, F.W., and Brewer, L.R., 1990,
Preliminary isoseismal map for the Santa Cruz (Loma Prieta), California,
earthquake of October 18, 1989 UTC: U.S. Geological Survey Open-File
Report 90-18, 24 p.
Sydnor, R.H., Griggs, G. B., Weber, G. E.. McCarthy, R. J., and Plant. N ,
1990, Coastal bluff landslides in Santa Cruz County resulting from the
Loma Prieta earthquake of 17 October 1989: this volume, p. 67-82.
Sykes, L.R., and Nishenko, S.P., 1984, Probabilities of occurrence of large
plate rupturing earthquakes for the San Andreas, San Jacinto, and
Imperial faults, California, 1983-2003: Journal of Geophysical Research, v.
89, p. 5905-5927.
Tocher, D., 1959, Seismic history of the San Francisco region: in Oakeshott,
G.B., ed., 1959, San Francisco earthquakes of March 1957: California
Division of Mines Special Report 57, p. 39-48.
Toppozada, T.R., 1975, Earthquake magnitude as a function of intensity data
in California and western Nevada: Bulletin of the Seismological Society of
America, v. 65, no. 5, p. 1223-1238.
Toppozada, T.R., 1990, Earthquake history and hazards in central California,
within 100 km of Parkfield: California Division of Mines and Geology,
(manuscript in review), 120 p.
Toppozada, T.R., Hallstrom, C, and Ransom, D., 1990, M> 5.5 Earthquakes
within 100 km of Parkfield, CA: Seismological Research Letters, v. 61,
no. 1, p. 42, (abstract).
Toppozada, T.R., and Parke, D.L., 1982, Areas damaged by California
earthquakes, 1900-1949: California Division of Mines and Geology Open-
File Report 82-17 SAC, 65 p.
Toppozada, T.R., Real, C.R., and Parke, D.L.. 1981, Preparation of isoseismal
maps and summaries of reported effects for pre- 1900 California
earthquakes: California Division of Mines and Geology Open-File Report
81-11 SAC, 182 p.
Toppozada, T.R., Real, C.R., and Parke, D.L., 1986, Earthquake history of
California: California Geology, v. 39, no. 2, p. 27-33.
Townley, M.D., and Allen, M.W., 1939, Descriptive catalog of earthquakes of
the Pacific coast of the United States, 1769 to 1928: Bulletin of the
Seismological Society of America, v. 29, p. 1-297.
U.S. Geological Survey Staff, 1990, The Loma Prieta, California, earthquake:
an anticipated event: Science, v. 247, p. 286-293.
Wallace, T.C., and Lay, T., 1990, Preliminary analysis of the broadband
P waves from the 1989 Loma Prieta earthquake: EOS, Transactions of the
American Geophysical Union, v. 71, no. 8, p. 290, (abstract).
WGCEP (Working Group on California Earthquake Probabilities), 1988.
Probabilities of large earthquakes occurring in California on the San
Andreas fault: U.S. Geological Survey Open-File Report 88-398, 62 p.
Widmer. F., and Masters, G., 1990. The long-period moment tensor of the
Loma Prieta earthquake from IRIS/IDA data: EOS, Transactions of the
American Geophysical Union, v. 71, no. 8, p. 290, (abstract).
Woods, B.B., Satake, K.. Zhao, L.S., Jones, L.E.. Kanamon, H . and
Helmberger, D.V., 1990, Notes on the Loma Prieta earthquake: EOS.
Transactions of the American Geophysical Union, v. 71 , no. 8, p. 290,
(abstract).
Yielding, G., Jackson, J.A., King, G.C.P., Sinvhal. H., Vita-Finzi, C, and
Wood, R.M., 1 981 , Relations between surface deformation, fault geometry,
seismicity, and rupture characteristics during the El Asnam (Algeria)
earthquake of 10 October, 1980: Earth and Planetary Science Letters, v.
56, p. 287-304.

SECTION II
Earthquake Effects


THE L.OMA PRIF.TA EARTHQUAKE OF 17 OCTOBER 1989 \b

36 DIVISION OF MINES AND GEOLOGY SP 104
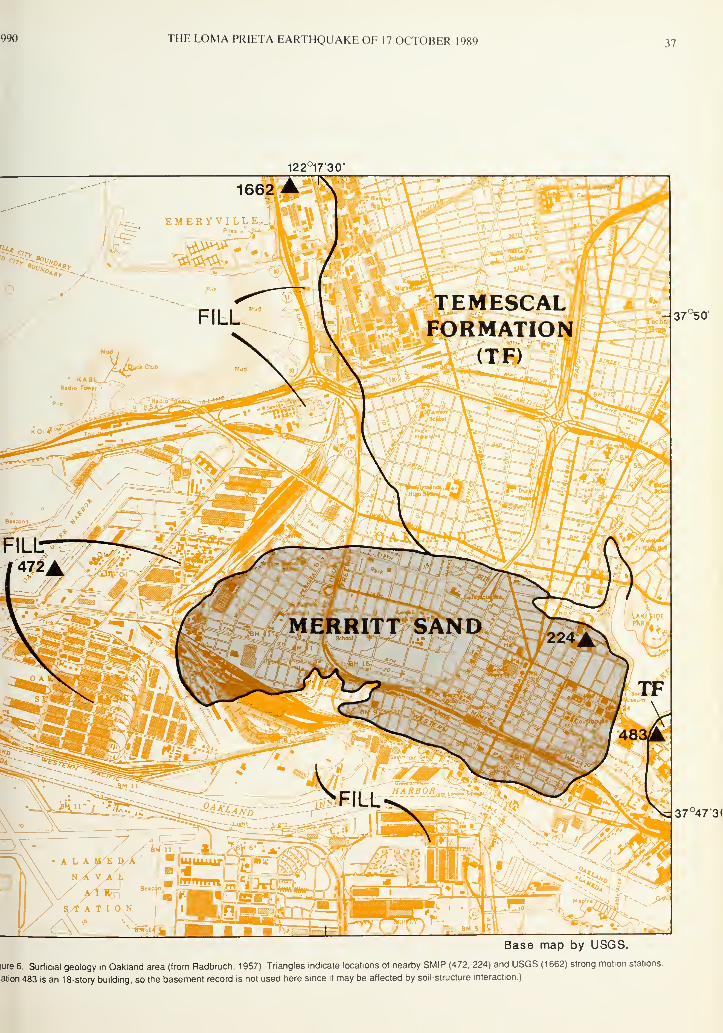
990 THE LOMA PRIETA EARTHQUAKE OF 17 OCTOBER 1989 37
122°17'30"
- 37°50'
- 17°37°47"3<
Base map by USGS.
lure 6. Surficial geology in Oakland area (from Radbruch. 1957). Triangles indicate locations of nearby SMIP (472. 224) and USGS (1662) strong motion stations
ation 483 is an 18-story building, so the basement record is not used here since it may be affected by soil-structure interaction)

38 DIVISION OF MINES AND GEOLOGY SP104
10
-
::.:••'.••
... m20 ~il§l
30 ~lfll
40-L_—
10-
ft.
20-
30-
u
o-ft.
10-
^
OAKLAND WHARF (SMIP Sta. 472)
EMERYVILLE (USGS Sta. 1662)
OAKLAND (SMIP Sta. 224)
125
°^li- 035°
0.26g
260°
0.22g
350°
0.26g
115°
200
12 3 4 5 10 15 Sec.
1 sec.
Fill
Bay Mud
LEGEND
Merritt Sand
TemescalFormation
AlamedaFormation
Figure 7. Horizontal components of the accelerograms from three stations in the Oakland area, each 2 km from the Cypress Structure. The shallow soil profile neareach station is also shown.

THE LOMA PRIETA EARTHQUAKE OF 17 OCTOBER 1989 39
CO
11 >• ^J^g^ V - feat
1X1
o5c
<_lD_
XLU
©>to
</)
3O0)
oCOcon
D i_
C to
03 o</) oo «-»
© 05
D) CO
T3 n©l_ VT1 *_
ffl.>.
n T3 ro
3E
T3o
*-<
>* CO—
(0 T3 wn *M
O uTi w c(n c CO
D oo ra-
© c te
CC 3 o
T3Cto
oc(0
C/)
is°
.2 CO
© J5•- o
s >• *T3 —
I C WCOC V) >.
£ . CO
O >* o
I I
= T3rr 3
.2 >,O CO
s: CD
n —©c o©
© ©> —
O (0—I w
I
TJcCO
CO
3
©
OO-,o
o-1
CO

40 DIVISION OF MINES AND GEOLOGY SP 104
LOMA PRIETA (SANTA CRUZ MOUNTAINS) EARTHQUAKE 1 7 OCTOBER 1 989 1 7 04 PDT
OAKLAND OUTER HARBOR WHARFCHN 1 305 DEG (TERMINAL AREA, NEAR CENTER)
ACCELEROGRAM BANDPASS-FILTERED WITH RAMPS AT .05-07 TO 23.0-25.0 Hz
58472-C0221 -89293 05 1 1 2189.01 06-QL89A472A
LOMA PRIETA (SANTA CRUZ MOUNTAINS) EARTHQUAKE 1 7 OCTOBER 1 989 1 7:04
OAKLAND - 2-STORY OFFICE BLDGCHN 2: 290 DEG (GROUND FLOOR, AT NE CORNER)
ACCELEROGRAM BANDPASS-FILTERED WITH RAMPS AT 05-07 TO 23.0-25.0 Hz
58224-C01 20-89293.02 112089 2140-QL89A224A
RESPONSE SPECTRA PSV. PSA & SDDAMPING VALUES 0, 2, 5, 10, 20%
FREQUENCY (HZ)
- FOURIER AMPLITUDE SPECTRUM: FS RESPONSE SPECTRA: PSV, PSA S SDDAMPING VALUES: 0, 2, 5, 10, 20%
rREQUENCY (HZ)
FOURIER AMPLITUDE SPECTRUM: FS
PERIOD (SEC) PERIOD (SEC)
Figure 9A. Response spectra for the (approximately) east-west components of the records from the Oakland wharf (left) and a two-story office
building near Lake Merritt (right) in Oakland.
LOMA PRIETA (SANTA CRUZ MOUNTAINS) EARTHQUAKE 17 OCTOBER 1989 17:04 PDT
YERBA BUENA ISLAND
CHN 1.90 DEGACCELEROGRAM BANDPASS-FILTERED WITH RAMPS AT 05- 07 TO 23.0-25.0 Hz
58163-S1720-89296 01 112189 1718-QL89A163
LOMA PRIETA (SANTA CRUZ MOUNTAINS) EARTHQUAKE 1 7 OCTOBER 1 989 1 7:04 PDT
TREASURE ISLAND
CHN 1 90 DEGACCELEROGRAM BANDPASS-FILTERED WITH RAMPS AT .05-07 TO 23 0-25.0 Hz
581 17-S2598-89296 01 1 1 1789 21 14-QL89A117
RESPONSE SPECTRA PSV, PSA S SD -
DAMPING VALUES: 0, 2, 5. 10, 20%FREQUENCY (HZ)
FOURIER AMPLITUDE SPECTRUM: FS
10 1
-
III 1
1
j <1
1
Mill 1 |ii i i1 1 -
PSA (G) so (IN) y-; oo
1
\yfo
*"^<
1C
-
10
1-
\'\
iKIir
•i
1
i
\f,\
f/
i
A/iy/ nNjw\ vnlf WCh
'I s
kf\ A
X/fo" 1
i.i
XT
1
-
PERIOD (SEC)
RESPONSE SPECTRA: PSV, PSA & SDDAMPING VALUES: 0, 2, 5, 10, 20%
FREQUENCY (HZ)
10 I
FOURIER AMPLITUDE SPECTRUM: FS
[••I'\l
i in U 'i III 1
1
1'-
-:
-
°S* (G) so IN)
-
100
-\/fo
w^~\/
-
^ :
10
1
1
ft
i . i
/VK/Ti
Cif
\
i
i i > \ (Ill . i
11\
4f
-
°ER!00 (SEC)
Figure 9B. Response spectra for the east-west components of the records from Yerba Buena Island (left) and Treasure Island (right).

1990 THE LOMA PRIETA EARTHQUAKE OF 17 OCTOBER 1989 41
LOMA PRIETA (SANTA CRUZ MOUNTAINS) EARTHQUAKE 17 OCTOBER 1989 1704PDTCORRALITOSCHN 1 . 90 DEG
ACCELEROGRAM BANDPASS-FILTERED WITH RAMPS AT 05-07 TO 23 0-25.0 Hz
57007-S4809-89292.01 112189 1437-OL89A007
RESPONSE SPECTRA: PSV, PSA & SD FOURIER AMPLITUDE SPECTRUM FS
DAMPING VALUES: 0, 2, 5, 10, 20%
FREQUENCY (HZ)
1—I' ' ' '
I
—
r|
l l l l
\
—rq 1000
°ER!0D (SEC)
Figure 9C. Response spectra for the east-west component of the record
'rom Corralitos, a station in the epicentral area and within 1 km of the San
Andreas fault.
Processed Accelerograms from Stations
near the Cypress Structure
The records shown in Figure 7 from the Oakland wharf and the
ffice building near Lake Merritt have been digitized and processed
o obtain spectra and velocity and displacement time histories. The
pectra for these two stations, for the east-west component, are
hown in Figure 9A. The spectra have a peak at a period of about
.5 seconds. The wharf spectrum shows another peak at about 0.8
econds period. (The data for both the wharf and the Lake Merritt
milding are ground or reference channels, not structure channels.)
lie spectra from the Treasure Island and Yerba Buena Island records
ire shown in Figure 9B. The spectrum at Treasure Island looks
imilar to that at the wharf, but has lower peak values in the spectrum
.
Fhe spectrum at Yerba Buena Island, near Treasure Island but on
ock, is only about one-third that of the Treasure Island spectrum,
or reference, Figure 9C shows the response spectrum for the
-orralitos station in the epicentral area.
The preliminary displacement time histories computed from the
Treasure Island record are shown in Figure 10. They show a peak
iisplacement of over 9 cm in the east-west direction and nearly 4.5
m north-south. In other words, the displacement in the east-west
lirection was approximately double that in the north-south direction,
i he Cypress Structure is nearly north-south, so the larger east-west
Iisplacement occurred nearly transverse to the structure. The peak
Iisplacement at the wharf and the Lake Merritt stations is also about
'cm.
Anticipated Strong Shaking in the Bay Area
for a Future Magnitude 7 Earthquake
on the San Andreas Fault
near San Francisco
For the Loma Prieta earthquake, a zone within about 20 km of the
fault experienced the strongest shaking. This region, where the peak
acceleration was generally 40% g or greater, is indicated in Figure
1 1 . The region includes the heavily damaged coastal area from Santa
Cruz to Watsonville, where the strong shaking lasted for 10 seconds
or more. (Note that the Oakland/San Francisco area is approximately
90 km from the fault rupture.)
To gain some understanding of what shaking levels should be
anticipated if the same event were to happen farther north on the San
Andreas next to San Francisco, for example from Daly City north-
ward, the zone of strongest shaking from Figure 1 1 is overlain on the
San Andreas fault in Figure 12. The figure shows that all of the
northern San Francisco peninsula would be included in the zone of
strong shaking. Consideration of accelerations at distances beyond
20 km in Figure 1 1 suggests that, for the Daly City event being con-
sidered, rock accelerations in Oakland would be near 20-30% g, in
contrast to near 10% g in the Loma Prieta event. If the same
amplification occurs that occurred in the Loma Prieta event, the
motion in much of the flat-lying portion of Oakland is expected to
be 40-60% g.
Anticipated Strong Shaking in the Bay Area
for a Future Magnitude 7 Earthquake
on the Hayward Fault
To gain some understanding of what shaking levels should be
anticipated if an event like the Loma Prieta earthquake were to occur
on the Hayward fault, the zone of strongest shaking from Figure 1
1
is overlain on the northern section of the Hayward fault in Figure 13.
The strongly-shaken area would cover almost all of the East Bay if
this occurred. The long duration shaking that occurred in the
Capitola - Watsonville area (see Figure 3A, for example) could be
expected through much of the East Bay. The San Francisco penin-
sula would also be strongly shaken, with values of 20% g occurring
at rock sites, and significantly higher levels in soil areas. In this case,
accelerations in the flat-lying portions of Oakland would exceed the
0.64 g at Corralitos, but nonlinear and nearfield effects preclude even
a rough numerical estimate.
ACKNOWLEDGMENTSThe California Strong Motion Instrumentation Program
(CSMIP) extends its appreciation to the individuals and organi-
zations which have permitted and cooperated in the installation
of seismic strong-motion equipment on their property. The
authors would like to recognize the CSMIP technicians for their
diligence and care in installing and maintaining the stations and
in recovering records.
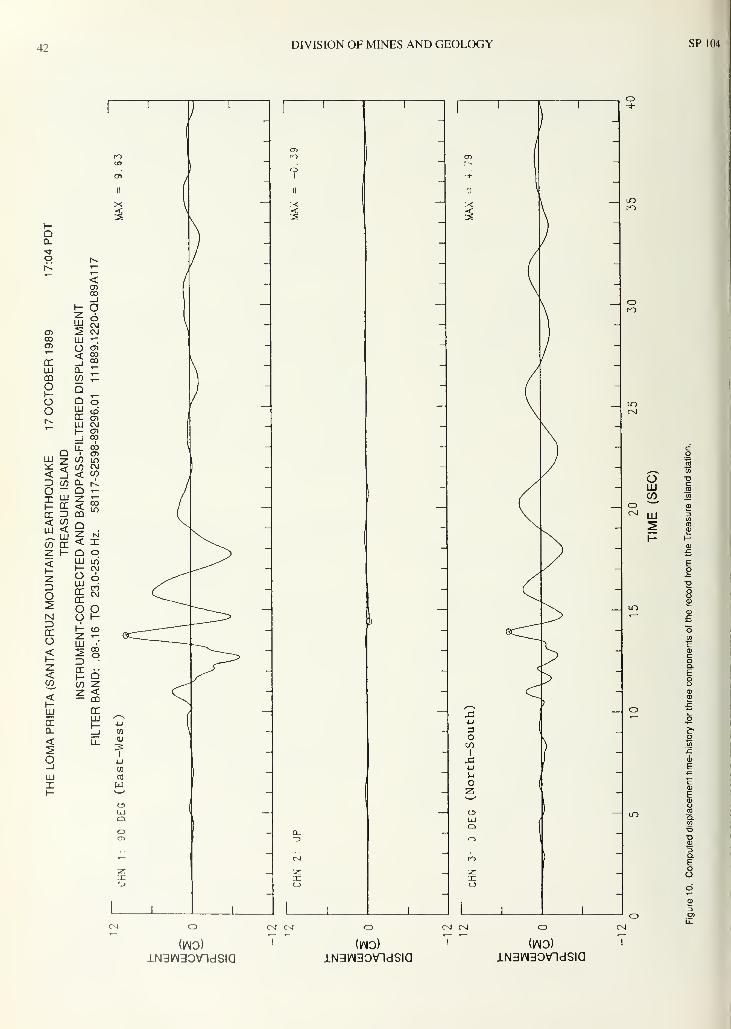
42 DIVISION OF MINES AND GEOLOGY SP104
QCL
o
x<
<CD00_l
1- oz:LUoC\J
CD 2 C\l
CO LU 1
—
O) O CD'l— < 00
cc _l 00
LU CL,—
CD CO ,_
o Qo Q oo LU CD
r-.CC CDLU C\J
Q LL
CDCO
obCD
LU 2 CO IT)
< 5CO<
C\J
CO3 CO CL C".
o —Cl
I LU z T-
h- CC < COin
DC 3 CD<LU
CO
CO<LUCC
Q< X
2: H Q o<i—
LU iri1— CNJ
23o
OLUCCCC
o
ococvj
OM o (-3cco LU
CD
<1- 3
00O2 CC< I- QCO co 2' '
-z. << COh-LU CC
CCLU
4->
a. _J en
< LL cu
1
2O 4-1
_iCO
LU cfl
X WH <>-/
<3:
IT)
o
csl
-
1
:
-
Q.
-
CNl
-
-
1 1 1
oCsl
oLUCO
LU
4-1
OC/3
I
x:i->
S-l
o53
o
1
Q.
Eo
o
EoO
(WO)lN31AI30\ndSIQ
(iaio)
iN3^30\ndsia(WO)
iN3i^i30\ndsia

THE LOMA PRIETA EARTHQUAKE OF 17 OCTOBER 1989 43
gure 1 1 . Strongly shaken zone (stippled area) for the 1 7 October 1 989, Loma Prieta earthquake (peak acceleration generally 0.4 g or greater).

44DIVISION OF MINES AND GEOLOGY SP1C
E X PLAN ATI ON
CDMG - SMIP STRONG " MOTION STATIONS
• Ground
Structure
KILOMETERS Z5
MILES 25
N
i
c^*
Figure 12. Strongly shaken zone anticipated from a magnitude 7 earthquake like the Loma Prieta event on the San Andreas Fault near San Francisco.

THE LOMA PRIETA EARTHQUAKE OF 17 OCTOBER 1989 45
EXPLANATION
CDMG - SMIP STRONG - MOTION STATIONS
• Ground
Structure
KILOMETERS 35
MILES 25
N
j
•
36.5° +122.5
120.75
37.5-+
120.75'
37' +
F re 13. Strongly shaken zone anticipated from a magnitude 7 earthquake like the Loma Prieta event on the Hayward Fault near Oakland
46 DIVISION OF MINES AND GEOLOGY SP10
REFERENCES
EERI (Earthquake Engineering Research Institute) Geoscience Reconnais-
sance Team, 1989, Geoscience Investigations of the Earthquake of 17
October 1989, near the Summit of Loma Prieta in the Southern Santa Cruz
Mountains: Borcherdt, J., and Donovan, N., (Coordinators), and Bolt, B.,
Boore, D., Celebi, M., Eberhart-Phillips, D., Hall, T., Hough, S., Shakal, A.,
and Sharp, R.
Goldman, H.B., 1969, Geology of San Francisco Bay in Geologic and
engineering aspects of San Francisco Bay fill: California Department of
Conservation, Division of Mines and Geology, Special Report 97.
Helley, E., Lajoie, K., Spangle, W., and Blair, M., 1979, Flatland Deposits of
the San Francisco Bay Region, California - Their geology and engineering
properties, and their importance to comprehensive planning: U.S.
Geological Survey, Professional Paper 943.
Joyner, W.B., and Boore, D.M., 1981 . Peak horizontal acceleration and
velocity from strong-motion records including records from the 1 979
Imperial Valley, California, earthquake: Bulletin of the Seismological
Society of America, v. 71 , p. 201 1 -2038.
Lee, C. H., 1969, Treasure Island fill, in Goldman, H. B„ ed., Geologic and
engineering aspects of San Francisco Bay fill: California Division of Mines
and Geology, Special Report 97, p. 69-72.
Lisowski, M., Prescott, W.H., Savage, J.C., and Svarc, J.L., 1990, A possible
geodetic anomaly observed prior to the Loma Prieta, California, earth-
quake: Geophysical Research Letters, v. 17, p. 1211-1214.
Maley, R., Costa, A., Ellis, F., Etheredge, E., Foote, L., Johnson, D.,
Porcella, R., Salsman, M., and Switzer, J., 1989, U.S. Geological Survey
strong-motion records from the Northern California (Loma Prieta)
earthquake of October 17, 1989: U.S. Geological Survey, Open File Repo
89-568.
NEIC (National Earthquake Information Center) ,1989, Preliminary determina
tion of epicenters: No. 42-89, U.S. Geological Survey.
Radbruch, D.H. (1957) Areal and engineering geology of the Oakland west
quadrangle, California: U.S. Geological Survey, Miscellaneous Geologic
Investigations Map I-239.
Shakal, A., Huang, M., Reichle, M., Ventura, C, Cao, T., Sherburne, R.,
Savage, M., Darragh, R., and Petersen, O, 1989, CSMIP strong-motion
records from the Santa Cruz Mountains (Loma Prieta), California
earthquake of 17 October 1989: California Department of Conservation,
Division of Mines and Geology, Report OSMS 89-06, 196 p.

PRELIMINARY ANALYSIS OF PROCESSED STRONG MOTION DATA
FROM THE LOMA PRIETA EARTHQUAKEBy
Michael S. Reichle 1
, Robert B. Darragh 1
, Moh-Jiann Huang 1
,
Tianqing Cao\ Ute R. Vetter 1
, and Anthony F. Shakal 1
INTRODUCTION
An extensive strong-motion data set from a magnitude 7 earth-
aake is unprecedented worldwide. The strong-motion data gener-
ed by the Loma Prieta earthquake will be the basis for the first
Uensive analyses ofsource mechanism, attenuation ofstrong motion,rfects of local site geology and response of structures for an earth-
jake of this magnitude. This paper discusses observed variations
peak ground motion with distance and possible factors contribut-
g to those variations. We use the analog accelerograms ( Shakal and
•'hers, 1989; Maley and others, 1989) and the initial 26 digitized and
ocessed ground-response records (CSMIP, 1989; Huang and oth-
s, 1990) in this discussion. Obviously, these are complicated topics
id many of our initial observations may be modified as more
celerograms are digitized and incorporated into the analyses.
PEAK GROUND ACCELERATIONOf the 93 CSMIP stations and 38 U.S. Geological Survey stations
iggered by the Loma Prieta earthquake (see Shakal and others,
>89; Shakal and others, this volume; and Maley and others, 1989),
7 are from ground response (free field) stations or stations located
buildings with two stories or less. Peak ground acceleration data
om these 77 stations (listed in the referenced reports) are plotted in
gure 1 as a function of distance from the aftershock zone. Only
ations within 100 km are plotted. As one would expect, there is
>nsiderable scatter in the peak acceleration data. Also shown in the
jure are the expected median, median -1 standard deviation, and
edian + 1 , +2 and +3 standard deviation peak acceleration curves for
noment magnitude 6.9 earthquake using the relationships obtained
i Joyner and Boore ( 1 98 1 ). Clearly, the data do not cluster about
e median curve, but lie principally above it. Nine of the 77 peak
ilues fall above the median +2 standard deviation peak acceleration
irve. This should occur only 2.5% of the time if the data had been
awn from a population with the distribution assumed in the Joyner-
aore regression model.
In an attempt to further understand the factors contributing to the
scatter, we have classified the data by the general geology beneath
each accelerograph site. The three divisions are rock (solid dots),
alluvium or soil (open circles) and bay mud (x's). The distribution
of younger bay mud used is that of Helley and others (1979) and
Goldman (1969). Of the nine peak values that lie above the median
+2 standard deviation peak acceleration curve, five are from bay mudsites, two from alluvium sites and two from rock sites. This simple
classification does not explain the higher-than-expected peak accel-
erations even though there is some slight tendency for rock sites to
record lower peak accelerations than alluvium sites at comparable
distances, and for bay mud sites to record higher peak accelerations
than alluvium sites at comparable distances. Also, the data do not
cluster into easily separable groups using this simple scheme. Per-
haps a more realistic classification, incorporating thicknesses of bay
mud and alluvium as well as seismic velocities, would yield a clearer
picture of the effects of local geology on peak acceleration.
PEAK GROUND VELOCITY
To date, 26 ground response accelerograms have been digitized and
processed to velocity as well as displacement time histories as well
as spectra (CSMIP, 1989; Huang and others, 1990). Table 1 lists the
peak velocity and displacement values obtained from the accelero-
grams recorded at those stations.
Figure 2 is a plot of peak ground velocity as a function of distance
for these data. The classification of site geology into rock, alluvium
and bay mud, as well as the symbols are the same as in Figure 1 . The
peak velocities, like the peak accelerations, are generally higher than
would be predicted by the standard Joyner-Boore ( 198 1 ) regression.
Only three points lie at or below the median rock velocity curve. Four
data points (two bay mud sites, one alluvium site and one rock site)
lie above the median +2 standard deviation peak velocity curve for
soils. However, unlike the peak acceleration data, the available peak
velocity data do seem to clearly divide into two groups based on site
California Department of Conservation, Division of Mines and Geology, Strong Motion Instrumentation Program
47

48 DIVISION OF MINES AND GEOLOGY SP104
geology. In general, the peak velocity recorded on rock sites is lower
than the peak velocity recorded on alluvium and bay mud sites at com-
parable distances. Also, the peak velocity recorded on rock sites
appears to attenuate less rapidly with distance than that predicted by
the Joyner-Boore regression. This may be due to the increased contri-
bution of long-period surface wave energy to the ground motion with
increasing distance from the fault rupture. Remarkably, the alluvium
and bay mud data, taken as one group, show no apparent attenuation
of peak velocity for distances between 9 and 80 km! Of course, this
preliminary observation may change as more data are processed.
PEAK GROUND DISPLACEMENT
Figure 3 shows a plot of peak ground displacement as a function of
distance for the same 26 stations as in Figure 2. The symbols and the
grouping by geology are the same as in Figures 1 and 2. The scatter
in peak displacement is the largest at distances between 25 and 35 km.
In that distance range, stations Hollister and Agnew, located on
alluvium, had peak displacements of 30 and 1 8 cm, respectively. In
contrast, Gilroy stations #6 and #7, located on or near rock, had peak
1.0r—
O)
co
cai_
<D
o 0.1
oo<
(0
<x>
CL
0.01
x Bay mud
o Alluvium
• Rock
\
J L I I J I 1_L
10
Distance (km)
100
Figure 1 Peak horizontal acceleration versus distance. Distance measured from the surface trace of the San Andreas fault above the Loma Prieta aftershock zone
Largest of the two horizontal components is plotted Solid line is the median curve of Joyner and Boore (1981) for a moment magnitude 6.9 earthquake. Dashed lint
indicate median -1, +1, +2 and +3 standard deviations. Solid dots indicate stations located on (or near) rock; open circles, on alluvium; x's, on bay mud.

11990 THE LOMA PRIETA EARTHQUAKE OF 1 7 OCTOBER 1 989 49
displacements between 3 and 5 cm. Displacements measured at sites surface geology. This inference is not surprising as the longer periods
located on either rock or alluvium/bay mud do not show significant that dominate the displacement time histories sense deeper structure
attenuation in the distance range between 15 and 80 km. The largest to a greater extent than the shorter periods dominant in the velocity
'values obtained thus far are from stations located on alluvium rather or acceleration time histories.
than bay mud and probably result from factors other than simple near-
i
100.0 z \ \ \: \ \ \
> m \ \o ^P oo \ ^
\,o ° \ \o 7% ° \ \E
• \ \ \o \ \ x
• \ \"o \ ^© 10.0> \ *\D \ \C _ \3 \o — \1— \(5 \CO x Bay mud \0)
Q_o Alluvium ^
• Rock
1.0«
i i i i i i i i 1 i i i i i i i i 1
10 100
Distance (km)
Figure 2. Peak ho rizontal velocity versus distance. Curves show Joyner-Boore curves as in Figure 1 for soil sites, symbols are the same as in Figure 1
.

50 DIVISION OF MINES AND GEOLOGY SPIO^
Table 1
Peak Ground Acceleration, Peak Ground Velocity and Peak Ground Displacement
Obtained from 26 Processed Accelerograms Recording the Loma Prieta Earthquake
Station (1. D. Number) Geology Distance 1 Peak Horizontal Peak Velocity Peak Displacement
(km) Acceleration (g) (cm/sec) (cm)
Corralitos (57007) rock 1 0.64 55.2 11.5
Saratoga (58235) alluvium 9 0.33 43.6 28.0
Capitola (47125) alluvium 14 0.54 36.1 11.0
Gavilan College (47006) rock 15 0.37 28.9 5.8
Gilroy #1 (47379) rock 15 0.50 33.8 6.5
Gilroy #2 (47380) alluvium 16 0.37 39.2 10.9
UCSC-Lick Lab (58135) rock 16 0.47 21.2 6.8
Gilroy - 2-story building (57476) alluvium 16 0.28 43.5 9.7
Gilroy #3 (47381) alluvium 18 0.55 43.8 14.3
Gilroy #4 (57382) alluvium 20 0.42 39.1 8.5
Gilroy #6 (57383) rock 24 0.17 13.9 5.0
Agnew (57066) alluvium 25 0.17 30.9 18.1
Gilroy #7 (57425) rock 28 0.33 16.6 3.4
Hollister (47524) alluvium 33 0.38 62.8 30.2
Foster City (58375) bay mud 44 0.29 45.4 14.7
SFO (58223) bay mud 66 0.33 29.3 5.9
SF-Diamond Hgts (58130) rock 73 0.12 14.3 4.3
Oakland- 2-story office bldg. (58224) alluvium 73 0.26 37.9 8.1
Oakland-wharf (58472) bay mud 76 0.29 42.3 9.9
SF-Rincon Hill (58151) rock 76 0.09 11.6 4.9
Yerba Buena Island (58163) rock 77 0.06 4.7 4.1
SF-Telegraph Hill (58133) rock 78 0.08 9.6 2.8
SF-Pacific Heights (58131) rock 78 0.06 14.3 4.9
Treasure Island (58117) bay mud 79 0.16 3.4 12.2
SF-Presidio (58222) rock 79 0.21 33.5 4.1
SF-Cliff House (58132) rock 80 0.11 21.0 6.5
'Distance to the nearest point on the fault inferred from the aftershock distribution as given in Shakal and others (1989).

99(1 THE LOMA PRIETA EARTHQUAKE OF 17 OCTOBER 1989 51
DISPLACEMENT POLARIZATION
Particle motion diagrams for the horizontal ground displacements
lave been plotted to examine the polarization of ground motion at
/arious stations. The direction of polarization is defined as the
referred direction of particle motion. An example of ground motion
>olarization for this earthquake is shown in Figure 4, which shows the
torizontal ground displacement obtained from the Yerba Buena ac-
celerogram. At this station, the largest excursions are fairly strongly
>olarized at an azimuth of 070°, approximately transverse to the
picenter-station ray. The polarizations obtained from the displace-
ment data are plotted in Figure 5 for the 26 stations considered above.
A circle indicates that there is little or no preferred polarization
direction in the particle motion diagram for the station. Figure 5
shows that many signals are polarized in the transverse direction to the
local ray direction. Since transverse polarization is a characteristic of
SH or Love waves we infer that the predominant ground motion at
these stations was composed principally of these wave types. Vari-
ations from the transverse direction of less than 20° occur at stations
in the San Francisco - Oakland area with a tendency for the polariza-
tion to rotate clockwise as station location moves from west to east.
Exceptions to transverse polarization are at the Santa Cruz, and the San
Francisco Airport stations where the polarization is approximately
isotropic, and the stations at Agnew and Capitola that are approxi-
mately radially polarized.
100 r-
Eo
c
E<D
Q.
CD
0-x Bay mud
o Soil
• Rock
o oo
%•
i i i i i
10
Distance (km)
i i i I
100
Figure 3. Peak horizontal displacement versus distance. Symbols are the same as in Figure 1.
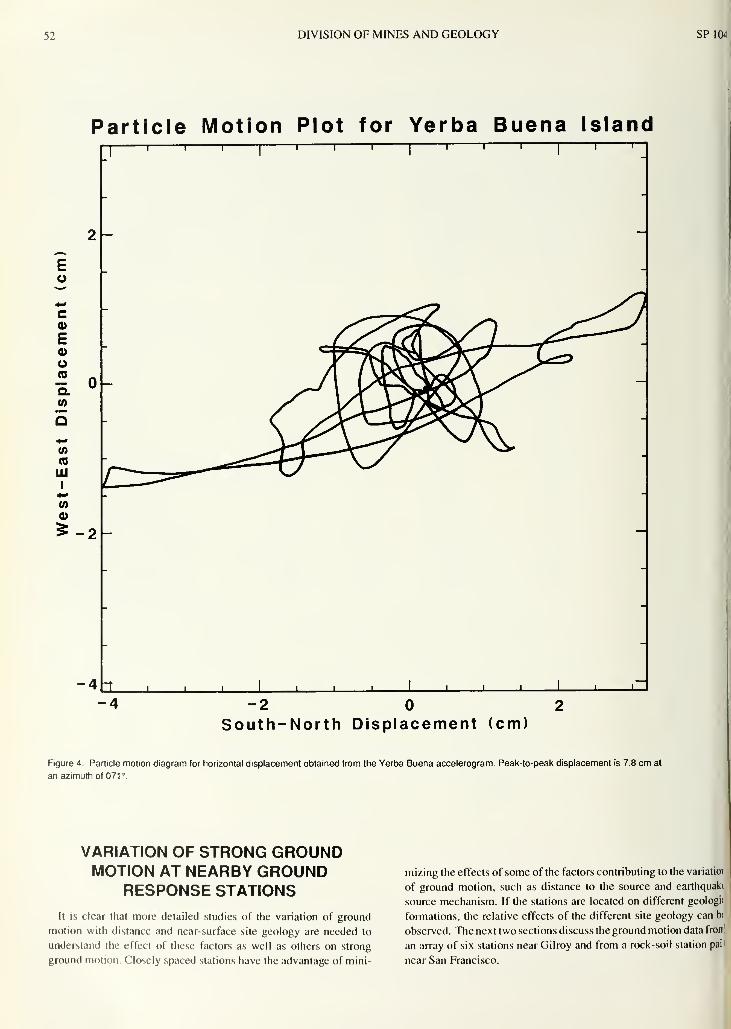
52 DIVISION OF MINES AND GEOLOGY SP104
Particle Motion Plot for Yerba Buena Island
-2 2
South-North Displacement (cm)
Figure 4. Particle motion diagram for horizontal displacement obtained from the Yerba Buena accelerogram. Peak-to-peak displacement is 7.8 cm at
an azimuth of 071°.
VARIATION OF STRONG GROUNDMOTION AT NEARBY GROUND
RESPONSE STATIONS
It is clear that more detailed studies of the variation of ground
motion with distance and near-surface site geology are needed to
understand the effect of these factors as well as others on strong
ground motion. Closely spaced stations have the advantage of mini-
mizing the effects of some of the factors contributing to the variatior
of ground motion, such as distance to the source and earthquakt
source mechanism. If the stations are located on different geologii
formations, the relative effects of the different site geology can bt
observed. The next two sections discuss the ground motion data frorr
an array of six stations near Gilroy and from a rock-soil station pai
near San Francisco.

THE LOMA PRIETA EARTHQUAKE OF 17 OCTOBER 1989 53
10cm
O-Peak
JO Km
30 Mi
+
121°
+ 37°
+
F: re 5. Measured polarizations of horizontal displacements for processed SMIP accelerograms. Direction of line indicates azimuth of polarization; a circle indicates
v< weak or no obvious polarization direction. Length of line is proportional to peak displacement. Line is centered at station.
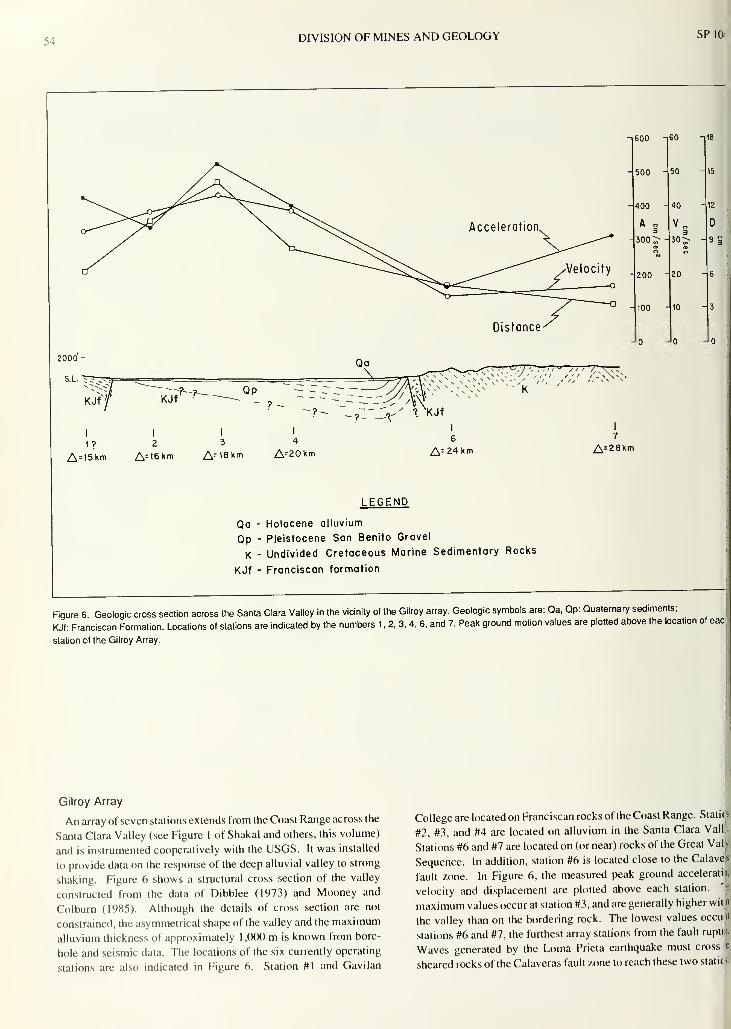
54 DIVISION OF MINES AND GEOLOGY SP10
600 n60 —118
- 500
400
Distance-
A „3
300^
200
100
J
2000 -
S.L. "?
kS* Vj??~ ?-
-?"JV 7-
KJf
i i ii
1? 2 3 4
A=15km A=16km A: 18km A:20km
I
6
A=24km A=28km
LEGEND
Qa - Holocene alluvium
Qp - Pleistocene San Benito Gravel
K - Undivided Cretaceous Marine Sedimentary Rocks
KJf - Franciscan formation
-Jo
Figure 6 Geologic cross section across the Santa Clara Valley in the vicinity of the Gilroy array. Geologic symbols are: Qa, Qp: Quaternary sediments;
KJf: Franciscan Formation. Locations of stations are indicated by the numbers 1 , 2. 3, 4, 6, and 7. Peak ground motion values are plotted above the location of eac
station of the Gilroy Array.
Gilroy Array
An array of seven stations extends from the Coast Range across the
Santa Clara Valley (see Figure 1 of Shakal and others, this volume)
and is instrumented cooperatively with the USGS. It was installed
to provide data on the response of the deep alluvial valley to strong
shaking. Figure 6 shows a structural cross section of the valley
constructed from the data of Dibblee (1973) and Mooney and
Colburn (1985). Although the details of cross section are not
constrained, the asymmetrical shape of the valley and the maximum
alluvium thickness of approximately 1,000 m is known from bore-
hole and seismic data. The locations of the six currently operating
stations are also indicated in Figure 6. Station #1 and Gavilan
College are located on Franciscan rocks of the Coast Range. Static
#2, #3, and #4 are located on alluvium in the Santa Clara Vail
Stations #6 and #7 are located on (or near) rocks of the Great Valy
Sequence. In addition, station #6 is located close to the Calave.s
fault zone. In Figure 6, the measured peak ground accelerate,
velocity and displacement are plotted above each station,
maximum values occur at station #3, and are generally higher witfl
the valley than on the bordering rock. The lowest values occu.it
stations #6 and #7, the furthest array stations from the fault rupti:-
Waves generated by the Loma Prieta earthquake must cross je
sheared rocks of the Calaveras fault zone to reach these two static*

990 THE LOMA PRIETA EARTHQUAKE OF 17 OCTOBER 1989 55
100
oQ)
CO
<=10
o3
Q.
E<
10-v
Frequency1 0.10
5% damped response spectra
Oakland Wharf
ure Island
0.10 1
Period (sec)
10
gure 7. 5% damped response spectra from the Yerba Buena Island (090° component), Treasure Island (090' component) and Oakland Outer Harbor Wharf (035'
imponent) acceleration, velocity and displacement waveforms. Treasure and Yerba Buena islands data are plotted as solid lines, Oakland wharf as dashed lines.
srba Buena - Treasure Island Stations
U The stations at Yerba Buena Island and Treasure Island were
stalled specifically as a rock (Yerba Buena Island) - soil (Treasure
land) pair. Treasure Island is a manmade island, built of fill on a
iallow sand spit north of Yerba Buena Island. This is the first
,! gnificant data recorded by this pair of stations. Amplification of
<3 ^ak acceleration, velocity and displacement recorded at the soil site
i >mpared to the rock site are 2.4, 2.3 and 3.0, respectively, for the
oss
!|.st-west component of motion (largest horizontal component). The
ilative amplification of ground motion at Treasure Island can also
be seen in the response spectra, shown in Figure 7. The shapes of
the Treasure Island and Yerba Buena Island response spectra (5%
damped) are similar. The Treasure Island spectrum is amplified by
a factor of about four near a period of 2 seconds and the amplifica-
tion decreases toward both longer and shorter periods. Also shown
in Figure 7 is the response spectrum for the Oakland Wharf station
(component 035°) located on fill deposited on a thin layer of bay mud
over alluvium. The long-period spectral level is similar to that at
Treasure Island, but the short-period spectral level is higher, also
reflected in the larger peak acceleration recorded at the Oakland
Wharf.

56 DIVISION OF MINES AND GEOLOGY SP104
Figure 8. Comparison of Treasure Island and Oakland Outer Harbor Wharf acceleration, velocity and displacement waveforms. East-west components are plotted.
Treasure Island data are plotted as black lines, Oakland Wharf as colored lines.
One interesting feature in the Treasure Island accelerogram,
shown in Figure 8, is the sharp decrease in acceleration at about 15
seconds after the start of the record. Following that decrease, the
accelerations appear to be considerably subdued, relative to the earlier
part of the record. Significant liquefaction occurred at Treasure
Island, and this feature in the accelerogram may reflect the effect of
liquefaction on ground motion. A comparison with the time histories
rotated to the east-west direction at the Oakland Wharf only 5.2 km
to the east of Treasure Island is shown in Figure 8. The east compo-
nents of acceleration, velocity and displacement for each station are
shown. For the first 15 seconds of the record, the waveforms ar
remarkably similar, with the Oakland Wharf records having some
what larger amplitudes. Unlike the ground motion at Treasure Islam
the ground motion at Oakland Wharf does not show a significant dro
in acceleration amplitudes after the initial 15 seconds nor does lonj
period motion dominate late in the record. At Treasure Islanr.
following the presumed onset of liquefaction, the acceleration quickl
falls and remains at rather low levels. Afterward, longer periods, see
in the displacement record, dominate the motion.

1990 THE LOMA PRIETA EARTHQUAKE OF 17 OCTOBER 1989 57
DISCUSSION
This paper has considered some aspects of the processed strong-
notion data from the Loma Prieta earthquake, concentrating on the
/ariability of strong ground motion with distance and with site
>eology. Both site geology and distance from the fault rupture have
in important effect on the peak values of strong ground shaking
ecorded from the earthquake. Peak values of strong ground shaking
end to be amplified at alluvium and bay mud sites compared to nearby
ock sites. The amount of amplification is generally frequency de-
>endent with the smallest effect at high frequencies (> 5 Hz) for the
oil sites (mainly deep alluvium) discussed in this paper.
Peak values of acceleration, velocity and displacement decrease, in
.eneral, with distance but not as rapidly for this earthquake as has
been observed in previous earthquakes. Nearly 75 km from the fault
rupture, peak ground acceleration values range from approximately
50 to 280 cm/sec/sec. These values are all greater than the median
predicted for this distance. For both peak ground velocity and dis-
placement the peak values of 63 cm/sec and 30 cm are observed at
Hollister, an alluvial site 33 km from the fault rupture. These peak
values have been exceeded in other earthquakes but only at signifi-
cantly shorter distances from the fault rupture. The computed
displacements also show strong transverse polarization in many
cases. For example, in the San Francisco-Oakland area peak east-
west displacements are two to three times as large as the peak north-
south displacements.
ACKNOWLEDGMENTSThe California Strong Motion Instrumentation Program (CSMIP) extends its appreciation to the individu-
als and organizations which have permitted and cooperated in the installation ofseismic strong motion equip-
ment on their property. The authors would like to recognize the CSMIP technicians for their diligence and
care in installing and maintaining the stations and in recovering records.
REFERENCES
ilifornia Strong Motion Instrumentation Program, 1989. Plots of processed
data for the interim set of 14 records from the Santa Cruz Mountains
(Loma Prieta) earthquake of October 17, 1989: California Department of
Conservation, Division of Mines and Geology, Report OSMS 89-08, 142 p.
bblee, T.W., Jr., 1973, Preliminary geologic maps of the Gilroy Hot Springs
quadrangle, the Gilroy quadrangle, the Mt. Sizer quadrangle, the Morgan
Hill quadrangle, Santa Clara County, California, and the Mt. Madonna
quadrangle, Santa Clara and Santa Cruz counties, California:
U.S. Geological Survey Open-File Report 73-59, scale 1 :24,000.
>ldman, H.B., 1969, Geology of San Francisco Bay in Geologic and
engineering aspects of San Francisco Bay fill: California Department Con-
servation, Division of Mines and Geology Special Report 97, p. 9-29.
Hey, E. J., Lajoie, K. R., Spangle, W. E., and Blair, M. L, 1979, Flatland
Deposits of the San Francisco Bay region, California - their geology and
engineering properties, and their importance to comprehensive planning:
U.S. Geological Survey Professional Paper 943, 88 p.
ang, M.J., Cao, T.Q., Verier, U.R., and Shakal, A.F., 1990, Second interim
set of CSMIP processed strong motion records from the Santa Cruz
Mountains (Loma Prieta) earthquake of October 17, 1989: California
Department of Conservation, Division of Mines and Geology. Report
OSMS 90-01, 201 p.
Joyner, W.B. and Boore, DM., 1981, Peak horizontal acceleration and
velocity from strong-motion records including records from the 1979
Imperial Valley, California, earthquake: Bulletin of the Seismological
Society of America, v. 71 , p. 201 1 -2038.
Maley, R., Acosta, A., Ellis, F., Etheredge, E., Foote. L., Johnson, D.,
Porcella, R.. Salsman, M., and Switzer. J., 1989, U.S. Geological Survey
strong-motion records from the Northern California (Loma Prieta)
earthquake of October 17, 1989: U. S. Geological Survey Open-File
Report 89-568, 85 p.
Mooney, W.D., and Colburn, R.H., 1985, A seismic-refraction profile across
the San Andreas, Sargent and Caleveras faults, west-central California:
Bulletin of the Seismological Society of America, v. 75, p. 175-191.
Shakal, A., Huang, M., Reichle, M. S., Ventura, C, Cao, T., Sherburne, R..
Savage, M.. Darragh. R., and Petersen, C, 1989, CSMIP strong-motion
records from the Santa Cruz Mountains (Loma Prieta), California
earthquake of 1 7 October 1989: California Department of Conservation,
Division of Mines and Geology. Report OSMS 89-06. 196 p.
Shakal, A F., DeLisle, M. J., Reichle, M. S., and Darragh, R. B.. 1990, Strong
ground shaking from the Loma Prieta earthquake of 17 October 1989 and
its relation to near surface geology in the Oakland area: this volume,
p. 29-46.


LANDSLIDE FEATURES AND OTHER COSEISMIC FISSURES
TRIGGERED BY THE LOMA PRIETA EARTHQUAKE,
CENTRAL SANTA CRUZ MOUNTAINS, CALIFORNIABy
Thomas E. Spittler1
, Edwin L. Harp2, David K. Keefer2
,
Raymond C. Wilson 2, and Robert H. Sydnor 3
ABSTRACTExtensive landslides and coseismic fissures formed in a broad region in the central Santa Cruz Mountains
during the Ms7.1 Loma Prieta, California earthquake of October 17, 1989. Hundreds of homes, a major state
highway, and many county and private roads were damaged by earthquake-triggered landslides and surficial
ground fissures in the epicentral area.
The origins of the coseismic fissures are complex and no single explanation can account for all the observed
ground cracks. The majority of fissures are apparently related to landslides mobilized by intense seismic
shaking. Some fissures may be related to tectonic uplift and extension of the hanging-wall block due to fault
movement at depth. Detailed mapping of a 3,500 ha area with the highest density of surface fractures allows
for the discrimination of causes for some fissures, but not all.
The landslides were triggered by strong ground motion up to 0.47 g vertical and 0.64 g horizontal peak
acceleration as measured at the Corralitos CSMIP station located only 7 km from the epicenter. The earthquake
occurred late in a dry autumn following two years of drought. Had the earthquake occurred during the winter or
spring following several wet years, seismically-induced landslides probably would have been more widespread
and would have caused substantially more damage.
INTRODUCTION
Earthquake-triggered landslides were a major effect of the Loma"ieta earthquake. A regional reconnaissance by the U. S. Geological
jrvey (USGS) determined that earthquake-triggered landslides
xurred throughout an area of nearly 14,000 km 2(Plafker and
alloway, 1989, p. 23). The highest concentration of landslides trig-
:red by the earthquake was in Santa Cruz County (Manson and
hers, 1990). Teams ofgeologists with the California Department' Conservation, Division of Mines and Geology (DMG) and the
SGS began a cooperative systematic reconnaissance of the earth-
lake-triggered landslides in the San Francisco Bay Area immedi-
ely following the Loma Prieta earthquake. This reconnaissance
:fined an area near the San Andreas fault in the developed portion
the epicentral region of approximately 3,500 hectares (ha) (Figure
> in which many of the largest landslides and most of the coseismic
?sures formed (Spittler and otters, 1990). The landslides and other
ssures destroyed or damaged more than 100 residential structures
the mapped area and may pose further hazards from renewed
ovement in response to winter rainfall and consequent high local
ound-water levels.
Following the initial survey, DMG and USGS geologists, in coop-
eration with geologists from other public and private agencies,
prepared a set of maps of the area most impacted by landslides and
fissures. The maps are at a scale of 1:4,800 and show observed
surface cracks and compressional ridges that formed during the
October 17, 1989 earthquake (Spittler and Harp, 1990). The large
landslides and coseismic fissures are most abundant on ridge crests
and slopes on the southwestern flank of the Santa Cruz Mountains,
along and below the ridge that separates Santa Cruz County from
Santa Clara County. The features are most prevalent along Summit
Road between the intersections with Highway 17 and with Highland
Way. This area is southwest of the surface trend of the San Andreas
fault and northwest of the epicenter of the Loma Prieta earthquake,
and is located on the upthrown block.
The strong ground shaking that accompanied the Loma Prieta
earthquake was measured at the Corralitos California Strong Motion
Intrumentation Program station 7 km from the epicenter. Accelera-
tions were as strong as 47 percent of the acceleration of gravity in the
vertical direction and 64 percent of gravity in a horizontal direction
(Shakal and others, this volume). These ground motions are well in
excess of those required to trigger the numerous landslides in the
Santa Cruz Mountains (Wilson and Keefer, 1985).
California Department of Conservation, Division of Mines and Geology, Environmental Protection ProgramI. S. Geological Survey, Menlo ParkCalifornia Department of Conservation, Division of Mines and Geology, Geologic Hazards Assessment Program
59

60 DIVISION OF MINES AND GEOLOGY SP104
LEXINGTON RESERVIORSM IP STATION
SUMMIT ROADLANDSLIDE AREA
5 km
DETAILED V?>MAPPING AREAX
a LOMA PRIETA\ ** 1155.m.
%MAJOR LANDSLIDECLOSED HWY 17
SANTACRUZSMIPSTATION
W&, CORRALITOsXy& SMIP V \m^ STATION\
!IK1|BI lit,%SW/ Ms 7 - 1 ::; ^s.^*F' EPICENTER *VVV^, 17 Oct 89 >X
CAPITOLA •:
SMIP STATIONFigure 1 . Index map of the epicentral
area. Hachures indicate 3,500 ha area
where detailed mapping occurred. Stippli
area indicates the approximate region of
widespread landsliding and ground
cracking due to the earthquake. Bullet
symbols indicate station locations of
DMG's Strong Motion Instrumentation
Program (SMIP).
The direct and indirect costs of the many earthquake-triggered
landslides cannot yet be adequately determined. In addition to the
direct losses of personal property caused by the landslides, State
Highway 1 7 (Photo 1 ) was closed for 33 days, costing the California
Department ofTransportation (Caltrans) approximately $ 1 .8 million
to repair. This highway normally carries 60,000 vehicles per day. In-
direct costs to commuters and businesses during the time the high-
way was closed were also greatly increased.
SAN ANDREAS SETTING
The right-lateral strike-slip San Andreas fault slices through Cali-
fornia for over 900 km from Cape Mendocino to the Gulf of Califor-
nia, separating the Pacific tectonic plate west of the fault from the
North American plate to the east. The Pacific plate is moving north-
west at approxomately 4.8 cm/yr past the North American plate
( DeMets and others, 1 987). Along most of its length, the trend of the
San Andreas fault follows a continuous arc and the fault plane is
nearly vertical. In the epicentral area of the Loma Prieta earthquake
in the central Santa Cru/. Mountains, the fault makes a 7 degree bend
to the left from the regional arc. Compression along this bend has re-
sulted in a southwest dip and a reverse component of movementalong the fault. The reverse thrusting accompanying earthquakes in
this area is the cause of the rapid uplift of the mountains. The LomaPrieta earthquake was a part of this process.
Although no through-going surface fault rupture was observe
along the San Andreas fault as a result of the Loma Prieta earthquak
(Hart and others, this volume; U. S. Geological Survey Staff, 1990
seismic records from the earthquake and its aftershocks (Plafker an
Galloway, 1989) and geodetic measurements taken before and aft<
the earthquake (Lisowski and others, 1990) define a rupture plar
that dips 70 degrees to the southwest and extends from a depth of
km to 1 8 km along a 37 km reach of the fault. Total displacemer
across this rupture surface was about 1 .6 ± 0.3 m right-lateral strik
slip and 1.2 ± 0.3 m reverse dip slip (Lisowski and others, 1990)
GEOLOGY, GEOMORPHOLOGYAND CLIMATE
The Santa Cruz Mountains are a 1 20 km-long, 20 km-wide moui.
tain range that separates San Francisco Bay and the Santa Cla
Valley from the Pacific Ocean and Monterey Bay. The Santa Cru
Mountains are highest in the southern portion, adjacent to tl;
southern part of the bend in the San Andreas fault, and reach
maximum elevation of 1,155 m at Loma Prieta, which was on tl
downthrown block of this earthquake.
Uplift of the Santa Cruz Mountains along folds and faults h
exposed marine sandstones, mudstones, shales, and both extrusi'
and intrusive basaltic volcanic rocks. Rocks exposed west of tl
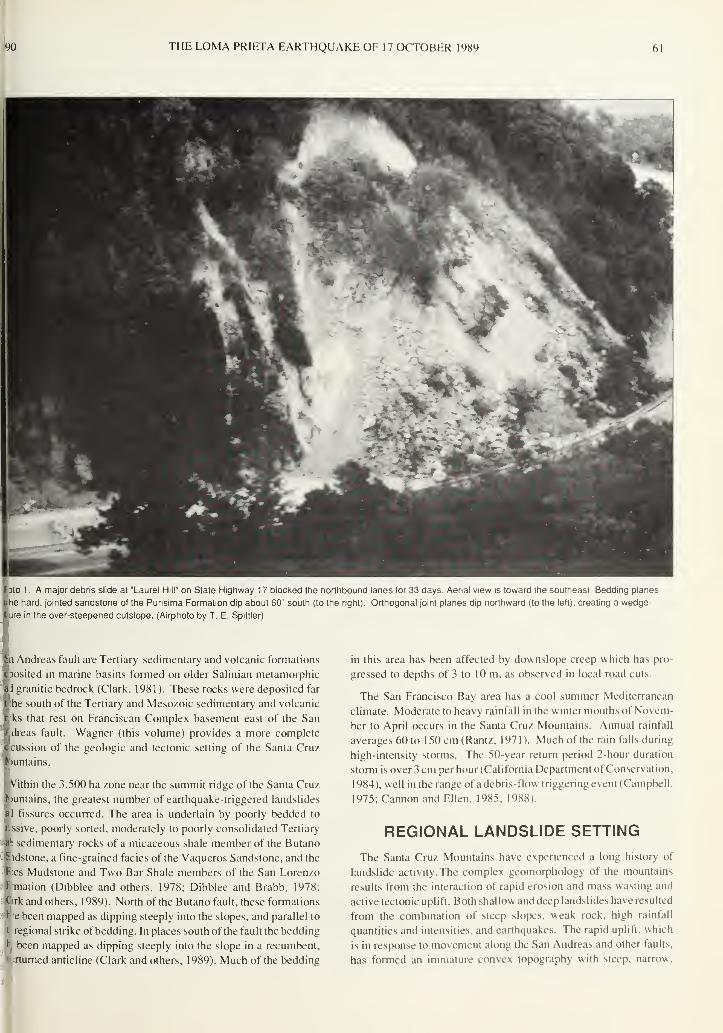
THE LOMA PRIETA EARTHQUAKE OF 17 OCTOBER 1989
FDto 1. A major debris slide at "Laurel Hill" on State Highway 17 blocked the northbound lanes for 33 days. Aerial view is toward the southeast. Bedding planes
fche hard, jointed sandstone of the Punsima Formation dip about 60' south (to the right). Orthogonal joint planes dip northward (to the left), creating a wedge-
lure in the over-steepened cutslope. (Airphoto by T. E. Spiftler)
Andreas fault are Tertiary sedimentary and volcanic formations
osited in marine basins formed on older Salinian metamorphic
_ granitic bedrock (Clark, 1981 ). These rocks were deposited far
the south of the Tertiary and Mesozoic sedimentary and volcanic
•ks that rest on Franciscan Complex basement east of the San
dreas fault. Wagner (this volume) provides a more complete
cussion of the geologic and tectonic setting of the Santa Cruz
)untains.
t Vithin the 3,500 ha zone near the summit ridge of the Santa Cruz
fmntains. the greatest number of earthquake-triggered landslides
1 fissures occurred. The area is underlain by poorly bedded to
Issive, poorly sorted, moderately to poorly consolidated Tertiary
# sedimentary rocks of a micaceous shale member of the Butano
hdstone, a fine-grained fades of the Vaqueros Sandstone, and the
R:es Mudstone and Two Bar Shale members of the San Lorenzo
|-mation (Dibblee and others, 1978; Dibblee and Brabb, 1978;
Cirk and others, 1 989). North of the Butano fault, these formations
'H'e been mapped as dipping steeply into the slopes, and parallel to
t regional strike of bedding. In places south of the fault the bedding
f been mapped as dipping steeply into the slope in a recumbent,
Cxturned anticline (Clark and others, 1989). Much of the bedding
in this area has been affected by dovvnslope creep which has pro-
gressed to depths of 3 to 10 m, as observed in local road cuts.
The San Francisco Bay area has a cool summer Mediterranean
climate. Moderate to heavy rainfall in the winter months of Novem-
ber to April occurs in the Santa Cruz Mountains. Annual rainfall
averages 60 to 150 cm (Rantz, 1971 ). Much of the rain falls during
high-intensity storms. The 50-year return period 2-hour duration
storm is over 3 cm per hour (California Department of Conservation.
1 984), well in the range of a debris-flow triggering event (Campbell.
1975; Cannon and Ellen. 1985, 1988).
REGIONAL LANDSLIDE SETTING
The Santa Cruz Mountains have experienced a long history of
landslide activity. The complex geomorphology of the mountains
results from the interaction of rapid erosion and mass wasting and
active tectonic uplift. Both shallow and deep landslides have resulted
from the combination of steep slopes, weak rock, high rainfall
quantities and intensities, and earthquakes. The rapid uplift, which
is in response to movement along the San Andreas and other faults,
has formed an immature convex topography with steep, narrow.
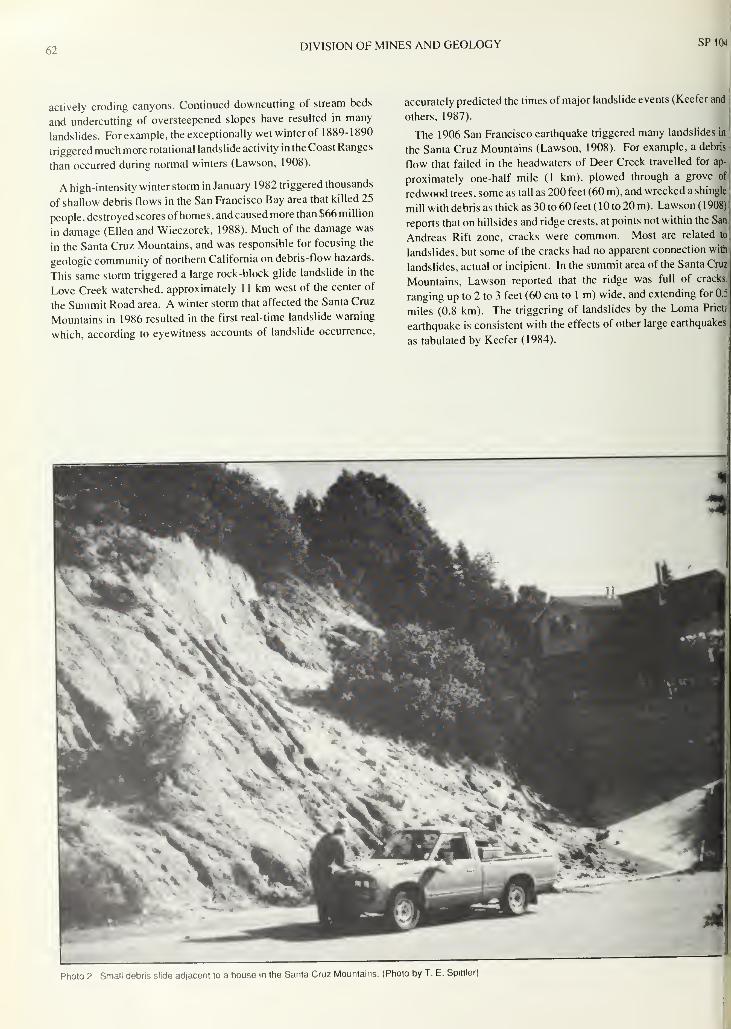
62 DIVISION OF MINES AND GEOLOGY SP104
actively eroding canyons. Continued downcutting of stream beds
and undercutting of oversteepened slopes have resulted in many
landslides. For example, the exceptionally wet winter of 1 889- 1 890
triggered much more rotational landslide activity in the Coast Ranges
than occurred during normal winters (Lawson, 1908).
A high-intensity winter storm in January 1 982 triggered thousands
of shallow debris flows in the San Francisco Bay area that killed 25
people, destroyed scores ofhomes, and caused more than $66 million
in damage (Ellen and Wieczorek, 1988). Much of the damage was
in the Santa Cruz Mountains, and was responsible for focusing the
geologic community of northern California on debris-flow hazards.
This same storm triggered a large rock-block glide landslide in the
Love Creek watershed, approximately 1 1 km west of the center of
the Summit Road area. A winter storm that affected the Santa Cruz
Mountains in 1986 resulted in the first real-time landslide warning
which, according to eyewitness accounts of landslide occurrence,
accurately predicted the times of major landslide events (Keefer and
others, 1987).
The 1906 San Francisco earthquake triggered many landslides in
the Santa Cruz Mountains (Lawson, 1908). For example, a debris
flow that failed in the headwaters of Deer Creek travelled for ap-
proximately one-half mile (1 km), plowed through a grove of
redwood trees, some as tall as 200 feet (60 m), and wrecked a shingle
mill with debris as thick as 30 to 60 feet ( 1 to 20 m). Lawson ( 1 908) i
reports that on hillsides and ridge crests, at points not within the San:
Andreas Rift zone, cracks were common. Most are related to
landslides, but some of the cracks had no apparent connection with
landslides, actual or incipient. In the summit area of the Santa Cruz
Mountains, Lawson reported that the ridge was full of cracks,
ranging up to 2 to 3 feet (60 cm to 1 m) wide, and extending for 0.5
miles (0.8 km). The triggering of landslides by the Loma Prieti
earthquake is consistent with the effects of other large earthquakes
as tabulated by Keefer (1984).
Photo 2 Small debris slide adjacent to a house in the Santa Cruz Mountains. (Photo by T. E. Spinier)
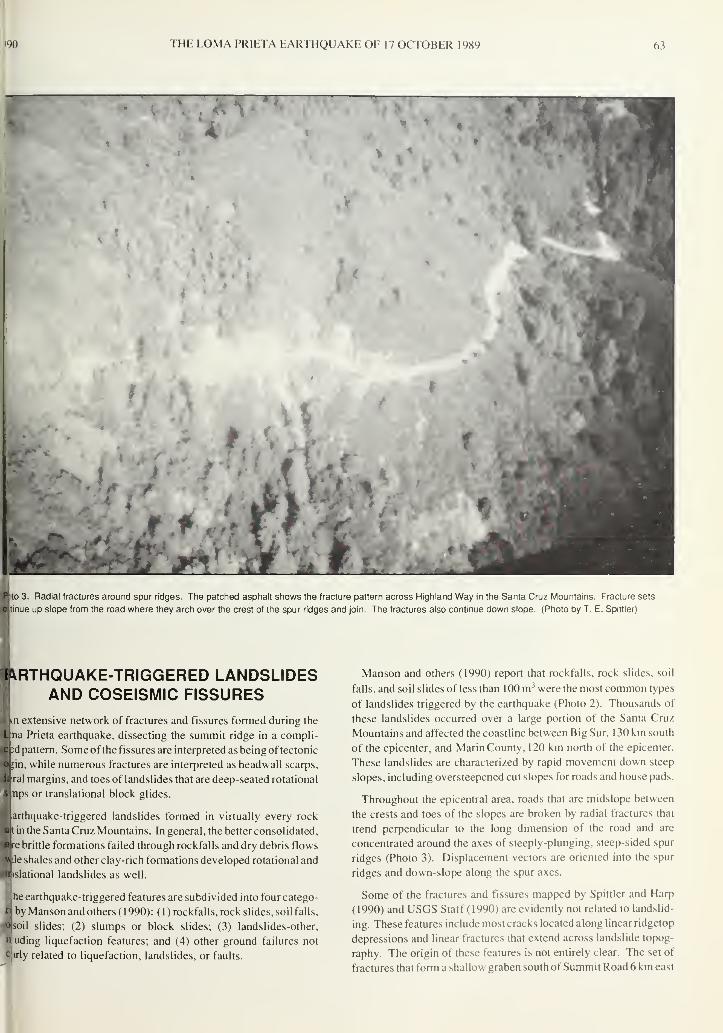
•90 THE LOMA PRIETA EARTHQUAKE OF 17 OCTOBER 19X9 63
r
*
A\\ %
*
Ibto 3. Radial fractures around spur ridges. The patched asphalt shows the fracture pattern across Highland Way in the Santa Cruz Mountains. Fracture sets
lltinue up slope from the road where they arch over the crest of the spur ridges and join. The fractures also continue down slope. (Photo by T. E. Spiftler)
EARTHQUAKE-TRIGGERED LANDSLIDESAND COSEISMIC FISSURES
An extensive network of fractures and fissures formed during the
Bna Prieta earthquake, dissecting the summit ridge in a compli-
ed pattern. Some of the fissures are interpreted as being of tectonic
Kin, while numerous fractures are interpreted as headwall scarps,
Bral margins, and toes of landslides that are deep-seated rotational
nps or translational block glides.
Barthquake-triggered landslides formed in virtually every rock
It in the Santa Cruz Mountains. In general, the better consolidated.
Ire brittle formations failed through rockfalls and dry debris flows
Hie shales and other clay-rich formations developed rotational and
pislational landslides as well.
Ilhe earthquake-triggered features are subdivided into four catego-
fi by Manson and others ( 1 990): ( 1 ) rockfalls, rock slides, soil falls,
>fl|soil slides; (2) slumps or block slides; (3) landslides-other,
it uding liquefaction features; and (4) other ground failures not
Cjirly related to liquefaction, landslides, or faults.
Manson and others (1990) report that rockfalls, rock slides, soil
falls, and soil slides of less than 1 00 m3 were the most common types
of landslides triggered by the earthquake (Photo 2). Thousands of
these landslides occurred over a large portion of the Santa Cruz
Mountains and affected the coastline between Big Sur. 1 30 km south
of the epicenter, and Marin County, 120 km north of the epicenter.
These landslides are characterized by rapid movement down steep
slopes, including oversteepened cut slopes for roads and house pads.
Throughout the epicentral area, roads that are midslope between
the crests and toes of the slopes are broken by radial fractures that
trend perpendicular to the long dimension of the road and are
concentrated around the axes of steeply-plunging, steep-sided spur
ridges (Photo 3). Displacement vectors are oriented into the spur
ridges and down-slope along the spur axes.
Some of the fractures and fissures mapped by Spittler and Harp
(1990) and USGS Staff ( 1990) are evidently not related to landslid-
ing. These features include most cracks located along linear ridgetop
depressions and linear fractures that extend across landslide topog-
raphy. The origin of these features is not entirely clear. The set of
fractures that form a shallow graben south of Summit Road 6 km east

64 DIVISION OF MINES AND GEOLOGY SP10
fault movement at depth. Cotton and other:
(this volume) propose that these fissures an
bedding plane faults which are second-orde
bending-moment faults related to coseismi.
active folding processes, as described by Yeat
(1986). A third view (Hart and others, thi
volume) is that the graben formed by gravita
tional spreading induced by strong groun
shaking that occurred along the summit ridge,
This model suggests that the ridgetop depre;
sions are similar to sackungen. However, th
bedrock lithology, the topography, and th
Quaternary geologic history of the Santa Cru
Mountains are significantly different from th
brittle crystalline igneous and metamorprr
rocks and the steep glaciated terrain whei
sackung have been described elsewhere in tr
western United States (Varnes and other
1989).
Photo 4. Incipient landslide scarp within the Villa del Monte subdivision along the summit of the Santa
Cruz Mountains. (Photo by J. P. Schlosser)
of Highway 1 7 has been interpreted in several ways. Ponti and Wells
(1990) suggest that the Summit Road surface fractures probably
formed as a result of ( 1 ) strong ground shaking that resulted in large-
scale slumping of the hillsides and/or collapse of the ridge crests, and
(2) tectonic uplift and extension of the hanging-wall block due to
Fractures are most common on long, narrov
steep-sided ridges. Most of these ridgetc
fractures exhibit extension, and back-facin
scarps also occur. Some of the extension
partings along the axes of narrow, steep-sid<
ridgetops can be explained as having formed
response to ground shaking accelerations directed perpendicular
the axis of the ridge. These accelerations may have been greater th;
1 .0 g in some areas as indicated by stones, logs, and concrete sla
that have been apparently thrown from their original positions wil
little or no rolling. Topographic amplification of the strong growl
Photo 5. Headwall scarp of large landslide near Schultheis Road. (Photo by J. P. Schlosser)

wo THE LOMA PRIETA EARTHQUAKE OF 17 OCTOBER 1989 65
haking is a possible cause for the domi-
ance offractures along ridgetops. Topo-
raphic amplification is also suggested by
bservations of broken tops of tall trees
tare commonly along ridgetops than in
r.her areas and the appearance of a greater
jnount of damage to structures of similar
Snstruction on ridgetops relative to side
topes and valley bottoms (Spittler and
vdnor, 1990). In several areas the ridge-
fp fractures end where ridges widen
>eyond approximately 100 m) or where
Opes are inclined less steeply than about
I percent. In most areas the ridgetop fis-
res appear to be parallel to the bedding or
inting of the underlying sedimentary
nnations(Ponti and Wells, 1990). How-- er, this may be an artifact of the parallel
ignment of ridges to the underlying struc-
iral trend of the geology.
Many of the large, deep landslides in the
.immit ridge area that were triggered by
fe Loma Prieta earthquake are within
irtions of ancient large landslide com-
|fexes as mapped by Dibblee and others
|('979); Cooper-Clark and Associates
KP75); and Clark and others (1989). The distinctive hummocky to-
graphy and disrupted bedrock units observed in road cuts and
King stream channels in this area indicate repeated episodes of
ladslide movement.
I vlost recognizable among landslide-related cracks are those that
Itti headwall scarps. In many localized areas the heads were the
lily portions of the landslides that moved during the earthquake,
e arcuate, concave-down pattern of the headwall scarps form
ad frowns on the landscape (Photo 4). Where more than just the
lermost portion of a landslide has failed, the headwall fractures
nmonly have the largest displacements of all of the landslide-
ated cracks. Displacements across the scarps of the deep-seated
mps along Schultheis Road and Morrell Cutoff exceed 1.0 mloto 5). The sense of displacement across fissures forming these
irps is most commonly extensional and slope-parallel dip-slip,
ley-side down. An arcuate, en echelon pattern of extensional
;ures, with right-stepping fractures along left-lateral margins and
t-stepping fractures along the right ones, was observed along
ny of the mapped landslides. Many of the headwall scarps are
ated along preexisting scarps (Photo 6).
Tactures that formed along the margins of landslides generally
libit a sense of shear displacement consistent with the relative
placement of the landslide mass. However, there are numerous
as where the relative displacement of the landslide mass is not
arand the relation of the sense of displacement across individual
Photo 6. Landslide scarp adjacent to a house in the Villa Del Monte area, about 3 km east of Highway 17.
(Photo by J. P. Schlosser)
cracks to the overall mass movement also is unclear. The least
common deformational features related to the earthquake-triggered
landslides are well-defined folds or bulges with fresh fractures that
delineate areas of compression at the toes of landslides.
Landslides and coseismic fissures were developed by the Loma
Prieta earthquake despite its occurrence late in the dry season follow-
ing nearly two years of drought. Although wet areas, springs, and
shallow wells in the summit ridge area indicate the presence of
locally perched ground-water zones, the severe rainfall deficit sug-
gests that seismically induced pore-water pressures were substan-
tially less than those that have occurred during earlier earthquakes.
Had the earthquake occurred during a wet period, landslide problems
would undoubtedly have been worse.
CONCLUSIONThe triggering of landslides by the Loma Prieta earthquake was not
a unique phenomenon. Concern must now be directed toward the
threat ofan acceleration of landslide activity in the highly slide-prone
Santa Cruz Mountains. Now that many slide planes have been reac-
tivated, the stability of slopes, some of which have many houses on
them (Photo 6), could be greatly reduced, and a wet winter could
trigger additional landslide movement on some of these slides. This
concern was emphasized by the observations of post-seismic move-
ment by G. K. Gilbert follow ing the 1 906 Great San Francisco earth-
quake (Lawson, 1908).
ACKNOWLEDGMENTSThe authors are indebted to the numerous geologists who assisted in mapping the surficial effects of the Loma Prieta earthquake. Special thanks
re given to Paia Levine, Mary Ann McKittrick, David Hope, and Peter Parkinson of the County of Santa Cm/ for providing logistic al support
Mlowing the earthquake and for coordinatiing the work of the County with that of the Division of Mines and Geology and the U. S. Geological
urvey. Bruce R. Clark of Leighton and Associates provided three staff geologists for assistance in the mapping effort, and Gary B. Griggs of
le University of California at Santa Cruz arranged for graduate student help. Levine, McKittrick. and Griggs, as well as Gerald E. Weber and
nan Walls, worked with the authors on directing the course of slope stability investigations following the earthquake. We appreciate the
loughtful and insightful reviews by Daniel J. Ponti and Michael J. Rymer of the U. S. Geological Survey.

66 DIVISION OF MINES AND GEOLOGY SP104
REFERENCES
California Department of Conservation, 1984, California precipitation intensity
maps, 50-year return period with 8 different durations: unpublished report
to the California Department of Forestry, 20 p.
Campbell, R.H., 1975, Soil slips, debris flows, and rainstorms in the central
Santa Monica Mountains and vicinity, southern California: U.S. Geological
Survey Professional Paper 851 , 51 p.
Cannon, S.H., and Ellen, S.D., 1985, Rainfall conditions for abundant debris
avalanches, San Francisco Bay region: California Geology, v. 38, no. 12,
p. 267-272.
Cannon, S.H., and Ellen, S.D., 1988, Rainfall that resulted in abundant debris
flow activity during storms, in Ellen, S.D. and Wieczorek, G.F., editors,
Landslides, floods, and marine effects of the storm of January 3-5, 1982 in
the San Francisco Bay region: U.S. Geological Survey Professional Paper
1434. p. 27-33.
Clark, J.C., 1 981 , Stratigraphy, paleontology, and geology of the central Santa
Cruz Mountains, California Coast Ranges: U.S. Geological Survey
Professional Paper 1 168, 51 p.
Clark, J.C., Brabb, E.E., and McLaughlin, R.J., 1989. Geologic map of the
Laurel 7.5-minute quadrangle, Santa Cruz and Santa Clara counties,
California: U.S. Geological Survey Open-File Report 89-676, scale
1 :24,000.
Cooper-Clark, and Associates, 1975, Preliminary map of landslide deposits in
Santa Cruz County, in Seismic Safety Element, Santa Cruz, CA: Santa
Cruz County Planning Department, map scale 1 :62,500.
Cotton, W.R., Fowler, W.L., and Van Velsor, J.E., 1990, Coseismic bedding
plane faults and ground fissures associated with the Loma Prieta
earthquake of October 17, 1989: this volume, p. 95-103.
DeMets, C . Gordon, R.G., Stein, S., and Argus, D.F., 1987, A revised
estimate of Pacific-North American plate boundary zone tectonics:
Geophysical Research Letters, v. 14, p. 911-921.
Dibblee, T.W. Jr., Brabb, E.E., and Clark, J.C., 1978, Preliminary geologic
map of the Laurel quadrangle, Santa Cruz and Santa Clara counties,
California: U.S. Geological Survey Open-File Report 78-84, 1 plate,
scale 1 :24,000.
Dibblee, T.W. Jr., and Brabb, E.E., 1978, Preliminary geologic map of the Los
Gatos quadrangle, Santa Cruz and Santa Clara counties, California: U.S.
Geological Survey Open-File Report 78-453, 1 plate, scale 1 :24,000.
Ellen, S.D. and Wieczorek, G.F., editors, Landslides, floods, and marine
effects of the storm of January 3-5, 1982 in the San Francisco Bay region:
U.S. Geological Survey Professional Paper 1434, 310 p.
Hart, E.W., Bryant, W.A., Wills, C.J., and Treiman, J.A., 1990, The search for
fault rupture and significance of ridgetop fissures: this volume, p. 83-94.
Keefer, D.K., 1984, Landslides caused by earthquakes: Geological Society of
America Bulletin, v. 95, p. 406-421
.
Keefer, D.K., Wilson, R.C., Mark, R.K., Brabb, E.E., Brown, W.M., III, Ellen,
S.D., Harp, E.L, Wieczorek, G.F., Alger, C.S., and Zatkin, R.S., 1987,
Real-time landslide warning during heavy rainfall: Science, v. 238, p. 921-
925.
Lawson, AC, ed., 1908, The California Earthquake of April 18, 1906: Report
of the State Earthquake Investigation Committee, Carnegie Institution of
Washington, Publication 87, v. 1, 451 p.
Lisowski, M., Prescott, W.H., Savage, JO, and Svarc, J.L., 1990, A possible
geodetic anomaly observed prior to the Loma Prieta, California, earth-
quake: Geophysical Research Letters, v. 17, p. 1211-1214.
Manson, M. W., Keefer, D.K., and McKittrick, M.A., compilers, 1990, Prelimi-
nary reconnaissance location map of landslides and other geologic
features related to earthquake shaking in the Santa Cruz Mountains,
California, resulting from the Loma Prieta earthquake of October 17, 1989:
California Division of Mines and Geology Open-File Report 89-29.
Plafker, G. and Galloway, J. P., eds, 1989, Lessons learned from the Loma
Prieta, California, Earthquake of October 17, 1989: U. S. Geological
Survey Circular 1045, 48 p.
Ponti, D. J., and Wells, R. E., 1990, Extent and origin of surface fractures in
the Summit Road-Skyland Ridge area, in Schwartz, D. P., and Ponti, D. J.,
eds., Field guide to the neotectonics of the San Andreas fault system,
Santa Cruz Mountains, in light of the 1989 Loma Prieta earthquake: U. S.
Geological Survey Open-File Report 90-274, p. 27-30.
Prescott, W.H., Lisowski, M., Johnston, M.J.S., Schulz, S.S., Savage, J.C.,
and Clark, T.A., 1990, Deformation before, during and after the Loma
Prieta earthquake of October 1989: EOS, Transactions of the American
Geophysical Union, v. 71, no. 8, p. 291 (abstract).
Rantz, S.E., 1971, Mean annual precipitation and precipitation depth-duration-
frequency data for the San Francisco Bay region, California: U. S.
Geological Survey Open-File Report.
Shakal, A.F., DeLisle, M.J., Reichle, M.S., and Darragh, R.B., 1990, Strong
ground shaking from the Loma Prieta earthquake of 17 October 1989, and
its relation to near surface geology in the Oakland area: this volume,
p. 29-46.
Spittler, T.E., and Harp, E.L., 1990, Preliminary map of landslide features and
coseismic fissures triggered by the Loma Prieta earthquake of October 17
1989: California Division of Mines and Geology Open-File Report 90-6,
map scale 1 :4,800.
Spittler, T.E., Sydnor, R.H., Manson, M.W., Levine, P., and McKittrick, M.A.,
1990, Large-scale mapping of landslides in the epicentral area of the Lom
Prieta earthquake of October 17, 1989, Santa Cruz County, California:
EOS, Transactions of the American Geophysical Union, v. 71, no. 8,
p. 290 (abstract).
Spittler, T.E., and Sydnor, R.H., 1990, Landslides and ridge-top failures
associated with the epicentral area of the Loma Prieta earthquake of
October 17, 1989: EOS, Transactions of the American Geophysical Unio
v. 71 , no. 8, p. 290 (abstract).
U. S. Geological Survey Staff, 1989, Preliminary map of fractures formed in
the Summit Road-Skyland Ridge area during the Loma Prieta, California,
earthquake of October 17, 1989: U.S. Geological Survey Open-File
Report 89-686, 1 plate, scale 1 :1 2,000.
U.S. Geological Survey Staff, 1990, Surface fractures and ground failure
associated with the Loma Prieta, California, earthquake of October 17,
1 989: EOS, Transactions of the American Geophysical Union, v. 71 , no
p. 291 (abstract).
Varnes, D.J., Radbruch-Hall, D.H., and Savage, W.Z., 1989, Topographic ar
structural conditions in areas of gravitational spreading of ridges in the
western United States: U.S. Geological Survey Professional Paper 1496 1
28 p.
Wagner, D.L., 1990, Geologic and tectonic setting of the epicentral area oft!
Loma Prieta earthquake, Santa Cruz Mountains, central California: this i
volume, p. 1-10.
Wieczorek, G.F., Harp, E.L., Mark, R.K., and Bhahacharyya, A.K., 1988,
Debris flows and other landslides in San Mateo, Santa Cruz, Contra Cos
Alameda, Napa, Solano, Sonoma, Lake, and Yolo counties, and factors
influencing debris-flow distribution, in Ellen, S.D. and Wieczorek, G.F., e
Landslides, floods, and marine effects of the storm of January 3-5, 1982
the San Francisco Bay region: U.S. Geological Survey Professional Pah
1434, p. 133-161.
Wilson, R.C., and Keefer, D.K., 1985, Predicting areal limits of earthquake- ;
induced landsliding, /nZiony, J. I., ed., Evaluating earthquake hazards I
the Los Angeles region: U. S. Geological Survey Professional Paper 13'j
p. 317-345.
Yeats, R.S., 1986, Active faults related to folding, in Active tectonics: Nation
Academy Press, Washington, D. O, p. 63-79.

COASTAL BLUFF LANDSLIDES IN SANTA CRUZ COUNTY
RESULTING FROM THE
LOMA PRIETA EARTHQUAKE OF 17 OCTOBER 1989
By
Robert H. Sydnor 1
, Gary B. Griggs2, Gerald E. Weber3
,
Richard J. McCarthy4, and Nathaniel Plant2
ABSTRACTThe 1 989 Loma Prieta earthquake caused widespread landsliding along coastal blufts. Most coastal landslides occurred
within 9 to 20 km of the epicenter where shaking of Modified Mercalli Intensity VII or greater occurred. Strong ground-
motion from a CSMIP free-field station at Capitola (only 0.4 km from the coastal bluffs) measured peak accelerations of
0.54 g horizontal and 0.60 g vertical.
One fatality and several million dollars in damage were attributed to coastal landslides during this earthquake. Thesegment of the coast where landslides were most prevalent includes Capitola Beach, New Brighton State Beach, Seacliff
State Beach, Rio Del Mar, La Selva Beach, Manresa State Beach, and Sunset Beach.
Engineering geologists from the University of California at Santa Cruz, the California Division of Mines and Geology,
the California Coastal Commission, and several local consulting engineering geology firms performed a rapid reconnais-
sance of the coastline to evaluate landslides immediately following the earthquake.
Three kinds of coastal landslides occurred: (1 ) Block falls in sedimentary bedrock cliffs, (2) translational landslides in
friable sandstone cliffs, and (3) sand flows in Quaternary dune deposits. Most of the coastal landslides occurred in the
Pliocene Purisima Formation and the Pleistocene Aromas Sand because these formations form the seacliffs that received
the highest intensity of seismic shaking (within 9-20 km of the epicenter).
Prudent land-use decisions based on detailed engineering geologic mapping and geotechnical analyses will minimize
the exposure of structures to damage by coastal landslides.
INTRODUCTION
The coastal bluffs in central and southern Santa Cruz County are
bated only about 9 to 20 km from the epicenter of the 1989 Lomalieta Earthquake. Intense seismic shaking caused landslides at
i,merous locations along the coastline from Monterey to Marin
•)unty. One person was killed by a rockfall below a sea cliff and
weral million dollars in damages were attributed to coastal land-
des triggered by this earthquake.
CToastal bluff landslides due to seismic shaking are a significant
;ologic hazard. Because ocean view property and homes are in
'.mand, available land is either already built upon or is under
;ssure for development. The purposes of this paper are: (1) to
1 nsider seismic shaking from earthquakes as a punctuated geomor-:
f ic process which affects coastal bluff morphology, (2) to summa-
e strong ground-motion records which pertain to coastal bluffs.
i to describe the occurrence of seismically-induced coastal land-
des, and (4) to consider land-use implications and planning
•ights related to coastal landslides.
The scope of this paper is limited to reconnaissance-level field
work in southern Santa Cruz County where coastal landslides were
most prevalent. Not all seismically-induced coastal landslides are
described.
GEOLOGIC SETTING
Santa Cruz County and most of central California is noted for its
rugged and picturesque emergent coastline characterized by pre-
cipitous cliffs experiencing active surf erosion. This modern sea-
cliff is but the latest of a series of Pleistocene seacliffs represented
by the well-preserved flight of marine terraces present on the
seaward side of the Santa Cruz Mountains. Marine terrace studies
(Bradley, 1 957; Bradley and Griggs, 1 976; Alexander, 1 953; Weber
and others, 1979; Weber and Griggs, 1990; Anderson. 1990) indi-
cate the Santa Cruz Mountains have formed in response to long-term
regional uplift over the past 1.2 ma. This episodic coseismic uplifl
may be associated with Loma Prieta-type earthquakes. The local-
ized deformation of shoreline angles appears to be related to seismic
Jlifornia Department of Conservation, Division of Mines and Geology. Geologic Hazards Assessment Program
>ard of Earth Sciences, University of California, Santa Cruzeber & Associates, 120 Westgate Dr., Watsonville
ilifornia Coastal Commission, 631 Howard St., San Francisco
67

68 DIVISION OF MINES AND GEOLOGY SP104
events, as does the regional uplift. Uplift is most likely related to
fault motion resulting from localized convergence at a restraining
bend along the San Andreas fault.
Previous Work
Active coastal erosion and slope failures along the modern sea
cliff are continuing processes that reflect the rapidity ofchanges that
characterize an active emergent coastline. Both slope failure and
cliff erosion have long been recognized as a problem with respect
to California coastal development (e.g., Cleveland, 1 975; Habel and
Armstrong, 1977; Atwater, 1978; Griggs and Johnson, 1979; Kuhn
and Shepard, 1984; Griggs and Savoy, 1985).
Previous Earthquakes
Although landslide-generating earthquakes are typically episodic
and widely spaced in time, they may still reflect a major geomorphic
process that helps shape the cliffs and coastline. During the past 124
years, two other major seismic events (1865 and 1906) apparently
caused slope failures in northern Monterey Bay (Griggs, 1 973; Plant
and Griggs, 1990). The effects of the 1838 and 1926 earthquakes
on coastal bluff stability are not known. However, the 1838 event
on the San Andreas fault may have had an effect similar to 1 865 and/
or 1906, while the two 1926 Monterey Bay earthquakes apparently
had a relatively minor effect on the sea cliff.
Coastal Bluff Processes
Severe seismic shaking is but one process affecting sea cliff
stability. Rock type, orientation and development of structures in
the rocks, surf erosion, weathering and episodic intense storms all
interact to create the geomorphic environment that shapes the cliffs.
All processes except active surf zone erosion at the base of the cliff
act to degrade the cliff and decrease the slope angle. Active surf
erosion acts to steepen the slope angle. However, all processes
cause the sea cliff to migrate inland. Figure 1 summarizes the
approximate range in frequency of events and processes which
affect coastal bluffs in northern Monterey Bay in the context of
geologic time.
Dynamic Equilibrium
The modern sea cliff is an evolving landform that exists within the
dynamic interplay (equilibrium) of surf erosion that steepens the
cliff and mass movements that wear down the cliff. The cliff wil
exist in this interaction between processes until its base is elevatec
above the active surf zone by either a drop in sea level ortectonism;
Once the surf abandons the sea cliff it begins to slowly degrade am
evolve toward an erosional equilibrium slope.
Present along northern Monterey Bay are both sea cliffs in th<
dynamic equilibrium of surf zone and mass movement, and cliff
which are almost isolated from the active surf zone. North of Nev
Brighton Beach the sea cliff is under continual wave attack. Her
the cliff maintains a near-vertical profile in bedrock and steep (±45°
slopes in the capping terrace deposits. The cliff profile does no
degrade but is maintained in dynamic equilibrium by the wavi
erosion.
South from New Brighton to Sunset Beach, the sea cliff
protected much of the time by a broad beach, as well as an extensiv
series of seawalls and revetments. Therefore, waves only reach th
base of the cliff during periods of very large storms coincident wit
high tides (e.g., the 1983 winter). As a result, terrestrial processe
such as runoff and mass movement tend to be more importa;
geomorphic processes than wave erosion for this segment of tr
coastline.
Coastal J
Severe
Major
Eustatic Sea Level Cha "iges
Earthquakes
ii
Rain Storms
Storms
1
Human Activity
,.
i
is
10' 10* 10°
TIME IN YEARS
10* 10'
Figure 1 Approximate frequency range of events/processes affecting coastal bluffs in northern Monterey Bay.
HI

990 THE LOMA PRIETA EARTHQUAKE OF 17 OCTOBER 1989 69
Prior to the 1 989 Loma Prieta earthquake, the seale ofseismically-
mduced slope failures in this area was somewhat unknown. This
ype of slope failure can be a significant factor in the degradation
ind evolution of all sea cliffs but is most noticeable where cliffs are
«ss exposed to wave action. The absence of erosion at the toe of
he cliff results in the development of gentler slopes (near the angle-
>f-repose) in the marine terrace deposits that cap the cliff. Large
talus aprons formed at the base of these cliffs reflect the toppling,
ailing, and avalanching processes acting on the sea cliff. On an
,ctive sea cliff in dynamic equilibrium, seismically-induced slope
allures are not as obvious as on an abandoned sea cliff.I
. A significant effect of seismic shaking on coastal bluffs is the
emoval of loose weathered material from the cliff face. The process
S comparable in effectiveness to non-seismic slope failure in
loving earth materials off the cliff face, and exposing fresh rock to
•/eathering, although it occurs much less frequently (Figure 1).
1'onsequently earthquake-induced slope failure increases both the
ite of retreat of active sea cliffs and the degradation of abandoned
;a cliffs. These earthquake events also act as an intermittent
contributory source of sediment to the littoral drift along the coast.
;Six distinct geologic/geomorphic parameters affecting coastal
Huff stability occur together within the Santa Cruz County segment
f the California coastline: (1 ) steep cliffs, (2) weak sedimentary
edrock capped by Quaternary terrace deposits, (3) active faulting
id a high level of regional seismicity, (4) active marine erosion, (5)
oisodic intense storms, and (6) adverse impact of development by
Kan.
rosion Rates
lErosion rates along the cliffs of southern Santa Cruz County vary
om about 5 to 50 cm/yr and are controlled primarily by lithology,
ructure, stratigraphy, and exposure to wave action (Griggs and
)hnson, 1979; Griggs and Savoy, 1985). Erosional processes
fecting the cliffs include hydraulic impact and scour from winter
orms, landsliding due to intense rainfall, seismically-induced
ndslides, and ground-water seepage. The latter includes lateral
igration of septic effluent from cliff-top homes and adverse effects
domestic irrigation water (lawn and garden watering).
ack of Antecedent Rainfall
In the autumn of 1989, Santa Cruz County was still experiencing
severe multi-year drought, with no unusually heavy rainfall since
;e Valentine's Day storms of 1986. The coastal bluffs were
latively dry from a geotechnical viewpoint, except for local
fects of domestic landscape irrigation and sewage disposal leach-
;lds. The First rainfall for the winter season did not come until four
ys after the main shock. Thus it is believed that pore-water
essure was not a leading factor in coastal bluff failure for this
ent. However, had the earthquake occurred in mid-winter after
pical heavy winter rainfall, it is possible that more extensive
idsliding would have occurred along the coastal bluffs.
In summary, a seacliff profile is maintained by wave erosion at its
:. Without active wave erosion, mass-wasting processes degrade
astal cliffs. Earthquakes are an important episodic process which
affect seacliffs. There was no antecedent rainfall prior to the
earthquake which could have set the stage for more extensive
landsliding.
EARTHQUAKE EFFECTS
The epicenter of the 17 October 1989 Loma Prieta Earthquake
was located only about 9 km inland from the nearest segment of the
coastline (Aptos - Capitola); the focal depth was 17.6 km. Strong
shaking along the coastline lasted for about 1 7-23 seconds. Based
on preliminary reports, Modified Mercalli Intensity VII shaking
occurred along the Santa Cruz coastline, diminishing to MMI VI
near Half Moon Bay (Stover and others, 1990). However, slightly
inland from Capitola - New Brighton Beach area the intensity of
shaking was MMI VIII. Thus the most populous and densely
developed segment of the coastal bluffs in Santa Cruz County
received the highest intensity of shaking.
Within the epicentral area there appeared to be topographic am-
plification of shaking on narrow ridge crests (Spittler and Sydnor,
1 990; Spittler and others, 1 990). Ground cracking was found along
the edges of coastal cliffs and narrow promentories. This may have
been due to lack of lateral support during intense shaking rather
than topographic amplification.
Strong Motion Records Near the Coast
Four strong-motion instrument stations operated by the Califor-
nia Division of Mines and Geology, Strong Motion Instrumenta-
tion Program (CSMIP), provide quantitative records of shaking.
Prior to October 1989, there were no strong motion records in the
near-field of a significant earthquake which could be related to
coastal landslides.
The 1989 Loma Prieta epicenter, the coastal cliffs, and the four
strong-motion instruments were all relatively close to each other.
Figure 2 is an index map which shows the proximity of the coastal
cliffs to the epicenter and CSMIP stations. An isoseismal line
which separates Modified Mercalli Intensity VII from VIII is also
shown, based on Stover and others (1990).
The data from the 1989 earthquake that apply to coastal Santa
Cruz County are summarized in Table 1 ; refer to Shakal and others
(1989) for the complete report. The three stations at Corralitos,
Capitola, and UC Santa Cruz are free-Field stations; the fourth
station at Watsonville is an instrumented building and ground
motion for the first floor is tabulated.
Peak Acceleration Affecting Cliffs
For coastal cliffs nearest the epicenter, the range of peak horizon-
tal ground motion was apparently on the order of 0.47 g to 0.64 g,
and the range of peak vertical ground motion was about 0.40 g to
0.66 g. These data are significant for three reasons: ( 1 ) the records
indicate consistently high ground-motion between the four CSMIPstations records, so no single record can be considered an anomaly:
(2) correlation can be made between regional occurrence of land-
slides and quantitative strong motion; (3) the recorded peak accel-
erations offer an opportunity to compare actual peak ground-
motion data with seismic coefficients typically used in slope sta-
bility analyses by geotechnical engineers.

DIVISION OF MINES AND GEOLOGY

990 THE LOMA PRIETA EARTHQUAKE OF 17 OCTOBER 1989
TABLE 1
Near-Field Strong Motion Affecting the Santa Cruz Coastline
1989 Loma Prieta Earthquake
71
Location of
CSMIP Station
Epicentral
Distance
Acceleration Peak Peak(gravity) Velocity Displacement
cm/sec cm
90 0.50g
Up 0.47g360' 0.64g 55.2 11.5
90° 0.47g
Up 0.60g 36.1 11.0
360' 0.54g
90 0.44g
Up 0.40g
360 0.47g 21.2 6.8
45° 0.28g
Up 0.66g -- --
360 0.39g
Corralitos SMIP #57007 7 kmEureka Canyon Road
(12.4 km inland from
Seacliff State Beach)
Capitola SMIP #471 25 9 kmCounty Fire Station
(only 0.4 km inland
from Capitola Beach)
Santa Cruz SMIP #581 35 16 kmUCSC Lick Observatory
(5.5 km inland from Cowell Beach)
Watsonville SMIP #47459 1 8 km4-story commercial building
(first floor data)
(This is not a free-field site.)
(6.1 km inland from Sunset State Beach)
Data from Shakal and others, 1989; and Reichle and others, this volume.
ntensity of Shaking
! The highest reported intensity of shaking along the coastline was
VIMI VIII from Point Santa Cruz to Soquel Point (Figure 2). From
1'oint Santa Cruz northward to Half Moon Bay, the intensity of
haking was MMI VII. From Soquel Point southward to the mouth
'if the Salinas River the intensity of shaking was also MMI VII.
however, most of the intensities reported by Stover and others
'1990) were apparently several km inland along the marine terraces;
i>nly a few localities are plotted along the coastline. Based on field
Evidence of ground cracks along the edges of seacliffs, our recon-
naissance in the Capitola to Rio Del Mar area indicates that
VIMI VIII shaking occurred locally.
Seismic intensity is a subjective numerical index describing the
•everity of an earthquake in terms of effects on the earth's surface
ind on structures. Seismic intensity depends in a complicated way
,iot only on ground acceleration, but also on wave period, properties
>f rock and soil subgrade, local geologic structure and topography,
picentral distance, etc. According to the method of Murphy and
)'Brien (1977) the peak accelerations recorded at Capitola and UC>anta Cruz could equate with intensity of MMI VII+. The calcu-
ated intensity is in cautious agreement with observed intensity
ilong the coastline within 20 km of the epicenter.
Duration of Shaking
The recorded duration of significant shaking (bracketed at >(). lOg
and >0.05g) for the Corralitos CSMIP Station was 1 1 and 16 seconds
respectively, for Capitola was 1 7 and 3 1 seconds, and for Santa Cruz
was 17 and 19 seconds. This is slightly less than, but in general
agreement with, duration of shaking formulas given by Bullen and
Bolt (1985. p. 444) which yield estimated durations of 14 and 28
seconds, respectively, for a M7.1 event. Landslides are more likely
to mobilize at longer durations ol significant ground motion, espe-
cially >0.10g.
Geotechnical Applications
Future analysis and modeling of the near-field Loma Prieta
CSMIP records by seismologists, furthering concepts described by
Aki (1988) and Joyner and Boore ( 1988), may increase our under
standing of local geologic effects on seismic shaking. In turn, this
will provide better insight into the geotechnical analysis ol coastal
bluff stability. There arc also important earthquake engineering im-
plications for the design of offshore petroleum facilities. Seismi-
cally-induced submarine landslides ma) ad\ ersel) at feet petroleum
pipelines and other offshore facilities.

72 DIVISION OF MINES AND GEOLOGY SP104
In summary, the coastal bluffs nearest the epicenter experienced
MMI VII to VIII shaking. The bracketed duration was about 17 to
23 seconds. Ground accelerations were uniformly high in both
vertical and horizontal directions, resulting in landslides on the free
faces of coastal cliffs. The recorded peak accelerations offer an
opportunity to compare actual peak ground-motion data with seis-
mic coefficients typically used in slope stability analyses by
geotechnical engineers. The edges of coastal cliffs and promonto-
ries appear to be vulnerable to the effects of strong shaking. This
may be due to the lack of lateral support.
COASTAL RESPONSE ACTIVITIES
Rapid reconnaissance of the Santa Cruz coastline was performed
during October 18-22, following the main shock on October 17,
1989. The team was organized by the Santa Cruz County Geologist
with assistance from the University of California at Santa Cruz,
local consulting engineering geologists, the California Division of
Mines and Geology (DMG), and the California Coastal Commis-
sion. Such reconnaissance will likely occur after future large earth-
quakes, thus it is important to keep the following events in mind.
Coastal Reconnaissance
The emphasis was to determine which structures (homes, roads,
etc.) were in danger from coastal landslides. Bluff-top homes that
were deemed to be geologically unsafe to occupy were posted with
a formal written notice from the County Building Official. Those
cliff areas where the landslide damage was minor or cosmetic were
quickly checked and the information given to homeowners. The
geologic field effort was concentrated on those coastal landslide
areas where it would be effectively used for timely decisions.
Permit Assistance
The County Geologist and County Building Official provided
flyers and information booklets to homeowners regarding emer-
gency reconstruction permits (grading and building). Within the
coastal zone, the California Coastal Commission issued emergency
clean-up permits, with an explanation that homeowners were sub-
sequently obligated to obtain regular permits.
USGS Advisories
Many homeowners affected by coastal landslides were apprehen-
sive about aftershocks during the first week following October 17th.
The aftershock probabilities developed by Reasenberg and Jones
(1989) of the U.S. Geological Survey (USGS) were helpful. Whenheavy rainfall was forecast for October 20-21-22, a citizen's advi-
sory message regarding coastal landslides was issued to the news
media by William M. Brown III, geologist with the USGS at Menlo
Park.
Coastal Video Inventory
A complete inventory of coastal landslides was made on Novem-ber I. 1989 by geologists from the University of California, Santa
Cruz. A chartered aircraft was used to photograph and videotape the
coastline at low altitude between Bolinas and Monterey (Plant and
Griggs, 1990). The videotape proved to be an efficient and eco-
nomical method of acquiring geologic data lor a strip map of the
coastline. It also provided an important archive for future reference.
Individual coastal sites were subsequently mapped at a scale of
1:1,200
TYPES OF COASTAL LANDSLIDES
Coastal bluff failures resulting from the Loma Prieta earthquake
occurred between Marin County and Monterey County in a variety
of lithologies and geomorphic environments. Landslides were most
prevalent in northern Monterey Bay between Seabright Beach to the
north and Sunset State Beach to the south (Figure 2). This coastal
segment received seismic shaking of MMI VII to VIII.
Three general types of seismically-induced landslides occurred in
the coastal bluffs: rock falls, translational slides, and sand flows
(Figures 3, 4, and 5). Sedimentary bedrock cliffs are particularly
susceptible to seismically-induced landslides where they are closely
jointed, or the bedrock is friable. Terrace deposits are particularly
susceptible to slope failure where vertical soil peds are well-devel-
oped, or where basal terrace gravels lack a cohesive matrix. Site
conditions ofbedrock lithology , bedrock cementation, terrace thick-
ness, cliff morphology, bedding plane orientation, groundwater
seepage, joint structure and joint spacing, angle of repose of protec-
tive talus aprons, and local wave erosion at the base of the cliff are
principal natural parameters which control precise occurrence of
coastal landslides.
The three kinds of seismically-induced landslides are discussed in
order of prevalence with selected examples given in a general north-
to-south order. In several localities, complex landslides of more
than one type occurred adjacent to one another on the same cliff face
(vertically or laterally), so that a clear distinction is not always
possible.
ROCK FALLS
Geologic Setting
As a result of intense seismic shaking from the Loma Prieta
earthquake, there were numerous rock falls and block falls along the,
coastline of northern Monterey Bay. Undercut and weakened bed,
rock and fractured promontories collapsed along with bluff-tof
terrace deposits. Failure along joint surfaces allowed large block;
to separate from more intact rock. The size of these failures wa:
dependent on joint spacing and orientation, cliff height, and to<
support at the base of the cliff. High cliffs with widely spaced, sub
vertical joints and inadequate toe support sustained the larges
instantaneous and incipient failures in weakened or undercut sedi
mentary rock (Plant and Griggs, 1990).
Between Seabright Beach at Santa Cruz and New Brighton Stat
Beach near Aptos, seacliffs are cut into a marine terrace that is u>
to 25 m high. This terrace consists of an uplifted wave-cut bedroc
platform that is overlain by about 3 to 7 m of terrace deposits. Th
base of the coastal cliffs along much of this area is actively bein
eroded by the surf, and the cliff is in dynamic equilibrium betwee:
surf-dominated processes and mass-movement processes. The se
cliff is nearly vertical in bedrock, with =45° slopes in the cappin 1
marine terrace deposits. In this geomorphic setting the basal cli
in siltstone bedrock retreats rapidly enough so that the slopes in tr,
marine terrace deposits never achieve an equilibrium profile.
The bedrock is the Pliocene Purisima formation, a flat-lyin,
thickly bedded to massive, tuffaceous mudstone, siltstone, an
sandstone (Clark, 19X1; Brabb. 1989). Although well-indurate|
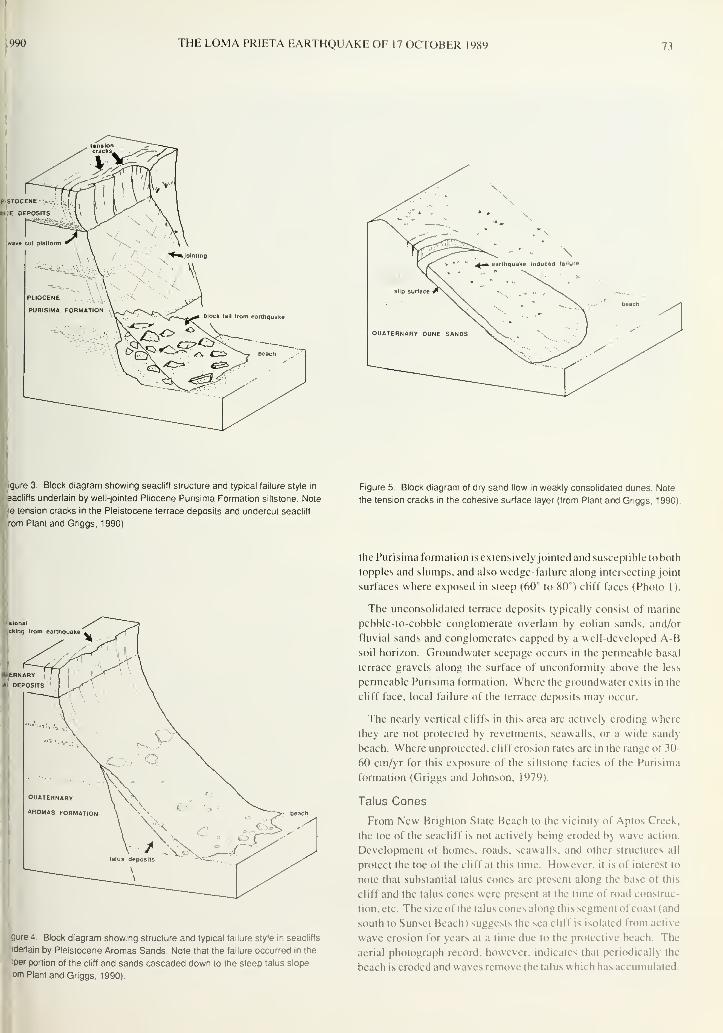
1990 THE LOMA PRIETA EARTHQUAKE OF 17 OCTOBER 1989 73
PlSTOCENE ••-.-.
»i:e deposits
igure 3. Block diagram showing seacliff structure and typical failure style in
eacliffs underlain by well-jointed Pliocene Purisima Formation siltstone. Note
oe tension cracks in the Pleistocene terrace deposits and undercut seacliff
rom Plant and Griggs. 1990).
Figure 5. Block diagram of dry sand flow in weakly consolidated dunes. Note
the tension cracks in the cohesive surface layer (from Plant and Griggs. 1990)
tonaleking irom earthquake
HljERNARY
»i DEPOSITS
gure 4. Block diagram showing structure and typical failure style in seacliffs
iderlain by Pleistocene Aromas Sands. Note that the failure occurred in the
>per portion of the cliff and sands cascaded down to the steep talus slope
om Plant and Griggs. 1990).
the Purisima formation is extensively jointed and susceptible to both
topples and slumps, and also wedge-failure along intersecting joint
surfaces where exposed in steep (60° to 80°) cliff faces (Photo 1).
The unconsolidated terrace deposits typically consist of marine
pebble-to-cobble conglomerate overlain by eolian sands, and/or
fluvial sands and conglomerates capped by a well-developed A-Bsoil horizon. Groundwater seepage occurs in the permeable basal
terrace gravels along the surface of unconformity above the less
permeable Purisima formation. Where the groundwater exits in the
cliff face, local failure of the terrace deposits may occur.
The nearly vertical cliffs in this area are actively eroding where
they are not protected by revetments, seawalls, or a wide sand)
beach. Where unprotected, cliff erosion rates are in the range ol $0-
60 cm/yr for this exposure of the siltstone fades of the Purisima
formation (Griggs and Johnson. 1979).
Talus Cones
From New Brighton State Beach to the vicinity of Aptos Creek,
the toe of the seacliff is not activelj being eroded by wave action.
Development of homes, roads, seawalls, and other structures all
protect the toe of the cliff al this time. However, il is of interest to
note that substantial talus cones are present along the base of this
cliff ami the talus cones were present at the time of road construc-
tion, etc. The size ofthe talus cones along this segment of coast (and
south to Sunset Beach) suggests the sea cliff is isolated from active
wave erosion for years at a time due to the protective beach. The
aerial photograph record, however, indicates thai periodically the
beach is eroded and waves remove the talus which has accumulated.
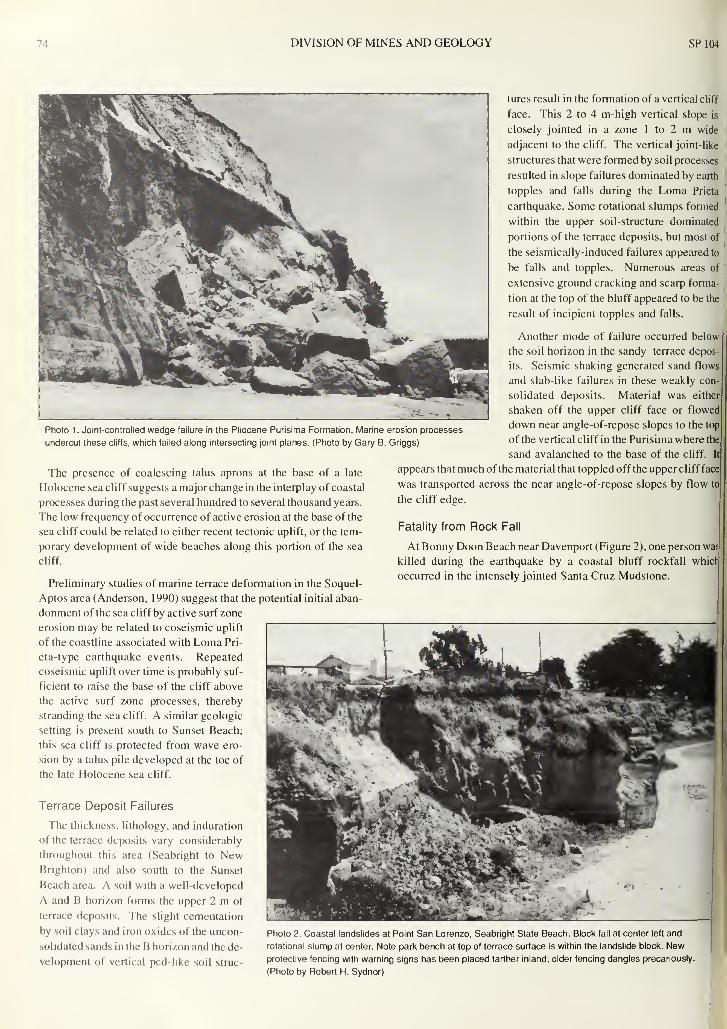
74 DIVISION OF MINES AND GEOLOGY SP104
Photo 1 . Joint-controlled wedge failure in the Pliocene Purisima Formation. Marine erosion processes
undercut these cliffs, which failed along intersecting joint planes. (Photo by Gary B. Griggs)
The presence of coalescing talus aprons at the base of a late
Holocene sea cliff suggests a major change in the interplay of coastal
processes during the past several hundred to several thousand years.
The low frequency of occurrence of active erosion at the base of the
sea cliff could be related to either recent tectonic uplift, or the tem-
porary development of wide beaches along this portion of the sea
cliff.
Preliminary studies of marine terrace deformation in the Soquel-
Aptos area (Anderson, 1990) suggest that the potential initial aban-
donment of the sea cliff by active surf zone
erosion may be related to coseismic uplift
of the coastline associated with Loma Pri-
eta-type earthquake events. Repeated
coseismic uplift over time is probably suf-
ficient to raise the base of the cliff above
the active surf zone processes, thereby
stranding the sea cliff. A similar geologic
setting is present south to Sunset Beach;
this sea cliff is protected from wave ero-
sion by a talus pile developed at the toe of
the late Holocene sea cliff.
Terrace Deposit Failures
The thickness, lithology, and induration
of the terrace deposits vary considerably
throughout this area (Seabright to NewBrighton) and also south to the Sunset
Beach area. A soil with a well-developed
A and B horizon forms the upper 2 m of
terrace deposits. The slight cementation
by soil clays and iron oxides of the uncon-
solidated sands in the B horizon and the de-
velopment of vertical ped-like soil struc-
tures result in the formation of a vertical cliff
face. This 2 to 4 m-high vertical slope is
closely jointed in a zone 1 to 2 m wide
adjacent to the cliff. The vertical joint-like
structures that were formed by soil processes
resulted in slope failures dominated by earth
topples and falls during the Loma Prieta
earthquake. Some rotational slumps formed
within the upper soil-structure dominated
portions of the terrace deposits, but most of
the seismically-induced failures appeared to
be falls and topples. Numerous areas of
extensive ground cracking and scarp forma-
tion at the top of the bluff appeared to be the
result of incipient topples and falls.
Another mode of failure occurred below
the soil horizon in the sandy terrace depos-
its. Seismic shaking generated sand flows
and slab-like failures in these weakly con-
solidated deposits. Material was either
shaken off the upper cliff face or flowed
down near angle-of-repose slopes to the top
of the vertical cliff in the Purisima where the
sand avalanched to the base of the cliff. It
appears that much of the material that toppled off the upper cliff face
was transported across the near angle-of-repose slopes by flow to|
the cliff edge.
Fatality from Rock Fall
At Bonny Doon Beach near Davenport (Figure 2), one person was
killed during the earthquake by a coastal bluff rockfall whicl
occurred in the intensely jointed Santa Cruz Mudstone.
Photo 2 Coastal landslides at Point San Lorenzo, Seabright State Beach Block fall at center left and
rotational slump at center. Note park bench at top of terrace surface is within the landslide block. New
protective fencing with warning signs has been placed farther inland; older fencing dangles precariously.
(Photo by Robert H. Sydnor)

990 THE LOMA PRIETA EARTHQUAKE OF 17 OCTOBER 1989 75
Point San Lorenzo
, Located just east of the Santa Cruz Boardwalk, Point San Lorenzo
s a picturesque 10 m-high vertical headland in Purisima sandstone
.apped by a 1 m thick soil. It is flanked by a wide sandy beach. This
lopular state beach is frequented by thousands of tourists each week
luring the summer season. Park benches had been set up at the edge
,)f the seacliff. The earthquake caused both block falls and rotational
lumps on these cliffs (Photo 2). The park benches and protective
ences had to be relocated farther inland after tension cracks were
letected landward of the benches. A fence was also constructed
long the base of the cliffs with warning signs for persons on the
teach. A prudent mitigative measure in a heavily-used park setting
vould be to induce failure or otherwise complete the landslide
•rocess where there are impending rock falls.
oto 3. Coastal cliff failure below the Crest Apartments. Depot Hill. Capitola. Bedrock is the
3nsely jointed Purisima siltstone. (Photo by Gary B. Griggs, November 1989)
Crest Apartments at Depot Hill
A seismically-induced rockfall occurred at Depot Hill in ( lapitola,
where the 1967-era Crest Apartments were constructed at the edge
of the cliff with virtually no set-back. Although a cantilevered
grade-beam foundation was used, it proved to be ineffective because
of the continued undercutting and the inherent weakness of the
jointed siltstone bedrock (Photo 3). Earthquake-induced failure led
to partial loss of caisson support, and cracking of the slab and pe-
rimeter wall of the apartments. The shoreline protection and engi-
neering efforts which were still in the planning process at the time
of the earthquake were reevaluated by the project engineering
geologist, geotechnical engineer, and structural engineer. Tension
cracks were apparent up to 10 m inland from the cliff edge. Based
on the earthquake effects on the site and damage to the structure, six
threatened apartment units are being demolished.
The Crest Apartments are accessed from above by
Cliff Drive. This city road has been permanently
closed to through traffic and "dangerous cliff
warning signs have been posted.
Pot Belly Beach
At privately-owned Pot Belly Beach (0.2 kmeast of New Brighton State Beach), a row of 12
expensive homes was built on the beach at the base
of the 20 m-high bluff. A private driveway runs
laterally along the base of the near-vertical bluffs.
To gain adequate width for the driveway, a 1 to 2
m-high wall was constructed at the base of the
bluffs. The wall was constructed using vertically-
standing telephone poles. Each pole was embed-
ded less than 0.5 m and neither tied back nor tied
together. A dense grove of eucalyptus trees was
planted on the face of the bluff. Bedrock consists
of a friable sandy facies of the Purisima forma-
tion: the slopes are variable, 40° to 60°.
Rockfalls and translational landsliding were
induced by the earthquake (Photo 4). Top-heavy
eucalyptus trees overturned and fell across the
driveway towards the homes. The wall could not
resist the overturning moments from the landslide
mass and many vertical poles overturned. The
driveway was covered with a mass ol sand, euca-
lyptus branches, and telephone poles. Fortu-
nately, there was no structural damage to the
homes because the sandstone blocks disaggre-
gated as they fell downslope.
Seacliff State Beach and Las Olas Drive
The longest continuous segment of coastal land-
sliding occurred at Seacliff State Beach and adja-
cent Las Olas Drive. Here the Purisima Forma-
tion is characterized by a sandstone facies. The
cliffs are 30 to 38 m in height. The sandstone is
mtcrbedded, pebbly, cross-bedded, moderately
indurated, and weakly jointed. The terrace depos-
its are about 5 m in thickness and consist of poorly
consolidated sands and interbedded pebbles, as
well as a poorly-sorted fluvial conglomerate. A

76 DIVISION OF MINES AND GEOLOGY SP104
Photo 5. Numerous landslides temporarily closed Seaclitf State Beach and adjacent Las Olas Drive. Bedrock is Purisima sandstone. Sawyers have felled top
heavy eucalyptus and cypress trees to make access for crane-supported dragline and track-mounted backhoe. Utility lines were relocated underground during
repair. (Photo by Robert H. Sydnor, October 20, 1989)
cliff
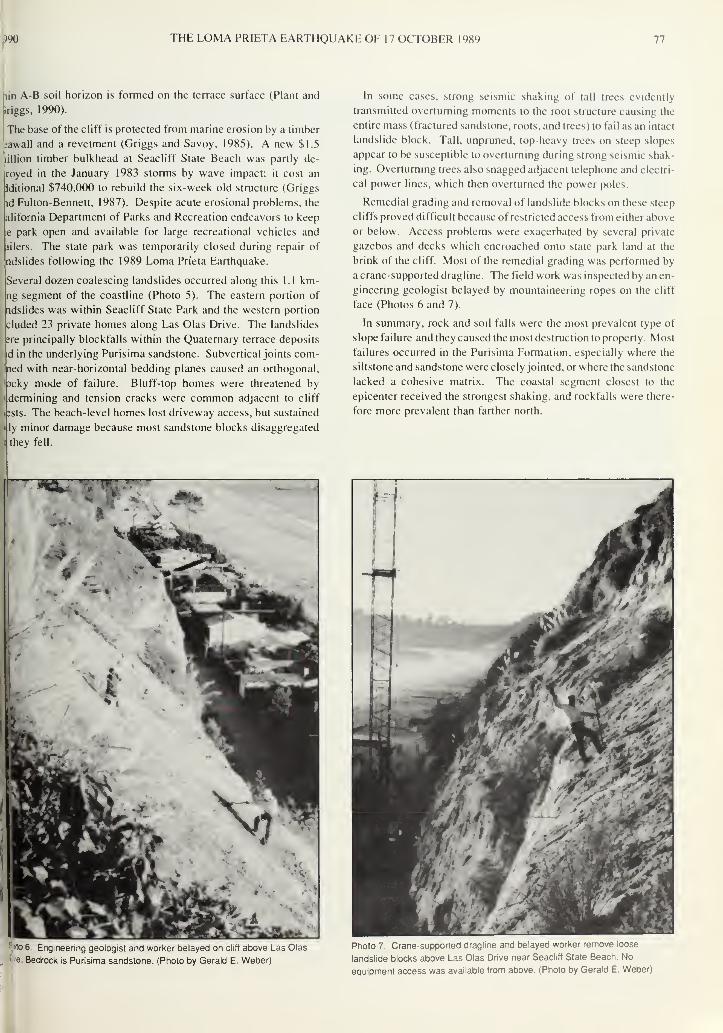
^90 THE LOMA PRIETA EARTHQUAKE OF 17 OCTOBER 1989 77
lin A-B soil horizon is formed on the terrace surface (Plant and
Iriggs, 1990).
The base of the cliff is protected from marine erosion by a timber
awall and a revetment (Griggs and Savoy, 1985). A new $1.5
lillion timber bulkhead at Seacliff State Beach was partly de-
royed in the January 1983 storms by wave impact; it cost an
iditional $740,000 to rebuild the six-week old structure (Griggs
id Fulton-Bennett, 1987). Despite acute erosional problems, the
alifornia Department of Parks and Recreation endeavors to keep
e park open and available for large recreational vehicles and
lilers. The state park was temporarily closed during repair of
ndslides following the 1989 Loma Prieta Earthquake.
Several dozen coalescing landslides occurred along this 1.1 km-
ng segment of the coastline (Photo 5). The eastern portion of
ndslides was within Seacliff State Park and the western portion
eluded 23 private homes along Las Olas Drive. The landslides
;re principally blockfalls within the Quaternary terrace deposits
d in the underlying Purisima sandstone. Subvertical joints com-
ned with near-horizontal bedding planes caused an orthogonal,
Dcky mode of failure. Bluff-top homes were threatened by
dermining and tension cracks were common adjacent to cliff
:sts. The beach-level homes lost driveway access, but sustained
ly minor damage because most sandstone blocks disaggregated
they fell.
In some cases, strong seismic shaking of tall trees evidently
transmitted overturning moments to the root structure causing the
entire mass (fractured sandstone, roots, and trees) to fail as an intact
landslide block. Tall, unpruned, top-heavy trees on steep slopes
appear to be susceptible to overturning during strong seismic shak-
ing. Overturning trees also snagged adjacent telephone and electri-
cal power lines, which then overturned the power poles.
Remedial grading and removal of landslide blocks on these steep
cliffs proved difficult because of restricted access from either above
or below. Access problems were exacerbated by several private
gazebos and decks which encroached onto state park land at the
brink of the cliff. Most of the remedial grading was performed by
a crane-supported dragline. The field work was inspected by an en-
gineering geologist belayed by mountaineering ropes on the cliff
face (Photos 6 and 7).
In summary, rock and soil falls were the most prevalent type of
slope failure and they caused the most destruction to property. Most
failures occurred in the Purisima Formation, especially where the
siltstone and sandstone were closely jointed, or where the sandstone
lacked a cohesive matrix. The coastal segment closest to the
epicenter received the strongest shaking, and rockfalls were there-
fore more prevalent than farther north.
f.rto 6. Engineering geologist and worker belayed on cliff above Las Olas
t 'e. Bedrock is Purisima sandstone. (Photo by Gerald E. Weber)
Photo 7. Crane-supported dragline and belayed worker remove loose
landslide blocks above Las Olas Drive near Seacliff State Beach No
equipment access was available from above. (Photo by Gerald E Weber)

78 DIVISION OF MINES AND GEOLOGY SP10
TRANSLATIONAL LANDSLIDES
Geologic Setting
The second type of seismically-induced failures were larger trans-
lational landslides (Figure 4). These were several meters in thick-
ness, up to 30 m wide, and occurred in the upper 10 to 15 m of the
cliff face where near-vertical more cohesive cliff tops existed before
the earthquake. A 1 to 3 m-vertical scarp cut through the more
cohesive material that was undermined by downslope failure of
underlying, less cohesive soils. Large intact blocks ( 1 to 2 m thick)
and loose sand from the upper portion of the cliff cascaded down the
slope to form an apron of talus. Tension cracks (up to 10 m long)
formed several meters landward of the scarps (Plant and Griggs,
1990). Translational landslides occurred principally in the Rio Del
Mar area. They were not as widespread as rock falls, but locally
caused acute damage.
Sea View Drive Landslide
An example of this type of coastal landslide is the Harts property
on Sea View Drive, Rio Del Mar (Photo 8). A steep canyon is
obliquely cut into the coastal bluff, forming a narrow promontory
with steep relief (=40°) on three sides. Bedrock is friable sands oi
the Purisima Formation, capped by about 2 m of cohesive terrace
deposits. Intense seismic shaking (estimated MMI VIII) evidenfh,
occurred, based on widespread ground cracks on the promontory
These cracks did not occur elsewhere on the terrace surface, bu
were confined to the promontory. After the earthquake the severely
damaged house was dismantled and the slope reduced to a lowei
elevation and slope. A row of homes is situated at the base of the
sea cliffs and was impacted by the slope failure during the earth
quake. To protect these homes from further inundation by the slide
mass, sandy debris was removed from the seaward cliff face anc
placed as engineered fill in the steep side canyon. This remedia
grading increased future stability of the remaining property.
Backward-rotated intact blocks were found in the upper portior
of the Sea View Drive landslide, indicating loss of support frorr
below. It appears that a shallow translational landslide first oc
curred in mid-slope, followed by a progression of failure upslope
towards the more cohesive terrace deposits. These more cohesive
blocks then failed along vertical ped-like joints and rotated back-
ward as they slid downslope. This steep three-sided promontor>
was evidently very vulnerable to intense ground shaking.
Photo 8. Remedial grading at the Sea View Drive landslide in Rio Del Mar. Loose friable sands are being removed and the slope angle reduced. The former
residence was located directly upslope from where the bulldozer is working; only the separate guest house remains. (Photo by Robert H. Sydnor, May 2, 1990)

1990 THE LOMA PRIETA EARTHQUAKE OF 17 OCTOBER 1989 79
hoto 9. Very large dry sand flow above Place de Mer development in Rio Del Mar. Houses at the top and base of this failure were at risk (Airphoto by Gary B.
3riggs, November 1, 1989).
SAND FLOWS
Seologic Setting
South from Rio Del Mar to La Selva Beach and Manresa State
teach, the coastal bluffs consist of the Pleistocene Aromas Sand,
t friable, semi-consolidated formation consisting of eolian and flu-
ial sands (Brabb, 1989; Dupre, 1975; Dupre and Tinsley, 1980;
Alexander, 1953). The coastal bluffs are about 25 to 40 m high. The
'luff faces are unusually steep (30°- 40°) for a friable sandy unit.
The reason is that the bluffs are normally protected from wave
rosion by a wide beach. Sand flows occurred on these steep
'leistocene dune faces (Figure 5) and were limited in geographic
listribution to the coast between Rio Del Mar and Sunset Beach.
5lace de Mer
An example of sand flow occurred above the Place de Merondominium development in La Selva Beach. Refer to Photo 9.
his sand-flow was 2 to 3 m thick and about 100 m wide. The flow
letached from the upper 10 to 15 m of the cliff, just below the near-
ertical cliff in the terrace sands. Hundreds of old automobile tires
ad been stacked on the lower half of this sandy slope for slope
'rotection. These tires proved to be ineffective for either surficial
rosion control or as a retaining device for landsliding.
At the headscarp area vertical tension cracks developed in the
more cohesive terrace deposits. With loss of support from below,
large blocks (1-2 m3) of terrace soil toppled and rolled downslope,
some crossing Oceanview Avenue and nearly reaching the row of
condominiums built at the base of the cliff.
A home on the crest of the hill above the condominiums was
undermined by the landsliding. Its wooden deck and caisson
support were left overhanging by loss of support from below (Photo
10). This home had to be razed. The hilltop building pad was then
lowered in elevation by grading and the seaward-facing slope was
reduced to a safer angle.
Pleistocene Dunes
At Sunset State Beach in the southern-most portion of Santa Cruz
County, the coastal bluffs consist of weakly consolidated Pleisto-
cene dunes of Wisconsin age (Dupre, 1975). The bluffs are about
40-55 m high and the seaward dune face has a slope of about 35°.
These bluffs have been partly stabilized by vegetation. Homes have
been built on the edge of this ancient dune complex. Slope failure
in this area occurred when shallow slabs of sand up to 1 m thick were
detached and translated short distances downslope. One home is
scheduled to be relocated due to this type of dry sand flow ( Plant and
Griggs, 1990).
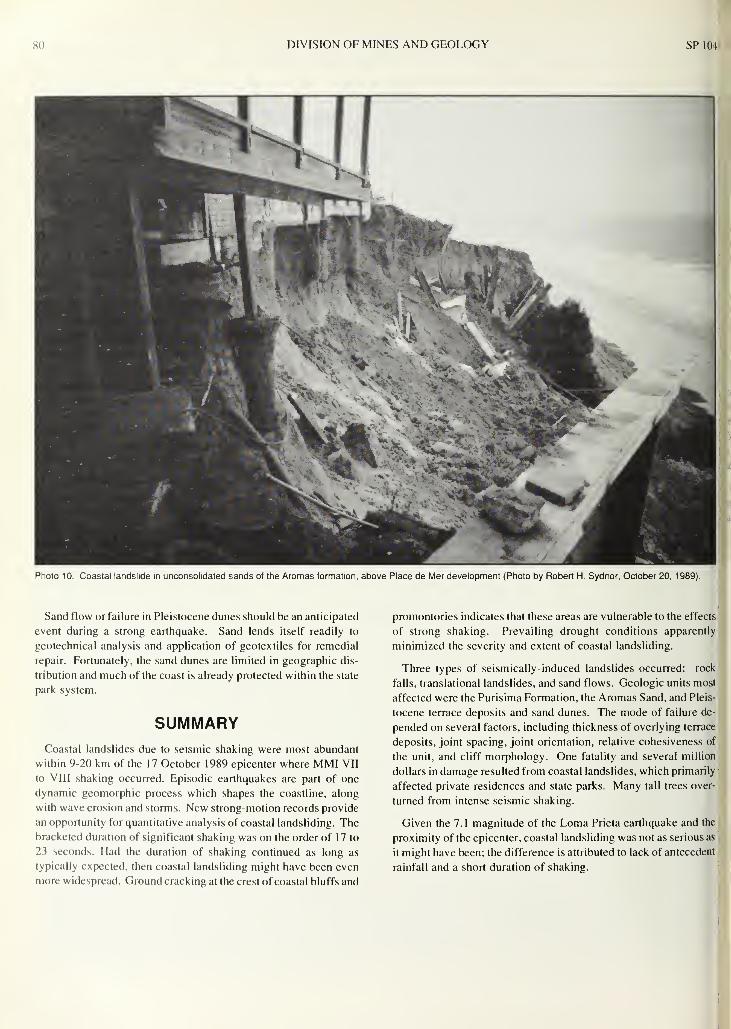
80 DIVISION OF MINES AND GEOLOGY SP104
Photo 10. Coastal landslide in unconsolidated sands of the Aromas formation, above Place de Mer development (Photo by Robert H. Sydnor, October 20, 1989).
Sand flow or failure in Pleistocene dunes should be an anticipated
event during a strong earthquake. Sand lends itself readily to
geotechnical analysis and application of geotextiles for remedial
repair. Fortunately, the sand dunes are limited in geographic dis-
tribution and much of the coast is already protected within the state
park system.
SUMMARYCoastal landslides due to seismic shaking were most abundant
within 9-20 km of the 17 October 1989 epicenter where MMI VII
to VIII shaking occurred. Episodic earthquakes are part of one
dynamic geomorphic process which shapes the coastline, along
with wave erosion and storms. New strong-motion records provide
an opportunity for quantitative analysis of coastal landsliding. The
bracketed duration of significant shaking was on the order of 17 to
23 seconds. Had the duration of shaking continued as long as
typically expected, then coastal landsliding might have been even
more widespread. Ground cracking at the crest of coastal bluffs and
promontories indicates that these areas are vulnerable to the effects
of strong shaking. Prevailing drought conditions apparently
minimized the severity and extent of coastal landsliding.
Three types of seismically-induced landslides occurred: rock
falls, translational landslides, and sand flows. Geologic units most
affected were the Purisima Formation, the Aromas Sand, and Pleis-
tocene terrace deposits and sand dunes. The mode of failure de-
pended on several factors, including thickness of overlying terrace
deposits, joint spacing, joint orientation, relative cohesiveness of
the unit, and cliff morphology. One fatality and several million
dollars in damage resulted from coastal landslides, which primarily
affected private residences and state parks. Many tall trees over-
turned from intense seismic shaking.
Given the 7.1 magnitude of the Loma Prieta earthquake and the
proximity of the epicenter, coastal landsliding was not as serious as
it might have been; the difference is attributed to lack of antecedent
rainfall and a short duration of shaking.

1990 THE LOMA PRIETA EARTHQUAKE OF 17 OCTOBER 1989 81
INSIGHTS GAINED FOR LAND-USEPLANNING
The 1989 Loma Prieta Earthquake was a learning experience for
the geologic community (government, academia, consulting, and
regulatory). Landslides on coastal bluffs provide new insights into
the larger picture of land-use planning and environmental geology.
1
.
Governments should both anticipate and plan for seismically-
induced landslides along the coastline. They are natural events.
Geomorphic agents of earthquakes, marine wave action, and rain-
storms, all affect the occurrence of coastal landslides.
2. Encroachment of manmade structures (homes, roads, utilities,
(etc.) into the coastal zone requires a complete geologic investiga-
I tion. A full understanding of coastal processes, marine erosion,
j
regional seismicity, and Quaternary geomorphology is necessary.
3. Wise land-use planning decisions along the California coast-
line are best addressed by the Geohazards Element of a Local
Coastal Program (LCP) which incorporates detailed geologic infor-
mation into the planning process. The California Coastal Commis-sion reviews and approves the LCP for adequacy. Most of the
permitting process is then released to local government agencies.
The Geohazards Element of most LCPs needs systematic update to
include 1989 Loma Prieta earthquake ground-motion information
and consideration of seismically-induced coastal landslides.
4. Systematic geologic mapping is needed at a detailed scale for
those coastal cliff areas where development is anticipated. The mapscale should be sufficiently large (such as 1 : 1 ,200 or larger) so that
landslide data can be plotted. Prudent site-specific planning deci-
sions can then be made along the coastline.
5. Depending upon the relative exposure to coastal landslides,
local building officials may wish to encourage homeowners with
unsafe conditions to remedy geologic hazards by corrective grading
and/or structural repairs. The building official also has the power
under Section 203 of the Uniform Building Code to convene
hearings for hazard abatement.
6. Older flight lines of low-level stereoscopic aerial photographs
are available for much of the California coastline. They are a
valuable research tool for semi-quantitatively estimating erosion
rates and locating areas of previous landsliding activity. Several
aerial photograph libraries which have imagery ofcoastal landslides
are listed in the Appendix.
7. Efficient reconnaissance of coastal bluffs can be performed
shortly after an earthquake by use of a hand-held video camera from
a low-flying aircraft. Aerial oblique photographs are also very
useful.
8. Trees which are both tall and top-heavy, such as eucalyptus ami
cypress, apparently do not perform well on coastal bluffs during
earthquakes. Native shrubs and native dwarf trees appear to be
optimum for four reasons: (1) good root strength for erosion
control, (2) adequate natural growth without need for artificial
watering, (3) lower susceptibility to intense seismic shaking and
overturning, (4) minimal snagging hazard to adjacent aerial utility
lines along coastal cliffs.
ACKNOWLEDGMENTSWe appreciate drafting of several figures by Joy Sullivan and Frances Rubish, and the layout by
Ross Martin. Thanks are also due to Jeffrey K. Howard, Stephen R. McNutt, John P. Schlosser, and
Timothy P. McCrink for critical review. William R. Cotton, Patrick O. Shires, and Mark G. Smelser
kindly provided information about the Sea View Drive landslide in Rio Del Mar.
APPENDIX
Special Aerial Photograph Libraries of the California Coastline
Fairchild Airphoto Library
Geology Department
Whittier College, Whittier, California 90608
telephone (213) 693-0771, ext. 419
1,222 separate flights, beginning in 1928.
Airphoto Library
U.S. Geological Survey, Mail Stop 955, Building 5
345 Middlefield Road, Menlo Park, California 94025
telephone (415) 329-5009
California Coastal Commission
631 Howard Street,
San Francisco, California 94105
telephone (415) 543-8555
Imagery begins in the early 1970s, with new coastal flights every four
years.
The libraries of several campuses of the University of California
(particularly Santa Cruz, Santa Barbara, Los Angeles, and SanDiego) also contain special libraries of older stereoscopic aerial
photographs taken along the California coastline. Many private
photogrammetry firms also have an inventory of older aerial
photographs.
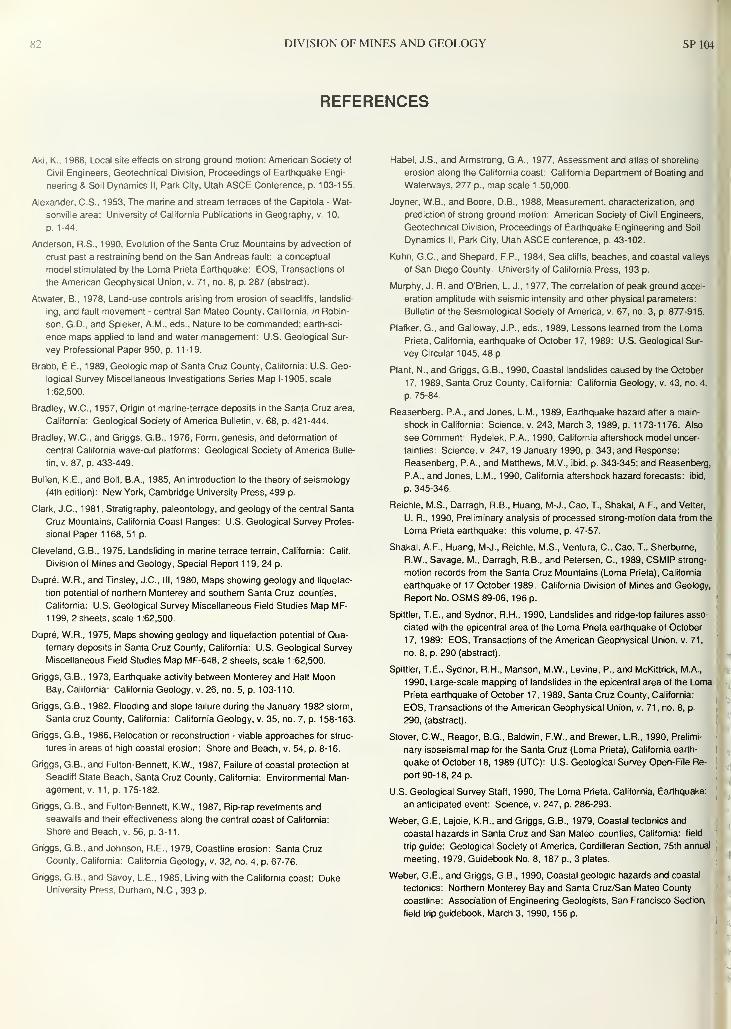
82 DIVISION OF MINES AND GEOLOGY SP104
REFERENCES
Aki, K., 1988, Local site effects on strong ground motion: American Society of
Civil Engineers, Geotechnical Division, Proceedings of Earthquake Engi-
neering & Soil Dynamics II, Park City. Utah ASCE Conference, p. 103-155.
Alexander, C.S., 1953, The marine and stream terraces of the Capitola - Wat-
sonville area: University of California Publications in Geography, v. 10,
p. 1 -44.
Anderson, R.S., 1990, Evolution of the Santa Cruz Mountains by advection of
crust past a restraining bend on the San Andreas fault: a conceptual
model stimulated by the Loma Prieta Earthquake: EOS, Transactions of
the American Geophysical Union, v. 71, no. 8, p. 287 (abstract).
Atwater, B., 1978, Land-use controls arising from erosion of seacliffs, landslid-
ing, and fault movement - central San Mateo County, California, in Robin-
son, G.D., and Spieker, A.M., eds., Nature to be commanded; earth-sci-
ence maps applied to land and water management: U.S. Geological Sur-
vey Professional Paper 950, p. 11-19.
Brabb, E.E., 1989, Geologic map of Santa Cruz County, California: U.S. Geo-
logical Survey Miscellaneous Investigations Series Map 1-1905, scale
1 :62,500.
Bradley, W.C., 1957, Origin of marine-terrace deposits in the Santa Cruz area,
California: Geological Society of America Bulletin, v. 68, p. 421-444.
Bradley, WO, and Griggs, G.B., 1976, Form, genesis, and deformation of
central California wave-cut platforms: Geological Society of America Bulle-
tin, v. 87, p. 433-449.
Bullen, K.E., and Bolt, B.A., 1985, An introduction to the theory of seismology
(4th edition): New York, Cambridge University Press, 499 p.
Clark, J.C., 1981 , Stratigraphy, paleontology, and geology of the central Santa
Cruz Mountains, California Coast Ranges: U.S. Geological Survey Profes-
sional Paper 1168, 51 p.
Cleveland, G.B., 1975, Landsliding in marine terrace terrain, California: Calif.
Division of Mines and Geology, Special Report 1 19, 24 p.
Dupre, W.R., and Tinsley, J.C., III, 1980, Maps showing geology and liquefac-
tion potential of northern Monterey and southern Santa Cruz counties,
California: U.S. Geological Survey Miscellaneous Field Studies Map MF-
1 199, 2 sheets, scale 1 :62,500.
Dupre, W.R., 1975, Maps showing geology and liquefaction potential of Qua-
ternary deposits in Santa Cruz County, California: U.S. Geological Survey
Miscellaneous Field Studies Map MF-648, 2 sheets, scale 1 :62,500.
Griggs, G.B., 1973, Earthquake activity between Monterey and Half MoonBay, California: California Geology, v. 26, no. 5, p. 103-1 10.
Griggs, G.B., 1982, Flooding and slope failure during the January 1982 storm,
Santa cruz County, California: California Geology, v. 35, no. 7, p. 158-163.
Griggs, G.B., 1986, Relocation or reconstruction - viable approaches for struc-
tures in areas of high coastal erosion: Shore and Beach, v. 54, p. 8-16.
Griggs, G.B , and Fulton-Bennett, K.W., 1987, Failure of coastal protection at
Seacliff State Beach, Santa Cruz County, California: Environmental Man-
agement, v. 11, p. 175-182.
Griggs, G.B., and Fulton-Bennett, K.W., 1987, Rip-rap revetments and
seawalls and their effectiveness along the central coast of California:
Shore and Beach, v. 56, p. 3-1 1
.
Griggs, G.B., and Johnson, R.E., 1979, Coastline erosion: Santa Cruz
County, California: California Geology, v. 32, no. 4, p. 67-76.
Griggs, G.B., and Savoy, L.E., 1985, Living with the California coast: Duke
University Prfss, Durham, N.C., 393 p.
Habel, J.S., and Armstrong, G.A., 1977, Assessment and atlas of shoreline
erosion along the California coast: California Department of Boating and
Waterways, 277 p., map scale 1 :50,000.
Joyner, W.B., and Boore, D.B., 1988, Measurement, characterization, and
prediction of strong ground motion: American Society of Civil Engineers,
Geotechnical Division, Proceedings of Earthquake Engineering and Soil
Dynamics II, Park City, Utah ASCE conference, p. 43-102.
Kuhn, G.C., and Shepard, F.P., 1984, Sea cliffs, beaches, and coastal valleys
of San Diego County: University of California Press, 193 p.
Murphy, J. R. and O'Brien, L. J., 1977, The correlation of peak ground accel-
eration amplitude with seismic intensity and other physical parameters:
Bulletin of the Seismological Society of America, v. 67, no. 3, p. 877-915.
Plafker, G., and Galloway, J. P., eds., 1989, Lessons learned from the Loma
Prieta, California, earthquake of October 17, 1989: U.S. Geological Sur-
vey Circular 1045, 48 p.
Plant, N., and Griggs, G.B., 1990, Coastal landslides caused by the October
17, 1989, Santa Cruz County, California: California Geology, v. 43, no. 4,
p. 75-84.
Reasenberg, P.A., and Jones, L.M., 1989, Earthquake hazard after a main-
shock in California: Science, v. 243, March 3, 1989, p. 1 173-1 176. Also
see Comment: Rydelek, P. A., 1990, California aftershock model uncer-
tainties: Science, v. 247, 19 January 1990, p. 343; and Response:
Reasenberg, P. A., and Matthews, M.V., ibid, p. 343-345; and Reasenberg,
P.A., and Jones, L.M., 1990, California aftershock hazard forecasts: ibid,
p. 345-346.
Reichle, M.S., Darragh, R.B., Huang, M-J., Cao, T., Shakal, A.F., and Vetter,
U. R., 1990, Preliminary analysis of processed strong-motion data from the
Loma Prieta earthquake: this volume, p. 47-57.
Shakal, A.F., Huang, M-J., Reichle, M.S., Ventura, C, Cao, T., Sherburne,
R.W., Savage, M., Darragh, R.B., and Petersen, C, 1989, CSMIP strong-
motion records from the Santa Cruz Mountains (Loma Prieta), California
earthquake of 1 7 October 1989: California Division of Mines and Geology,
Report No. OSMS 89-06, 196 p.
Spittler, T.E., and Sydnor, R.H., 1990, Landslides and ridge-top failures asso-
ciated with the epicentral area of the Loma Prieta earthquake of October
17, 1989: EOS, Transactions of the American Geophysical Union, v. 71
,
no. 8, p. 290 (abstract).
Spittler, T.E., Sydnor, R.H., Manson, M.W., Levine, P., and McKittrick, M.A.,
1990, Large-scale mapping of landslides in the epicentral area of the Loma
Prieta earthquake of October 17, 1989, Santa Cruz County, California:
EOS, Transactions of the American Geophysical Union, v. 71 , no. 8, p.
290, (abstract).
Stover, C.W., Reagor, B.G., Baldwin, F.W., and Brewer, L.R., 1990, Prelimi-
nary isoseismal map for the Santa Cruz (Loma Prieta), California earth-
quake of October 18, 1989 (UTC): U.S. Geological Survey Open-File Re-
port 90-18, 24 p.
U.S. Geological Survey Staff, 1990, The Loma Prieta, California, Earthquake:
an anticipated event: Science, v. 247, p. 286-293.
Weber, G.E, Lajoie, K.R., and Griggs, G.B., 1979, Coastal tectonics and
coastal hazards in Santa Cruz and San Mateo counties, California: field
trip guide: Geological Society of America, Cordilleran Section, 75th annual
meeting, 1979, Guidebook No. 8, 187 p., 3 plates.
Weber, G.E., and Griggs, G.B., 1990, Coastal geologic hazards and coastal
tectonics: Northern Monterey Bay and Santa Cruz/San Mateo County
coastline: Association of Engineering Geologists, San Francisco Section,
field trip guidebook, March 3, 1990, 156 p.

THE SEARCH FOR FAULT RUPTURE
AND SIGNIFICANCE OF RIDGETOP FISSURES,
SANTA CRUZ MOUNTAINS, CALIFORNIA
by
Earl W. Hart1
, William A. Bryant 1
, Christopher J. Wills1
, and Jerome A. Treiman 1
ABSTRACTInvestigations following the 1989 Loma Prieta earthquake revealed no convincing evidence that primary surface
faulting occurred on the San Andreas or other faults in the epicentral area. However, triggered slip did occur on the
Calaveras fault in Hollister. In contrast, extensive fault-like fissures developed on several ridges near and southwest
of the San Andreas fault.
Some of these fissures, many of which are large, follow pre-existing scarps and depressions, indicating previous dis-
placements. These features are clearly hazardous and avoidable, similar to active faults. Other fissures, however,
do not correspond with specific geomorphic features and to some extent are distributive. The latter constitute a less
predictable hazard that needs to be addressed, possibly by the use of specially reinforced foundations or other means.
This is a dilemma for zoning provisions of local government.
The fissures also are a dilemma for implementation of the Alquist-Priolo Special Studies Zones Act, which is intended
to mitigate the hazard of surface faulting by means of avoidance. Our concern relates to the facts that the fissures (1
)
are largely caused by shaking and are more likely to be related to landsliding than faulting, and (2) are partly distributive
and therefore difficult to avoid.
INTRODUCTION
Immediately after the 1 7 October 1989 earthquake the entire staff
>f the Fault Evaluation and Zoning Project was dispatched to search
; or fault rupture. The purposes of our response were to: ( 1 ) map any
urface faulting, and (2) evaluate the accuracy and effectiveness of
,xisting Special Studies Zones (SSZs) established under the Alquist-
'riolo Special Studies Zones (APSSZ) Act.
' Our response plan was to first determine the distribution and nature
K surface faulting and then map the ruptures in greater detail. After
hree days of field work, it was evident that significant primary surface
upture did not occur in the epicentral area along the San Andreas fault
i hr on adjacent parts of the Sargent and Zayante faults. However,
linor coseismic slip was triggered on the Calaveras fault in and north
,'f Hollister and possibly on the San Andreas fault in and south of San
uan Bautista.
,More impressive were the many large fissures that developed on
idgetops and damaged a number of buildings and other structures.
Although many of the fissures were within existing Special Studies
I'.ones, it was decided that detailed fissure mapping would be left to
thers— including the U. S. Geological Survey, Santa Cruz County
;:ooperative mapping with DMG), and various consulting geologists
— to avoid duplicated mapping field work. Much of that preliminary
work is now available and it is apparent that some geologists consider
the fissures to be secondary faults probably related to tectonic uplift
of the ridge (e.g., Wells and others, 1989; Plafker and Galloway,
1989; USGS, 1990; Cotton and others, this volume). Other geologists
(e.g., Baumann and others, 1990; Hempen. 1990; this paper) believe
that the fissures are largely due to intense shaking effects. The
question of origin may be difficult to prove, but there is no doubt that
some of the fissures are fault-like, having significant vertical and/or
lateral components of slip. As such, they are a threat to buildings and
other structures. Because some of these fissures are fault-like in
character and tend to occur along known geomorphic features (linear
scarps and depressions) near active faults these features are problem-
atic in terms of their identification and cause.
Under California law, the State Geologist is required to establish
Special Studies Zones around active faults in order to mitigate the
hazard of surface faulting to structures for human occupancy (Hart,
1988). Cities and counties must regulate most projects within the
SSZs by requiring geologic site-investigations prior to issuing devel-
opment permits. Structures for human occupancy must not be
constructed over an active fault trace.
California Department of Conservation, Division of Mines and Geology, Geologic Hazards Assessment Program
83

84 DIVISION OF MINES AND GEOLOGY SP104
FAULT RUPTURE INVESTIGATION
Two teams of DMG geologists from the Fault Evaluation and
Zoning Project were sent into the epicentral area early the following
morning (within 15 hours) after the main shock of the Loma Prieta
earthquake. Efforts during several days of field investigations (Oc-
tober 1 8-20 and 27) were concentrated along previously mapped and
zoned traces of the San Andreas fault between Alma College
(locality D, Figure 1 ) and the Cienega Winery (locality H, Figure 1 ).
Selected traces of the Calaveras, Sargent, and Zayante faults were
also checked. Only sparse and equivocal evidence of surface fault
rupture was observed along the San Andreas fault. Based on the
worldwide data base of Bonilla and others (1984), primary surface
rupture with at least 1 m of displacement would be expected for a
Ms7. 1 earthquake. Triggered slip occurred along the Calaveras fault
and possibly along strands of the San Andreas fault in and south of
San Juan Bautista (localities G- J, Figure 1). No evidence of surface
fault rupture was observed along traces of the southern Sargent and
Zayante faults that had been zoned by the State Geologist (Figure 1).
Equivocal evidence of surface fault rupture along the San Andreas
fault was found at Mt. Madonna Road, which was right-laterally
offset 2.7 cm (locality D, Figure 1). These cracks were followed
northwest into colluvium exposed in a roadcut that also was right-
laterally offset. Although extensional cracks were traced dis-
continuously for about 1 km northwest of Mt. Madonna Road along
a northeast-facing scarp, evidence of systematic right-lateral offset
was not observed.
45'-
30'
T—
INDEX TO 7.5-MINUTE QUADRANGLES
a. Castle Rock Ridge g. Watsonville East
b. Los Qatos h. Chittenden
c. Laurel 1. San Felipe
d. Loma Prieta j. San Juan Bautista
e.
f.
Mt. Madonna
Watsonville West
k. Hollister
n
>
31
37°00'
122°00' 45' 30'
Figure 1 Location of the San Andreas and related faults in the epicentral area of the Ms7 1 Loma Prieta earthquake. Quadrangle boundaries indicate areas of
Special Studies Zones Maps that were checked for evidence of surface fault rupture after the earthquake. Heavy lines indicate faults previously zoned for Special
Studies under the Alquist Priolo Special Studies Zones Act of 1972; light lines indicate faults not zoned. Location of the Ms7.1 epicenter is shown by the hexagon;
arrows indicate the approximate extent of the mainshock subsurface rupture zone. Letters A-K indicate specific localities referred to in text; localities 15 and 16 are
described in Table 1

990 THE LOMA PRIETA EARTHQUAKE OF 17 OCTOBER 1989 85
It is not certain if the observed right-lateral offset at Mt. Madonna
(oad is meaningful because shaking and downslope movement may
lave produced the observed right-lateral offset. It is also not clear
f any afterslip occurred at this site. Measurements of displacement
Tom a USGS quadrilateral array installed two days after the earth-
uake are no larger than the resolution of the survey methods (J.D.
Jims, personal communication, February 28, 1990).
jEvidence of surface fault rupture along the San Andreas fault to
,ie northwest and southeast of locality D (Figure 1 ) is even more un-
iertain and equivocal. For example, 13 to 14 cm of right-lateral
jffset and compression occurred in the northbound lanes of High-
jay 17 (locality B, Figure 1), but the rupture did not continue north-
westward across the southbound lanes. As the road at this locality
Ilargely on fill, the ruptures are believed to be due to shaking,
ompressional fractures also occurred in pavement of San Jose
oad along the San Andreas fault (locality C, Figure 1), but these
,jcur over a road fill prism and are considered to be caused by
laking. About 5 cm of right-slip was observed along a 15- to 20-
•n-wide fissure at locality E (Figure 1 ). Because this locality is 300
northeast of the mapped trace of the San Andreas fault (Bryant and
hers, 1981 ) and because it occurs on a naturally benched slope, we
,;lieve this feature is a reactivation of a landslide. Several other
,acture zones along the San Andreas fault revealed minor right-
teral extension, but all are considered most likely to be due to
:aking effects. However, minor discontinuous faulting could
isily be obscured by the numerous shaking cracks and fissures.
In contrast to the surprising absence of primary surface faulting on
e San Andreas fault, triggered slip occurred as expected along the
eeping segment of the Calaveras fault in the Hollister area. Left-
jpping, en echelon cracks were observed in an unpaved baseball
amond just south of 7th Street in Hollister (locality I, Figure 1).
ght-lateral offset along this N5°W-trending zone of cracks was
out 4 mm. Because this observation was made less than 24 hours
ter the earthquake, these cracks apparently formed coseismically.
Additional evidence of triggered slip along the Calaveras fault
:ludes a minor fracture in soil and a freshly cracked concrete curb
5th Street in Hollister (locality I, Figure 1) and fresh hairline
<jcks in Shore Road (locality J, Figure 1). About 5 mm of triggered
p was recorded by a creepmeter at Shore Road (McClellan and
ty, 1989). Triggered slip also was observed at Shore Road after
: 1984 M6.2 Morgan Hill earthquake and the 1979 Coyote Lake
rthquake (Schultz, 1984). About 5 mm of right-lateral offset was
• served by McClellan and Hay (1989) 90 hours after the earth-
fake at Highway 152 north of San Felipe Lake (locality K, Figure
Hairline cracks suggestive of triggered slip also formed along
'ep-active traces of the San Andreas fault near San Juan Bautista
id south of Hollister (localities F-H, Figure 1).
The lack of primary surface rupture on the San Andreas fault
• ring the Loma Prieta earthquake is not fully understood. Prior
irldwide earthquake data provide an expectation that a Ms7.1
'ihquake would be associated with 1 to 2 m of right-lateral
< placement (Bonilla and others, 1984). The 18 km focal depth, the
SW dip of the fault, and the reverse oblique sense ofdisplacement
1 6 m right-lateral; 1 .2 m vertical, southwest side up; Lisowski and
«iers, 1990) are unusual for the San Andreas fault and may have
i ltributed to the lack of surface fault rupture. It is also significant
1 1 the aftershock distribution did not extend to the surface (Plafker
i\ Galloway, 1989).
The lack of discrete surface fault rupture along the San Andreas
fault in the area may not be unique. No through-going surface fault
rupture in this area was reported after the 1906 earthquake (E.P.
Carey, in Lawson, 1908), although detailed geologic surface map-
ping was not undertaken. Approximately 1 .4 in ofright slip occurred
in the old South Pacific Coast Railroad Company tunnel near
Wrights Station in 1906 (Figure 2). but this displacement apparently
did not extend to the surface.
Geomorphic expression of the San Andreas fault in the LosGatos,
Laurel, and northwestern Loma Prieta quadrangles, as viewed on
stereoscopic aerial photographs (National Archives, 1939; USGS,
1966), is only weakly developed and largely concealed b\ massive
landslides and heavy vegetation. Sarna-Wojcicki and others (1975)
have portrayed the fault zone in this area as a wide zone (up to 2 km)
of discontinuous traces that are partly obscured by landslides. They
also show the fault zone as having a more westerly trend than
adjacent segments of the San Andreas fault zone. It is not clear if
the lack of a well-defined surface trace is due to distributive defor-
mation along this compressional bend or to the obscuring effects of
massive landsliding.
RIDGETOP FISSURES
A large number of fault-like fissures and associated fractures
developed in the epicentral region during the Loma Prieta earth-
quake. Most of the fissures occurred along the ridge of Summit Road
and on Skyland Ridge to the southeast (Figure 2). Similar fissures
were noted on ridgetops to the southwest at localities 15 and 16
(Figure 1). These fissures are notable because of their size and
continuity, association with existing linear depressions and scarps,
and almost exclusive location on the uplifted southwestern block of
the San Andreas fault. Some geologists believe these extensional
features are tectonic (Cotton and others, this volume; Plafker and
Galloway, 1989; Wells and others, 1989; USGS, 1990) but recog-
nize that lateral spreading of ridges due to shaking may have
enhanced them. In contrast, we believe that intense shaking is the
dominant factor in forming the fissures. (Refer to Shakal and others,
this volume, who document a significant 0.50 g to 0.60 g horizontal
and vertical peak acceleration in the near- field.) Regardless of
origin, it is clear that the larger fissures and fractures are hazardous
to buildings and other structures.
By far the largest concentration of fissures occurs in the Summit
Road-Skyland Ridge area (Figure 2). This area was mapped in detail
by the USGS (Wells and others, 1989) to identify those fissures1 and
associated fractures thought to be tectonic in origin (i.e., regional
uplift). The identification of tectonic fractures by the USGS appar-
ently was based on linearity, continuity along trend, relatively large
vertical or lateral displacements, and general coincidence with linear
topographic features (USGS, 1990). Although extensional displace-
ment was dominant, vertical and left-lateral components of slip
suggested flexural-slip (i.e. secondary) faulting. Many additional
fissures were mapped in the Summit Road-Skyland Ridge area
without regard to origin by DMG in cooperation with Santa Cruz
County, the USGS, and various consulting geologists (Spittler and
Harp, 1990). Most of these features appear to us to be landslide
related, but selected linear traces that are parallel to the traces of
Wells and others (1989) are shown on Figure 2.
'The USGS has used the term "fractures" and "cracks" to identify the large
extensional features discussed here as fissures. We prefer the term "fissure"
which identifies the dominantly extensional character of these fracture zones.
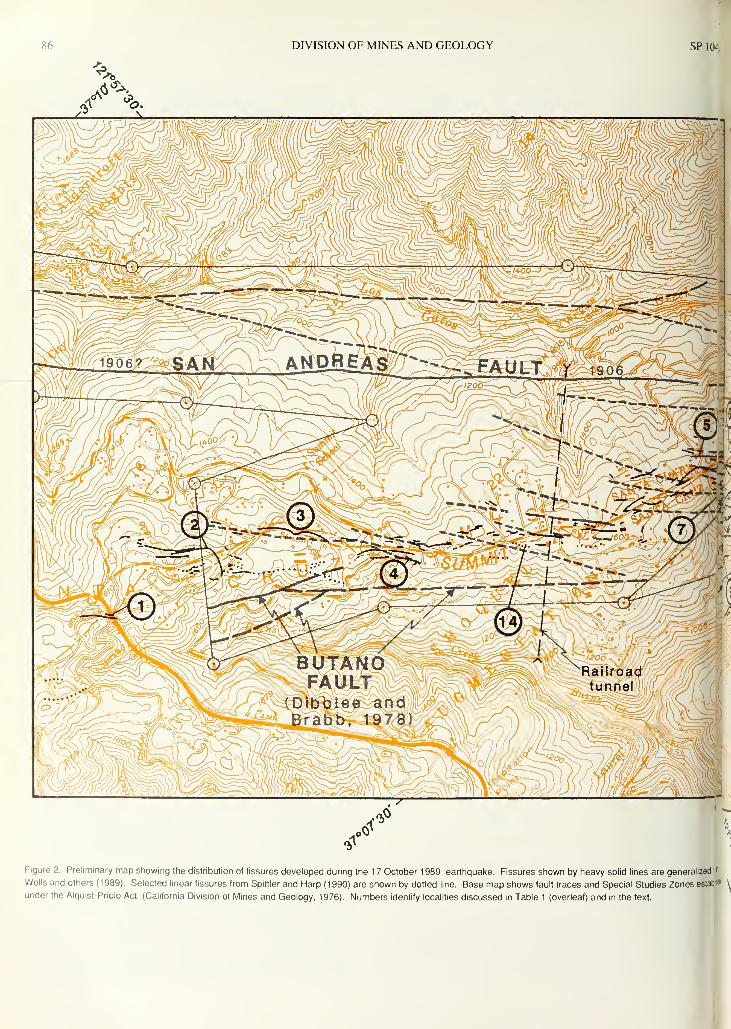
86 DIVISION OF MINES AND GEOLOGY SP1(>!
Figure 2. Preliminary map showing the distribution of fissures developed during the 17 October 1989 earthquake. Fissures shown by heavy solid lines are generalized'"
Wells and others (1989). Selected linear fissures from Spittler and Harp (1990) are shown by dotted line. Base map shows fault traces and Special Studies Zones estate \
under the Alquist-Priolo Act (California Division of Mines and Geology, 1976). Numbers identify localities discussed in Table 1 (overleaf) and in the text.

990 THE LOMA PRIETA EARTHQUAKE OF 17 OCTOBER 1989 87
Base compiled by U.S. Geological Survey, 1968 and 1973
XSCALE 1:24,000
.5
a1 Mile
3000 5000 7000 Feet
1 Kilometer

DIVISION OF MINES AND GEOLOGY SP lfc
Table 1
Locality descriptions of significant fissures and fracture zones developed on or near ridgetops during the
17 October 1989 Loma Prieta Earthquake (see Figure 2 for localities 1-14 and Figure 1 for localities 15-16).
1. Highway 17 pavement offset 40 cm vertically (south side up); bedding-plane fractures in steeply dipping mudstone unit of Vaqueros Sandstone are
exposed in high road cuts; attributed to coseismic secondary faulting (flexural slip) by Cotton and others (this volume). Two narrow fissure zones each
with up to a few centimeters of extension and minor down-to-the-north offset in paved road to northwest. Not obviously associated with a geomorphic
feature, but faulted colluvial wedge exposed in east highway cut indicates previous down-to-the-north displacements along fracture zone.
2. Large ridgetop fissure with as much as 79 cm net displacement - mostly extensional with significant vertical (down to south) and left-lateral compo-
nents of displacement; mostly a narrow, well-defined fissure zone, but partly branching and diffuse; follows pre-existing, somewhat sinuous drainage
swale (subtle in part). Severely damaged local water supply system and offset Summit Road. Fissures are in Vaqueros Sandstone (Dibblee and
Brabb, 1978).
3. Somewhat sinuous fissure with as much as 40 cm total displacement—extensional and vertical (down to southwest); follows base of existing
southwest-facing scarp and drainage swale. Fissure zone is in Vaqueros Sandstone (Dibblee and Brabb, 1978).
4. Linear fissure zone with up to 19 cm of net extension and down-to-northeast offset; follows well-defined north-facing scarp along margin of linear de-
pression. Southeast end of zone at damaged house had estimated 5 to 7 cm extension and minor subsidence. In Vaqueros Sandstone (Dibblee and
Brabb, 1978).
5. 600 m-long fissure zone. Northwestern part had 22 cm of left-lateral extension at Morrill Road in same location where at least 1m of left-lateral offset
occurred in 1906 (Wells and others, 1989; Lawson, 1908); segment is well-defined by prominent northeast-facing scarp. Southeast segment is
weakly defined by swale. Complexly interconnects with other fissure zones which are not as well-defined geomorphically. Fissure partly follows
Butano fauit of Dibblee and Brabb (1978).
6. Ground surface around a water-well pad and within a 5 m- wide fissure zone subsided 20 cm; indicates shallow subsidence caused by shaking and not
tectonic subsidence; fissures occur in broad swale. In Butano sandstone near Butano fault.
7. Two zones of fissures/fractures pass under and damage two buildings and paving of C.T. English Middle School; total extension across building site is
23 cm (J. Cottingham, 1990, personal communication). Trenches excavated in January 1990 indicate about 2.5 m previous vertical offset of Butano
Formation against soil/colluvium (northeast side down). Also, one fissure filled with soft soil may represent a 1906 fissure or other recent event
(Geary Consultants, 1990). In Butano sandsone and siltstone (Dibblee and Brabb, 1978).
8. Minor to moderate extensional cracking and differential settlement of Loma Prieta School buildings and pavement. Fissures and cracks are somewhat
distributive, but partly correspond to "faults" previously identified in trenches by Johnson (1989), which caused this public school to be closed prior to
earthquake; report identifies offset colluvium as young as 2,180 ybp, soil-filled fissures, and several faults. In Vaqueros Sandstone and near Butano
fault of Dibblee and Brabb (1978).
9. Large extensional fissures with northeast-facing scarps developed on hillslope; fissures turn downslope to the west in benched topography; to east
fissures connect landslide fissures and related features upslope. Fissures are gradational with those at C.T. English School farther upslope, all of
which suggest toppling associated with landsliding. In landslide deposits in San Lorenzo Formation (Clark and others, 1989).
10. Zone of northwest-trending fissures and southwest-facing scarplets becoming arcuate to west; coincides with existing arcuate scarp and associated
bench in large landslide deposit and in Butano sandstone of Dibblee and others (1978). Based on ground inspection and aerial photos, other fractures
mapped near the hamlet called The Willows and to the southeast also occur on hummocky and benched topography and probably are landslide
related.
1 1
.
Fissures with 21 cm of extension at road coincide with a broad trough and closed depression to the west which, along with arcuate pattern of fissure
zone, indicate a landslide feature; slope to the northwest is benched and hummocky. San Lorenzo Formation of Clark and others (1989).
12. Large fissure zone extends diagonally uphill; 33 cm extension at road; crudely follows weak swale, bench, and scarps; left-lateral slip in eastern
segment (Wells and others, 1989) appears to represent the left flank of a large landslide as do other crack zones to the northwest and southeast.
Hillslope is benched and hummocky. Butano shale and sandstone of Clark and others (1989).
13. Extensional cracks in sandstone outcrop in Laurel Creek suggest expansion (bulging) of slopes outward; bedrock is pervasively sheared and bedding
attitudes erratic, suggesting landslide deformation. San Lorenzo Formation of Clark and others (1989).
14. Faults, soil-filled fissures, and possible landslide slip plane identified in trench logs of consultant's report (Foxx, Nielson and Associates, 1988).
Fissures mapped at this locality by Spittler and Harp (1990) closely align with trench features, suggesting repeated activity.
15. Ridgetop fissures parallel to northwest-trending ridge over distance of nearly 0.8 km mapped by Spittler and Harp (1990). Fissures are in steeply
dipping Purisima Formation and Lambert Shale (Clark and others, 1989).
16. Discontinuous fissures noted along both sides and the narrow crest of N20 W-trending ridge; fissures to 25 cm wide are linear and resemble fissures
along Summit Road; Spittler and Harp (1990) show this fissure zone to be 0.6 km long. Two houses and a studio were severely damaged (now torn
down) and at least two had fissures under foundations. Trenching showed at least one fissure to flatten out at depth of about 1m; another fissure
extended into bedrock and was at least 4 m deep. Bedrock is soft sandstone and siltstone of Purisima Formation with nearly horizontal dip (Clark and
others, 1989).

1990 THE LOMA PRIETA EARTHQUAKE OF 17 OCTOBER 1989 89
Photo 1.Portion of sinuous fissure zone in Summit
Road at locality 3 (Figure 2) showing significant
extensional and vertical offset. (Photo by E W. Hart,
10/18/89)
3hoto 2. A near miss: fissure in front of Tranbarger
louse (near locality 2, Figure 2) had significant
Extensional opening as well as vertical displacement
ieen here. Note offset of walkway to front door. (Photo
by C.J. Wills, 10/25/89)
Description of Fissures
Most of the fissures in the Summit Road-Skyland Ridge area have
N50°W to N60°W trend, which is generally parallel to the regional
Tike of Tertiary strata (Dibblee and Brabb, 1978: Clark and others,
j989) as well as the ridgelines. Other fissure zones trend more
i'esterly or northerly and also tend to parallel ridge spurs. Individual
issures tend to be relatively straight, apparently controlled by bed-
!>ck structures (bedding, faults or joints). However, some zones of
Issures are curved, sinuous or irregular (Photo 1) (localities 2, 3. and
J, Figure 2), as well as complexly branching and anastomosing
(localities 2 and 6, Figure 2). Selected fissure localities, field-checked
by us from October 1989 to January 1990, are identified on Figure 2
and described in Table 1.
Fissure zones are as long as 700 m and individual fissures are open
as wide as 0.8 m (Photo 2). Although extension dominates the sense
of displacement, many fissures have vertical components of displace-
ment to 0.4 m and uphill-facing scarps are common. Left-lateral
components of offset are also common and approach 0.4 m at
localities 2 and 5. Right-lateral slip components are less abundant and
smaller (Wells and others, 1989).

90 DIVISION OF MINES AND GEOLOGY SP104
The depth of the fissures generally could not be
determined because thick colluvial soil from the
walls would tend to collapse into the fissures.
However, depths to 4 to 5 m were observed ( Bau-
mann and others, 1990). Presumably, the larger
fissures extended even deeper into bedrock. The
general linearity of fissures and the fact that they
followed existing geomorphic features (linear
depressions, ridgelets, and scarps) indicate that
they are anchored in bedrock and probably follow
bedding planes, faults, and joints. Exposures at
localities 1, 7, and 8 further verify this relation-
ship.
Many fissures are clearly associated with geo-
morphic features indicative of past extension and
vertical displacement (Photo 3). However, the
individual depressions, swales and scarps seldom
exceed 200 to 300 m in length and most lack the
degree of linearity and continuity normally asso-
ciated with recent faulting. Recurrence of dis-
placement has been documented in a road cut at
Highway 17 (locality 1, Table 1; Cotton and
others, this volume), in trenches at two school
sites (localities 7 and 8), and at a residential site
(locality 14). Recurrence also has been docu-
mented at Morrill Road (locality 5) which was
offset left-laterally as much as 0.4 m in 1989 at the same location
where 1.1 m of left-lateral offset was recorded in 1906(Lawson, 1908,
plate 64B; USGS, 1990, p. 290). Other fissures and landslides
reported by Lawson (1908, p. 109-1 13 and 275-278) in the Summit
Road-Skyland Ridge area also appeared to have greater displace-
ments in 1906. For example, Los Gatos Creek near Wright Station
was dammed by a large landslide in 1906 (Lawson, p. 1 10), but no
comparable sliding occurred in 1989.
Origin of Ridgetop Fissures
Many of the fissures in the Summit Road-Skyland Ridge area are
considered to be tectonic in origin by some geologists, based on the
fault-like characteristics and general linearity (e.g. USGS, 1 990). The
fracture zone and offset highway pavement at locality 1 (Figure 2)
were mapped as a bedding-plane fault in both of the 20 m high road
cuts of Highway 1 7 by Cotton and others (this volume). The fractures
parallel bedding in a shale unit of the Vaqueros Formation and offset
a colluvial/soil wedge in the same sense (north side down) as the
pavement of Highway 1 7 and the closely associated fissure zone just
west of the highway.
The evidence for a tectonic origin of other fissures is indirect,
however, being based on the assumed 1.3-0.4 m of uplift and pre-
sumed extension across the southwestern block of the San Andreas
fault (USGS, 1990). Furthermore, some of the fissures follow linear
depressions, scarps and other small-scale geomorphic features often
associated with active faulting. Some of these same geomorphic
features were used by Hall and others (1974) and Sama-Wojcicki and
others ( 1975) to map left stepping en echelon faults in the SummitRoad-Skyland Ridge area. Yet the fissure and fracture zones mappedby Wells and others ( 1989) only coincide to a limited extent with
traces <>l Hall and others (see Figure 2), which is similar to Sama-Wn|i icki and others. This suggests that the fault traces shown in the
Photo 3. Fissure formed along the base of a pre-existing scarp at locality 4 (Figure 2). House at
southeastern end of this fissure (left of photo) was damaged by extension. Linear scarp defines margin
of depression and provides good evidence of previous fissuring. (Photo by E.W. Hart, 10/25/89)
1974 and 1975 publications are rather interpretive and inadequately
predicted the 1989 fissure locations.
Based on our own interpretations of aerial photographs (National
Archives, 1939; USGS, 1966; Air Flight Service, 1989), we were
unable to verify the northwest set of left-stepping faults mapped by
the USGS in 1974 and 1975. What we see in unforested areas is a
rather complex set of short, linear to curved depressions, swales,
scarps, and hummocks that generally parallel the ridgecrest along
Summit Road. There is no question that these features are youthful.
The only question is their origin. Features observed on Skyland Ridge
are less parallel to the ridgetop and associated spurs, being a mosaic
of young hummocks, swales, and benches punctuated with round to
elongate depressions. These ridgetop features are clearly gradational
with the hummocky and benched landslides of the steep slopes of
Skyland Ridge.
Most of the linear, fault-like fissures were concentrated within a
relatively small area on or near ridgecrests. Therefore, it seems
unlikely that the fissures could be caused by tectonic uplift that
extended over a much larger area (USGS, 1990). More likely, the
fissures in the Summit Road-Skyland Ridge area were caused by
intense shaking that caused the ridges to spread laterally and the tops
to settle. The fact that the fissures tend to parallel the ridgecrests and
spurs suggests this is so, and the association of the 1989 fissures and
scarps with existing depressions and scarps demonstrates a repetition
ofevents. The gradational relations with landslide fissures developed
on the flanks of the ridges (Spittler and Harp, 1990) further indicate
a common cause for both types of fissures.
Ridgetop depressions and fissures, and uphill-facing scarps are
relatively common in mountainous terrain in glaciated regions of the
world (Beck, 1968; Tabor, 1971; Radbruch-Hall and others, 1977;\
Bovis, 1982; Savage and Varnes, 1987; Thorsen, 1989; Varnes and

1990 THE LOMA PRIETA EARTHQUAKE OF 17 OCTOBER 1989 91
others, 1989). These features have been largely attributed to lateral
spreading involving gravity and rock creep. Toppling, translation,
and rotational phenomena also contribute to such features.
Models for ridgetop features have been proposed or summarized by
Varnes (1978), Bovis (1982), Savage and Varnes (1987), Thorsen
(1989), and Varnes and others (1989). Ridgetop features and uphill-
facing scarps also can result from seismic shaking and may involve
hills and ridges, as well as high mountains. Beck ( 1 968 ) thought that
uphill-facing scarps in New Zealand were caused by earthquakes.
IRadbruch-Hall ( 1978) associated the 1899 and 1958 earthquakes on
!the Fairweather fault, Alaska, and the 1 97 1 San Fernando earthquake
with lateral spreading of ridges and uphill-facing scarps. We have
noted ridgetop depressions and uphill-facing scarps within a few
kilometers of active faults in the Coast Ranges, Transverse Ranges,
and elsewhere in California and believe that many of the features are
:aused by intense seismic shaking.
The relatively weak rocks that underlie the Summit Road- Skyland
^idge area undoubtedly have contributed to the ridgetop failures and
he landslides observed on these relatively low (200 m-high) ridges,
-igure 3 is a schematic cross section through the ridge along Summit
*oad showing how lateral spreading and ridgetop settling might
rccur. However, the spreading/settling phenomenon probably is very
omplex and no doubt is significantly controlled by bedding planes,
faults, and joints.
The abundant left-lateral fractures reported by Wells and others
1989) have been cited as evidence of tectonic deformation (USGS.
:990). It seems to us that most left-lateral and right-lateral displace-
ments can be explained by shaking-induced lateral movement of
Mgetop blocks towards a free-face. Also, afterslip, which frequently
h observed after normal and strike-slip faulting events, has not been
Measured across any of the fracture zones surveyed by the USGSVI.M. Clark, personal communication, 1990).
, Although we are reasonably confident that shaking and associated
iteral-spreading caused most of the ridgetop fissures, as well as the
fissures associated with landslides on the flanks of ridges, we cannot
rule out a tectonic contribution that may have occurred during the
Loma Prieta earthquake. However, we doubt that a shaking versus
tectonic origin can be consistently demonstrated by trenching or other
normal investigative techniques.
RELATIONSHIP OF FISSURES TOALQUIST-PRIOLO
SPECIAL STUDIES ZONESSubsurface rupture on the San Andreas fault during the Loma Prieta
earthquake extended over a distance of 45 km beneath nine quad-
rangles covered by Special Studies Zones maps (Figure 1 ). These
SSZ maps were issued in 1974, 1976, and 1982 under the Alquist-
Priolo Special Studies Zones Act (Hart, 1988). We fully expected to
have the opportunity to determine the efficacy of these zones, some
of which were based on the work of others ( 1 974 and 1 976 maps ) and
some based mainly on our own mapping (1982 maps). But as
discussed above, there was little evidence that any primary fault
rupture propagated to the ground surface. So, in terms of primary
surface rupture, the SSZ maps have not really been tested.
The numerous fissures developed during the Loma Prieta earth-
quake raise a different set of questions. Are these features actually
secondary faults? How widely distributed are these fissures? What is
the likelihood that fissuring will recur? Although many of these
features formed within the SSZs of the Los Gatos and Laurel quad-
rangles, several formed outside the SSZs (Figure 2).
We feel that the ridgetop fissures are caused largely by intense
shaking, although we recognize that the uplifted southwestern block
of the San Andreas fault probably was associated with some tectonic
stretching. Being unable to prove the absence of faulting, it is difficult
to recommend against zoning the fissures, particularly when some are
clearly related to geomorphic features indicative of repeated events.
In addition, these fault-like features are certainly hazardous to struc-
tures and are best mitigated by avoidance. One possible course of
LARGELANDSLIDE COMPLEX
?
LARGELANDSLIDE COMPLEX
nure 3. Schematic cross section through ridge of Summit Road showing seismically-induced lateral-spreading of ridge. Outward movement of ridge induces
erential settlement forming back-facing scarps and linear depressions on top of ridge. Large landslide complexes, which generally flank ridges, also are activated
J move downslope coseismically. Displacements on ridgetop tend to follow pre-existing faults, bedding planes, or other rock structures, which are not detailed in
; model.

92 DIVISION OF MINES AND GEOLOGY SP104
Photo 4 Looking southeast at uphill-facing scarp and associated fissures along sidehill bench at locality 9 ( Figure 2); note knife for scale. Features are similar to
fault-like fissures on ridgecrest above but appear to interconnect with landslide features to northwest and southeast. Presence of bench indicates previous rupture
events. (Photo by W. A. Bryant, 1/1 1/90)
action would be to treat the features like faults and to zone them under
the APSSZ Act. This would precipitate the need for a consulting
geologist to evaluate sites proposed for new construction on a case-
by-case basis.
The problem with this course of action is that the fault-like fissures
are very similar to fissures that develop on landslides which are not
zonable under the APSSZ Act (Photo 4). Elsewhere in California wehave made a conscious effort in the past not to zone lateral spreading
or landslide features.
The 1989 fault-like fissures also are associated with lesser fissures
that are distributed over the entire Summit Road-Skyland Ridge area.
These minor fissures create a dilemma for those who propose new
building in the epicentral area. Although these fissures may be
somewhat less damaging than larger ones, they are more difficult to
avoid due to their abundance. It may be possible to mitigate potential
damage to structures by design of a specially reinforced foundation
for a structure. We observed that smaller fissures and fractures were
at least partly diverted around the foundations of several structures.
As an alternative to avoiding all possible future ruptures, it may be ap-
propriate to avoid the more obvious fault-like fissures and to design
structures to resist or otherwise accommodate displacement by minor
fissures.
In order to decide which fissures are landslide-related and which are
not, more needs to be known about the various fissures. These
features are still being evaluated by DMG and others.

wo THE LOMA PRIETA EARTHQUAKE OF 17 OCTOBER 1989
CONCLUSIONS
93
In spite of the large size of the Ms7. 1 Loma Prieta earthquake, there
as no through-going primary surface rupture in the epicentral area
ong the San Andreas fault. If surface faulting occurred, it was minor,
scontinuous, and generally obscured by extensional cracks and
;sures caused by shaking. The best evidence of surface faulting was
Mt. Madonna Road (locality D) where 2.7 cm of right-lat ;al
tsplacement was observed shortly after the earthquake. Because this
rface rupture is minor and discontinuous, it seems unlikely to be
imary. No evidence of fault rupture was observed on the Sargent or
lyante faults in the epicentral area. The general absence of primary
rface rupture on the San Andreas fault came as a complete surprise
geologists, even though the subsurface rupture was abnormally
ep and contained a large component of reverse slip (compression).
Triggered slip occurred 36-46 km from the epicenter along the
iilaveras fault from the town of Hollister to San Felipe Lake
<j ighway 1 52 ) with maximum right-lateral slip of about 5 mm. Some»i this slip was coseismic. Additional minor triggered slip may have
iicurred near San Juan Bautista and to the southeast on the San
.ldreas fault. Triggered slip also may have occurred within the
(icentral area to the northwest (such as at locality D, Figure 1 ), but
'buld be difficult to distinguish from other shaking cracks.
The extensive fissuring that developed on the uplifted southwestern
pck of the San Andreas fault was perhaps as surprising as the lack
surface faulting. The most abundant fissures developed in the
mmit Road-Skyland Ridge area (Figure 2), where some fissure
les attained lengths of 0.7 km and net displacements to 0.8 m(ostly extensional but commonly including vertical and left-lateral
nponents). Some geologists believe that fissures at or near the
getops are caused by tectonic uplift and secondary faulting. We
believe that secondary faulting may be a causative factor, but that
lateral spreading of the ridges caused by shaking is the dominant
cause of fissuring. The fact that many of the fissures follow existing
geomorphic features (depression boundaries, swales, scarps) and
have displacements with a similar sense indicates that some of the
displacements are repeatable over time. Other fissures are distribu-
tive or otherwise do not follow existing geomorphic features. More-
over, similar fissures occur on the flanks of ridges within known
landslides that also were reactivated by the Loma Prieta earthquake.
The ridgetop fissures and landslide fissures appear to have a grada-
tional relationship.
The ridgetop fissures contributed to the damage of a number of
school buildings, residences, and other structures— mainly by exten-
sional and vertical displacement. Future construction should be
preceded by a detailed geologic investigation to avoid these larger,
fault-like fissures. Where fissures are distributive or difficult to
identify, specially reinforced foundations and other engineering tech-
niques may be appropriate.
Although a broad zone of fissures on the Summit Road ridge
generally lies within regulatory zones established under the Alquist-
Priolo Special Studies Zones Act, some fault-like features extend
farther to the northwest (Figure 2). Other fissures on Skyland Ridge
largely lie outside established SSZs. As a result, the SSZ s in the Los
Gatos and Laurel quadrangles are being reevaluated.
ACKNOWLEDGMENTSWe would like to acknowledge David L. Wagner and Robert H. Sydnor of DMG for reviewing this paper and providing
suggestions for improvement. Thanks also goes to Malcolm M. Clark and Daniel J. Ponti of the USGS, Thomas E. Spittler
and Michael W. Manson of DMG. William R. Cotton, and J.M. Cleary for providing preliminary fracture/fissure data in
a timely way. Finally, we acknowledge the many useful discussions with these geologists, as well as many others too
numerous to mention here.
94 DIVISION OF MINES AND GEOLOGY SPlfr
REFERENCES
Baumann, M.F., Connelly, S.F., Falls, J.N., Haley, LA., McKee, M.W., and
Upp, R.R., 1990, Finding fissures from the Loma Prieta earthquake:
Association of Engineering Geologists, AEG News, v. 33, no. 1 , p. 31-32.
Beck, A.C., 1968, Gravity faulting as a mechanism of topographic adjust-
ment: New Zealand Journal of Geology and Geophysics, v. 1 1 , p. 191-
199.
Bonilla, M. G., Mark, R. K., and Lienkaemper, J. J., 1984, Statistical relations
among earthquake magnitude, surface rupture length, and surface fault
displacement: Seismological Society of America Bulletin, v. 76, no. 6,
p. 2379-2411.
Bovis, M.J., 1982, Uphill-facing (antislope) scarps in the Coast Mountains,
southwest British Columbia: Geological Society of America Bulletin, v. 93,
p. 804-812.
Bryant, W.A., Smith, DP., and Hart, E.W., 1981, Sargent, San Andreas and
Calaveras fault zones: evidence for recency in the Watsonville East,
Chittenden and San Felipe quadrangles, California: California Division of
Mines and Geology Open File Report 81-7SF, 3 plates, scale 1 :24,000.
California Division of Mines and Geology, 1976, Revised Official Maps of
Special Studies Zones, Laurel and Los Gatos quadrangles, scale
1 :24,000.
Clark, J. C, Brabb, E. E., and McLaughlin, R. J., 1989, Geologic map and
structure sections of the Laurel 7.5-minute quadrangle, Santa Clara and
Santa Cruz counties, California: U. S. Geological Survey Open-File
Report 89-676, 30 p., 2 plates, scale 1 :24,000.
Cleary Consultants, 1990, Post-earthquake geotechnical evaluation, C. T.
English Middle School, 23800 Summit Road, Santa Cruz County,
California: Los Altos, California, Cleary Consultants, Inc., unpublished
consulting report, January 31, 1990, 19 p., 22 drawings.
Cotton, W. R., Fowler, W. L., and J. E. Van Velsor, 1990, Coseismic bedding
plane faults and ground fissures associated with the Loma Prieta
earthquake of 1 7 October 1 989: this volume, p. 95-1 04.
Dibblee, T.W. Jr., and Brabb, E.E., 1978, Preliminary geologic map of the Los
Gatos quadrangle, Santa Cruz and Santa Clara counties, California: U.S.
Geological Survey Open-File Report 78-453, 1 plate, scale 1 :24,000.
Dibblee, T.W. Jr., and Brabb, E.E., 1980, Preliminary geologic map of the
Loma Prieta quadrangle, Santa Cruz and Santa Clara counties,
California: U.S. Geological Survey Open-File Report 80-994, 1 plate,
scale 1 :24,000.
Foxx, Nielson and Associates, 1988, Geologic fault investigation. Lands of
Donna Hines (APN 96-131-22), Summit Road, Santa Cruz County,
California: Unpublished consulting report dated 10 August 1988,
29 p., 4 plates.
Hall, NT., Sarna-Wojcicki, A., and Dupre, W.R., 1974, Faults and their
potential hazards in Santa Cruz County, California: U.S. Geological
Survey Miscellaneous Field Studies Map MF- 626, scale 1 :62,500.
Hart, E.W., 1988, Fault-rupture hazard zones in California: California
Department of Conservation, Division of Mines and Geology Special
Publication 42 (revised edition), 24 p.
Hempen, G.L., 1990, Notes on the Loma Prieta earthquake: Association of
Engineering Geologists, AEG News, v. 33, p. 29- 30.
Johnson, RE., & Associates, 1989, Fault investigation, Loma Prieta
Elementary School, 23845 Summit Road, Santa Clara County, California
(Phases 1 and 2): Unpublished consulting report dated 23 March 1989,
45 p., 1 appendix, 9 plates.
Lawson, AC, ed., 1908, The California Earthquake of April 18, 1906: Report
of the California State Earthquake Investigation Commission: Carnegie
Institution of Washington, Publication 87, v. 1, 451 p.
Lisowski, M., Prescott, W.H., Savage, J.C., and Svarc, J.L., 1990, A possible
geodetic anomaly observed prior to the Loma Prieta, California,
earthquake: Geophysical Research Letters, v. 17, p. 1211-1214.
Mahr, T., 1977, Deep-reaching gravitational deformations of high mountain
slopes: International Association of Engineering Geology Bulletin, no. 16,
p. 121-127.
McClellan, P.H., and Hay, E.A., 1989, Geologic evidence for triggered slip on
the Calaveras fault during the magnitude 7.1 Loma Prieta earthquake of
October 17, 1989: U.S. Geological Survey Open File Report 89-641, 37 p..
Plafker, G., and Galloway, J. P., eds., 1989, Lessons learned from the Loma
Prieta, California, earthquake of October 17, 1989: U.S. Geological
Survey Circular 1045, 48 p.
Radbruch-Hall, D.H., 1978, Gravitational creep of rock masses on slopes,
in B. Voight, ed., Rockslides and avalanches, 1— Natural phenomena:
Elsevier Scientific Publishing Company, Developments in Geotechnical
Engineering 14A, p. 607-657.
Radbruch-Hall, D.H., Varnes, D.J., and Colton, R.B., 1977, Gravitational
spreading of steep-sided ridges ("sackung") in Colorado: U.S. Geological
Survey Journal of Research, v. 5, no. 3, p. 359-363.
Sarna-Wojcicki, A.M., Pampeyan, E.H., and Hall, N.T., 1975, Map showing
recently active breaks along the San Andreas fault between the central
Santa Cruz Mountains and northern Gabilan Range, California: U.S.
Geological Survey Miscellaneous Field Studies Map MF-650, scale
1 :24,000.
Savage, W.Z., and Varnes, D.J., 1987, Mechanics of gravitational spreading
of steep-sided ridges ("sackung"): International Association of Engineer-
ing Geology Bulletin, no. 35, p. 31- 36.
Schulz, S.S., 1984, Triggered creep near Hollister after the April 24, 1984,
Morgan Hill, California, earthquake, in J.H. Bennett and R.W. Sherburne,
eds., The 1984 Morgan Hill, California, earthquake: California Division of
Mines and Geology Special Publication 68, p. 175-182.
Shakal, A. F., DeLisle, M. J., Reichle, M. S., and Darragh, R. B., 1990,
Strong ground shaking from the Loma Prieta earthquake of 17 October
1989 and its relation to near surface geology in the Oakland area: this
volume, p. 29-46.
Spittler, T.E., and Harp, E.L., 1990, Preliminary map of landslide features am
coseismic fissures triggered by the Loma Prieta, California, earthquake of
October 17, 1989: California Division of Mines and Geology, Open-File
Report 90-6, map scale 1 :4,800.
Tabor, R.W., 1971 , Origin of ridge-top depressions by large-scale creep in
the Olympic Mountains, Washington: Geological Society of America
Bulletin, v. 82, p. 1811-1822.
Thorsen, G.W., 1989, Splitting and sagging mountains: Washington Geologic
Newsletter, v. 17, no. 4, p. 3-13.
U.S. Geological Survey Staff, 1990, The Loma Prieta, California, earthquake:
an anticipated event: Science, v. 247, p. 286- 293.
Varnes, D.J., 1978, Slope movement types and processes, in R.L. Schuster
and R.J. Krizek, eds., Landslides—analysis and control: National
Academy of Sciences, Washington, DC,Transportation Research Board,
Special Publication 176, p. 11 -33 and Figure 2.1.
Varnes, D.J., Radbruch-Hall, D.H., and Savage, W.Z., 1989, Topographic
and structural control in areas of gravitational spreading of ridges in the;
western United States: U.S. Geological Survey Professional Paper 1496.
28 p.
Wells, RE., Ponti, D.J., Clark, M.M., Bucknam, R.C., Budding, K.E., Fumal, I
T.E., Harwood, D.S., Lajoie, K.R., Lienkaemper, J.J., Machette, M.N.,
Prentice, C.S., and Schwartz, D.P., 1989, Preliminary map of fractures
formed in the Summit Road-Skyland Ridge area during the Loma Prieta,
California, earthquake of October 17, 1989: U.S. Geological Survey
Open-File Report 89-686, 1 plate, scale 1:12,000.

COSEISMIC BEDDING PLANE FAULTS AND GROUND FISSURES
ASSOCIATED WITH THE LOMA PRIETA EARTHQUAKE
OF 17 OCTOBER 1989
by
William R. Cotton 1
, William L. Fowler 1
,
and Joan E. Van Velsor 2
ABSTRACTCoseismic bedding plane faulting of approximately 40 cm slip has been documented in two 20 m-high road
cuts and highway pavement located just south of the intersection of the state Highway 1 7 and Summit Roadat the crest of the Santa Cruz Mountains. The site is situated near the north end of the earthquake rupture zone
and approximately 2 km south of the mapped trace of the San Andreas fault.
Ground rupture in the form of high-angle normal faulting is characterized by ground cracking and uplifted
highway pavement. The faulting is preferentially confined to the weak shale interbeds of a thick section of
massive Vaqueros Sandstone which is exposed in the two facing cutslopes. The primary zone of active faulting
is defined by a 1 5 cm-wide zone of clay gouge which parallels bedding (N55'W,d82°N) and has been mappedthrough the road cuts on both sides of the faulted road section. Near the top of one cut slope, the fault cuts an
8 m thick, charcoal-rich deposit of surficial materials.
The exposed stratigraphic relationships indicate that the fault has a well-established paleoseismic history of
repeated episodes of normal fault displacement. The surficial materials are interpreted to have formed as infill
deposits of a fault-bounded, ridgetop depression. The origin and significance of the depressions and associated
topographic furrows and scarps that characterize the crest of the Summit Ridge area have been a topic of
geologic debate for several decades.
Bedding plane faulting with normal slip is presented as a likely geologic model to explain the origin, orientation,
and distribution of both the ridgetop depressions and many of the ground fissures that developed along the crest
of the ridge as a result of the Loma Prieta earthquake. The bedding plane faults are, in turn, structurally
controlled by the strike and dip of the bedrock and the location of the weak shale intervals. Ground fissures that
appear to cut across strike of the underlying bedrock are interpreted to be the result of slip along other bedrock
structures such as faults or fracture zones that are discordant to bedding.
We propose that the bedding plane faults and the secondary faults represent second-order, bending-moment
faults which result from lengthening (i.e., tension) of the ridgecrest as a result of large magnitude earthquake
events on the San Andreas fault.
INTRODUCTION
wide variety of ground fissuring developed in the Summit Ridge
i of the Santa Cruz Mountains, Santa Cruz and Santa Clara
Cnties. as a result of the Ms7.1 Loma Prieta earthquake (Figure 1).
Kny of the fissures are on steep mountain flanks and are clearly
n ted to landslide processes. Many others, however, are located
aig the crest of the ridge and are closely related to pre-existing
g morphic features such as ridgetop depressions, linear topographic
h'ows, and subdued scarps. Their area-wide pattern suggests that
tl' are controlled by the underlying bedrock structure and lithology
(< tton and others, 1990 and U. S. Geological Survey Staff, 1990).
It is generally recognized that the zone of ground fissuring ranges
from 1 to 2 km wide and extends southeast from Highway 17 along
the axis of the ridge for a distance of 8 km (Wells and others, 1989).
The tectonic relationship between the distribution and nature of the
ground fissuring and the lack of primary ground rupture along the
southern Santa Cruz Mountains segment of the San Andreas fault is
presently uncertain. Detailed paleoseismic studies of the extensive
record of second-order deformation that accompanied the earthquake
should enable the development of a tectonic model that will explain
regional deformational patterns and provide some insights into the
return period of large earthquakes along this segment of the San
Andreas fault.
^ iam Cotton and Associates, Inc., Los Gatos!( fornia Department of Transportation, District 4, San Francisco
95

96 DIVISION OF MINES AND GEOLOGY SP104
COSEISMIC SECOND-ORDER SURFACEFAULTING
Coseismic bedding plane faulting with approximately 40 cm of
vertical throw has been documented cutting across two 20 m-high
roadcuts and adjacent highway pavement for State Highway 17
(Figure 1). The previously unmapped fault buckled both the north-
bound and southbound lanes of the highway as well as the interven-
ing reinforced concrete divider (Photo 1 ). Ground cracks mapped to
the west and east of the highway roadcut, at or near the original ground
surface along frontage roads, are characterized by deformation of the
asphalt pavement as well as fissuring of the natural ground. The
cracks and fissures are like those found elsewhere in the Summit
Ridge area that developed as a result of the 1989 Loma Prieta
earthquake.
The distribution and nature of these fissures, and the apparent lack
of a well-defined zone of primary, right-lateral ground rupture along
the mapped trace of the San Andreas fault, have prompted several
geologic models to explain their origin (Cotton and others, 1990;
Hardin and others, 1990; U.S. Geological Survey Staff, 1990; Spinier
and Sydnor, 1990; Plafker and Galloway, 1989; Spittler and Harp,
1990; Horns, 1990; and Hart and others, this volume).
The Highway 17 site is located approximately 1.5 km to the
southwest of the mapped trace of the San Andreas fault and approxi-
mately 300 m to the northeast of the Butano fault (Brabb, 1989;
Dibblee and Brabb, 1978; Hall and others, 1974). The bedding plane
faulting is confined to near-vertical shale interbeds of a thick section
of massive Vaqueros Sandstone that strikes nearly perpendicular to
the highway alignment ( Photo 2 ). The primary zone of recent faulting
is defined by a 15 cm-wide zone of clay gouge that parallels bedding
(N55°W,d82°N) and has been mapped through the roadcuts on both
sides of the road. Because of the fault's location entirely within the
Vaqueros section, and its concordant relationship to the bedrock
stratification, the faulting is not considered to be related to the nearby
Butano fault.
Near the top of the eastern cutslope, the fault cuts an 8 m thick,
charcoal-rich deposit of surficial materials (Photo 3 and Figure 2).
The lowermost 2 m of the deposit is cut by several subsidiary faults,
indicating that the primary bedding plane fault has experienced
multiple episodes of normal fault displacement. Our preliminary
geologic logging of the fault relationships indicates that buried
paleosols and colluvial wedges may exist within the surficial deposit
that will provide further evidence for multiple faulting events. Char-
coal samples for radiometric dating have been obtained. Because the
observed 1989 displacement of this fault was clearly coseismic, we
believe that investigation of these features will provide important data
on the timing and magnitude of paleoseismic events on the Santa Cruz
Mountains segment of the San Andreas fault.
The surficial materials cut by the fault are interpreted to
have formed as infill deposits of a fault-bounded, ridgetopde-
pression. Similar topographic depressions are present along
the ridgecrest to the east and have been mapped previously by
others (Hall and others, 1 974; and Sarna-Wojcicki and others,
1975). The origin of the depressions and associated topo-
graphic furrows and scarps that characterize the Summit
Ridge area is believed to be the result of repeated second-
order faulting of the underlying bedrock.
We have identified several locations where active bedding'
plane faulting was associated with the earthquake event, and
that in at least two sites, such faults have a clear geologic
record of repeated slip events. This discovery is especially
significant because little or no paleoseismic information
exists for this segment of the San Andreas fault. Such
information is necessary to evaluate the relative activity of the
fault segment and forjudging the potential seismic hazard in
the southern San Francisco Bay region with its population of
three million.
GROUND FISSURECHARACTERISTICS
Ground fissures in the Summit Ridge area are characterized
predominantly by a general northwest strike that is subparal-
lel to the axis of the ridge and the alignment of Summit Road.i
They display primarily extensional openings; however, both
strike slip and compressional displacement have been docu-
mented (Wells and others, 1989). As a first approximation,
those segments that parallel the strike of the underlying
bedrock display extensional displacements. Predominantly >
left-lateral strike-slip displacement is characteristic of fis-
sures that have trends that are more northerly of the bednx k
Figure 1.Index map of the Summit Ridge area, the fault rupture zone of the Loma Prieta
earthquake, and the ground deformation sites described in the text.

THE LOMA PRIETA EARTHQUAKE OF 17 OCTOBER 1989 97
Photo 1. Bedding plane, normal faulting expressed as a 40 cm heave in Highway 17. View looking south toward Santa Cruz County
Photo 2. Southeast view of the bedding plane, normal fault relationships in the Highway 17 roadcut. Faulting bisects a thick shale unit
in the Vaqueros Sandstone and can be traced to within one meter of the ground surface. An 8 meter thick cover of surficial materials,
believed to be the infilling of a ridgetop depression, is cut by the fault.

98 DIVISION OF MINES AND GEOLOGY SP104
Photo 3. Close-up view of
the surficial material (light
color) faulted against shale
bedrock (dark color).
Figure 2. Preliminary geologic log of the fault relationships in the bottom 2 m of surficial deposits

1990 THE LOMA PRIETA EARTHQUAKE OF 17 OCTOBER 1989 99
structure and the northwest trend of the crest of
Summit Ridge. Ground fissures that exhibit
compression are rare and are characterized by
trends that are generally perpendicular ( i.e., trend
more northeast) to the strike of the bedrock.
The ground fissures are confined for the most
part to the surficial earth materials that mantle
the Summit Ridge area. Generally, the cohesive
surficial deposits that host the ground fissures
perform in a brittle manner and are capable of
supporting high, near-vertical scarps and open
; fissures for a considerable length of time, espe-
cially during seasonal drought conditions. The
most common ground fissures are those that rep-
resent extension of the ground surface. These are
considered to be the result of normal slip along bedding
iplanes or other weak bedrock structures (i.e., faults, fractures,
etc.) which propagate up through the overlying surficial deposits
(Figure 3 ). Other styles ofground fissuring such as strike slip (i.e., left
lateral) and compression can be explained by such a model as well.
We have identified several sites ofground fissuring that we believe
:an be attributed to faulting within bedrock. These sites include the
following:
i Tranbarger Ground Fissure - A spectacular system of ground
"issures is located along the crest of Summit Ridge at the Tranbarger
jroperty, approximately 3 km southeast of Highway 17 (Figure 1).
Detailed geologic mapping (scale 1 :240 and 1 : 1 20) has documented
•l 335 m-long by 76 m-wide zone of ground fissures that crosses the
ixis of Summit Ridge. Extensional ground fissures up to 1 m-wide
ind 2 m-deep (Photo 4), compressional mole tracks up to 15 m long,
md a pronounced left-lateral displacement of Summit Road of up to
i »0 cm horizontal and 40 cm vertical (Figure 7), make this feature one
if the largest and certainly most highly publicized of the Loma Prieta
arthquake (Hardin and others, 1990). The Tranbarger fissure was
tictured in dozens of local and national newspapers and news maga-
ines immediately following the October 17, 1989 event.
Through much of its length, the Tranbarger fissure is associated
/ith geomorphic features such as topographic furrows and sidehill
enches that are the result of repeated episodes of deformation,
leometric analysis of the fissure where it crosses a drainage swale
ear its western end indicates that the fissure strikes N40°W and dips
9°SW. This attitude conforms with the regional bedrock attitudes of
ie Vaqueros Sandstone (generally N40-65°W, d50-60°S) and strongly
iiggests that the fissure is related to fault rupture along bedding.
1 WoollAldana Ridgetop Depression - This site is located along Sum-
lit Road 6 km southeast from Highway 17 (Figure 1 ) and is within
ie Wool and Aldana properties. It is characterized by a very
ronounced northwest-trending, elongate ridgetop depression that
leasures approximately 500 m long and 200 m wide and has a
•pographic closure of nearly 3 m ( Photo 5 ). Two extensional ground
ssures developed along the southwestern and northeastern flanks of
.e depression as a result of the earthquake. Displacement along the
ssures indicates a relative downward displacement of the depression
relation to the flanks.
We interpret the depression to be a graben structure that has resulted
om displacement along normal faults that form the flanks of the
:pression. The youthful, undrained aspect of the depression indi-
Figure 3. Development of extensional ground fissures in surficial
deposits due to coseismic normal slip along a bedding plane within
shale bedrock.
Photo 4. Northwest view of the dramatic extensional ground fissure that
passed within several meters of the front door of the Tranbarger home.

100 DIVISION OF MINES AND GEOLOGY SP104
Photo 5. Northwest view across the left lateral displacement of Summit Road near the Tranbarger
property. In this area, the extensional ground fissure near the Tranbarger home (driveway at upper
right corner) changes to a north-trending zone of shear.
fissuring. The zone of distress extended under
two school buildings and caused considerable
structural damage. Other earthquake-generated
cracks were noted in the asphalt school yard and
to a lesser degree in the natural ground. These
cracks, however, did not display any measurable
slip and could not be correlated to any bedding
planes or fault surfaces that were logged in the
exploratory trenches.
It was clear from the engineering geologic ,
investigation that several of the faults that passed
through the school site were zones of repeated
faulting and that in an event like the 1989 Loma
Prieta earthquake, damaging ground rupture
could recur. To our knowledge, this is the only
case where a school site was abandoned due to
high risk of surface faulting and where this did
indeed occur essentially as predicted.
Wrights Station Tunnel - An abandoned nar-
row-gauge railroad tunnel passes through Sum-
mit Ridge nearly perpendicular to the structural
trend of the bedrock (Figure 1). The tunnel for
the old South Pacific Coast Railroad was built by
Chinese labor in 1877-1880 (MacGregor and
Truesdale, 1982, p. 186-203). The tunnel is
1,898 m long, and is located about 210 m be-
neath the ridgecrest. During the 1906 earth-
quake, the tunnel was deformed over much of its
length and was offset approximately 1 .4 m near
the north ("Wrights") portal along what was
described as a discrete "fissure" (Lawson, 1908,
p. 111). Observations of the deformation of the
tunnel were made by E.P. Carey and included '
the following:
Afissure crost (sic) the tunnel 400feetfrom
the northeast portal, along which there was a
lateral displacement of 4.5 feet. The move-
ment on the southwest side was northerly
with reference to the northeast side. ... The
strike of this fissure is N25 ° W, making an
angle of80 'with the trend ofthe tunnel, and
it dips at an angle of about 75 °to the west.
cates that this site is a zone of repeated Late Quaternary fault
displacements, that such displacements are rooted in the underlying
bedrock, and arc most probably controlled by the structure of the
underlying bedrock.
Loma Prieta School - The school site is located at the southeast end
of Summit Ridge approximately 4 km from Highway 17 (Figure 1).
The school was closed in the spring of 1989 because geologic studios
mandated by the State Alquist-Priolo Special Studies Zones Act
found that active faults associated with the San Andreas fault system
passed underneath several of the school buildings (Johnson, 1989).
As a result ofthe Loma Prieta earthquake, it is apparent that at least
one of the faults identified in the exploratory trenches experienced
displacement that resulted in a broad zone of ground warping and
Several other "fissure lines" were found to be generally parallel to
the main zone of offset but were located between 427 m and 670 mfrom the Wrights Station portal. E.P. Carey states further:
According to the evidence, sofar as it went, the whole ofthe top
ofthe mountains wasfissured thruout in such a way that a large
movement could he distributed among several fissures and thus
account for a relatively slight motion along any one fissure.
(Carey, in Lawson, 1908, p. 111.)
The sharp displacement on the "fissure" near the north end of the
tunnel which was attributed to primary fault rupture along the trace of
the San Andreas fault in 1 906 may well have been secondary faulting
parallel to bedding. Likewise, fault displacement that was described
at two other discrete localities within the tunnel (that is, 427 m and 670
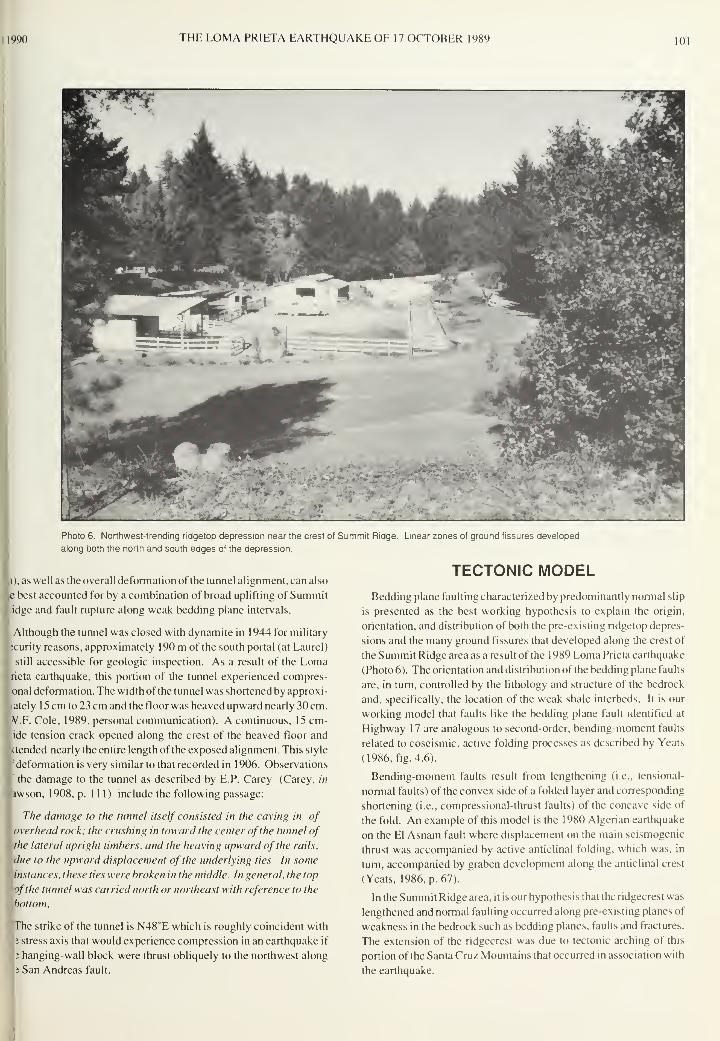
1990 THE LOMA PRIETA EARTHQUAKE OF 17 OCTOBER 1989 101
Photo 6. Northwest-trending ridgetop depression near the crest of Summit Ridge. Linear zones of ground fissures developed
along both the north and south edges of the depression.
), as well as the overall deformation of the tunnel alignment, can also
e best accounted for by a combination of broad uplifting of Summit
idge and fault rupture along weak bedding plane intervals.
Although the tunnel was closed with dynamite in 1944 for military
;curity reasons, approximately 190 m of the south portal (at Laurel)
Istill accessible for geologic inspection. As a result of the Loma
rieta earthquake, this portion of the tunnel experienced compres-
I onal deformation. The width of the tunnel was shortened by approxi-
lately 1 5 cm to 23 cm and the floor was heaved upward nearly 30 cm.
V.F. Cole, 1989, personal communication). A continuous, 15 cm-
ide tension crack opened along the crest of the heaved floor and
'(tended nearly the entire length of the exposed alignment. This style
"deformation is very similar to that recorded in 1906. Observations
t the damage to the tunnel as described by E.P. Carey (Carey, in
pwson, 1908, p. Ill) include the following passage:
The damage to the tunnel itself consisted in the caving in of
overhead rock; the crushing in toward the center ofthe tunnel of
the lateral upright timbers, and the heaving upward of the rails,
due to the upward displacement of the underlying ties. In some
instances, these ties were broken in the middle. In general, the top
ofthe tunnel was carried north or northeast with reference to the
.bottom.
The strike of the tunnel is N48°E which is roughly coincident with
|: stress axis that would experience compression in an earthquake if
: hanging-wall block were thrust obliquely to the northwest along
San Andreas fault.
TECTONIC MODELBedding plane faulting characterized by predominantly normal slip
is presented as the best working hypothesis to explain the origin,
orientation, and distribution of both the pre-existing ridgetop depres-
sions and the many ground fissures that developed along the crest of
the Summit Ridge area as a result of the 1 989 Loma Prieta earthquake
(Photo 6). The orientation and distribution of the bedding plane faults
are, in turn, controlled by the lithology and structure of the bedrock
and, specifically, the location of the weak shale interbeds. It is our
working model that faults like the bedding plane fault identified at
Highway 17 are analogous to second-order, bending-moment faults
related to coseismic, active folding processes as described by Yeats
(1986, fig. 4.6).
Bending-moment faults result from lengthening (i.e., tensional-
normal faults) of the convex side of a folded layer and corresponding
shortening (i.e., compressional-thrust faults) of the concave side of
the fold. An example of this model is the 1980 Algerian earthquake
on the El Asnam fault where displacement on the main seismogenic
thrust was accompanied by active anticlinal folding, which was, in
turn, accompanied by graben development along the anticlinal crest
(Yeats, 1986, p. 67).
In the Summit Ridge area, it is our hypothesis that the ridgecrest was
lengthened and normal faulting occurred along pre-existing planes of
weakness in the bedrock such as bedding planes, faults and fractures.
The extension of the ridgecrest was due to tectonic arching of this
portion of the Santa Cruz Mountains that occurred in association with
the earthquake.

102 DIVISION OF MINES AND GEOLOGY SP104
In our model, the 1 .2 m reverse-slip and 1 .6 m right-lateral oblique
strike-slip that occurred at depth did not extend into the upper 5 kmof the crust (Lisowski and others, 1 990), but was accommodated at the
ground surface by extensional faulting along bedding planes and
other weak bedrock structures on the southwest side of the fault zone
(i.e., hanging-wall block), and possibly by compressional tectonics
along the rangefront to the northeast (i.e., foot-wall block). The
vertical deformation of 1.2 m at depth translated into approximately
36 cm of uplift at the ground surface (Plafker and Galloway, 1989).
The uplift was not concentrated along the trace of the San Andreas
fault as primary ground rupture and, therefore, must have been par-
tially accommodated by slip along weak discontinuities within the
bedrock.
With regard to compressional tectonics, evidence for shortening as
a result ofthe Loma Prieta earthquake has been documented in the Los
Gatos area situated north of the fault (Haugerud and Ellen, 1990) and
is well-expressed in the geologic record by the Sargent-Berrocal,
Shannon, and Monta Vista faults that define a zone of range-front
faulting along the north side of the Santa Cruz Mountains (McLaugh-
lin, 1974; McLaughlin and others, 1988; Dibblee and Brabb, 1978;
Sarna-Wojcicki and others, 1975). The Santa Cruz Mountains have
attained their present elevation by thrusting Franciscan bedrock to the
north over Quaternary alluvial deposits of the Santa Clara Valley.
We propose that a model incorporating bending-moment faults
characterized by extensional tectonics in the hanging wall block and
compressional tectonics in the footwall block can account for: ( 1 ) the
ground fissures in the Summit Ridge area, (2) the geomorphology of
the Summit Ridge area, (3) the compressional ground deformation
documented along the Santa Cruz Mountains rangefront, (4) the
system of range-front faults along this segment ofthe fault, and (5 ) the
lack of primary right-lateral ground rupture along the trace of the San
Andreas fault.
We further propose that the bending-moment faults themselves are
the result of the geometry of the San Andreas fault zone in this region.
The 70 km-long segment of the San Andreas fault that lies between
Hollister and Saratoga, including all of the Loma Prieta rupture zone,
represents a restraining bend in the fault. Along most of this segment,
the fault strikes nearly 10° more northwesterly than the general
N4()"W strikes that characterize the fault zone to the south and the
north. The Summit Ridge terrain and the other mountainous topog-
raphy that are found along the fault in this region are the tectonic
products of convergence between the Pacific Plate and the North
American Plate where soft Tertiary marine sediments to the southwest
are abutted against strong Mesozoic sedimentary and volcanic rocks
to the north of the fault.
PALEOSEISMIC CONSIDERATIONS
It seems clear that the ground effects of the Loma Prieta earthquake
were to a lesserextent a repeat performance of the great San Francisco
earthquake of 1906. Field descriptions of the ground behavior along
the crest of the Summit Ridge area in 1906 included the following
observation by L.E. Davidson who was camping in the Santa Cruz
Mountains during the earthquake:
The ridge on which we camped was full of cracks, ranging up
to 2 and3feet in width and in lengthfrom afew rods to 0.25 miles,
all trending west ofnorth to northwest. . . The canyon south ofus
wasfilled with landslides. In this canyon the stratification of the
rocks is plainly shown. The strike is northwest-southeast and the
dip is almost vertical. The cracks coincide in direction with the
strike of the strata. (Davidson, in Lawson, 1908, p. 278.)
These and other descriptions confirm the notion that the "character-
istic" behavior of the Summit Ridge area to large earthquakes is the
development of widespread landsliding on the steep flanks of the
ridge and the production ofground fissures along the crest of the ridge.
This segment of the San Andreas fault has had two large, well
documented, historic earthquakes which have created field conditions
(i.e., open fissures and closed depressions) which are ideal for the
collection and preservation of seismic data. Therefore the ridge area
should be considered as a primary target for paleoseismic research.
We believe that the timing of large-magnitude earthquake events on
the San Andreas fault can be approximated by paleoseismic studies of !
second-order, ridgetop faults. This is especially true where normal
faulting has provided topographic depressions which are capable of
trapping sediments and thus recording earthquakes. Preservation of
strata within such depressions is typically related to surface faulting
events, and the timing of these events can be interpreted based on
radiocarbon dating and soil stratigraphy. Because soil development
reflects some degree of stability of a geomorphic surface, buried soils
within a tectonic depression suggest intermittent stability separated
by discrete rupture events. A package of buried soils would provide
data on the number of rupture events and, because soil development
is time-dependent, the relative amounts of time between faulting
events.
If the seismotectonic behavior of the southern Santa Cruz Moun-
tains segment of the San Andreas fault is characterized mainly by
coseismic faulting in the bedrock of the upper plate of the rift zone,
then studies of these second-order faults may be the only source of
;
paleoseismic data available to define the return period of major
earthquakes. It is important to emphasize that such studies would, at
best, provide a minimum seismic record for earthquakes along this
segment of the San Andreas fault.
The argument can be made, however, that the Late Quaternary
behavior of the fault may be characterized by events like the 1989i
Loma Prieta earthquake. This segment of the fault did not experience
primary fault rupture within the upper 6 km of the crust in 1989 and
may not have done so in 1906. Since the development of the
restraining bend, the northwest migration of the Pacific Plate may I
never have been characterized by through-going rupture that reaches
the earth's surface. Rather, the plate motion is manifested by a broad
zone of deformation which is accommodated by arching and internal;
faulting of the hanging-wall block. Consequently, under the present
tectonic setting, it may be reasonable to assume that primary ground
rupture is not necessary along this segment of the San Andreas fault
in order to reduce the seismic potential of the fault to lower levels,j

990 THE LOMA PRIETA EARTHQUAKE OF 17 OCTOBER 1989 MM
ACKNOWLEDGMENTSWe would like to thank Bill Cole and Heidi Mack for their helpful discussions, review of our paper, and many valuable
suggestions for its improvement. A special debt of thanks goes to Bob Sydnor ofDMG for his encouragement, critical editorial
comments, and constant prodding to complete our work. We thank Bill Cole for sharing with us his preliminary measurements
of the deformation of the Wrights tunnel. Finally, we thank all of those geologists that we have had fruitful discussions with
since October 17, 1989.
REFERENCES
rabb. E.E., 1989, Geologic map of Santa Cruz County, California: U. S.
Geological Survey Miscellaneous Investigations Series Map 1-1905. scale
1:62,500.
Jlark, J.C., 1981. Stratigraphy, paleontology, and geology of the central Santa
,Cruz Mountains, California Coast Ranges: U.S. Geological Survey
Professional Paper 1168, 51 p.
lark, J.C., Brabb, E.E., and McLaughlin, R.J., 1989, Geologic map of the
,Laurel 7.5-minute Quadrangle, Santa Cruz and Santa Clara counties,
California: U. S. Geological Survey Open-File Report 89-676, scale
1 :24,000.
otton. W.R., Fowler, W.L., and Van Velsor, J.E., 1990, Coseismic bedding
plane faulting associated with the Loma Prieta earthquake of October 1 7,
; 1989: EOS, Transactions of the American Geophysical Union, v. 71
,
|no. 8, p. 287, (abstract).
'bblee, T.W., Jr., and Brabb, E.E., 1978, Preliminary geologic map of the Los
;Gatos quadrangle, Santa Cruz and Santa Clara counties, California: U. S.
Geological Survey Open-File Report 78-453. 1 plate, scale 1 :24,000.
bblee, T.W., Jr., and Brabb, E.E., 1978, Preliminary geologic maps of the
Chittenden, Los Gatos, and Watsonville East quadrangles, California:
; U. S. Geological Survey Open-File Report 78-453, 3 sheets, scale
'. 1:24,000.
'ibblee, T.W., Jr., and Brabb, E.E., 1980, Preliminary geologic map of the
.Loma Prieta quadrangle. Santa Cruz and Santa Clara counties. California:
U. S. Geological Survey Open-File Report 80-994, 1 plate, scale 1 :24,000.
bblee, T.W., Jr., Brabb, E.E., and Clark, J.C.. 1978. Preliminary geologic
map of the Laurel quadrangle, Santa Cruz and Santa Clara counties,
California: U. S. Geological Survey Open-File Report 78-84, 1 plate, scale
' 1:24,000.
'all, N.T., Sarna-Wojcicki, A.M.. and Dupre, W.R., 1974, Faults and their
,potential hazards in Santa Cruz County. California: U. S. Geological
Survey Miscellaneous Field Studies Map MF-626, scale 1 :62,500.
irdin, B.C., ORegan. G.T., and Cotton, W.R., 1990, Large-scale mapping of
iextensional ground cracks associated with the Loma Prieta earthquake of
October 17, 1989: EOS, Transactions of the American Geophysical Union,
.v. 71, no. 8, p. 288, (abstract).
;
iugerud, R.A., and Ellen, S.D., 1990. Deformation along the northeast foot
' of the Santa Cruz Mountains during the Loma Prieta earthquake: EOS.
Transactions of the American Geophysical Union, v. 71 , no. 8, p. 288,
(abstract).
irt, E. W., Bryant, W. A. Wills, C. J. and Tremain. J. A., 1990, The search for
fault rupture and significance of ridgetop fissures. Santa Cruz Mountains,
California: this volume, p. 83-94.
rns. D., 1990, Surface fractures from the Loma Prieta earthquake: evidence
for tectonic extension?: EOS, Transactions of the American Geophysical
Union, v. 71, no. 8, p. 288, (abstract).
Johnson, R.E., 1989, Fault investigation report, Loma Prieta Elementary
School, Santa Clara County, California: Santa Cruz, CA, Rogers E.
Johnson and Associates, unpublished consultant report.
Lawson, AC, ed., 1908, The California Earthquake of April 18, 1906. Report
of the State Earthquake Investigation Committee: Carnegie Institution of
Washington, Publication no. 87, v. I, 451 p.
Lisowski, M., Prescott, W.H., Savage, J.C., and Svarc, J.L., 1990, A possible
geodetic anomaly observed prior to the Loma Prieta. California, earth-
quake: Geophysical Research Letters, v. 17, p. 1211-1214.
MacGregor, B.A., and Truesdale. R., 1982. South Pacific Coast [Railroad] - a
centennial: Boulder, Colorado, Pruett Publishing Company, 351 p.
McLaughlin, R.J., 1974, The Sargent-Berrocal fault zone and its relation to the
San Andreas fault system in the southern San Francisco Bay region and
Santa Clara Valley, California: U.S. Geological Survey, Journal of
Research, v. 2, no. cp 593-598.
McLaughlin, R.J., Clark, J.C., and Brabb, E.E., 1988, Geologic map and
structure sections of the Loma Prieta 7.5-minute Quadrangle, Santa Clara
and Santa Cruz counties, California: U. S. Geological Survey, Open-File
Report 88-752, 32 p., scale 1 :24,000
Plafker. G., and Galloway, J. P.. eds., 1989, Lessons learned from the Loma
Prieta. California, earthquake of October 1 7, 1 989: U. S. Geological
Survey Circular 1045, 48 p.
Sarna-Wojcicki, A.M., Pampeyan, E.H., and Hall, N.T., 1975, Recently active
breaks, San Andreas fault, Santa Cruz Mountains to Gabilan Range,
California: U. S. Geological Survey Miscellaneous Field Studies. Map MF-
650, 1 :24,000.
Spittler, T.E., and Harp, E.L., 1990, Preliminary map of landslide features and
coseismic fissures triggered by the Loma Prieta, California, earthquake of
October 17, 1989: California Division of Mines and Geology Open-File
Report 90-6. map scale 1 :4,800.
Spittler, T.E., and Sydnor, R.H., 1990, Landslides and ridge-top failures
associated with the epicentral area of the Loma Prieta earthquake of
October 17, 1989: EOS, Transactions of the American Geophysical Union,
v. 71, no. 8, p. 290, (abstract).
U.S. Geological Survey Staff. 1990, Apparent lithologic and structural control
of surface fracturing during the Loma Prieta earthquake of October 17,
1989: EOS, Transactions of the American Geophysical Union, v. 71, no. 8,
p. 290, (abstract).
Wells. R.E.. Ponti, D.J., Clark. MM., Bucknam, R.C., Budding, K.E., Fumal,
T.E.. Harwood. D.S., Lajoie. K.R., Lienkaemper, J.J., Machette M.N.,
Prentice, C.S., and Schwartz, DP.. 1989, Preliminary map of fractures
formed in the Summit Road-Skyland Ridge area during the Loma Prieta,
California, earthquake of October 17. 1989: U. S. Geological Survey
Open-File Report 89-686. 1 plate, scale 1 : 12,000.
Yeats. R.S., 1986, Active faults related to folding, in Active Tectonics:
National Academy Press, Washington, DC. p. 63- 79.


EARTHQUAKE DAMAGE IN SOQUEL DEMONSTRATION STATE FOREST,
SANTA CRUZ COUNTY
by
Trinda L. Bedrossian 1 and Julie A. Sowma 1
ABSTRACT
A geologic reconnaissance of earthquake damage resulting from the 1989 Loma Prieta earthquake wasconducted in Soquel Demonstration State Forest, Santa Cruz County. Particular emphasis was placed on
road and stream channel failures that could pose potential slope stability and flooding hazards within and
downstream from the state forest. New and reactivated landslides and other types of earthquake-related
ground rupture were identified within the East Branch of Soquel Creek and the Amaya Creek drainages as
areas that could cause blockage of the stream channels and result in future flooding along Soquel Creek.
Numerous snapped tree trunks within the state forest indicate that the intensity of shaking was VI II or greater
on the Modified Mercalli Scale.
More detailed geologic mapping is recommended to identify site-specific slope stability problems that
could be encountered during road construction and other types of development associated with manage-
ment of the forest.
BACKGROUNDSoquel Demonstration State Forest comprises about 1 ,200 hectares
(ha) in the East Branch of Soquel Creek watershed, approximately 5
to 1 1 km north of the earthquake epicenter (Figure 1). At the request
of California Department of Forestry and Fire Protection (CDF), ge-
ologists from the Division of Mines and Geology evaluated the earth-
quake damage to the state forest in the weeks following the LomaPrieta Earthquake (Bedrossian, 1990). The state forest is located in
the Santa Cruz Mountains about 19 km northeast of the City of Santa
Cruz and less than 16 km upstream from the town of Soquel. Soquel
has suffered severe flood damage at least eight times since 1890
(Singer and Swanson, 1983). During the past 25 years, major land-
use activities in the Soquel Creek watershed have been rural residen-
tial development and timber harvesting. The watershed currently
supplies domestic water for approximately 40,000 customers.
The Soquel Creek watershed drains 109 km2 on the southern flank
of the Santa Cruz Mountains into the northern end of Monterey Bay;
the main creek is about 1 8 km long. According to Singer and Swanson
(1983), the mean annual precipitation in the upper watershed is over
102 cm and the recurrence interval for significant flooding is seven
years. Flood hazards are increased throughout the watershed by: (1)
the concentration and movement oflogs and other large woody debris,
and (2) landslides which move directly into the stream channels.
GEOLOGIC CONDITIONS
Soquel Demonstration State Forest is underlain primarily by a
sequence of early- to mid-Tertiary marine sedimentary rocks that is
highly folded and faulted with some units overturned (refer to Figure
2; and Wagner, this volume). The regional geology has been well
mapped by Brabb (1989), Clark (1981), McLaughlin and others
(1988), and Clark and others (1989).
The eastern third of the forest contains thin- to very thick-bedded
arkosic sandstone with thin interbeds of siltstone of the Eocene-
age Butano Sandstone formation. These rocks lie within the active
San Andreas fault zone and have been subjected to both large- and
small-scale downslope movement related in part to movement along
the fault.
Rocks in the central portion ofthe forest are comprised ofmudstone,
shale, sandstone of the San Lorenzo Formation (Oligocene and
Eocene), and Vaqueros Sandstone (lower Miocene and Oligocene).
The western portion of the forest is underlain primarily by mudstone
of the lower Miocene-age Lambert Shale and very thick-bedded
tuffaceous siltstone interbedded with andesitic sandstone of the
Pliocene- and upper Miocene-age Purisima Formation. The conglom-
erate unit of the Butano Sandstone is present in the southwestern
corner of the forest. The conglomerate is in contact with the Purisima
Formation along the Zayante fault.
'California Department of Conservation, Division of Mines and Geology, Environmental Protection Program
105
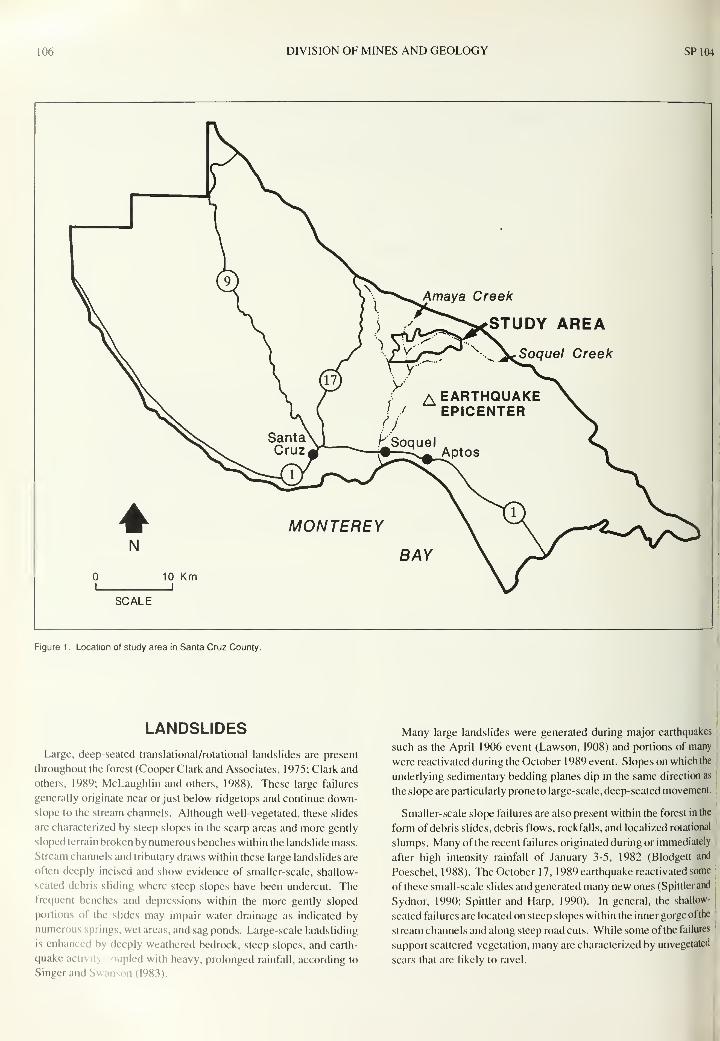
106 DIVISION OF MINES AND GEOLOGY SP104
Amaya Creek
^STUDY AREA
Soquel Creek
SCALE
Figure 1 . Location of study area in Santa Cruz County.
LANDSLIDES
Large, deep-seated translational/rotational landslides are present
throughout the forest (Cooper Clark and Associates, 1975; Clark and
others, 1989; McLaughlin and others, 1988). These large failures
generally originate near or just below ridgetops and continue down-
slope to the stream channels. Although well-vegetated, these slides
are characterized by steep slopes in the scarp areas and more gently
sloped terrain broken by numerous benches within the landslide mass.
Stream channels and tributary draws within these large landslides are
often deeply incised and show evidence of smaller-scale, shallow-
seated debris sliding where steep slopes have been undercut. Thefrequent benches and depressions within the more gently sloped
portions of the slides may impair water drainage as indicated by
numerous springs, wet areas, and sag ponds. Large-scale landsliding
is enhanced by deeply weathered bedrock, steep slopes, and earth-
quake actr pled with heavy, prolonged rainfall, according to
Singer and Swanson (1983).
Many large landslides were generated during major earthquakes
such as the April 1906 event (Lawson, 1908) and portions of many
were reactivated during the October 1989 event. Slopes on which the
underlying sedimentary bedding planes dip in the same direction as
the slope are particularly prone to large-scale, deep-seated movement.
Smaller-scale slope failures are also present within the forest in the
form of debris slides, debris flows, rockfalls, and localized rotational
slumps. Many of the recent failures originated during or immediately
after high intensity rainfall of January 3-5, 1982 (Blodgett and
Poeschel, 1988). The October 17, 1989 earthquake reactivated somej
of these small-scale slides and generated many new ones (Spittler and
Sydnor, 1990; Spittler and Harp, 1990). In general, the shallow-
seated failures are located on steep slopes within the inner gorge of the
stream channels and along steep road cuts. While some of the failures
support scattered vegetation, many are characterized by unvegetated
scars that are likely to ravel.

THE LOMA PRIETA EARTHQUAKE OF 17 OCTOBER 1989 107
"X 45»
N
Tbm <*•Amaya Creeky^yjsr jM XC tv /L Ts4nfTbu ^ East Branch
Tsl v,^s^Soquel. Creek
\ \ \ i Kl ^~~^\^^s<l rnp
y\Jsr
. Tvy\SC^\ Tbm XT^^^
Tst X ^syX^>5\ZAYANTE \ X yCTlaV TV X^rz
FAULTA>T^X^ ^FOREST BOUNDARY
Tblc"V\ 1 Km
i , j
SCALE
EXPLANATION
Qal Alluvial deposits
Tp Purisima Formation
Tla Lambert Shale
Tv Vaqueros Sandstone
Tz Zayante Sandstone
Tsl San Lorenzo Formation:
Tsr Rices Mudstone member
Tst Twobar Shale member
Butano Sandstone:
Tbu Upper sandstone member
Tbm Middle siltstone member
Tblc Conglomerate
Tmp Shale of Mount Pajaro area
— Contact
--- Fault, dashed where approximate
-<. Strike and dip of bedding
-bt. Overturned bedding
-i^ Vertical bedding
Syncline
Figure 2. General geology of Soquel Demonstration State Forest (after Brabb, 1989)
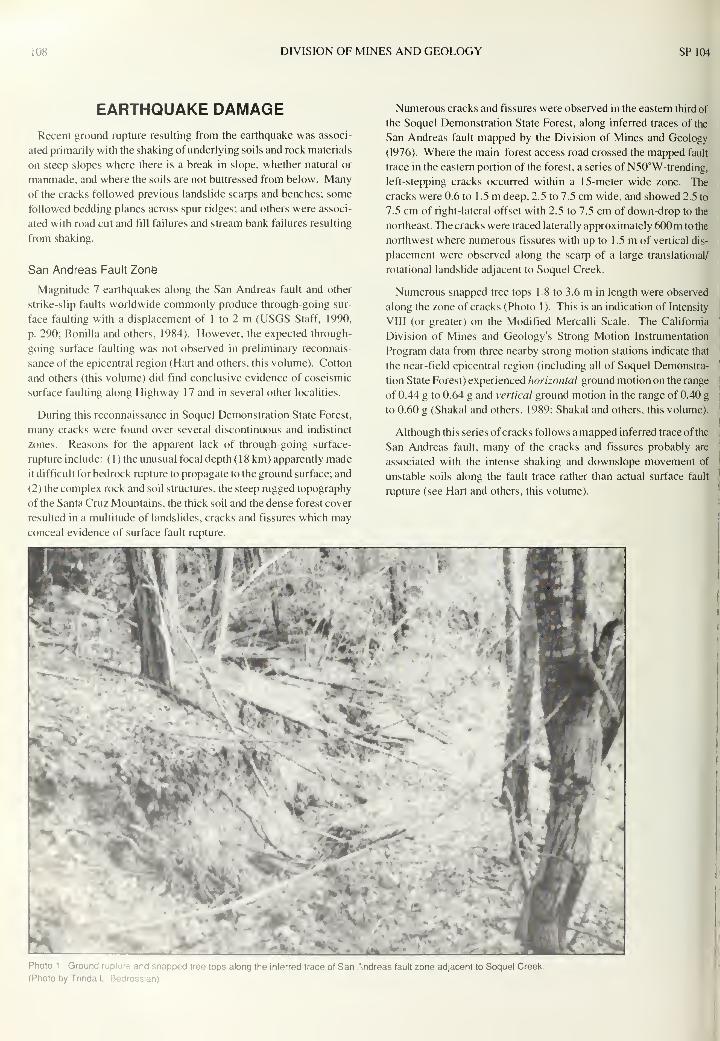
108 DIVISION OF MINES AND GEOLOGY SP104
EARTHQUAKE DAMAGERecent ground rupture resulting from the earthquake was associ-
ated primarily with the shaking of underlying soils and rock materials
on steep slopes where there is a break in slope, whether natural or
manmade, and where the soils are not buttressed from below. Many
of the cracks followed previous landslide scarps and benches; some
followed bedding planes across spur ridges; and others were associ-
ated with road cut and fill failures and stream bank failures resulting
from shaking.
San Andreas Fault Zone
Magnitude 7 earthquakes along the San Andreas fault and other
strike-slip faults worldwide commonly produce through-going sur-
face faulting with a displacement of 1 to 2 m (USGS Staff, 1990,
p. 290; Bonilla and others, 1984). However, the expected through-
going surface faulting was not observed in preliminary reconnais-
sance of the epicentral region (Hart and others, this volume). Cotton
and others (this volume) did find conclusive evidence of coseismic
surface faulting along Highway 17 and in several other localities.
During this reconnaissance in Soquel Demonstration State Forest,
many cracks were found over several discontinuous and indistinct
zones. Reasons for the apparent lack of through-going surface-
rupture include: ( 1 ) the unusual focal depth ( 1 8 km) apparently made
it difficult for bedrock rupture to propagate to the ground surface; and
(2 ) the complex rock and soil structures, the steep rugged topography
of the Santa Cruz Mountains, the thick soil and the dense forest cover
resulted in a multitude of landslides, cracks and fissures which may
conceal evidence of surface fault rupture.
Numerous cracks and fissures were observed in the eastern third of
the Soquel Demonstration State Forest, along inferred traces of the
San Andreas fault mapped by the Division of Mines and Geology
(1976). Where the main forest access road crossed the mapped fault
trace in the eastern portion of the forest, a series of N50°W-trending,
left-stepping cracks occurred within a 15-meter wide zone. The
cracks were 0.6 to 1.5 m deep, 2.5 to 7.5 cm wide, and showed 2.5 to
7.5 cm of right-lateral offset with 2.5 to 7.5 cm of down-drop to the
northeast. The cracks were traced laterally approximately 600m to the
northwest where numerous fissures with up to 1.5 m of vertical dis-
placement were observed along the scarp of a large translational/
rotational landslide adjacent to Soquel Creek.
Numerous snapped tree tops 1 .8 to 3.6 m in length were observed
along the zone of cracks (Photo 1 ). This is an indication of Intensity
VIII (or greater) on the Modified Mercalli Scale. The California
Division of Mines and Geology's Strong Motion Instrumentation
Program data from three nearby strong motion stations indicate that
the near-field epicentral region (including all of Soquel Demonstra-
tion State Forest) experienced horizontal ground motion on the range
of 0.44 g to 0.64 g and vertical ground motion in the range of 0.40 g
to 0.60 g (Shakal and others, 1989; Shakal and others, this volume).
Although this series ofcracks follows a mapped inferred trace of the
San Andreas fault, many of the cracks and fissures probably are
associated with the intense shaking and downslope movement of
unstable soils along the fault trace rather than actual surface fault
rupture (see Hart and others, this volume).
**»
T*> V*\
v
Photo 1.Ground rupture and snapped tree tops along the inferred trace of San Andreas fault zone adjacent to Soquel Creek.
(Photo by Trinda L. Bedrossian)
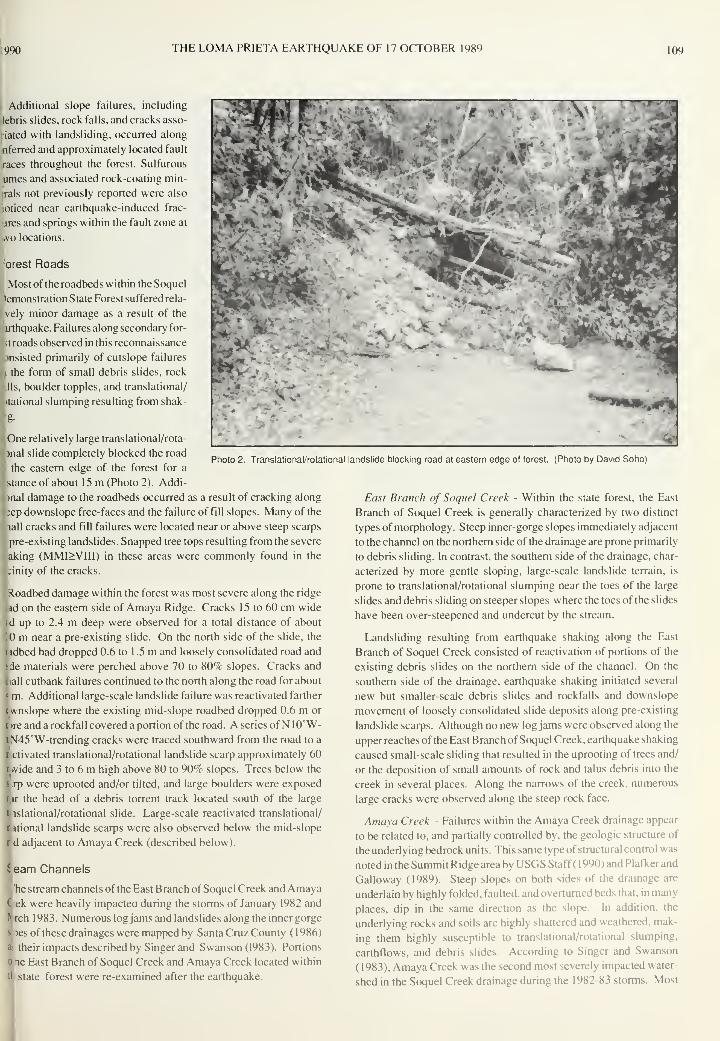
990 THE LOMA PRIETA EARTHQUAKE OF 17 OCTOBER 1989 109
**:
Additional slope failures, including
lebris slides, rock falls, and cracks asso-
ciated with landsliding, occurred along
nferred and approximately located fault
races throughout the forest. Sulfurous
umes and associated rock-coating min-
vrals not previously reported were also
soticed near earthquake-induced frac-
ures and springs within the fault zone at
tvo locations.
orest Roads
Most of the roadbeds within the Soquel
•emonstration State Forest suffered rela-
vely minor damage as a result of the
irthquake. Failures along secondary for-
roads observed in this reconnaissance
insisted primarily of cutslope failures
,i the form of small debris slides, rock
Wis, boulder topples, and translational/
•rational slumping resulting from shak-
g-
One relatively large translational/rota-
onal slide completely blocked the road
i(, the eastern edge of the forest for a
stance of about 15 m (Photo 2). Addi-
>nal damage to the roadbeds occurred as a result of cracking along
;ep downslope free-faces and the failure of fill slopes. Many of the
lall cracks and fill failures were located near or above steep scarps
pre-existing landslides. Snapped tree tops resulting from the severe
.aking (MMI>VIII) in these areas were commonly found in the
;inity of the cracks.
Roadbed damage within the forest was most severe along the ridge
nd on the eastern side of Amaya Ridge. Cracks 15 to 60 cm wide
id up to 2.4 m deep were observed for a total distance of about
iO m near a pre-existing slide. On the north side of the slide, the
ndbed had dropped 0.6 to 1.5 m and loosely consolidated road and
tde materials were perched above 70 to 80% slopes. Cracks and
tall cutbank failures continued to the north along the road for about
4 m. Additional large-scale landslide failure was reactivated farther
wnslope where the existing mid-slope roadbed dropped 0.6 m or
I >re and a rockfall covered a portion of the road. A series ofN 10°W-
t M45° W-trending cracks were traced southward from the road to a
Ictivated translational/rotational landslide scarp approximately 60
I wide and 3 to 6 m high above 80 to 90% slopes. Trees below the
s-.jp were uprooted and/or tilted, and large boulders were exposed
I, it the head of a debris torrent track located south of the large
islational/rotational slide. Large-scale reactivated translational/
rational landslide scarps were also observed below the mid-slope
rd adjacent to Amaya Creek (described below).
Seam Channels
she stream channels of the East Branch of Soquel Creek and AmayaC ek were heavily impacted during the storms of January 1982 and
Nrch 1983. Numerous logjams and landslides along the inner gorge
s jesofthese drainages were mapped by Santa Cruz County (1986)
a their impacts described by Singer and Swanson (1983). Portions
o he East Branch of Soquel Creek and Amaya Creek located within
tl state forest were re-examined after the earthquake.
Photo 2. Translational/rotational landslide blocking road at eastern edge of forest. (Photo by David Soho)
East Branch of Soquel Creek - Within the state forest, the East
Branch of Soquel Creek is generally characterized by two distinct
types ofmorphology. Steep inner-gorge slopes immediately adjacent
to the channel on the northern side of the drainage are prone primarily
to debris sliding. In contrast, the southern side of the drainage, char-
acterized by more gentle sloping, large-scale landslide terrain, is
prone to translational/rotational slumping near the toes of the large
slides and debris sliding on steeper slopes where the toes of the slides
have been over-steepened and undercut by the stream.
Landsliding resulting from earthquake shaking along the East
Branch of Soquel Creek consisted of reactivation of portions of the
existing debris slides on the northern side of the channel. On the
southern side of the drainage, earthquake shaking initiated several
new but smaller-scale debris slides and rockfalls and downslope
movement of loosely consolidated slide deposits along pre-existing
landslide scarps. Although no new logjams were observed along the
upper reaches of the East Branch of Soquel Creek, earthquake shaking
caused small-scale sliding that resulted in the uprooting of trees and/
or the deposition of small amounts of rock and talus debris into the
creek in several places. Along the narrows of the creek, numerous
large cracks were observed along the steep rock face.
Amaya Creek - Failures within the Amaya Creek drainage appear
to be related to, and partially controlled by, the geologic structure of
the underlying bedrock units. This same type of structural control was
noted in the Summit Ridge area by USGS Staff ( 1 990) and Plafker and
Galloway (1989). Steep slopes on both sides of the drainage are
underlain by highly folded, faulted, and overturned beds that, in many
places, dip in the same direction as the slope. In addition, the
underlying rocks and soils are highly shattered and weathered, mak-
ing them highly susceptible to translational/rotational slumping,
earthflows, and debris slides. According to Singer and Swanson
(1983), Amaya Creek was the second most severely impacted water-
shed in the Soquel Creek drainage during the 1982-83 storms. Most

110 DIVISION OF MINES AND GEOLOGY SP104
Photo 3. Landslide scarp on the west side of Amaya Creek. (Photo by
David Soho)
of the channel is characterized by continuous landsliding along both
banks, which has deposited large quantities of woody debris, soil, and
rock into the channel. In addition, the generally straight channel,
which lies within over-steepened inner-gorge slopes undercut by
channel scouring, has a high capacity to move large logs.
Landsliding resulting from earthquake shaking along Amaya Creek
consisted of reactivation of existing slides on both sides of the stream
channel and initiation of new failures on steep, unbuttressed slopes
adjacent to the inner gorge. Renewed failure that resulted in the
uprooting of trees and/or the deposition of small amounts of rock and
talus debris into the creek occurred midway up the channel. Snapped
tree tops associated with severe shaking (MMI>VIII) were prevalent
along the upslope scarps of these failures, particularly on the east side
Photo 4. Fresh cracks resulting from earthquake shaking upslope from
Amaya Creek along the southeast side of the stream channel. (Photo by
Trinda L. Bedrossian)
of the drainage. New and reactivated failures that resulted in partial
blockage of the creek also occurred farther upstream. Small amounts
of water were ponded behind two of the failures but appeared to be
eroding small channels around them.
On the west side of the channel, earthquake shaking caused large-
scale translational/rotational sliding and debris sliding approximately
75 m wide and 45 m long on 80 to 90% slopes adjacent to the channel.
North of the slide, failure along inner-gorge banks resulted in a 3 m-
high scarp, with failed materials remaining perched above the channel
(Photo 3). On the southeast side of Amaya Creek, multiple sets of
fresh cracks up to 1 m wide and 2.4 m deep were observed for a
distance of about 1 50 m on 80% slopes, 30 to 45 m upslope from the
stream channel (Photo 4).
990 THE LOMA PRIETA EARTHQUAKE OF 17 OCTOBER 1989 111
CONCLUSIONS
Two primary hazards to public safety resulting from earthquake
damage within Soquel Demonstration State Forest consist of: (1)
utslope failures along existing roads and horse trails in the form of
;mall debris slides, rock falls, boulder topples, and translational/
rotational slumping; and (2) areas of potential landsliding along the
iast Branch of Soquel Creek and Amaya Creek drainages that could
esult in blockage of the stream channels, flooding of the alluvial flats
vithin the forest, and subsequent movement of logs and other large
voody debris farther downstream during high water flows. The
•onstruction of roads and hiking/horse trails on slopes with high
andslide potential resulting from earthquake shaking could also pose
: hazard to public safety should these slopes fail in the future.
Areas of high landslide potential were identified where cracks
kcurred on or above steep slopes, particularly where the soils and
nderlying rock materials are not buttressed from below. Many of the
iracks followed previous landslide scarps and benches; some fol-
iwed bedding planes across spur ridges; and others were associated
,. ith road cut and fill failures and downslope movement along stream
anks. Three areas of particular geologic concern include: ( 1 ) the east
Hide of Amaya Ridge, (2) both sides of the entire Amaya Creek
[ihannel, and (3) selected slopes along Soquel Creek. A high landslide
potential may also exist where steep slopes and the toes of landslides
ire undercut by streams and/or existing and proposed roads.
Areas that could result in flood-related hazards within and down-
stream from the forest include existing and potential slope failures
located primarily in the Amaya Creek drainage. The downstream
movement of debris into existing log jams within the East Branch of
Soquel and Amaya creeks drainages could also result in future
flooding problems.
As a result of this reconnaissance geologic field work, the Califor-
nia Department of Forestry and Fire Protection is taking measures to
periodically monitor these potential hazard areas to assess the degree
and urgency of remedial work needed within the drainage. In
addition, more detailed geologic mapping of the forest will be
conducted at an appropriate scale to identify site-specific slope
stability problems that could be encountered during road construe
tion, timber harvesting, and other types of development associated
with management of the forest. These specialized geologic mapping
methods are outlined in six Division of Mines and Geology publica-
tions by Huffman ( 1977). Huffman and Bedrossian ( 1979), Bedros-
sian (1983), Bedrossian (1986a and 1986b). and CDMG Note 54
entitled "Guidelines for Geologic Reports Prepared for Timber Har-
vesting Plans."
ACKNOWLEDGMENTS
Assistance in the field was provided by Richard Boylan (DMG), Nancy Drinkard (CDF), and David Soho
(CDF). The authors also express their appreciation to Joy Sullivan and Ross Martin for completion of
drafting and layout design, and to Robert H. Sydnor for his editorial comments.

112 DIVISION OF MINES AND GEOLOGY SP104
REFERENCES
Bedrossian, T.L., 1983, Watersheds mapping in northern California: California
Geology, v. 36, no. 7, p. 140-147.
Bedrossian, T.L., 1986a, An update [on] watersheds mapping in northern
California: California Geology, v. 39, no. 2, p. 34-38.
Bedrossian, T.L., 1986b, Geologic recommendations for timber harvesting:
California Geology, v. 39, no. 6, p. 134-138.
Bedrossian, T.L., 1990, Reconnaissance geologic review of earthquake
damage in Soquel Demonstration State Forest resulting from the October
17, 1989 Loma Prieta earthquake, Santa Cruz: California Department of
Conservation, Division of Mines and Geology, Open-File Report 90-03,
26 p., map scale 1:1.000.
Blodgett, J.C., and Poeschel, K.R., 1988, Peak discharge, volume, and
frequency of the January 1982 flood in the Santa Cruz Mountains and
vicinity, in Ellen, S.D., and Wieczorek, G.F., eds., Landslides, floods, and
marine effects of the storm of January 3-5, 1982, in the San Francisco Bay
Region. California: U.S. Geological Survey Professional Paper 1434,
p. 229-243.
Bonilla, M.G, Mark, R.K., and Lienkaemper, J.J., 1984, Statistical relations
among earthquake magnitude, surface rupture length, and surface fault
displacement: Seismological Society of America Bulletin, v. 76, no. 6,
p. 2379-2411.
Brabb, E.E., 1989. Geologic map of Santa Cruz County, California: U.S.
Geological Survey Miscellaneous Investigations Series Map 1-1905,
scale 1 :62,500.
Clark, J.C., 1 981 , Stratigraphy, paleontology, and geology of the central Santa
Cruz Mountains, California Coast Ranges: U.S. Geological Survey
Professional Paper 1168, 51 p.
Clark, J.C., Brabb, E.E., and McLaughlin, R.J., 1989, Geologic map and
structure sections of the Laurel 7.5-minute quadrangle, Santa Cruz and
Santa Clara Counties, California: U.S. Geological Survey Open-File
Report 89-676, scale 1 :24,000
Cooper Clark and Associates, 1974, Preliminary map of landslide deposits in
Santa Cruz County, California: Santa Cruz County, Planning Department,
Seismic Safety Element of the County General Plan, 1 sheet,
scale 1 :62,500.
Cotton, W. R., Fowler, W. S., and Van Velsor, J. E., 1990. Coseismic bedding
plane faults and ground fissures associated with the Loma Prieta
earthquake of 17 October 1990: this volume, p. 95-103.
County of Santa Cruz, 1986, Stream Survey: III Soquel System A to Z, AmayaCreek and East Soquel Creek: Unpublished report, map scale 1 :24,000.
Division of Mines and Geology, 1976, Alquist-Priolo Special Studies Zones,
Laurel and Loma Prieta quadrangles: California Division of Mines and
Geology, scale 1 :24,000
Hart, E. W., Bryant, W. A., Wills, C. J., and Treiman, J. A., 1990, The search
for fault rupture and significance of ridgetop fissures, Santa Cruz
Mountains, California: this volume, p. 83-94.
Huffman, M.E., 1977, Geology for timber harvest planning, north coastal
California: California Geology, v. 30, no. 9, p. 195-201.
Huffman, M.E., and Bedrossian, T.L., 1979, The role of the geologist in timber
harvesting plan review: California Geology, v. 32, no. 6, p. 115-119.
Lawson, A.C., ed., 1908, The California Earthquake of April 18, 1906: Report
of the California State Earthquake Investigation Commission: Carnegie
Institution of Washington, Publication 87, v.1, 451 p.
McLaughlin, R.J., Clark, J.C., and Brabb, E.E., 1988, Geologic map and
structure sections of the Loma Prieta 7.5-minute quadrangle, Santa Clara
and Santa Cruz counties, California: U.S. Geological Survey, Open-File
Report 88-752, 32 p., scale 1 :24,000.
Plafker, G., and Galloway, J. P., eds., 1989, Lessons learned from the Loma
Prieta, California, earthquake of October 17, 1989: U.S. Geological
Survey Circular 1045, 48 p.
Shakal, A.F., Huang, M-J., Reichle, M.S., Ventura, O, Cao, T. .Sherburne,
R.W., Savage, M., Darragh, R.B., and Petersen, C, 1989, CSMIP strong-
motion records from the Santa Cruz Mountains (Loma Prieta), California
earthquake of 17 October 1989: California Division of Mines and Geology,
Report No. OSMS 89-06, 196 p.
Shakal, A. F., DeLisle, M. J., Reichle, M. S., and Darragh, R. B., 1990, Strong
ground shaking from the Loma Prieta earthquake of 17 October 1989 and
its relation to near surface geology in the Oakland area: this volume,
p. 29-46
Singer, S.. and Swanson, ML., 1983, Soquel Creek storm damage recovery
plan: US Soil Conservation Service, 71 p.
Spittler, T.E, and Harp, E.L., 1990, Preliminary map of landslide features and
coseismic fissures triggered by the Loma Prieta, California, earthquake of
October 17, 1989: California Division of Mines and Geology Open-File
Report 90-6, map scale 1 :4,800.
Spittler, T.E., and Sydnor, R.H., 1990, Landslides and ridge-top failures
associated with the epicentral area of the Loma Prieta earthquake of
October 17, 1989: EOS, Transactions of the American Geophysical Union,
v. 71, no. 8, p. 290, (abstract).
U.S. Geological Survey Staff, 1990, The Loma Prieta, California, earthquake:
an anticipated event: Science, v. 247, p. 286-293.
Wagner, D. L., 1990, Geologic and tectonic setting of the epicentral area of
the Loma Prieta earthquake, Santa Cruz Mountains, Central California: this
volume, p. 1-10.

REPRESENTATIVE DAMAGE PHOTOGRAPHS
FROM THE LOMA PRIETA EARTHQUAKE
by
David R. Montgomery 1
ABSTRACTThe types and distribution of damage from the Loma Prieta earthquake reflected both the earthquake magnitude
and the influence of distance, local geology, and building design and materials. In steep terrain near the epicenter
high peak accelerations, localized ground surface rupture, and massive landsliding caused considerable dam-age. In other less steep areas near the epicenter, structural damage was severe in many unreinforced masonry
buildings and older residences underlain by unconsolidated alluvium. Liquefaction was widespread in sandy
alluvial deposits throughout the Monterey Bay area. Farther from the epicenter, damage was concentrated in
areas underlain by alluvium, bay mud, and sandy artificial fill and preferentially impacted building types generally
considered susceptible to damage during earthquakes.
INTRODUCTION
The Loma Prieta earthquake lasted only 15 seconds but had wide-
;aching effects. The magnitude 7.1 earthquake was felt throughout
tost of California. Sixty-three people were killed, 3,757 injured, and
iany thousands rendered homeless (Plafker and Galloway, 1989;
^S, 1989). Total public and private property damage exceeded $6
llion, emergency response services cost millions, and millions more
commerce were lost due to economic disruption. The general types
id distribution of damage, however, varied as a function of distance
om the earthquake epicenter and local geologic conditions. The
trposes of this article are to describe the broad damage patterns and
show representative photographs of different types of damage.
The Modified Mercalli (MM) intensity scale (Table 1) provides a
lalitative method for describing the intensity of ground shaking
sed on relative effects on people, buildings, and the ground surface,
gure 1 shows the generalized distribution ofMM intensities for the
>ma Prieta Earthquake (Stover and others, 1990). Ground shaking
is generally most destructive near the earthquake epicenter, its
ipact diminishing with increasing distance. However, amplifica-
•n of ground shaking due to local surficial deposits (Borcherdt,
70) resulted in areas of anomalously high MM intensity at great
itances from the epicenter.
DAMAGE NEAR THE EPICENTER
Damage from severe ground shaking was extensive in the Santa
Cruz Mountains. Peak horizontal accelerations of 0.64 g were meas-
ured near the earthquake epicenter (Shakal and others, 1989; Shakal
and others, this volume) and local peak accelerations may have ap-
proached 1.0 g (McNally and others, 1989). Eyewitness reports of
household items flying across rooms and evidence for water tanks
becoming temporarily airborne also suggest extreme peak vertical
accelerations on narrow ridge tops in the Santa Cruz Mountains. To
date, some 4,875 residences in unincorporated areas of Santa Cruz
County have been inspected for earthquake-related damage
(D. Houghton, personal communication, 1990). Some houses were
thrown from their foundations (Photo 1 ) and many residences were
damaged by extensive ground cracking and landsliding. One massive
slope failure closed the northbound lanes of Highway 17 for 33 days.
Large slumps initiated by the earthquake severely damaged dozens of
homes in the Redwood Estates and Villa del Monte subdivisions.
These and many other similar landslides which initially moved
relatively little may become chronically unstable during heavy winter
rains. The potential for future deformation of these massive land-
slides during large-magnitude earthquakes is undoubtedly large.
jpartment of Geology and Geophysics. University of California, Berkeley
113
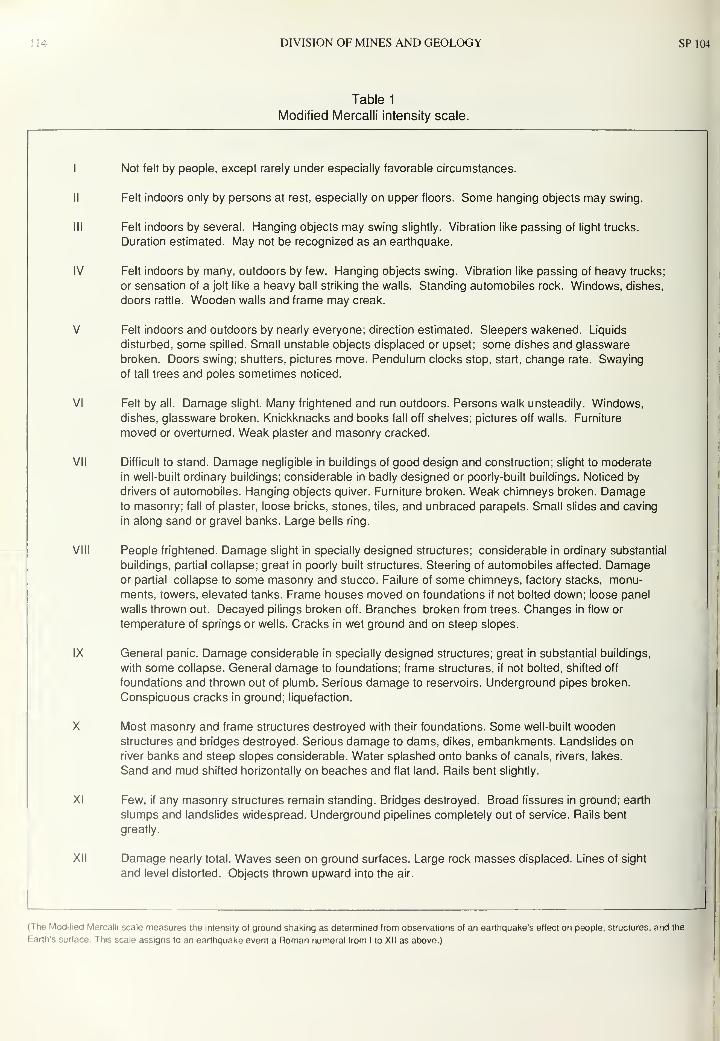
DIVISION OF MINES AND GEOLOGY SP 104
Table 1
Modified Mercalli intensity scale.
I Not felt by people, except rarely under especially favorable circumstances.
II Felt indoors only by persons at rest, especially on upper floors. Some hanging objects may swing.
III Felt indoors by several. Hanging objects may swing slightly. Vibration like passing of light trucks.
Duration estimated. May not be recognized as an earthquake.
IV Felt indoors by many, outdoors by few. Hanging objects swing. Vibration like passing of heavy trucks;
or sensation of a jolt like a heavy ball striking the walls. Standing automobiles rock. Windows, dishes,
doors rattle. Wooden walls and frame may creak.
V Felt indoors and outdoors by nearly everyone; direction estimated. Sleepers wakened. Liquids
disturbed, some spilled. Small unstable objects displaced or upset; some dishes and glassware
broken. Doors swing; shutters, pictures move. Pendulum clocks stop, start, change rate. Swaying
of tall trees and poles sometimes noticed.
VI Felt by all. Damage slight. Many frightened and run outdoors. Persons walk unsteadily. Windows,
dishes, glassware broken. Knickknacks and books fall off shelves; pictures off walls. Furniture
moved or overturned. Weak plaster and masonry cracked.
VII Difficult to stand. Damage negligible in buildings of good design and construction; slight to moderate
in well-built ordinary buildings; considerable in badly designed or poorly-built buildings. Noticed by
drivers of automobiles. Hanging objects quiver. Furniture broken. Weak chimneys broken. Damageto masonry; fall of plaster, loose bricks, stones, tiles, and unbraced parapets. Small slides and caving
in along sand or gravel banks. Large bells ring.
VIII People frightened. Damage slight in specially designed structures; considerable in ordinary substantial
buildings, partial collapse; great in poorly built structures. Steering of automobiles affected. Damageor partial collapse to some masonry and stucco. Failure of some chimneys, factory stacks, monu-
ments, towers, elevated tanks. Frame houses moved on foundations if not bolted down; loose panel
walls thrown out. Decayed pilings broken off. Branches broken from trees. Changes in flow or
temperature of springs or wells. Cracks in wet ground and on steep slopes.
IX General panic. Damage considerable in specially designed structures; great in substantial buildings,
with some collapse. General damage to foundations; frame structures, if not bolted, shifted off
foundations and thrown out of plumb. Serious damage to reservoirs. Underground pipes broken.
Conspicuous cracks in ground; liquefaction.
X Most masonry and frame structures destroyed with their foundations. Some well-built woodenstructures and bridges destroyed. Serious damage to dams, dikes, embankments. Landslides on
river banks and steep slopes considerable. Water splashed onto banks of canals, rivers, lakes.
Sand and mud shifted horizontally on beaches and flat land. Rails bent slightly.
XI Few, if any masonry structures remain standing. Bridges destroyed. Broad fissures in ground; earth
slumps and landslides widespread. Underground pipelines completely out of service. Rails bent
greatly.
XII Damage nearly total. Waves seen on ground surfaces. Large rock masses displaced. Lines of sight
and level distorted. Objects thrown upward into the air.
(The Modified Mercalli scale measures the intensity of ground shaking as determined from observations of an earthquake's effect on people, structures, and the
Earth's surface. This scale assigns to an earthquake event a Roman numeral from I to XII as above.)
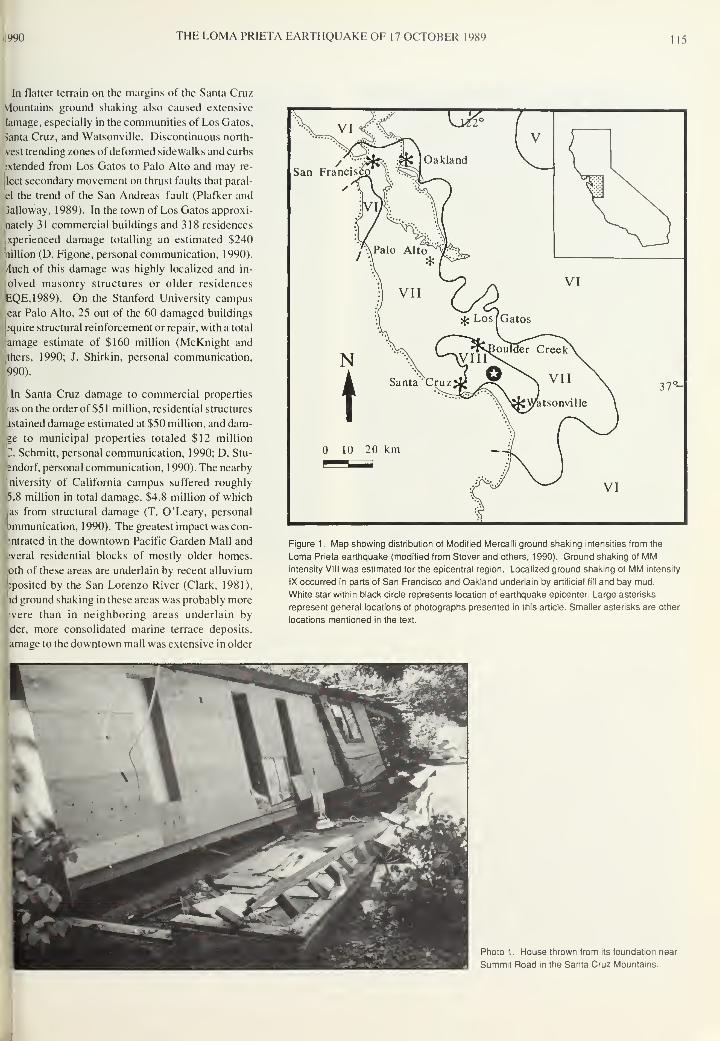
4990 THE LOMA PRIETA EARTHQUAKE OF 17 OCTOBER 1989 115
In flatter terrain on the margins of the Santa Cruz
Mountains ground shaking also caused extensive
lamage, especially in the communities of Los Gatos,
Santa Cruz, and Watsonville. Discontinuous north-
vest trending zones of deformed sidewalks and curbs
:xtended from Los Gatos to Palo Alto and may re-
|lect secondary movement on thrust faults that paral-
el the trend of the San Andreas fault (Plafker and
3alloway, 1989). In the town of Los Gatos approxi-
mately 31 commercial buildings and 318 residences
xperienced damage totalling an estimated $240
Inillion (D. Figone, personal communication, 1990).
/luch of this damage was highly localized and in-
iolved masonry structures or older residences
'EQE.1989). On the Stanford University campus
ear Palo Alto, 25 out of the 60 damaged buildings
pquire structural reinforcement or repair, with a total
:amage estimate of $160 million (McKnight and
,thers, 1990; J. Shirkin, personal communication,
,990).
In Santa Cruz damage to commercial properties
'as on the order of $5 1 million, residential structures
jstained damage estimated at $50 million, and dam-
ge to municipal properties totaled $12 million
Z. Schmitt, personal communication, 1990; D. Stu-
'endorf, personal communication, 1990). The nearby
niversity of California campus suffered roughly
,5.8 million in total damage, $4.8 million of which
,as from structural damage (T. O'Leary, personal
ommunication, 1990). The greatest impact was con-
^ntrated in the downtown Pacific Garden Mall and
.^veral residential blocks of mostly older homes,
oth of these areas are underlain by recent alluvium
bposited by the San Lorenzo River (Clark, 1981),
id ground shaking in these areas was probably more
•vere than in neighboring areas underlain by
der, more consolidated marine terrace deposits,
amage to the downtown mall was extensive in older
Figure 1 . Map showing distribution of Modified Mercalli ground shaking intensities from the
Loma Prieta earthquake (modified from Stover and others, 1990). Ground shaking of MMintensity VIII was estimated for the epicentral region. Localized ground shaking of MM intensity
IX occurred in parts of San Francisco and Oakland underlain by artificial fill and bay mud.
White star within black circle represents location of earthquake epicenter. Large asterisks
represent general locations of photographs presented in this article. Smaller asterisks are other
locations mentioned in the text.
Photo 1 . House thrown from its foundation near
Summit Road in the Santa Cruz Mountains.

116 DIVISION OF MINES AND GEOLOGY SP104
Photo 2. Partially collapsed masonry building in the Pacific Garden Mall,
Santa Cruz,
Photo 3. Collapsed chimney in the heavily damaged residential area of Santa
Cruz (from Montgomery, 1990).
brick buildings (EQE, 1989) (Photo 2) and several people were killed
when they were buried under rubble. Roughly 375,000 square feet of
commercial space in 23 buildings have already been demolished. Ex-
tensive damage in the residential area near Myrtle and Laurel streets
primarily involved collapsed chimneys and porches, and various
foundation failures (Photo 3). One building in this neighborhood
burned to the ground, apparently as a result of a gas line rupture. Anexample of the value of seismic retrofitting is provided by the relative
impact on the houses in this neighborhood. Residences that had
recently been structurally upgraded were essentially undamaged by
the earthquake while many unretrofitted houses experienced severe
damage (EQE Engineering, 1989).
Similar patterns of damage occurred in the town of Watsonville.
Buck buildings were extensively damaged in the downtown area, and
many older residential structures suffered partial collapse due to
foundation failure (Photo 4). Liquefaction of unconsolidated, satu-
iated, sandy deposits occurred throughout the alluvial plains and near
the coast from Santa Cruz to near Salinas. Post-earthquake mapping
indicates that the areas exhibiting evidence of liquefaction coincide
with areas previously mapped as susceptible to liquefaction (Plafker
and Galloway, 1 989), Perhaps the most dramatic example ofdamagein this area was the collapse of a portion of Highway 1 spanning Struvc
Slough as a result of strong shaking that may have been enhanced by
liquet. i inI Photo 5).
DAMAGE FAR FROM THE EPICENTER
The intensity of ground shaking generally decreased with increas-
ing distance from the epicenter for sites underlain by bedrock or
relatively consolidated alluvium. In contrast, sites underlain by bay
mud did not exhibit much attenuation of ground acceleration with
distance from the epicenter (Plafker and Galloway, 1989). Not;
surprisingly, damage far from the earthquake epicenter was concen-
.
trated in areas underlain by soft soil artificial fill and bay mud,
deposits prone to liquefaction or amplified ground surface accelera-
tions.
Ground shaking in San Francisco was greatest in the poorly consoli-'•
dated natural and manmade sediments on the margin of San Franciscoj
Bay; and most of the roughly $2 billion in damage occurred in parts
of the Marina, South of Market, and Mission districts mapped as being
underlain by landfill (Schlocker, 1974). Throughout the city 22 build- i
ings suffered damage sufficient to warrant their demolition, 363 were i
declared unsafe; and 1,250 designated as suitable only for limited
access pending repairs (City of San Francisco, 1990; L. Kornlield,
personal communication, 1990). The Marina District, one of the
hardest hit areas of San Francisco, is located on an old lagoon that was I
filled to accommodate construction of the Panama-Pacific Exhibi-
tion, which celebrated the rebuilding of the city after the devastating
1906 earthquake and fire. Sand boils and evidence of lateral spreading

990 THE LOMA PRIETA EARTHQUAKE OF 17 OCTOBER 1989 117
nto 4. Structural damage to a Victorian-style house in Watsonville.
S;gest that liquefaction of sandy fill
ntributed to the extensive damage in
Is area. Many of the devastated struc-
ies were three-and four-story apart-
I'nt complexes with parking garages
C the first floor (Photo 6). The limited
&ar resistance offered by the open
c ign of their lowest floor makes such
t ldings particularly vulnerable to col-
Ise during violent shaking or lateral
seading of the underlying ground
QE, 1989; Plafker and Galloway,
1 !9). Measurements of ground accel-
e lions during aftershocks indicate that
p k accelerations at nearby, minimally
it meted sites underlain by natural dune
s,ds were similar to those experienced
ii.ie heavily damaged area, suggesting
« a combination of ground deforma-
li|i and susceptible building design
c sed much of the damage (Plafker and
C loway, 1989). Lateral spreading of
fi nay have also damaged water mains,
h tpering initial efforts to fight fires re-
s ing from the earthquake.
Photo 5. Collapsed section of Highway 1 at Struve Slough near Watsonville.
The young alluvium underlying the failed portion of the structure had been
identified as having a high potential for liquefaction (Dupre, 1975).
Photo 6. Collapsed apartment building in the Marina District of San Francisco.

S18 DIVISION OF MINES AND GEOLOGY SPIO
Photo 7. Partially collapsed portion of Interstate 880 near 13th and 14th streets in west Oakland.
Many unreinforced masonry buildings in the South of Market
District were severely damaged by ground shaking, and six fatalities
resulted from the partial collapse of one brick structure (Plafker and
Galloway, 1 989). Strong ground shaking also damaged buildings lo-
cated on the site of a filled lagoon in the Mission District.
Across the bay in Oakland, damage was concentrated in areas
mapped as being underlain by manmade fill, bay mud, and sandy
alluvium (Radbruch, 1957). The 1.5 mile-long collapsed portion of
Interstate 880 (Cypress structure) was underlain by thin bay mud and
artificial fill, whereas the portion of the structure that did not fail was
underlain by older alluvium (Shakal and others, this volume). This
correlation suggests that locally modified ground motion may have
contributed to the disastrous pancaking of the freeway (Photo 7)
although this issue is not yet completely resolved. Similar sections ol
Highway 280 and Highway 480 (Embarcadero Freeway) in Sar
Francisco were closed as a result of earthquake-caused damage anc
may eventually be demolished. Liquefaction and lateral spreading
caused damage in other areas underlain by sandy fill and bay mud ot
the eastern margins of the bay. Lateral spreading damaged the Por
of Oakland (Photo 8), and liquefaction of sandy fill also causec
damage on the approaches to the San Francisco-Oakland Bay Bridge
at Oakland International Airport, and at Alameda Naval Air Station
Photo 8. Pavement disrupted by lateral spreading
of sand fill in the Port of Oakland.

1990 THE LOMA PRIETA EARTHQUAKE OF 17 OCTOBER 1989 119
In the city of Oakland some 1 ,400 residential, 200 commercial, and
12 public buildings sustained damage estimated at $29 million, $750
million, and $250 million, respectively (City of Oakland, 1989).
Thirteen commercial buildings were also destroyed at an estimated
loss of $234 million, bringing the estimated damage total to almost
$1.3 billion (excluding demolition and construction costs relating to
the Cypress Structure). Much of the structural damage occurred in
areas underlain by older alluvium where ground shaking should not
have been as great as in the filled areas near the bay. The buildings
in west Oakland that partially collapsed or were thrown off their
foundations generally were either older Victorian-style or masonry
structures that had not been seismically upgraded. Similarly, much of
the damage in downtown Oakland, which is also underlain by older
alluvium, was concentrated in masonry buildings (Photo 9).
CONCLUSIONS
The types and distribution of damage caused by the Loma Prieta
earthquake illustrate that local geologic conditions profoundly influ-
enced the particular types of damage likely to impact an area during
seismic shaking (see Borcherdt, 1975, for a discussion of seismic
zonation in land-use planning). The concentration of damage in areas
underlain by sandy manmade fill graphically illustrates the increased
seismic hazard associated with building on such deposits. Fatalities
in San Francisco and Santa Cruz were concentrated in unreinforced
masonry buildings. The highly localized nature of damage from the
Loma Prieta earthquake may not, however, be representative of the
hazard potential of all larger earthquakes. The DMG earthquake
planning scenarios for large earthquakes on the San Andreas and
Hayward faults outline areas of expected damage, especially in
heavily urbanized areas (Davis and others, 1982; Steinbrugge and
others, 1987). Unfortunately, knowing where earthquake-related
damage will be greatest does not, in and of itself, reduce seismic
hazards. The modification of land-use practices and reinforcement
of existing potentially hazardous buildings are also required.
poto 9. Partially collapsed unreinforced masonry building in downtown Oakland.
,'
120 DIVISION OF MINES AND GEOLOGY SP104
REFERENCES
Borcherdt, R.D., 1970, Effects of local geology on ground motion near San
Francisco Bay: Bulletin of the Seismological Society of America , v. 60, p.
29-61.
Borcherdt, R.D., ed., 1975, Studies for seismic zonation of the San Francisco
Bay Region: U.S. Geological Survey Professional Paper 941 -A, 102 p.
City of Oakland, 1989, Earthquake related issues fact sheet, 12-19-89, 5 p.
City of San Francisco, 1990, "Red Tag" buildings interim status report,
January 24, 1990, City of San Francisco, Department of Public Works,
Bureau of Building Inspection, 180 p.
Clark, J.C., 1981 , Stratigraphy, paleontology, and geology of the central Santa
Cruz Mountains, California Coast Ranges: U.S. Geological Survey Profes-
sional Paper 1168, 51 p.
Davis, J.F., Bennett, J.H., Borchardt, G.A., Kahle, J.E., Rice, S.J., and Silva,
M.A., 1982, Earthquake planning scenario for a magnitude 8.3 earthquake
on the San Andreas fault in the San Francisco Bay area: California
Division of Mines and Geology Special Publication 61 , 160 p.
Dupre, W.R., 1975, Maps showing geology and liquefaction potential of Qua-
ternary deposits in Santa Cruz County, California: U.S. Geological Survey
Miscellaneous Field Studies Map MF-648.
EQE Engineering, 1989, The October 17, 1989, Loma Prieta earthquake, Aquick look report: San Francisco, California, 40 p.
McKnight, C.L., Fehlhaber, K.L., Heubeck, C, and Sleep, N.H., 1990, Seismic
damage at Stanford University from the October 17, 1989 Loma Prieta
earthquake: EOS, Transactions of the American Geophysical Union, v. 71,
no. 8, p. 289, (abstract).
McNally, K.C., Lay, T., Protti-Quesada, M., Valensise, G., Orange, D., and
Anderson, R.S., 1989, Santa Cruz Mountains (Loma Prieta) earthquake:
EOS, Transactions of the American Geophysical Union, v. 70, no. 45,
p. 1463, 1467.
Montgomery, D.R., 1990, Effects of the Loma Prieta earthquake, October 17,
1989, San Francisco Bay Area: California Geology, v. 43, p. 8-13, 24.
OES (California Office of Emergency Services), 1989, executive summary,
December 18, 1989, 4:00 p.m., 3 p.
Plafker, G., and Galloway, J. P., eds., 1989, Lessons learned from the Loma
Prieta, California, earthquake of October 17, 1989: U.S. Geological Survey
Circular 1045, 48 p.
Radbruch, D.H., 1957, Areal and engineering geology of the Oakland West
Quadrangle, California: U.S. Geological Survey Miscellaneous Geologic
Investigations Map I-239.
Schlocker, J., 1974, Geology of the San Francisco North Quadrangle,
California, U.S. Geological Survey Professional Paper 782, 109 p.
Shakal, A.F., DeLisle, M.J., Reichle, M.S., and Darragh, R.B., 1990, Strong
ground shaking from the Loma Prieta earthquake of 17 October 1989 and
its relation to near surface geology in the Oakland area: this volume,
p.29-46.
Shakal, A.F., Huang, M.J., Reichle, M.S., Ventura, C, Cao, T., Sherburne,
R.W., Savage, M., Darragh, R., and Petersen, C, 1989, CSMIP strong-
motion records from the Santa Cruz Mountains (Loma Prieta), California
earthquake of 17 October 1989: California Division of Mines and Geology,
Report No. SMS 89-06, 196 p.
Steinbrugge, K.V., Bennett, J.H., Lagorio, H.J., Davis, J.F., Borchardt, G.A.,
and Toppozada, T.R., 1987, Earthquake planning scenario for a
magnitude 7.5 earthquake on the Hayward fault in the San Francisco Bay
area: California Division of Mines and Geology Special Publication 78,
243 p.
Stover, C.W., Reagor, G.R., Baldwin, F.W., and Brewer, L.R., 1990,
Preliminary isoseismal map for the Santa Cruz (Loma Prieta), California,
earthquake of October 18, 1989 UTC: U.S. Geological Survey, Open-File
Report 90-18, 24 p.
U. S. Geological Survey Staff, 1990, The Loma Prieta, California, earthquake,
An anticipated event: Science, v. 247, p. 286-293
ACKNOWLEDGMENTSThis paper is primarily based on a brief survey of damage during the days immediately after the earthquake,
technical information on the earthquake subsequently published by the USGS, and interviews with local officials.
A number ofpeople were exceptionally helpful. In particular, I wish to thank Cheryl Schmitt and Dick Stubendorff
(City of Santa Cruz), Linda Schroff (City of Oakland), Deborah Figone (City of Los Gatos), Darcy Houghton
(Santa Cruz County), Lawrence Kornfield (City of San Francisco), Tom O'Leary (U.C. Santa Cruz), and Joel
Shirkin (Stanford University). Many specific impacts of the earthquake are not covered to the extent that they
deserve to be, and this broad overview should not be considered comprehensive. Any inadvertent errors of fact
or interpretation are regretted and remain my responsibility. I also thank Joachim Hampel for technical assistance
in preparing and printing photographs and Whole Earth Access for a timely donation of film the morning after
the earthquake.
SECTION
Earthquake Response


HIGH-ALTITUDE U-2 PHOTOGRAPHY FOR POST-EARTHQUAKE
DISASTER ASSESSMENTby
Charles R. Real 1
, Robert E. Yoha2, and Fumio Kaneko3
ABSTRACT
High-altitude U-2 photography was obtained of the San Francisco Bay region soon after the Loma Prieta
earthquake, using an IRIS-II panoramic camera. The photographs were analyzed for evidence of structural
damage and ground effects. The high resolution photography permitted ground viewing at scales up to 1 :800
or about 1 inch equals 67 feet. Areas of liquefaction were readily identified on the imagery and later verified
by field inspection. Although objects as small as 6 inches could be seen when contrast was high, only severe
structural damage could be easily recognized. The imagery proved valuable for quickly assessing the regional
scope of certain types of major structural damage.
INTRODUCTION
The morning following the Loma Prieta earthquake, the 9th Strate-
gic Reconnaissance Wing (9th SRW) of Beale Air Force Base
conducted an overflight of the San Francisco Bay region using U-2
aircraft to obtain photo coverage of the affected area in place of a
routine training mission. This imagery was made available to Divi-
sion of Mines and Geology (DMG) staff for post-earthquake assess-
ment of damage and effects through the Governor's Office of Emer-
gency Services. While the United States Air Force does not routinely
provide such imagery for civilian use, this special circumstance
presented a unique opportunity for government agencies to provide
information of use in immediate disaster relief planning and also to
evaluate the usefulness of unclassified U-2 photography for studying
the effects of earthquakes on the land and engineered structures. Such
unclassified high-altitude photography is also commercially avail-
able through other sources, so experience with this specific applica-
tion would help provide a relative cost/benefit comparison as a basis
for future considerations.
The Geologic Hazards Assessment Program of the Department of
Conservation's Division of Mines and Geology collects, analyzes, in-
terprets, and disseminates information on geologic hazards in Califor-
nia for the safety and welfare of the public. As a means of improving
our ability to recognize hazardous areas well in advance of a disaster,
program staff respond to damaging events by conducting field studies
and making observations of their effects. Because the effects of
earthquakes upon the land and engineered structures are short-lived,
assessments must be made soon after the event. In many instances
repairs in the San Francisco Bay region began almost immediately
after shaking from the Loma Prieta earthquake ceased. Thus, from a
regional damage assessment point of view, the scope of the disaster
must be quickly determined, and a method of rapidly inventorying
damage and shaking effects over a large geographic area must be used.
With early reports of catastrophic collapse and widespread damage
immediately following the Loma Prieta earthquake, aerial photogra-
phy seemed to provide such a method.
Our purpose for investigating the use of U-2 photography is to
determine the usefulness of the U-2 platform for making such assess-
ments. Such photography can be used to rapidly assess the severity
and geographic extent of damage, and to provide necessary imagery
for a long-term study of the relationships between earthquake damage
and effects, observed ground shaking, and near-surface geology. This
paper discusses our preliminary conclusions on the utility of U-2 pho-
tography for post-earthquake disaster study. We first introduce the
characteristics of the U-2 platform, and then provide some examples
of its utility in the wake of the Loma Prieta earthquake.
'California Department of Conservation, Division of Mines and Geology, Geologic Hazards Assessment Program
^California Department of Conservation, Office of Land Conservation
'OYO Corporation, Japan
121
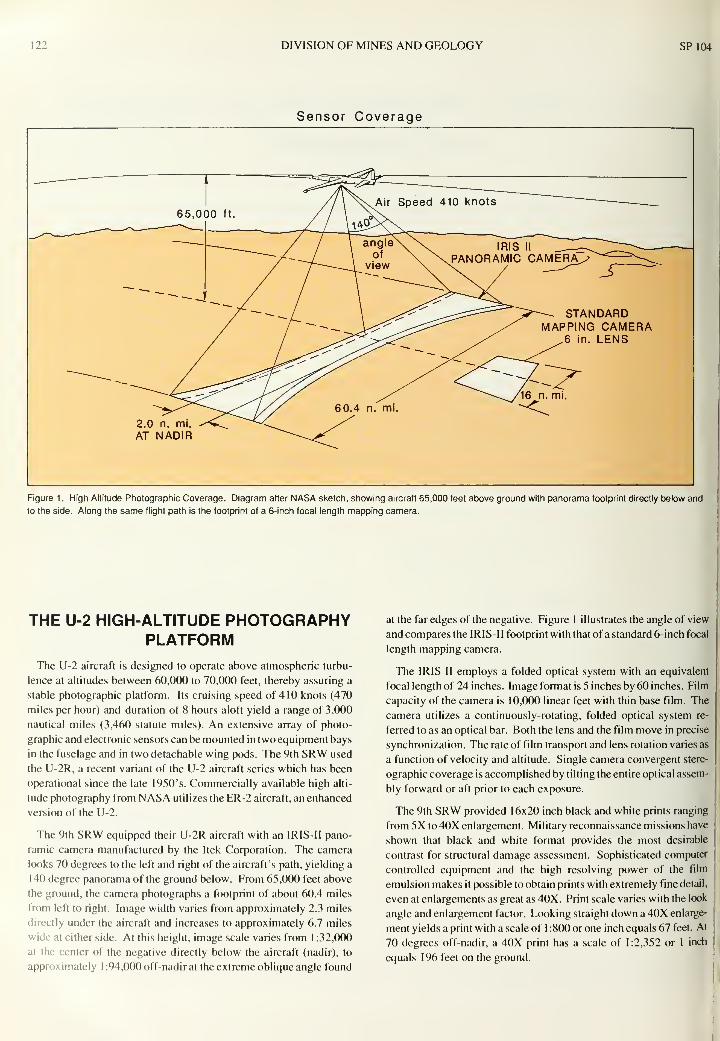
122 DIVISION OF MINES AND GEOLOGY SP104
Sensor Coverage
2.0 n. mi.
AT NADIR
Figure 1 . High Altitude Photographic Coverage. Diagram after NASA sketch, showing aircraft 65,000 feet above ground with panorama footprint directly below and
to the side. Along the same flight path is the footprint of a 6-inch focal length mapping camera.
THE U-2 HIGH-ALTITUDE PHOTOGRAPHYPLATFORM
The U-2 aircraft is designed to operate above atmospheric turbu-
lence at altitudes between 60,000 to 70,000 feet, thereby assuring a
stable photographic platform. Its cruising speed of 410 knots (470
miles per hour) and duration of 8 hours aloft yield a range of 3,000
nautical miles (3,460 statute miles). An extensive array of photo-
graphic and electronic sensors can be mounted in two equipment bays
in the fuselage and in two detachable wing pods. The 9th SRW used
the U-2R, a recent variant of the U-2 aircraft series which has been
operational since the late 1950's. Commercially available high alti-
tude photography from NASA utilizes the ER-2 aircraft, an enhanced
version of the U-2.
The 9th SRW equipped their U-2R aircraft with an IRISH pano-
ramic camera manufactured by the Itek Corporation. The camera
looks 70 degrees to the left and right of the aircraft's path, yielding a
140 degree panorama of the ground below. From 65,000 feet above
the ground, the camera photographs a footprint of about 60.4 miles
from left to right. Image width varies from approximately 2.3 miles
directly under the aircraft and increases to approximately 6.7 miles
wide at cither side. At this height, image scale varies from 1 :32,000
at the center of the negative directly below the aircraft (nadir), to
approximately 1 :94,000 off-nadir at the extreme oblique angle found
at the far edges of the negative. Figure 1 illustrates the angle of view
and compares the IRIS-II footprint with that of a standard 6-inch focal
length mapping camera.
The IRIS II employs a folded optical system with an equivalent
focal length of 24 inches. Image format is 5 inches by 60 inches. Film
capacity of the camera is 10,000 linear feet with thin base film. The
camera utilizes a continuously-rotating, folded optical system re-
ferred to as an optical bar. Both the lens and the film move in precise
synchronization. The rate of film transport and lens rotation varies as
a function of velocity and altitude. Single camera convergent stere-
ographic coverage is accomplished by tilting the entire optical assem-
bly forward or aft prior to each exposure.
The 9th SRW provided 16x20 inch black and white prints ranging
from 5X to 40X enlargement. Military reconnaissance missions have
shown that black and white format provides the most desirable
contrast for structural damage assessment. Sophisticated computer
controlled equipment and the high resolving power of the film
emulsion makes it possible to obtain prints with extremely fine detail,
even at enlargements as great as 40X. Print scale varies with the look
angle and enlargement factor. Looking straight down a 40X enlarge-
ment yields a print with a scale of 1 :800 or one inch equals 67 feet. At
70 degrees off-nadir, a 40X print has a scale of 1 :2,352 or 1 inch
equals 196 feet on the ground.

1990 THE LOMA PRIETA EARTHQUAKE OF 17 OCTOBER 19X9123

124 DIVISION OF MINES AND GEOLOGY SP104
Interpretation is best done using a second generation film positive,
copied from the original negative, on a backlighted table equipped
with viewing optics. The film positive image stands up well at
magnifications of 50X and greater. Prints lose a certain amount of
detail upon enlargement; however, it is still possible to observe
objects as small as 6 inches across on a 20X vertical print.
Panoramic photography makes it possible to obtain both vertical
and oblique views from the same camera and flight. The panoramic
image provides the interpreter with three distinct views, vertical and
oblique to either side of the flightline. If one side of the area/object
of interest is in shadow or masked, it is a simple process to locate an
adjoining flight line and choose a corresponding view looking from
the other side, providing hills or mountains do not mask the area/
object from the adjoining flightline. Having both a vertical and
oblique print of the same scene is extremely useful because the
amount of information that can be extracted from the pair is much
greater than using one or the other alone. Oblique and vertical scenes
make it possible to assess spatial information, without resorting to
stereo interpretation, greatly facilitating the assessment of vertical
objects such as buildings and other structures. Stereo interpretation
is possible using IRIS-II images; however, this is best done with the
film positive on a light table using stereo viewing equipment.
While the imagery used in this study is not available for public or
private use, IRIS-II imagery and remote sensing services are com-
mercially available from NASA's High Altitude Aircraft Program at
NASA/AMES Research Center, Moffett Field, California.
ANALYSIS OF LOMA PRiETAEARTHQUAKE COVERAGE
Method of Analysis
The IRIS-II coverage was flown October 18, 1989 in the morning
approximately 16 hours after the earthquake. We examined our first
frames by noon, October 19, 1989, and began systematically evalu-
ating the photography by about 3:00 p.m., about 48 hours after the
earthquake. Our approach was to first identify sites of known
reported damage to allow some level of "calibration" for photo-
interpretive damage analysis. Analysis was done viewing a film
positive with a motorized optical comparator, which allowed mag-
nification to 30 times. Once a known damage site was evaluated, a
reconnaissance of damage in the area immediately surrounding the
site was made. Questionable observations were noted for subsequent
field inspection and the next known damage site was then evaluated.
On-line reports from the Governor's Office of Emergency Services
were used to select damage sites for analysis. Limited ground
verification was available from media reports on television. After
the first few hours of analysis, a discrepancy was apparent between
the information given by the news media of the extent of regional
damage, and what was beginning to unfold from air photo analysis.
Damage was not uniformly high, nor even moderate, over the Bay
region, but was instead very concentrated geographically. Informa-
tion provided by the news media was not systematic throughout the
region, but was focused instead on several severely damaged areas.
In contrast, within 24 hours after the earthquake the high-altitude im-
agery showed the first clear indication of the regional extent of
damage and thereby demonstrated the value of the imagery for such
assessments.
Specific Examples of Damage and Effects
Three broad categories of structures were examined for damage
detection: (1) Transportation, (2) Utilities, and (3) Buildings. In
many instances where photo interpretation was questionable, the
structures were later visited on-site to verify suspected damage or
ground effects. The field inspection team consisted ofDMG staff and
geotechnical engineers with OYO Corporation of Japan, who were
immediately dispatched to the affected area to gather information for
a company reconnaissance report. DMG had already been cooper-
ating with OYO Corporation in the exchange of hazard assessment
technology, and the earthquake provided an opportunity to conduct
joint field observations.
Transportation - Observed damage to highway bridges and over-
passes included the collapsed Cypress segment of the Nimitz Free-
way (Interstate 880) in Oakland, the failure of the San Francisco-
Oakland Bay Bridge span and liquefaction along the toll plaza
approach and the collapse of U.S. Route 1 in Watsonville. Less
obvious damage was observed at bridge crossings over the San
Lorenzo River in Santa Cruz, which field inspection proved to be the
result of lateral spreads and abutment failure, and separation at the,
abutment of University Avenue overcrossing of U.S. 101 in Pale
Alto. Fresh black asphalt patches about two feet wide on each
abutment were readily visible on the imagery. Extensive liquefac-
tion and runway damage were apparent at the Oakland International
Airport and Alameda Naval Air Station. The latter revealed i
lineation of liquefaction along seams between old hydraulic fill set
walls and newer bay fill supporting bayward expansions of the
airport (Lee and Praszker, 1969).
Utilities - Leakage of gasoline storage tanks was observed at oi,
refineries located in Richmond, Pinole, and Rodeo. No structura.
damage was apparent, and leakage may have resulted from seiche
induced breaching. Damage to a switching yard at Moss Landing
electric power generating station was observed. The partial collapse
ofKGO radio transmitting towers east of the Dumbarton Bridge was
particularly evident on oblique images. Also observed were effect;
of buried water lines that ruptured. In most cases their effects coulc
not be distinguished from liquefaction.
Buildings - Building damage proved difficult to verify on imager)
unless very severe and accompanied by partial roof collapse, twist1
ing, tilting, or wrenching of structures. Of many severely damagec
structures in the Santa Cruz mall, only two clearly revealed partia
roof collapse that was easily identified on the IRIS-II imagery. /
school building at Santa Cruz High School having suspected damagt
was later proven to be undamaged. Practically none of the singlt
family structures suffering foundation failure could be identified.;
Foundation failure is usually accompanied by a downward settling
of the structure one foot or so, which is not visible from overhead o
oblique high-altitude photography. Of course, serious internal dam
age to buildings can go unnoticed from outside the building even a
ground level. The more dramatic failures, such as in the Marina are;
of San Francisco where structures were severely tilted or twisted ou
of alignment with adjacent structures, were readily identified on th<
imagery.

1990 THE LOMA PRIETA EARTHQUAKE OF 17 OCTOBER 1989 125
Ground failures - As mentioned, liquefaction
sffects accompanied by the ejection of water and
and (flow failure) were generally identifiable on
[RIS-II imagery (Photos 1 and 2). Because of
jood contrast, dry sand was more easily seen on
dark ground or pavement, while wet sand was
'nore easily seen on light colored ground. One
case of suspected liquefaction at a high school
ootball field in Santa Cruz proved not to be
iquefaction, but runoff from water sprinklers.
What appeared to be liquefaction along the board-
walk in Santa Cruz and at some locations near a
;hopping mall in Alameda, turned out, upon field
nspection, to be ruptured water mains that had
brought sand and water to the ground surface. Wepeculate that failure of the water mains probably
esulted from liquefaction at depth.
! Most of the damage related to slope failure oc-
curred in the Santa Cruz Mountains. Except for
arge failures that removed vegetation or that
iccurred along open road cuts, most landslides
vere difficult to identify because of dense vege-
ation. These conditions were severe enough that
,ven conventional low altitude aerial photography
.vasonly marginally useful. In one instance, a 10-
oot diameter block of rock broke off a cliff and
topped about 15 feet to rest alongside a small
arking lot behind a store in Santa Cruz. The
ailure could not be identified on the IRIS-II
nagery because of lack of contrast between the
alien block and similarly-colored talus slope.
APhoto 2. (A) Ground level photograph of liquefaction In parking lot of industrial complex (Photo by
Charles R. Real) shown in Photo 1 . (B) Close-up view of damaged area (Photo by Fumio Kaneko).
V

126 DIVISION OF MINES AND GEOLOGY SP104
CONCLUSIONS
A limited analysis ofIRISH U-2 aerial photography has shown the
value of high-altitude imagery for post-earthquake disaster assess-
ments of damage and ground effects caused by a regional M7 event.
It provided DMG scientists and management with the first region-
wide view of the scope of the disaster, greatly clarifying misleading
perceptions from sensationalized news media reports. Care and con-
trol during processing of film, contrast of objects under surveillance,
time of day, and sun angle contribute to the level of damage detecta-
bility using the IRIS-II U-2 platform. While a 10 foot diameter rock
could not be detected under conditions of poor contrast, 6 inch wide
yard lines on a football field could be readily distinguished because
of high contrast of white chalk lines against dark green grass.
Structural collapse can usually be recognized on IRIS-II imagery.
Lesser damage to buildings must be severe, at least involving partial
roof collapse, tilting, twisting of the structure, or other physical
displacement in order to be recognized. Partial collapse of bridges, or
misalignment with abutments and adjacent roadways are identifiable.
In some cases minor separation of bridge abutments was identified by
the strong contrast of dark, new asphalt patches against light-colored
pavement.
Ground failures can also be recognized on IRIS-II imagery. The
surface expulsion of sand associated with liquefaction is readily
identifiable in some cases, as are hillside scars caused by slope failure.
Many of the damage or ground features detectable on high altitude
imagery would probably also have occurred in a smaller earthquake
occurring in a more localized urban area. However, we believe that
the high-altitude IRIS-II imagery would be most useful under condi-
tions of higher uniform damage than that caused by the Loma Prieta
earthquake.
REFERENCESLee, C. J., and Praszker, M., 1969, Bay mud developments and related
structural foundations, in Goldman, H. B., ed., Geologic and engineering
aspects of San Francisco Bay fill, California Division of Mines and Geology
Special Report 97, p. 43-85.
Miller, J., and Pocock, C, 1988, Lockheed U-2RATR-1: Aerofax Minigraph
Number 28.
Slama, C.C., ed., 1980, Manual of Photogrammetry, 4th ed.: American
Society of Photogrammetry, Section 4.2.2, p. 196- 209.
ACKNOWLEDGMENTSWe thank Brigadier General Lawrence Mitchell, Commander, 14th Air Division, Beale Air Force Base, and the
9th Strategic Reconnaissance Wing for acquiring this imagery and making it available to government agencies
responding to the Loma Prieta earthquake disaster. Chris Higgins of DMG assisted with initial air photo
interpretation. We also thank Major John Dieken and First Lieutenant Steve Wilcox of the 9th Strategic Reconnais-
sance Wing, and Steve McNutt of DMG for reviewing the manuscript and making helpful suggestions.

LOMA PRIETA EARTHQUAKE RESPONSE ACTIVITIES
OF THE DIVISION OF MINES AND GEOLOGY
by
Robert Streitz1
, Robert H. Sydnor 2, Allan G. Barrows 2
,
and Thomas E. Spittler3
ABSTRACT
The Division of Mines and Geology (DMG) responded to the Loma Prieta earthquake in five ways: (1
)
immediate data gathering, analysis of a developing situation, and briefings to state government officials
and the news media working through the Governor's Office of Emergency Services (OES), (2) searching
the epicentral area for surface rupture, (3) quick retrieval and timely publication of records from DMG strong
motion stations, (4) field assistance to local government agencies in Santa Cruz and Santa Clara counties
regarding landslides in the epicentral area, and (5) publication of earthquake information.
Initial field deployment of geologic staff was made using the DMG Event Response Plan which assigns
appropriate projects to respond to a geologic event. One week after the event, the response plan wasmodified to allow geologists from other DMG projects to aid in landslide risk analysis.
Scientific publications resulting from the DMG response effort include California Strong Motion Instru-
mentation Program reports, four poster sessions presented at the December 1989 meeting of the
American Geophysical Union in San Francisco, articles in California Geology magazine, open-file reports,
and this special publication.
INTRODUCTION
The Loma Prieta earthquake was felt at 5:04 p.m. on Tuesday,
October 17, 1989 in all three offices of the Division of Mines and
Geology (DMG): felt sharply (MMI VI) in the Bay Area Regional
Office in Pleasant Hill (with power outages); felt as a long rolling
event (MMI IV) in Sacramento (from the long-period waves); and
barely perceptible (MMI II) in Los Angeles.
Based on the DMG Event Response Plan and past experience, staff
immediately began to gather information to determine the location
and magnitude of the earthquake and the likely distribution of
geologic effects that would require DMG response. The purpose of
this article is to document DMG response activities and to provide
a summary of specific lessons learned following the event. Since
magnitude 7 earthquakes occur infrequently in California, this infor-
mation may be of value to DMG staff and others who may need to
respond to comparable events in the future. Much of the information
presented here could not be anticipated in advance of the earthquake,
but could only be obtained during actual response to the event.
INITIAL ACTIVITIES
A Public Contact Office was set up by 5:24 p.m. on October 17. The
State Geologist and a Senior Seismologist immediately went to the
State Headquarters of the Governor's Office of Emergency Services
(OES) to provide technical information to that critical command
post. The California Strong Motion Instrumentation Program
(CSMIP) manager made plans to dispatch several teams of techni-
cians to the Bay area to retrieve strong-motion records. Plans were
made by the Fault Evaluation and Zoning project manager to put two
teams into the epicentral area early Wednesday morning. Concur-
rently, the Landslide Hazard Identification project (LHIP) manager
mobilized his team for field work, sending in several geologists from
Los Angeles, Sacramento and Pleasant Hill.
From 5:19 to 8:45 p.m., 21 telephone calls were handled by
the Public Information Office. Most of the calls came from local
(Sacramento) and Bay area radio stations, television stations, and
newspapers. On the first evening, there were no telephone commu-
nications in or out of the epicentral area; the telephone lines in the
Bay area were overloaded with 20 million calls. Thus, field mobili-
zation plans had to be made by program managers, based on the
'California Department of Conservation, Division of Mines and Geology, Publications and Information Program2Division of Mines and Geology, Geologic Hazards Assessment Program'Division of Mines and Geology, Environmental Protection Program
127

128 DIVISION OF MINES AND GEOLOGY SP 104
assumption that widespread damage had occurred throughout the
epicentral region. Scientific communications between DMG and the
U. S. Geological Survey (USGS) were hindered because telephone
lines, computers, and electrical power were out of service at USGSoffices in Menlo Park.
PUBLIC CONTACT OFFICE IN
SACRAMENTOThe main purpose of the DMG Public Contact Office following a
significant geologic event, such as the Loma Prieta earthquake, is to
provide reliable geologic information to State and local emergency
officials, to the news media, to earth science professionals, and to the
public. The Public Contact Office staff provides background data on
earthquakes and the geology of California and answers specific
geologic questions. Calls to DMG came from across the country and
from as far away as Japan and Australia.
DMG staff were hampered by regional post-earthquake telecom-
munications problems, so early information gathering relied on
monitored television and radio broadcasts. As communications
improved, technical information from DMG field geologists was
provided to the Public Contact Office. Part of the service provided
by the Public Contact Office was the clarification of unverified in-
formation on fault rupture.
In this regard, the two most important responsibilities of the Public
Contact Office were: (1) to verify such reports before they were
passed on to the news media and to the public, and (2) to correct
erroneous reports as soon as accurate reports based on reliable (first-
hand) field observations were received. During the first few days
following the earthquake, findings were communicated to DMGmanagement through the Public Contact Office.
For the first 16 days following the earthquake, the Public Contact
Office responded to 1 52 calls from the news media, including radio,
television and the press. The calls ranged from single quick ques-
tions, to reviews and updates about the event, to in-depth interviews
regarding geology and seismicity of California as it relates to the
Santa Cruz Mountains and this specific earthquake.
FIELD WORK DURING THE FIRST WEEKThe initial phase of field investigations was carried out between
Wednesday morning, October IK and Sunday evening, October 22,
[989. The Fault Evaluation and Zoning project sent two teams into
the field early Wednesday morning following the main shock. Twogeologists teamed up to inspect road crossings in the southern ep-
icentral area (Hecker Pass Road to Hollister). A second team of two
geologists inspected the northern epicentral part of the San Andreas
fault. Here they found abundant ridgetop fissures and many large
landslides, but found no through-going fault rupture on the San
Andreas fault, as had been anticipated. I.I UP geologists were mobi-
lized early on the morning of October 18th. That night, DMGgeologists met at the USGS offices in Menlo Park lo coordinate State
and federal field activities
U-2 imagery of the San Francisco Bay area taken on October 18
was obtained from Beale Air Force Base. This imagery was available
to DMG staff for specific studies (see Real and others, this volume).
One other task completed during the first week following the earth-
quake involved assisting earth scientists from other areas in their
earthquake research.
A DMG engineering geologist worked with the Santa Cruz
County Geologist for five days following the mainshock, then
returned to Sacramento with videotapes of epicentral landslide
damage for review by DMG management. Landslides in the Santa
Cruz Mountains and along the coastline affected hundreds of per-
sons, leaving many homeless.
At the request of the Regional Director for OES Region II, a LHIP
geologist from the DMG Pleasant Hill office provided information
about earthquake-related geologic hazards to OES staff on Monday,
October 23, 1 989. The two offices are located adjacent to each other,
facilitating close liaison between the two state agencies.
FIELD WORK DURING THENEXT TWO MONTHS
Santa Cruz County Activities
One week after the earthquake, DMG responded to a request for
assistance and technical advice from the Santa Cruz County Office
of Emergency Services. The county requested DMG to evaluate the
geologic hazards from reactivated large landslides.
Due to the urgent nature of the task and because of concern for
public safety, five geologists from additional DMG programs were
assigned to the initial systematic reconnaissance of the rugged
terrain in the epicentral area.
A geologist with the LHIP set up a clearinghouse in the Santa Cruz
County Emergency Operations Center. Data acquired by team
members, the USGS, and other geologists were plotted on a master
set of topographic maps. Specific notes regarding individual land-
slides were keyed to numbered site locations and entered into a
computer database. This clearinghouse was maintained for four
weeks. Following the initial evaluation of the most critically affected
areas in Santa Cruz County, other DMG geologists and some private
consulting geologists joined the team.
DMG geologists, in cooperation with USGS geologists, prepared
a set of large-scale maps of the epicentral area in Santa Cruz County.
These maps were prepared to: ( 1 ) provide county officials with
regional landslide information that could be used for timely rehabili-
tation of damaged areas; (2) identify disturbed ground which is
potentially vulnerable to debris Hows during upcoming winter rains;
(3) provide county planning officials with specific geologic hazard
information that will be used for effective land-use decisions; and (4)
document regional landslide features that might not otherwise be
recognized during individual site investigations lor reconstruction,
remedial grading, or for future development. The landslide mapping
products resulted in DMG Open File Report 90-6 and two technical
papers prepared for the American Geophysical Union Fall Meeting.

Iwo THE LOMA PRIETA EARTHQUAKE OF 17 OCTOBER 1989 129
Large-scale mapping of a 3,500 hectare (ha) /one in the epicentral
region of the Santa Cruz Mountains identified several areas where
earthquake-triggered landslides pose an on-going hazard to public
safety (see Spittler and others, this volume). In response to this
hazard, Santa Cruz County applied to the Federal Emergency
Management Agency (FEMA) for assistance in evaluating the haz-
ard. A Technical Advisory Group was formed, consisting of scien-
tists and engineers from the U.S. Army Corps of Engineers (the
managing agency). Santa Cruz County, the U. S. Geological Survey,
U.C. Santa Cruz, the Santa Cruz County geologic review consultant,
and DMG. The Technical Advisory Group began meeting in Novem-
ber 198°- and has overseen the collection of a large amount of data.
The group is scheduled to continue to oversee the collection and
analysis of slope-stability data through the winter of 1990-1991.
Santa Clara County Activities
Within a week of the earthquake, an urgent request for geologic
assistance was received from the Santa Clara County Office of
Emergency Services. Although not as common or widespread as in
Santa Cruz County, landsliding was locally very damaging in the
Santa Cruz Mountains portion of Santa Clara County, particularly in
the villages of Redwood Estates, Chemeketa Park, Holy City, the
Summit Road area, Aldercroft Heights, and the road to Lake Elsman.
The LHIP manager set up a clearinghouse and provided a commu-nications link between geologists in the field and the County Emer-
gency Services personnel at the Emergency Operations Center in San
, Jose. Two LHIP geologists were called in to examine sites in the
Summit Ridge area where cracking or other manifestations of ground
failure that appeared to threaten homes were reported. Rapid
evaluations were made of these localities, and the county was able to
determine where significant problems existed and where many other
features were not threatening to dwellings. This clearinghouse in
San Jose was maintained for five days. The LHIP geologists then
joined the team working in Santa Cruz County.
Other DMG Response Activities
The California Department of Forestry and Fire Protection (CDF)
requested that the DMG Timber Harvest Project (THP) geologists,
who are under long-term contract to CDF for review and analysis of
.geologic conditions affecting timber harvesting, perform an assess-
ment of Soquel Demonstration State Forest, which is located in a
remote mountainous area very near the epicenter. The results of that
field work are reported by Bedrossian and Sowma (1990, this vol-
ume).
Timely briefings on the earthquake were given by DMG manage-
ment to the Director of the Department of Conservation, to the State
Mining and Geology Board, to the Governor's office, and to the
Legislature. On January 11-12, 1 990 a briefing and field tour of the
ipicentral region was given in Santa Cruz to the entire State Mining
ind Geology Board.
ADDITIONAL FIELD MAPPING
In mid-January 1 990. two geologists from the Fault Evaluation and
Zoning project returned to the Summit Road area, along the border
of Santa Cruz and Santa Clara counties. Six work days ol field
mapping wereperformed to restudy the complex fissures, cracks, ami
scarps along the Summit Road area and Skyland Ridge. It was
necessary to perform the field work before winter rains obscured
fragile surficial features. The results of that field work are presented
by Hart and others ( 1990, this volume).
On April 18, 1990, there were several aftershocks in the Watson-
ville area; the largest shock had a magnitude of 5.4. Two geologists
from DMG's Pleasant Hill office responded, but found no surface
rupture. Some small slope failures occurred along Highway 129 at
River Oaks (near Chittenden). Dozens of sand boils formed in Soda
Lake, where similar features formed during the Loma Prieta earth-
quake.
DMG's Landslide Hazard Identification project and the USGShave plotted the seismically-induced slope failures that resulted from
the Loma Prieta earthquake on 7.5-minute quadrangle maps. These
maps will be published as a joint DMG-USGS Open-File Report.
DMG expects to publish a revised version of this report in the near
future.
LESSONS LEARNEDThis was the largest earthquake in 37 years in California. Some
lessons that we learned in responding may prove useful to others in
similar circumstances.
1. For a large magnitude earthquake, local government agencies
need considerable help with landslides if the epicentral area is one
with steep relief and has many scattered homes.
2. It is important for government geologists to be certain about the
extent of large landslide complexes which may involve dozens of
homes. County officials should be briefed on large landslide situ-
ations in a timely manner; in turn, officials should then notify con-
stituent homeowners.
3. The complex and overlapping occurrence of geologic features
such as landslide scarps, ground fissures, and other surficial effects
tend to obscure the distinction between precise earth sciences inves-
tigations. An event response plan should thus call for broadly
trained personnel to investigate landsliding. surface faulting, lique-
faction and other earthquake-related geologic processes, products,
and land forms.
4. Professionalfamiliarities developed over years of liaison be-
tween state and county geologists are the foundation of close coop-
eration during an emergency event. Professional civil service staff
at the local, state and federal level (geologists, planners, building of-
ficials, public works engineers, OES staff, and others) are essential
to successful emergency response efforts.

130 DIVISION OF MINES AND GEOLOGY SP104
5. Telephone communications cannot be relied upon for several
days following a large earthquake. A pre-arranged general response
plan must be followed. Routine communications with a centralized
headquarters and clearinghouse are possible only after several days.
Pay telephones may be used during daytime operations where avail-
able and functional in the epicentral area, but most calls should be
made and received late at night or early in the morning. Cellular
phones, where available, are very useful. Daytime telephone com-
munications are readily made (without repetitive dialing) by the
second week following the main shock.
6. The voice-mail system and personal home telephone recorders
are useful communications devices for late-night and early morning
messages during the first week ofemergency response activities. In
the future, it may be desirable to carry telephone recorders into the
field for use in motel rooms and so gain the advantage of receiving
out-going messages from a centralized headquarters.
7. Facsimile machines (fax) are used to great advantage during
the earthquake response. There is lasting value to a typewritten field
memorandum; it does not get garbled as a third-hand transcribed
telephone message.
8. A computer bulletin board is useful for both internal commu-nications and for disseminating public information. It may be more
widely utilized in future years, as more persons become familiar with
bulletin board systems and as more persons acquire computers
equipped with modems.
9. Radio communications between geologists in Santa Cruz
County were efficiently carried out using hand-held FM radios
loaned by the County. It is an advantage to be on the same radio
network as local county officials for coordination of communica-
tions.
10. Emergency response plans need to recognize that vehicle con-
gestion is a very real delay in effective geologic field work. In order
to perform their duties, it was necessary for DMG geologists to
obtain passage through police roadblocks. Only OES-issued disaster
worker ID cards were uniformly effective in gaining access through
the blockades. Official logos on hats and vehicle doors, red safety
vests, and Diamond-E state vehicle license plates were generally
helpful.
1 1. Portable computers can be used effectively in the clearing-
house by field geologists. Field geologists can return each evening
and enter new field site descriptions directly onto the computer; these
are keyed to numbered site locations marked on a wall map com-
posed of 7.5-minute topographic maps. Computerized data files maybe sent via modem between the clearinghouse and other emergency
offices.
12. A hand-held video camera is a useful method to record field
notes and ephemeral data. Videotapes can be edited later for manydiverse purposes, such as: (1) technical briefings for internal
management; (2) news media and documentaries; (3) professional
meetings and conferences; and (4) academic instructional uses.
13. Public schools within the epicentral area serve as important
disaster recovery centers for local residents, families, and hundreds
of school-aged children. The Red Cross and county government
officials set up assistance centers at public schools. County super-
visors may give evening townhall briefings to concerned local
residents. These public schools would be useful places to display
geologic maps and daily earthquake data to keep local residents
informed in a timely manner.
14. Newly developed aftershock probabilities by Reasenberg and
Jones of the USGS provided a useful quantitative method to answer
questions from anxious homeowners in the epicentral area. For
example, statements could be made that there was a certain percent
chance of an aftershock of a given size or larger during the next week
or other time period.
15. Rapid deployment of U-2 reconnaissance aircraft by the U.S.
Air Force generated aerial photographs in a timely way which
assisted in evaluation of some structural damage, landslides, lique-
faction, and other types of ground failure. The high-resolution aerial
photographs are systematic and reliable. However, many geologic
features concealed by dense vegetation cannot be identified from the
photographs and need to be field checked.
16. Geologists prefer to work on topographic maps and geologic
maps in the epiecentral area. Enough complete sets of such maps
at 7.5-minute quadrangle scale should be provided for a dozen
geologists to work in the field simultaneously. Photocopied portions
of such maps may be temporarily expedient, but these generally have
poorer resolution and introduce some distortion.
17. Assistance requests from homeowners to county officials were
relayed to DMG geologists in the field. Many of these requests
included a street address in a rural area; however, most topographic
maps do not show complete street names. Published street atlases
are therefore needed for all counties in the epicentral area.
In summary, the most important problems for DMG were: 1) the
abundance of ground failures in the epicentral area; 2) deployment
of appropriate staff; 3) communications at many different levels; 4)
logistics in the epicentral area; and 5) availability of maps and other
general information publications. These elements are likely to
present problems following future large earthquakes as well. The
relative severities of the different types of problems, however, are
likely to vary depending on such factors as the location, magnitude,
and time of day of the earthquake.

SUMMARY OF DAMAGE AND LOSSES
CAUSED BY
THE LOMA PRIETA EARTHQUAKE
by
Stephen R. McNutt 1
INTRODUCTION
The Loma Prieta earthquake of 1 7 October 1 989 has been called the
most expensive earthquake and one of the most expensive natural
disasters in United States history. It is certainly the most significant
earthquake to affect California since the 1971 San Fernando event,
; and is probably second only to the 1906 San Francisco earthquake in
its overall impact. When reviewing the information presented in this
paper, however, it is important to keep in mind that the earthquake
occurred in a sparsely populated area. If a magnitude 7.1 earthquake
, had occurred near San Francisco or Oakland, the losses would have
been considerably higher.
The purpose of this article is to systematically evaluate the damage
and losses caused by the earthquake, and to compare the event to other
destructive California earthquakes. The article does not fully consider
the human impact, such as emotional or mental health issues. Most of
the data were drawn from published sources, many of which included
only preliminary data. The order of presentation of topics was chosen
to match that of the Hayward Fault Scenario (Steinbrugge and others,
1987), with several additions. A map of the 10 affected counties is
shown as Figure 1 . For further information on specific topics, please
see the References section at the end of the article.
SOCIAL DISRUPTION AND LOSSES
Deaths and Injuries
The official death toll from the Loma Prieta earthquake is 63, with
3,757 injuries reported as of April 12, 1990 (OES, written communi-
cation, 1990). Hospitalization was required for 368 persons (Ameri-
can Red Cross, written communication, 1990). Several estimates of
the death toll were as high as 65 or 67. Some uncertainty was caused
by deaths resulting from injuries that may not have been caused by the
earthquake and by whether or not to include a person killed while
attempting to direct automobile traffic just after the earthquake (E.
Bortugno, personal communication, 1990).
The majority of deaths (42) occurred at the Cypress Structure
(Interstate 880) in Oakland. Aside from this single structure, the
deaths and injuries were fairly widely distributed (Table 1). Most of
the deaths occurred at the time of the earthquake. However, two
persons died much later: Mr. Buck Helm was rescued from the
Cypress structure four days after the earthquake but died from com-
plications to his injuries about three weeks later; the second person
suffered injuries in San Francisco from the earthquake and died in
April 1990.
Homeless
At least 1 2,000 people were rendered homeless by the earthquake
(OES, written communication, 1990). An incomplete listing by
county is shown in Table 1 . It is also known that a disproportionately
high percentage of low-income housing was lost in Santa Cruz, San
Francisco, and Oakland (BAREPP, 1990).
On a temporary basis, many thousands of people were cared for by
the American Red Cross and other organizations. The Red Cross
alone enlisted the aid of 7,842 paid and volunteer workers and esti-
mated that it served over 640,000 meals ( American Red Cross, written
communication, 1990).
Fires
A number of fires were caused by the earthquake. In San Francisco
there were 27 structural fires, including the major fire in the Marina
District, and there were also more than 500 responses to incidents
(EQE, 1989; EERI, 1989). There was one structural fire in Berkeley
but none in Oakland (EQE, 1989; EERI, 1989). About two dozen
residential fires occurred in Santa Cruz County (Dames and Moore,
1989), and six occurred in Watsonville (G. Smith, personal commu-
nication, 1 990). Overall, there were relatively few fires, thanks in part
to the fact that there was very little wind at the time of the earthquake
(EERI, 1989).
'California Department of Conservation. Division of Mines and Geology, Geologic Hazards Assessment Program
131

132 DIVISION OF MINES AND GEOLOGY SP104
I 20°
V US"
VE RNARDI N0
\*)
E R S I D E
SCALE IN KILOMETERS p E R | A L *-- .,
Figure 1 . Index map showing California counties. The ten counties that suffered damage during the Loma Prieta earthquake are outlined by a bold line
Details of the damage are given in Table 1 . Circles with radii of 100 and 200 km are drawn for reference.

1990 THE LOMA PRIETA EARTHQUAKE OF 17 OCTOBER 1989 133
BUILDINGS
Residential Damage
In total, 23,408 private homes were damaged and 1,018 private
homes were destroyed (OES, written communication, 1990). The
breakdown by county is shown in Table 1 . Santa Cruz was the hardest
hit county and had both the highest number of homes damaged or
destroyed and the highest percentage of damage relative to the
population . Assuming an occupancy of 3.5 persons per private home
(J. Ryan, personal communication, 1990), at least 85,000 persons
were adversely affected by earthquake damage to their homes.
Business Damage
In total, 3,530 businesses were damaged and 366 businesses were
destroyed (OES, written communication, 1990). Table 1 shows the
breakdown by county. The county that suffered both the highest
number and the highest percentage of businesses damaged or de-
stroyed was Santa Cruz County. Because the number of workers per
business varies so greatly, no attempt was made to estimate the
number of persons adversely affected by earthquake damage to their
places of employment. Additionally, many people who had formerly
been served by those businesses were adversely affected.
Hospitals
Engineered hospital buildings throughout the region performed
well during the earthquake. Many suffered minor system damage,
temporary losses of power and elevator stoppage, and cosmetic
damage. However, there were no operational interruptions, and all
facilities continued services throughout the emergency (EERI, 1 989).
Public Schools
A preliminary survey of 1,544 public schools in the impacted area
showed an estimated $81 million in damage (EERI, 1989). Severe
damage occurred in eight schools (FEMA, 1 989) in Watsonville, Los
Gatos, and San Francisco. Eight others suffered damage substantial
enough for them to be closed for more than two days. Other schools
suffered only minor damage.
The California Community Colleges suffered an estimated $21
million in damage; the California State University system suffered
$18 million in damage; and the University of California system
suffered $33 million in damage (FEMA, 1989).
TRANSPORTATION LIFELINES
Highways and Bridges
Of the 1 ,500 highway bridges in the affected area, three had one or
more spans collapse (EERI, 1989). These were Interstate 880 (Cy-
press Structure, Oakland), Interstate 80 (San Francisco-Oakland Bay
Bridge), and Highway 1 (at Struve Slough, near Watsonville). Ten
bridges were closed due to structural damage, including Highway 480
(the Embarcadero Freeway, San Francisco) and a portion of Interstate
280 in San Francisco. Ten other bridges required shoring in order to
be used, and 73 other bridges had various types of less severe damage
(EERI, 1989).
In addition to the structural damage, extensive liquefaction oc-
curred at the toll area (east end) of the San Francisco-Oakland Bay
Bridge. This damage alone would probably have caused closure of the
bridge for several days had the fallen span not already caused the
bridge to be closed (J. Hindmarsh, personal communication, 1990).
Two lanes of Highway 1 7 between San Jose and Santa Cruz were
blocked by a landslide, resulting in closure of the road for 33 days in
order to clear the debris. Portions of Highway 25, Highway 1 52, and
Highway 1 29 were also closed. Many other roads suffered cracks that
were for the most part filled in within a few days of the earthquake.
These bridge and highway closures caused substantial disruption to
local transportation. Highway 1 7 normally handled 60,000 vehicles
per day; there was no convenient alternative route. The Bay Bridge,
which was closed for one month (it re-opened on 17 November
1989), normally handled an estimated 250,000 vehicles per day.
Alternative routes took about an hour longer to traverse. The Cypress
Structure normally handled about 170,000 vehicles per day, and the
Embarcadero handled about 60,000 vehicles per day (Dames and
Moore, 1989). Nearby surface streets handled much of the excess load
created by these closures, as did Bay Area Rapid Transit (BART).
Airports
Damage to airports in the Bay area was moderate. There was both
structural and non-structural damage at San Francisco International
Airport, requiring it to be closed for 12 hours for repairs and inspec-
tions. At Oakland International Airport one building sufferered struc-
tural damage, and liquefaction caused extensive cracking, as well as
settling of the northern 3,000 feet of the 10,000-foot main runway.
The runway remained in service except for very large aircraft that
required extended runway length (Dames and Moore, 1989). The
nearby Alameda Naval Air Station also suffered runway damage
caused by liquefaction (FEMA, 1989).
Bay Area Rapid Transit (BART)
BART's 75 miles of rail lines were virtually undamaged by the
earthquake, and service was uninterrupted except for a short-duration
inspection period immediately after the event. BART's ridership
increased from 218,000 passengers per day before the earthquake to
308,000 passengers per day after the earthquake (Dames and Moore,
1989).
Railroads
Rail transportation was generally slowed for several days while rail
lines were inspected. The railroad suffered substantial damage in the
vicinity of Watsonville where the tracks subsided and a bridge was
damaged (FEMA, 1989). Damage to the Caltrain trackbed, which
runs along the San Francisco Peninsula, temporarily disrupted serv-
ice between San Francisco and San Jose (EERI, 1989). Such damage
was mainly caused by local ground failure.
Marine Facilities (Ports)
Port facilities in Oakland and San Francisco were damaged. The
Port of Oakland suffered considerable damage from settlement of
uncompacted hydraulic fill (Dames and Moore, 1989). Of the 10
terminals and 26 cranes in operation, there was a loss of use of three
large cranes (EERI, 1989) and about 30 percent of the terminal area
(EQE, 1989). In San Francisco, Pier 45 had structural damage and
was closed for repairs (EQE, 1989), and slight ground subsidence and
cracking was observed at Pier 80 (Dames and Moore, 1989).
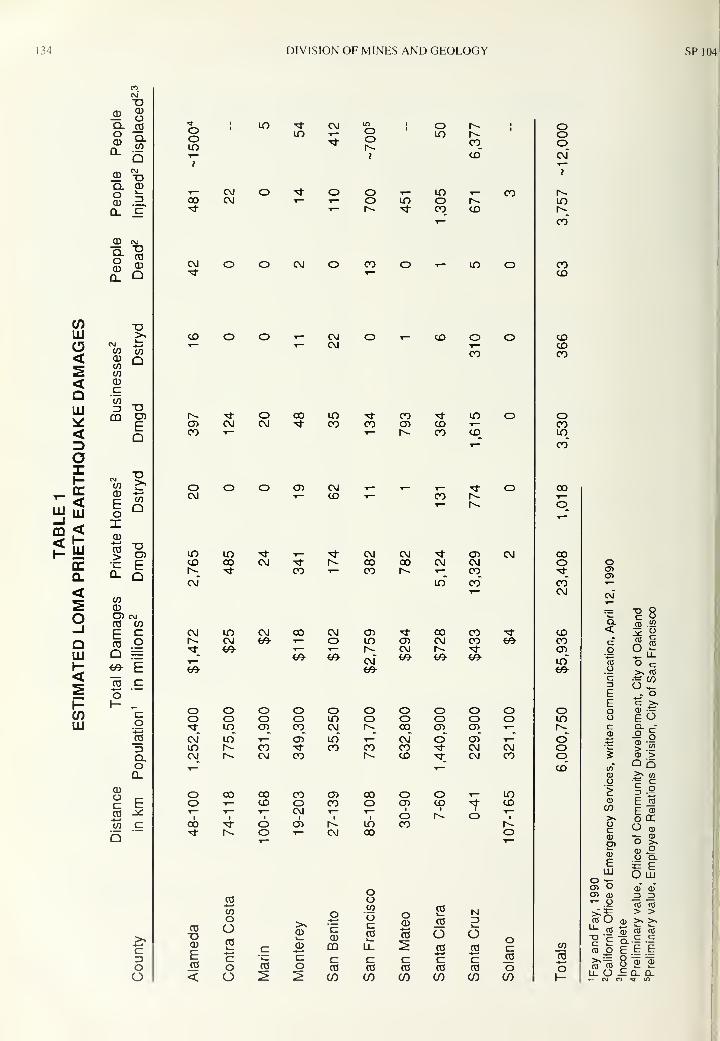
134 DIVISION OF MINES AND GEOLOGY
T3CD CD
OQ. COOCD
Q_
Q.CO
bO CMDQ. CDOCDQ. 'c
CD CM
Q.OCD
Q_
COCD
Q
CO TJLU >N
O COCO CO< CD Q
2 COCO
<a
CD
CO
uj 3 "OCD
E< Q^oX
CMCOCD
T3
,_ cc i_
uj 2 EO
CO
Q-1 ^CD < X
CD
CO>D
cc *1_ ECL Q_ Q<2 CO
CD
o COCMCO—
1
E co CO oLU Q =1- t^ E<2 o
c
H h- ,_
co cLU
<D
o"ca
ZJQ.OQ_
OE
cd x.
CO
coO
ooin
00
CM
CD
CM
5
CMCM
O CM O
OOI
s-I
oor-
CO
o Is-r-cqCD
inIO T-o r-CO CD
t- in
CO
o T- CMeg
o r- CD oCO
o
r- rj- o CO m -3- CO tj- inOi CM cm "* CO co CD CD t—CO v— 1—
I
s- CO CD
oCM
o> CMCD CO
^1"
Is-r-
inCOr-
inCO CM
co
T*Is-
CM00CO
CM00Is-
CMenCMCO
cm" in co"
CM
CM in CM 00 CM CD Ti- 00 CO TfIs- CM e^ 1
—
O in en CM CO <fr^ <& 1— I— r*. CM I
s- •>?
5*#* <&
cm"<y> &> <y>
o o o o o o o O o oo o o o in o o O o o-3- io o> CO CM r- CO CD O) 1—
cm" m" -T-" CT>" in",—
"
cm" o" cd" T-"m Is- CO «* CO CO CO Tt- CM CM
CM Is-. CM CO r- CD Tfr CM co
*~ "r~
o CO 00 CO cd 00 O o .,_ mo •t— CD o CO o O) CD Tj" CD*7 *7 *7 CM
1 i 1 o 1
Is-
1o I
00 -<t o CD r- in CO r--<t I
s- o 1— CM CO o
CT3
CD
ECO
oCO oCOooCO
C
>>CD
CD
ocCDCD
CO
oc
oCD
03
2
03
03
oco
NZ)
oco
oc
•*—
i
-*—
*
03c "C C c c £= c co 03 o cc CO 03 03 03 oo ^ ^ co CO CO CO CO CO
ooocm"
Is-inIs-co"
coCD
CDCDCO
oCOin
co"
CO
o
00oco"CM
CDCOo>in"
omIs-o"oocd"
V)
£o
oen
CM
Q.<coroo'c3EEoocCD
XI O
co .<H
O 2
O c>N CO
gco^_r °c >-
ISo£%:*0) >
>- co
•^ c— c
CD
CO>»OcCOO)
CO
EHI
"Sen Oen co*~ 9
co O co" « o1 Eg.ro o E>,= oro co ou.O£r- CM W
OE ]S
E co
o OCO co*. COo >,CO °O CL
s EO LU
co" co"
_2 ^ro ro> >>. >.
ro roc c
J I"co "S
CU CL

1990 THE LOMA PRIETA EARTHQUAKE OF 17 OCTOBER 1989 135
UTILITY LIFELINES
ICommunications
Damage to telephone facilities (primarily Pacific Bell) was minor
and did not affect service (EERI, 1989). Some long distance calls
from area codes other than 4 1 5 or 408 were blocked by long distance
( load control as a means of increasing the availability of local area
I service. As in many other earthquakes, the increase in telephone
|traffic in the days immediately following the earthquake overloaded
'. the system, resulting in a delay in obtaining a dial tone. Cellular
phones worked well in most, but not all, areas throughout the event.
Loss of electric power caused several types of communication
problems. Some private branch exchanges (PBX) would not operate,
I and backup power was not fully adequate at some telephone company
I facilities (EERI, 1989). Several radio stations and newspapers lost
I. power and could not carry out their normal communications func-
I; tions. Finally, several radio transmission towers were damaged (e.g.,
1 station KGO).
Electric Power
Approximately 1 .4 million customers suffered interruption of their
I electrical service as a result of the earthquake. Within 48 hours,
service had been restored to all but 26,000 customers. Parts of
|Watsonville, however, were without electricity for 4 to 5 days (EERI,
I 1989).
Pacific Gas and Electric (PG&E) reported that two power plants
I were damaged, at Moss Landing and Hunter's Point, and three
I substations were also damaged, at San Mateo, Metcalf, and Moss
I Landing (Dames and Moore, 1989).
for several hours. Damage to pipes or facilities occurred in San
Francisco and Oakland (Dames and Moore, 1989), the city ol Santa
Cruz and Santa Clara County (EERI, 1 989), and in the epiccntral area.
Raw sewage overflows caused by power failures occurred in Mon-
terey Bay (FEMA, 1989), the city of San Francisco, and at the East
Bay Municipal Utilities District water treatment plant in Oakland
(Dames and Moore, 1989).
Natural Gas Facilities
Of the total 3.2 million PG&E customers in northern and central
California, about 1 50,000 suffered interruption of normal gas service,
of which about 90 percent were customer initiated (Dames and
Moore, 1989). In the Marina District of San Francisco, 5,100
customers lost service. The entire system there had to be replaced at
a cost of $20 million and 2 months of time. There were approximately
400 other gas line breaks throughout San Francisco; and damage to
gas lines was also reported in Los Gatos, Watsonville, Hollister,
Richmond, Santa Cruz, San Jose, Oakland, and Alameda (Dames and
Moore, 1989). Gas line damage mostly occurred in areas of strong
shaking or where ground failure occurred.
Storage Tanks
Some damage to pipes and storage tanks occurred at two major oil
terminals in Richmond. Most of the damaged tanks were unanchored
with floating roofs and were either full or close to full at the time of
the earthquake (Dames and Moore, 1989). Leaks were apparently
minor and were locally contained.
Many other tanks used for storing water, beverages, and wine also
suffered damage throughout the epicentral area (EQE, 1989).
Water Supply
Water mains suffered breaks and leaks throughout the damaged
area. Specific data were available from the San Francisco Water
Department, the East Bay Municipal Utilities District, and the San
Jose Water Company. In San Francisco there were 70 water main
breaks and 50 service line breaks in the Marina District alone and 35
water main breaks throughout the rest of the city ( Dames and Moore,
1989). There were over 200 water main breaks in the East Bay
(FEMA, 1989), more than 100 in Hollister, more than 60 in SantaCruz
(EERI, 1989), and 155 in San Jose (Dames and Moore, 1989). In
addition, the Santa Clara Water District experienced major disrup-
tions (Dames and Moore, 1989). Ground failure, particularly lique-
faction, played a large role in causing damage to water mains.
About a dozen dams were located within the epicentral area, and
based on preliminary information, minor damage in the form of
settlement, cracks, or small landslides occurred at six of them and
moderate damage occurred at one (the Austrian Dam suffered $3
million in damage) (D. Babbitt, personal communication, 1990;
Dames and Moore, 1989). Fortunately, the water level was low,
between 10 and 50 percent of capacity, at the time of the earthquake.
Waste Water
Waste water systems were affected by direct damage to pipes and
facilities and by indirect problems caused by the loss of electric power
ECONOMIC LOSSES
Direct Losses
Estimates of direct losses from the Loma Prieta earthquake are
$4 billion in private property damage, $1.8 billion in public property
damage, and $0.1 billion undetermined for a total of $5.9 billion
(OES, written communication, 1 990). These estimates include losses
to both buildings and their contents.
For comparison, the Gross State Product (GSP) for California for
1989 was estimated to be $682 billion (computed by correcting the
1 986 value of Fay and Fay ( 1 990) by 8.5 percent per year, w hich is the
average growth of the previous six years). The population affected by
the Loma Prieta earthquake is 6,000,750 (Table 1 ), which is about 21
percent of California's total 1989 population of 28.662.000 (Fay and
Fay, 1990). Assuming that the GSP is uniformly distributed through-
out the state, the portion attributable to the Bay area is 21 percent of
$682 billion or $ 143 billion. Thus, the earthquake direct losses of $5.9
billion represent about 0.9 percent of the entire 1989 GSP, but about
4.1 percent of the Bay area portion of the GSP. This provides some
perspective on the economic scale of the disaster; the effect was
similar to shutting down the Bay area economy for 1 1 days (assuming
260 workdays per year).

136 DIVISION OF MINES AND GEOLOGY SP104
The above estimates do not include functional losses associated
with the earthquake. These indirect losses include lost work time,
transportation disruption, and emotional impacts such as loss of
concentration. No exact figures are yet available, but because of the
large number of people involved, the total indirect losses may be sub-
stantial.
Requests for Assistance
As of 21 February 1990, 36,096 applications had been received
under the Temporary Housing Program, of which 12,463 were ap-
proved. In addition, there were 22,358 applications for the Small
Business Administration Loans Program, 34,487 for the Individual
and Family Grants Program, 1,632 for the Disaster Unemployment
Program, and 241 applications for other programs. A total of 78,680
registrations were processed, and 97,918 hotline calls were received
(OES, written communication, 1990).
Legislation and Taxes
As of 15 March 1990, 185 pieces of legislation pertaining to
earthquake-related issues have been presented in the California
State Legislature. One dozen pieces of Federal legislation have also
been introduced. A special State emergency session was convened
November 2-4, 1989, soon after the earthquake. To raise money for
earthquake relief efforts, a special sales tax of 1/4 percent was added
for the time period 1 December 1 989 to 3 1 December 1 990. This tax
alone was expected to raise about $800 million (CSAC, 1990).
A report on unmet needs (CSAC, 1 990) estimated that $2.9 billion
in additional State and federal assistance was needed to help the ten
affected counties (Table 1) recover from the earthquake. Approxi-
mately $2.3 billion were identified for hazard mitigation projects,
with the remainder earmarked for replacement housing, temporary
shelter, and loans for working capital (CSAC, 1990).
DISCUSSION
Other California Earthquakes
Other California earthquakes that have resulted in significant
damage are shown in Table 2. Since 1812, there have been 25
earthquakes that resulted in loss of life. The Loma Prieta event is the
fourth worst earthquake in California's history in terms of lives lost.
It is easily the most costly event in terms of dollar loss, although the
1906 San Francisco earthquake would cost over $20 billion in
today's dollars (Plafker and Galloway, 1989).
Worldwide Disasters
In a recent study, Housner (1989) noted that in the last 20 years
natural disasters of all types accounted for the loss of 2.8 million
lives, adverse effects to 820 million people, and economic losses of
as much as $ 1 00 billion. Compared to these values, it is apparent that
the Loma Prieta earthquake had a relatively small number of lives
lost but a very high economic cost. A large part of the reason for this
is that the United States is a wealthy country. It is likely that most
natural disasters in the United States will yield high economic costs
relative to deaths and injuries.
Unusual Features of Loma Prieta
Several features of the damage distribution of the Loma Prieta
earthquake are noteworthy. First, the earthquake epicenter occurred
in one of the most sparsely populated parts of a region adjacent to
urban areas. Given the high damage levels in the epicentral region,
the Santa Cruz Mountains region was about the best place for the .
event to occur in terms of minimizing losses. Second, less than 1
percent of the developed property in the affected region suffered
damage, attributable in large part to the high quality of construction
and to the adherence to strict building codes. Third, while a high
:
percentage of damage occurred near the epicenter, much significant
damage also occurred far from the epicenter. This fact reflected the
importance of site conditions or local geology as well as the vulnera-
bility of certain classes of structures. Fourth, the total number of
deaths and injuries was relatively small for an event of this size near
an urban area, and the ratio of deaths to injuries was very small. This
reflects the fact that while many structures were severely damaged,
only a small number completely collapsed. Finally, although direct <
damage losses were estimated at $5.9 billion, it is likely that the total
losses will exceed this value when all the indirect costs are included. ;

1 990 THE LOMA PRIETA EARTHQUAKE OF 17 OCTOBER 19KM 137
TABLE 2
DESTRUCTIVE CALIFORNIA EARTHQUAKES, 1812-1990
Lives Dollar losses
Year Location Magnitude Lost in thousands 1 References
1812 San Juan Capistrano (?) -7 40 __ Sherburne, 1981
1857 Fort Tejon ~8 1- "
1865 Santa Cruz Mountains -6.6 -- $500 Sherburne, 1981 ; Coffman, 1969
1868 Hayward ~7 30 $350 ii
1872 Owens Valley ~8 27 $250"
1892 Vacaville-Winters 6.7 1 $225n
1898 Mare Island 6.5 - $1 ,400"
1899 San Jacinto 6.9 6 - " "
1906 San Francisco 8.3 >3,000 >$500,000 Hansen & Condon, 1989
1915 Imperial Valley 6.3 6 $900 Sherburne, 1981; Coffman, 1969
1918 San Jacinto and Hemet 6.8 1 $200
1925 Santa Barbara 6.3 13 $8,000
1926 Santa Barbara 5.5 1--
1932 Humboldt Co. (offshore) 6.4 1--
1933 Long Beach 6.3 115 $40,000
1940 Imperial Valley 7.1 9 $6,000
1941 Santa Barbara 5.9 -- $100
1941 Torrance-Gardena 5.4 - $1,000
1949 Terminal Island2 3.7 - $9,000
1951 Terminal Island23.1 -- $3,000
1952 Kern County 7.7 14 $60,000
1954 Eureka-Areata 6.5 1 $2,100
1955 Terminal Island2 3.3 -- $3,000
1955 Oakland-Walnut Creek 5.4 1 $1,000
1957 San Francisco 5.3 1 $1,000
1961 Terminal Island2? -- $4,500
1969 Santa Rosa 5.6 1 $8,350
1971 San Fernando 6.4 65 $504,950
1975 Oroville 5.7 -- $2,500
1978 Santa Barbara 5.1 -- $12,000
1979 Imperial Valley 6.6 - $30,000
1980 Livermore Valley 5.5 1 $11,500 Sherburne, 1981; OES, 1990
1980 Mammoth Lakes 6.2 -- $2,000M ii
1980 Northern California 6.9 -- $1,750•I ii
1983 Coalinga 6.5 - $31,000 Bennett and Sherburne, 1983
1984 Morgan Hill 6.2 - $10,000 Bennett and Sherburne, 1984; OES, 1990
1986 Palm Springs 5.6 - $5,300 OES, 1990
1986 Oceanside 5.3 1 $720"
1986 Chalfant Valley 6.4 - $437"
1987 Whittier Narrows 5.9 8 $358,000"
1987 Superstition Hills 6.6 - $2,700"
1989 Lake Elsman 5.2 1- Sacramento Bee, 1989
1989 Loma Prieta 7.1 63 $5,936,000 OES, written comm.,1990
1990 Upland 5.5 -- $10,400 OES, 1990
1 At the time of the earthquake2Oil wells only

138 DIVISION OF MINES AND GEOLOGY SP 104
REFERENCES
BAREPP (Bay Area Regional Earthquake Preparedness Project), 1990, The
once and future quake, all about Loma Prieta: Networks, Earthquake
Preparedness News, v. 5, no. 1, 28 p.
Bennett, J.H., and Sherburne, R.W., eds., 1983, The 1983 Coalinga,
California Earthquakes: California Division of Mines and Geology Special
Publication 66, 335 p.
Bennett, J.H., and Sherburne, R.W., eds., 1984, The 1984 Morgan Hill,
California Earthquake: California Division of Mines and Geology Special
Publication 68. 271 p.
Cotfman, J. L, 1969, Earthquake investigation in the United States: Coast and
Geodetic Survey Special Publication 282, Revised Edition, U. S. Govt.
Printing Office, Washington, D. C, 58p.
CSAC (County Supervisors Association of California), 1990, Loma Prieta
earthquake unmet needs action plan: CSAC Earthquake Relief Legislative
Task Force, Supervisor Fred Keeley, Chair, Sacramento, California, 181 p.
Dames and Moore, 1989, A special report on the October 17, 1989 Loma
Prieta earthquake: Dames and Moore, Los Angeles, California, 30 p.
EERI (Earthquake Engineering Research Institute), 1989, Loma Prieta
earthquake October 17, 1989: Preliminary reconnaissance report: El
Cerrito, California, Report 89-03, 51 p.
EQE, 1989, The October 17, 1989 Loma Prieta earthquake, A quick look
report: EQE Engineering, San Francisco, California, 40 p.
Fay, J.S., and Fay, S.W., eds., 1990, California Almanac, 4th edition: Pacific
Data Resources, Santa Barbara, California, 610 p.
FEMA (Federal Emergency Management Agency), 1989, State and Federal
hazard mitigation team report for the October 17, 1989 Loma Prieta
earthquake, California: Report FEMA-845-DR-CA, 1 12 p.
Hansen, G., and Condon, E., 1989, Denial of disaster: the untold story and
photographs of the San Francisco earthquake and fire of 1906: Cameron
and Company, San Francisco, California, 160 p.
Housner, G.W., 1989, An international decade of natural disaster reduction:
1990-2000: Natural Hazards, v. 2, no. 1, p. 45-75
OES (California Office of Emergency Services), 1990, Significant California
Earthquakes: OES Information and Public Affairs Office, Sacramento,
California, 2 p.
Plafker, G., and Galloway, J. P., 1989, Lessons learned from the Loma Prieta,
California, earthquake of October 17, 1989: U.S. Geological Survey
Circular 1045,48 p.
Sacramento Bee, 1989, 5.2 quake gives Bay Area shudder: The Sacramento
Bee, Sacramento, California, August 9, 1989, p. A-1, A-21.
Sherburne, R.W., 1981, Seismology Program: California Geology, v. 34, no. 1,
p. 3-6.
Steinbrugge, K.V., Bennett, J.H., Lagorio, H.J., Davis, J.F., Borchardt, G., and
Toppozada, T.R., 1 987, Earthquake planning scenario for a magnitude 7.5
earthquake on the Hayward Fault in the San Francisco Bay area,
California Department of Conservation, Division of Mines and Geology
Special Publication 78, 245 p.
ACNOWLEDGMENTSI thank Jane Hindmarsh of OES and Tousson Toppozada of DMG for
reviewing this manuscript. Jeff Ryan of Farmers Insurance Company, Carol
Biancalana of the California Department of Conservation, Don Babbitt of the
California Department of Water Resources, Virginia Bowser of the American
Red Cross, and Jim Williams of Northern California Cardiologists Associates
provided helpful information.
LOMA PRIETA AND EARTHQUAKE PREPAREDNESS
Modified from Testimony to the
House of Representatives
Committee on Science, Space and Technology
by
Richard A. Andrews 1
INTRODUCTION
The Loma Prieta earthquake of 17 October 1989 provided a dra-
matic test of the level of California's preparedness for a large-
magnitude earthquake in a metropolitan area. Because ofCalifornia's
long-standing involvement with the National Earthquake Hazards
Reduction Program (NEHRP), Loma Prieta was an occasion to
measure aspects of NEHRP. On balance, the emergency response to
this 7.1 magnitude earthquake was remarkably effective at every
level, particularly within the counties and cities of the affected areas.
Residents overwhelmingly did the right things. Cooperative efforts
spontaneously broke out where immediate life-threatening emergen-
cies existed. At the Cypress Structure, the Marina, downtown Santa
Cruz, Candlestick Park, Watsonville, Hollister, and on the Bay
Bridge, first responders were often individuals who happened to be at
places where damage occurred. Fire and police worked alongside
citizen volunteers in the first hours.
There is much to be proud of in what has been accomplished in
California since the issuance of the 1981 report, "An Assessment of
the Consequences and Preparations for a Catastrophic California
Earthquake" (FEMA, 1981). Since 1981, there has been steady
progress in earthquake preparedness in California's cities and coun-
ties. The private sector has initiated many emergency preparedness
programs and established organizations to share emergency strate-
gies. The State has expanded its support for earthquake preparedness,
completed detailed response plans for northern and southern Califor-
nia, and conducted frequent drills. Federal agencies have a detailed
plan to support state and local resources at the time of a "catastrophic"
earthquake. The federal plan has been tested in a large-scale table-top
exercise with California on August 8, 1989 and again on October 17,
1989 after the earthquake.
Nevertheless, there are many lessons to be learned from this
earthquake, and areas where action is needed to enhance operational
capabilities, accelerate hazard reduction programs, and broaden public
preparedness.
The first section of this report focusses on developments in Califor-
nia. The second deals with federal programs and their interaction with
those of the State; the third part addresses priority needs.
EARTHQUAKE VULNERABILITIES:
AN EMERGENCY RESPONSEPERSPECTIVE
Loma Prieta was arguably the most significant California earth-
quake since the Long Beach temblor of 1933 because it provided a
real-life test of earthquake risk and programs that have been under-
taken to reduce California's vulnerabilities (all carried live before a
nationwide television audience).
With the notable exception of the damage to the Bay Bridge, the
Loma Prieta earthquake reaffirmed what had been learned in earlier
earthquakes. Older structures, particularly those built before 1950,
are vulnerable to severe damage or collapse. The collapse of sections
of the Interstate 880 Freeway underscored the special danger posed by
nonductile, reinforced concrete structures built prior to the mid-
1970's. It is likely that this class of structures will pose the greatest
risk to life in future California earthquakes. In general, engineered
structures built according to codes in place since the mid-1970's
performed well.
While recognizing that it is likely that the State's metropolitan areas
will be shaken by even larger earthquakes within the next 30 years, the
Loma Prieta event suggests that structures built since the mid 1 970's,
including high-rises, freeway overpasses, many types of office build-
ings—including developments on marginal soils—may not fail cata-
strophically even in a large earthquake. Substantial damage or even
many serious injuries can occur from things inside the building; but
the type of life-threatening collapses seen in Mexico City, Armenia,
and at the Cypress Structure are not likely to occur in great numbers
in modem California structures.
Emergency planners look at earthquake risk somewhat differently
than engineers, building owners, or the insurance industry. Planners
are primarily interested in collapse potential, the likelihood that a
structure will fail in a catastrophic way. Evidence from Loma Prieta,
Mexico City, and earlier San Francisco suggests that fatalities tend to
be concentrated in structures that fail catastrophically rather than in
evenly distributed patterns of destruction.
In planning for emergency response in the areas of search, rescue,
medical, firefighting, and engineering operations, better data are
'Deputy Director, Governor's Office of Emergency Services. State of California
139

140 DIVISION OF MINES AND GEOLOGY SP104
needed on: ( 1 ) which types of structures have the greatest potential
to collapse, (2) how many people use them at what times of the day,
and (3) where are they concentrated. To date, little of this informa-
tion exists. Moreover there is no generally accepted definition of
what constitutes collapse potential.
Research that seeks to develop an acceptable method for estimat-
ing collapse potential and application of that technique to California
cities would be of great significance to our efforts to fine-tune our
response plans. This is particularly true in regional planning and in
determining how many trained heavy search and rescue teams are
needed.
Therefore, the highest priority research should be addressed to
rapidly developing the ability to reduce the risk to life in those
structures where there is consensus that there is significant potential
for life-threatening failure. Closely related to this is the need for
better data on earthquake injury epidemiology. How are people
injured in earthquakes; and how should they be treated, particularly
those who may be trapped in collapsed structures?
One fortuitous surprise on October 17 was the low number of life-
threatening toxic releases. Though no general estimates existed prior
to October 17, many emergency planners feared that toxic releases
in the Silicon Valley could be very serious. Additional work is
needed to understand in detail the concentrations of toxic materials
and to collect better data on techniques for safely storing hazardous
materials.
We should not feel overconfident in our ability to respond to an
even larger earthquake or suggest that with current systems all major
earthquakes in California can be managed effectively. Such notions
are tempered by the recognition that there is no certain knowledge
on how structures will perform when the epicenter is closer to more
heavily populated areas, the strong ground motion is of longer
duration, or the time of day is different.
EARTHQUAKE PREPAREDNESS IN
CALIFORNIA DURING THE 1980S
California accelerated its seismic safety programs in the early
1 980' s, largely as a result of the first credible scientific estimates of
the potentials for great earthquakes. The first actions in California's
recent preparedness efforts came in early 1981 with: ( l ) the creation
of the Southern California Earthquake Preparedness Project (SCEPP)
as a joint federal-state prototype effort, and (2) the establishment of
a Governor's task force on preparedness, bringing together a broad
spectrum of the state's private groups from industry, finance, and the
media to talk about the risk and to develop broad strategies.
These efforts have continued, in various forms, to the present time.
Governor Dcukmejian signed bills in 1983 and 1987 to continue
SCEPP and to establish a similar effort in northern California, the
Bay Area Regional Earthquake Preparedness Project (BAREPP). In
September of 1 989, GovernorDeukmejian signed legislation author-
izing a five-year extension of both projects through June 1995.
SCEPPand BAREPP work with local governments, industry, schools,
volunteer groups, and the public. The projects approach groups to
enlist their participation in earthquake preparedness; they do not
regulate planning. Instead, they provide technical assistance to local
governments like those in San Jose, San Francisco, Oakland, Los
Angeles City and County, San Bernardino, and Orange County in
developing comprehensive, multi-year programs to reduce risk and
enhance local preparedness.
The effectiveness of SCEPP and BAREPP is also based on the fact
that their work program results from decisions made within each
region through recommendations of a policy advisory board for each
project. These boards include local elected and appointed officials,
representatives of industry, schools, and volunteer groups, scientists,
and engineers. This local involvement is unique among prepared-
ness programs. It helps account for the broad support that BAREPPand SCEPP have enjoyed in each region.
Earthquake Planning Scenarios published by the California De-
partment of Conservation's Division of Mines and Geology (DMG)beginning in 1982 were used effectively by emergency planners in
developing the basic strategies for response at the local and state
levels. The scenarios provided a realistic portrait of the general level
and distribution of damage on October 17, 1989, although the sce-
narios were developed for other nearby fault segments.
Since January 1983 California has steadily increased its commit-
ment to earthquake preparedness. Governor Deukmejian has signed
over 25 earthquake-related measures, which include: ( 1 ) making the
Seismic Safety Commission a permanent state agency; (2) requiring
earthquake planning and drills in grades K-12 throughout the state;
(3) requiring all new essential services facilities to meet rigorous
seismic standards; (4) expanding the Strong Motion Instrumentation
Program; and, (5) participating in the Parkfield Earthquake Predic-i
tion Experiment.
Two additional laws enacted since 1983 are particularly signifi-
cant: (1) all local governments in UBC seismic zone 4 are required
to inventory their unreinforced masonry buildings and, before Janu-j
ary 1990, develop a strategy to reduce the identified hazard; and, (2)
the California Earthquake Hazards Reduction Program was createdj
to establish a goal for the State to "significantly reduce California's
earthquake risk" by the year 2000 through a series of five-year plansj
developed by the Seismic Safety Commission in cooperation with
other state and local agencies (SSC, 1986).
The Earthquake Task Force, established in 1 98 1 , continued through
1985. It developed many recommendations that influenced State
emergency response planning. More importantly, through the in-
volvement of private industry, an ongoing program of disaster pre-
paredness within business and industry in California was developed.
In both northern and southern California, business and industry pre-
paredness groups have been formed to provide a forum fordiscussingj
planning strategies, exchanging technical information, and conduct-
ing exercises.
The effectiveness of California's earthquake preparedness pro- ;
grams results from a comprehensive approach that addresses mitiga-
tion, response, and recovery strategies. The involvement of both
government and private industry has been crucial, and so has the em-
phasis on the need for preparedness actions by each resident, rein-
forced through countless community preparedness efforts, the State's
Annual Earthquake Preparedness Month, and publications such as
the DMG Earthquake Planning Scenarios.
In addition, it has been assumed that preparedness is not a static
process. Given the scale of the potential problems that we face in the
aftermath of a major earthquake, an incremental approach is neces-
sary in which basic themes are reiterated and encouragements to
preparedness are conveyed through many methods of communica-
tion.

1990 THE LOMA PRIETA EARTHQUAKE OF 17 OCTOBER 1989 141
While we believe the basic approach to preparedness is sound,
unquestionably the actual occurrence of earthquakes since 198 1 has
provided fundamental credibility to the effort. Since 1983, Califor-
nia has experienced eight damaging earthquakes. These events have
acted as a catalyst to preparedness efforts. Together with forecasts
for even larger temblors, these events stimulated the on-going in-
volvement by the print and electronic news media in the state in
support of governmental preparedness programs.
As we look to the future in California's earthquake programs, the
Seismic Safety Commission's California at Risk (SSC, 1986)
should serve as the basic guide to approach the programs that should
be undertaken.
The approach needs to be comprehensive. It should emphasize the
reduction of existing risk through aggressive mitigation programs
that target those areas of greatest life threat. It should pay careful
attention to insuring that soil conditions are taken into account in
future development. It should insure that building codes continue to
incorporate lessons learned from events like Loma Prieta.
We need to enhance our operational capabilities to carry out the
plans that have been developed by local and state government,
particularly immediately following even larger earthquakes. Special
attention should be paid to: ( 1 ) more detailed regional planning; (2)
modernizing communications systems; (3) construction of emer-
gency operations facilities; (4) information management systems;
(5) search and rescue capabilities and strategies; and (6) on-going
training for state and local governments, including large-scale drills
like those held in southern California in 1 987 and northern California
in 1989.
Public education and preparedness efforts should be broadened.
The annual Earthquake Preparedness month provides a focus for
these efforts, but strategies like those in Los Angeles County of em-
phasizing a preparedness action each month—strapping down water
heaters one month, stockpiling emergency medical supplies another
month—should be encouraged statewide.
Particularly in the areas of mitigation and enhancement of our
emergency response capabilities, we have addressed many of the
most inexpensive initiatives. Further progress will require a substan-
tial commitment of funds. Some programs, like the construction of
new emergency operations centers in southern and northern Califor-
nia or installation of an emergency communications system less
vulnerable to disruption during earthquakes, are essentially one-time
expenditures.
Other projects that address risks posed by existing structures
J
constructed to earlier standards will require commitment of signifi-
cant resources. Important policy decisions will have to be made
]regarding whether, in some instances, to invest in new construction
[or to strengthen existing structures.
As the 56-year history of the 1 933 Field Act or the 1 6-year history
of the 1973 Hospital Seismic Safety Act demonstrate, progress in
mitigation occurs over years and decades. Hazards will not be imme-
.diately eliminated. The essential step is the first one: commitment
to reduce the risk with a rational program based upon reasonable data
that sets forth a timetable for gradual risk reduction.
SEISMIC SAFETY IN CALIFORNIAAND ITS RELATIONSHIP WITH THENATIONAL EARTHQUAKE HAZARDSREDUCTION PROGRAM (NEHRP)
California has been an active participant in the National Earth-
quake Hazards Reduction Program since its inception in 1977.
Indeed much of the impetus to the establishment of NEHRP came as
a result of the perception of earthquake risk in California.
The national program has been of value to the State's earthquake
safety efforts in a number of ways. Support for scientific research
on earthquake probabilities has added greatly to the understanding
of California's seismic history and potential. Research that has iden-
tified recurrence intervals has, as noted, added the credibility essen-
tial to convince individual citizens, corporate leaders, and elected of-
ficials to support preparedness efforts.
Since 1985 California has worked with the USGS and with DMGin developing more effective ways to use scientific information in
forecasting short-term earthquake potential. The State is a full
partner in the Parkfield Earthquake Prediction Experiment in central
California. In cooperation with the USGS and DMG, the Office of
Emergency Services (OES) has developed detailed plans for how we
would respond to a short-term prediction of a moderate-sized earth-
quake along the Parkfield segment of the San Andreas fault in
southern Monterey County.
OES has also pioneered the use of scientific assessments of in-
creased probabilities along significant seismic gaps in the state. Im-
portantly, OES issued advisories to counties in the Bay Area follow-
ing the Lake Elsman and Lexington Reservoir earthquakes of June
1988 and August 1989. These events, which occurred near the
epicentral area of the Loma Prieta earthquake, appear to be preshocks
to the October 17 event. OES' advisories, developed through the
cooperative efforts of USGS and DMG scientists and the California
Earthquake Prediction Evaluation Council, represent the most sig-
nificant use of earthquake forecasting for public policy purposes
since the 1975 Haicheng prediction in the People's Republic of
China (Raleigh and others, 1977). (Evidence supports the view that
the issuance of these advisories helped stimulate preparedness ac-
tions among the local governments and citizens who performed so
effectively on October 17.)
The Federal Emergency Management Agency (FEMA) has been
an active participant in California's earthquake preparedness efforts
since 1981. NEHRP funds have provided almost 50 percent of the
total support for Southern California Earthquake Preparedness Project
(SCEPP) and Bay Area Regional Earthquake Preparedness Project
(BAREPP). FEMA has also funded portions of the State's Earth-
quake Preparedness Month activities, as well as special projects like
the development of the methodology and field guide used to conduct
post-earthquake safety inspections of buildings.
Although each federal agency invob ed in NEHRP has attempted
to focus research on application neeoN, greater attention is needed in
this area. All too often research is funded at levels disproportionate
to allocations for actual program implementation. For example, a
$100,000 federally funded research grant was used to asscs~> the
effectiveness of a $40,000 public information effort in the counties
that would be impacted by a short-term Parkfield earthquake predic-
142 DIVISION OF MINES AND GEOLOGY SP104
tion. Greater attention should be given to funding research that
addresses specific needs of local and state governments involved in
seismic safety programs rather than projects defined by the logic of
the various disciplines involved in hazards-related work.
Greater coordination is needed between the activities in FEMAthat fall under NEHRP and those that address federal response
planning and disaster recovery programs. These program ele-
ments are important parts of a comprehensive preparedness effort.
It can be confusing for state and local governments to work with
elements of the same agency that have little knowledge of what
other program offices are doing.
The Loma Prieta earthquake, like the Whittier-Narrows earth-
quake of 1 987, has highlighted issues related to disaster assistance
programs that need consideration. Contemporary demographics,
with multiple families living in residences in many communities,
may conflict with regulations governing assistance programs.
Damaging earthquakes near metropolitan areas disproportion-
ally affect the housing inventory for low and marginal income
levels. Some estimates are that between 40 and 70 percent of the
low-income housing was damaged or destroyed in Oakland, San
Francisco, Santa Cruz, and Watsonville.
Immediate attention is needed to develop strategies at the local,
State, and federal levels for both short- and long-term housing
needs that will exist on a broader scale after larger earthquakes
forecast for California. These strategies should involve FEMA,HUD, State, and local agencies who share responsibility for hous-
ing.
The Federal Catastrophic Earthquake Response Plan provides a
sound basis for making federal resources available to assist State
and local governments. Attention is needed to detail the opera-
tional procedures for specific functions. This is particularly true
regarding issues of incident management at the local level and how
federal resources will be integrated with those of State and local
governments.
It is important to keep in mind that quantity of resources is
almost never a problem during the emergency response. Rather,
the problem is the allocation of the right resource to the right
incident in a timely basis. Federal resources provide an essential
component of the nation's response capability, but care must be
taken not to overwhelm local and state management systems in an
effort to establish a federal presence.
Accelerated training programs are needed to further define the
procedures for application of federal resources. Ad hoc response
efforts, which are understandable given the scale of the emergen-
cies created by large-magnitude earthquakes, must be minimized.
It is our view that response strategies that assume a lead opera-
tional role for federal resources, including search and rescue, may
clash with the principle of local incident management that is one
of the essential strengths of California's emergency systems.
During the Loma Prieta earthquake there were examples of ad
hoc responses at the local, State, and federal levels. In almost
every instance these activities confused rather than enhanced
operational effectiveness. Only through on-going programs of
training and exercises like the August 19X9 federal-state exercise,
can a broader understanding be created of how the various re-
sponse systems are intended to work.
FUTURE PROGRAM NEEDS
The Loma Prieta earthquake demonstrated the usefulness of
forecasts of future seismic activity in California.
It is important to remember that the probability of one or more
magnitude 7.0 or greater earthquakes is believed to be highest in
southern California. In addition, we must take note of the fact that
an 1865 earthquake centered near the Loma Prieta event was
followed three years later by a comparable earthquake on the
Hayward fault.
This is emphasized because we cannot continue to view earth
quake preparedness in California as business as usual. Efforts
must be made to accelerate preparedness and critical mitigation
programs to enhance our readiness for even more damaging events
It is time to develop strategies to encourage mitigation actions by
local, State, and federal agencies. As a general principle, it is
probably more cost-effective to invest in mitigation and prepared
ness before an earthquake than to allocate billions of dollars after
a region has been devastated.
CONCLUSIONS
The response to the October 17 earthquake demonstrated that
progress can be made in preparing for large-magnitude earthquakes.
There remain, however, significant needs at the local, State, and
federal levels if we are to continue the advances of the last decade.
Larger earthquakes closer to heavily populated areas will pose even
more serious problems.
The needs are clear. Mitigation efforts must be accelerated.
Response capabilities must be enhanced. Public education programs
must be broadened, and assistance programs must be updated.
The challenge is to translate the interest in seismic safety shown
since 5:04 p.m. on October 1 7 into programs that can enhance public
safety before we experience the even larger earthquakes that are likely
to occur in California.
REFERENCESRaleigh, B. and others, 1977, Prediction of the Haicheng earthquake: EOS,
Transactions of The American Geophysical Union, v. 58, p. 236-272.
SSC (Seismic Safety Commission), 1986, California at Risk: Office of State
Printing, State of California, Sacramento, California, 92 p.
FEMA (Federal Emergency Management Agency) and the National Security
Council, 1981 , Assessment of the Consequences and Preparations for a
Catastrophic California Earthquake: Government Printing Office, United
States, Washington. DC.
89 79772


m~*.i. IS -
THIS BOOK IS DUE ON THE LAST DATE
\
THIS BOOK IS DUE ON THE LAST DATE
STAMPED BELOW
BOOKS REQUESTED BY ANOTHER BORROWER
ARE SUBJECT TO IMMEDIATE RECALL
£oq 3 1
>HYSICALSCS.UBRA
cD
LIBRARY, UNIVt
81234

U^UB^I^ft^MA^IB
J

THIS BOOK IS DUE ON THE LAST DATESTAMPED BELOW
BOOKS REQUESTED BY ANOTHER BORROWERARE SUBJECT TO IMMEDIATE RECALL
DEC 3 2007
DEC 6 2007
B& 7 2M7
PSL
LIBRARY, UNIVERSITY OF CALIFORNIA, DAVIS
D4613-1 (5/02)M
{

NIVI IV II r 111 ' Al II OMNIA 1JAVIUNIVl
3 1175 01971 6474