Time-evolving Relational Classification and Ensemble Methods
Upload
universityofarizonaCategory
view
2download
0
Dynamics of Mismatch Correction in the Hippocampal EnsembleCode for Space: Interaction between Path Integration andEnvironmental Cues
Katalin M. Gothard, William E. Skaggs, and Bruce L. McNaughton
Arizona Research Laboratories Division of Neural Systems, Memory and Aging, University of Arizona, Tucson,Arizona 85724
Populations of hippocampal neurons were recorded simulta-neously in rats shuttling on a track between a fixed reward siteat one end and a movable reward site, mounted in a sliding box,at the opposite end. While the rat ran toward the fixed site, thebox was moved. The rat returned to the box in its new position.On the initial part of all journeys, cells fired at fixed distancesfrom the origin, whereas on the final part, cells fired at fixeddistances from the destination. Thus, on outward journeys fromthe box, with the box behind the rat, the position representationmust have been updated by path integration. Farther along thejourney, the place field map became aligned on the basis ofexternal stimuli. The spatial representation was quantified interms of population vectors. During shortened journeys, thevector shifted from an alignment with the origin to an alignment
with the destination. The dynamics depended on the degree ofmismatch with respect to the full-length journey. For smallmismatches, the vector moved smoothly through interveningcoordinates until the mismatch was corrected. For large mis-matches, it jumped abruptly to the new coordinate. Thus, whenmismatches occur, path integration and external cues interactcompetitively to control place-cell firing.When the same box was used in a different environment, it
controlled the alignment of a different set of place cells. Thesedata suggest that although map alignment can be controlled bylandmarks, hippocampal neurons do not explicitly representobjects or events.Key words: population vector; cell ensemble; computation;
path integration; place cells; navigation
The rat hippocampus is crucial for spatial learning and navi-gation (O’Keefe and Nadel, 1978; Barnes, 1988; Jarrard, 1993).Although the location-specific firing of hippocampal place cellshas been amply documented (O’Keefe and Dostrovsky, 1971;Olton et al., 1978; Kubie and Ranck, 1983; McNaughton et al.,1983; Muller et al., 1987; Eichenbaum et al., 1989; Wiener etal., 1989; Jung and McNaughton, 1993; Wilson and McNaugh-ton, 1993), the factors that determine place-cell activity are notfully understood. According to the original formulation of thecognitive map hypothesis (O’Keefe and Nadel, 1978), “a placerepresentation can be activated in either of two ways: (1)externally, by the simultaneous occurrence of two or moresensory inputs with the appropriate spatial coordinates in ego-centric space; (2) internally, by an input from another placerepresentation coupled with a signal from the motor systemconcerning the magnitude and orientation of a movement” (seealso O’Keefe, 1976). Much subsequent work on the determi-nants of place fields has focused on the former of these twofactors, i.e., external sensory cues; however, the observationthat novel place fields can arise in darkness and persist aftersubsequent illumination (Quirk et al., 1990; Markus et al.,1994) indicate that location-specific firing, at least initially, can
be independent of external input. In addition, when the taskdemands are changed without altering the external cues, sub-stantial changes in place field distributions are induced(Markus et al., 1995). Furthermore, the observation that theentire place field distribution can rotate synchronously in thepresence of stable visual cues (Knierim et al., 1995) suggeststhat place cells may be driven by self-motion signals.Gothard et al. (1996) reported that in a landmark-based navi-
gation task, place fields were coupled to moving objects. Whenrats shuttled between a variably placed box and two variablyplaced landmarks inside a large arena, some cells fired in stablespatial relationships to the box, whereas others fired in relation tothe landmarks. These data suggested that behaviorally relevantobjects establish distinct spatial reference frames in which loca-tion is encoded. Because of limited sampling in the large arena,however, object-related firing could be demonstrated only forthose cells that fired in close proximity to the reference objects.Because the rats’ trajectories between the box and the landmarkswere highly variable, the extent to which the box or the otherlandmarks influenced cell activity along the journey could not beestablished.The present study was designed to elucidate how the origin and
destination of a journey control place fields along the route. Bysystematically varying the distance between the origin and thedestination of a journey, the influence of these cardinal pointscould be measured separately.A related objective was to establish whether cells bound to the
reference frame of an object would maintain their object-relatedfiring in a different environment. Object-related firing could, inprinciple, be accounted for by tuning to sensory aspects of theobject (Otto and Eichenbaum, 1992; Young et al., 1994; Kor-
Received May 6, 1996; revised Aug. 22, 1996; accepted Sept. 20, 1996.This work was supported by the Office of Naval Research and NS20331 and
conducted in partial fulfillment of the requirements for the degree of Doctor ofPhilosophy. We thank Dr. C. A. Barnes for two surgically implanted rats; Dr. D.Chialvo for useful discussions about the experiments; Drs. Carol Barnes, A. J.Fuglevand, and H. S. Kudrimoti for thoughtful comments on this manuscript; CaseyStengel for technical assistance; and Karen Weaver for help with recording.Correspondence should be addressed to Dr. Bruce L. McNaughton, 344 Life
Sciences North, University of Arizona, Tucson, AZ 85724.Copyright q 1996 Society for Neuroscience 0270-6474/96/168027-14$05.00/0
The Journal of Neuroscience, December 15, 1996, 16(24):8027–8040

shunov et al., 1996), by representation of specific behaviors orreward contingencies related to that object (Eichenbaum et al.,1987; Eichenbaum and Cohen, 1988; Breese et al., 1989; Wieneret al., 1989; Fukuda et al., 1992), or by participation in a spatialmap centered on the object (Gothard et al., 1996). To distinguishamong these alternatives, hippocampal cells were recorded indifferent environments that shared a behaviorally relevant object,a box in which each trial started and ended. If the sensory featuresof the box, the reward contingency, or the behavior of walking intoor out of the box are responsible for box-related firing, the spatialcontext would make little or no difference, and the cells wouldmaintain their box-related firing in both environments. Alterna-tively, if box-related cells are simply place cells, then one mightexpect different place field relationships in different environments(Kubie and Ranck, 1983), regardless of the presence of a commonobject.Abstracts of this work have been published previously (Gothard
et al., 1995; McNaughton et al., 1995).
MATERIALS AND METHODSSurgery, electrode assembly, and data acquisition. Surgeries were con-ducted according to National Institutes of Health guidelines for rodents.Eight male Fisher 344 rats were implanted under pentobarbital anesthe-sia with a “hyperdrive,” a device holding a circular array of 14 separatelymovable microdrives. The construction of this device and the parallelrecording technique were described in detail in Gothard et al. (1996).Briefly, each microdrive consisted of a drive screw coupled with a moldednut to a guide cannula. The guide cannula held a tetrode, a four-channelelectrode constructed by twisting together four strands of polyimide-coated, 14 mm, nichrome wire (H. P. Reid, Neptune, NJ). A full turn ofthe screw advanced the tetrode 320 mm into the brain. The stereotaxiccoordinates for the placement of the electrode array were 2.5 mm lateraland 3.8 mm posterior to bregma on the right hemisphere. The tetrodeswere lowered gradually into the CA1 layer of the right dorsal hippocam-pus. Two of the tetrodes served as reference and/or EEG electrodes, andthe other 12 tetrodes were each connected to four separate channels of amultipin connector.During training and recording, a headstage was attached to the mul-
tipin connector. The headstage consisted of two unity-gain, 25 channel,miniature FET preamplifiers (CFP-1020, Multichannel Concepts, Gaith-
Figure 1. Behavioral apparatus and analysis methods for Experiment 1. A, Linear track (to scale) with the five box locations used as the start and endpoint of each journey. The 188 3 8 cm track was placed across a corner of the laboratory and was surrounded by recording equipment and laboratoryfurniture. A 27-cm-high 3 32-cm-wide 3 27-cm-long cardboard box was mounted on the track. On each trial, the box was moved to one of five equallyspaced locations. One food cup was mounted in the box and another was fixed at the opposite end of the track. During each trial, while the rat approachedthe fixed food cup, the box was moved to a new location to which the rat then returned. Box locations were randomly assigned, ensuring that all fivelocations were equally probable. B shows the five types of outbound journeys, labeled box1 out, box2 out, etc. C shows the five types of inbound journeys.D, The behavioral correlate of each cell was quantified by the slope of a line fitted to the firing profiles on the five different types of trials (the“displacement slope”). The figure shows firing profiles of an idealized cell with a displacement slope of 1.0 on the outbound journeys. This cell fires atthe same distance from the box irrespective of the position of the box on the track. The slanted dashed line represents the regression line used to calculatethe displacement slope. The vertical dashed line points to the location of the peak firing on the box1-out trials (;0.25 for this example). E, Firing profileof an idealized cell with a displacement slope of 0.0 on the inbound journeys. The firing field of this cell remains in the same location on the track forall trial types. The vertical dashed line gives a displacement slope of 0.0 and also indicates the location of peak firing on the box1-in trials.
8028 J. Neurosci., December 15, 1996, 16(24):8027–8040 Gothard et al. • Path Integration and Sensory Cues in the Hippocampal Code for Space

ersburg, MD) and a 14 cm lightweight aluminum rod, reaching fromabove the head to the back, with a large cluster of infrared diodes in thefront and a small cluster in the back. The front diodes generated a largerlight spot than the back diodes, allowing a video tracking system (SA-2Dragon tracker, Boulder, CO) to record the position and head orienta-tion of the animal with a sampling frequency of 20 Hz.A multiwire cable connected the headstage to a commutator (Beila
Idea Development, Anaheim, CA) from which the signals were transmit-ted to an array of 56 digitally programmable amplifiers. The signals wereamplified by a factor of 10,000, bandpass-filtered between 600 Hz and 6KHz, and transmitted to an array of seven 80486 computers equippedwith synchronized time-stamp clocks. The signals from each tetrodechannel were digitized at 32 KHz. The relative amplitude of the spikes ondifferent tetrode channels (McNaughton et al., 1983; Recce and O’Keefe,
1989) served as the basis for cell identification. Pyramidal cells weredistinguished from interneurons based on spike width (spike width of atleast 300 msec measured from peak to valley), the property of firingcomplex spikes, and an overall mean rate , 5 Hz during the recordingsession.
Experiment 1Behavioral apparatus and training. The behavioral apparatus was a 188 38 cm linear track placed across the corner of a large room and surroundedby the recording equipment and laboratory furniture. The recording areawas illuminated by a surgical lamp that projected a bright light spot onone of the walls of the room. A 27-cm-high 3 32-cm-wide 3 27-cm-longsliding cardboard box, mounted on the track, could be moved quickly andeasily to any of five equally spaced locations along the track (Fig. 1A).These five locations are henceforth referred to as box1, box2, box3, etc.,with box1 being the location at one end of the track. A small food cup wasmounted in the center of the carpeted floor of the box. A second food cupwas affixed to the opposite end of the track. The distance from the frontedge of the box to the fixed food cup varied from 161 cm for the longestjourney to 53 cm for the shortest journey.The task required the rats to run back and forth between the box and
the fixed goal. While the rat was traveling from the box to the fixed goal,(outbound journey), the box was manually moved to one of the fivepossible box locations along the track. After visiting the fixed goal, the ratreturned to the box, which was by then in a new location (inboundjourney). This way, the position of the box was usually different at thebeginning and end of a trial, and each trial started where the previoustrial had ended. Custom-designed software controlled the randomizationof box locations, ensuring that in a recording session (usually 75–100trials), all five box locations were sampled equally. The first trial of eachrecording session started at box1 (the farthest from the fixed goal). Eventflags, inserted automatically in the data file, marked the time of each boxexit and box entry and also the time of reaching the fixed goal anddeparting from it. Event flags permitted the selection and analysis of allthe outbound journeys that originated in any of the five box locations orthe inbound journeys that ended in any box location (see Fig. 1B,C).Training for this task started with 3–5 d of habituation to the apparatus.
During this period, the rats were placed inside the box, which was alwaysin position box1, and allowed to explore. Chocolate sprinkles were strewnalong the track. After a few minutes of exploring the box, the rats startedto explore the track and eat the chocolate. Initially, the rats made onlyshort excursions from the box, but by the fifth day they ran the full lengthof the track without hesitation.The initial experiences of all the animals on the track were with the box
located at position box1. For six rats, recording started with the box fixedin this position, and the box was moved to new locations only after two tothree recording sessions. For two rats, recording started after they hadalready experienced the box moving from trial to trial. Because nodifferences were observed in any of the analyses that could be attributedto these training procedure differences, the data from all rats werepooled.To control for the occlusion of the distal visual cues by the walls of the
box, an additional manipulation was performed in one rat. Halfwaythrough the last recording session, the rat was briefly removed from theapparatus while the walls of the box were removed. The rat was thenplaced back on the remaining floor of the box and the recording wascontinued according to the normal protocol. With only the floor of thebox left in place, the rat had full access to the distal visual cues.Data analysis. The spatial firing profile for each cell was calculated by
averaging the firing rates over all trials (15–20), for each type of outboundand inbound journey (e.g., box1-out, box2-out, box1-in, box2-in, etc.) (seeFig. 1). The firing profile is calculated as a function of position along thetrack, thereby ignoring any possible two-dimensional structure of thefiring fields. To analyze the relative influences of the box or fixed spatialcues on place-cell firing, the firing profiles from the box1-out trials werecompared with all the other firing profiles (box2-out, box3-out, etc.). Theoffset of the firing rate profile relative to the corresponding profile for thebox1 position was estimated by calculating the spatial cross-correlationbetween the two rate distributions and measuring the spatial shift atwhich this function was maximal. This measurement took into accountthe shape of the firing profile, not merely the peak. Only points contain-ing nonzero occupancies in both profiles were entered into the cross-correlation. For each cell, the distance by which the profile shifted wasplotted against the corresponding shift of the box relative to the positionof box1, and a regression line was computed. The slope of the regression
Figure 2. Behavioral apparatus for Experiment 2. A 1.23 1.2 m platformwas placed in the center of a room (3.5 m diameter area) surrounded byblack curtains. Large white objects, serving as distal visual cues, were hungin front of the curtains (not shown). The box used in experiment 1 was alsoused in this task. A 5-cm-diameter, 40-cm-high landmark, which indicatedthe goal location (x), was also placed on the platform. A, Outboundjourney originating from the middle of the E edge of the platform, with thebox opening facing W. In this trial, the landmark was placed in thenorthwest corner of the platform. The place of the reward is indicated bythe x. B, Inbound journey of the same trial. While the rat approached thelandmark to eat the chocolate sprinkles placed near it, the box was movedto the NE corner of the platform and was rotated 908 to face south. Thefollowing trial (data not shown) started from this box location. Computersoftware randomized box location, box orientation, and landmark loca-tion. C, Seven possible box locations and orientations (1–7 ) and threepossible landmark locations (8) were sampled with equal probability ineach recording session.
Gothard et al. • Path Integration and Sensory Cues in the Hippocampal Code for Space J. Neurosci., December 15, 1996, 16(24):8027–8040 8029
line was normalized so that if the firing profile shifted by the same amountas the box, then the slope of the line, henceforth called displacementslope, would be 1.0; if the profile did not shift with the box, the displace-ment slope would be 0.0. The slope could not be calculated if the cell didnot fire for at least two different box locations. Figure 1, D and E, depictstwo idealized cells with slopes of 1.0 and 0.0. The location of the peakfiring on the full track was quantified on a scale from 0 to 1, where 0.0corresponded to the box1 end of the track and 1.0 corresponded to theopposite end containing the fixed food cup.Vector correlations were used to compare the population firing pat-
terns at different points on the track, across different types of trials.Population vectors were constructed for each rat separately. For a givenrat, all pyramidal cells with robust firing during any type of trial wereused. Data from all available recording sessions were combined for thisanalysis, but if the same cell was recorded in multiple sessions, only datafrom one of these sessions were used. The full length of the track wasdivided into 64 equal bins, and the mean firing rate of each cell wascalculated for each spatial bin for all 10 types of journeys. From thesefiring rates, an n-element population vector was constructed for eachspatial location-trial type combination, where n is the number of cellsused from a rat. The correlation coefficient of each pair of populationvectors was calculated and used as a measure of the similarity of popu-lation firing patterns at different locations on different types of trials.To test whether cells whose spatial firing profiles overlapped on the
shortened track were active simultaneously, we calculated the temporalcross-correlation between spike trains for a 1 sec window with a 10 msecbin size and also for a 200 msec window with a 2 msec bin size.
Experiment 2Behavioral apparatus and training. Four of the eight rats involved inexperiment 1 were trained for a second task. For this task, the box usedin experiment 1 was moved to a new recording room, where it becamepart of a new behavioral apparatus. The new environment consisted of a120 3 120 cm wooden platform located on a table in the center of a 3.5 mdiameter, curtained arena with numerous large visual cues at the periph-ery (Fig. 2). The room was illuminated by four symmetrical, medium-intensity lights. The rats were brought to this room without disorienta-tion, and during training and recording, the door leading to the adjacentroom with the recording equipment was left open.The rats were trained to run back and forth for a small food reward
between the box used previously on the track and a cylindrical landmark.The box could be placed at any of three equally spaced locations along theeast edge of the platform, with the opening facing west, north, or south(see Fig. 2). The landmark could be placed at three equally spaced goallocations along the west edge of the platform. A trial consisted of anoutbound journey, from the box to the cylindrical landmark, and aninbound journey, from the landmark back to the box. On each trial, areward was placed on the platform adjacent to the landmark and in thefood cup in the box. During the outbound journey, the box was moved toa new location and usually rotated 908. Thus, the position and orientationof the box were always different at the beginning and end of a trial. Whilethe rat was eating the reward inside the box, the landmark was placed ina new location so that consecutive trials had different goal locations.Custom-designed software controlled the randomization of box locations,
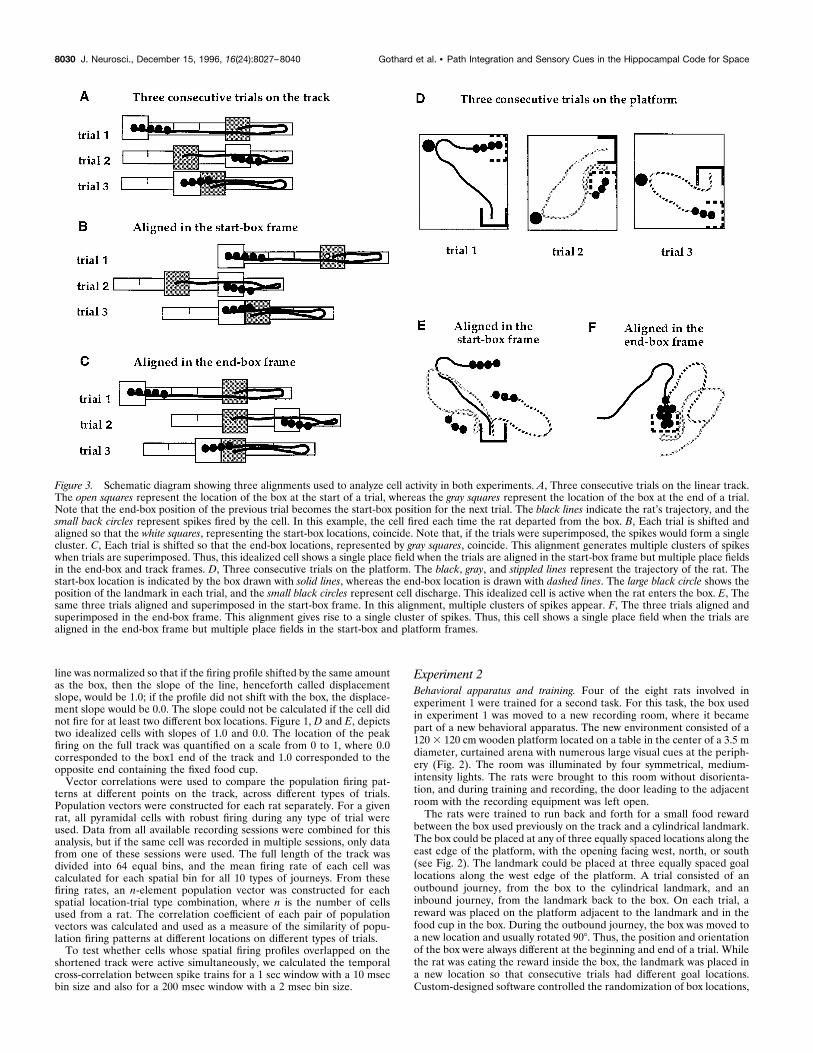
Figure 3. Schematic diagram showing three alignments used to analyze cell activity in both experiments. A, Three consecutive trials on the linear track.The open squares represent the location of the box at the start of a trial, whereas the gray squares represent the location of the box at the end of a trial.Note that the end-box position of the previous trial becomes the start-box position for the next trial. The black lines indicate the rat’s trajectory, and thesmall back circles represent spikes fired by the cell. In this example, the cell fired each time the rat departed from the box. B, Each trial is shifted andaligned so that the white squares, representing the start-box locations, coincide. Note that, if the trials were superimposed, the spikes would form a singlecluster. C, Each trial is shifted so that the end-box locations, represented by gray squares, coincide. This alignment generates multiple clusters of spikeswhen trials are superimposed. Thus, this idealized cell shows a single place field when the trials are aligned in the start-box frame but multiple place fieldsin the end-box and track frames. D, Three consecutive trials on the platform. The black, gray, and stippled lines represent the trajectory of the rat. Thestart-box location is indicated by the box drawn with solid lines, whereas the end-box location is drawn with dashed lines. The large black circle shows theposition of the landmark in each trial, and the small black circles represent cell discharge. This idealized cell is active when the rat enters the box. E, Thesame three trials aligned and superimposed in the start-box frame. In this alignment, multiple clusters of spikes appear. F, The three trials aligned andsuperimposed in the end-box frame. This alignment gives rise to a single cluster of spikes. Thus, this cell shows a single place field when the trials arealigned in the end-box frame but multiple place fields in the start-box and platform frames.
8030 J. Neurosci., December 15, 1996, 16(24):8027–8040 Gothard et al. • Path Integration and Sensory Cues in the Hippocampal Code for Space

box orientations, and goal locations. The software inserted event flagsinto the data file, which marked the times of arrival at and departure fromthe box or the goal and position and orientation of the box for each exitand entry. Training for this task started when recording for experiment 1was completed. Rats were considered ready for recording when theycompleted each trial in ,1 min.Each recording consisted of three sessions separated by 10–20 min
breaks. The first session (30 min) was recorded on the linear track, thesecond session (30 min) on the platform, and the third session (10 min)on the linear track again. During the 20 min break between the sessions,the rat and the box were transported from one room to the other, and thecells were monitored while that rat was quietly resting to ascertain that noelectrode drift had occurred in the previous session.
Data analysis. Only cells that showed the same spike shape andrelative spike height on each of the four tetrode channels for each ofthe three recording sessions were included in the analysis. On theplatform, the displacement slope could not be calculated, because therat could run toward or away from the box in multiple directions. Thealternative was to construct firing maps for each trial and to superim-pose these maps in the absolute spatial frame of the environment oraligned on the box, either at the beginning or the end of each trial (Fig.3). If a cell fired preferentially when the rat was inside the box, then afiring map for that cell in the absolute spatial frame would show fiveclusters of spikes, corresponding to the five possible box locations onthe linear track, and three clusters for the corresponding box locationson the platform. When the same trials are aligned on the start- or
Figure 4. Relationship between spatial firing properties and box location for outbound and inbound journeys. A, Firing profiles of four outbound-selective cells (1, 2, 3, 4 ) shown for all five types of outbound journey (see Fig. 1B). The horizontal lines represent the track, and the small rectanglesrepresent the box. The last 27 cm portion of the track, containing the fixed reward cup, is omitted. Cell 1 fired immediately after the rat exited the boxand had a displacement slope of 0.95; cell 2 fired farther away from the box and had a displacement slope of 0.72; cell 3 fired approximately halfwaybetween the box and the goal and had a displacement slope of 0.57; cell 4 fired close to the goal and had a displacement slope of 0.10. The maximumfiring rates for cells 1, 2, 3, and 4 were 11, 30, 18, and 22 Hz, respectively. Note that the firing field of cell 2 shrunk progressively as the box moved closerto the goal. Also, the firing rate of this cell was very low on box4-out trials and vanished on box5-out trials. Cell 3 showed decreased firing rates on box3-outtrials and ceased firing on box4-out and box5-out trials. No such modulation of firing rate and firing field size were seen in cell 1 or cell 4. B, Plot of thedisplacement slope as a function of the position of the peak firing along the track for box1-out trials (168 outbound-selective cells from eight rats). Thehorizontal axis represents the location of the peak firing on the track for the box1-out journeys and is scaled so that the origin corresponds to box1, and1.0 corresponds to the fixed food cup. The vertical axis shows the displacement slope (ratio of the firing-field shift to the distance that the box was moved)representing the extent to which the box controlled cell activity. A displacement slope of 1 indicates that the cell fired at a fixed distance from the boxacross the five types of outbound journeys, whereas a displacement slope of 0 indicates that the cell fired at a fixed distance from the fixed reward site.This plot shows that all cells that fired on the initial part of the journey were strongly bound to the box. As the rat moved farther along the track, thedisplacement slope gradually declined. Near the end of the journey, the influence of the box was overridden by that of the fixed cues (displacement slopevalues near 0.0). Note that because a rat samples a limited region of the track on different journeys, certain combinations of slope versus peak firing alongthe full track are impossible. These lie at the bottom left and top right of plot B. C, Firing profiles of four inbound-selective cells (5, 6, 7, 8) shown for allfive types of inbound journey (see Fig. 1C). Cell 8 fired immediately after the rat departed from the fixed site and had a displacement slope of 0.0; cell7 fired farther away and had a displacement slope of 0.0; cell 6 fired approximately halfway between the fixed food cup and the box and had a displacementslope of 0.35; cell 5 fired as the rat was entering the box and had a displacement slope of 1.06. The maximum firing rates for cells 5, 6, 7, and 8 were 32,27, 21, and 11, respectively. Note that cells 6 and 7 ceased firing when the box was placed inside their firing fields. D, Plot of the displacement slope asa function of the position of the peak firing along the track for box1-in trials (157 inbound-selective cells from eight rats). More than half of the inboundtrajectory was marked by firing fields at constant distances from the fixed reward site (displacement slopes close to 0.0). Cells with intermediatedisplacement slopes appeared only on the last part of the inbound journey and covered a shorter span of the inbound journey than cells with intermediateslopes did on the outbound journey. Box-related cells started to fire at a short distance before reaching the box and continued firing inside the box.
Gothard et al. • Path Integration and Sensory Cues in the Hippocampal Code for Space J. Neurosci., December 15, 1996, 16(24):8027–8040 8031
end-box frame, only one cluster of spikes would appear for bothenvironments.
RESULTSExperiment 1The behavioral apparatus for Experiment 1 was the linear track. Alleight rats trained on this apparatus acquired the task in six to seventraining sessions. The rats were trained with the box always inposition box1. They appeared to be startled and explored vigorouslywhen they first encountered the box in an unexpected location. In thenext two to three trials, however, they got used to the manipulationand showed no additional hesitation in entering the box.The duration of a trial was;25 sec, including the time that the rat
spent eating in the box and at the fixed food cup. Each rat adopteda stereotypical running and turning pattern inside the box and at thefixed food cup, and hence, at these points, only half of the possiblehead directions were sampled. In a recording session of 75 to 100trials, each start-box and end-box location was sampled 15 to 20times. The session came to an end when, because of fatigue or satiety,the rats slowed down, and the trial duration exceeded 45 sec.From the 603 recorded cells that exhibited activity on the
apparatus, 92 were interneurons (theta cells), and 511 were pyra-midal (complex-spike) cells. Of the latter, 140 were eliminatedfrom the main analysis for one of the following reasons: (1) thecell fired ,100 spikes during the recording session (98 cells); (2)the cell fired on the whole length of the track in one direction butnot in the other (7 cells); (3) the cell showed no consistent firingpattern (35 cells). Clear, location-specific firing was seen in 371cells. The great majority of cells showed clear directional prefer-ences: 157 cells were outbound-selective, 168 were inbound-selective, and 46 fired in both directions. The distribution of placefields was uniform along the track, with no tendency to cluster atthe reward sites. Because no recordings were made during sleepor quiet wakefulness, these numbers should not be taken as ameasure of the probability that a given cell will be active in a givenenvironment (Thompson and Best, 1989).
Outbound-selective cellsThe outbound journey started when the rat finished eating thereward while facing the back wall of the box and turned to exitthe box; the journey ended when the rat reached the fixed foodcup at the opposite end of the track. Thus, some outbound cellsfired inside the box and others on different portions of thetrack. The distribution of displacement slopes for theoutbound-selective cells revealed that the extent to which thebox or fixed cues influenced their firing on the shortenedversions of the track was a function of the location of the placefield on the full track (Fig. 4A,B). All cells active during theinitial part of the outbound journey fired at fixed distancesfrom the box, irrespective of box location, and hence haddisplacement slopes of 1 or close to 1. (Recall that a slope of 1indicated that the firing field shifted together with the box,whereas a slope of 0 indicated that the firing field was fixedrelative to the track and the static background cues.) No cellswith stable fields relative to the fixed cues were active inside orin the vicinity of the box, even though, after exiting the box, theexternal cues would presumably have been sufficient for the ratto determine its location on the track. Cells that fired fartherfrom the box had intermediate displacement slopes. Cellsshowed stable firing fields with respect to the fixed cues (dis-placement slopes near 0) only when the rat reached the vicinityof the fixed reward site. The majority of the outbound-selectivecells were influenced by the box; however, with increasingdistance from the box, the displacement slopes gradually de-creased, indicating that the influence of the box diminished,whereas that of the fixed cues gained strength (Fig. 4B).With few exceptions, the outbound-selective cells that were
active close to the box fired with comparable rates and forcomparable spans of the rat’s trajectory for all box locations. Incontrast, the majority of cells with intermediate displacementslopes showed progressively decreasing firing-field size anddecreasing mean firing rates from box1-out to box5-out runs.
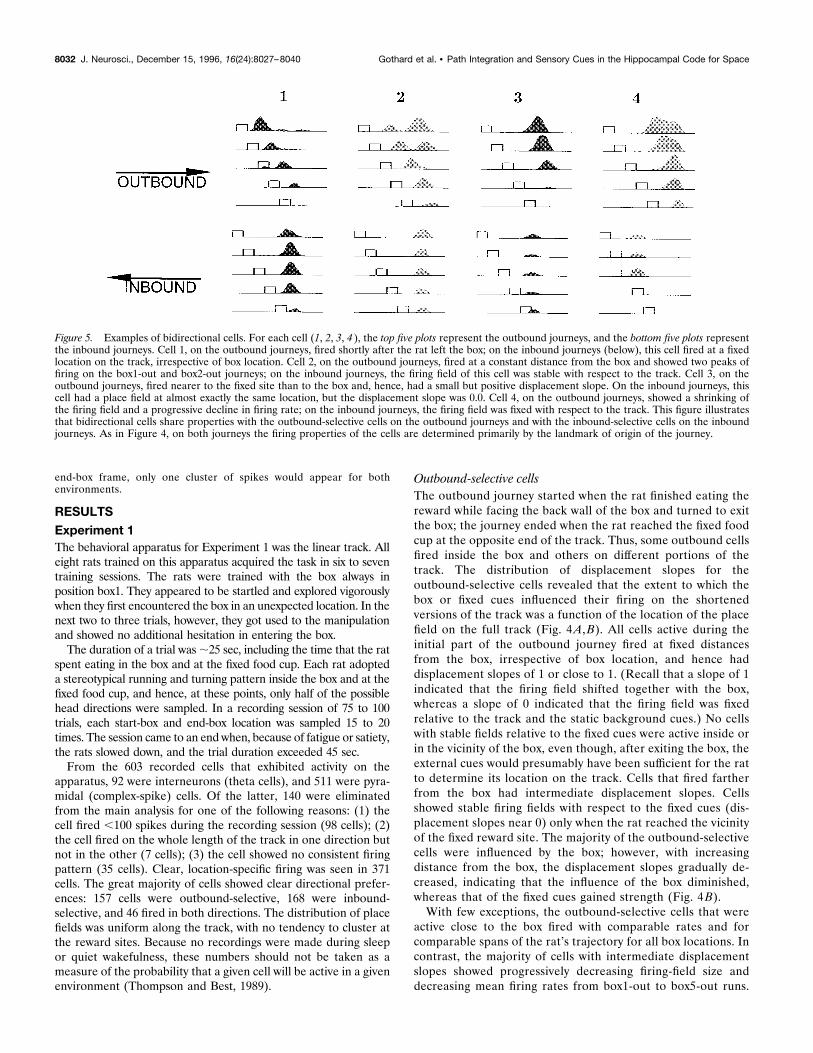
Figure 5. Examples of bidirectional cells. For each cell (1, 2, 3, 4 ), the top five plots represent the outbound journeys, and the bottom five plots representthe inbound journeys. Cell 1, on the outbound journeys, fired shortly after the rat left the box; on the inbound journeys (below), this cell fired at a fixedlocation on the track, irrespective of box location. Cell 2, on the outbound journeys, fired at a constant distance from the box and showed two peaks offiring on the box1-out and box2-out journeys; on the inbound journeys, the firing field of this cell was stable with respect to the track. Cell 3, on theoutbound journeys, fired nearer to the fixed site than to the box and, hence, had a small but positive displacement slope. On the inbound journeys, thiscell had a place field at almost exactly the same location, but the displacement slope was 0.0. Cell 4, on the outbound journeys, showed a shrinking ofthe firing field and a progressive decline in firing rate; on the inbound journeys, the firing field was fixed with respect to the track. This figure illustratesthat bidirectional cells share properties with the outbound-selective cells on the outbound journeys and with the inbound-selective cells on the inboundjourneys. As in Figure 4, on both journeys the firing properties of the cells are determined primarily by the landmark of origin of the journey.
8032 J. Neurosci., December 15, 1996, 16(24):8027–8040 Gothard et al. • Path Integration and Sensory Cues in the Hippocampal Code for Space

[A few exceptional cells (13) increased their mean rates as theplace field was compressed. Some of these cells fired only a fewspikes on the full journey and, thus, appeared to be active onlyon shortened journeys.] Usually, on the shortest journey (box5-out), only the cells with fields on the full track near the box orthe fixed food cup remained active (e.g., cells 1 and 4, Fig. 4A),
whereas cells with intervening fields were silent (e.g., cells 2and 3, Fig. 4A).
Inbound-selective cellsThe inbound journey started when the rat finished eating thereward at the fixed food cup and turned to proceed toward the
Figure 6. Temporal cross-correlations between cells with widely separated fields on the full track and adjacent or partially overlapping fields on the shortenedtrack. Each row corresponds to a pair of simultaneously recorded cells. In each row, the first plot shows the firing profiles of the two cells (dark gray and lightgray) on all five types of journeys. The middle plot shows the temporal cross-correlation (1 sec window with 10 msec bin size) between the two spike trains. Theplots on the right show the same cross-correlation but for a window of 200 msec with a bin size of 2 msec. A, Two outbound-selective cells with adjacent butnonoverlapping fields on the full track and partially overlapping fields on box5-out trials. The cross-correlations show no temporal overlap, although the fieldsappear to be spatially overlapping on the box5-out trials. Note that with increased distortion of the track, the sizes of the firing fields shrink, the centers of thefields converge, and the firing rates decline. B, Two outbound-selective cells with adjacent but nonoverlapping fields on the full track and partially overlappingfields on box4-out trials. This is an exceptional midtrack cell, because it fired on all five types of outbound journeys and increased its firing rate on box4-out andbox5-out journeys. The cross-correlations for box1-out, box2-out, and box3-out trials show little or no temporal overlap. The cross-correlations for box4-out trialsshow some overlap but less than would be predicted from the spatial overlap of the firing profiles. C, Two inbound-selective cells with widely separated fieldson the full track and partially overlapping fields on the box3-in and box4-in trials. The cross-correlations show little temporal overlap on these trials, althoughthe firing profiles appear to overlap. Note that the second cell ceased firing on the box5-in trials.
Gothard et al. • Path Integration and Sensory Cues in the Hippocampal Code for Space J. Neurosci., December 15, 1996, 16(24):8027–8040 8033

Figure 7. Population vector correlations between the pattern of firing on the full track and on the shortened track for two rats, A and B. For each rat,population vector correlations are shown for the outbound journeys (top five plots) and inbound journeys (bottom five plots). For each correlation plot,the vertical axis corresponds to the full track, whereas the horizontal axis corresponds to the length of the track covered by the rat in one of the five trialtypes (box1, box2, etc.; see Key, bottom left). Figure legend continues.
8034 J. Neurosci., December 15, 1996, 16(24):8027–8040 Gothard et al. • Path Integration and Sensory Cues in the Hippocampal Code for Space

box; the journey ended when the rat reached the food cup insidethe box. A large fraction of inbound-selective cells had stablefiring fields with respect to the fixed cues and, hence, had dis-placement slopes of 0 or close to 0. Cells with displacement slopesapproaching a value of 1 were seen only in the vicinity of the box.On the inbound journey, such cells started to fire only 5–10 cmbefore the rat reached the threshold of the box and continued tofire inside the box until the rat arrived at the food cup. Comparedwith the outbound journeys, a smaller fraction of cells had inter-mediate displacement slopes, and the transition from slope 0 toslope 1 was more abrupt (Fig. 4B,D).Cells that fired in the vicinity of the fixed food cup, on either
outbound or inbound journeys, had the same field size and firingrates for all types of journeys. Cells active in the middle part of thejourney ceased firing when the box was placed over their firingfield (Fig. 4C). To exclude the possibility that the lack of visualaccess to the fixed cues accounts for the cessation of firing, in thelast recording session for one rat, the walls of the box wereremoved so that the rat was shuttling between the floor of the boxand the fixed food cup. The floor of the box alone, placed in thefiring field of an inbound-selective cell, was sufficient to inhibit itsfiring (data not shown). Moreover, this manipulation failed tointroduce any detectable changes in cell activity.Seven cells fired on the whole length of the inbound or the
outbound journey but did not fire at all in the opposite direction.These cells did not show any particular characteristics that woulddifferentiate them from ordinary complex-spike neurons.
Bidirectional cellsForty-six cells (12%) were bidirectional. Bidirectional cells firedon both the outbound and inbound journeys, but there was noapparent systematic relationship between the inbound and out-bound firing locations. Typically, bidirectional cells behaved likeoutbound-selective cells on the outbound journey and likeinbound-selective cells on the inbound journey (Fig. 5).
Interactions between cells with neighboring place fieldsSpatial and temporal relationships between place fields werequantified in terms of cross-correlations between pairs of simul-taneously recorded cells. All cell pairs showed a consistent orderof cell firing on all types of journeys. The majority of cell pairs hadnonoverlapping fields on the full track, which remained nonover-lapping on the shortened track. A few simultaneously recordedcells had partially or completely overlapping fields on the full
track. The pattern of spatial overlap between cells with neighbor-ing fields was altered when the journeys were shortened. Smalldistortions of the journey (e.g., box2-out) led to a proportionalcompression of the representation, indicated by reduced field size,converging field centers, and (on average) increased relative over-lap between adjacent fields (Fig. 6A). Large distortions often ledto the cessation of discharge in cells that were active in the middleof the journey, so that widely separated fields on the full trackbecame adjacent or partially overlapping on the shortened track.Such pairs of cells were rare, even in data sets with 25 to 30simultaneously recorded cells with clear fields on the full track.Figure 6 depicts three examples of these rare cases. The spatialoverlap between firing profiles results partly from averaging datafrom multiple trials of the same type in which small, but coherent,shifts in the spatial distributions occurred between trials andpartly from a true temporal overlap between the two spike trainswithin trials. The cross-correlations in Figure 6 show little overlapbetween cells with widely separated fields on the full track andspatially overlapping fields on the shortened track. The smalloverlap that occurred is restricted to ,;250 msec (1–2 thetacycles).
Population propertiesThe directional selectivity, together with the observation thatbidirectional cells had unrelated discharge patterns on the out-bound and inbound journeys, indicates that locations between thetwo reward sites on the full track were represented by uncorre-lated distributions of place fields on the inward and outwardjourneys, with the same set of cells firing in the same order oneach type of journey. Within each distribution, the relative firingtimes, times the rat’s running velocity, corresponded to a metricfor the length of the track. When the track was shortened, the firstand last cells of the full sequence fired reliably, but the cellscorresponding to the middle part of the journey showed dramaticchanges. This effect was more pronounced on the outboundjourneys. Cells corresponding to the middle part of the outboundjourneys gradually decreased their firing rates and, often, the sizeof their firing fields, as the journey was shortened (see Fig. 4).Typically, on the shortest (i.e., box5-out) journeys, these cellsstopped firing as if the population activation skipped the cells inthe middle of the sequence. We tested the similarity of thepopulation activation on the full-length journey and on the fourtypes of shortened journeys by correlating point by point thepopulation vectors computed for each spatial location (see Mate-
4
Highly correlated firing patterns between one location on the full track and a second location on one of the shortened tracks are indicated in red. Thefirst plot in each row is a spatial autocorrelation of the population vectors on the full track, which gives rise to a perfectly symmetrical pattern, with valuesof 1.0 along the diagonal. The more similar the firing patterns on each shortened track to those on the full track, the more closely the correlation matrixfor the shortened track resembles the autocorrelation. With few exceptions, the firing pattern at each location on each shortened track was very similarto the firing pattern of some location on the full track, as indicated by the red ridge of high correlation, either continuous or broken into two pieces. Theexceptions correspond to locations where the ridge is discontinuous. The regions of the ridge corresponding to the box and to the fixed food cup alwayshad high correlations. This indicates that the population firing pattern in the vicinity of the box and fixed food cup was always similar to the correspondingpatterns on the full track. Thus, the pattern of high correlation points gives a picture of the “mapping” from the shortened track to the full track (alsoshown in Fig. 8). A, Population vector correlations for rat A (78 cells). For both outbound and inbound journeys, the pattern of activity on the full trackwas highly correlated with the pattern of activity on the box2-out and box2-in trials. The correlation matrix was similar to the autocorrelation but exhibiteda slight deviation from the diagonal. This deviation indicates that on box2 trials, the population activity pattern was governed primarily by the origin ofthe journey at early times and by the destination of the journey at later times. Beginning with the third plot (box3-out and box3-in trials), the correlationmatrix shows striking differences from the autocorrelation matrix. When the track was greatly shortened, e.g., on the box4-out trials (fourth plot to theright), the pattern of activity remained correlated at the beginning of the trial when the rat is in the vicinity of the box. Then there is an area of lowcorrelation and a sudden jump to the final part of the journey, where the activity patterns are highly correlated again, indicating that there is adiscontinuous shift in the representation. B, Population vector correlations for rat B (35 cells). The same general features as for rat A are apparent, exceptfor the correlation pattern for the shortened outbound journeys (top row). In contrast to the other seven rats, this rat showed continuous transition ofthe representation on all the outbound journeys. The population vector correlations on the inbound journey show discontinuity. This indicates individualdifferences between rats in the way the representation responds to shortening of the track.
Gothard et al. • Path Integration and Sensory Cues in the Hippocampal Code for Space J. Neurosci., December 15, 1996, 16(24):8027–8040 8035

rials and Methods). As seen in Figure 7, for most points on theshortened journeys, there was a unique region of high correlationon the full track (red ridge in the figure). The location of the highcorrelation areas shows that the population firing patterns in thevicinity of the box and fixed food cup were always similar regard-less of the box location.The point of maximal population vector correlation provides a
function relating the representation of the shortened track to thatof the full track (Fig. 8). This operation is equivalent to recon-structing the rat’s virtual location on the full track from theactivity recorded on the shortened tracks, according the method
of Wilson and McNaughton (1993). For all configurations, theslope of this function was parallel to the slope of the identitymapping at the beginning and end of the journey and steeper inthe intervening regions; the shorter the journey, the greater theintervening slope. For the most compressed configurations, therewas almost always a discontinuity, indicating an abrupt jump fromone hippocampal representation to another, without passingthrough the intervening states. There were individual differencesamong rats as to whether and where these transitions occurred.For one exceptional rat, the transition appeared to remain con-tinuous for all outbound journeys; however, it was discontinuous
Figure 8. Mappings from each shortened track to the full track, derived from the correlation plots shown in Figure 7 for rats A and B. Each black panelshows five superimposed plots, color-coded according to the box location (see Key at bottom left). For each rat, the left panel shows mappings for theoutbound journeys, and the right panel shows mappings for the inbound journeys. A schematic outline of the track is drawn at the bottom of each panel,where 1–5 indicate the front edge of the box. As illustrated in the key (top left) each curve shows for every point on one of the shortened journeys thepoint on the full journey where the hippocampal representation was most similar. In other words, the colored points correspond to the red ridges of thecorrelations plots in Figure 7. In each plot, the white dots aligned along the diagonal represent the identity mapping, associating the box1 journeys withthemselves. In all cases, the red dots, representing box2 journeys, form a continuous, slightly curved line indicating a gradual transition of therepresentation between origin and destination. Most of the other plots, corresponding to shorter journeys, show discontinuities at some point along thejourney, indicating abrupt shifts in the hippocampal representation. Note that the length of the segments in which the colored plots are parallel to theidentity line reflects the distance over which the representation was dominated by the box. For some outward journeys, this was almost 1 m, even thoughthe box was behind the rat, outside of its field of view. In contrast, for inbound journeys, the representation did not become dominated by the box untilthe rat was within ;20 cm.
8036 J. Neurosci., December 15, 1996, 16(24):8027–8040 Gothard et al. • Path Integration and Sensory Cues in the Hippocampal Code for Space
on the inbound journeys (Fig. 7B). For all rats, on the inboundjourneys, the transition occurred a short distance before the ratcrossed the threshold of the box. For the outbound journeys,however, the transition usually occurred midway between the boxand the fixed reward site. Thus, the hippocampal representationremained aligned with the box for almost half of the outboundjourney. This is an important observation, because the box was atthis time behind the rat and, thus, outside its field of view.Cells recorded on the same tetrode did not usually have adja-
cent firing fields. It was common, however, to find cells with verysimilar firing correlates recorded in the same session from differ-ent tetrodes. When one cell with a well-characterized behavioralcorrelate did not fire on one trial or fired in an unexpectedlocation, simultaneously recorded cells with similar correlatesshowed the same behavior. This indicates a strong functionalcoupling between cells with similar place fields.
Experiment 2Experiment 2 was designed to test whether cells that fired as therat entered or exited the box retained this behavioral correlate ina second environment. Although the four rats involved in thisexperiment learned in four to six training sessions to exit the box,orient toward the landmark, and return to the box after consum-ing the reward, they occasionally encountered difficulty finding theentrance side of the box. (Recall that while the rat was travelingtoward the landmark, the box was moved to a new location androtated so that the entrance was facing a new direction.) Asillustrated in Figure 3D, they often walked along the walls of thebox searching for the entrance. A total of 122 cells, with activity inone or both of the environments, were recorded from four rats. Ofthese, 73 were active both on the linear track and the platform, 18were active only on the linear track, and 31 cells were active onlyon the platform. If a cell fired as the rat was either entering orexiting the box, or when it was inside the box, the cell wasconsidered box-related. Only 8 of 27 cells that were box-related onthe track were box-related on the platform too, indicating thatneither the sensory features of the box nor the behavior ofentering or exiting it were enough to account for the cell’s activity.Even these eight cells were box-related in different ways, e.g., abox-outward cell on the linear track fired inside the box on theplatform. In addition to the eight cells that were box-related inboth environments, five cells fired in relation to the box on theplatform but were silent on the track. Despite the common phys-ical element between the two environments (the box) and thecommon element between the tasks (shuttling between box and agoal), the firing correlate on the track did not predict the firingcorrelate on the platform or vice versa (Fig. 9).
DISCUSSIONExperiment 1 examined the place fields of hippocampal cells inrats that had been trained to shuttle on a track between a box atone end and a fixed reward site at the opposite end. Duringrecording, the box was shifted from trial to trial to differentlocations on the track, thereby creating mismatches with theoriginally learned relationships of the box to other cues in theenvironment. Along a journey, the same cells were active, in thesame order, regardless of the location of the box, although ele-ments of the sequence of place fields on the full track weresometimes omitted. Despite the constancy of the order, the spe-cific locations of the firing fields shifted in a systematic andpredictable way as a function of box location. These facts permit-
ted the use of a population vector analysis to construct a “map-ping” from each shortened track to the full-length track.The principal finding was that when a mismatch existed be-
tween the internal spatial representation and real-world coordi-nates, defined by external cues, this led to a dynamic correctionprocess. For small mismatches, the internal representation, afteran initial delay, was translated smoothly through interveningstates, faster than the animal’s actual speed, until the internalrepresentation “caught up” with the real-world coordinate. Incase of large mismatches, however, one internal representationcollapsed and the other representation emerged in its place, andthe intervening coordinates were skipped. For intermediate mis-matches, a combination of these effects was observed. This de-scription is derived from the variation of the displacement slope asa function of the location of a firing field on the full track (Fig. 4),from the compression of place fields and reduction in firing ratefor cells with intermediate displacement slopes during intermedi-ate compressions (i.e., box2 and box3), and from the disappear-ance of some midtrack fields in the highly compressed configura-tions (i.e., box4 and box5).An important conclusion can be drawn from the delay in the
correction of the internal representation on outbound journeys.This delay implies that during the first ;50 cm, the rats updatedtheir internal representations primarily with respect to their dis-tance from the box, even though the only external landmark thatmight serve to anchor the representations was the box itself, whichwas behind the rat, presumably outside of its field of view. Thisindicates that during this time, the position representation wasupdated on the basis of path integration in spite of the mismatchwith the external visual cues. This conclusion is reinforced by theobservation that on inbound journeys, even though the rat wasfacing the box, the correction of the mismatch did not begin untilthe rat was within 10–15 cm of the box. The ability of rodents toupdate their position representation on the basis of self-motioncues has been demonstrated directly by behavioral experiments(O’Keefe, 1976; Mittelstaedt and Mittelstaedt, 1982; Cheng, 1986;Etienne et al., 1986; Sharp et al., 1990; Etienne, 1992; Seguinot etal., 1993; Knierim et al., 1995; Alyan, 1996). Several theoreticalmodels have attempted to account for this phenomenon (Worden,1992; Wan et al., 1994; Maurer and Seguinot, 1995; Redish andTouretzky, 1996; McNaughton et al., 1996).Thus, it appears that both path integration and external sensory
information interact to update the rat’s location representation.The delay in correcting the representation in cases of mismatchsuggests that the path integration mechanism normally dominatesthe update process and indeed may provide the fundamentalspatial metric for the map (O’Keefe and Nadel, 1978; McNaugh-ton et al., 1996). This is consistent with previous observations onthe behavior of place and head direction cells in a cylindricalapparatus after cue rotation (Knierim et al., 1995). In that study,mismatches between the internal angular representation and theactual directional cues were often corrected only after a delay and,in some cases, not at all. When corrections occurred, they wereusually continuous, as was the case for the linear coordinateduring small distortions in the present study.The results of the present work and of an earlier study (Goth-
ard et al., 1996), in which rats shuttled between a box and a pairof landmarks placed variably in a large arena, are consistent withthe idea that place fields are controlled by a competitive interac-tion between path integration and external sensory input, primar-ily vision. The neural substrate of this interaction is not yetunderstood, but the essential information is available to the hip-
Gothard et al. • Path Integration and Sensory Cues in the Hippocampal Code for Space J. Neurosci., December 15, 1996, 16(24):8027–8040 8037

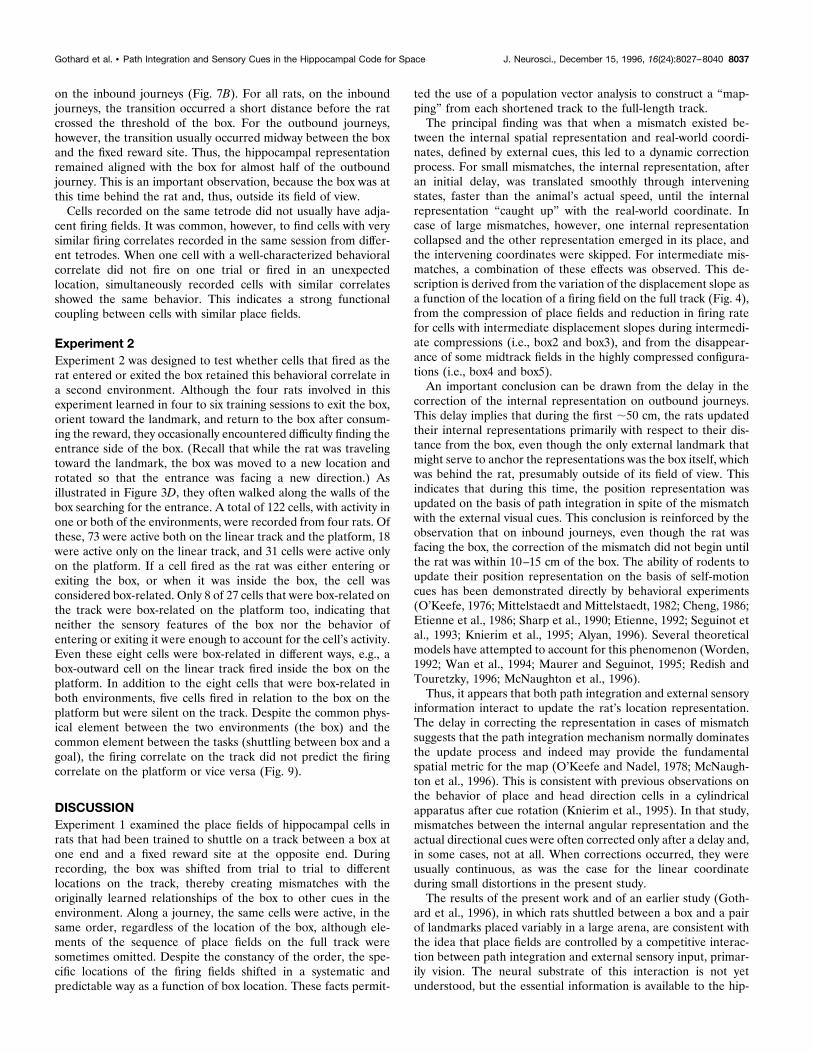
Figure 9. Examples of cells recorded both on the linear track (Experiment 1) and on the square platform (Experiment 2). Each plot is a spatial firingmap in which the gray lines represent the superimposed trajectories of the rat, and the black circles represent cell discharge. For the first three cells (A,B, C), the top panels depict the firing map on the linear track obtained by superimposing all the trials, the panel below shows the same trials aligned andsuperimposed in the box frame (see Materials and Methods) (see Fig. 3), and the bottom panel shows the firing map for the same cell on the squareplatform. For cells D, E, and F, only two firing maps are shown. The fine vertical lines on the linear track correspond to the front of the five box locations.In the panels depicting the square platform, the box and goal locations correspond to three equidistant locations along the left and right edge, respectively(see Materials and Methods) (see Fig. 2). A, A cell that fired inside the box on the track and in the vicinity of the landmarks on the platform. The toppanel shows that the cell fired preferentially in five equally spaced locations corresponding to the five box locations on the track. When the trials arealigned and superimposed so that the box locations coincide (below), a single cluster of firing appears, indicating that this cell fired specifically when therat was inside the box. On the platform, the cell fired exclusively when the rat was at the three landmark (goal) locations. B, A cell that fired inside thebox both on the track and on the platform. The three clusters of spikes on the right edge of the platform indicate that the cell fired on the platform whenthe rat was inside the box. C, This cell fired on the track just as the rat was leaving the box, and it showed very strong activity near the landmark in allthree landmark locations on the platform. The trials in themiddle panel are aligned on the start-box frame to show that the firing field spans the thresholdof the box, indicated by a thin vertical line. D, This cell had a bidirectional place field on the track and strong fields inside the box on the platform. In thetop panel, the bottom streak of spikes corresponds to the outbound journeys and the top streak to the inbound journeys. A bidirectional cell of this typeis shown in Figure 5, cell 1. E, This cell had an inbound-selective place field on the track and a nondirectional place field on the platform. A second fieldis suggested by the small cluster of spikes near the top left corner of the platform. F, This cell was silent on the linear track but fired reliably on the platformwhen the rat was turning from the food cup, ready to exit the box. In general, there was no consistent relationship of cells to the box across differentenvironments.
8038 J. Neurosci., December 15, 1996, 16(24):8027–8040 Gothard et al. • Path Integration and Sensory Cues in the Hippocampal Code for Space
pocampal formation. External visual information is conveyed tothe hippocampal formation via the ventral (inferotemporal) visualprocessing stream (Ungerleider and Mishkin, 1982). Informationabout head direction is available in at least two parts of thehippocampal system, the postsubiculum and the anterior thalamus(Taube et al., 1990; Taube, 1995). Finally, information aboutself-motion is also available from cingulate and posterior parietalcortices (Chen et al., 1994) and possibly also from the medialseptum (Ranck, 1973).The plots in Figure 4, B and D, are reminiscent of a hysteresis
loop, suggesting that the place-cell activity pattern at any momentis determined primarily by the previous activity pattern and not bythe incoming sensory information. Together with the continuouscorrections for small mismatches, this provides compelling evi-dence that internal representations of position are stabilized bycooperative intrinsic interactions and are not merely driven by thecurrent exteroceptive input (Tsodyks and Sejnowski, 1995; Mc-Naughton et al., 1996).The emergence of a place field map in the dark and its persis-
tence when lights are turned on (Quirk et al., 1990) suggest thatthe position representations themselves are either preconfiguredwithin the connections of the network or developed as a conse-quence of path integration. Thus, the metric for the locationrepresentation appears not to derive from the perception ofspatial relationships, such as the geometry of the environment,visual angles, and retinal image sizes of landmarks, but ratherfrom self-motion cues.The role of path integration in updating the hippocampal
spatial representation offers an explanation for recent results ofO’Keefe and Burgess (1996) on stretching and doubling of placefields when the size and/or aspect ratio of a rectangular recordingbox were altered. In that study, the rats foraged randomly in atwo-dimensional space and, hence, would be expected to shownondirectional place fields (Muller et al., 1994; Markus et al.,1995). When place fields split or elongated as a consequence ofstretching the environment, the two half fields were almost alwaysdirectionally selective. The directionality of the firing in the twohalf fields was typically oriented toward the center of the field,indicating that the wall behind the rat was the main predictor ofwhere the cell would fire. This form of directional selectivity canbe explained by the assumption that the rats take position fixeswhen they are at or very near the walls and then update theirposition representation primarily by path integration as the theymove away from the walls. If this account is correct, then thesplitting of place fields in the O’Keefe and Burgess study resultsfrom the same kind of hysteresis that caused the delay in mis-match correction in the present experiments. O’Keefe and Bur-gess accounted for this effect by a Gaussian influence of the wallson the firing of place fields at a given position. The present resultssuggest that the determinant is primarily the activity of the cells,the place fields of which were most recently traversed, coupledwith direction and linear motion information. The walls mayinitiate the sequence, but there is no direct influence of the wallsper se.Experiment 2 was designed to determine whether cells that fire
in or near the box represent sensory qualities of the box, rewardcontingencies, or the behaviors of entering or exiting the box. Ifany of these possibilities were true, cells should have maintainedtheir firing correlate in relation to the box, even when the box wasin a new spatial context. In this experiment, most cells that fired inor near the box in one of the two environments (track or platform)failed to show box-related activity in the other environment.
These results show that box-related cells are not simply “boxdetectors”; instead they behave as place cells in other studies withrecordings in multiple environments (Kubie and Ranck, 1983).Feature-selective responses are more common for entorhinal cor-tical cells, as shown by Quirk et al. (1992), who found thatentorhinal input cells were significantly more driven by the sen-sory features of the environment than CA1 place cells. CA 1 cellsappear to be governed more by cooperative, intrinsic dynamicsthan by a predominance of strong, feature-selective inputs toindividual place cells.In a previous study (Gothard et al., 1996), we showed that place
cells can be bound to different behaviorally relevant, variablyplaced landmarks in an environment and interpreted this asevidence that the hippocampus encodes location within multiple,landmark-centered, spatial reference frames, where the term “ref-erence frame” was intended to be synonymous with a map-likerepresentation encoded in a specific distribution of place fields(Gothard et al., 1996) (see also Wan et al., 1994). In this inter-pretation, reference frame shifts would be equivalent to the rear-rangement of place fields that occurs across different environ-ments. In light of the present results, however, it appears thatlandmark-bound firing is attributable to a mismatch correctionwithin a single map rather than to a switching of maps. Thus, atleast under the present conditions, a journey between two pointsseems to be encoded on a single map rather than on a mosaic ofdifferent maps. Shifts of reference frame do seem to occur, how-ever, if one redefines reference frame to be a given object or set ofobjects in relation to which location is encoded. Shifts of maps dooccur between environments as well as between inward and out-ward journeys on linear tracks (McNaughton et al., 1989; Wan etal., 1994) or when task demands change (Markus et al., 1995). Onlinear tracks, map-shifts can account for place-cell directionality.Finally, the present results may provide insight into general
brain mechanisms involved in updating and correcting conflictsbetween internal models of the world and external sensory input.
REFERENCESAlyan SH (1996) Evidence for resetting the directional component ofpath integration in the house mouse (mus musculus). Ethology102:629–638.
Barnes CA (1988) Spatial learning and memory processes: the search fortheir neurobiological mechanisms in the rat. Trends Neurosci11:163–169.
Breese CR, Hampson RE, Deadwyler SA (1989) Hippocampal placecells: stereotypy and plasticity. J Neurosci 9:1097–1111.
Chen LL, Lin L-H, Barnes CA, McNaughton BL (1994) Head-directioncells in rat posterior cortex. II. Contributions of visual and ideotheticinformation to the directional firing. Exp Brain Res 101:24–34.
Cheng K (1986) A purely geometric model in the rat’s spatial represen-tation. Cognition 23:149–178.
Eichenbaum H, Cohen NJ (1988) Representation in the hippocampus:what do hippocampal neurons code? Trends Neurosci 116:244–248.
Eichenbaum H, Kuperstein M, Fagan A, Nagode J (1987) Cue-samplingand goal-approach correlates of hippocampal unit activity in rats per-forming an odor-discrimination task. J Neurosci 7:716–732.
Eichenbaum H, Wiener SI, Shapiro ML, Cohen NJ (1989) The organi-zation of spatial coding in the hippocampus: a study of neural ensembleactivity. J Neurosci 9:2764–2775.
Etienne AS (1992) Navigation of a small mammal by dead reckoning andlocal cues. Curr Dir Psychol Sci 1:48–52.
Etienne AS, Maurer R, Saucy F, Teroni E (1986) Short-distance homingin the golden hamster after a passive outward journey. Animal Behav34:696–715.
Fukuda M, Kobayashi T, Ono T, Tamura R (1992) Effects of learningplace significance in rat hippocampal place cells. Soc Neurosci Abstr18:1426.
Gothard et al. • Path Integration and Sensory Cues in the Hippocampal Code for Space J. Neurosci., December 15, 1996, 16(24):8027–8040 8039

Gothard KM, Skaggs WE, McNaughton BL (1995) Interactions betweenmultiple spatial reference frames in the rat hippocampus. Soc NeurosciAbstr 21:941.
Gothard KM, Skaggs WE, Moore KM, McNaughton BL (1996) Bindingof hippocampal CA1 neural activity to multiple reference frames in alandmark-based navigation task. J Neurosci 16:823–835.
Hampson RE, Heyser CJ, Deadwyler SA (1993) Hippocampal cell firingcorrelates of delayed-match-to-sample performance in the rat. BehavNeurosci 107:715–739.
Jarrard EL (1993) On the role of the hippocampus in learning andmemory in the rat. Behav Neural Biol 60:9–26.
Jung MW, McNaughton BL (1993) Spatial selectivity of unit activity inthe hippocampal granular layer. Hippocampus 3:165–182.
Knierim JJ, Kudrimoti HS, McNaughton BL (1995) Place cells, headdirection cells, and learning of landmark stability. J Neurosci15:1648–1659.
Korshunov VA, Wiener SI, Korshunova TA, Berthoz A (1996) Place-and behavior-independent sensory triggered discharges in rat hip-pocampal CA1 complex spike cells. Exp Brain Res 109:169–173.
Kubie JL, Ranck Jr JB (1983) Sensory-behavioral correlates in individualhippocampal neurons in three situations: space and context. In: Neu-robiology of the hippocampus (Seifert W, ed), pp 433–447. London:Academic.
Markus EJ, Barnes CA, McNaughton BL, Gladden VL, Skaggs WE(1994) Spatial information content and reliability of hippocampal CA1neurons: effects of visual input. Hippocampus 4:410–421.
Markus EJ, Qin Y, Leonard B, Skaggs WE, McNaughton BL, Barnes CA(1995) Interactions between location and task affect the spatial anddirectional firing of hippocampal neurons. J Neurosci 15:7079–7094.
Maurer R, Seguinot V (1995) What is modeling for? A critical review ofmodels of path integration. J Theor Biol 175:457–475.
McNaughton BL, Barnes CA, O’Keefe J (1983) The contributions ofposition, direction, and velocity to single unit activity in the hippocam-pus of freely-moving rats. Exp Brain Res 53:41–49.
McNaughton BL, Gothard KM, Skaggs WE (1995) Context-dependentbinding of hippocampal “place cells” to different feature-centered ref-erence frames. Soc Neurosci Abstr 21:941.
McNaughton BL, Barnes CA, Gerrard JL, Gothard KM, Jung MW,Knierim JJ, Kudrimoti HS, Qin Y, Skaggs WE, Suster M, Weaver KL(1996) Deciphering the hippocampal polyglot: the hippocampus as apath integration system. J Exp Biol 199:173–185.
Mittelstaedt H, Mittelstaedt ML (1982) Homing by path integration. In:Avian navigation (Papi H, Wallraff G, eds), pp 290–297. Berlin:Springer.
Muller RU, Kubie JL (1987) The effects of changes in the environmenton the spatial firing of hippocampal complex-spike cells. J Neurosci7:1951–1968.
Muller RU, Kubie JL, Ranck Jr JB (1987) Spatial firing patterns ofhippocampal complex-spike cells in a fixed environment. J Neurosci7:1935–1950.
Muller RU, Bostock E, Taube JS, Kubie JL (1994) On the directionalfiring properties of hippocampal place cells. J Neurosci 14:7235–7251.
O’Keefe J (1976) Place units in the hippocampus of the freely movingrat. Exp Neurol 51:87–109.
O’Keefe J, Burgess N (1996) Geometric determinants of the place fieldsof hippocampal neurones. Nature 381:425–428.
O’Keefe J, Conway DH (1978) Hippocampal place units in the freelymoving rat: why they fire where they fire. Exp Brain Res 31:573–590.
O’Keefe J, Dostrovsky J (1971) The hippocampus as a spatial map.Preliminary evidence from unit activity in the freely moving rat. BrainRes 34:171–175.
O’Keefe J, Nadel L (1978) The hippocampus as a cognitive map. Oxford:Clarendon.
O’Keefe J, Speakman A (1987) Single unit activity in the rat hippocam-pus during a spatial memory task. Exp Brain Res 68:1–27.
Olton DS, Branch M, Best PJ (1978) Spatial correlates of hippocampalunit activity. Exp Neurol 58:387–409.
Otto T, Eichenbaum H (1992) Neuronal activity in the hippocampusduring delayed nonmatching to sample performance in rats: evidencefor hippocampal processing in recognition memory. Hippocampus2:323–334.
Quirk GJ, Muller RU, Kubie JL (1990) The firing properties of hip-pocampal place cells in the dark depends on the rat’s recent experience.J Neurosci 10:2008–2017.
Quirk GJ, Muller RU, Kubie JL, Ranck Jr JB (1992) The positionalfiring properties of medial entorhinal neurons: description and compar-ison with hippocampal place cells. J Neurosci 12:1945–1963.
Ranck JB (1973) Studies on single neurons in dorsal hippocampal for-mation and septum in unrestrained rats. Exp Neurol 41:461–531.
Recce ML, O’Keefe J (1989) The tetrode: an improved technique formulti-unit extracellular recording. Soc Neurosci Abstr 15:1250.
Redish DA, Touretzky DS (1996) Cognitive maps beyond the hippocam-pus. Hippocampus, in press.
Seguinot V, Maurer R, Etienne AS (1993) Dead reckoning in a smallmammal: the evaluation of distance. J Comp Physiol [A] 173:103–113.
Sharp PE, Kubie JL, Muller RU (1990) Firing properties of hip-pocampal neurons in a visually symmetrical environment: contribu-tions of multiple sensory cues and mnemonic processes. J Neurosci10:3093–3105.
Taube JS (1995) Head direction cells recorded in the anterior thalamicnuclei of freely moving rats. J Neurosci 15:70–86.
Taube JS, Muller RU, Ranck JB (1990) Head direction cells recordedfrom the postsubiculum in freely moving rats. I. Description and quan-titative analysis. J Neurosci 10:420–435.
Tsodyks M, Sejnowski TJ (1995) Associative memory and hippocampalplace cells. Int J Neural Sys 6:81–86.
Ungerleider LG, Mishkin M (1982) Two cortical visual systems. In: Anal-ysis of visual behavior (Ingle DJ, Goodale MA, Wansfield RJ, eds), pp549–586. Cambridge, MA: MIT.
Wan HS, Touretzky DS, Redish DA (1994) Towards a computationaltheory of rat navigation. In: Proceedings of the 1993 ConnectionistModels Summer School (Mozer MC, Smolensky P, Touretzky DS,Elman JL, Weigend AS, eds), pp 11–19. Hillsdale, NJ: Erlbaum.
Wiener SI, Paul CA, Eichenbaum H (1989) Spatial and behavioral cor-relates of hippocampal neuronal activity. J Neurosci 9:2737–2763.
Wilson MA, McNaughton BL (1993) Dynamics of the hippocampal en-semble code for space. Science 261:1055–1058.
Worden R (1992) Navigation by fragment fitting: a theory of hippocam-pal function. Hippocampus 2:165–187.
Young BJ, Fox GD, Eichenbaum H (1994) Correlates of hippocampalcomplex-spike activity in rats performing a nonspatial radial maze task.J Neurosci 14:6553–6563.
8040 J. Neurosci., December 15, 1996, 16(24):8027–8040 Gothard et al. • Path Integration and Sensory Cues in the Hippocampal Code for Space
Copyright © 2022 FDOKUMEN