Single-Photon Detection System for Quantum Optics Applications
IEEE TRANSACTIONS ON BIOMEDICAL ENGINEERING 1
An Ensemble-based System for MicroaneurysmDetection and Diabetic Retinopathy Grading
Balint Antal, Student Member, IEEE, and Andras Hajdu, Member, IEEE
Abstract—Reliable microaneurysm detection in digital fundusimages is still an open issue in medical image processing. We pro-pose an ensemble-based framework to improve microaneurysmdetection. Unlike the well-known approach of considering theoutput of multiple classifiers, we propose a combination ofinternal components of microaneurysm detectors, namely prepro-cessing methods and candidate extractors. We have evaluated ourapproach for microaneurysm detection in an online competition,where this algorithm is currently ranked as first, and also ontwo other databases. Since microaneurysm detection is decisivein diabetic retinopathy grading, we also tested the proposedmethod for this task on the publicly available Messidor database,where a promising AUC 0.90±0.01 is achieved in a ’DR/non-DR’-type classification based on the presence or absence of themicroaneurysms.
Index Terms—Microaneurysm detection, Ensemble-based sys-tems, Diabetic retinopathy grading, Fundus image processing.
I. INTRODUCTION
D IABETIC retinopathy (DR) is a serious eye diseasethat originates from diabetes mellitus and is the most
common cause of blindness in the developed countries. Earlytreatment can prevent patients to become affected from thiscondition or at least the progression of DR can be sloweddown. Thus, mass screening of patients suffering from diabetesis highly desired, but manual grading is slow and resourcedemanding. Therefore, several efforts have been made toestablish reliable computer-aided screening systems based oncolor fundus images [1]. The promising results reported byFleming et al. [2] and Jelinek et al. [3] indicate that automaticDR screening systems are getting closer to be used in clinicalsettings.
A key feature to recognize DR is to detect microaneurysms(MAs) in the fundus of the eye. The importance of handlingMAs are two-fold. First, they are normally the earliest signs ofDR, hence their timely and precise detection is essential. Onthe other hand, the grading performance of computer-aidedDR screening systems highly depends on MA detection [3][4]. In this paper, we propose a microaneurysm detector whichprovides remarkable results from both aspects.
One way to ensure high reliability and raise accuracy in adetector is to consider ensemble-based systems, which havebeen proven to be efficient in several fields. However, the
Balint Antal and Andras Hajdu are with the University of Debrecen, Facultyof Informatics, POB 12, 4010, Debrecen, Hungary. E-mail: {antal.balint, ha-jdu.andras}@inf.unideb.hu. The corresponding author is Balint Antal. Phone:+36 52 512-900/62830, Fax: +36 52 512-900/62822.
Copyright (c) 2010 IEEE. Personal use of this material is permitted.However, permission to use this material for any other purposes must beobtained from the IEEE by sending an email to [email protected].
usual ensemble techniques aim to combine class labels or realvalues which cannot be adopted in our case. In MA detection,detectors provide spatial coordinates as centers of potentialMA candidates. The use of well-known ensemble techniqueswould require a classification of each pixel, which can bemisleading in our context, since different algorithms extractMAs with different approaches and the MA centers may notcoincide exactly. To overcome this difficulty, we gather closeMA candidates of the individual detectors and apply a votingscheme on them.
In [5], Niemeijer et al. showed that the fusion of theresults of the several MA detectors leads to an increasedaverage sensitivity measured at seven predefined false positiverates. In this paper, we propose a framework to build MAdetector ensembles based on the combination of the internalcomponents of the detectors not only on their output as in [5].Some of our earlier research on combining MA detectors didnot provide reassuring results [6]. To increase the accuracyof such ensembles, we must identify the weak points ofMA detection. The first difficulty originates from the shapecharacteristics of MAs. They appear as small circular darkspots on the surface of the retina (see Figure 1), which canbe hard to distinguish from fragments of the vascular systemor from certain eye features. Most MA detectors tackle thisproblem in the following way: first, the green channel of thefundus image is extracted and preprocessed to enhance MAlike characteristics. Then, in a coarse level step (which willbe referred as candidate extraction in the rest of the paper),all MA-like objects are detected in the image. Finally, a finelevel algorithm (usually a supervised classifier) removes thepotentially false detections based on some assumptions aboutMAs. Our former investigations showed that the low sensitivityof MA detectors originates from the candidate extractor part[7]. However, we could increase the sensitivity by applyingproper preprocessing methods before candidate extraction.This technique causes a slight increment in the number of falsepositives, but it can be decreased by classification or voting.
In this paper, we propose an effective microaneurysm de-tector based on the combination of preprocessing methodsand candidate extractors. We provide an ensemble creationframework to select the best combination. An exhaustivequantitative analysis is also given to prove the superiority ofour approach over individual algorithms. We also investigatethe grading performance of our method, which is proven tobe competitive with other screening systems.
The rest of the paper is organized as follows: the selectedpreprocessing methods and candidate extractors are presentedin section II and III, respectively. The details of the proposed

IEEE TRANSACTIONS ON BIOMEDICAL ENGINEERING 2
Fig. 1. Sample digital fundus image with a microaneurysm.
ensemble creation framework is discussed in section IV. Wepresent our evaluation methodology in section V. In sectionVI, we summarize our experimental results. A detailed discus-sion is given in section VII to address several issues. Finally,we draw conclusions in section VIII.
II. PREPROCESSING METHODS
In this section, we present the selected preprocessingmethods, which we consider to be applied before executingMA candidate extraction. The selection of the preprocessingmethod and candidate extractor components for this frame-work is a challenging task. Comparison of preprocessingmethods dedicated to microaneurysm detection has not beenpublished yet. Since preprocessing methods need to be highlyinterchangeable, we must select algorithms which can beused before any candidate extractor and do not change thecharacteristics of the original images (unlike e.g. shade cor-rection [8]). We also found some techniques to generate toonoisy images for MA detection (histogram equalization [8],adaptive histogram equalization [8] or color normalization[8]). Thus, we have selected methods which are well-known inmedical image processing and preserve image characteristics.Naturally, the proposed system can be improved in the futurewith adding new methods. A summary on the key differencesof the algorithms is given in Table I.
A. Walter-Klein contrast enhancement [9]
This preprocessing method aims to enhance the contrast offundus images by applying a gray level transformation usingthe following operator:
f ′ =
1
2(f ′
max − f ′min)
(µ− fmin)r · (f − fmin)
r+ f ′
min, f ≤ µ,
−1
2(f ′
max − f ′min)
(µ− fmax)r · (f − fmax)
r+ f ′
max, f ≥ µ,
where {fmin, . . . , fmax}, {f ′min, . . . , f
′max} are the inten-
sity levels of the original and the enhanced image, respectively,µ is the mean value of the original grayscale image and r ∈ Ris a transition parameter.
B. Contrast limited adaptive histogram equalization [10]
Contrast limited adaptive histogram equalization (CLAHE)is a popular technique in biomedical image processing, since
TABLE ISUMMARY OF THE KEY DIFFERENCES OF THE PREPROCESSING METHODS.
Algorithm Aim Method
Walter-Klein contrast enhancement gray leveltransformation
CLAHE salient objectenhancement
local histogramequalization
Vessel Removal MA enhancement nearvessels
vessel removal andinpainting
Illumination eq. MA enhancement at theborder of the ROI vignette correction
it is very effective in making the usually interesting salientparts more visible. The image is split into disjoint regions,and in each region a local histogram equalization is applied.Then, the boundaries between the regions are eliminated witha bilinear interpolation.
C. Vessel removal and extrapolation [11]
We investigate the effect of processing images with thecomplete vessel system being removed based on the ideaproposed in [11]. We extrapolate the missing parts to fill inthe holes caused by the removal using the inpainting algorithmpresented in [12]. MAs appearing near vessels become moreeasily detectable in this way.
D. Illumination equalization [8]
This preprocessing method aims to reduce the vignettingeffect caused by uneven illumination of retinal images. Eachpixel intensity is set according to the following formula:
f ′ = f + µd − µl,
where f, f ′ are the original and the new pixel intensity values,respectively, µd is the desired average intensity and µl is thelocal average intensity. MAs appearing on the border of theretina are enhanced by this step.
E. No preprocessing
We also consider the results of the candidate extractorsobtained for the original images without any preprocessing.That is, we formally consider a ”No preprocessing” operation,as well.
III. MICROANEURYSM CANDIDATE EXTRACTORS
Candidate extraction is a process which aims to spot anyobjects in the image showing MA-like characteristics. Individ-ual MA detectors consider different principles to extract MAcandidates. In this section, we provide a brief overview of thecandidate extractors involved in our analysis. Again, just as forpreprocessing methods, adding new MA candidate extractorsmay lead to further improvement in the future. A summary onthe key differences of the candidate extractor algorithms andtheir performance measured in the ROC training dataset [13]are shown in Table II.
IEEE TRANSACTIONS ON BIOMEDICAL ENGINEERING 3
A. Walter et al. [14]
Candidate extraction is accomplished by grayscale diameterclosing. That is, this method aims to find all sufficiently smalldark patterns on the green channel. Finally, a double thresholdis applied.
B. Spencer et al. [15]
From the input fundus image, the vascular map is extractedby applying twelve morphological top-hat transformationswith twelve rotated linear structuring elements (with a radialresolution 15 ◦). Then, the vascular map is subtracted fromthe input image, which is followed by the application of aGaussian matched filter. The resulting image is then binarizedwith a fixed threshold. Since the extracted candidates are notprecise representations of the actual lesions, a region growingstep is also applied to them. While the original paper [15] iswritten to detect MAs on fluorescein angiographic images, ourimplementation is based on the modified version published byFleming et al. [16].
C. Circular Hough-transformation [17]
Following the idea presented in [17], we established anapproach based on the detection of small circular spots inthe image. Candidates are obtained by detecting circles onthe images using circular Hough transformation. With thistechnique, a set of circular objects can be extracted from theimage.
D. Zhang et al. [18]
In order to extract candidates, this method constructs a max-imal correlation response image for the input retinal image.This is accomplished by considering the maximal correlationcoefficient with five Gaussian masks with different standarddeviations for each pixel. The maximal correlation responseimage is thresholded with a fixed threshold value to obtainthe candidates. Vessel detection and region growing is appliedto reduce the number of candidates, and to determine theirprecise size, respectively.
E. Lazar et al. [19]
Pixel-wise cross-section profiles with multiple orientationsare used to construct a multi-directional height map. This mapassigns a set of height values that describe the distinction ofthe pixel from its surroundings in a particular direction. Ina modified multilevel attribute opening step, a score map isconstructed from which the MAs are extracted by thresholding.
IV. ENSEMBLE CREATION
In this section, we describe our ensemble creation approach.In our framework, an ensemble E is a set of ⟨preprocessingmethod, candidate extractor⟩ or shortly ⟨PP,CE⟩ pairs. Themeaning of a ⟨preprocessing method, candidate extractor⟩ pairis that first we apply the preprocessing method to the inputimage and then we apply the candidate extractor to this result.That is, such a pair will extract a set of candidates HE from the
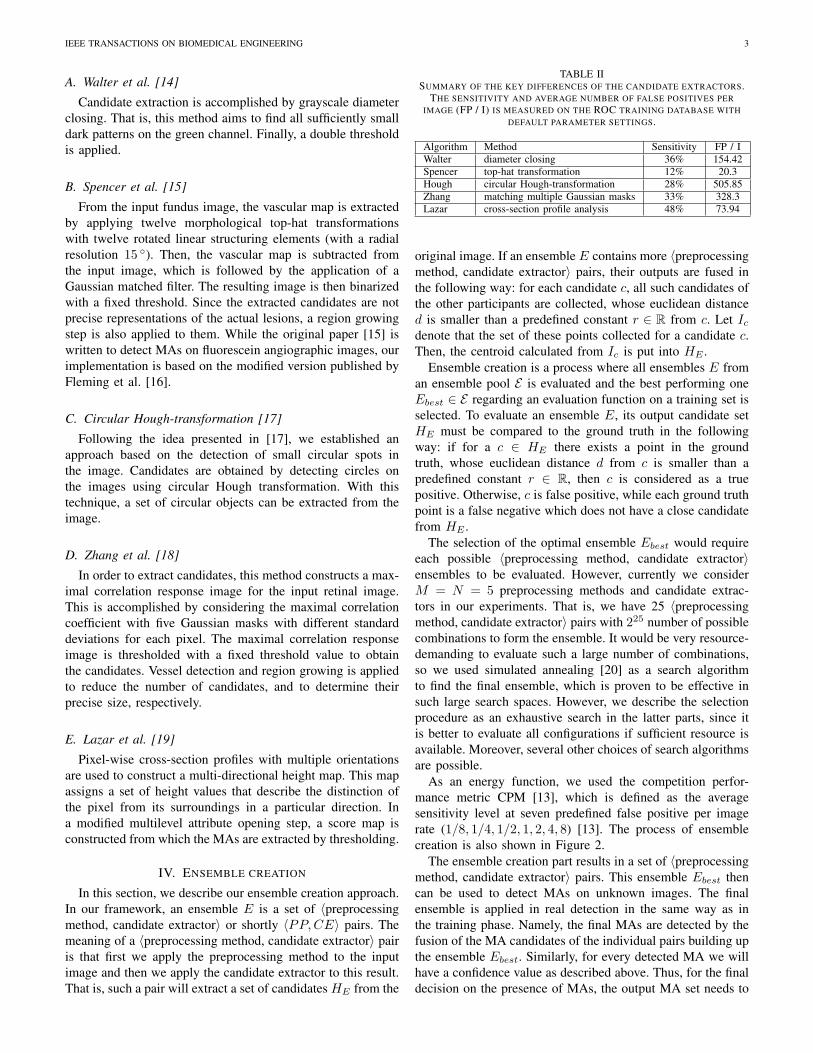
TABLE IISUMMARY OF THE KEY DIFFERENCES OF THE CANDIDATE EXTRACTORS.
THE SENSITIVITY AND AVERAGE NUMBER OF FALSE POSITIVES PERIMAGE (FP / I) IS MEASURED ON THE ROC TRAINING DATABASE WITH
DEFAULT PARAMETER SETTINGS.
Algorithm Method Sensitivity FP / IWalter diameter closing 36% 154.42Spencer top-hat transformation 12% 20.3Hough circular Hough-transformation 28% 505.85Zhang matching multiple Gaussian masks 33% 328.3Lazar cross-section profile analysis 48% 73.94
original image. If an ensemble E contains more ⟨preprocessingmethod, candidate extractor⟩ pairs, their outputs are fused inthe following way: for each candidate c, all such candidates ofthe other participants are collected, whose euclidean distanced is smaller than a predefined constant r ∈ R from c. Let Icdenote that the set of these points collected for a candidate c.Then, the centroid calculated from Ic is put into HE .
Ensemble creation is a process where all ensembles E froman ensemble pool E is evaluated and the best performing oneEbest ∈ E regarding an evaluation function on a training set isselected. To evaluate an ensemble E, its output candidate setHE must be compared to the ground truth in the followingway: if for a c ∈ HE there exists a point in the groundtruth, whose euclidean distance d from c is smaller than apredefined constant r ∈ R, then c is considered as a truepositive. Otherwise, c is false positive, while each ground truthpoint is a false negative which does not have a close candidatefrom HE .
The selection of the optimal ensemble Ebest would requireeach possible ⟨preprocessing method, candidate extractor⟩ensembles to be evaluated. However, currently we considerM = N = 5 preprocessing methods and candidate extrac-tors in our experiments. That is, we have 25 ⟨preprocessingmethod, candidate extractor⟩ pairs with 225 number of possiblecombinations to form the ensemble. It would be very resource-demanding to evaluate such a large number of combinations,so we used simulated annealing [20] as a search algorithmto find the final ensemble, which is proven to be effective insuch large search spaces. However, we describe the selectionprocedure as an exhaustive search in the latter parts, since itis better to evaluate all configurations if sufficient resource isavailable. Moreover, several other choices of search algorithmsare possible.
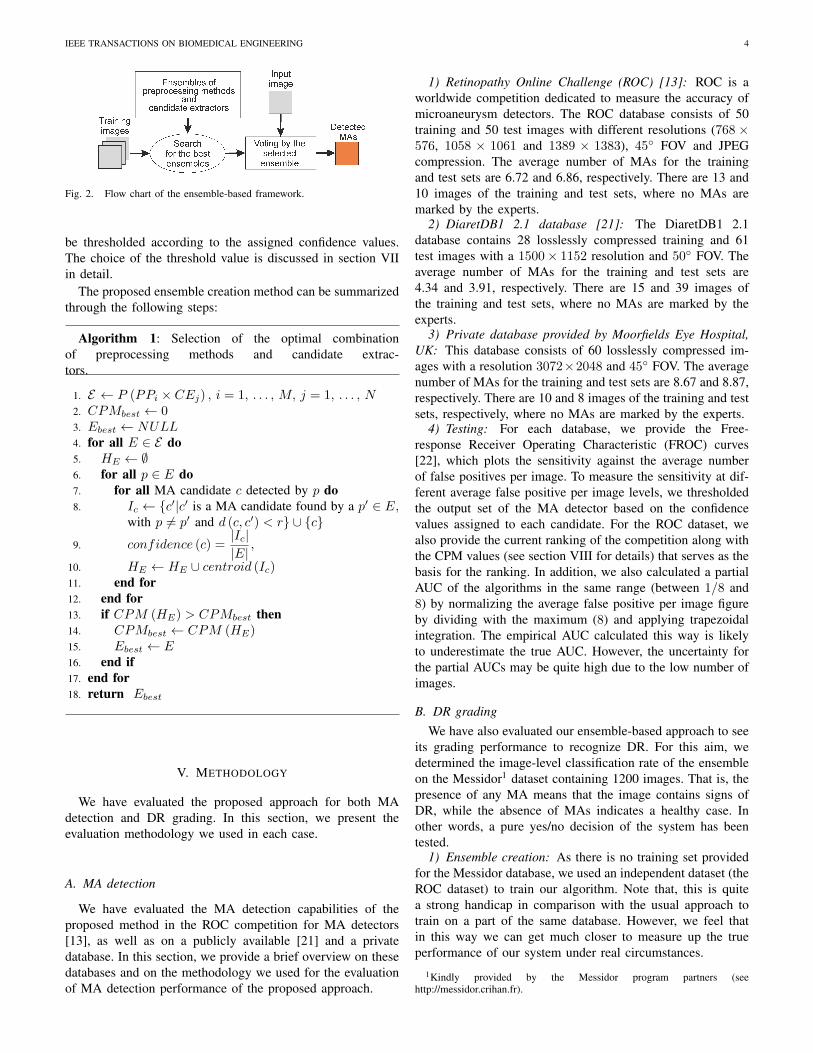
As an energy function, we used the competition perfor-mance metric CPM [13], which is defined as the averagesensitivity level at seven predefined false positive per imagerate (1/8, 1/4, 1/2, 1, 2, 4, 8) [13]. The process of ensemblecreation is also shown in Figure 2.
The ensemble creation part results in a set of ⟨preprocessingmethod, candidate extractor⟩ pairs. This ensemble Ebest thencan be used to detect MAs on unknown images. The finalensemble is applied in real detection in the same way as inthe training phase. Namely, the final MAs are detected by thefusion of the MA candidates of the individual pairs building upthe ensemble Ebest. Similarly, for every detected MA we willhave a confidence value as described above. Thus, for the finaldecision on the presence of MAs, the output MA set needs to
IEEE TRANSACTIONS ON BIOMEDICAL ENGINEERING 4
Fig. 2. Flow chart of the ensemble-based framework.
be thresholded according to the assigned confidence values.The choice of the threshold value is discussed in section VIIin detail.
The proposed ensemble creation method can be summarizedthrough the following steps:
Algorithm 1: Selection of the optimal combinationof preprocessing methods and candidate extrac-tors.
1. E ← P (PPi × CEj) , i = 1, . . . , M, j = 1, . . . , N2. CPMbest ← 03. Ebest ← NULL4. for all E ∈ E do5. HE ← ∅6. for all p ∈ E do7. for all MA candidate c detected by p do8. Ic ← {c′|c′ is a MA candidate found by a p′ ∈ E,
with p = p′ and d (c, c′) < r} ∪ {c}9. confidence (c) =
|Ic||E|
,
10. HE ← HE ∪ centroid (Ic)11. end for12. end for13. if CPM (HE) > CPMbest then14. CPMbest ← CPM (HE)15. Ebest ← E16. end if17. end for18. return Ebest
V. METHODOLOGY
We have evaluated the proposed approach for both MAdetection and DR grading. In this section, we present theevaluation methodology we used in each case.
A. MA detection
We have evaluated the MA detection capabilities of theproposed method in the ROC competition for MA detectors[13], as well as on a publicly available [21] and a privatedatabase. In this section, we provide a brief overview on thesedatabases and on the methodology we used for the evaluationof MA detection performance of the proposed approach.
1) Retinopathy Online Challenge (ROC) [13]: ROC is aworldwide competition dedicated to measure the accuracy ofmicroaneurysm detectors. The ROC database consists of 50training and 50 test images with different resolutions (768 ×576, 1058 × 1061 and 1389 × 1383), 45◦ FOV and JPEGcompression. The average number of MAs for the trainingand test sets are 6.72 and 6.86, respectively. There are 13 and10 images of the training and test sets, where no MAs aremarked by the experts.
2) DiaretDB1 2.1 database [21]: The DiaretDB1 2.1database contains 28 losslessly compressed training and 61test images with a 1500× 1152 resolution and 50◦ FOV. Theaverage number of MAs for the training and test sets are4.34 and 3.91, respectively. There are 15 and 39 images ofthe training and test sets, where no MAs are marked by theexperts.
3) Private database provided by Moorfields Eye Hospital,UK: This database consists of 60 losslessly compressed im-ages with a resolution 3072×2048 and 45◦ FOV. The averagenumber of MAs for the training and test sets are 8.67 and 8.87,respectively. There are 10 and 8 images of the training and testsets, respectively, where no MAs are marked by the experts.
4) Testing: For each database, we provide the Free-response Receiver Operating Characteristic (FROC) curves[22], which plots the sensitivity against the average numberof false positives per image. To measure the sensitivity at dif-ferent average false positive per image levels, we thresholdedthe output set of the MA detector based on the confidencevalues assigned to each candidate. For the ROC dataset, wealso provide the current ranking of the competition along withthe CPM values (see section VIII for details) that serves as thebasis for the ranking. In addition, we also calculated a partialAUC of the algorithms in the same range (between 1/8 and8) by normalizing the average false positive per image figureby dividing with the maximum (8) and applying trapezoidalintegration. The empirical AUC calculated this way is likelyto underestimate the true AUC. However, the uncertainty forthe partial AUCs may be quite high due to the low number ofimages.
B. DR gradingWe have also evaluated our ensemble-based approach to see
its grading performance to recognize DR. For this aim, wedetermined the image-level classification rate of the ensembleon the Messidor1 dataset containing 1200 images. That is, thepresence of any MA means that the image contains signs ofDR, while the absence of MAs indicates a healthy case. Inother words, a pure yes/no decision of the system has beentested.
1) Ensemble creation: As there is no training set providedfor the Messidor database, we used an independent dataset (theROC dataset) to train our algorithm. Note that, this is quitea strong handicap in comparison with the usual approach totrain on a part of the same database. However, we feel thatin this way we can get much closer to measure up the trueperformance of our system under real circumstances.
1Kindly provided by the Messidor program partners (seehttp://messidor.crihan.fr).
IEEE TRANSACTIONS ON BIOMEDICAL ENGINEERING 5
TABLE III⟨PREPROCESSING METHOD, CANDIDATE EXTRACTOR⟩ PAIRS SELECTED
AS MEMBERS OF THE ENSEMBLE FOR THE THREE DATASET. R, D, MDENOTE WHETHER THE PAIR IS SELECTED FOR THE ROC, DIARET2.1, OR
THE MOORFIELDS DATASET, RESPECTIVELY.
Walter Spencer Hough Lazar ZhangWalter-Klein M RCLAHE R, D M R DVessel Removal D R, D, M R, DIllumination eq. R, MNo preprocessing R M R, D R
2) Testing: We used the publicly available Messidordatabase for testing. This database consists of 1200 losslesslycompressed images with 45◦ FOV and different resolutions(440×960, 2240×1488 and 2304×1536). For each image, agrading score ranging from R0 to R3 is provided. These gradescorrespond to the following clinical conditions: a patient withan R0 grade has no DR. R1 and R2 are mild and severecases of non-proliferative retinopathy, respectively. Finally, R3is the most serious condition (proliferative retinopathy). Thegrading is based on the appearance of MAs, haemorrhagesand neovascularization. The proportion of the images in theMessidor dataset: 540 R0 (46%), 153 R1 (12.75%), 247 R2(20.58%) and 260 R3 (21.67%).
In our evaluation, we classified the retinal images whetherthey contain signs of DR (R1, R2, R3) or not (R0). TheMA detector classifies an image as diseased if at least oneMA was detected, and healthy otherwise. We measured thesensitivity, specificity and accuracy of the detector at differentlevels by thresholding the confidence values assigned to theMA candidates as described in section IV using the followingformulas:
sensitivity =tp
tp+ fn,
specificity =tn
tn+ fp,
andaccuracy =
tp+ tn
tp+ fn+ tn+ fp.
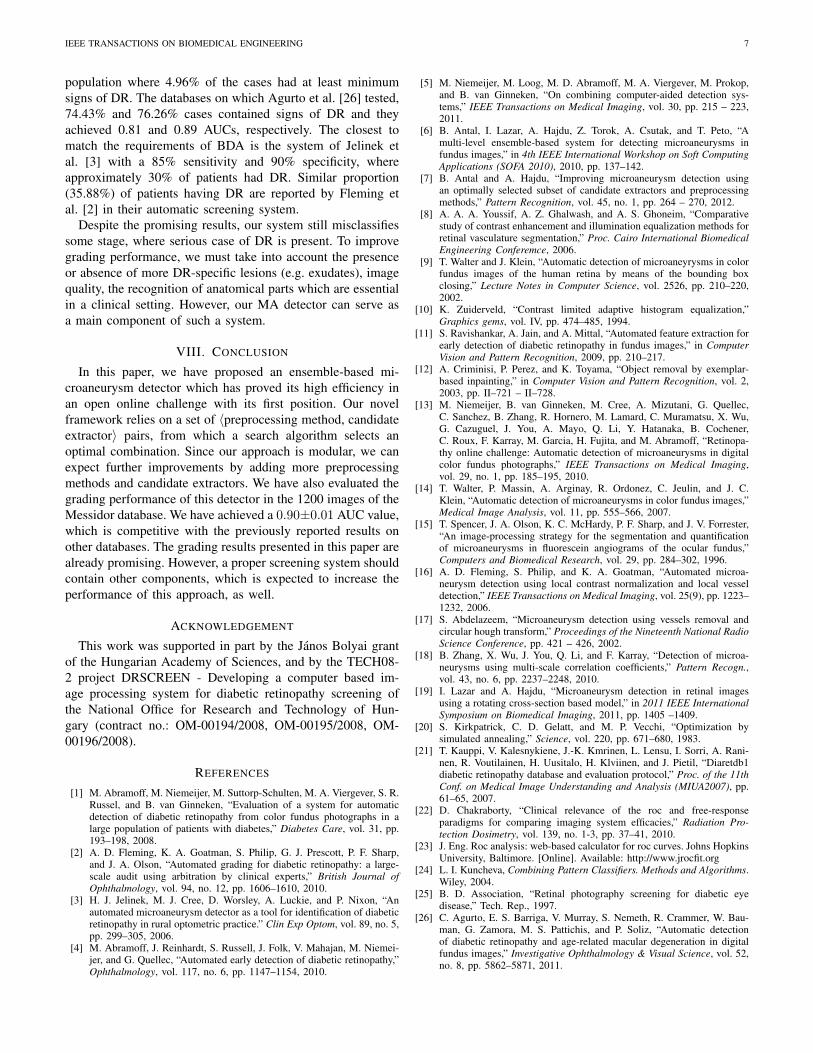
We also measured that the percentage of correctly recognizedcases for each grade. We provided a fitted Receiver OperatingCharacteristic (ROC) curve along with the empirical and fittedAUC for the proposed method on the Messidor database. Forcurve fitting, we used JROCFIT [23].
VI. RESULTS
In this section, we present our experimental results for bothMA detection and DR grading.
A. MA detection
In Table III, we exhibit the ⟨preprocessing method, candi-date extractor⟩ pairs included in the selected ensembles forthe three datasets, respectively. The rows of the table showthe preprocessing methods from section II, while the columnslabel the candidate extractor algorithms listed in section III.
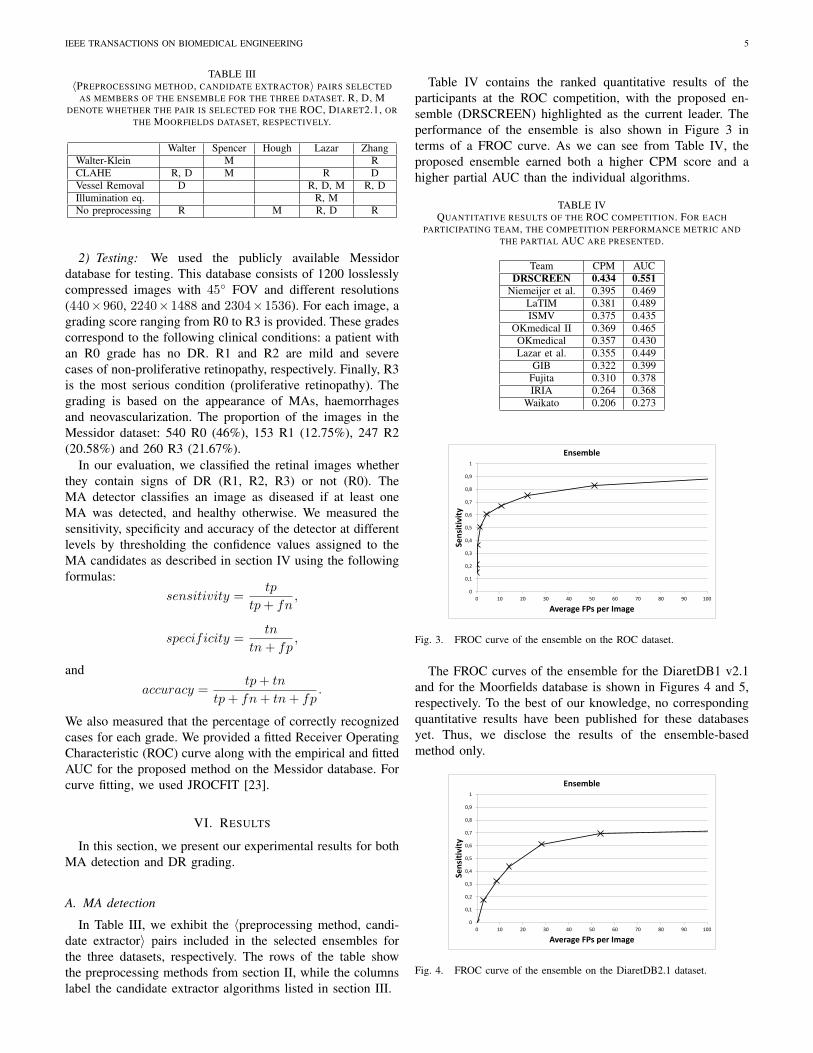
Table IV contains the ranked quantitative results of theparticipants at the ROC competition, with the proposed en-semble (DRSCREEN) highlighted as the current leader. Theperformance of the ensemble is also shown in Figure 3 interms of a FROC curve. As we can see from Table IV, theproposed ensemble earned both a higher CPM score and ahigher partial AUC than the individual algorithms.
TABLE IVQUANTITATIVE RESULTS OF THE ROC COMPETITION. FOR EACH
PARTICIPATING TEAM, THE COMPETITION PERFORMANCE METRIC ANDTHE PARTIAL AUC ARE PRESENTED.
Team CPM AUCDRSCREEN 0.434 0.551
Niemeijer et al. 0.395 0.469LaTIM 0.381 0.489ISMV 0.375 0.435
OKmedical II 0.369 0.465OKmedical 0.357 0.430Lazar et al. 0.355 0.449
GIB 0.322 0.399Fujita 0.310 0.378IRIA 0.264 0.368
Waikato 0.206 0.273
0
0,1
0,2
0,3
0,4
0,5
0,6
0,7
0,8
0,9
1
0 10 20 30 40 50 60 70 80 90 100
Se
nsi
tiv
ity
Average FPs per Image
Ensemble
Fig. 3. FROC curve of the ensemble on the ROC dataset.
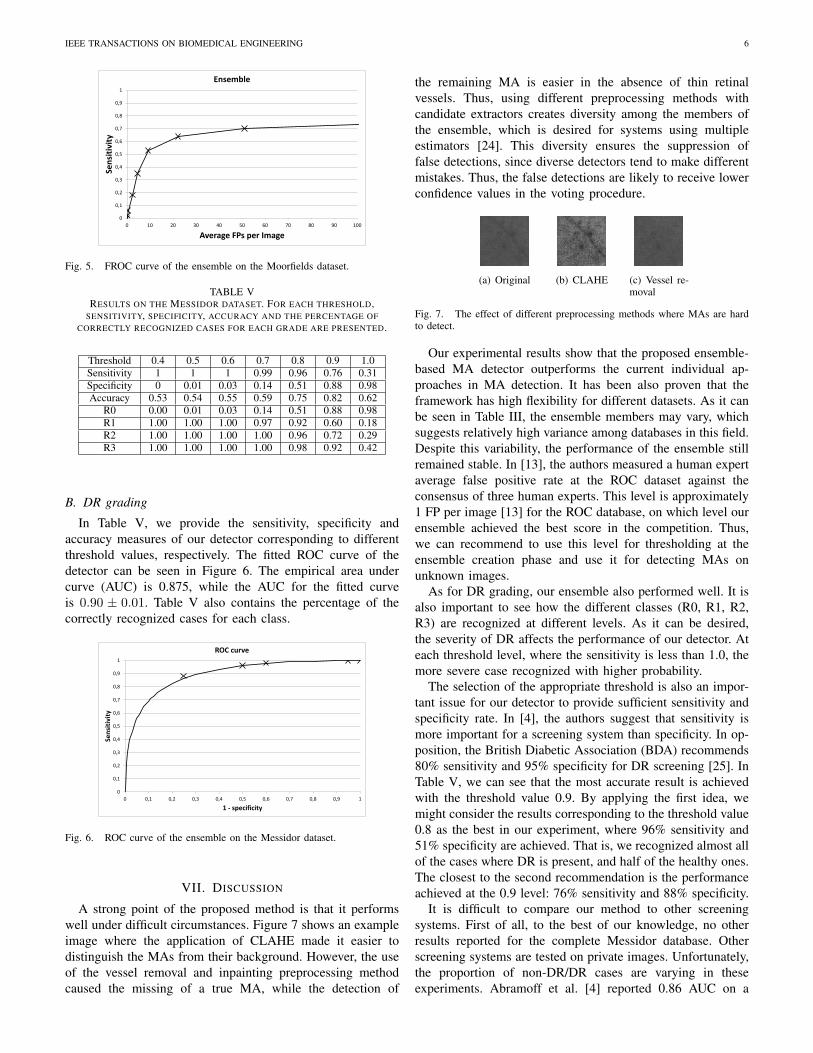
The FROC curves of the ensemble for the DiaretDB1 v2.1and for the Moorfields database is shown in Figures 4 and 5,respectively. To the best of our knowledge, no correspondingquantitative results have been published for these databasesyet. Thus, we disclose the results of the ensemble-basedmethod only.
0
0,1
0,2
0,3
0,4
0,5
0,6
0,7
0,8
0,9
1
0 10 20 30 40 50 60 70 80 90 100
Se
nsi
tiv
ity
Average FPs per Image
Ensemble
Fig. 4. FROC curve of the ensemble on the DiaretDB2.1 dataset.
IEEE TRANSACTIONS ON BIOMEDICAL ENGINEERING 6
0
0,1
0,2
0,3
0,4
0,5
0,6
0,7
0,8
0,9
1
0 10 20 30 40 50 60 70 80 90 100
Se
nsi
tiv
ity
Average FPs per Image
Ensemble
Fig. 5. FROC curve of the ensemble on the Moorfields dataset.
TABLE VRESULTS ON THE MESSIDOR DATASET. FOR EACH THRESHOLD,
SENSITIVITY, SPECIFICITY, ACCURACY AND THE PERCENTAGE OFCORRECTLY RECOGNIZED CASES FOR EACH GRADE ARE PRESENTED.
Threshold 0.4 0.5 0.6 0.7 0.8 0.9 1.0Sensitivity 1 1 1 0.99 0.96 0.76 0.31Specificity 0 0.01 0.03 0.14 0.51 0.88 0.98Accuracy 0.53 0.54 0.55 0.59 0.75 0.82 0.62
R0 0.00 0.01 0.03 0.14 0.51 0.88 0.98R1 1.00 1.00 1.00 0.97 0.92 0.60 0.18R2 1.00 1.00 1.00 1.00 0.96 0.72 0.29R3 1.00 1.00 1.00 1.00 0.98 0.92 0.42
B. DR grading
In Table V, we provide the sensitivity, specificity andaccuracy measures of our detector corresponding to differentthreshold values, respectively. The fitted ROC curve of thedetector can be seen in Figure 6. The empirical area undercurve (AUC) is 0.875, while the AUC for the fitted curveis 0.90 ± 0.01. Table V also contains the percentage of thecorrectly recognized cases for each class.
0
0,1
0,2
0,3
0,4
0,5
0,6
0,7
0,8
0,9
1
0 0,1 0,2 0,3 0,4 0,5 0,6 0,7 0,8 0,9 1
Se
nsi
tiv
ity
1 - specificity
ROC curve
Fig. 6. ROC curve of the ensemble on the Messidor dataset.
VII. DISCUSSION
A strong point of the proposed method is that it performswell under difficult circumstances. Figure 7 shows an exampleimage where the application of CLAHE made it easier todistinguish the MAs from their background. However, the useof the vessel removal and inpainting preprocessing methodcaused the missing of a true MA, while the detection of
the remaining MA is easier in the absence of thin retinalvessels. Thus, using different preprocessing methods withcandidate extractors creates diversity among the members ofthe ensemble, which is desired for systems using multipleestimators [24]. This diversity ensures the suppression offalse detections, since diverse detectors tend to make differentmistakes. Thus, the false detections are likely to receive lowerconfidence values in the voting procedure.
(a) Original (b) CLAHE (c) Vessel re-moval
Fig. 7. The effect of different preprocessing methods where MAs are hardto detect.
Our experimental results show that the proposed ensemble-based MA detector outperforms the current individual ap-proaches in MA detection. It has been also proven that theframework has high flexibility for different datasets. As it canbe seen in Table III, the ensemble members may vary, whichsuggests relatively high variance among databases in this field.Despite this variability, the performance of the ensemble stillremained stable. In [13], the authors measured a human expertaverage false positive rate at the ROC dataset against theconsensus of three human experts. This level is approximately1 FP per image [13] for the ROC database, on which level ourensemble achieved the best score in the competition. Thus,we can recommend to use this level for thresholding at theensemble creation phase and use it for detecting MAs onunknown images.
As for DR grading, our ensemble also performed well. It isalso important to see how the different classes (R0, R1, R2,R3) are recognized at different levels. As it can be desired,the severity of DR affects the performance of our detector. Ateach threshold level, where the sensitivity is less than 1.0, themore severe case recognized with higher probability.
The selection of the appropriate threshold is also an impor-tant issue for our detector to provide sufficient sensitivity andspecificity rate. In [4], the authors suggest that sensitivity ismore important for a screening system than specificity. In op-position, the British Diabetic Association (BDA) recommends80% sensitivity and 95% specificity for DR screening [25]. InTable V, we can see that the most accurate result is achievedwith the threshold value 0.9. By applying the first idea, wemight consider the results corresponding to the threshold value0.8 as the best in our experiment, where 96% sensitivity and51% specificity are achieved. That is, we recognized almost allof the cases where DR is present, and half of the healthy ones.The closest to the second recommendation is the performanceachieved at the 0.9 level: 76% sensitivity and 88% specificity.
It is difficult to compare our method to other screeningsystems. First of all, to the best of our knowledge, no otherresults reported for the complete Messidor database. Otherscreening systems are tested on private images. Unfortunately,the proportion of non-DR/DR cases are varying in theseexperiments. Abramoff et al. [4] reported 0.86 AUC on a
IEEE TRANSACTIONS ON BIOMEDICAL ENGINEERING 7
population where 4.96% of the cases had at least minimumsigns of DR. The databases on which Agurto et al. [26] tested,74.43% and 76.26% cases contained signs of DR and theyachieved 0.81 and 0.89 AUCs, respectively. The closest tomatch the requirements of BDA is the system of Jelinek etal. [3] with a 85% sensitivity and 90% specificity, whereapproximately 30% of patients had DR. Similar proportion(35.88%) of patients having DR are reported by Fleming etal. [2] in their automatic screening system.
Despite the promising results, our system still misclassifiessome stage, where serious case of DR is present. To improvegrading performance, we must take into account the presenceor absence of more DR-specific lesions (e.g. exudates), imagequality, the recognition of anatomical parts which are essentialin a clinical setting. However, our MA detector can serve asa main component of such a system.
VIII. CONCLUSION
In this paper, we have proposed an ensemble-based mi-croaneurysm detector which has proved its high efficiency inan open online challenge with its first position. Our novelframework relies on a set of ⟨preprocessing method, candidateextractor⟩ pairs, from which a search algorithm selects anoptimal combination. Since our approach is modular, we canexpect further improvements by adding more preprocessingmethods and candidate extractors. We have also evaluated thegrading performance of this detector in the 1200 images of theMessidor database. We have achieved a 0.90±0.01 AUC value,which is competitive with the previously reported results onother databases. The grading results presented in this paper arealready promising. However, a proper screening system shouldcontain other components, which is expected to increase theperformance of this approach, as well.
ACKNOWLEDGEMENT
This work was supported in part by the Janos Bolyai grantof the Hungarian Academy of Sciences, and by the TECH08-2 project DRSCREEN - Developing a computer based im-age processing system for diabetic retinopathy screening ofthe National Office for Research and Technology of Hun-gary (contract no.: OM-00194/2008, OM-00195/2008, OM-00196/2008).
REFERENCES
[1] M. Abramoff, M. Niemeijer, M. Suttorp-Schulten, M. A. Viergever, S. R.Russel, and B. van Ginneken, “Evaluation of a system for automaticdetection of diabetic retinopathy from color fundus photographs in alarge population of patients with diabetes,” Diabetes Care, vol. 31, pp.193–198, 2008.
[2] A. D. Fleming, K. A. Goatman, S. Philip, G. J. Prescott, P. F. Sharp,and J. A. Olson, “Automated grading for diabetic retinopathy: a large-scale audit using arbitration by clinical experts,” British Journal ofOphthalmology, vol. 94, no. 12, pp. 1606–1610, 2010.
[3] H. J. Jelinek, M. J. Cree, D. Worsley, A. Luckie, and P. Nixon, “Anautomated microaneurysm detector as a tool for identification of diabeticretinopathy in rural optometric practice.” Clin Exp Optom, vol. 89, no. 5,pp. 299–305, 2006.
[4] M. Abramoff, J. Reinhardt, S. Russell, J. Folk, V. Mahajan, M. Niemei-jer, and G. Quellec, “Automated early detection of diabetic retinopathy,”Ophthalmology, vol. 117, no. 6, pp. 1147–1154, 2010.
[5] M. Niemeijer, M. Loog, M. D. Abramoff, M. A. Viergever, M. Prokop,and B. van Ginneken, “On combining computer-aided detection sys-tems,” IEEE Transactions on Medical Imaging, vol. 30, pp. 215 – 223,2011.
[6] B. Antal, I. Lazar, A. Hajdu, Z. Torok, A. Csutak, and T. Peto, “Amulti-level ensemble-based system for detecting microaneurysms infundus images,” in 4th IEEE International Workshop on Soft ComputingApplications (SOFA 2010), 2010, pp. 137–142.
[7] B. Antal and A. Hajdu, “Improving microaneurysm detection usingan optimally selected subset of candidate extractors and preprocessingmethods,” Pattern Recognition, vol. 45, no. 1, pp. 264 – 270, 2012.
[8] A. A. A. Youssif, A. Z. Ghalwash, and A. S. Ghoneim, “Comparativestudy of contrast enhancement and illumination equalization methods forretinal vasculature segmentation,” Proc. Cairo International BiomedicalEngineering Conferemce, 2006.
[9] T. Walter and J. Klein, “Automatic detection of microaneyrysms in colorfundus images of the human retina by means of the bounding boxclosing,” Lecture Notes in Computer Science, vol. 2526, pp. 210–220,2002.
[10] K. Zuiderveld, “Contrast limited adaptive histogram equalization,”Graphics gems, vol. IV, pp. 474–485, 1994.
[11] S. Ravishankar, A. Jain, and A. Mittal, “Automated feature extraction forearly detection of diabetic retinopathy in fundus images,” in ComputerVision and Pattern Recognition, 2009, pp. 210–217.
[12] A. Criminisi, P. Perez, and K. Toyama, “Object removal by exemplar-based inpainting,” in Computer Vision and Pattern Recognition, vol. 2,2003, pp. II–721 – II–728.
[13] M. Niemeijer, B. van Ginneken, M. Cree, A. Mizutani, G. Quellec,C. Sanchez, B. Zhang, R. Hornero, M. Lamard, C. Muramatsu, X. Wu,G. Cazuguel, J. You, A. Mayo, Q. Li, Y. Hatanaka, B. Cochener,C. Roux, F. Karray, M. Garcia, H. Fujita, and M. Abramoff, “Retinopa-thy online challenge: Automatic detection of microaneurysms in digitalcolor fundus photographs,” IEEE Transactions on Medical Imaging,vol. 29, no. 1, pp. 185–195, 2010.
[14] T. Walter, P. Massin, A. Arginay, R. Ordonez, C. Jeulin, and J. C.Klein, “Automatic detection of microaneurysms in color fundus images,”Medical Image Analysis, vol. 11, pp. 555–566, 2007.
[15] T. Spencer, J. A. Olson, K. C. McHardy, P. F. Sharp, and J. V. Forrester,“An image-processing strategy for the segmentation and quantificationof microaneurysms in fluorescein angiograms of the ocular fundus,”Computers and Biomedical Research, vol. 29, pp. 284–302, 1996.
[16] A. D. Fleming, S. Philip, and K. A. Goatman, “Automated microa-neurysm detection using local contrast normalization and local vesseldetection,” IEEE Transactions on Medical Imaging, vol. 25(9), pp. 1223–1232, 2006.
[17] S. Abdelazeem, “Microaneurysm detection using vessels removal andcircular hough transform,” Proceedings of the Nineteenth National RadioScience Conference, pp. 421 – 426, 2002.
[18] B. Zhang, X. Wu, J. You, Q. Li, and F. Karray, “Detection of microa-neurysms using multi-scale correlation coefficients,” Pattern Recogn.,vol. 43, no. 6, pp. 2237–2248, 2010.
[19] I. Lazar and A. Hajdu, “Microaneurysm detection in retinal imagesusing a rotating cross-section based model,” in 2011 IEEE InternationalSymposium on Biomedical Imaging, 2011, pp. 1405 –1409.
[20] S. Kirkpatrick, C. D. Gelatt, and M. P. Vecchi, “Optimization bysimulated annealing,” Science, vol. 220, pp. 671–680, 1983.
[21] T. Kauppi, V. Kalesnykiene, J.-K. Kmrinen, L. Lensu, I. Sorri, A. Rani-nen, R. Voutilainen, H. Uusitalo, H. Klviinen, and J. Pietil, “Diaretdb1diabetic retinopathy database and evaluation protocol,” Proc. of the 11thConf. on Medical Image Understanding and Analysis (MIUA2007), pp.61–65, 2007.
[22] D. Chakraborty, “Clinical relevance of the roc and free-responseparadigms for comparing imaging system efficacies,” Radiation Pro-tection Dosimetry, vol. 139, no. 1-3, pp. 37–41, 2010.
[23] J. Eng. Roc analysis: web-based calculator for roc curves. Johns HopkinsUniversity, Baltimore. [Online]. Available: http://www.jrocfit.org
[24] L. I. Kuncheva, Combining Pattern Classifiers. Methods and Algorithms.Wiley, 2004.
[25] B. D. Association, “Retinal photography screening for diabetic eyedisease,” Tech. Rep., 1997.
[26] C. Agurto, E. S. Barriga, V. Murray, S. Nemeth, R. Crammer, W. Bau-man, G. Zamora, M. S. Pattichis, and P. Soliz, “Automatic detectionof diabetic retinopathy and age-related macular degeneration in digitalfundus images,” Investigative Ophthalmology & Visual Science, vol. 52,no. 8, pp. 5862–5871, 2011.
Copyright © 2022 FDOKUMEN