Dynamical modeling of microRNA action on the protein translation process
24
RESEARCH ARTICLE Open Access Dynamical modeling of microRNA action on the protein translation process Andrei Zinovyev 1,2,3*† , Nadya Morozova 4† , Nora Nonne 4 , Emmanuel Barillot 1,2,3 , Annick Harel-Bellan 4 , Alexander N Gorban 5,6 Abstract Background: Protein translation is a multistep process which can be represented as a cascade of biochemical reactions (initiation, ribosome assembly, elongation, etc.), the rate of which can be regulated by small non-coding microRNAs through multiple mechanisms. It remains unclear what mechanisms of microRNA action are the most dominant: moreover, many experimental reports deliver controversial messages on what is the concrete mechanism actually observed in the experiment. Nissan and Parker have recently demonstrated that it might be impossible to distinguish alternative biological hypotheses using the steady state data on the rate of protein synthesis. For their analysis they used two simple kinetic models of protein translation. Results: In contrary to the study by Nissan and Parker, we show that dynamical data allow discriminating some of the mechanisms of microRNA action. We demonstrate this using the same models as developed by Nissan and Parker for the sake of comparison but the methods developed (asymptotology of biochemical networks) can be used for other models. We formulate a hypothesis that the effect of microRNA action is measurable and observable only if it affects the dominant system (generalization of the limiting step notion for complex networks) of the protein translation machinery. The dominant system can vary in different experimental conditions that can partially explain the existing controversy of some of the experimental data. Conclusions: Our analysis of the transient protein translation dynamics shows that it gives enough information to verify or reject a hypothesis about a particular molecular mechanism of microRNA action on protein translation. For multiscale systems only that action of microRNA is distinguishable which affects the parameters of dominant system (critical parameters), or changes the dominant system itself. Dominant systems generalize and further develop the old and very popular idea of limiting step. Algorithms for identifying dominant systems in multiscale kinetic models are straightforward but not trivial and depend only on the ordering of the model parameters but not on their concrete values. Asymptotic approach to kinetic models allows putting in order diverse experimental observations in complex situations when many alternative hypotheses co-exist. Background MicroRNAs (miRNAs) are currently considered as key regulators of a wide variety of biological pathways, including development, differentiation and oncogenesis. Recently, remarkable progress was made in understand- ing of microRNA biogenesis, functions and mechanisms of action. Mature microRNAs are incorporated into the RISC effector complex, which includes as a key compo- nent an Argonaute protein. MicroRNAs affect gene expression by guiding the RISC complex toward specific target mRNAs. The exact mechanism of this inhibition is still a matter of debate. In the past few years, several mechanisms have been reported, and some of the reports contradict to each other (for review, see [1-3]). The inhibition mechanisms include, in particular, the inhibition of translation initiation (acting at the level of cap-40S or 40S-AUG-60S association steps), the inhibi- tion of translation elongation and the premature transla- tion termination. MicroRNA-mediated mRNA decay and sequestration of target mRNAs in P-bodies have been also proposed. Moreover, some microRNAs med- iate target mRNA cleavage [4], chromatin reorganization * Correspondence: [email protected] † Contributed equally 1 Institut Curie, Bioinformatics and Computational Systems Biology Of Cancer, Paris, France Zinovyev et al. BMC Systems Biology 2010, 4:13 http://www.biomedcentral.com/1752-0509/4/13 © 2010 Zinovyev et al; licensee BioMed Central Ltd. This is an Open Access article distributed under the terms of the Creative Commons Attribution License (http://creativecommons.org/licenses/by/2.0), which permits unrestricted use, distribution, and reproduction in any medium, provided the original work is properly cited.
Transcript of Dynamical modeling of microRNA action on the protein translation process
RESEARCH ARTICLE Open Access
Dynamical modeling of microRNA action on theprotein translation processAndrei Zinovyev1,2,3*†, Nadya Morozova4†, Nora Nonne4, Emmanuel Barillot1,2,3, Annick Harel-Bellan4,Alexander N Gorban5,6
Abstract
Background: Protein translation is a multistep process which can be represented as a cascade of biochemicalreactions (initiation, ribosome assembly, elongation, etc.), the rate of which can be regulated by small non-codingmicroRNAs through multiple mechanisms. It remains unclear what mechanisms of microRNA action are the mostdominant: moreover, many experimental reports deliver controversial messages on what is the concretemechanism actually observed in the experiment. Nissan and Parker have recently demonstrated that it might beimpossible to distinguish alternative biological hypotheses using the steady state data on the rate of proteinsynthesis. For their analysis they used two simple kinetic models of protein translation.
Results: In contrary to the study by Nissan and Parker, we show that dynamical data allow discriminating some ofthe mechanisms of microRNA action. We demonstrate this using the same models as developed by Nissan andParker for the sake of comparison but the methods developed (asymptotology of biochemical networks) can beused for other models. We formulate a hypothesis that the effect of microRNA action is measurable andobservable only if it affects the dominant system (generalization of the limiting step notion for complex networks)of the protein translation machinery. The dominant system can vary in different experimental conditions that canpartially explain the existing controversy of some of the experimental data.
Conclusions: Our analysis of the transient protein translation dynamics shows that it gives enough information toverify or reject a hypothesis about a particular molecular mechanism of microRNA action on protein translation. Formultiscale systems only that action of microRNA is distinguishable which affects the parameters of dominantsystem (critical parameters), or changes the dominant system itself. Dominant systems generalize and furtherdevelop the old and very popular idea of limiting step. Algorithms for identifying dominant systems in multiscalekinetic models are straightforward but not trivial and depend only on the ordering of the model parameters butnot on their concrete values. Asymptotic approach to kinetic models allows putting in order diverse experimentalobservations in complex situations when many alternative hypotheses co-exist.
BackgroundMicroRNAs (miRNAs) are currently considered as keyregulators of a wide variety of biological pathways,including development, differentiation and oncogenesis.Recently, remarkable progress was made in understand-ing of microRNA biogenesis, functions and mechanismsof action. Mature microRNAs are incorporated into theRISC effector complex, which includes as a key compo-nent an Argonaute protein. MicroRNAs affect gene
expression by guiding the RISC complex toward specifictarget mRNAs. The exact mechanism of this inhibitionis still a matter of debate. In the past few years, severalmechanisms have been reported, and some of thereports contradict to each other (for review, see [1-3]).The inhibition mechanisms include, in particular, theinhibition of translation initiation (acting at the level ofcap-40S or 40S-AUG-60S association steps), the inhibi-tion of translation elongation and the premature transla-tion termination. MicroRNA-mediated mRNA decayand sequestration of target mRNAs in P-bodies havebeen also proposed. Moreover, some microRNAs med-iate target mRNA cleavage [4], chromatin reorganization
* Correspondence: [email protected]† Contributed equally1Institut Curie, Bioinformatics and Computational Systems Biology Of Cancer,Paris, France
Zinovyev et al. BMC Systems Biology 2010, 4:13http://www.biomedcentral.com/1752-0509/4/13
© 2010 Zinovyev et al; licensee BioMed Central Ltd. This is an Open Access article distributed under the terms of the CreativeCommons Attribution License (http://creativecommons.org/licenses/by/2.0), which permits unrestricted use, distribution, andreproduction in any medium, provided the original work is properly cited.
followed by transcriptional repression or activation [5,6],or translational activation [7,8].The most frequently reported, but also much debated,
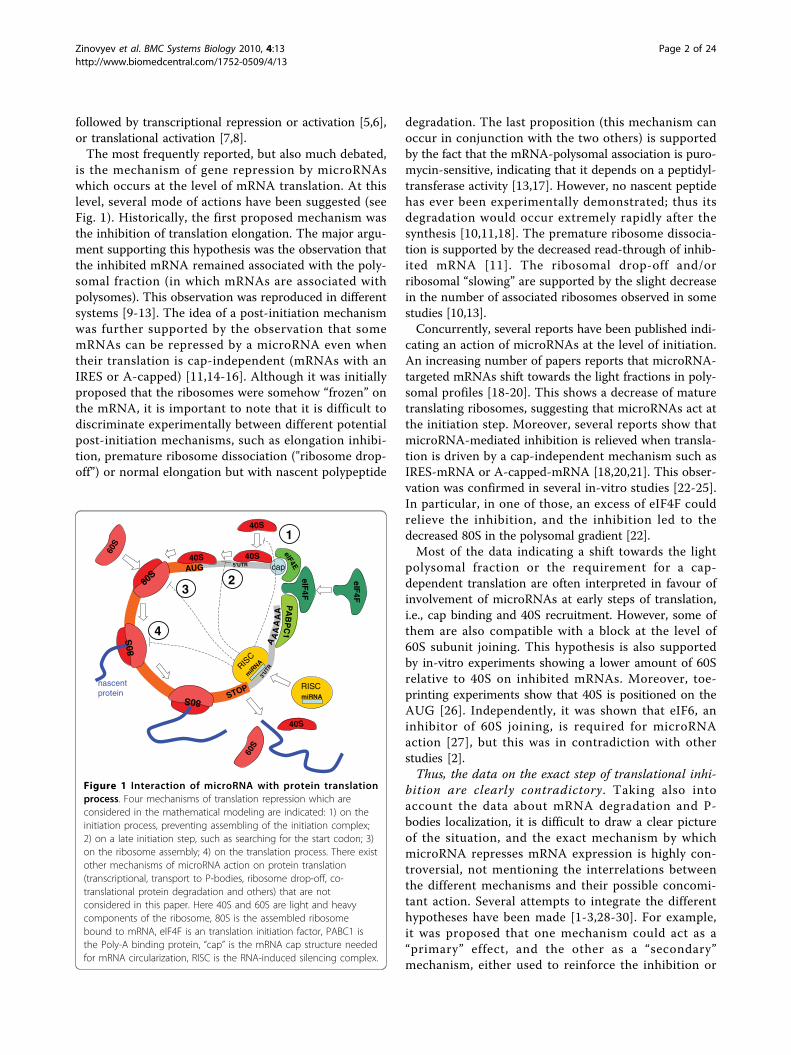
is the mechanism of gene repression by microRNAswhich occurs at the level of mRNA translation. At thislevel, several mode of actions have been suggested (seeFig. 1). Historically, the first proposed mechanism wasthe inhibition of translation elongation. The major argu-ment supporting this hypothesis was the observation thatthe inhibited mRNA remained associated with the poly-somal fraction (in which mRNAs are associated withpolysomes). This observation was reproduced in differentsystems [9-13]. The idea of a post-initiation mechanismwas further supported by the observation that somemRNAs can be repressed by a microRNA even whentheir translation is cap-independent (mRNAs with anIRES or A-capped) [11,14-16]. Although it was initiallyproposed that the ribosomes were somehow “frozen” onthe mRNA, it is important to note that it is difficult todiscriminate experimentally between different potentialpost-initiation mechanisms, such as elongation inhibi-tion, premature ribosome dissociation ("ribosome drop-off”) or normal elongation but with nascent polypeptide
degradation. The last proposition (this mechanism canoccur in conjunction with the two others) is supportedby the fact that the mRNA-polysomal association is puro-mycin-sensitive, indicating that it depends on a peptidyl-transferase activity [13,17]. However, no nascent peptidehas ever been experimentally demonstrated; thus itsdegradation would occur extremely rapidly after thesynthesis [10,11,18]. The premature ribosome dissocia-tion is supported by the decreased read-through of inhib-ited mRNA [11]. The ribosomal drop-off and/orribosomal “slowing” are supported by the slight decreasein the number of associated ribosomes observed in somestudies [10,13].Concurrently, several reports have been published indi-
cating an action of microRNAs at the level of initiation.An increasing number of papers reports that microRNA-targeted mRNAs shift towards the light fractions in poly-somal profiles [18-20]. This shows a decrease of maturetranslating ribosomes, suggesting that microRNAs act atthe initiation step. Moreover, several reports show thatmicroRNA-mediated inhibition is relieved when transla-tion is driven by a cap-independent mechanism such asIRES-mRNA or A-capped-mRNA [18,20,21]. This obser-vation was confirmed in several in-vitro studies [22-25].In particular, in one of those, an excess of eIF4F couldrelieve the inhibition, and the inhibition led to thedecreased 80S in the polysomal gradient [22].Most of the data indicating a shift towards the light
polysomal fraction or the requirement for a cap-dependent translation are often interpreted in favour ofinvolvement of microRNAs at early steps of translation,i.e., cap binding and 40S recruitment. However, some ofthem are also compatible with a block at the level of60S subunit joining. This hypothesis is also supportedby in-vitro experiments showing a lower amount of 60Srelative to 40S on inhibited mRNAs. Moreover, toe-printing experiments show that 40S is positioned on theAUG [26]. Independently, it was shown that eIF6, aninhibitor of 60S joining, is required for microRNAaction [27], but this was in contradiction with otherstudies [2].Thus, the data on the exact step of translational inhi-
bition are clearly contradictory . Taking also intoaccount the data about mRNA degradation and P-bodies localization, it is difficult to draw a clear pictureof the situation, and the exact mechanism by whichmicroRNA represses mRNA expression is highly con-troversial, not mentioning the interrelations betweenthe different mechanisms and their possible concomi-tant action. Several attempts to integrate the differenthypotheses have been made [1-3,28-30]. For example,it was proposed that one mechanism could act as a“primary” effect, and the other as a “secondary”mechanism, either used to reinforce the inhibition or
miR
NA
AUG cap
AA
AA
AA
40S
60S
40S40S
eIF4F
eIF4F
miRNA
RISC
RISC
80S
80S
80S
PA
BP
C1
eIF4E
60S
40S
1
23
4
STOP
5’UTR
3’UTR
nascentprotein
Figure 1 Interaction of microRNA with protein translationprocess. Four mechanisms of translation repression which areconsidered in the mathematical modeling are indicated: 1) on theinitiation process, preventing assembling of the initiation complex;2) on a late initiation step, such as searching for the start codon; 3)on the ribosome assembly; 4) on the translation process. There existother mechanisms of microRNA action on protein translation(transcriptional, transport to P-bodies, ribosome drop-off, co-translational protein degradation and others) that are notconsidered in this paper. Here 40S and 60S are light and heavycomponents of the ribosome, 80S is the assembled ribosomebound to mRNA, eIF4F is an translation initiation factor, PABC1 isthe Poly-A binding protein, “cap” is the mRNA cap structure neededfor mRNA circularization, RISC is the RNA-induced silencing complex.
Zinovyev et al. BMC Systems Biology 2010, 4:13http://www.biomedcentral.com/1752-0509/4/13
Page 2 of 24
as a back-up mechanism. In others, the differentmechanisms could all coexist, but occur differentiallydepending on some yet unidentified characteristics. Forexample, it has been observed than the same mRNAtargeted by the same microRNA can be regulatedeither at the initiation or the elongation step depend-ing on the mRNA promoter and thus on the mRNAnuclear history [31]. It was also proposed that techni-cal (experimental) problems, including the variety ofexperimental systems used, may also account for thesediscrepancies [1-3]. However, this possibility does notseem to be sufficient to provide a simple and convin-cing explanation to the reported discrepancies.A possible solution to exploit the experimental obser-
vations and to provide a rational and straightforwarddata interpretation is the use of mathematical modelsfor microRNA action on protein translation. For manyyears, the process of protein synthesis is a subject ofmathematical modeling with use of various approachesfrom chemical kinetics and theoretical physics. Many ofthe models created consider several stages of translation,however, most of them concentrate on the elongationand termination processes. In [32-34], a non-equilibriumstatistical physics description of protein synthesis wasproposed. Models taking into account gene sequencewere developed in [33,35-37]. These models can predictthe probability of that a ribosome will completely termi-nate a transcript, spatio-temporal organization ofribosomes in polysome, dependence of the proteinsynthesis rate on various factors, such as presence ofslow synonymous codons in the gene sequence [33,37]and the frequency of non-sense errors [35]. Severalmodels of the effect of microRNA on protein translationwere proposed. Thus, in [38] the authors tried to deter-mine which inhibition mechanism (via translationrepression or transcript degradation) is the most abun-dant in mammalian cells using Bayesian modeling andmicroarray data. Quantitative features of sRNA-mediated gene regulation were considered in [39]. Asimple kinetic model of microRNA-mediated mRNAdegradation was proposed in [40] and compared to atemporal microarray dataset.In this paper we will analyze two simple models of
microRNA action on protein translation developedrecently by Nissan and Parker [41]. They studied themicroRNA-dependent steady states rates of proteinsynthesis [41] and provided a critical analysis for theexperiments with alternative mRNA cap structures andIRES elements [22,23,25]. This analysis led to a possibleexplanation of the conflicting results. The authors sug-gested that the relief of translational repression uponreplacement of the cap structure can be explained ifmicroRNA is acting on a step which is not rate-limitingin the modified system, in which case, the effect of
microRNA can simply not be observed. It was claimedthat it is impossible to discriminate between two alter-native interpretations of the biological experiments withcap structure replacement, using sole monitoring of thesteady state level of protein synthesis [41].Two remarks can be made in this regard. Firstly, in
practice not only the steady state level of protein can beobserved but also other dynamical characteristics, suchas the relaxation time, i.e. the time needed to achievethe steady state rate after a perturbation (such asrestarting the translation process). We argue that havingthese measurements in hands, one can distinguishbetween two alternative interpretations. In this paper weprovide such a method from the same models as con-structed by Nissan and Parker, for comparison purposes.However, the method applied can be easily generalizedfor other models.Secondly, even in the simple non-linear model of pro-
tein translation, taking into account the recycling ofribosomal components, it is difficult to define what isthe rate limiting step. It is known from the theory ofasymptotology of biochemical networks [42] that evenin complex linear systems the “rate limiting place”notion is not trivial and cannot be reduced to a singlereaction step. Moreover, in non-linear systems the “ratelimiting place” can change with time and depend on theinitial conditions. Hence, conclusions of [41] should bere-considered for the non-linear model, made more pre-cise and general. The notion of rate limiting step shouldbe replaced by the notion of dominant system.In this paper we perform careful analysis of the Nissan
and Parker’s models and provide their approximate ana-lytical solutions, which allows us to generalize theconclusions of [41] and make new checkable predictionson the identifiability of active mechanism of microRNA-dependent protein translation inhibition.The paper is organized in the following way. The
Methods contain introduction, all necessary definitionsand basic results of the asymptotology of biochemicalreaction networks (quasiequilibrium, quasi steady-state,limiting step and dominant system asymptotics), usedfurther in the Results. The Methods section is deliber-ately made rather detailed to make the reading self-sufficient. These details are necessary for reproducingthe analytical calculations but not for understanding theinterpretation of the modeling results. When the mostimportant notions are introduced (such as dominantsystem, critical parameters), they are emphasized inbold. The Results section starts with listing modelassumptions, followed by deriving semi-analytical solu-tions of Nissan and Parker’s model and interpretation ofthe analysis results and prediction formulations. Forthose readers who are interested only in the appliedaspect of this work, it is possible to skip the details of
Zinovyev et al. BMC Systems Biology 2010, 4:13http://www.biomedcentral.com/1752-0509/4/13
Page 3 of 24
deriving the analytical solutions and start reading fromthe “Model assumptions” section, look at the definitionof the model parameters and variables and continuewith ‘the ‘Effect of microRNA on the translationdynamics” section.
ResultsModel assumptionsWe consider two models of action of microRNA onprotein translation process proposed in [41]: the sim-plest linear model, and the non-linear model whichexplicitly takes into account recycling of ribosomal sub-units and initiation factors.Both models, of course, are significant simplifications
of biological reality. Firstly, only a limited subset of allpossible mechanisms of microRNA action on thetranslation process is considered (see Fig. 1). Secondly,all processes of synthesis and degradation of mRNAand microRNA are deliberately neglected. Thirdly,interaction of microRNA and mRNA is simplified: it issupposed that when microRNA is added to the experi-mental system then only mRNA with bound micro-RNAs are present (this also assumes that theconcentration of microRNA is abundant with respectto mRNA). Concentrations of microRNA and mRNAare supposed to be constant. Interaction of only onetype of microRNA and one type of mRNA is consid-ered (not a mix of several microRNAs). The process ofinitiation is greatly simplified: all initiation factors arerepresented by only one molecule which is marked aseIF4F.Finally, the classical chemical kinetics approach is
applied, based on solutions of ordinary differential
equations, which supposes sufficient and well-stirredamount of both microRNAs and mRNAs. Anotherassumption in the modeling is the mass action lawassumed for the reaction kinetic rates.It is important to underline the interpretation of cer-
tain chemical species considered in the system. The ribo-somal subunits and the initiation factors in the modelexist in free and bound forms, moreover, the ribosomalsubunits can be bound to several regions of mRNA (theinitiation site, the start codon, the coding part). Impor-tantly, several copies of fully assembled ribosome can bebound to one mRNA. To model this situation, we haveto introduce the following quantification rule for chemi-cal species: amount of “ribosome bound to mRNA”means the total number of ribosomes translating pro-teins, which is not equal to the number of mRNAs withribosome sitting on them, since one mRNA can hold sev-eral translating ribosomes (polyribosome). In this view,mRNAs act as places or catalyzers, where translationtakes place, whereas mRNA itself formally is not con-sumed in the process of translation, but, of course, canbe degraded or synthesized (which is, however, not con-sidered in the models described further).
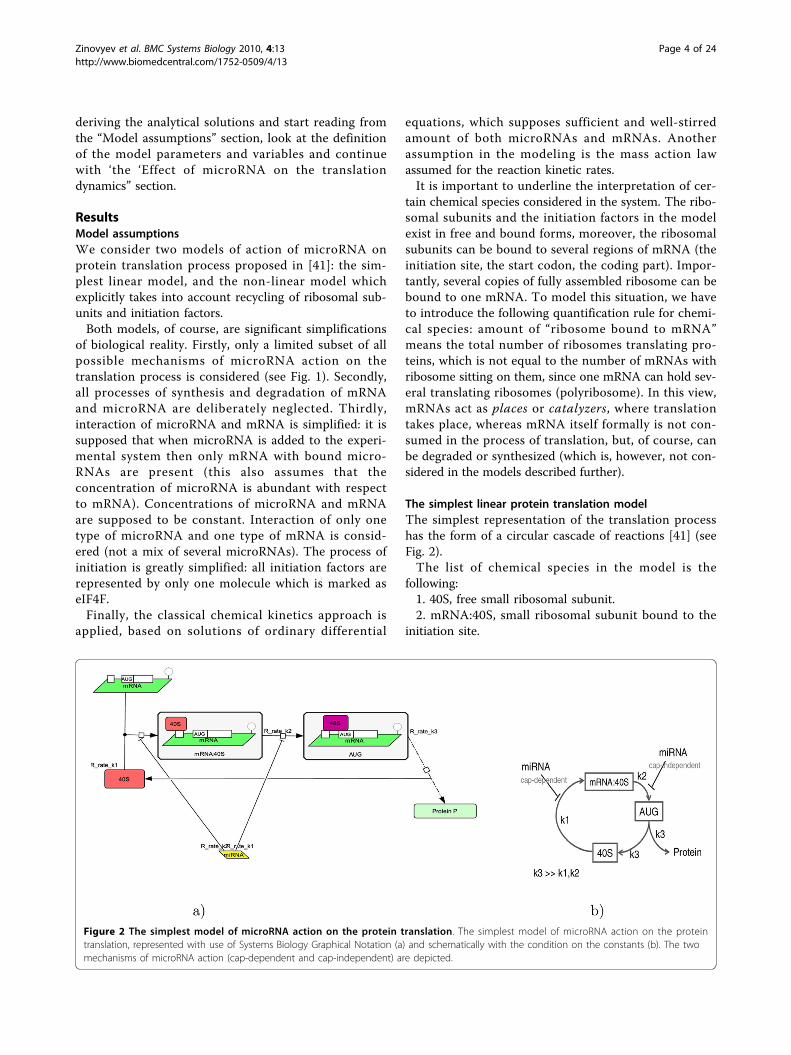
The simplest linear protein translation modelThe simplest representation of the translation processhas the form of a circular cascade of reactions [41] (seeFig. 2).The list of chemical species in the model is the
following:1. 40S, free small ribosomal subunit.2. mRNA:40S, small ribosomal subunit bound to the
initiation site.
Figure 2 The simplest model of microRNA action on the protein translation. The simplest model of microRNA action on the proteintranslation, represented with use of Systems Biology Graphical Notation (a) and schematically with the condition on the constants (b). The twomechanisms of microRNA action (cap-dependent and cap-independent) are depicted.
Zinovyev et al. BMC Systems Biology 2010, 4:13http://www.biomedcentral.com/1752-0509/4/13
Page 4 of 24
3. AUG, small ribosomal subunit bound to the startcodon.The catalytic cycle is formed by the following
reactions:1. 40S ® mRNA:40S, Initiation complex assembly
(rate k1).2. mRNA:40S ® AUG, Some late and cap-indepen-
dent initiation steps, such as scanning the 5’UTR for thestart AUG codon recognition (rate k2) and 60S riboso-mal unit joining.3. AUG ® 40S, combined processes of protein elonga-
tion and termination, which leads to production of theprotein (rate k3), and fall off of the ribosome from mRNA.The model is described by the following system of
equations [41]:
d S tdt
k S k AUG
d mRNA S tdt
k S k mR
[ ]( )[ ] [ ]
[ : ]( )[ ] [
4040
4040
1 3
1 2
NNA S
d AUG tdt
k mRNA S k AUG
Prsynth t k AUG
: ]
[ ]( )[ : ] [ ]
( ) [ ]
40
402 3
3
(( )t
(1)
where Prsynth(t) is the rate of protein synthesis.Following [41], let us assume that k3 >>k1, k2. This
choice was justified by the following statement: “...Thesubunit joining and protein production rate (k3) is fasterthan k1 and k2 since mRNA:40S complexes bound tothe AUG without the 60S subunit are generally notobserved in translation initiation unless this step isstalled by experimental methods, and elongation is gen-erally thought to not be rate limiting in protein synth-esis...” [41].Under this condition, the equations (1) have the fol-
lowing approximate solution (which becomes the more
exact the smaller the k kk
1 23
ratio):
[ ]( )
[ : ]( )
[ ]( )
[ ]/40
4040 01
1
1
2
1
11S t
mRNA S t
AUG t
S
k k
k
//
/
k
k
ke
kk t
2
31
1
3
1
1
0
1
2
0
1
1
3
e k k t( )1 2
(2)
Prsynth tS
k k
kk
e k k t( )[ ] ( )
40 0
1
1
1
2
1 32
1 2
(3)
for the initial condition
[ ]
[ : ]
[ ]
[ ]40
40
40
0
0
00
0S
mRNA S
AUG
Prsynth
S
. (4)
From the solution (2) it follows that the dynamics ofthe system evolves on two time scales: 1) fast elongationdynamics on the time scale ≈ 1/k3; and 2) relatively slowtranslation initiation dynamics with the relaxation time
t rel k k 1
1 2. The protein synthesis rate formula (3)
does not include the k3 rate, since it is neglected withrespect to k1, k2 values. From (3) we can extract the for-mula for the protein synthesis steady-state rate Prsynth(multiplier before the parentheses) and the relaxationtime trel for it (inverse of the exponent power):
PrsynthS
k k
tk krel
[ ]
,40 01
1
1
2
1
1 2 (5)
Now let us consider two experimental situations: 1)the rates of the two translation initiation steps are com-parable k1 ≈ k2; 2) the cap-dependent rate k1 is limiting:k1 <<k2. Accordingly to [41], the second situation cancorrespond to modified mRNA with an alternative cap-structure, which is much less efficient for the assemblyof the initiation factors, 40S ribosomal subunit andpolyA binding proteins.For these two experimental systems (let us call them
“wild-type” and “modified” correspondingly), let us studythe effect of microRNA action. We will model themicroRNA action by diminishing the value of a kineticrate coefficient for the reaction representing the step onwhich the microRNA is acting. Let us assume that thereare two alternative mechanisms: 1) microRNA acts in acap-dependent manner (thus, reducing the k1 constant)and 2) microRNA acts in a cap-independent manner,for example, through interfering with 60S subunit join-ing (thus, reducing the k2 constant). The dependence of
the steady rate of protein synthesis Prsynthk k
~ 111
12
and the relaxation time t rel k k 1
1 2on the efficiency of
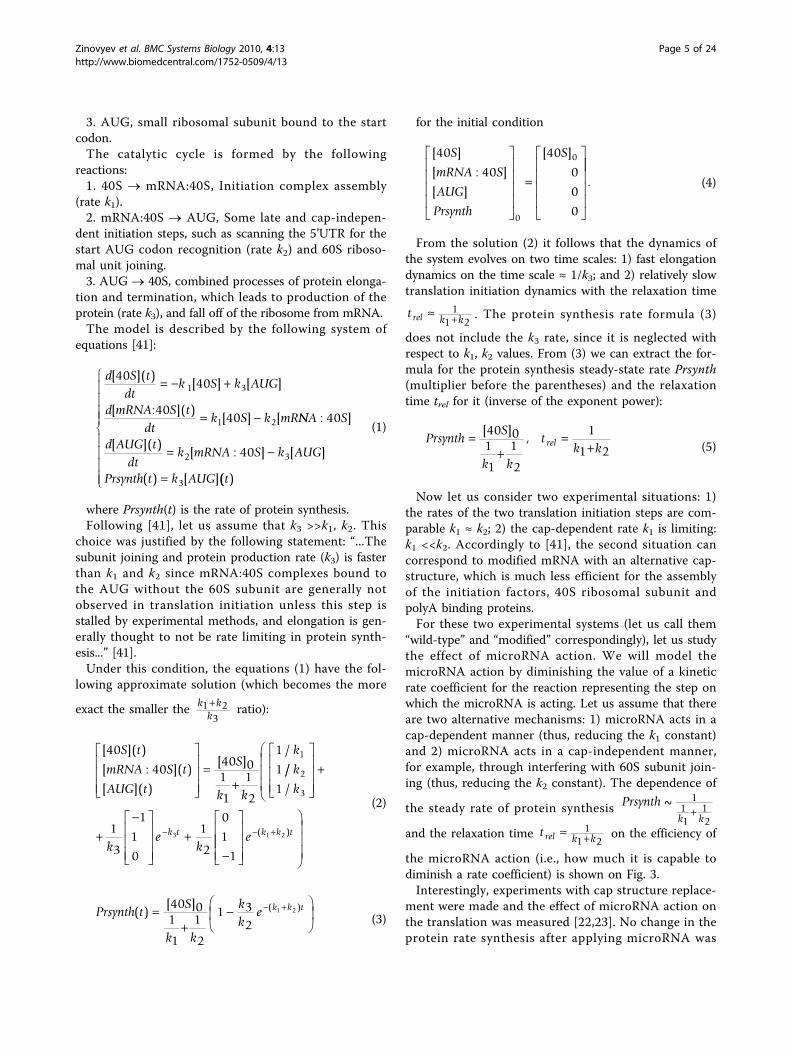
the microRNA action (i.e., how much it is capable todiminish a rate coefficient) is shown on Fig. 3.Interestingly, experiments with cap structure replace-
ment were made and the effect of microRNA action onthe translation was measured [22,23]. No change in theprotein rate synthesis after applying microRNA was
Zinovyev et al. BMC Systems Biology 2010, 4:13http://www.biomedcentral.com/1752-0509/4/13
Page 5 of 24
observed. From this it was concluded that microRNA inthis system should act through a cap-dependent mechan-ism (i.e., the normal “wild-type” cap is required formicroRNA recruitment). It was argued that this could bea misinterpretation [41] since in the “modified” system,cap-dependent translation initiation is a rate limitingprocess (k1 <<k2), hence, even if microRNA acts in thecap-independent manner (inhibiting k2), it will have noeffect on the final steady state protein synthesis rate. Thiswas confirmed this by the graph similar to the Fig. 3a.From the analytical solution (2) we can further
develop this idea and claim that it is possible to detectthe action of microRNA in the “modified” system if onemeasures the protein synthesis relaxation time: if it sig-nificantly increases then microRNA probably acts in thecap-independent manner despite the fact that the steadystate rate of the protein synthesis does not change (seethe Fig. 3b). This is a simple consequence of the fact thatthe relaxation time in a cycle of biochemical reactions islimited by the second slowest reaction (see [42] or the“Dominant system for a simple irreversible catalyticcycle with limiting step” section in Methods). If the
relaxation time is not changed in the presence of micro-RNA then we can conclude that none of the two alter-native mechanisms of microRNA-based translationrepression is activated in the system, hence, microRNAaction is dependent on the structure of the “wild-type”transcript cap.The observations from the Fig. 3 are recapitulated in
the Table 1. This analysis (of course, over-simplified inmany aspects) provides us with an important lesson:observed dynamical features of the translation processwith and without presence of microRNA can give clueson the mechanisms of microRNA action and help todistinguish them in a particular experimental situation.Theoretical analysis of the translation dynamics high-lights what are the important characteristics of thedynamics which should be measured in order to inferthe possible microRNA mechanism.This conclusion suggests the notion of a kinetic sig-
nature of microRNA action mechanism which wedefine as the set of measurable characteristics of thetranslational machinery dynamics (features of time seriesfor protein, mRNA, ribosomal subunits concentrations)
0 20 40 60 80 1000
0.1
0.2
0.3
0.4
0.5
0.6
0.7
0.8
0.9
1
efficiency of kinetic rate repression by miRNA, %
rela
tive
chan
ge o
f the
val
ueSteady rate of protein synthesis
k1<<k2
k1 ~ k2
cap−independent
cap−dependent
cap−dependentcap−independent
0 10 20 30 40 50 60 70 80 90 10010
−1
100
101
efficiency of kinetic rate repression by miRNA, %
valu
e, s
ec
Relaxation time
Figure 3 Predicted change in the steady-state rate of protein synthesis and its relaxation time. Graphs illustrating the predicted changein the steady-state rate of protein synthesis (left), and its relaxation time, i.e., the time needed to recover from a perturbation to the steady statevalue (right). Four curves are presented. The black ones are for the wild-type cap structure, which is modeled by k1 = k2. The red ones are forthe modified structure, when k1 <<k2. The main conclusion from the left graph is that if microRNA acts on a late initiation step, diminishing k2,then its effect is not measurable unless k2 is very strongly suppressed (as reported in [41]). The main conclusion from the right graph is that theeffect of microRNA can be measurable in this case if one looks at dynamical features such the relaxation time.
Table 1 Modeling two mechanisms of microRNA action in the simplest linear model
Observable value Initiation(k1) Step after initiation, cap-independent(k2) Elongation (k3)
Wild-type cap
Steady-state rate decreases decreases no change
Relaxation time increases slightly increases slightly no change
A-cap
Steady-state rate decreases no change no change
Relaxation time no change increases drastically no change
MicroRNA action effect is described for the protein synthesis steady rate and the relaxation time. It is assumed that the ribosome assembly+elongation step inprotein translation, described by the k3 rate constant, is not rate limiting.
Zinovyev et al. BMC Systems Biology 2010, 4:13http://www.biomedcentral.com/1752-0509/4/13
Page 6 of 24
and the predicted tendencies of their changes as aresponse to microRNA action through a particular bio-chemical mechanism.
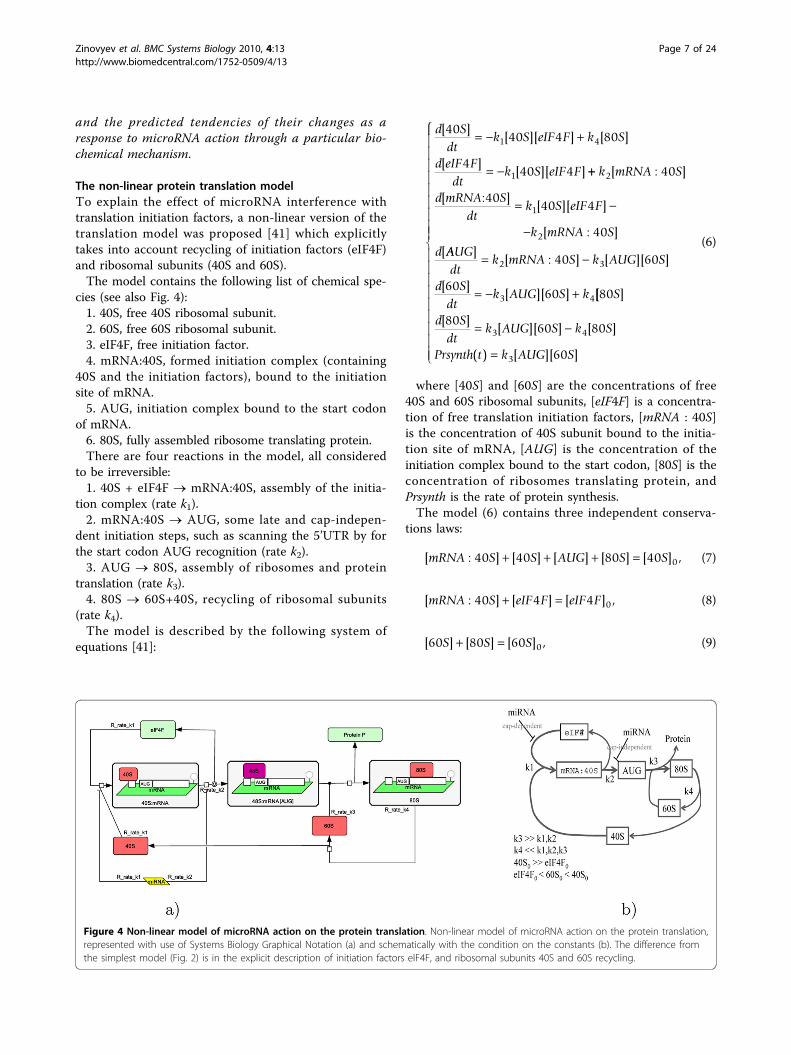
The non-linear protein translation modelTo explain the effect of microRNA interference withtranslation initiation factors, a non-linear version of thetranslation model was proposed [41] which explicitlytakes into account recycling of initiation factors (eIF4F)and ribosomal subunits (40S and 60S).The model contains the following list of chemical spe-
cies (see also Fig. 4):1. 40S, free 40S ribosomal subunit.2. 60S, free 60S ribosomal subunit.3. eIF4F, free initiation factor.4. mRNA:40S, formed initiation complex (containing
40S and the initiation factors), bound to the initiationsite of mRNA.5. AUG, initiation complex bound to the start codon
of mRNA.6. 80S, fully assembled ribosome translating protein.There are four reactions in the model, all considered
to be irreversible:1. 40S + eIF4F ® mRNA:40S, assembly of the initia-
tion complex (rate k1).2. mRNA:40S ® AUG, some late and cap-indepen-
dent initiation steps, such as scanning the 5’UTR by forthe start codon AUG recognition (rate k2).3. AUG ® 80S, assembly of ribosomes and protein
translation (rate k3).4. 80S ® 60S+40S, recycling of ribosomal subunits
(rate k4).The model is described by the following system of
equations [41]:
d Sdt
k S eIF F k S
d eIF Fdt
k S eIF F
[ ][ ][ ] [ ]
[ ][ ][ ]
4040 4 80
440 4
1 4
1
k mRNA S
d mRNA Sdt
k S eIF F
k mRNA S
d
2
1
2
40
4040 4
40
[ : ]
[ : ][ ][ ]
[ : ]
[AAUGdt
k mRNA S k AUG S
d Sdt
k AUG S k
][ : ] [ ][ ]
[ ][ ][ ]
2 3
3 4
40 60
6060 [[ ]
[ ][ ][ ] [ ]
( ) [ ][ ]
80
8060 80
60
3 4
3
S
d Sdt
k AUG S k S
Prsynth t k AUG S
(6)
where [40S] and [60S] are the concentrations of free40S and 60S ribosomal subunits, [eIF4F] is a concentra-tion of free translation initiation factors, [mRNA : 40S]is the concentration of 40S subunit bound to the initia-tion site of mRNA, [AUG] is the concentration of theinitiation complex bound to the start codon, [80S] is theconcentration of ribosomes translating protein, andPrsynth is the rate of protein synthesis.The model (6) contains three independent conserva-
tions laws:
[ : ] [ ] [ ] [ ] [ ] ,mRNA S S AUG S S40 40 80 40 0 (7)
[ : ] [ ] [ ] ,mRNA S eIF F eIF F40 4 4 0 (8)
[ ] [ ] [ ] ,60 80 60 0S S S (9)
Figure 4 Non-linear model of microRNA action on the protein translation. Non-linear model of microRNA action on the protein translation,represented with use of Systems Biology Graphical Notation (a) and schematically with the condition on the constants (b). The difference fromthe simplest model (Fig. 2) is in the explicit description of initiation factors eIF4F, and ribosomal subunits 40S and 60S recycling.
Zinovyev et al. BMC Systems Biology 2010, 4:13http://www.biomedcentral.com/1752-0509/4/13
Page 7 of 24
The following assumptions on the model parameterswere suggested in [41]:
k k k k k k k
eIF F S eIF F S4 1 2 3 3 1 2
0 0 0 04 40 4 60 40
, , ; ,
[ ] [ ] ;[ ] [ ] [ SS]0(10)
with the following justification: “...The amount 40S ribo-somal subunit was set arbitrarily high ... as it is thought togenerally not be a limiting factor for translation initiation.In contrast, the level of eIF4F, as the canonical limitingfactor, was set significantly lower so translation would bedependent on its concentration as observed experimen-tally... Finally, the amount of subunit joining factors forthe 60S large ribosomal subunit were estimated to bemore abundant than eIF4F but still substoichiometricwhen compared to 40S levels, consistent with in vivolevels... The k4 rate is relatively slower than the other ratesin the model; nevertheless, the simulation’s overall proteinproduction was not altered by changes of several orders ofmagnitude around its value...” [41].Notice that further in our paper we show that the last
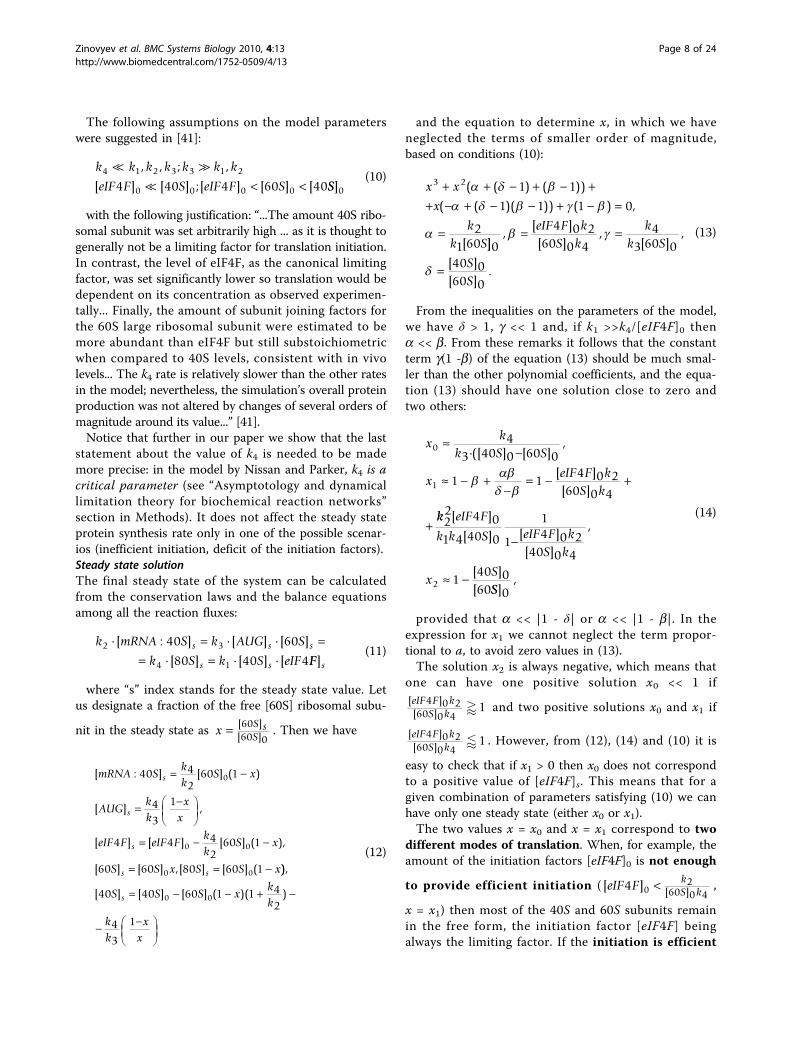
statement about the value of k4 is needed to be mademore precise: in the model by Nissan and Parker, k4 is acritical parameter (see “Asymptotology and dynamicallimitation theory for biochemical reaction networks”section in Methods). It does not affect the steady stateprotein synthesis rate only in one of the possible scenar-ios (inefficient initiation, deficit of the initiation factors).Steady state solutionThe final steady state of the system can be calculatedfrom the conservation laws and the balance equationsamong all the reaction fluxes:
k mRNA S k AUG S
k S k S eIFs s s
s s
2 3
4 1
40 60
80 40 4
[ : ] [ ] [ ]
[ ] [ ] [ FF s](11)
where “s” index stands for the steady state value. Letus designate a fraction of the free [60S] ribosomal subu-
nit in the steady state as x S sS [ ]
[ ]6060 0
. Then we have
[ : ] [ ] ( )
[ ] ,
[ ]
mRNA Skk
S x
AUGkk
xx
eIF F
s
s
s
40 42
60 1
43
1
4
0
[[ ] [ ] ( ),
[ ] [ ] ,[ ] [ ] (
eIF Fkk
S x
S S x S S xs s
4 42
60 1
60 60 80 60 1
0 0
0 0
)),
[ ] [ ] [ ] ( )( )40 40 60 1 1 42
43
1
0 0S S S xkk
kk
xx
s
(12)
and the equation to determine x, in which we haveneglected the terms of smaller order of magnitude,based on conditions (10):
x x
x
kk S
3 2 1 1
1 1 1 0
21 60
( ( ) ( ))
( ( )( )) ( ) ,
[
]]
,[ ][ ]
,[ ]
,
[ ][ ]
.
0
4 0 260 0 4
43 60 0
40 060 0
eIF F kS k
kk S
SS
(13)
From the inequalities on the parameters of the model,we have δ > 1, g << 1 and, if k1 >>k4/[eIF4F]0 thena << b. From these remarks it follows that the constantterm g(1 -b) of the equation (13) should be much smal-ler than the other polynomial coefficients, and the equa-tion (13) should have one solution close to zero andtwo others:
xk
k S S
xeIF F k
S k
0
1
43 40 0 60 0
1 14 0 2
60 0 4
([ ] [ ],
[ ][ ]
kk eIF F
k k S eIF F kS k
xS
22 4 0
1 4 40 0
1
14 0 2
40 0 4
140 0602
[ ]
[ ] [ ][ ]
,
[ ][
SS]
,0
(14)
provided that a << |1 - δ| or a << |1 - b|. In theexpression for x1 we cannot neglect the term propor-tional to a, to avoid zero values in (13).The solution x2 is always negative, which means that
one can have one positive solution x0 << 1 if[ ][ ]eIF F k
S k4 0 2
60 0 41 and two positive solutions x0 and x1 if
[ ][ ]eIF F k
S k4 0 2
60 0 41 . However, from (12), (14) and (10) it is
easy to check that if x1 > 0 then x0 does not correspondto a positive value of [eIF4F]s. This means that for agiven combination of parameters satisfying (10) we canhave only one steady state (either x0 or x1).The two values x = x0 and x = x1 correspond to two
different modes of translation. When, for example, theamount of the initiation factors [eIF4F]0 is not enough
to provide efficient initiation ( [ ] [ ]eIF F kS k4 0
260 0 4
,
x = x1) then most of the 40S and 60S subunits remainin the free form, the initiation factor [eIF4F] beingalways the limiting factor. If the initiation is efficient
Zinovyev et al. BMC Systems Biology 2010, 4:13http://www.biomedcentral.com/1752-0509/4/13
Page 8 of 24
enough ([ ] [ ] )eIF F kS k4 0
260 0 4
, then we have x = x0 << 1
when almost all 60S ribosomal subunits are engaged inthe protein elongation, and [eIF4F] being a limiting factorat the early stage, however, is liberated after and riboso-mal subunits recycling becomes limiting in the initiation(see the next section for the analysis of the dynamics).Let us notice that the steady state protein synthesis
rate under these assumptions is
Prsynth k S x
k S ifeIF F k
S k
k
4 0
4 0
60 1
604 0 2
60 0 41
[ ] ( )
[ ] ,[ ][ ]
22 04
[ ] ,
.
eIF F else
(15)
This explains the numerical results obtained in [41]:with low concentrations of [eIF4F]0 microRNA actionwould be efficient only if it affects k2 or if it competeswith eIF4F for binding to the mRNA cap structure(thus, effectively further reducing the level [eIF4F]0)With higher concentrations of [eIF4F]0, other limitingfactors become dominant: [60S]0 (availability of theheavy ribosomal subunit) and k4 (speed of ribosomalsubunits recycling which is the slowest reaction rate inthe system). Interestingly, in any situation the proteintranslation rate does not depend on the value of k1directly (of course, unless it does not become “glob-ally” rate limiting), but only through competing witheIF4F (which makes the difference with the simplestlinear protein translation model).Equation (15) explains also some experimental results
reported in [22]: increasing the concentration of [eIF4F]translation initiation factor enhances protein synthesisbut its effect is abruptly saturated above a certain level.It would be interesting to make some conclusions on
the shift of the polysomal profile from the steady statesolutions (14). In this model, the number of ribosomessitting on mRNA Npolysome is defined by
N polysomeS
mRNA [ ][ ] ,80 where [mRNA] is the concentration
of mRNA. However, [mRNA] is not an explicit dynami-cal variable in the model, it is implicitly included inother model constants, such as k1, together with theeffective volume of cytoplasmic space considered in themodel. Nevertheless, the model can predict the relativeshift of the polysome profile. In the steady state
N x
k S ifeIF F k
S k
k eIF F
polysome ~
[ ] ,[ ][ ]
[ ]
1
604 0 2
60 0 41
4 0
4 0
2
,, else
(16)
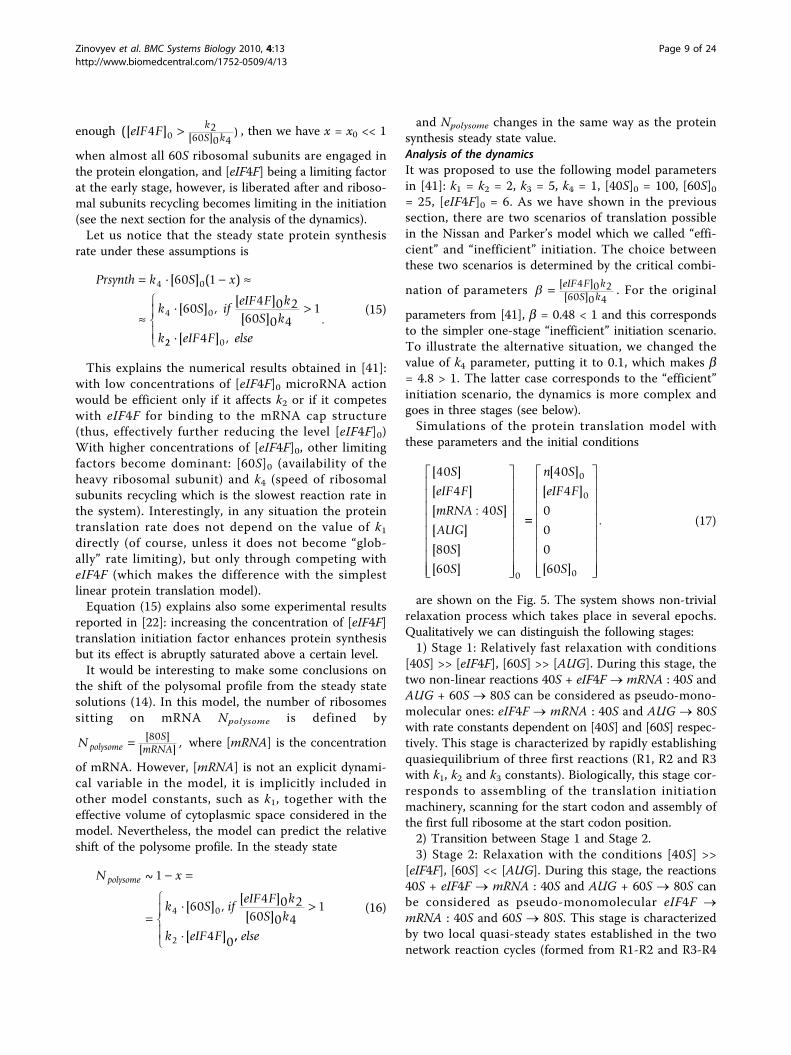
and Npolysome changes in the same way as the proteinsynthesis steady state value.Analysis of the dynamicsIt was proposed to use the following model parametersin [41]: k1 = k2 = 2, k3 = 5, k4 = 1, [40S]0 = 100, [60S]0= 25, [eIF4F]0 = 6. As we have shown in the previoussection, there are two scenarios of translation possiblein the Nissan and Parker’s model which we called “effi-cient” and “inefficient” initiation. The choice betweenthese two scenarios is determined by the critical combi-
nation of parameters [ ][ ]eIF F k
S k4 0 2
60 0 4. For the original
parameters from [41], b = 0.48 < 1 and this correspondsto the simpler one-stage “inefficient” initiation scenario.To illustrate the alternative situation, we changed thevalue of k4 parameter, putting it to 0.1, which makes b= 4.8 > 1. The latter case corresponds to the “efficient”initiation scenario, the dynamics is more complex andgoes in three stages (see below).Simulations of the protein translation model with
these parameters and the initial conditions
[ ]
[ ]
[ : ]
[ ]
[ ]
[ ]
40
4
40
80
600
S
eIF F
mRNA S
AUG
S
S
n S
eIF F
S
[ ]
[ ]
[ ]
.
40
4
0
0
0
60
0
0
0
(17)
are shown on the Fig. 5. The system shows non-trivialrelaxation process which takes place in several epochs.Qualitatively we can distinguish the following stages:1) Stage 1: Relatively fast relaxation with conditions
[40S] >> [eIF4F], [60S] >> [AUG]. During this stage, thetwo non-linear reactions 40S + eIF4F ® mRNA : 40S andAUG + 60S ® 80S can be considered as pseudo-mono-molecular ones: eIF4F ® mRNA : 40S and AUG ® 80Swith rate constants dependent on [40S] and [60S] respec-tively. This stage is characterized by rapidly establishingquasiequilibrium of three first reactions (R1, R2 and R3with k1, k2 and k3 constants). Biologically, this stage cor-responds to assembling of the translation initiationmachinery, scanning for the start codon and assembly ofthe first full ribosome at the start codon position.2) Transition between Stage 1 and Stage 2.3) Stage 2: Relaxation with the conditions [40S] >>
[eIF4F], [60S] << [AUG]. During this stage, the reactions40S + eIF4F ® mRNA : 40S and AUG + 60S ® 80S canbe considered as pseudo-monomolecular eIF4F ®mRNA : 40S and 60S ® 80S. This stage is characterizedby two local quasi-steady states established in the twonetwork reaction cycles (formed from R1-R2 and R3-R4
Zinovyev et al. BMC Systems Biology 2010, 4:13http://www.biomedcentral.com/1752-0509/4/13
Page 9 of 24
reactions). Biologically, this stage corresponds to thefirst round of elongation, when first ribosomes movesalong the coding region of mRNA. The small ribosomalsubunit 40S is still in excess which keeps the initiationstage (reaction R1-R2 fluxes) relatively fast.4) Transition between Stage 2 and Stage 3.5) Stage 3: Relaxation with the conditions [40S] <<
[eIF4F], [60S] << [AUG]. During this stage, the reactions40S + eIF4F ® mRNA : 40S and AUG + 60S ® 80S canbe considered as pseudo-monomolecular 40S ® mRNA :40S and 60S ® 80S. During this stage all reaction fluxesare balanced. Biologically, this stage corresponds to thestable production of the protein with constant recyclingof the ribosomal subunits. Most of ribosomal subunits40S are involved in protein elongation, so the initiationprocess should wait the end of elongation for that theywould be recycled.Stages 1-3 can be associated with the corresponding
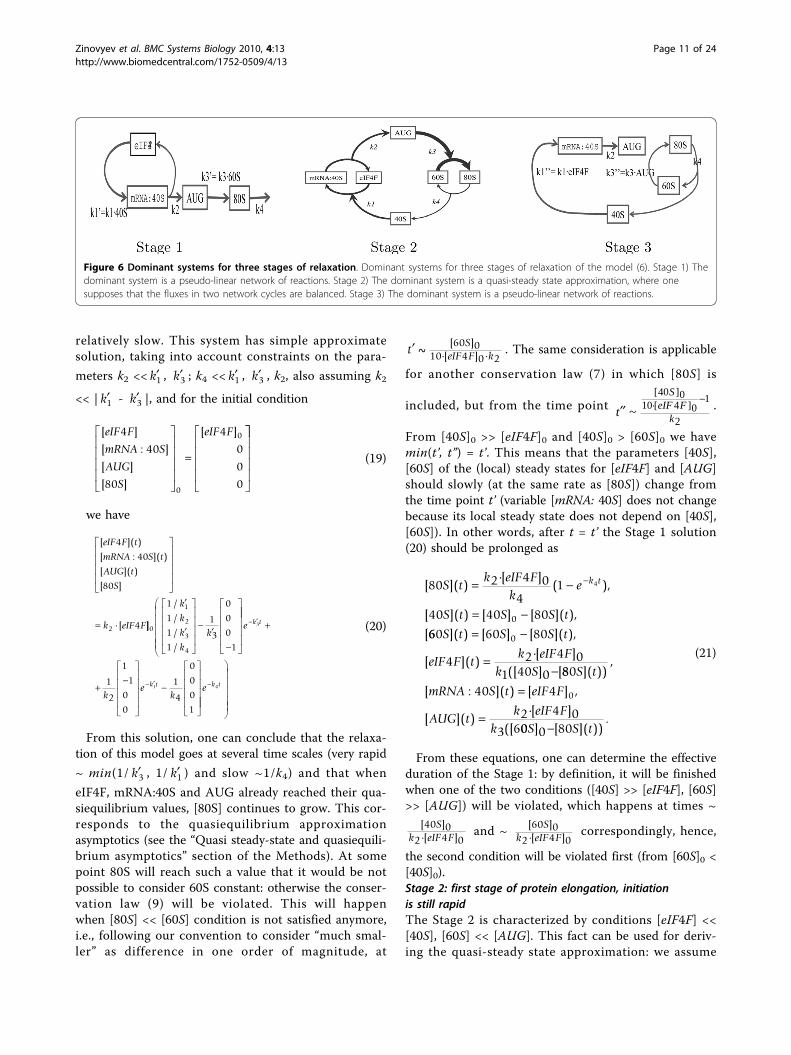
dominant systems [42] which are shown on Fig. 6.Below we give a more detailed analysis of stages 1-3 andtransitions between them.
Stage 1: translation initiation and assembly of the firstribosome at the start codonThe dominant system of the Stage 1 (Fig. 6a) can bemodeled as a linear system of equations (notice that it isnot equivalent to the system of equations that wouldcorrespond to fully monomolecular reaction networkbecause the reaction R2 is still bimolecular despite thefact that the products of this reaction do not interact,which leads to the linear description):
d eIF Fdt
k eIF F k mRNA S
d mRNA Sdt
k eIF F
[ ][ ] [ : ]
[ : ][
44 40
404
1 2
1
]]
[ : ]
[ ][ : ] [ ]
[ ][
k mRNA S
d AUGdt
k mRNA S k AUG
d Sdt
k
2
2 3
3
40
40
80AAUG S k S][ ] [ ]60 804
(18)
where k1 = k1 · [40S], k3 = k3 · [60S] and we con-sider that at this stage the changes of 40S and 60S are
2 4 6 8 10 12 14 16 1810
−3
10−2
10−1
100
101
102
103
time
conc
entr
atio
n
2 4 6 8 10 12 14 16 1810
−4
10−3
10−2
10−1
100
101
102
time
conc
entr
atio
n
10−6
10−4
10−2
100
102
10−4
10−3
10−2
10−1
100
101
102
time
conc
entr
atio
n
Non−linear Nissan&Parker’s model
40SeIF4FmRNA:40SAUG60S80S
10−6
10−4
10−2
100
102
10−3
10−2
10−1
100
101
102
103
time
conc
entr
atio
n
k1*40S*eIF4Fk2*mRNA:40Sk3*AUG*60Sk4*80S
a) b)
c) d)
Sta
ge1
Sta
ge2
Sta
ge3
Sta
ge1
Sta
ge2
Sta
ge3
Sta
ge1
Sta
ge2
Sta
ge3
Sta
ge1
Sta
ge2
Sta
ge3
Figure 5 Simulation of the non-linear protein translation model. Simulation of the non-linear protein translation model with parameters k1= 2, k2 = 2, k3 = 5, k4 = 0.1, [40S]0 = 100, [60S]0 = 25, [eIF4F]0 = 6. a) and b) chemical species concentrations at logarithmic and linear scales; c)and d) reaction fluxes at logarithmic and linear scales. By the dashed line several stages are delimited during which the dynamics can beconsidered as (pseudo-)linear. To determine where “>>“ and “<<” conditions are violated, we arbitrarily consider “much bigger” or “muchsmaller” as difference in one order of magnitude (by factor 10).
Zinovyev et al. BMC Systems Biology 2010, 4:13http://www.biomedcentral.com/1752-0509/4/13
Page 10 of 24
relatively slow. This system has simple approximatesolution, taking into account constraints on the para-
meters k2 << k1 , k3 ; k4 << k1 , k3 , k2, also assuming k2
<< | k1 - k3 |, and for the initial condition
[ ]
[ : ]
[ ]
[ ]
[ ]eIF F
mRNA S
AUG
S
eIF F4
40
80
4
0
0
00
0
(19)
we have
[ ]( )
[ : ]( )
[ ]( )
[ ]
[
eIF F t
mRNA S t
AUG t
S
k eIF F
4
40
80
42
]]
/
/
/
/
0
1
2
3
4
1
1
1
1
1
3
0
0
0
1
k
k
k
k
k
e
ke
k
k t
k t
3
11
2
1
1
0
0
1
4
0
0
0
1
e k t4
(20)
From this solution, one can conclude that the relaxa-tion of this model goes at several time scales (very rapid
~ min(1/ k3 , 1/ k1 ) and slow ~1/k4) and that when
eIF4F, mRNA:40S and AUG already reached their qua-siequilibrium values, [80S] continues to grow. This cor-responds to the quasiequilibrium approximationasymptotics (see the “Quasi steady-state and quasiequili-brium asymptotics” section of the Methods). At somepoint 80S will reach such a value that it would be notpossible to consider 60S constant: otherwise the conser-vation law (9) will be violated. This will happenwhen [80S] << [60S] condition is not satisfied anymore,i.e., following our convention to consider “much smal-ler” as difference in one order of magnitude, at
t SeIF F k~ [ ]
[ ]60 0
10 4 0 2. The same consideration is applicable
for another conservation law (7) in which [80S] is
included, but from the time point t
SeIF F
k~[ ][ ]40 0
10 4 01
2.
From [40S]0 >> [eIF4F]0 and [40S]0 > [60S]0 we havemin(t’, t”) = t’. This means that the parameters [40S],[60S] of the (local) steady states for [eIF4F] and [AUG]should slowly (at the same rate as [80S]) change fromthe time point t’ (variable [mRNA: 40S] does not changebecause its local steady state does not depend on [40S],[60S]). In other words, after t = t’ the Stage 1 solution(20) should be prolonged as
[ ]( )[ ]
( ),
[ ]( ) [ ] [ ]( ),
[
80 2 4 04
1
40 40 80
4
0
S tk eIF F
ke
S t S S t
k t
660 60 80
4 2 4 01 40 0
0S t S S t
eIF F tk eIF F
k S
]( ) [ ] [ ]( ),
[ ]( )[ ]
([ ] [
880
40 4
2 4 03 6
0
S t
mRNA S t eIF F
AUG tk eIF F
k
]( )),
[ : ]( ) [ ] ,
[ ]( )[ ]
([
00 0 80S S t] [ ]( ))
.
(21)
From these equations, one can determine the effectiveduration of the Stage 1: by definition, it will be finishedwhen one of the two conditions ([40S] >> [eIF4F], [60S]>> [AUG]) will be violated, which happens at times ~
[ ][ ]40 0
2 4 0
Sk eIF F and ~
[ ][ ]60 0
2 4 0
Sk eIF F correspondingly, hence,
the second condition will be violated first (from [60S]0 <[40S]0).Stage 2: first stage of protein elongation, initiationis still rapidThe Stage 2 is characterized by conditions [eIF4F] <<[40S], [60S] << [AUG]. This fact can be used for deriv-ing the quasi-steady state approximation: we assume
Figure 6 Dominant systems for three stages of relaxation. Dominant systems for three stages of relaxation of the model (6). Stage 1) Thedominant system is a pseudo-linear network of reactions. Stage 2) The dominant system is a quasi-steady state approximation, where onesupposes that the fluxes in two network cycles are balanced. Stage 3) The dominant system is a pseudo-linear network of reactions.
Zinovyev et al. BMC Systems Biology 2010, 4:13http://www.biomedcentral.com/1752-0509/4/13
Page 11 of 24
that the reaction fluxes in two network cycles (R1-R2and R3-R4) are independently balanced:
k S eIF F k mRNA S
k AUG S k S1 2
3 4
40 4 40
60 80
[ ] [ ] [ : ],
[ ] [ ].
(22)
Then (6) is simplified and, using the conservationlaws, we have a single equation on [40S]:
d S tdt
k eIF F S tkk
S t
k S A[ ]( ) [ ] [ ]( )
[ ]( )
[ ] ( [40 2 4 0 40
21
40
4 60 0
440
43
40
S tkk
A S t
]( ))
[ ]( ),
(23)
where A = [40S](t) + [AUG](t) is a constant quantityconserved accordingly to the quasi-steady state approxima-tion (see “Quasi steady-state and quasiequilibrium asymp-totics” section of Methods). Equation (23) can be alreadyintegrated but let us further simplify it for our analysis.Having in mind k4 <<k3 and assuming that at the beginning
of the Stage 2 [AUG] >>kk43, we can simplify (23) to
d S t
dtk eIF F S t
kk
S tk S
[ ]( ) [ ] [ ]( )
[ ]( )[ ] ,
40 2 4 0 40
21
404 60 0
(24)
and, further, assuming that at the beginning of the Stage2 we have [40S] >> [AUG] let us approximate the right-hand side of the equation by a piecewise-linear function
d S tdt
k eIF F
kk
S t t
kk
S t t
[ ]( )
[ ][ ]|
[ ]|
40
4
21
40
3 21
402 0
kk S if S tkk
k eIF FS t
k S
4 0
4
60 40 21
1 4 02
40
60
[ ] , [ ]( ) ,
[ ][ ]( )
[ ]
00 40 21
, [ ]( ) , if S tkk
(25)
where [40S]|t=t” is the amount of 40S at the beginningof the Stage 2. Then the descent of [40S](t) can be sepa-rated into linear and exponential phases:
[ ]( )
[ ] | ( ),
[ ] ([40
40
40 401 2
2S t
S K t t if t t
S St t
s
]] [ ] | )
exp( ( )),s t tS
K t t
if t t
2
2 2
2
40
(26)
where K1, K2 are linear and exponential slopes and [40S]
s2 is the quasi-steady state value of [40S] at the end of theStage 2:
K k eIF F
kk
S t t
kk
S t t
k S
Kk
1 2 04
21
40
3 21
404 60 0
21
[ ]
[ ]|[ ]
[eeIF F
S skk k eIF F
k S
S t tk
4 02
40 221
1
2 4 04 60 0
1
2
40 22
]
[ ][ ][ ]
[ ]|
kkK
11
(27)
Other dynamic variables are expressed through [40S](t) as
[ ]( ) [ ][ ]( )
[ : ]( ) [ ]
eIF F t eIF F
kk
kk
S t
mRNA S t eIF F
4 4
21
21
40
40 4
0
0
[ ]( )
[ ]( )
[ ]( ) [ ] |
[ ](
40
21
40
40
2 4 03
S tkk
S t
AUG t S
k eIF Fk
t t
[[ ] [ ] [ ]| )[ ]( )
[ ]( ) [ ]
60 0 40 0 4040
60 60
43
40
S S S t tS t
S t S
kk
kk
33
80 6043
0 0
[ ]( )
[ ] ( ) [ ][ ]( )
[ ]( ).
AUG t
S t SAUG t
kk
AUG t
(28)
At some point, the amount of free small ribosomalsubunit 40S, which is abundant at the beginning ofthe Stage 2, will not be sufficient to support rapid trans-lation initiation. Then the initiation factor eIF4F willnot be the limiting factor in the initiation and the con-dition [40S] >> [eIF4F] will be violated. We can esti-
mate this time as t Sk eIF F
[ ][ ]40 0
2 4 0.
Stage 3: steady protein elongation, speed of initiationequals to speed of elongationDuring the Stage 3 all fluxes in the network becomebalanced and the translation arrives at the steady state.From Fig. 6 it is clear that the relaxation goes indepen-dently in the cycle R3 - R4, where the relaxation equa-tions are simply
[ ]( ) [ ] ([ ] | [ ] )( [ ]|
60 60 60 60
4 3
S t S S S
e
s t t s
k k AUG t
tt t t
S t S S t
)( ),
[ ]( ) [ ] [ ] ( ).
80 60 600 0
(29)
Zinovyev et al. BMC Systems Biology 2010, 4:13http://www.biomedcentral.com/1752-0509/4/13
Page 12 of 24
where t"’ is the time when the Stage 3 of the relaxa-tion starts. This relaxation goes relatively fast, since k3[AUG]|t=t’’’ is relatively big. So, during the Stage 3, onecan consider the cycle R1 - R4 equilibrated, with [80S] =[80]s, [60S] = [60]s values.Hence, the relaxation during the Stage 3 consists in
redistributing concentrations of 40S and mRNA:40S totheir steady states in a linear chain of reactions R1 - R2(the value of [AUG] is relatively big and can be adjustedfrom the conservation law (7)). Using the pseudo-linearapproximation of this stage (see Fig. 6), we can easilywrite down the corresponding approximate relaxationequations:
[ : ]( )
[ : ] ( )
( [ ]| (
mRNA S t
mRNA e
B e
sk t
k eIF F tt t
40
40 1 2
1 4
t k t t
t tk t t
e
mRNA S e
S t
) ( )
( )
)
[ : ] | ,
[ ](
2
240
40 )) [ ] ( ) 40 2S Besk t t
(30)
where B = (1 - kk eIF F
21 4[ ] ) ([40]s- [40S]|t = t′′). [40]s
and [mRNA : 40S]s are the steady-state values of thecorresponding variables, see (12). The values [60S]|t = t′′,
[eIF4F]|t = t′′, [AUG]|t = t′′ and [mRNA : 40S]|t = t″′ canbe estimated from (28), using the [40S]|t = t′′ value. Therelaxation time at this stage equals
31
1 41
2
1
4 3
max(
[ ]|, ,
[ ]|)
k eIF F t t k k k AUG t t
The solution for the Stage 3 can be further simplifiedif k2 <<k1[eIF4F]|t = t′′ or k2 >>k1 [eIF4F]|t = t′′′.Transitions between stagesAlong the trajectory of the dynamical system (6) there arethree dominant system each one transforming intoanother. At the transition between stages, two neighbordominant systems are united and then split. Theoreti-cally, there might be situations when the system can stayin these transition zones for long periods of time, eveninfinitely. However, in the model (6) this is not the case:the trajectory rapidly passes through the transition stagesand jumps into the next dominant system approximation.Three dominant approximations can be glued, using
the concentration values at the times of the switching ofdominant approximation as initial values for the nextstage. Note that the Stage 2 has essentially one degreeof freedom since it can be approximated by a singleequation (23). Hence, one should only know one initialvalue [40S]|t = t′′ to glue the Stages 1 and 2. The same isapplied to the gluing of Stages 2 and 3, since in the endof Stage 2 all variable values are determined by thevalue of [40S]|t = t′′.
Case of always limiting initiationAs it follows from our analysis, the most critical para-meter of the non-linear protein translation model is the
ratio k eIF Fk S2 4 04 60 0
[ ][ ] . Above we have considered the
case b > 1 which is characterized by a switch of the lim-iting factor in the initiation (from eIF4F at the Stages 1and 2 to 40S at the Stage 3).In the case b < 1 the dynamics becomes simpler and
consists of one single stage: relaxation accordingly to(20) and further with correction (21) with the relaxationtime ~ 1
4k (the quasiequilibrium approximation corre-sponding to the Stage 1 works well for the whole trans-lation process). The reason for this is that if theinitiation is not efficient then the system is never in thesituation of the Stage 2 conditions when the cycle R1-R2 is balanced with much bigger flux than the cycle R3-R4. This approximation is the more exact the smallerb value, however, the value of b should not be necessaryvery small. For example, for the default parameter valuesof the model b = 0.48, and it well reproduces thedynamics (see Fig. 7c-d). From numerical experimentsone can see that even for b = 0.95 the dynamics is qua-litatively well reproduced. To model the A-cap structureeffect with very weak capacity for initiation (assembly ofthe initiation factors and 40S subunit), we should alsoconsider the case
k k k k1 4 2 3 (31)
for which the solution derived above is not directlyapplicable. However, the analytical calculations in this casecan be performed in the same fashion as above. Thedetailed derivation of the solution is given in Additional file1. The effect of putting k1 very small on the steady stateprotein synthesis and the relaxation time is shown on Fig. 7.In a similar way all possible solutions of the equations
(6) with very strong inhibitory effect of microRNA on aparticular translation step can be derived. These solu-tions will describe the situation when the effect of micro-RNA is so strong that it changes the dominant system(limiting place of the network) by violating the initialconstraints (10) on the parameters (for example, by mak-ing k3 smaller than other kis). Such possibility exists,however, it can require too strong (non-physiological)effect of microRNA-dependent translation inhibition.Effect of microRNA on the translation dynamicsOur analysis of the non-linear Nissan and Parker’smodel showed that the protein translation machinerycan function in two qualitatively different modes, deter-
mined by the ratio k eIF Fk S2 4 04 60 0
[ ][ ]
. We call these two
modes “efficient initiation” (b > 1) and “inefficient initia-tion” (b < 1) scenarios. Very roughly, this ratio
Zinovyev et al. BMC Systems Biology 2010, 4:13http://www.biomedcentral.com/1752-0509/4/13
Page 13 of 24

determines the balance between the overall speeds ofinitiation and elongation processes. In the case of “effi-cient initiation” the rate of protein synthesis is limitedby the speed of recycling of the ribosomal components(60S). In the case of “inefficient initiation” the rate ofprotein synthesis is limited by the speed of recycling ofthe initiation factors (eIF4F). Switching between twomodes of translation can be achieved by changing theavailability of the corresponding molecules ([60S]0 or[eIF4F]0) or by changing the critical kinetic parameters(k2 or k4). For example, changing k4 from 1 (Fig. 7c) to0.1 (Fig. 7a), performs such a switch for the originalparameter values from [41].As a result of the dynamical analysis, we can assemble
an approximate solution of the non-linear system underassumptions (10) about the parameters. An example ofthe approximate solution is given on Fig. 7. The advan-tage of such a semi-analytical solution is that one canpredict the effect of changing the system parameters.For example, on Fig. 7b the solution is compared to anexact numerical one, where the parameters have beenchanged but still obey the initial constraints (10).One of the obvious predictions is that the dynamics of
the system is not sensitive to variations of k3, so ifmicroRNA acts on the translation stage controlled by k3
then no microRNA effect could be observed looking atthe system dynamics (being the fastest one, k3 is not acritical parameter in any scenario).If microRNA acts on the translation stage controlled
by k4 (for example, by ribosome stalling mechanism)then we should consider two cases of efficient (b > 1)and inefficient (b < 1) initiation. In the first case thesteady state protein synthesis rate is controlled by k4 (asthe slowest, limiting step) and any effect on k4 wouldlead to the proportional change in the steady state ofprotein production. By contrast, in the case of inefficientinitiation, the steady state protein synthesis is notaffected by k4. Instead, the relaxation time is affected,
being ~ 14k . However, diminishing k4 increases the b
parameter, hence, this changes “inefficient initiation”scenario for the opposite, hence, making k4 critical forthe steady state protein synthesis anyway when k4
becomes smaller thank eIF F
S2 4 0
60 0
[ ][ ] . For example, for the
default parameters of the model, decreasing k4 valuefirstly leads to no change in the steady state rate of pro-tein synthesis, whereas the relaxation time increases
and, secondly, after the threshold valuek eIF F
S2 4 0
60 0
[ ][ ] starts
10−6
10−4
10−2
100
102
10−4
10−2
100
102
time
conc
entr
atio
n
k1*40S*eIF4Fk2*mRNA:40Sk3*AUG*60Sk4*80S
10−6
10−4
10−2
100
102
10−4
10−3
10−2
10−1
100
101
102
time
conc
entr
atio
n
10−6
10−4
10−2
100
102
10−3
10−2
10−1
100
101
102
time
conc
entr
atio
n
Non−linear Nissan&Parker’s model
40SeIF4FmRNA:40SAUG60S80S
10−6
10−4
10−2
100
102
10−4
10−3
10−2
10−1
100
101
102
time
conc
entr
atio
n
Non−linear Nissan&Parker’s model
40SeIF4FmRNA:40SAUG60S80S
a) b)
c) d)
t’ t’’ t’’’ t’ t’’ t’’’
Figure 7 Comparison of the numerical and approximate analytical solutions of the non-linear protein translation model. Examples ofthe exact numerical (circles) and approximate analytical (solid lines) solutions of the non-linear protein translation model. a) For the set ofparameters k1 = 2, k2 = 2, k3 = 5, k4 = 0.1; b) For parameters k1 = 1, k2 = 5, k3 = 50, k4 = 0.01; c) For the set of parameters from [41], k1 = 2, k2 =2, k3 = 5, k4 = 1; d) Reaction fluxes for the set of parameters c). Dashed black vertical lines denote evaluated transition points between thedynamics stages. Dashed red vertical points denote the time points where [40S](t) = 10·[eIF4F](t) and [40S](t) = [eIF4F](t)/10 respectively.
Zinovyev et al. BMC Systems Biology 2010, 4:13http://www.biomedcentral.com/1752-0509/4/13
Page 14 of 24
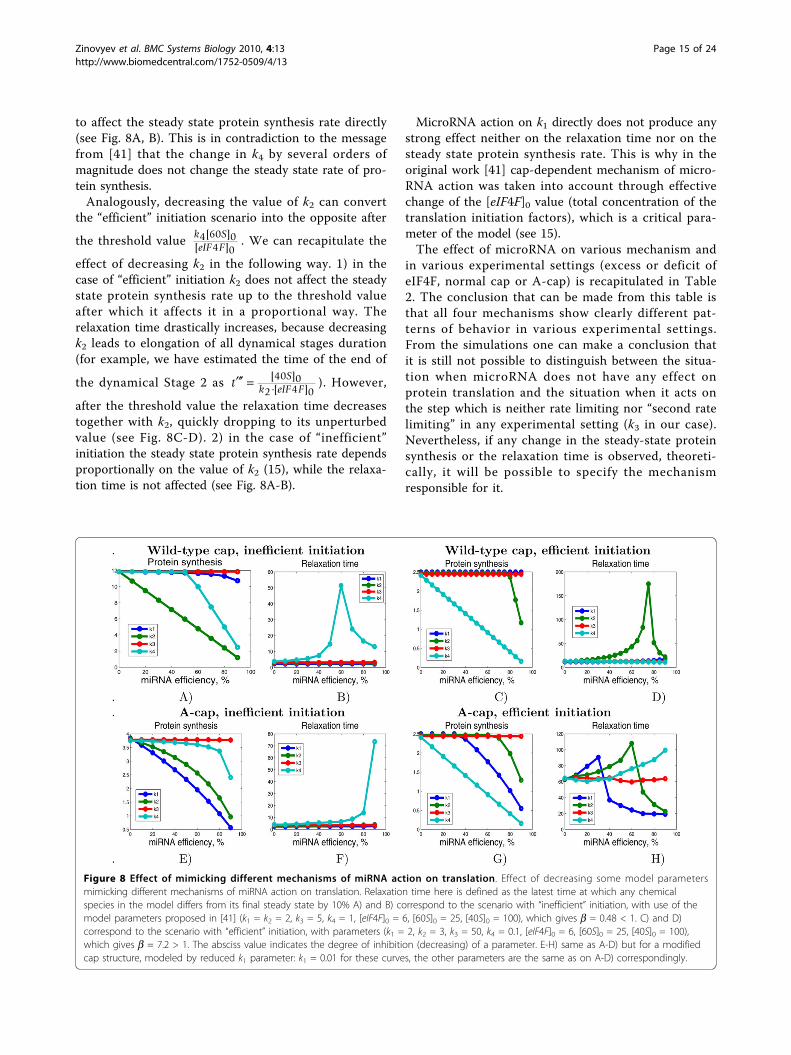
to affect the steady state protein synthesis rate directly(see Fig. 8A, B). This is in contradiction to the messagefrom [41] that the change in k4 by several orders ofmagnitude does not change the steady state rate of pro-tein synthesis.Analogously, decreasing the value of k2 can convert
the “efficient” initiation scenario into the opposite after
the threshold valuek SeIF F4 60 0
4 0
[ ][ ] . We can recapitulate the
effect of decreasing k2 in the following way. 1) in thecase of “efficient” initiation k2 does not affect the steadystate protein synthesis rate up to the threshold valueafter which it affects it in a proportional way. Therelaxation time drastically increases, because decreasingk2 leads to elongation of all dynamical stages duration(for example, we have estimated the time of the end of
the dynamical Stage 2 as t Sk eIF F
[ ][ ]40 0
2 4 0). However,
after the threshold value the relaxation time decreasestogether with k2, quickly dropping to its unperturbedvalue (see Fig. 8C-D). 2) in the case of “inefficient”initiation the steady state protein synthesis rate dependsproportionally on the value of k2 (15), while the relaxa-tion time is not affected (see Fig. 8A-B).
MicroRNA action on k1 directly does not produce anystrong effect neither on the relaxation time nor on thesteady state protein synthesis rate. This is why in theoriginal work [41] cap-dependent mechanism of micro-RNA action was taken into account through effectivechange of the [eIF4F]0 value (total concentration of thetranslation initiation factors), which is a critical para-meter of the model (see 15).The effect of microRNA on various mechanism and
in various experimental settings (excess or deficit ofeIF4F, normal cap or A-cap) is recapitulated in Table2. The conclusion that can be made from this table isthat all four mechanisms show clearly different pat-terns of behavior in various experimental settings.From the simulations one can make a conclusion thatit is still not possible to distinguish between the situa-tion when microRNA does not have any effect onprotein translation and the situation when it acts onthe step which is neither rate limiting nor “second ratelimiting” in any experimental setting (k3 in our case).Nevertheless, if any change in the steady-state proteinsynthesis or the relaxation time is observed, theoreti-cally, it will be possible to specify the mechanismresponsible for it.
Figure 8 Effect of mimicking different mechanisms of miRNA action on translation. Effect of decreasing some model parametersmimicking different mechanisms of miRNA action on translation. Relaxation time here is defined as the latest time at which any chemicalspecies in the model differs from its final steady state by 10% A) and B) correspond to the scenario with “inefficient” initiation, with use of themodel parameters proposed in [41] (k1 = k2 = 2, k3 = 5, k4 = 1, [eIF4F]0 = 6, [60S]0 = 25, [40S]0 = 100), which gives b = 0.48 < 1. C) and D)correspond to the scenario with “efficient” initiation, with parameters (k1 = 2, k2 = 3, k3 = 50, k4 = 0.1, [eIF4F]0 = 6, [60S]0 = 25, [40S]0 = 100),which gives b = 7.2 > 1. The absciss value indicates the degree of inhibition (decreasing) of a parameter. E-H) same as A-D) but for a modifiedcap structure, modeled by reduced k1 parameter: k1 = 0.01 for these curves, the other parameters are the same as on A-D) correspondingly.
Zinovyev et al. BMC Systems Biology 2010, 4:13http://www.biomedcentral.com/1752-0509/4/13
Page 15 of 24
Available experimental data and possible experimentalvalidationIt is important to underline that the Nissan and Parker’smodels analyzed in this paper are qualitative descrip-tions of the protein translation machinery. The para-meter values used represent rough order-of-magnitudeestimations or real kinetic rates. Moreover, these valuesshould be considered as relative and unitless since theydo not match any experimental time scale (see below).Nevertheless, such qualitative description already allowsto make predictions on the relative changes of thesteady states and relaxation times (see the Table 2), andin principle these predictions can be verified experimen-tally. Let us imagine an experiment in which it would bepossible to verify such predictions. In this experiment,two time series should be compared: 1) one measuredin a system in which microRNA acts on a normal “wild-type” protein translation machinery and 2) another sys-tem almost fully identical to the first one but in whichone of the translation stages is modified (made slow andrate-limiting, or, opposite, very rapid). There are multi-ple possibilities to modify the rate of this or that transla-tion stage. The initiation can be affected by changingthe concentration of the initiation factors such as eIF4Fas in [22]. The scanning stage can be affected by intro-ducing various signals in the 5’UTR sequence of mRNAsuch as in-frame AUG codons (see, for example, [43]).In principle, the elongation stage can be modified byintroducing slow synonymous codons in the codingsequence (there even exist mathematical models of theireffect [33,35,37] that can be used for the optimal experi-ment design). The stage of elongation termination canbe influenced by varying the concentration of the corre-sponding release factors (ETF1 or ETF2), at least in
vitro. The two time series measured after activation orintroduction of microRNA should be characterized forthe relative changes of steady state values and relaxationtimes of protein and mRNA concentrations, and, if pos-sible, the number of ribosomes in the polysome. Also,ideally, it is desired to construct several experimentalsystems in which the amount of inhibition by micro-RNA can be gradually changed (for example, by chan-ging the number of the corresponding seed sequences inthe 3’UTR region).To the best of our knowledge, there is no such a data-
set published until so far, even partially. In several recentpapers, one can find published time series of protein andmRNA concentrations or their relative changes measuredafter introducing microRNA. For example, the deadeny-lation time course is shown in [25]: translation decreasesafter 20 min and stops at 30 min, deadenylation begin at30 min, goes around 1 h. In [44], the authors study thekinetics of degradation of mRNA. After adding micro-RNA to the system, the amount and the length of the tar-geted mRNA starts to decrease at around 3-5 hours, anddecreases by 90% at 8 hours. In [45], the authors studythe global change of protein after transfection of a micro-RNA. They described a small change at the mRNA levelat 8 h after miRNA transfection, and the considerabledecrease appeared only after 32 hours while the proteinconcentration change was apparent at the time-coursebetween 8 hours and 32 hours. In the in vitro systemused in [22], at 15 min after incubation with microRNAthere was already a 25% decrease of translation, indicat-ing that the translational inhibition can be a relativelyrapid mechanism.These data on protein translation kinetics show that
the relaxation time range could vary from several
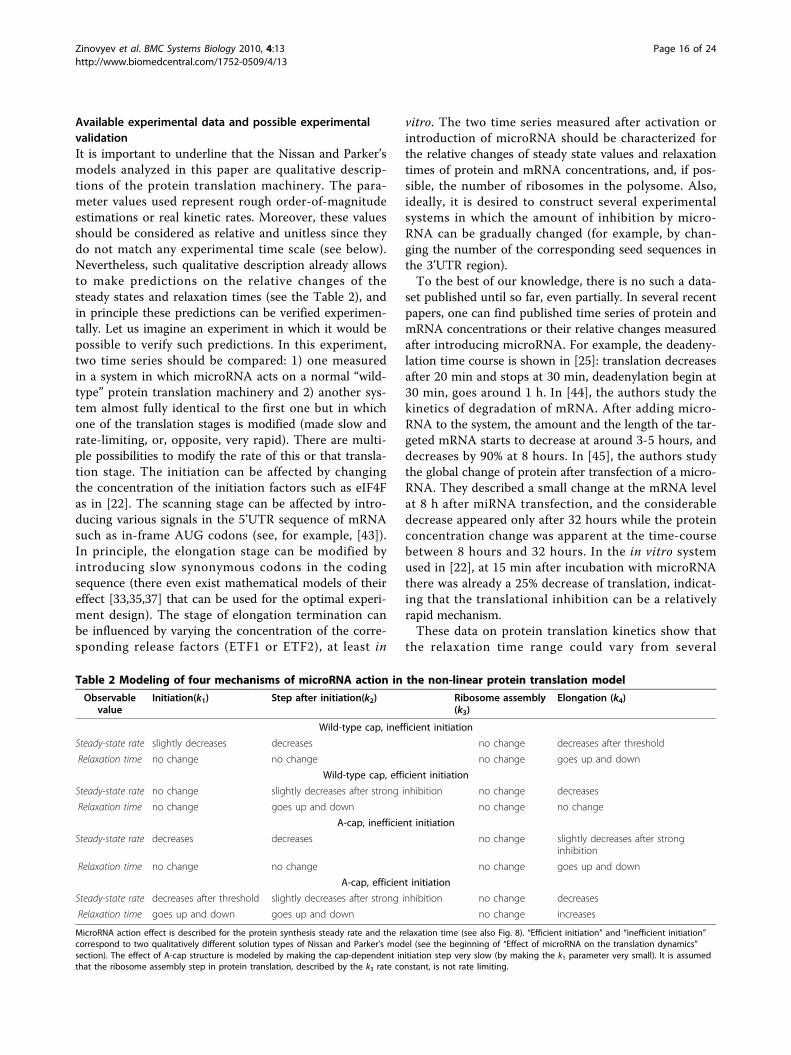
Table 2 Modeling of four mechanisms of microRNA action in the non-linear protein translation model
Observablevalue
Initiation(k1) Step after initiation(k2) Ribosome assembly(k3)
Elongation (k4)
Wild-type cap, inefficient initiation
Steady-state rate slightly decreases decreases no change decreases after threshold
Relaxation time no change no change no change goes up and down
Wild-type cap, efficient initiation
Steady-state rate no change slightly decreases after strong inhibition no change decreases
Relaxation time no change goes up and down no change no change
A-cap, inefficient initiation
Steady-state rate decreases decreases no change slightly decreases after stronginhibition
Relaxation time no change no change no change goes up and down
A-cap, efficient initiation
Steady-state rate decreases after threshold slightly decreases after strong inhibition no change decreases
Relaxation time goes up and down goes up and down no change increases
MicroRNA action effect is described for the protein synthesis steady rate and the relaxation time (see also Fig. 8). “Efficient initiation” and “inefficient initiation”correspond to two qualitatively different solution types of Nissan and Parker’s model (see the beginning of “Effect of microRNA on the translation dynamics”section). The effect of A-cap structure is modeled by making the cap-dependent initiation step very slow (by making the k1 parameter very small). It is assumedthat the ribosome assembly step in protein translation, described by the k3 rate constant, is not rate limiting.
Zinovyev et al. BMC Systems Biology 2010, 4:13http://www.biomedcentral.com/1752-0509/4/13
Page 16 of 24

minutes to several hours and even tens of hoursdepending on the critical step affected, on variousmRNA properties and on the whole biological systemtaken for the experiment (for example, the presence orabsence of different effectors influencing different stepsof the translation process). These data should be takeninto account when constructing more realistic andquantitative models of microRNA action on proteintranslation.
DiscussionThe role of microRNA in gene expression regulation isdiscovered and confirmed since ten years, however,there is still a lot of controversial results regarding therole of concrete mechanisms of microRNA-mediatedprotein synthesis repression. Some authors argue that itis possible that the different modes of microRNA actionreflect different interpretations and experimentalapproaches, but the possibility that microRNAs doindeed silence gene expression via multiple mechanismsalso exists. Finally, microRNAs might silence geneexpression by a common and unique mechanism; andthe multiple modes of action represent secondary effectsof this primary event [1-3].The main reason for accepting a possible experimental
bias could be the studies in vitro, where conditions arestrongly different from situation in vivo. Indeed, insidethe cell, mRNAs (microRNA targets) exist as ribonu-cleoprotein particles or mRNPs, and second, all proteinsnormally associated with mRNAs transcribed in vivo areabsent or at least much different from that bound to thesame mRNA in an in vitro system or following themicroRNAs transfection into cultured cells. The factthat RNA-binding proteins strongly influence the finaloutcome of microRNA regulation is proved now byseveral studies [19,46,47]. The mathematical resultsprovided in this paper suggests a complementary viewon the co-existence of multiple microRNA-mediatedmechanisms of translation repression. Mathematicalmodeling suggests to us to ask a question: if multiplemechanisms act simultaneously, would all of themequally contribute to the final observable repression ofprotein synthesis or its dynamics? The dynamical limita-tion theory gives an answer: the effect of microRNAaction will be observable and measurable in two cases:1) if it affects the dominant system of the protein trans-lationary machinery, or 2) if the effect of microRNAaction is so strong that it changes the limiting place (thedominant system).In a limited sense, this means, in particular, that the
protein synthesis steady rate is determined by the limit-ing step in the translation process and any effect ofmicroRNA will be measurable only if it affects the limit-ing step in translation, as it was demonstrated in [41].
Due to the variety of external conditions, cellular con-texts and experimental systems the limiting step in prin-ciple can be any in the sequence of events in proteintranslation, hence, this or that microRNA mechanismcan become dominant in a concrete environment. How-ever, when put on the language of equations, theprevious statement already becomes non-trivial in thecase of non-linear dynamical models of translation (andeven linear reaction networks with non-trivial networkstructure). Our analysis demonstrates that the limitingstep in translation can change with time, depends on theinitial conditions and is not represented by a single reac-tion rate constant but rather by some combination ofseveral model parameters. Methodology of dynamicallimitation theory that we had developed [42,48], allows todeal with these situations on a solid theoretical ground.Furthermore, in the dynamical limitation theory, we
generalize the notion of the limiting step to the notionof dominant system, and this gives us a possibility toconsider not only the steady state rate but also somedynamical features of the system under study. One ofthe simplest measurable dynamical feature is the proteinsynthesis relaxation time, i.e. the time needed for proteinsynthesis to achieve its steady state rate. The generalidea of “relaxation spectrometry” goes back to the worksof Manfred Eigen, a Nobel laureate [49] and is stillunderestimated in systems biology. Calculation of therelaxation time (or times) requires careful analysis oftime scales in the dynamical system, which is greatlyfacilitated by the recipes proposed in [42,50]. As wehave demonstrated in our semi-analytical solutions,measuring the steady state rate and relaxation time atthe same time allows to detect which step is possiblyaffected by the action of microRNA (resulting in effec-tive slowing down of this step). To our knowledge, thisidea was never considered before in the studies ofmicroRNA-dependent expression regulation. The Table2 recapitulates predictions allowing to discriminate aparticular mechanism of microRNA action.
ConclusionsThe analysis of the transient dynamics gives enoughinformation to verify or reject a hypothesis about a parti-cular molecular mechanism of microRNA action on pro-tein translation. For multiscale systems only that actionof microRNA is distinguishable which affects the para-meters of dominant system (critical parameters), orchanges the dominant system itself. Dominant systemsgeneralize and further develop the old and very popularidea of limiting step. Algorithms for identifying dominantsystems in multiscale kinetic models are straightforwardbut not trivial and depend only on the ordering of themodel parameters but not on their concrete values.Asymptotic approach to kinetic models of biological
Zinovyev et al. BMC Systems Biology 2010, 4:13http://www.biomedcentral.com/1752-0509/4/13
Page 17 of 24
networks suggests new directions of thinking on a biolo-gical problem, making the mathematical model a usefultool accompanying biological reasoning and allowing toput in order diverse experimental observations.However, to convert the methodological ideas
presented in this paper into a working tool forexperimental identification of the mechanisms of micro-RNA-dependent protein translation inhibition, requiresspecial efforts. Firstly, we need to construct a modelwhich would include all known mechanisms of micro-RNA action. Secondly, realistic estimations on the para-meter value intervals should be made. Thirdly, carefulanalysis of qualitatively different system behaviorsshould be performed and associated with the molecularmechanisms. Fourthly, a critical analysis of availablequantitative information existing in the literature shouldbe made. Lastly, the experimental protocols (sketched inthe previous section) for measuring dynamical featuressuch as the relaxation time should be developed. Allthese efforts makes a subject of a separate study whichis an ongoing work.
MethodsAsymptotology and dynamical limitation theory forbiochemical reaction networksMost of mathematical models that really work are sim-plifications of the basic theoretical models and use inthe backgrounds an assumption that some terms arebig, and some other terms are small enough to neglector almost neglect them. The closer consideration showsthat such a simple separation on “small” and “big” termsshould be used with precautions, and special culturewas developed. The name “asymptotology” for thisdirection of science was proposed by [51] defined as“the art of handling applied mathematical systems inlimiting cases”.In chemical kinetics three fundamental ideas were
developed for model simplification: quasiequilibriumasymptotic (QE), quasi steady-state asymptotic (QSS)and the idea of limiting step.In the IUPAC Compendium of Chemical Terminology
(2007) one can find a definition of limiting step [52]:“A rate-controlling (rate-determining or rate-limiting)step in a reaction occurring by a composite reactionsequence is an elementary reaction the rate constant forwhich exerts a strong effect -stronger than that of anyother rate constant - on the overall rate.”Usually when people are talking about limiting step
they expect significantly more: there exists a rate con-stant which exerts such a strong effect on the overallrate that the effect of all other rate constants together issignificantly smaller. For the IUPAC Compendium defi-nition a rate-controlling step always exists, becauseamong the control functions generically exists the
biggest one. On the contrary, for the notion of limitingstep that is used in practice, there exists a differencebetween systems with limiting step and systems withoutlimiting step.During XX century, the concept of the limiting step was
revised several times. First simple idea of a “narrow place”(the least conductive step) could be applied without adap-tation only to a simple cycle or a chain of irreversible stepsthat are of the first order (see Chap. 16 of the book [53] or[54] or the section “Dominant system for a simple irrever-sible catalytic cycle with limiting step” of this paper).When researchers try to apply this idea in more generalsituations they meet various difficulties.Recently, we proposed a new theory of dynamic and
static limitation in multiscale reaction networks [42,48].This approach allows to find the simplest networkwhich can substitute a multiscale reaction network suchthat the dynamics of the complex network can beapproximated by the simpler one. Following the asymp-totology terminology [55], we call this simple networkthe dominant system (DS). In the simplest cases, thedominant system is a subsystem of the original model.However, in the general case, it also includes new reac-tions with kinetic rates expressed through the para-meters of the original model, and rates of somereactions are renormalized: hence, in general, the domi-nant system is not a subsystem of the original model.The dominant systems can be used for direct compu-
tation of steady states and relaxation dynamics,especially when kinetic information is incomplete, fordesign of experiments and mining of experimental data,and could serve as a robust first approximation inperturbation theory or for preconditioning.Dominant systems serve as correct generalization of the
limiting step notion in the case of complex multiscalenetworks. They can be used to answer an importantquestion: given a network model, which are its criticalparameters? Many of the parameters of the initial modelare no longer present in the dominant system: theseparameters are non-critical. Parameters of dominantsystems (critical parameters) indicate putative targetsto change the behavior of the large network.Most of reaction networks are nonlinear, it is never-
theless useful to have an efficient algorithm for solvinglinear problems. First, nonlinear systems often includelinear subsystems, containing reactions that are(pseudo)monomolecular with respect to species inter-nal to the subsystem (at most one internal species isreactant and at most one is product). Second, for bin-ary reactions A + B ® ..., if concentrations of speciesA and B (cA, cB) are well separated, say cA >>cB thenwe can consider this reaction as B ® ... with rate con-stant proportional to cA which is practically constant,because its relative changes are small in comparison to
Zinovyev et al. BMC Systems Biology 2010, 4:13http://www.biomedcentral.com/1752-0509/4/13
Page 18 of 24
relative changes of cB. We can assume that this condi-tion is satisfied for all but a small fraction of genuinelynon-linear reactions (the set of non-linear reactionschanges in time but remains small). Under such anassumption, non-linear behavior can be approximatedas a sequence of such systems, followed one eachother in a sequence of “phase transitions”. In thesetransitions, the order relation between some of speciesconcentrations changes. Some applications of thisapproach to systems biology are presented by [50].The idea of controllable linearization “by excess” ofsome reagents is in the background of the efficientexperimental technique of Temporal Analysis of Pro-ducts (TAP), which allows to decipher detailedmechanisms of catalytic reactions [56].Below we give some details on the approaches used in
this paper to analyze the models by Nissan and Parker [41].
NotationsTo define a chemical reaction network, we have tointroduce:
• a list of components (species);• a list of elementary reactions;• a kinetic law of elementary reactions.
The list of components is just a list of symbols (labels)A1,...An. Each elementary reaction is represented by itsstoichiometric equation
si i
si
i i
si
A A , (32)
where s enumerates the elementary reactions, and thenon-negative integers asi, bsi are the stoichiometric coef-ficients. A stoichiometric vector gs with coordinates. gsi= bsi- asi is associated with each elementary reaction.A non-negative real extensive variable Ni ≥ 0, amount
of Ai, is associated with each component Ai. It measures“the number of particles of that species” (in particles, orin moles). The concentration of Ai is an intensive vari-able: ci = Ni/V, where V is volume. In this paper weconsider the volume (of cytoplasm) to be constant.Then the kinetic equations have the following form
ddct
w c T vs s
s
( , ) , (33)
where T is the temperature, ws is the rate of the reac-tion s, v is the vector of external fluxes normalized tounite volume. It may be useful to represent externalfluxes as elementary reactions by introduction of newcomponent Ø together with income and outgoing reac-tions Ø ® Ai and Ai ® Ø.
The most popular kinetic law of elementary reactionsis the mass action law for perfect systems:
w c T k cs s isi( , ) , (34)
where ks is a “kinetic constant” of the reaction s.
Quasi steady-state and quasiequilibrium asymptoticsQuasiequilibrium approximation uses the assumptionthat a group of reactions is much faster than other andgoes fast to its equilibrium. We use below superscripts‘f’ and ‘s’ to distinguish fast and slow reactions. A smallparameter appears in the following form
dd
s s
slow
f f
fast
ct
w c T w c Ts s
s
( , ) ( , ) ,, ,
1(35)
To separate variables, we have to study the spaces oflinear conservation law of the initial system (35) and ofthe fast subsystem
dd
f f
fast
ct
w c T 1
( , ),
If they coincide, then the fast subsystem just domi-nates, and there is no fast-slow separation for variables(all variables are either fast or constant). But if thereexist additional linearly independent linear conservationlaws for the fast system, then let us introduce new vari-ables: linear functions b1(c),...bn(c), where b1(c),...bm(c) isthe basis of the linear conservation laws for the initialsystem, and b1(c),...bm+l(c) is the basis of the linear con-servation laws for the fast subsystem. Then bm+l+1(c),...bn(c) are fast variables, bm+1(c),...bm+l(c) are slowvariables, and b1(c),...bm(c) are constant. The quasiequili-brium manifold is given by the equations
w c T f f( , ) 0 and for small ε it serves as an
approximation to a slow manifold.The quasi steady-state (or pseudo steady state)
assumption was invented in chemistry for description ofsystems with radicals or catalysts. In the most usual ver-sion the species are split in two groups with concentra-tion vectors cs (“slow” or basic components) and cf (“fastintermediates”). For catalytic reactions there is addi-tional balance for cf, amount of catalyst, usually it is just
a sum b ciiff The amount of the fast intermediates
is assumed much smaller than the amount of the basiccomponents, but the reaction rates are of the sameorder, or even the same (both intermediates and slowcomponents participate in the same reactions). This isthe source of a small parameter in the system. Let us
Zinovyev et al. BMC Systems Biology 2010, 4:13http://www.biomedcentral.com/1752-0509/4/13
Page 19 of 24
scale the concentrations cf and cs to the compatibleamounts. After that, the fast and slow time appear and
we could write ċs = Ws(cs, cf), c W c cf f s f 1 ( , ) , where
ε is small parameter, and functions Ws, Wf are boundedand have bounded derivatives (are “of the same order”).We can apply the standard singular perturbation techni-ques. If dynamics of fast components under given valuesof slow concentrations is stable, then the slow attractivemanifold exists, and its zero approximation is given bythe system of equations Wf(cs, cf) = 0.The QE approximation is also extremely popular and
useful. It has simpler dynamical properties (respectsthermodynamics, for example, and gives no criticaleffects in fast subsystems of closed systems).Nevertheless, neither radicals in combustion, nor
intermediates in catalytic kinetics are, in general, closeto quasiequilibrium. They are just present in muchsmaller amount, and when this amount grows, then theQSS approximation fails.The simplest demonstration of these two approxima-
tion gives the simple reaction: S + E ↔ SE ® P + E
with reaction rate constants k1 and k2. The only possi-
ble quasiequilibrium appears when the first equilibrium
is fast: k1 = �±/ε. The corresponding slow variable is Cs
= cS + cSE, bE = cE + cSE = const.For the QE manifold we get a quadratic equation
k
kc c c C c b cSE S E
sSE E SE
1
1
( )( ) . This equation
gives the explicit dependence CSE(Cs), and the slow
equation reads Ċs = -k2cSE(Cs), Cs + cP = bS = const.
For the QSS approximation of this reaction kinetics,under assumption bE<<bS, we have fast intermediates Eand SE. For the QSS manifold there is a linear equation
k c c k c k cS E SE SE1 1 2 0 , which gives us the explicit
expression for cSE(cS): c k c b k c k kSE S E S 1 1 1 2/ ( )
(the standard Michaelis-Menten formula). The slow
kinetics reads c k c b c c k c cS S E SE S SE S 1 1( ( )) ( ) .
The difference between the QSS and the QE in thisexample is obvious.The terminology is not rigorous, and often QSS is
used for all singular perturbed systems, and QE isapplied only for the thermodynamic exclusion of fastvariables by the maximum entropy (or minimum of freeenergy, or extremum of another relevant thermody-namic function) principle (MaxEnt). This terminologicalconvention may be convenient. Nevertheless, withoutany relation to terminology, the difference betweenthese two types of introduction of a small parameter ishuge. There exists plenty of generalizations of these
approaches, which aim to construct a slow and (almost)invariant manifold, and to approximate fast motion aswell. The following references can give a first impressionabout these methods: Method of Invariant Manifolds(MIM) ([57,58], Method of Invariant Grids (MIG), a dis-crete analogue of invariant manifolds ([59]), Computa-tional Singular Perturbations (CSP) ([60-62]) IntrinsicLow-Dimensional Manifolds (ILDM) by [63], developedfurther in series of works by [64]), methods based onthe Lyapunov auxiliary theorem ([65]).
Multiscale monomolecular reaction networksA monomolecular reaction is such that it has at mostone reactant and at most one product. Let us consider ageneral network of monomolecular reactions. This net-work is represented as a directed graph (digraph) [66]:vertices correspond to components Ai, edges correspondto reactions Ai ® Aj with kinetic constants kji > 0. Foreach vertex, Ai, a positive real variable ci (concentration)is defined.“Pseudo-species” (labeled Ø) can be defined to collect
all degraded products, and degradation reactions can bewritten as Ai ® Ø with constants k0i. Production reac-tions can be represented as Ø ® Ai with rates ki0. Thekinetic equation for the system is
ddcit
k k c k ci ij j ji i
jj
0
01
, (36)
or in vector form: ċ = K0 + Kc. Solution of this systemcan be reduced to a linear algebra problem: let us findall left (li) and right (ri) eigenvectors of K, i.e.:
Kr r l K lii
i ii
i , , (37)
with the normalization (li, ri) = δij, where δij is Kro-necker’s delta. Then the solution of (36) is
c t c r l c c ts k k sk
k
n
( ) ( , ( ) )exp( ), 0
1
(38)
where cs is the steady state of the system (36), i.e.when all d
dcit
= 0, and c(0) is the initial condition.If all reaction constants kij would be known with pre-
cision then the eigenvalues and the eigenvectors of thekinetic matrix can be easily calculated by standardnumerical techniques. Furthermore, Singular ValueDecomposition (SVD) can be used for model reduction.But in systems biology models often one has onlyapproximate or relative values of the constants (infor-mation on which constant is bigger or smaller thananother one). Let us consider the simplest case: when all
Zinovyev et al. BMC Systems Biology 2010, 4:13http://www.biomedcentral.com/1752-0509/4/13
Page 20 of 24
kinetic constants are very different (separated), i.e. forany two different pairs of indices I = (i, j), J = (i′, j′) wehave either kI >>kJ or kJ <<kI. In this case we say thatthe system is hierarchical with timescales (inverses ofconstants kij, j ≠ 0) totally separated.Linear network with totally separated constants can be
represented as a digraph and a set of orders (integernumbers) associated to each arc (reaction). The lowerthe order, the more rapid is the reaction. It happensthat in this case the special structure of the matrix K(originated from a reaction graph) allows us to exploitthe strong relation between the dynamics (36) and thetopological properties of the digraph. In this case, possi-ble values of li k are 0, 1 and the possible values of riare -1, 0, 1 with high precision. In previous works, weprovided an algorithm for finding non-zero componentsof li, ri, based on the network topology and the con-stants ordering, which gives a good approximation tothe problem solution [42,48,50].
Dominant system for a simple irreversible catalytic cyclewith limiting stepA linear chain of reactions, A1 ® A2 ® ...An, with reac-tion rate constants ki (for Ai ® Ai+1), gives the firstexample of limiting steps. Let the reaction rate constantkq be the smallest one. Then we expect the followingbehavior of the reaction chain in time scale ≳1/kq: allthe components A1,...Aq-1 transform fast into Aq, and allthe components Aq+1,...An-1 transform fast into An, onlytwo components, Aq and An are present (concentrationsof other components are small), and the whole dynamicsin this time scale can be represented by a single reactionAq ® An with reaction rate constant kq. This picturebecomes more exact when kq becomes smaller withrespect to other constants.The kinetic equation for the linear chain is
c k c k ci i i i i 1 1 , (39)
The coefficient matrix K of these equations is verysimple. It has nonzero elements only on the main diago-nal, and one position below. The eigenvalues of K are -ki(i = 1,...n - 1) and 0. The left and right eigenvectors for0 eigenvalue, l0 and r0, are:
l r0 01 1 1 0 0 0 1 ( , , ), ( , , , ), (40)
all coordinates of l0 are equal to 1, the only nonzerocoordinate of r0 is rn
0 and we represent vector-columnr0 in row.The catalytic cycle is one of the most important
substructures that we study in reaction networks. In thereduced form the catalytic cycle is a set of linearreactions:
A A A An1 2 1 .
Reduced form means that in reality some of thesereaction are not monomolecular and include some othercomponents (not from the list A1,... An). But in thestudy of the isolated cycle dynamics, concentrations ofthese components are taken as constant and areincluded into kinetic constants of the cycle linearreactions.For the constant of elementary reaction Ai ® we use
the simplified notation ki because the product of this ele-mentary reaction is known, it is Ai+1 for i <n and A1 for i= n. The elementary reaction rate is wi = kici, where ci isthe concentration of Ai. The kinetic equation is:
c k c k ci i i i i 1 1 , (41)
where by definition c0 = cn, k0 = kn, and w0 = wn. In thestationary state (ċi = 0), all the wi are equal: wi = w. Thiscommon rate w we call the cycle stationary rate, and
wb
k kn
cwki
i
1
1
1; ,
(42)
where b = ∑ici is the conserved quantity for reactionsin constant volume. Let one of the constants, kmin, bemuch smaller than others (let it be kmin = kn):
k k i ni min . if (43)
In this case, in linear approximation
c bknki
c bknki
w k bn
i n
i n
1 , , . (44)
The simplest zero order approximation for the steadystate gives
c b c i nn i , ( ).0 (45)
This is trivial: all the concentration is collected at thestarting point of the “narrow place”, but may be usefulas an origin point for various approximation procedures.So, the stationary rate of a cycle is determined by the
smallest constant, kmin, if it is much smaller than theconstants of all other reactions (43):
w k b min . (46)
In that case we say that the cycle has a limiting stepwith constant kmin.There is significant difference between the examples
of limiting steps for the chain of reactions and for
Zinovyev et al. BMC Systems Biology 2010, 4:13http://www.biomedcentral.com/1752-0509/4/13
Page 21 of 24
irreversible cycle. For the chain, the steady state doesnot depend on nonzero rate constants. It is just cn = b,c1 = c2 =... = cn-1 = 0. The smallest rate constant kqgives the smallest positive eigenvalue, the relaxationtime is τ = 1/kq. The corresponding approximation ofeigenmode (right eigenvector) r1 has coordinates:
r r r r r rq q q n n11
11 1
11
110 1 0 1 , , , . This
exactly corresponds to the statement that thewhole dynamics in the time scale ≳1/kq can berepresented by a single reaction Aq ® An withreaction rate constant kq. The left eigenvector for eigen-value kq has approximation l1 with coordinates
l l l l lq q n11
21 1
11 11 0 , . This vector pro-
vides the almost exact lumping on time scale ≳1/kq. Letus introduce a new variable clump = ∑ilici, i.e. clump =c1 + c2 +... + cq. For the time scale ≳1/kqwe can writeclump + cn ≈ b, dclump/dt ≈ -kqclump, dcn/dt ≈ kqclump.In the example of a cycle, we approximate the steady
state, that is, the right eigenvector r0 for zero eigenvalue(the left eigenvector is known and corresponds to themain linear balance b: li
0 ≡ 1). In the zero-orderapproximation, this eigenvector has coordinatesr r rn n1
01
0 00 1 , .If kn/ki is small for all i <n, then the kinetic behavior
of the cycle is determined by a linear chain of n - 1reactions A1 ® A2 ® ...An, which we obtain after cut-ting the limiting step. The characteristic equation for an
irreversible cycle, ( ) k ki ii
n
i
n0
11, tends to
the characteristic equation for the linear chain,
( ) kii
n0
1
1 , when kn ® 0.
The characteristic equation for a cycle with limitingstep (kn/ki << 1) has one simple zero eigenvalue thatcorresponds to the conservation law ∑ci = b and n - 1nonzero eigenvalues
i i ik i n ( ). (47)
where δi ® 0 when knkii n
0 .
A cycle with limiting step (41) has real eigenspectrumand demonstrates monotonic relaxation without dampedoscillations. Of course, without limitation such oscilla-tions could exist, for example, when all ki ≡ k > 0, (i =1,...n).The relaxation time of a stable linear system (41) is,
by definition, τ = 1/min{Re(-li)} (l ≠ 0). For small kn,τ ≈ 1/kτ, kτ = min{ki}, (i = 1,...n - 1). In other words, fora cycle with limiting step, kτ is the second slowest rateconstant: kmin <<kτ ≤ ....
Additional file 1: Analytical analysis of the case of very inefficientcap structure. In this text we derive an asymptotical solution for thecase when k1 is very small corresponding to the case of very inefficienttranslation initiation (for example, in the case of A-cap structurereplacement experiment)Click here for file[ http://www.biomedcentral.com/content/supplementary/1752-0509-4-13-S1.PDF ]
AcknowledgementsWe acknowledge support from Agence Nationale de la Recherche (projectANR-08-SYSC-003 CALAMAR) and from the Projet Incitatif Collaboratif“Bioinformatics and Biostatistics of Cancer” at Institut Curie. AZ and EB aremembers of the team “Systems Biology of Cancer” Equipe labellis’ee par laLigue Nationale Contre le Cancer. This work was supported by the EuropeanCommission Sixth Framework Programme Integrated Project SIROCCOcontract number LSHG-CT-2006-037900. We thank Vitaly Volpert andLaurence Calzone for inspiring and useful discussions.
Author details1Institut Curie, Bioinformatics and Computational Systems Biology Of Cancer,Paris, France. 2INSERM, U900, Paris, F-75248 France. 3Mines ParisTech, Centrefor Computational Biology, Fontainebleau, F-77300 France. 4CNRS FRE 2944,Institut André Lwoff, Villejuif, France. 5University of Leicester, Center forMathematical Modeling, Leicester, UK. 6Institute of Computational ModelingSB RAS, Department of nonequilibrium systems, Krasnoyarsk, Russia.
Authors’ contributionsAZ and AG have written the main body of the manuscript. NM, NN and AHBprovided the critical review of miRNA mechanisms and contributed towriting the manuscript. AG and AZ developed the mathematicalmethodology for identifying dominant systems. AZ performed the analyticalcomputations and numerical simulations. All authors have participated indiscussing the results and model predictions. All authors read and approvedthe final manuscript.
Received: 27 September 2009 Accepted: 24 February 2010Published: 24 February 2010
References1. Chekulaeva M, Filipowicz W: Mechanisms of miRNA-mediated post-
transcriptional regulation in animal cells. Curr Opin Cell Biol 2009,21:452-460.
2. Eulalio A, Huntzinger E, Izaurralde E: Getting to the root of miRNA-mediated gene silencing. Cell 2008, 132(1):9-14.
3. Filipowicz W, Bhattacharyya S, Sonenberg N: Mechanisms of post-transcriptional regulation by microRNAs: are the answers in sight? NatRev Genet 2008, 9(2):102-114.
4. Yekta S, Shih I, Bartel D: MicroRNA-directed cleavage of HOXB8 mRNA.Science 2004, 304(5670):594-596.
5. Kim D, Saetrom P, Snove OJ, Rossi J: MicroRNA-directed transcriptionalgene silencing in mammalian cells. PNAS 2008, 105(42):16230-5.
6. Place R, Li L, Pookot D, Noonan E, Dahiya R: MicroRNA-373 inducesexpression of genes with complementary promoter sequences. PNAS2008, 105(5):1608-13.
7. Orom U, Nielsen F, Lund A: MicroRNA-10a binds the 5’UTR of ribosomalprotein mRNAs and enhances their translation. Mol Cell 2008,30(4):460-71.
8. Vasudevan S, Tong Y, Steitz J: Switching from repression to activation:microRNAs can up-regulate translation. Science 2007, 318(5858):1931-4.
9. Gu S, Jin L, Zhang F, Sarnow P, Kay M: Biological basis for restriction ofmicroRNA targets to the 3’ untranslated region in mammalian mRNAs.Nat Struct Mol Biol 2009, 16(2):144-150.
10. Nottrott S, Simard M, Richter J: Human let-7a miRNA blocks proteinproduction on actively translating polyribosomes. Nat Struct Mol Biol2006, 13(12):1108-14.
Zinovyev et al. BMC Systems Biology 2010, 4:13http://www.biomedcentral.com/1752-0509/4/13
Page 22 of 24
11. Petersen C, Bordeleau M, Pelletier J, Sharp P: Short RNAs represstranslation after initiation in mammalian cells. Mol Cell 2006, 21(4):533-42.
12. Olsen P, Ambros V: The lin-4 regulatory RNA controls developmentaltiming in Caenorhabditis elegans by blocking LIN-14 protein synthesisafter the initiation of translation. Dev Biol 1999, 216(2):671-80.
13. Maroney P, Yu Y, Fisher J, Nilsen T: Evidence that microRNAs areassociated with translating messenger RNAs in human cells. Nat StructMol Biol 2006, 13(12):1102-7.
14. Baillat D, Shiekhattar R: Functional dissection of the human TNRC6(GW182-related) family of proteins. Mol Cell Biol 2009, 29(15):4144-4155.
15. Karaa Z, Iacovoni J, Bastide A, Lacazette E, Touriol C, Prats H: The VEGFIRESes are differentially susceptible to translation inhibition by miR-16.RNA 2009, 15(2):249-54.
16. Lytle J, Yario T, Steitz J: Target mRNAs are repressed as efficiently bymicroRNA-binding sites in the 5’ UTR as in the 3’ UTR. PNAS 2007,104(23):9667-72.
17. Bandres E, Cubedo E, Agirre X, Malumbres R, Zarate R, Ramirez N, Abajo A,Navarro A, Moreno I, Monzo M, Garcia-Foncillas J: Identification by Real-time PCR of 13 mature microRNAs differentially expressed in colorectalcancer and non-tumoral tissues. Mol Cancer 2006, 5:29.
18. Pillai R, Bhattacharyya S, Artus C, Zoller T, Cougot N, Basyuk E, Bertrand E,Filipowicz W: Inhibition of translational initiation by Let-7 MicroRNA inhuman cells. Science 2005, 309(5740):1573-6.
19. Bhattacharyya S, Habermacher R, Martine U, Closs E, Filipowicz W: Relief ofmicroRNA-mediated translational repression in human cells subjected tostress. Cell 2006, 125(6):1111-1124.
20. Kiriakidou M, Tan G, Lamprinaki S, De Planell-Saguer M, Nelson P,Mourelatos Z: An mRNA m7G cap binding-like motif within human Ago2represses translation. Cell 2007, 129(6):1141-51.
21. Humphreys D, Westman B, Martin D, Preiss T: MicroRNAs controltranslation initiation by inhibiting eukaryotic initiation factor 4E/cap andpoly(A) tail function. PNAS 2005, 102(47):16961-6.
22. Mathonnet G, Fabian M, Svitkin Y, Parsyan A, Huck L, Murata T, Biffo S,Merrick W, Darzynkiewicz E, Pillai R, Filipowicz W, Duchaine T, Sonenberg N:MicroRNA inhibition of translation initiation in vitro by targeting thecap-binding complex eIF4F. Science 2007, 317:1764-1767.
23. Thermann R, Hentze M: Drosophila miR2 induces pseudo-polysomes andinhibits translation initiation. Nature 2007, 447:875-878.
24. Wang B, Love T, Call M, Doench J, Novina C: Recapitulation of short RNA-directed translational gene silencing in vitro. Mol Cell 2006, 22(4):533-60.
25. Wakiyama M, Takimoto K, Ohara O, Yokoyama S: Let-7 microRNA-mediatedmRNA deadenylation and translational repression in a mammalian cell-free system. Genes Dev 2007, 21(15):1857-62.
26. Wang B, Yanez A, Novina C: MicroRNA-repressed mRNAs contain 40S butnot 60S components. PNAS 2008, 105(14):5343-8.
27. Clhendrimada T, Finn K, Ji X, Baillat D, Gregory R, Liebhaber S, Pasquinelli A,Shiekhattar R: MicroRNA silencing through RISC recruitment of eIF6.Nature 2007, 447(7146):823-828.
28. Jackson R, Standart N: How do microRNAs regulate gene expression? SciSTKE 2007, (367):re1.
29. Kozak M: Faulty old ideas about translational regulation paved the wayfor current confusion about how microRNAs function. Gene 2008,423:108-115.
30. Valencia-Sanchez M, Liu J, Hannon G, Parker R: Control of translation andmRNA degradation by miRNAs and siRNA. Genes Dev 2006, 20:515-524.
31. Kong Y, Cannell I, de Moor C, Hill K, Garside P, Hamilton T, Meijer H,Dobbyn H, Stoneley M, Spriggs K, Willis A, Bushell M: The mechanism ofmicro-RNA-mediated translation repression is determined by thepromoter of the target gene. PNAS 2008, 105(26):8866-71.
32. Basu A, Chowdhury D: Modeling Protein Synthesis from a Physicist’sPerspective: A Toy Model. Am J Physics 2007, 75:931-937.
33. Dong J, Schmittmann B, Zia R: Towards a model for protein productionrates. J Stat Phys 2007, 128:21-34.
34. Basu A, Chowdhury D: Traffic of interacting ribosomes: Effects of single-machine mechanochemistry on protein synthesis. Phys Rev E 2007, 75(1),021902-1-11.
35. Gilchrist M, Wagner A: A model of protein translation including codonbias, nonsense errors, and ribosome recycling. J Theor Biol 2006,239:417-434.
36. Zouridis H, Hatzimanikatis V: A Model for Protein Translation: PolysomeSelf-Organization Leads to Maximum Protein Synthesis Rates. BiophysicalJournal 2007, 92:717-730.
37. Chou T, Lakatos G: Clustered Bottlenecks in mRNA Translation andProtein Synthesis. Phys Rev Lett 2004, 93:198101.
38. Huang J, Morris Q, Frey B: Bayesian inference of microRNA targets fromsequence and expression data. J Comp Bio 2007, 14:550-563.
39. Levine E, Zhang Z, Kuhlman T, Hwa T: Quantitative Characteristics of GeneRegulation by Small RNA. PLoS Biol 2007, 5(9):e229.
40. Khanin R, Vinciotti V: Computational Modeling of Post-TranscriptionalGene Regulation by MicroRNAs. J Comp Biol 2008, 15(3):305-316.
41. Nissan T, Parker R: Computational analysis of miRNA-mediated repressionof translation: Implications for models of translation initiation inhibition.RNA 2008, 14:1480-1491.
42. Gorban A, Radulescu O, Zinovyev A: Asymptotology of chemical reactionnetworks. Chemical Engineering Science 2010, 65:2310-2324.
43. Iacono M, Mignone F, Pesole G: uAUG and uORFs in human and rodent5’untranslated mRNAs. Gene 2005, 349:97-105.
44. Wu L, Fan J, Belasco J: MicroRNAs direct rapid deadenylation of mRNA.PNAS 2006, 103(11):4034-9.
45. Selbach M, Schwanhausser B, Thierfelder N, Fang Z, Khanin R, Rajewsky N:Widespread changes in protein synthesis induced by microRNAs. Nature2006, 455(7209):58-63.
46. George A, Tenenbaum S: MicroRNA modulation of RNA-binding proteinregulatory elements. RNA Biol 2006, 3:57-59.
47. Jing Q, Huang S, Guth S, Zarubin T, Motoyama A, Chen FJ, abd Di Padova ,Lin S, Gram H, Han J: Involvement of microRNA in AU-rich element-mediated mRNA instability. Cell 2005, 120:623-634.
48. Gorban AN, Radulescu O: Dynamic and static limitation in reactionnetworks, revisited. Advances in Chemical Engineering 2008, 34:103-173.
49. Eigen M: Immeasurably fast reactions. Nobel Lecture. Nobel Lectures,Chemistry, 1963-1970 Amsterdam: Elsevier 1972, 170-203.
50. Radulescu O, Gorban A, Zinovyev A, Lilienbaum A: Robust simplificationsof multiscale biochemical networks. BMC Systems Biology 2008, 2(1):86.
51. Kruskal M: Asymptotology. Proceedings of Conference on MathematicalModels on Physical Sciences Englewood Cliffs, HJ: Prentice-Hall 1963, 17-48.
52. Rate-controlling step: IUPAC Compendium of Chemical Terminology.2007. [http://goldbook.iupac.org/R05139.html].
53. Johnston HS: Gas phase reaction theory New York: Roland Press 1966.54. Boyd RK: Some common oversimplifications in teaching chemical
kinetics. J Chem Educ 1978, 55:84-89.55. White RB: Asymptotic Analysis of Differential Equations London: Imperial
College Press & World Scientific 2006.56. Yablonsky G, Olea M, Marin G: Temporal Analysis of Products (TAP): Basic
Principles, Applications and Theory. Journal of Catalysis 2003, 216:120-134.57. Gorban AN, Karlin I: Invariant manifolds for physical and chemical kinetics,
Volume 660 of Lect. Notes Phys Berlin-Heidelberg-New York: Springer 2005.58. Roussel M, Fraser S: On the geometry of transient relaxation. J Chem Phys
1991, 94:7106-7111.59. Gorban A, Karlin I, Zinovyev A: Invariant grids for reaction kinetics. Physica
A 2004, 333:106-154.60. Lam SH: Using CSP to Understand Complex Chemical Kinetics.
Combustion Science and Technology 1993, 89(5):375-404.61. Lam SH, Goussis DA: The CSP Method for Simplifying Kinetics.
International Journal of Chemical Kinetics 1994, 26:461-486.62. Zagaris A, Kaper H, Kaper T: Analysis of the computational singular
perturbation reduction method for chemical kinetics. J Nonlinear Sci2004, 14:59-91.
63. Maas U, Pope S: Simplifying chemical kinetics: intrinsic low-dimensionalmanifolds in composition space. Combustion and Flame 1992, 88:239-264.
64. Bykov V, Goldfarb I, Gol’dshtein V, Maas U: On a Modified Version of ILDMApproach: Asymptotical Analysis Based on Integral Manifolds Method. Jof Applied Mathematics 2006, 71(3):359-389.
Zinovyev et al. BMC Systems Biology 2010, 4:13http://www.biomedcentral.com/1752-0509/4/13
Page 23 of 24
65. Kazantzis N, Kravaris C: A New Model Reduction Method for NonlinearDynamical Systems using Singular PDE Theory. Model Reduction andCoarse-Graining Approaches for Multiscale Phenomena SpringerGorban A,Kazantzis N, Kevrekidis Y, Ottinger H, Theodoropoulos C 2006, 3-15.
66. Temkin O, Zeigarnik A, Bonchev D: Chemical Reaction Networks: A Graph-Theoretical Approach Boca Raton, FL: CRC Press 1996.
doi:10.1186/1752-0509-4-13Cite this article as: Zinovyev et al.: Dynamical modeling of microRNAaction on the protein translation process. BMC Systems Biology 2010 4:13.
Submit your next manuscript to BioMed Centraland take full advantage of:
• Convenient online submission
• Thorough peer review
• No space constraints or color figure charges
• Immediate publication on acceptance
• Inclusion in PubMed, CAS, Scopus and Google Scholar
• Research which is freely available for redistribution
Submit your manuscript at www.biomedcentral.com/submit
Zinovyev et al. BMC Systems Biology 2010, 4:13http://www.biomedcentral.com/1752-0509/4/13
Page 24 of 24