Dynamic situation monitoring and Context-Aware BI ...
172
HAL Id: tel-00718917 https://tel.archives-ouvertes.fr/tel-00718917 Submitted on 18 Jul 2012 HAL is a multi-disciplinary open access archive for the deposit and dissemination of sci- entific research documents, whether they are pub- lished or not. The documents may come from teaching and research institutions in France or abroad, or from public or private research centers. L’archive ouverte pluridisciplinaire HAL, est destinée au dépôt et à la diffusion de documents scientifiques de niveau recherche, publiés ou non, émanant des établissements d’enseignement et de recherche français ou étrangers, des laboratoires publics ou privés. Dynamic situation monitoring and Context-Aware BI recommendations Raphaël Thollot To cite this version: Raphaël Thollot. Dynamic situation monitoring and Context-Aware BI recommendations. Other. Ecole Centrale Paris, 2012. English. NNT : 2012ECAP0020. tel-00718917
-
Upload
khangminh22 -
Category
Documents
-
view
3 -
download
0
Transcript of Dynamic situation monitoring and Context-Aware BI ...
HAL Id: tel-00718917https://tel.archives-ouvertes.fr/tel-00718917
Submitted on 18 Jul 2012
HAL is a multi-disciplinary open accessarchive for the deposit and dissemination of sci-entific research documents, whether they are pub-lished or not. The documents may come fromteaching and research institutions in France orabroad, or from public or private research centers.
L’archive ouverte pluridisciplinaire HAL, estdestinée au dépôt et à la diffusion de documentsscientifiques de niveau recherche, publiés ou non,émanant des établissements d’enseignement et derecherche français ou étrangers, des laboratoirespublics ou privés.
Dynamic situation monitoring and Context-Aware BIrecommendations
Raphaël Thollot
To cite this version:Raphaël Thollot. Dynamic situation monitoring and Context-Aware BI recommendations. Other.Ecole Centrale Paris, 2012. English. �NNT : 2012ECAP0020�. �tel-00718917�

Ecole Centrale Paris
DOCTORAL SCHOOL
SCIENCES FOR THE ENGINEER
PhD Thesis
to obtain the title of
Doctor of Ecole Centrale Paris
Defended by
Raphael Thollot
Dynamic Situation
Monitoring and
Context-Aware
BI Recommendations
prepared at Ecole Centrale Paris, MAS Laboratory, and SAP
Research, Business Intelligence Practice
defended on 2012, April 3rd
Jury:
Advisor: Marie-Aude Aufaure - Professor at Ecole Centrale Paris
President: Jacky Akoka - Professor at CNAMReviewers: Franck Ravat - Professor at Universite Toulouse 1 Capitole
Stefano Rizzi - Professor at University of BolognaExaminators: Yannick Cras - PhD, chief architect at SAP
Patrick Marcel - Associate professor at Universite FrancoisRabelais Tours

2

Abstract
The amount of information generated and maintained by information sys-tems and their users leads to the increasingly important concern of informa-tion overload. Personalized systems have thus emerged to help provide morerelevant information and services to the user. In particular, recommendersystems appeared in the mid 1990’s and have since then generated a grow-ing interest in both industry and academia. Besides, context-aware systemshave been developed to model, capture and interpret information about theuser’s situation, generally in dynamic and heterogeneous environments.
Decision support systems like Business Intelligence (BI) platforms alsoface usability challenges as the amount of information available to knowledgeworkers grows. Remarkably, we observe that only a small part of person-alization and recommendation techniques have been used in the context ofdata warehouses and analysis tools. Therefore, our work aims at exploringsynergies of recommender systems and context-aware systems to developpersonalization and recommendation scenarios suited in a BI environment.
In response to this, we develop in our work an open and modular situ-ation management platform using a graph-based situation model. Besides,dynamic aspects are crucial to deal with context data which is inherentlytime-dependent. We thus define two types of active components to enabledynamic maintenance of situation graphs, activation rules and operators.In response to events which can describe users’ interactions, activation rulesdefined using the event-condition-action framework are evaluated thanks toqueries on underlying graphs, to eventually trigger appropriate operators.
These platform and framework allow us to develop and support vari-ous recommendation and personalization scenarios. Importantly, we designa re-usable personalized query expansion component, using semantics ofmulti-dimensional models and usage statistics from repositories of BI docu-ments like reports or dashboards. This component is an important part ofanother experimentation we realized, Text-To-Query. This system dynam-ically generates multi-dimensional queries to illustrate a text and supportthe knowledge worker in the analysis or enrichment of documents she is ma-nipulating. Besides, we also illustrate the integration and usage of our graphrepository and situation management frameworks in an open and extensi-ble federated search project, to provide background knowledge managementand personalization.
Resume
Le volume des donnees creees et gerees par les systemes d’information etleurs utilisateurs augmente regulierement, conduisant a la problematiquecroissante de la surinformation. Pour repondre aux defis poses par l’acces a

ii
l’information dans de grands volumes de donnees, les systemes personnalisesvisent a proposer des donnees et des services plus adaptes a l’utilisateur.Les systemes de recommandation (SR), apparus au milieu des annees 1990,sont un cas particulier de ces systemes personnalises. Depuis, les SR ontsuscite un interet croissant tant dans la communaute academique que ducte des industriels. Par ailleurs, des systemes contextuels ont ete developpesdans le but de modeliser, capturer et interpreter l’information relative al’environnement de l’utilisateur. Systemes contextuels et SR partagent doncun meme but, celui de fournir les donnees et les services les plus adaptes a lasituation de l’utilisateur, generalement dans un environnement dynamiqueet heterogene.
Les systemes d’aide a la decision tels que les outils de Business Intel-ligence (BI) presentent eux aussi des difficultes relatives a leur utilisation,en particulier du fait de la quantite et de la complexite des donnees acces-sibles aux utilisateurs. Il est cependant notable que seules quelques rarestechniques heritees de systemes de recommandation ont a ce jour ete ap-pliquees dans le domaine des entrepts de donnees et des outils d’analyse.Notre travail consiste donc a explorer des synergies pouvant resulter de lacombinaison de SR et de systemes contextuels, a des fins de personnalisationdynamique dans les outils de BI.
En reponse a ces challenges, nous developpons dans notre travail uneplateforme ouverte et modulaire permettant la gestion des situations ou con-textes utilisateurs. Cette plateforme repose principalement sur un modelede situation a base de graphes. Par ailleurs, la dynamique des interactionsimplique une dependance inherente au temps des informations contextuelles.Nous definissons donc deux types de composants actifs, regles d’activationet operateurs, responsables de la gestion de l’evolution des graphes de con-naissances. Les regles sont construites selon le modele evenement-condition-action (ECA) et sont evaluees en reponse aux divers evenements reus par laplateforme. L’evaluation d’une regle consiste a valider ses conditions gracea l’execution d’un certain nombre de requetes sur les graphes de donnees,afin de declencher l’execution d’operateurs appropries.
La plateforme modulaire proposee avec un framework de developpementnous a permis de demontrer divers scenarios de personnalisation et derecommandations. Nous presentons en particulier un composant person-nalise d’expansion de requetes multidimensionnelles. Ce composant exploited’une part la semantique des modeles multidimensionnels et d’autre part desstatistiques d’usage derivees de collections de rapports et tableaux de bordsexistants. Le composant d’expansion de requetes est utilise par exempledans Text-To-Query (T2Q), un SR suggerant des requetes et visualisationsadaptees, generees dynamiquement afin d’illustrer un document texte (nonstructure). T2Q a pour objectif d’aider l’utilisateur a analyser et enrichirles documents sur lesquels il travaille. Enfin, nous decrivons l’integrationde notre plateforme dans un projet de recherche federee d’information. La

iii
plateforme est en particulier utilisee comme support pour la gestion de laconnaissance relative aux utilisateurs. Celle-ci nous permet d’elaborer unestrategie de personnalisation de la recherche via la definition de preferencesappliquees aux sources d’information.

iv
Acknowledgements
I first thank SAP Research for supporting this work and providing me witha rich industrial environment to experiment. More personally, I thank themany people who contributed to make this PhD a great experience for me.
I wish to express my deepest gratitude to my advisors at Ecole CentraleParis and SAP.
I would really like to thank Marie-Aude Aufaure for her gentle and com-prehensive guidance throughout these years. Her continuous support andacademic advices on research directions were precious to go forward withmy work.
I am also grateful to Yannick Cras for his kind management and themany inspiring discussions we had and, I hope, we will keep having. It wasa great opportunity for me to benefit from the computer science expertisehe delivers with passion.
In the SAP-sphere, I had the chance to work with various people thatall contributed to make work days instructive and enjoyable. I would liketo thank Chahab Nastar for taking me on board in the BI practice, forthe open discussions we had and, in particular, for shedding some light onthe paradox of choice. Thank you to the cross-prototyping and BI practiceteams, to the whole search task force of the Business Web project and tocoffee-break-colleagues.
I am also thankful to the whole BI team of the MAS laboratory, in EcoleCentrale Paris, for its good atmoshpere and those numerous lunches at theirreplaceable Chinese restaurant.
I am particularly thankful to Franck Ravat and Stefano Rizzi for accept-ing to review my PhD thesis. I would also like to thank Yannick Cras andPatrick Marcel who both accepted to be jury examinators. And thank youto Jacky Akoka for the honor he made me by accepting to be president ofthe jury.
I am lucky enough to have met amazing friends and they have alwaysbeen a great help. It proved true once again and it is fortunate for mymental health that they were here.
The permanent support of my family was extremely precious to me.Thank you to my parents and sisters to whom I owe so much. I am excitedto welcome three recent or soon-to-be nephews.
Last but not least, Anaıs already has more than my gratitude for themany little things, and the big ones, that she brings in our lives. Thank youfor being there, yourself, genuinely adorable.
Contents
I Introduction 1
1 General introduction . . . . . . . . . . . . . . . . . . . . . . . 1
2 Context and proposed approach . . . . . . . . . . . . . . . . . 1
3 Thesis organization . . . . . . . . . . . . . . . . . . . . . . . . 3
II Recommendations, context and BI 5
1 Introduction . . . . . . . . . . . . . . . . . . . . . . . . . . . . 5
2 Recommender systems . . . . . . . . . . . . . . . . . . . . . . 7
2.1 The recommendation problem . . . . . . . . . . . . . . 7
2.2 Recommendation methods . . . . . . . . . . . . . . . . 8
2.2.1 Content-based filtering . . . . . . . . . . . . 8
2.2.2 Collaborative filtering . . . . . . . . . . . . . 10
2.2.3 Hybrid methods . . . . . . . . . . . . . . . . 14
2.3 Extensions and perspectives . . . . . . . . . . . . . . . 14
2.3.1 Trust networks . . . . . . . . . . . . . . . . . 15
2.3.2 Semantic-based recommendations . . . . . . 15
2.3.3 Introducing context in recommender systems 16
3 Context-awareness . . . . . . . . . . . . . . . . . . . . . . . . 18
3.1 Definition, characteristics and usage of context . . . . 19
3.1.1 Preliminary definitions . . . . . . . . . . . . 19
3.1.2 Characteristics of context information . . . . 20
3.1.3 Acquisition of context information . . . . . . 22
3.2 Context and situation modeling . . . . . . . . . . . . . 23
3.2.1 Different formalisms . . . . . . . . . . . . . . 23
3.2.2 Categories or dimensions of context informa-tion . . . . . . . . . . . . . . . . . . . . . . . 25
3.3 Context management . . . . . . . . . . . . . . . . . . 26
3.3.1 Architecture . . . . . . . . . . . . . . . . . . 26
3.3.2 Dynamic management . . . . . . . . . . . . . 28
4 Data warehouses and recommendations . . . . . . . . . . . . 30
4.1 Data warehouses and OLAP . . . . . . . . . . . . . . 30
4.1.1 Data warehouses and the multi-dimensionalmodel . . . . . . . . . . . . . . . . . . . . . . 30
v

vi CONTENTS
4.1.2 OLAP - On-Line Analytical Processing . . . 32
4.2 Personalization of data warehouses . . . . . . . . . . . 33
4.2.1 Personalization approaches . . . . . . . . . . 33
4.2.2 User profiles and preferences . . . . . . . . . 34
4.3 Query recommendations . . . . . . . . . . . . . . . . . 36
4.3.1 Recommendation types . . . . . . . . . . . . 36
4.3.2 Query recommendation . . . . . . . . . . . . 36
5 Summary and discussion . . . . . . . . . . . . . . . . . . . . . 39
6 Conclusion . . . . . . . . . . . . . . . . . . . . . . . . . . . . 41
IIIGraph-based Situation Modeling 43
1 Introduction and requirements . . . . . . . . . . . . . . . . . 43
2 A graph-based situation model . . . . . . . . . . . . . . . . . 45
2.1 Situation statements . . . . . . . . . . . . . . . . . . . 45
2.1.1 Definition and notations . . . . . . . . . . . . 45
2.1.2 Situation graphs . . . . . . . . . . . . . . . . 47
2.2 Graph Repository . . . . . . . . . . . . . . . . . . . . 47
2.2.1 Source systems and personalized providers . 47
2.2.2 Definitions . . . . . . . . . . . . . . . . . . . 48
2.2.3 Graphs schema and the GR ontology . . . . 49
2.2.4 Graphs factories . . . . . . . . . . . . . . . . 51
3 Situation model characteristics . . . . . . . . . . . . . . . . . 52
3.1 Situation model overview . . . . . . . . . . . . . . . . 52
3.1.1 Current view . . . . . . . . . . . . . . . . . . 53
3.1.2 History management . . . . . . . . . . . . . . 54
3.2 Agent profile and core dimensions . . . . . . . . . . . 54
3.2.1 User profile . . . . . . . . . . . . . . . . . . . 55
3.2.2 Social dimension . . . . . . . . . . . . . . . . 55
3.2.3 Geography dimension . . . . . . . . . . . . . 57
3.3 Personalization-related dimensions . . . . . . . . . . . 57
3.3.1 Preference dimension . . . . . . . . . . . . . 57
3.3.2 Recommendation dimension . . . . . . . . . 58
4 Summary and discussion . . . . . . . . . . . . . . . . . . . . . 59
4.1 Modeled aspects . . . . . . . . . . . . . . . . . . . . . 59
4.2 Representation features . . . . . . . . . . . . . . . . . 59
4.3 Context management and usage . . . . . . . . . . . . 60
5 Conclusion . . . . . . . . . . . . . . . . . . . . . . . . . . . . 61
IVDynamic Situation Management 63
1 Introduction . . . . . . . . . . . . . . . . . . . . . . . . . . . . 63
1.1 Buisness events and situation dynamics . . . . . . . . 64
1.2 The ECA framework . . . . . . . . . . . . . . . . . . . 65
2 Activation rules and operators . . . . . . . . . . . . . . . . . 66
2.1 Rules expression . . . . . . . . . . . . . . . . . . . . . 66

CONTENTS vii
2.1.1 E - Filtering events . . . . . . . . . . . . . . 662.1.2 C - Condition expression . . . . . . . . . . . 672.1.3 A - Taking action . . . . . . . . . . . . . . . 68
2.2 Rules evaluation . . . . . . . . . . . . . . . . . . . . . 692.3 Operators . . . . . . . . . . . . . . . . . . . . . . . . . 71
2.3.1 Definition . . . . . . . . . . . . . . . . . . . . 712.3.2 Examples of operators . . . . . . . . . . . . . 72
3 Situation framework and services . . . . . . . . . . . . . . . . 733.1 Graph repository framework . . . . . . . . . . . . . . . 73
3.1.1 Platform and plugins modularity . . . . . . . 733.1.2 Personalized and secure graph repositories . 753.1.3 Providers and graphs factories . . . . . . . . 76
3.2 Situation management framework . . . . . . . . . . . 773.2.1 Situation provider . . . . . . . . . . . . . . . 773.2.2 Operators and activation rules . . . . . . . . 793.2.3 Events management and rules evaluation . . 80
3.3 Client situation services . . . . . . . . . . . . . . . . . 824 Summary and discussion . . . . . . . . . . . . . . . . . . . . . 835 Conclusion . . . . . . . . . . . . . . . . . . . . . . . . . . . . 84
V BI Semantics and Usage Statistics 871 Introduction . . . . . . . . . . . . . . . . . . . . . . . . . . . . 88
1.1 Situation modeling for BI personalization and recom-mendations . . . . . . . . . . . . . . . . . . . . . . . . 88
1.2 Application to the query design problem . . . . . . . . 882 Semantics of multi-dimensional domain models . . . . . . . . 89
2.1 Measures and dimensions . . . . . . . . . . . . . . . . 902.2 Functional dependencies and hierarchies . . . . . . . . 902.3 Reasoning about dependencies and hierarchies . . . . 92
2.3.1 Transitivity and custom rules . . . . . . . . . 922.3.2 Reasoning in the Graph Repository framework 93
3 Users’ preferences and similarity . . . . . . . . . . . . . . . . 943.1 User preferences and feedback . . . . . . . . . . . . . . 94
3.1.1 Explicit preferences . . . . . . . . . . . . . . 953.1.2 Implicit preferences . . . . . . . . . . . . . . 95
3.2 Users similarity . . . . . . . . . . . . . . . . . . . . . . 974 Usage statistics in BI documents . . . . . . . . . . . . . . . . 98
4.1 Structure of BI documents and co-occurrence . . . . . 984.2 Security and personal co-occurrence measure . . . . . 1004.3 Collaborative co-occurrence measure . . . . . . . . . . 102
4.3.1 Cold-start users and coverage . . . . . . . . . 1024.3.2 Using the social/trust network . . . . . . . . 1034.3.3 Similarity-based and hybrid approaches . . . 103
5 Personalized query expansion . . . . . . . . . . . . . . . . . . 104

viii CONTENTS
5.1 Query expansion . . . . . . . . . . . . . . . . . . . . . 1045.1.1 Ranking candidate entities . . . . . . . . . . 1045.1.2 Candidates filtering and parameters . . . . . 105
5.2 Architecture overview . . . . . . . . . . . . . . . . . . 1065.2.1 Multi-dimensional models provider . . . . . . 1065.2.2 BI documents provider . . . . . . . . . . . . 1085.2.3 Preferences provider . . . . . . . . . . . . . . 109
6 Summary and discussion . . . . . . . . . . . . . . . . . . . . . 1097 Conclusion . . . . . . . . . . . . . . . . . . . . . . . . . . . . 111
VIExperimentation: BI Recommendations 1131 Introduction . . . . . . . . . . . . . . . . . . . . . . . . . . . . 113
1.1 Exploratory recommendation scenarios . . . . . . . . . 1141.2 Search-related recommendations and personalization . 115
2 Text-to-query . . . . . . . . . . . . . . . . . . . . . . . . . . . 1152.1 Dictionary generation for entity extraction . . . . . . . 116
2.1.1 Dictionaries for data warehouses metadata . 1162.1.2 Relaxing dictionaries for entity extraction . . 117
2.2 Query generation from a text . . . . . . . . . . . . . . 1182.2.1 Standard analysis categories . . . . . . . . . 1182.2.2 Entities analysis and query completion . . . 1202.2.3 Text-To-Query algorithm . . . . . . . . . . . 122
2.3 Experimental results . . . . . . . . . . . . . . . . . . . 1232.3.1 Architecture overview . . . . . . . . . . . . . 1242.3.2 Clients for supported data acquisition . . . . 125
3 Personalization in search . . . . . . . . . . . . . . . . . . . . . 1273.1 An open architecture for search . . . . . . . . . . . . . 127
3.1.1 Architecture overview . . . . . . . . . . . . . 1273.1.2 Query parsing and annotations . . . . . . . . 129
3.2 BI queries and charts search . . . . . . . . . . . . . . . 1293.2.1 BI query auto-completion . . . . . . . . . . . 1303.2.2 Related charts search in dashboards and re-
ports . . . . . . . . . . . . . . . . . . . . . . 1303.3 Plugins personalization . . . . . . . . . . . . . . . . . 132
3.3.1 Authorizations and ranking . . . . . . . . . . 1333.3.2 Other forms of personalization . . . . . . . . 134
4 Summary and discussion . . . . . . . . . . . . . . . . . . . . . 1355 Conclusion . . . . . . . . . . . . . . . . . . . . . . . . . . . . 135
VIIConclusion and perspectives 1371 Summary . . . . . . . . . . . . . . . . . . . . . . . . . . . . . 1372 Discussion and perspectives . . . . . . . . . . . . . . . . . . . 140
Chapter I
Introduction
Contents
1 General introduction . . . . . . . . . . . . . . . . 1
2 Context and proposed approach . . . . . . . . . 1
3 Thesis organization . . . . . . . . . . . . . . . . . 3
1 General introduction
The amount of information generated and maintained by information sys-tems and their users leads to the increasingly important concern of informa-tion overload. Personalized systems have thus emerged to help provide morerelevant information and services to the user. In particular, recommendersystems appeared in the mid 1990’s and have since then generated a grow-ing interest in both industry and academia. Besides, context-aware systemshave been developed to model, capture and interpret information about theuser’s situation, generally in dynamic and heterogeneous environments.
Decision support systems like Business Intelligence (BI) platforms alsoface usability challenges as the amount of information available to knowledgeworkers grows. Remarkably, we observe that only a small part of person-alization and recommendation techniques have been used in the context ofdata warehouses and analysis tools.
Therefore, our work aims at exploring synergies of recommender systemsand context-aware systems to develop personalization and recommendationscenarios suited in a BI environment.
2 Context and proposed approach
Our work has been significantly influenced by the industrial environmentthat supported and fostered it, that is the BI practice of SAP Research.
1
2 CHAPTER I. INTRODUCTION
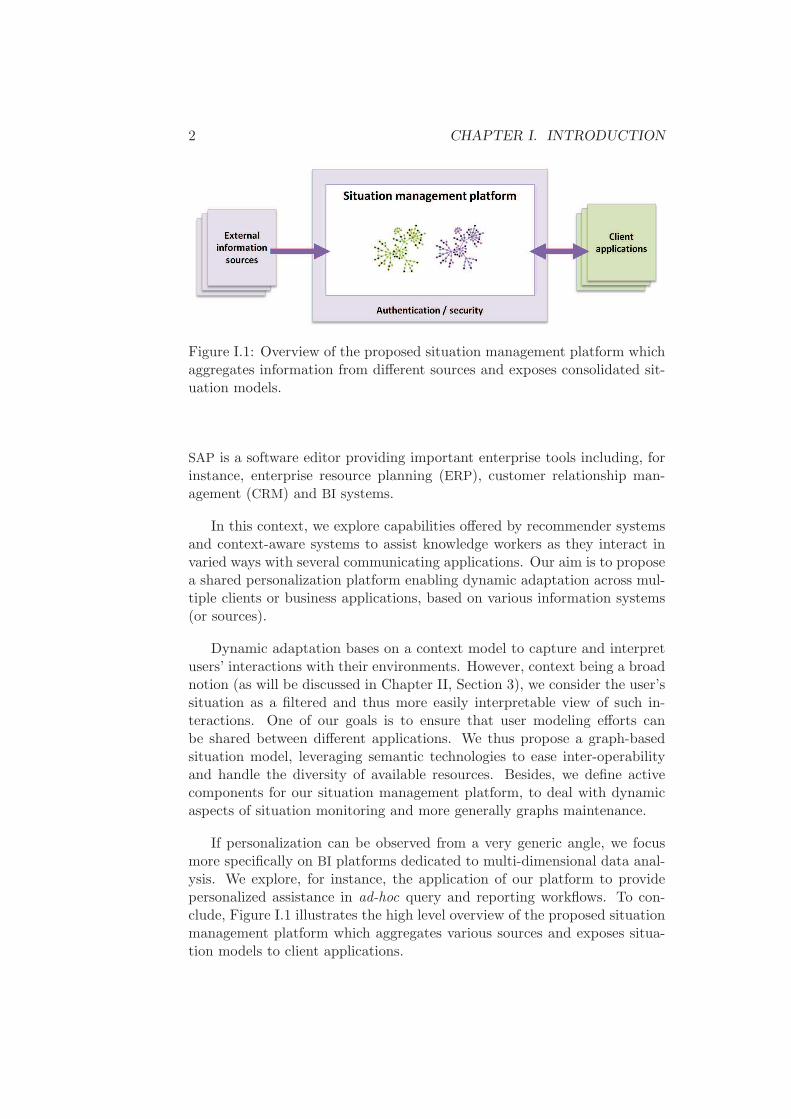
Figure I.1: Overview of the proposed situation management platform whichaggregates information from different sources and exposes consolidated sit-uation models.
SAP is a software editor providing important enterprise tools including, forinstance, enterprise resource planning (ERP), customer relationship man-agement (CRM) and BI systems.
In this context, we explore capabilities offered by recommender systemsand context-aware systems to assist knowledge workers as they interact invaried ways with several communicating applications. Our aim is to proposea shared personalization platform enabling dynamic adaptation across mul-tiple clients or business applications, based on various information systems(or sources).
Dynamic adaptation bases on a context model to capture and interpretusers’ interactions with their environments. However, context being a broadnotion (as will be discussed in Chapter II, Section 3), we consider the user’ssituation as a filtered and thus more easily interpretable view of such in-teractions. One of our goals is to ensure that user modeling efforts canbe shared between different applications. We thus propose a graph-basedsituation model, leveraging semantic technologies to ease inter-operabilityand handle the diversity of available resources. Besides, we define activecomponents for our situation management platform, to deal with dynamicaspects of situation monitoring and more generally graphs maintenance.
If personalization can be observed from a very generic angle, we focusmore specifically on BI platforms dedicated to multi-dimensional data anal-ysis. We explore, for instance, the application of our platform to providepersonalized assistance in ad-hoc query and reporting workflows. To con-clude, Figure I.1 illustrates the high level overview of the proposed situationmanagement platform which aggregates various sources and exposes situa-tion models to client applications.

3. THESIS ORGANIZATION 3
3 Thesis organization
Let us briefly present the organization of this manuscript.
We first review related work in Chapter II. The review is structured soas to reflect the three main fields of research related to our work. First,we introduce recommender systems and the most common techniques devel-oped in this area. Besides, we present more recent work that attempted tointroduce contextual parameters into the recommendation process. Then,we describe contributions related to more generic context-aware systems.These systems base on important efforts to generalize the notions of con-text and situation and aim at being shareable and reusable across differentapplications. The last area that we discuss concerns data warehouses andmulti-dimensional analysis. We present in particular some approaches thatwere adopted to provide a certain degree of personalization and recommen-dations in the context of data warehouses.
Next, we introduce in Chapter III the requirements imposed on the situa-tion management platform that we envision. These requirements lead to thedefinition of our graph-based situation model, meant to enable a high levelof expressiveness and deal with the heterogeneity of possible informationsources. To ensure data privacy and users’ data isolation, our work relies ona graph repository framework that we describe in details. Furthermore, oursituation model exposes dimensions that help categorize situation-relatedinformation and expose more structured information to consuming applica-tions.
Chapter IV deals with situation dynamics or more precisely mechanicsused to maintain graphs in response to events, using operators and activationrules described in the event-condition-action framework. This chapter alsodescribes the architecture of the proposed framework, from the underlyinggraph repository to dynamic components.
With a focus on data warehouses and multi-dimensional analysis, Chap-ter V introduces multi-dimensional models and their semantics. On top ofthese, we exploit usage statistics that can be derived from repositories ofexisting BI documents. This includes the definition of users’ preferences andsimilarity as well as a measure of co-occurrences between BI entities (mea-sures and dimensions). Eventually, semantics and statistics are combined topropose a personalized component for multi-dimensional query expansion.
To illustrate our generic framework and BI-specific notions previouslydiscussed, Chapter VI describes a certain number of experimentations thatwere realized. We first introduce Text-To-Query, a system dynamically gen-erating structured analytics related to a text document the user is reading.Besides, we further discuss the use of our framework to enable personaliza-tion at different levels, in a federated search project.
To conclude, we briefly summarize our work and contributions in Chap-ter VII. The discussion includes hints and suggestions for future work related

4 CHAPTER I. INTRODUCTION
to our situation management platform and its applications.
Chapter II
Recommender systems,
context-awareness and BI
recommendations
Contents
1 Introduction . . . . . . . . . . . . . . . . . . . . . 5
2 Recommender systems . . . . . . . . . . . . . . . 7
2.1 The recommendation problem . . . . . . . . . . . . 7
2.2 Recommendation methods . . . . . . . . . . . . . . 8
2.3 Extensions and perspectives . . . . . . . . . . . . . 14
3 Context-awareness . . . . . . . . . . . . . . . . . . 18
3.1 Definition, characteristics and usage of context . . 19
3.2 Context and situation modeling . . . . . . . . . . . 23
3.3 Context management . . . . . . . . . . . . . . . . 26
4 Data warehouses and recommendations . . . . . 30
4.1 Data warehouses and OLAP . . . . . . . . . . . . 30
4.2 Personalization of data warehouses . . . . . . . . . 33
4.3 Query recommendations . . . . . . . . . . . . . . . 36
5 Summary and discussion . . . . . . . . . . . . . . 39
6 Conclusion . . . . . . . . . . . . . . . . . . . . . . 41
1 Introduction
As information systems contain and generate ever increasing amounts ofdata, users face the tedious task of choosing among many possibly hugesources of information those likely to satisfy their needs. This problem,called information overload, led to the active development of personalized
5

6 CHAPTER II. RECOMMENDATIONS, CONTEXT AND BI
Figure II.1: Classification of personalization techniques proposed by Ben-tayeb et al. [BBF+09], according to user involvement and system functions.
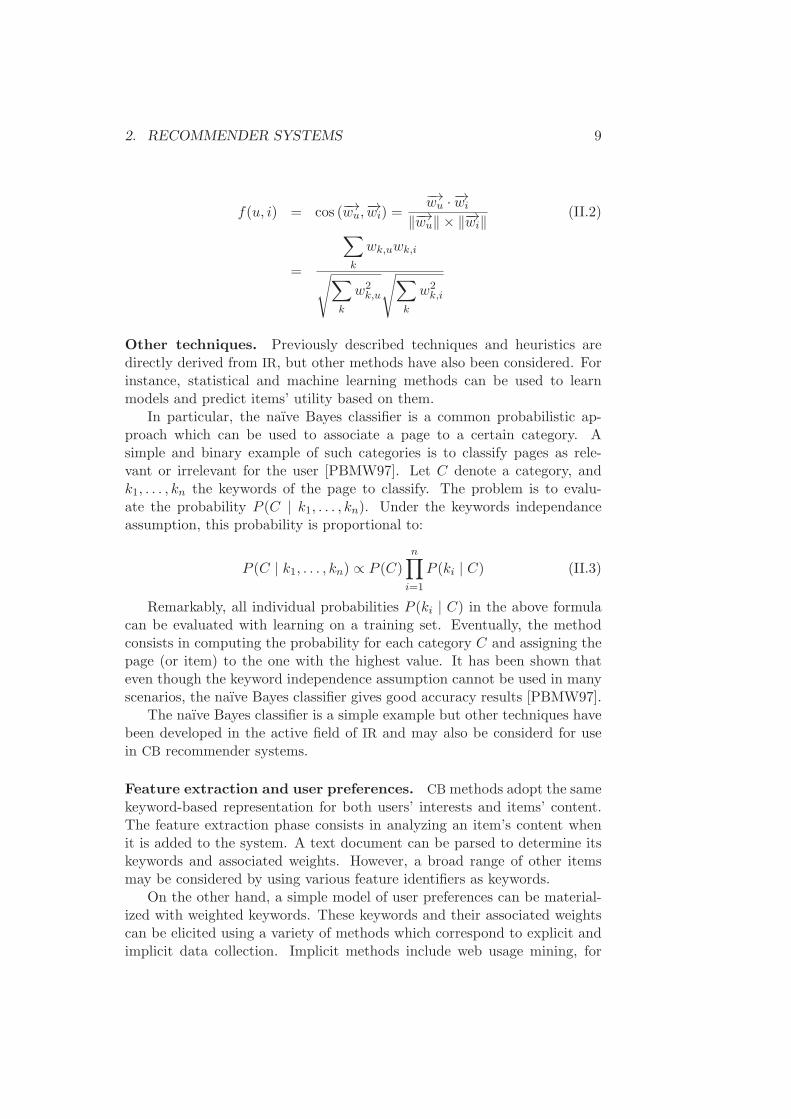
systems which aim at adapting information and services to the user, atcontent or design levels. Content-tailoring may be considered to filter oradapt content to present more relevant and adapted information to the user.Besides, different users may have distinct design preferences, e.g., in termsof layout and colors, or more generally theming options.
Bentayeb et al. classify personalization or personalized systems alongtwo axis, user involvment and system functions [BBF+09], as depicted inFigure II.1. Personalization fundamentally relies on user models which rep-resent key characteristics of the user like her hobbies, interests, goals, etc.User models are meant to identify the active user and collect various piecesof information about her, ideally so they can be understood and exploitedby both humans and machines. Previous work on user modeling led tothe development of Generic User Modeling Systems (GUMS), first meant toisolate user modeling efforts from application-specific logic. These systemshave been thoroughly reviewed by Kobsa in [Kob07].
A particular approach of personalization has been adopted with recom-mender systems (RS). These systems aim at providing suggestions of dif-ferent content, somehow related to the user’s current interests. RS presenta remarkable personalization technique as they are designed to introducea sense of novelty and serendipity so as to encourage exploration and dis-covery [HKTR04]. RS can be found in many systems nowadays but theirpopularity emerged in particular from collaborative or social Web sites.
However, most RS have relied on heavy pre-computations which reducedtheir ability to dynamically adapt to changing user needs. On the otherhand, context-aware systems have mainly focused on context modeling andacquisition, that is to leverage knowledge about the user’s environment and

2. RECOMMENDER SYSTEMS 7
dynamic behaviours to provide timely information and services. Researchin this area has mainly been driven by mobile or ubiquitous systems, forinstance with intelligent environments like a meeting room [CFJ03].
It can be observed that the two research areas of RS and context-awaresystems fundamentally share the same goal of providing personalized infor-mation and services to end-users. As a result, RS and context-aware systemscan be mutually beneficial, leading to present improved and more contex-tual suggestions [CGF07]. Our work thus aims at exploring the synergiesof these different personalization techniques, in particular in the context oflarge data warehouses and multi-dimensional data analysis.
The rest fo this chapter is structured as follows. Section 2 presents therecommendation problem and the main techniques that were developed toimplement RS. Then, Section 3 defines the notions of context and situa-tion to introduce context-aware systems, their architecture and dynamiccapabilities. Section 4 introduces multi-dimensional data analysis with datawarehouses and different forms of personalization and recommendations.Eventually, we summarize this discussion with a particular focus on connec-tions between these three research areas.
2 Recommender systems
Information systems and their users generate ever increasing amounts ofdata which leads to the infamous information overload problem. RS wereborn in this context to help users find and discover interesting items in vastsspaces of available resources [MMN02].
2.1 The recommendation problem
RS have grown increasingly popular in both industry and academia to be-come an important research area. These systems aim at helping the explo-ration of vast collections of resources by users. In an e-commerce context,suggestions can be used to encourage additional sales, e.g., in the form ofsale bundles or related items. The major focus in this field has been the useof ratings assigned by users to items so as to suggest other items of interestand thus encourage exploration.
Given a set of users U and a set of items I, the recommendation problemis commonly formulated as the maximization of a utility function f : U×I 7→R, where R is a totally ordered set of recommendations [AT05]. The coreproblem addressed by a RS is the coverage of the utility function f . Indeed,a user only rates some of the items. Estimating missing ratings then allowsto determine and recommend those with the highest scores.
An item i ∈ I may be represented with a certain number of features orcharacteristics. Characteristics of a song may be the artist, the year, thealbum, the genre, etc. Other types of items may obviously be described
8 CHAPTER II. RECOMMENDATIONS, CONTEXT AND BI
using different features, for instance a selection of important keywords in aWeb page. Similarly, a user u ∈ U is commonly described by the means ofa profile to enable further personalization.
In the rest of this section, we present the main techniques that weredeveloped to enable personalized recommendations of varied items.
2.2 Recommendation methods
The research area of RS has been very active and many techniques weredeveloped to provide users with recommendations. Major techniques havebeen thoroughly reviewed by Adomavicius et al. [AT05]. These techniquesare commonly classified into content-based, collaborative filtering (CF) andhybrid approaches. Let us first introduce CB methods which originate fromInformation Retrieval (IR) and Information Filtering (IR) areas.
2.2.1 Content-based filtering
Originating from IR and IF fields, content-based (CB) filtering methods baseon the representation of items features and user preferences in a vector spacemodel [MRS08]. Initially considered for search in text documents, thesetechniques can be used for a broad range of applications.
The vector space model. The adopted representation of documents oritems is a vector of weighted keywords. This representation is common inthe IR field, and an item (or document) can be noted as an array of weightedkeywords: d = {wk1,1, . . . , wkn,n}. Weights denote the importance of a givenkeyword in a document. A commonly used weighting scheme is that of termfrequency (TF ) - invert document frequency (IDF ) [Sal88]:
wk,d = TF (k, d)× IDF (k) (II.1)
=fk,d
maxk′ fk′,d× log
(
N
nk
)
Where N is the total number of docs and nk is the number of documentswhere the keyword k appears. The IDF contribution aims at reducing theimportance of keywords that appear in many documents. Such keywords donot help much in the filtering process since they are less discriminatory. Itmay also be noted that a normalized frequency is used for keywords in thescope of one document. This is meant to give equal chances to short andlong documents.
Given two vectors −→wu and −→wi representing respectively the user prefer-ences and the item. The utility function f can then be defined using adistance metric between these two vectors. For instance, the cosine similar-ity measure (or variants) is commonly used:
2. RECOMMENDER SYSTEMS 9
f(u, i) = cos (−→wu,−→wi) =
−→wu ·−→wi
‖−→wu‖ × ‖−→wi‖
(II.2)
=
∑
k
wk,uwk,i
√
∑
k
w2k,u
√
∑
k
w2k,i
Other techniques. Previously described techniques and heuristics aredirectly derived from IR, but other methods have also been considered. Forinstance, statistical and machine learning methods can be used to learnmodels and predict items’ utility based on them.
In particular, the naıve Bayes classifier is a common probabilistic ap-proach which can be used to associate a page to a certain category. Asimple and binary example of such categories is to classify pages as rele-vant or irrelevant for the user [PBMW97]. Let C denote a category, andk1, . . . , kn the keywords of the page to classify. The problem is to evalu-ate the probability P (C | k1, . . . , kn). Under the keywords independanceassumption, this probability is proportional to:
P (C | k1, . . . , kn) ∝ P (C)
n∏
i=1
P (ki | C) (II.3)
Remarkably, all individual probabilities P (ki | C) in the above formulacan be evaluated with learning on a training set. Eventually, the methodconsists in computing the probability for each category C and assigning thepage (or item) to the one with the highest value. It has been shown thateven though the keyword independence assumption cannot be used in manyscenarios, the naıve Bayes classifier gives good accuracy results [PBMW97].
The naıve Bayes classifier is a simple example but other techniques havebeen developed in the active field of IR and may also be considerd for usein CB recommender systems.
Feature extraction and user preferences. CB methods adopt the samekeyword-based representation for both users’ interests and items’ content.The feature extraction phase consists in analyzing an item’s content whenit is added to the system. A text document can be parsed to determine itskeywords and associated weights. However, a broad range of other itemsmay be considered by using various feature identifiers as keywords.
On the other hand, a simple model of user preferences can be material-ized with weighted keywords. These keywords and their associated weightscan be elicited using a variety of methods which correspond to explicit andimplicit data collection. Implicit methods include web usage mining, for

10 CHAPTER II. RECOMMENDATIONS, CONTEXT AND BI
instance using click-through data or the user’s browsing history. Explicitpreferences can also be employed to help determine more accuretely key-words weights, e.g., through forms asking users to rank keywords. Rankingkeywords is not possible in practice though as it introduces an importantwork load for the user. More commonly, users can be asked to order their fa-vorite categories, should items be categorized. This approach is for instanceadopted in the personalized news service proposed by Google1.
Benefits and limitations. Analyzing items’ content presents the greatinterest of making it possible to recommend items as soon as they are addedto the RS. Contrary to collaborative methods (discussed in the next section)CB methods do not suffer from the new item problem. Besides, CB sugges-tions are valuable in situations where users’ requests need to be served, e.g.,in the form of keyword-based queries.
By nature, CB methods rely on a representation of features or charac-teristics describing an items’ content. The feature extraction phase is keybut depends highly on the type of resource being processed. IR techniquesare well adapted to process text documents. However, automatic featuresextraction may be much more difficult with multimedia content like imagesor videos.
Another issue presented by CB recommender systems is the lack of nov-elty and surprise introduced in recommendations. Indeed, such systemsrecommend items similar to those the user has liked in the past.
Finally, if CB methods do not suffer from the new item problem, theyface issues with cold-start users. These users are those new to the systemand they have no associated profile or preferences. Therefore, the systemcannot offer personalized recommendations to a new user, as long as col-lected data are not sufficient. Recommendations may be bootstrapped withless personalized results though, e.g., simply with the most popular items(see for instance Youtube2).
2.2.2 Collaborative filtering
Collaborative recommender systems rely on the assumption that a user isbound to be interested by what other users with similar tastes or interestsliked. CF methods have been developed to ease information extraction usingthe collective intelligence [Ala08]. This is an important aspect of CF tech-niques since they do not rely on deep content analysis and feature extrac-tion, but primarily on ratings which remain superficial and are contributedby users themselves.
1http://news.google.com2http://www.youtube.com
2. RECOMMENDER SYSTEMS 11
User-based filtering. So called memory-based methods use the wholeset of ratings given by users to predict missing ratings. The base structurefor these methods is the user-item ratings matrix R = U ×I. The cell ru,i ofthis matrix is the rating assigned by user u to the item i. Then, various tech-niques are employed to extrapolate missing ratings and recommend itemswith the highest ratings. A rather general example of aggregation functionwhich uses ratings given by other users can be, with K a normalizationconstant:
ru,i = ru +K∑
u′∈U
sim(u, u′)× (ru′,i − ru′) (II.4)
In this aggregated rating, each contibution is weighted using a similaritymetric between users. In a first approximation, the sim(u, u′) factor canbe omitted but this leads to take into account users that may have verylittle in common with the active user u, and may thus produce less relevantrecommendations. To compute similarity between users, most popular ap-proaches use the set of items co-rated by two users u and u′, and noted Iu,u′ .The cosine similarity introduced in equation II.2 can also be used in this
context: sim(u, u′) = cos(−→ru,−→r′u). Contrary to CB methods which compute
the cosine of the angle formed by two vectors of weighted keywords, theapproach of CF methods is to use vectors of ratings, i.e., the vector spaceis not the same. Another important metric is the Pearson correlation, mostcommon to determine users’ similarity [SK09]:
sim(u, u′) =
∑
i∈Iu,u′
(ru,i − ru)(ru′,i − r′u)
√
∑
i∈Iu,u′
(ru,i − ru)2
∑
i∈Iu,u′
(ru′,i − r′u)2
(II.5)
In particular, this correlation coefficient does not only integrate absoluteratings but takes into account deviation from average user ratings. Thisaddresses the fact that different users may use the ratings scale differently.
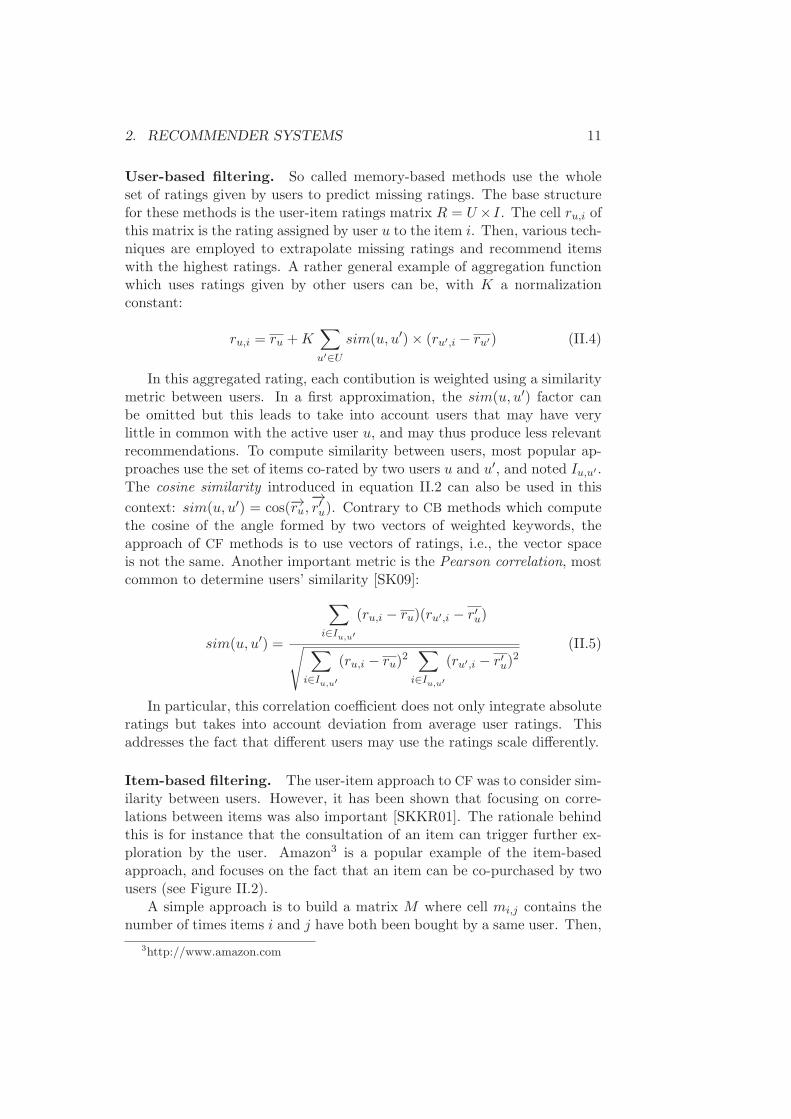
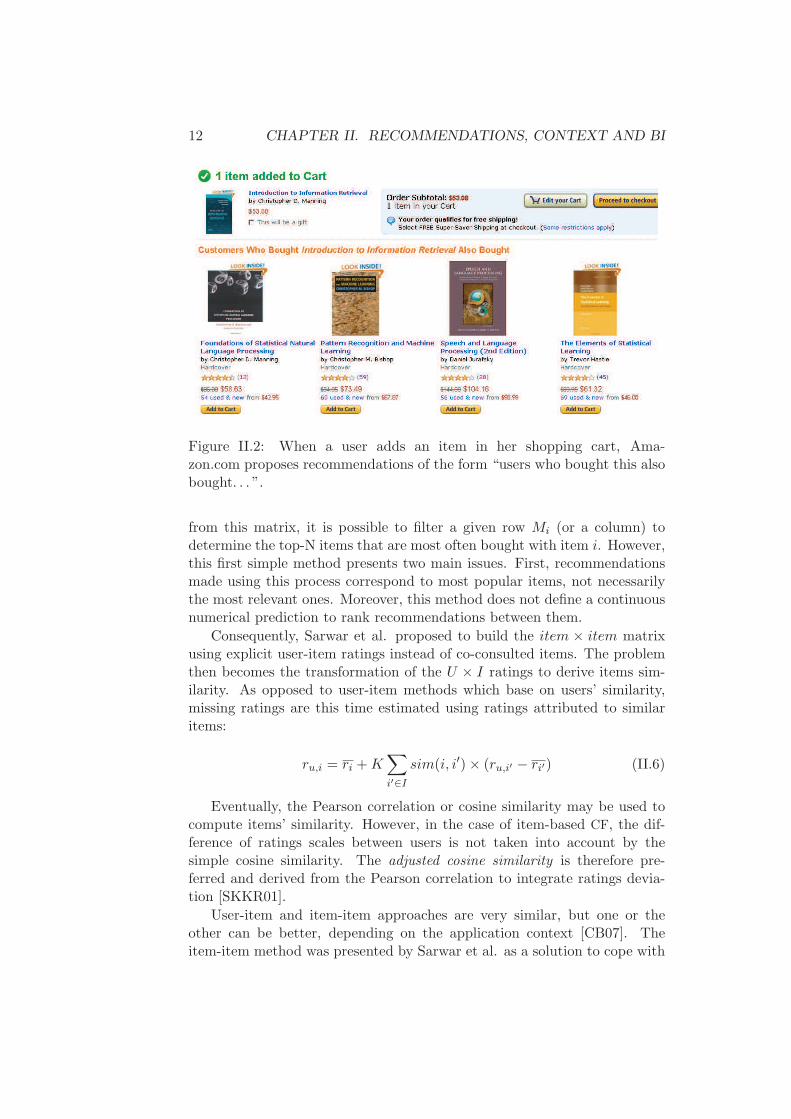
Item-based filtering. The user-item approach to CF was to consider sim-ilarity between users. However, it has been shown that focusing on corre-lations between items was also important [SKKR01]. The rationale behindthis is for instance that the consultation of an item can trigger further ex-ploration by the user. Amazon3 is a popular example of the item-basedapproach, and focuses on the fact that an item can be co-purchased by twousers (see Figure II.2).
A simple approach is to build a matrix M where cell mi,j contains thenumber of times items i and j have both been bought by a same user. Then,
3http://www.amazon.com
12 CHAPTER II. RECOMMENDATIONS, CONTEXT AND BI
Figure II.2: When a user adds an item in her shopping cart, Ama-zon.com proposes recommendations of the form “users who bought this alsobought. . . ”.
from this matrix, it is possible to filter a given row Mi (or a column) todetermine the top-N items that are most often bought with item i. However,this first simple method presents two main issues. First, recommendationsmade using this process correspond to most popular items, not necessarilythe most relevant ones. Moreover, this method does not define a continuousnumerical prediction to rank recommendations between them.
Consequently, Sarwar et al. proposed to build the item × item matrixusing explicit user-item ratings instead of co-consulted items. The problemthen becomes the transformation of the U × I ratings to derive items sim-ilarity. As opposed to user-item methods which base on users’ similarity,missing ratings are this time estimated using ratings attributed to similaritems:
ru,i = ri +K∑
i′∈I
sim(i, i′)× (ru,i′ − ri′) (II.6)
Eventually, the Pearson correlation or cosine similarity may be used tocompute items’ similarity. However, in the case of item-based CF, the dif-ference of ratings scales between users is not taken into account by thesimple cosine similarity. The adjusted cosine similarity is therefore pre-ferred and derived from the Pearson correlation to integrate ratings devia-tion [SKKR01].
User-item and item-item approaches are very similar, but one or theother can be better, depending on the application context [CB07]. Theitem-item method was presented by Sarwar et al. as a solution to cope with

2. RECOMMENDER SYSTEMS 13
the fact that the set of users may be less stable (more rapidly changing)than the catalogue of items. Besides, it is particularly adapted for caseswhere the number of users is much greater than the number of items: |U | ≫|I| [SKKR01].
Other model-based approaches. Previously presented methods arecalled memory-based methods, in that they rely on the whole set of rat-ings to make their predictions. Another direction in research work has beento build and learn models from collections of ratings to predict missing ones.
First, various probabilistic models have been proposed. Here again, thepopular Bayesian model can be used to evaluate conditional probabilities,e.g., if the rating prediction bases on the expected value:
ru,i = E(ru,i) =n∑
r=0
P (ru,i = r | ru,i′ , i′ ∈ I) (II.7)
Clustering techniques can also be used to improve CF algorithms. Thesemethods may be exploited in varied ways but they are most of the timeconsidered as a preliminary step to apply, e.g., memory-based techniques onsmaller sets of similar users or items. This can help address computationalcomplexity and thus scalability issues. For instance, the RecTree systemproposed by Chee et al. uses k-means clustering (with k = 2) to recursivelybuilding a tree structure, and recommendations are made within the leafwhere the active user belongs [CHW01].
Model-based techniques are regarded as having a better combinatorycomplexity [PHG00]. On the other hand, memory-based approaches presentgood accuracy results and are reactive to changes in the data. Therefore,these two approaches have been combined in hybrid methods [AT05].
Benefits and limitations. CF techniques present a certain number ofimportant advantages. First, they provide a sense of novelty and diversityin their recommendations, in particular with the user-item approach whichfocuses on users’ similarity, not items’. Besides, they do not require in-depthanalysis of items’ content and can therefore be employed to recommend anykind of item.
However, it is pointed out that CF techniques present various importantchallenges [SK09]. The first one and most important being the extreme spar-sity of the user×item matrix. Indeed, in many commercial applications, theRS has to work with very large datasets, and users only rate a small numberof items. In particular, this sparsity leads to significant cold-start and chal-lenges, be it for new items or new users. Indeed, new items that have notbeen rated by enough users cannot be recommended. Moreover, recommen-dations presented to new users are not likely to be relevant, as the browsingand rating history of these users is initially empty. The sparsity problem
14 CHAPTER II. RECOMMENDATIONS, CONTEXT AND BI
has been addressed using a variety of methods, including dimensionality re-duction techniques (e.g., Singular Value Decomposition, SVD) [SKKR00] toobtain an approximate ratings matrix of lower rank.
2.2.3 Hybrid methods
Numerous optimizations or variants have been proposed for CB and CF
methods independently. Beyond isolated improvements, CB and CF meth-ods are often combined to overcome some of the shortcomings of both typesof systems, resulting in hybrid methods. In this section, we briefly intro-duce these methods but we do not give much emphasize as they are inessence combinations of previously described techniques. Adomavicius etal. proposed the following classification of hybrid methods based on possi-ble combinations [AT05]:
• Methods that combine results obtained from separate CB and CF sys-tems.
• Methods that incorporate CB techniques in a CF method.
• Methods that incorporate CF techniques in a CB method.
• Methods that develop a unified model integrating some characteristicsof both approaches.
As an example of the third approach above, let us consider a CB systemrepresenting items (e.g., news articles) and users’ profiles using vectors ofweighted keywords. The system could also exploit ratings given by users toarticles and form a hybrid recommendation strategy. For instance, items’similarity may be measured using the cosine similarity on keyword vec-tors, hence eliminating the new item problem thanks to preliminary contentanalysis. On the other hand, users’ similarity may base on the Pearson cor-relation of rating vectors, the cosine similarity of keyword-based profiles oreventually a (linear) combination of both.
2.3 Extensions and perspectives
In this section, we present a certain number of approaches that have beenconsidered to improve existing RS. First, an important trend is to leveragetrust networks to improve the selection of similar or close users. Then,semantic-based systems help broaden the flexibility and expressiveness ofrecommendation queries. Finally, modeling and exploiting the user’s contexthas been an important research direction to provide further personalizedrecommendations.

2. RECOMMENDER SYSTEMS 15
2.3.1 Trust networks
As we presented the main CB and CF recommendation approaches, theimportance of selecting users similar to the current one was highlighted.Remarkably, recent work have focused on the use of trust networks to re-fine this selection and narrow down the collaborative contribution to usersmore trustworthy for the current one. In particular, it can be argued thattrust networks help deal with critical sparsity and cold-start issues. Indeed,trust data can be exploited to augment the overlap between information onusers’ in the system, which in turn helps increase its coverage. Jamali etal. indicate that trust-based approaches use ratings provided by direct orindirect neighbors and may lead to lower precision, as the distance betweenusers increases [JE09]. For this purpose, the authors propose a random-walk model which allows them to propose a confidence indicator for theirrecommendations.
Massa et al. proposed the use of a trust network using data from theepinions.com service [MB04, MA04]. With this service, users are invitedto review items but also to rate reviewers and indicate how helpful theyjudged their reviews. Using this already established trust network, Massaet al. compare two users using their distance, that is the number of edgesseparating them in the graph. In this approach, users explicitly build their“webs of trust”, which can in the end be aggregated to build a global trustnetwork. Massa et al. use this trust network, in conjunction with traditionalCF techniques to provide a final trust-based CF ranking.
Beyond this, O’Donovan et al. focused on the automatic inferrence oftrust data from ratings [OS05]. The authors argue that the collaborativecontribution in items’ scoring should also depend on the item itself. Thereason for this is that a given user may be more or less relevant to ratedifferent items. The computational model they propose for trust scores dis-tinguishes the consumer user, producer users and items, which leads to a3-dimensional scoring. The consumer is the active user, the one recommen-dations are destined to. On the other hand, producers are users selectedto contribute to items ratings. Finally, the last dimension of their modelstands for the items to recommend.
2.3.2 Semantic-based recommendations
Another important area of research for RS is that of knowledge-based meth-ods, which pursue the use of reasoning to maximize the match between anitem’s features and the user’s interests.
Initially, logic- an case-based reasoning were considered [Bur00] butknowledge-based RS have mainly been enabled by the emergence of Se-mantic Web technologies. These technologies aim at easing the represen-tation and exchange of knowledge in distributed and heterogeneous envi-

16 CHAPTER II. RECOMMENDATIONS, CONTEXT AND BI
ronments [EGCB09]. The common ground of these semantic technologiesis a rich typed graph model (RDF). On top of this, schemas can definedusing RDF-S and OWL frameworks and complex queries can be expressedusing the SPARQL query language [DKDA07]. Most commonly, knowledgebases are defined as ontologies within these frameworks but other methodsmay be used [Gha02]. Ontologies in RS are particularly well suited to helpinter-operability in heterogeneous environments, that is with distributed re-sources of varied types [PdCDL08]. Ziegler et al. presented a RS for suchdistributed environments. In their approach, agents interact and share par-tial trust and rating functions over a set of common products [Zie05]. Inparticular, this system considers all user and rating data distributed buteventually, recommendations are computed locally.
Aside from distributed environments which represent a particular con-figuration, ontologies may be used in CB or hybrid approaches to improvethe representation and understanding of users’ interests and items’ con-tent [CFV07, ZStL04]. Besides, logic rules can be defined (in the schemaitself) to use inferencing capabilities and derive additional (and potentiallymissing) information [BFPAGS+08]. As an example, this may help deal withpartial user preferences and reduce the cold-start issue. In order to addressthe issue of changing users’ interests, Loizou et al. present a system thatdynamically chooses input and output spaces for recommendation based onthe query, recommendation and rating history [LD06]. The work presentedin this paper focuses on the use of an ontology to incorporate contextual el-ements about items’ content and the recommendation process. Integratingcontextual aspects in RS has also been an active research area, which wenow discuss separately.
2.3.3 Introducing context in recommender systems
RS still need to base on a deeper understanding of the user and his context tooffer varied and adapted recommendations [AT05]. So called context-awareRS aim at improving the information filtering process by taking into accountsome elements about the user’s context, like her location, agenda, socialenvironment and preferences. However, actually used context attributes arelargely dependent on the application [WS07]. It is worth noting that RS
and context-aware systems fundamentally share the same goal, that is tooffer relevant personalized information and services [CGF07]. It is commonto distinguish between information about the user profile and the context.While profiles describe users themselves, context knowledge describes theenvironment they interact with and may bear more dynamic changes.
An example of context-aware RS is the CARS system proposed by Abbaret al., defining a personalized access model to information, with variouspersonalization concepts and services [ABL09]. In particular, the followingcontext attributes are considered: date, time (of the day), device, IP address
2. RECOMMENDER SYSTEMS 17
(for geo-location), browser and operating system. Values of these parametersare organized into hierarchies, so authors then use agglomerative hierarchicalclustering and k-means to cluster log records into separate contexts.
Beyond custom systems and models, the remaining of this sectionpresents two important approaches to introduce some degree of context-awareness, respectively in CF and CB systems.
Multi-criteria ratings and multi-dimensional methods. In CF sys-tems, simple ratings do not carry rich semantics which limits their exploita-tion for fine-tuned recommendations. One approach in this regard is calledmulti-criteria ratings and enables the association of multiple ratings to agiven item in different categories. A restaurant could be rated according tothe service, the atmosphere, the food, etc. Similarly, books, hotels and manyother items can be rated with regards to various aspects. Recommendationswith multi-criteria ratings may simply be broken down and use (linear) com-binations of the techniques previously described, for single-criterion ratings.
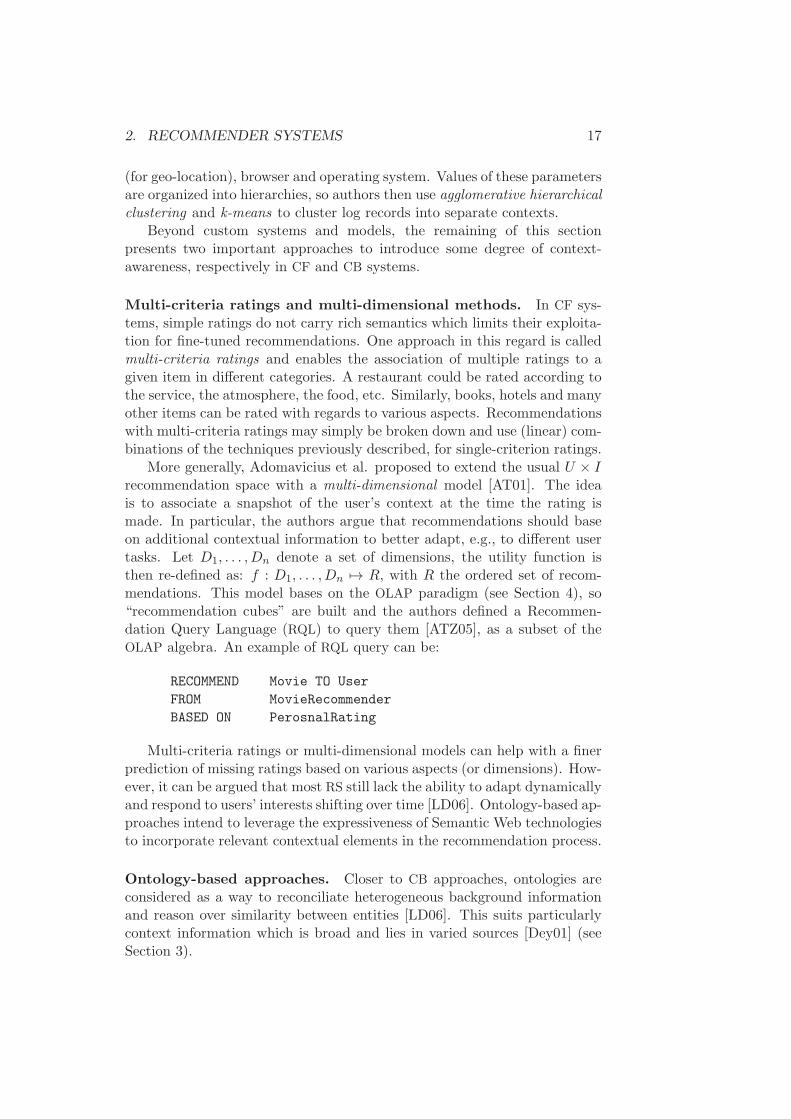
More generally, Adomavicius et al. proposed to extend the usual U × I
recommendation space with a multi-dimensional model [AT01]. The ideais to associate a snapshot of the user’s context at the time the rating ismade. In particular, the authors argue that recommendations should baseon additional contextual information to better adapt, e.g., to different usertasks. Let D1, . . . , Dn denote a set of dimensions, the utility function isthen re-defined as: f : D1, . . . , Dn 7→ R, with R the ordered set of recom-mendations. This model bases on the OLAP paradigm (see Section 4), so“recommendation cubes” are built and the authors defined a Recommen-dation Query Language (RQL) to query them [ATZ05], as a subset of theOLAP algebra. An example of RQL query can be:
RECOMMEND Movie TO User
FROM MovieRecommender
BASED ON PerosnalRating
Multi-criteria ratings or multi-dimensional models can help with a finerprediction of missing ratings based on various aspects (or dimensions). How-ever, it can be argued that most RS still lack the ability to adapt dynamicallyand respond to users’ interests shifting over time [LD06]. Ontology-based ap-proaches intend to leverage the expressiveness of Semantic Web technologiesto incorporate relevant contextual elements in the recommendation process.
Ontology-based approaches. Closer to CB approaches, ontologies areconsidered as a way to reconciliate heterogeneous background informationand reason over similarity between entities [LD06]. This suits particularlycontext information which is broad and lies in varied sources [Dey01] (seeSection 3).
18 CHAPTER II. RECOMMENDATIONS, CONTEXT AND BI
Kim et al. propose a layered ontology which describes different aspects:(a) products, (b) records or shopping history, (c) the location and (d) theconsumer [KK07]. In particular, the authors define preference scores forelements of the ontology – at instance and class levels – to select prod-ucts of interest. Instances are simply scored using shopping records and anaggregated score is computed for classes, taking into account the conceptshierarchy.
With their COReS system, Costa et al. argue for the inclusion of domain-specific preferences [CGF07]. Traditional CF techniques rely on the wholeset of ratings to determine users’ similarity and thus recommend items. Thishas significant implications and reduces the ability of the system to react todifferent tastes in different domains. For instance, if two users liked the samemovies, they would likely get recommendations for the same restaurants,even though they may have different culinary preferences. In response tothis, COReS uses domain ontologies to augment context information andperform suitable reasoning.
The News@hand system presented by Cantador et al. bases on a con-trolled and structured vocabulary – defined in an ontology – to representboth items’ features and users interests [CBC08]. The hybrid recommenda-tion process integrates these representations, along with semantic relationsdescribed in the ontology. Moreover, News@hand proposes recommenda-tions of news items using two different models: one for long term user’sinterests and one for short term adaptation to the user’s context. Newsarticles are automatically retrieved and annotated with weighted concepts,using TF-IDF-like weights. Then, inside a session, the user’s reading ac-tivity is analyzed to determine what the authors call the semantic runtimecontext. Similarly, this structure is represented as a set of concepts, withweights decreasing as time passes.
To conclude, we reckon RS could greatly benefit from an increasedcontext-awareness, for instance to enable further personalization and dy-namic adaptation. However, context modeling and management is a com-plex domain in itself. In the next section, we thus review related work inthe area of context-aware systems.
3 Context-awareness
In the previous section we presented work related to RS and in particular atrend which pushes for the integration of some context sensitivity. Contextis a very general term that led to the active development of a correspondingresearch area. In this section, we define context and context-aware comput-ing and we review related work in this area.

3. CONTEXT-AWARENESS 19
3.1 Definition, characteristics and usage of context
The notion of context appeared in different disciplines like artificial intel-ligence, databases, natural language processing [AS97], etc. However, thisresearch area has been mainly driven by work on context-aware computingand underlying modeling issues.
3.1.1 Preliminary definitions
Let us first introduce definitions of important terms which stand for ratherabstract concepts and have thus led to varying definitions.
Context. Dey and Abowd present the context as a key element to enrichand increase human interactions using an implicit common understanding,e.g., of everyday situations [DA99]. One can easily imagine that the notionof context is thus extremely broad and complex, in particular when appliedto human-computer interaction. As a result, authors have provided varyingdefinitions in previous work, trying to balance between the generality of thenotion and concrete operational needs [ZL07].
Definitions by examples are the most simple and operational since theyjust enumerate attributes that can be used and considered as context.Among possible attributes, location has been the most exploited in previouscontext-aware systems [KPVOGM05]. For instance, Schilit et al. presentedin 1994 the ParcTab system using as context information the user’s currentlocation (or room) and the device [SAW94]. Therefore, the type of deviceand its underlying capabilities are also commonly used attributes. Mobilecomputing is indeed an important use case of context-aware systems [CK00].
However, context cannot be limited to device and location [SBG99] andit is important for application designers to understand what context is andhow it can be used. Dey gave the following definition of context which isnow commonly accepted:
“Context is any information that can be used to characterize thesituation of an entity. An entity is a person, place, or objectthat is considered relevant to the interaction between a user andan application, including the user and applications themselves.”(Anind K. Dey) [Dey01]
Context-aware computing. Schilit and Theimer first coined the phrasecontext-aware to denote applications that react to the user’s location, objectsnearby and changes to these properties over time [SAW94]. In their vision,an application is said context-aware if it uses or reacts to knowledge aboutwho you are, where you are or what/who is around you. The definitionby Dey appears to be more general and thus more operational in variedapplication scenarios:
20 CHAPTER II. RECOMMENDATIONS, CONTEXT AND BI
“A system is context-aware if it uses context to provide relevantinformation and/or services to the user, where relevancy dependson the user’s task.” (Anind K. Dey) [Dey01]
Situation. The complexity and broadness of context led to the introduc-tion of a higher-level abstraction, called situation and sketched by Dey as adescription of the states of relevant entities [DA99]. A simple but remarkabledefinition of the situation was later formulated by Yau et al. as follows:
“A situation is a set of context (information) in the applicationover a period of time that affects future system behavior.” (Yauet al.) [YL06]
In particular, this definition indicates that designers of context-awaresystems should identify and focus on subsets of context information thatinfluence a given behavior of their system. Besides and most importantly,the time aspect is crucial and the definition highlights the fact that contextknowledge is inherently time-dependent [Sch06a], among other characteris-tics that we now present.
3.1.2 Characteristics of context information
Context information or knowledge presents characteristics which need to becarefuly analyzed as they push requirements on representation formalismsand context models [HIR02, BBH+10].
Sources and heterogeneity. Previous definitions of both context andsituation reveal the important variety of resources and facts which maycontribute to the description of a user’s environment. This is in particulartrue since context information often originates from heterogeneous sources indistributed environments. Among many possible examples, we can mentionprivate corporate information systems (CRM, ERP, BI platform, etc.), webservices, publicly accessible ontologies, etc.
Henricksen et al. recognize three main sources of context informationbased on how and where it is produced, be it from sensors, human users orderived through further computation [HI04]. User-provided information maybe rather static or dynamic. Static facts are rarely changing and explicitlyprovided by the user or obtained from (controlled) background knowledge.Therefore, they are regarded as highly accurate which differs from dynamicinformation, more often out-of-date or incomplete. Besides, derived infor-mation can also introduce errors or imprecisions. Sensors of context infor-mation will be further discussed along with context data acquisition (seeSection 3.1.3).
3. CONTEXT-AWARENESS 21
Incompleteness and uncertainty. Context data has often been pre-sented as imperfect by nature, be it unknown, ambiguous, imprecise orerrorneous [HI04]. In their extensive survey on context modelling and rea-soning techniques, Bettini et al. state that “one of the key requirements ofcontext-awareness is capturing and making sense of imprecise, and some-times conflicting data, about the physical world” [BBH+10].
We argue that the caution paid to uncertainty has mainly been moti-vated by the mere origin of most context-aware systems. Indeed, systemsthat aim at modeling context to provide adapted information and servicesmostly emerged from ubiquitous computing and so-called intelligent envi-ronments. Systems in this area primarily made use of networks of sensors toobtain information about the physical world, which is particularly prone toincompleteness or inaccuracy. Although uncertainty is an interesting topic,we do not consider this is so important when dealing with dedicated softwaresensors.
Time variability. The above mention of static and dynamic facts is amore general and common issue in context modeling. We previously men-tioned that context knowledge is inherently time-dependent [Sch06a] andthe aim of context-aware applications is to timely react and adapt to possi-ble environment changes. Bettini et al. therefore insisted on the importanttimeliness of context information and argued that it should natively be cap-tured by context models [BBH+10].
The problem of context information validity evolving over time is referredto as the aging. It can be noted that the aging is not uniform accrossdifferent aspects of the context [Sch06a]. That is, the validity of differentfacts evolves at different paces over time, from static to rapidly changing.For instance, the user’s hobbies and her employer are rather static factswhereas her location or current task are highly volatile.
Resulting from the evolution of information validity over time, contexthistory management is also another valuable feature to consider. In particu-lar, storage or persistence of the context composes a history, a rich resourcewhich can be used to enable reasoning over time [SLP04]. For instance,the user’s interaction history may be mined to detect common patterns andprovide predictive capabilities [Sch06a]. If history sounds like simple persis-tence, it brings considerable value to systems willing to adapt and opens animportant door to apply reasoning and machine learning techniques.
Eventually, Schmidt mentioned that imperfection and dynamics are twoaspects of context information that have been poorly explored by researchso far [Sch06a].
Security and privacy. Context information is by nature often personaland thus particularly sensitive. Consequently, models, architectures and
22 CHAPTER II. RECOMMENDATIONS, CONTEXT AND BI
frameworks need to integrate security and privacy as a core requirement oftheir design [CK00].
Tatli suggested three main requirements and proposed a context datamodel to handle privacy-related issues [Tat06]. An interesting particularityof this model is the use of blurring techniques, e.g., to return range valuesrather than exact ones.
Even if “technology in itself is rarely inherently bad (. . . ) it can be usedfor good or bad purposes” [WFG92]. Therefore, varying regulations in differ-ent countries control storing and usage of users’ personal data. These legalaspects often impose important limitations and should also be considered inthe design of context-aware systems.
3.1.3 Acquisition of context information
As mentioned previously, context information originates from differentsources and can be acquired in a variety of ways at different levels. Thisresults in distinct acquisition approaches described below [BDR07]:
Direct sensor access. In this approach, the application has direct accessto a sensor (in the hardware sense of the term). Examples of thesesensors include but are not limited to a GPS, a motion detector, aluminosity sensor, etc. For instance, most modern smartphones inte-grate a GPS which proves extremely useful for many location-basedapplications.
Middleware infrastructure. Robust software design and developmentmethods push for encapsulation and componentization, which leadsto layered approaches for context-aware applications. This is in par-ticular interesting to build components responsible for hiding the un-necessary complexity of context details, often very granular (e.g., GPS
coordinates). The layered architecture of context-aware middlewaresand applications will be further discussed in Section 3.3.1.
Context server. Pushing the approaches above further, context data man-agement is significantly improved using a client-server architecture.The context server consolidates partial context information and en-ables sharing with multiple clients or devices. Moreover, the servercan relieve clients from resource-intensive processing and perform con-solidated consistency checking.
Context information is either explicit – that is provided by the user – orimplicit [SBG99]. Information is said implicit when it is derived or collectedfrom a range of sources called sensors [HIR02]. Indulska et al. proposedto classify sensors as physical, virtual and logical [IS03]. The authors ini-tially considered location-related sensors but this classification holds moregenerally and can be described as follows [BDR07]:

3. CONTEXT-AWARENESS 23
Physical sensors. Many physical sensors are rather commonly availablenowadays. This includes hardware sensors like cameras, microphones,GPS, touch-sensitive screens, etc. These sensors prove useful in sce-narios which require to capture information about the user’s physicalenvironment.
Virtual sensors. A sensor is said virtual if it is an application or softwaresource of context information. For instance, observation plugins areused in [Sch06b] to obtain information on users’ actions and manipu-lated content in an unobtrusive manner.
Logical sensors. Logical sensors provide an additional layer of abstractionand may combine information from other sensors. Logical sensors canprovide information consolidated at a higher-level, or inferred usingreasoning techniques.
3.2 Context and situation modeling
In the previous section, we introduced the notions of context and situationand presented, in particular, characteristics of context information whichpush requirements on models. For these notions, this section discussesmodels which are required from machine-representation and computationalperspectives. It should be noted that an interesting survey and analysisframework for context models was published by Strang et al. [SLP04], laterextended and structured by Bolchini et al. [BCQ+07].
3.2.1 Different formalisms
Research on context modeling produced different types of models. Someused simple key-value pairs which lack semantics, others relied on objectmodels which may be hard to share between client applications. Finally,more recent works have proposed ontology-based models that enable a uni-form representation (e.g., using RDF) and improve reasoning[LCCH10].This section describes the main types of formalisms that have been con-sidered to model context.
Key-value models. The most simple context models are based on key-value pairs to represent named attributes [SLP04]. These attributes capturevarious characteristics of interest, for instance the most common one, theuser’s location.
Key-value pairs are often used as they are particularly easy to manage.However, they often lack semantics and are most of the time used to performsome exact matching.

24 CHAPTER II. RECOMMENDATIONS, CONTEXT AND BI
Markup scheme models. Markup scheme models rely on a markup-text representation of context data, for instance as XML. The aim of thisapproach was to encourage a richer representation of facts and enable moresophisticated querying and reasoning.
For this purpose, most markup-based approaches rely on a hierarchicaldata structure. Even though tree structures convey more semantics thansimple key-value attributes, we reckon that choosing between markup-basedand other models is more of a serialization problem and may/should be de-correlated from the core expressiveness of the model. For instance, RDF
graphs that describe ontology-based models (described later) may also beserialized as XML. To conclude, markup approaches often lead to custom orproprietary definitions and models which discourage sharing and re-usability.
Object models. Key-value pairs and markup text are rather common ap-proaches, easily shared between platforms, operating systems, etc. Objectmodels present the advantatage of being pragmatic and commonly under-stood by application developers. However, this formalism for models lacksa common representation suitable for sharing and re-use in distributed en-vironments using, e.g., different programming languages [CFJ03].
The particularity of object-oriented models is to easily enable encapsu-lation. This allows to hide some of the complexity of low-level context in-formation, for instance by providing convenience methods to access filtereddata. More generally, object-oriented formalisms only enable the exploita-tion of context knowledge through pre-defined interfaces.
Semantic models. Context aims at representing users, their environ-ments and interactions between all concerned entities. More generally,Kofod-Petersen et al. argue that context is knowledge, not a special typeof information [KPC06]. Therefore, context modeling should greatly ben-efit from research in the area of knowledge representation. For instance,description logics enable symbolic knowledge representation and reasoning.In particular, the OWL-DL subset of the OWL language – used to defineontologies – is a description logic [BBH+10].
The first approaches to model context using ontologies introduced this asa necessity to better normalize and formalize context information [OA97].More precisely, Strang et al. indicate that ontologies provide a uniformrepresentation formalism for the core concepts of the model, plus any kindof subconcepts or facts [SLP04].
There are varied examples of context model using ontologies. Again,context is a broad notion and authors do not seem to converge towardsa commonly accepted context ontology. As an example of ontology-basedmodel, the CoBrA-ONT ontology presented by Chen et al. in [CFJ03] de-scribes entities and relations of interest in the domain of an intelligent meet-

3. CONTEXT-AWARENESS 25
ing room. Gu et al. also presented an ontology-based model for intelligentenvironments, focusing on the following classes of entities: person, location,activity and computational entity [GWPZ04]. Sieg et al. use backgroundknowledge ontologies and model the context with scores assigned to con-cepts of these ontologies [SMB07]. These scores are dynamically adjustedusing spreading activation, in response to the user’s dynamic behaviour.
Heckmann et al. reconciliated user, context and resources models intothe notions of situation [Hec05b] and situated interaction [Hec05a]. Situ-ation statements were introduced by Heckmann et al. as a homogeneousdata structure to represent the unit of information in situation modeling.These statements extend simple subject-predicate-object triples with addi-tional metadata and reference entities described in ontologies like the generaluser modeling ontology (GUMO) [Hec05b].
Strang et al. summarized their analysis of different model formalisms,placing more hope in ontology-based approaches [SLP04]. The authors arguethat ontologies are best suited to handle characteristics of context informa-tion previously presented.
3.2.2 Categories or dimensions of context information
Since context information is broad, structuring it is key to enable an easierinterpretation – in particular by client applications [DA99] – with, for in-stance, general pre-defined categories. Various model dimensions have beenproposed in the literature. The most simple categorizations distinguishedbetween personal and environmental context knowledge [GS01]. Schmidtproposed a context model structured according to three categories: self,activity and environment [Sch02].
With a more operational focus, Zimmermann et al. propose the follow-ing five fundamental categories of information to extend the context defini-tion [ZL07]:
1. Individuality : this category contains knowledge about the entity ofinterest, be it a real user, an applicative agent, etc.
2. Time: time-variability of context information is a key aspect (see Sec-tion 3.1.2) and this category represents time-related information, forinstance the user’s time zone or the current time would stand in thiscategory. Besides, the time dimension may be further structured, e.g.,exposing work hours, holidays, etc.
3. Location: location has often been regarded as a key parameter of con-text. Location can be physical (e.g., GPS coordinates) or virtual (e.g.,the IP address in a network), absolute or relative.
4. Activity : the user’s needs are significantly determined by her currentactivity, which may be represented with goals, tasks and actions. Ac-
26 CHAPTER II. RECOMMENDATIONS, CONTEXT AND BI
tivity theory has also been used to model activities in [KPC06], butlittle has been done to indicate how this information can be captured.
5. Relations: the relations category provides structure to entities byrepresenting their interactions or dependencies. Zimmermann distin-guishes social, functional and compositional relations [ZL07].
In their data-oriented survey of context models [BCQ+07], Bolchini etal. propose to categorize aspects captured by existing models around space,time and related history, subject of the model and the user profile.
To conclude, it is commonly acknowledged that structuring context in-formation using dimensions make the model more operational. If suchgeneral dimensions have a real interest, we reckon that pragmatic context-adaptation will most of the time involve application-specific categorizationin more sophisticated models.
3.3 Context management
The previous sections presented characteristics of context information andmodels that are designed to represent, interpret and reason on this knowl-edge. This section presents context-aware systems and discusses their ar-chitecture, common context management tasks performed and eventuallydynamic aspects.
3.3.1 Architecture
Architecture applies at different levels for context-aware systems. First, theinternal perspective focuses on the core architecture of systems managingusers’ context data, often described in a layered manner. Then, frameworksand services can be proposed to help consume context information and buildcontext-aware clients in heterogeneous environments.
Proposed context-aware systems may be either centralized or dis-tributed [HIMB05]. However, centralized architectures have the great ad-vantage of facilitating information completeness and consistency manage-ment. For instance, the Context Broker Architecture CoBrA bases ona central broker which collects and aggregates data from heterogeneoussources [CFJ03]. Reconciliation can be helped by using ontologies and rea-soning, as in [LCCH10].
Context management layers. More generally, architectures developedfor context-aware systems usually base on a layered approach, even thoughnaming of layers and functional ranges may vary [BDR07]. In particular,decoupling context acquisition from its usage is key to handle data diversityand encourage reusability accross context-aware applications.
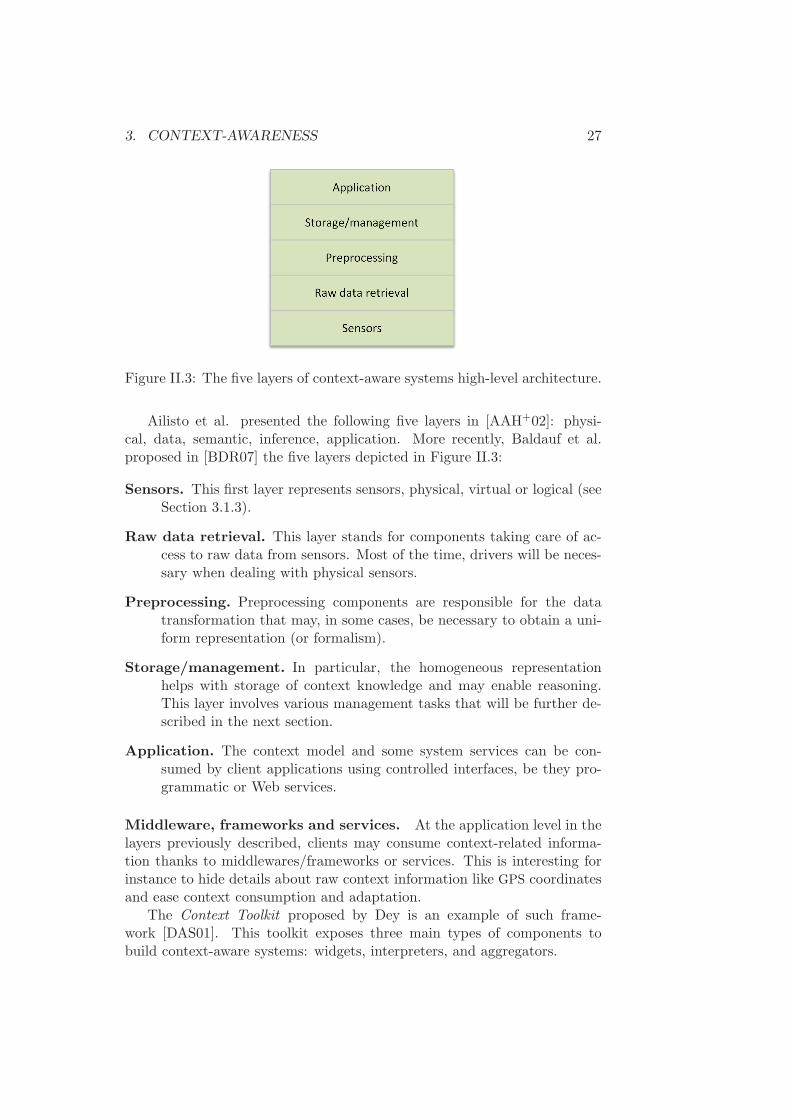
3. CONTEXT-AWARENESS 27
Figure II.3: The five layers of context-aware systems high-level architecture.
Ailisto et al. presented the following five layers in [AAH+02]: physi-cal, data, semantic, inference, application. More recently, Baldauf et al.proposed in [BDR07] the five layers depicted in Figure II.3:
Sensors. This first layer represents sensors, physical, virtual or logical (seeSection 3.1.3).
Raw data retrieval. This layer stands for components taking care of ac-cess to raw data from sensors. Most of the time, drivers will be neces-sary when dealing with physical sensors.
Preprocessing. Preprocessing components are responsible for the datatransformation that may, in some cases, be necessary to obtain a uni-form representation (or formalism).
Storage/management. In particular, the homogeneous representationhelps with storage of context knowledge and may enable reasoning.This layer involves various management tasks that will be further de-scribed in the next section.
Application. The context model and some system services can be con-sumed by client applications using controlled interfaces, be they pro-grammatic or Web services.
Middleware, frameworks and services. At the application level in thelayers previously described, clients may consume context-related informa-tion thanks to middlewares/frameworks or services. This is interesting forinstance to hide details about raw context information like GPS coordinatesand ease context consumption and adaptation.
The Context Toolkit proposed by Dey is an example of such frame-work [DAS01]. This toolkit exposes three main types of components tobuild context-aware systems: widgets, interpreters, and aggregators.
28 CHAPTER II. RECOMMENDATIONS, CONTEXT AND BI
CASS is an example of server-based context management framework thatwas presented by Fahy et al. [FC04]. The authors argue that serparatingcontext-based inferences and behaviours from application code paves theway to context-aware services configurable by users. About CASS, Bolchinimentions that it “manages both time and space, taking into account thecontext history, and provides context reasoning; it does not contain userprofiling capabilities.” [BCQ+07].
It is undoubtedly true that frameworks facilitate the development ofcontext-aware applications, e.g., by providing re-usable and extensible code.However, this approach often lacks the flexibility (client-wise) of Web ser-vices. For instance, two different devices in heterogeneous environments maynot allow the same programming language but they would likely both be ableto consume Web services via HTTP requests. For instance, SOCAM – forService-Oriented Context-Aware Middleware – aims at enabling the rapidprototyping and development of context-aware mobile services [GPZ05]. SO-
CAM defines context providers and interpreters to handle data acquisitionand processing.
These examples of context-aware systems and middlewares are far froman exhaustive list, but more complete surveys have already been presented,for instance in [BCQ+07, BDR07].
3.3.2 Dynamic management
Time-variability is a key characteristic of context information (see Sec-tion 3.1.2). A complete context-aware system approach thus needs to handlecontext construction but also dynamic maintenance aspects. In this section,we review work related to context usage at runtime and dynamic manage-ment aspects in particular.
Context usage and management. Context information acquisition hasbeen thoroughly investigated by previous research (see Section 3.1.3). Thegoal of data acquisition is first to build and initialize the context modelso the system can benefit from its dimensions. However, Zimmermann etal. mention that “something is context because of the way it is used ininterpretation, not due to its inherent properties” [ZL07]. Therefore, contextusage probably matters more than its acquisition.
Application developped using context-aware systems – in particular viadefined frameworks – generally consume information in either synchronousor asynchronous manner [BDR07]. Synchronous context consumption in-volves frequent polling which may be particularly resource intensive andleaves to the client the task of determining differences. On the other hand,the asynchronous consumption mode bases on the publish-subscribe patternfor event management. Subscribers or clients register so they can be notifiedby the system when a specific event occurs, as in [DSP09].
3. CONTEXT-AWARENESS 29
Dynamic evolution. Context-aware systems target dynamic adaptationof information and services. Such systems therefore need a strategy to handleactive components and knowledge evolution. However, dynamic contextmanagement has rather poorly been addressed by previous research [Sch06a].
Euzenat et al. approach the problem of dynamics with a focus on activecomponents. They argue in [EPR08] that context-aware systems in dis-tributed environments require the ability to dynamically integrate new andsometimes unexpected entities, be they real users and objects or computa-tional entities. In particular, the discussion adopts a data representationpoint of view. It highlights the fact that ontologies provide a homogeneousknowledge representation and ease the dynamic definition and integrationof new types of data. On the other hand, the definition of dynamic compu-tational entities responsible for actual data management and manipulationis almost ignored.
As discussed in Section 3.1.2, the validity of context information evolesover time. History management is thus an important component of contextmanagement systems. In particular, the history is composed of persistedcontext knowledge, which thus needs to integrate time-related metadata,e.g., a timestamp and a lifetime. If history sounds like simple persistence, itbrings considerable value to systems willing to adapt and opens an impor-tant door to perform reasoning over time or apply machine learning tech-niques [SLP04].
In event-driven systems and for instance active databases, the ECA
framework has been used to define active rules with clear declarative se-mantics: ON event IF condition DO action. In case a certain event occursand a specified condition is satisfied, the desired action is eventually per-formed [TSM01]. This framework seems particularly well adapted to ap-proach the issue of context knowledge maintenance. In the ECA framework,Laitaki presents the use of SPARQL-based rules to perform reasoning oncontext data represented in RDF graphs [Lai07]. Interestingly, the ECA
framework has also been considered to introduce dynamics in data ware-houses and multi-dimensional analysis [TSM01]. In a more recent work,Ravat et al. make use of the ECA framework to perform dynamic querypersonalization, in response to OLAP operations (events) performed by theuser to move from one analysis context to another. Query personalizationand recommendations will be further discussed in the next section.
To conclude, beyond pragmatic concerns related to actual context man-agement, Zimmermann introduces two interesting notions about contextdynamics: transition and sharing [ZL07]. First, capturing and modelingcontext transitions would be extremely valuable, for instance to determinea change of focus from the user. Second, sharing is defined as what happenswhen two contexts, e.g., from different entities, base on the same informa-tion or knowledge. In their discussion, Zimmermann et al. focus on thevalue brought by additional knowledge or inferred relations but they do not
30 CHAPTER II. RECOMMENDATIONS, CONTEXT AND BI
address privacy and security issues. Even though this discussion on contexttransition and sharing is interesting, concepts introduced still lack a properformalization and tangible implementations.
4 Data warehouses and recommendations
In this section we present previous work related to multi-dimensional datawarehouses (DW), for personalization and recommendations in particular.First, Section 4.1 introduces DWs and On-Line Analytical Processing (orOLAP) approaches. Then, we review in Section 4.2 methods that have beenconsidered to integrate personalization in warehouses. Last, Section 4.3 dis-cusses different kinds of recommendations proposed for DW-related content.
4.1 Data warehouses and OLAP
In this section, we introduce the basics of the multi-dimensional model sup-ported by DWs. Due to its important interest in both academia and industry,research on data warehousing produced many in-depth studies, so our aimhere is not to be exhaustive but rather to introduce the key concepts usedin the area.
4.1.1 Data warehouses and the multi-dimensional model
Let us first present DWs and the switch from relational to multi-dimensionalstorage and modeling of data.
From relational to multi-dimensional databases. Relationaldatabase management systems (RDBMS) are extensively used in produc-tion systems. The design of relational schemas is often optimized forOn-Line Transaction Processing (OLTP) thanks, e.g., to a high degreeof normalization. The requirements of OLTP applications (consistency,recoverability and concurrency) are quite different from those of OLAP
applications [CD97]. In particular, OLAP systems aim at supporting thedecision making process of knowledge workers thanks to sophisticatedanalysis that aggregate large amounts of data [CT98]. Chaudhuri mentionsthat for this purpose, “historical, summarized and consolidated data ismore important than detailed, individual records” [CD97]. OLAP analysisand operations will be further described in the next section.
At the heart of the OLAP approach is the DW, a large repository contain-ing historical data from several sources of an organization, for analysis pur-poses [PJ01]. Data are usually extracted from various production systemsto be transformed and eventually loaded in the DW; this extract-transfrom-load (ETL) process and related technologies have been reviewed in [Vas09].To conclude on the materialization of DWs, Rizzi argues that if centralized

4. DATA WAREHOUSES AND RECOMMENDATIONS 31
Figure II.4: Simple example of a Sales fact table defining two measuresRevenue and Quantity sold. These measures can be analyzed against 3dimensions (at the finest level): Product, Date and Shop.
architectures are well adapted for warehouses of isolated organizations, theyno longer fit the needs of collaborative BI networks [Riz11].
The multi-dimensional model. DWs and OLAP approaches are sup-ported by the multi-dimensional model which was introduced to provideimproved analytical capabilities and to enable the interactive analysis oflarge amounts of data. Multi-dimensional modeling methodologies havebeen thoroughly reviewed by Romero et al. in [RA09]. A certain number offormal definitions and models were proposed for the multi-dimensional spaceand the OLAP algebra [GRB11, PMT08, NNT01, Vas98, CT98], which oper-ations will be introduced in the next section. In short, the multi-dimensionaldata model organizes data in cubes and a DW can be seen as a collectionof related cubes [PJ01]. Cells of these cubes contain numerical facts calledmeasures. These measures are defined in fact tables and can be analyzedagainst any number of dimensions. Let us briefly describe these key ele-ments:
Dimensions are core concepts of multi-dimensional models and aim at pro-viding different observation angles around facts of interest. Dimensionsare used to select and aggregate data at the desired level. Dimensionsare indeed organized into hierarchies and each instance (or value) of adimension belongs to a particular level [PJ01].
Facts or fact tables contain tuples which may for instance describe unitsales transactions. Each tuple is defined by a certain number of point-ers to dimensions and numerical indicators [CDG01], and is thus rep-resented as a point in the multi-dimensional space.
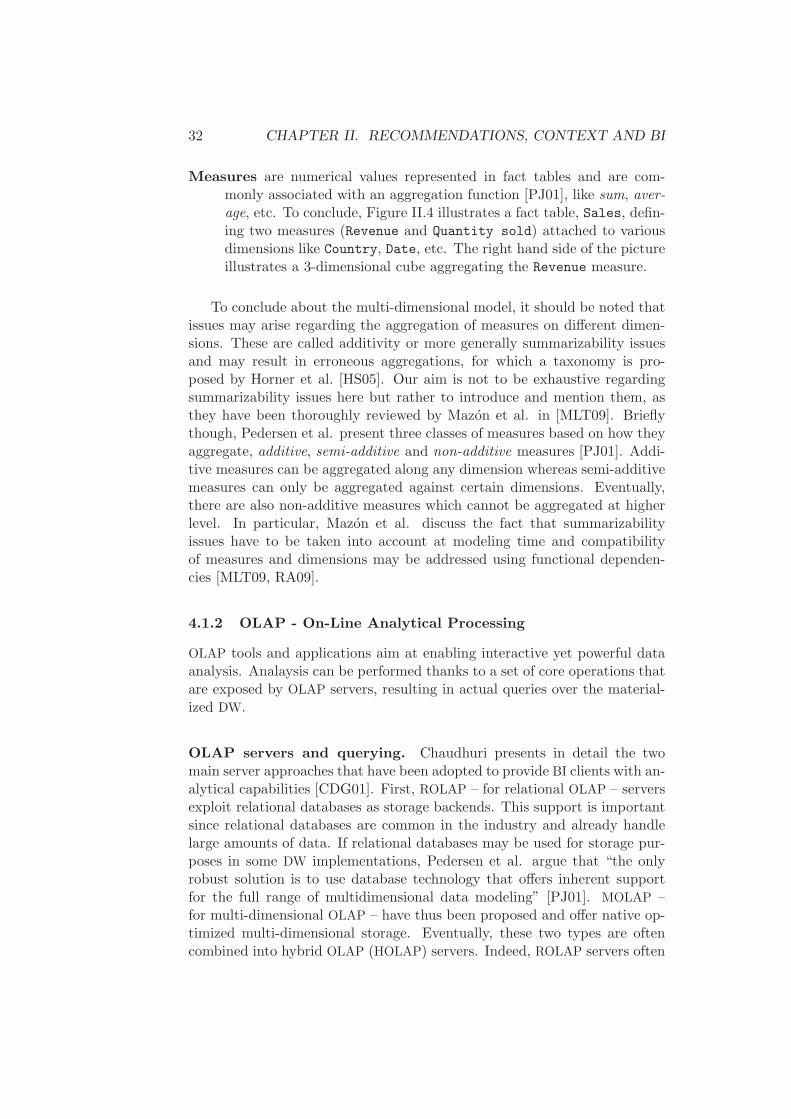
32 CHAPTER II. RECOMMENDATIONS, CONTEXT AND BI
Measures are numerical values represented in fact tables and are com-monly associated with an aggregation function [PJ01], like sum, aver-age, etc. To conclude, Figure II.4 illustrates a fact table, Sales, defin-ing two measures (Revenue and Quantity sold) attached to variousdimensions like Country, Date, etc. The right hand side of the pictureillustrates a 3-dimensional cube aggregating the Revenue measure.
To conclude about the multi-dimensional model, it should be noted thatissues may arise regarding the aggregation of measures on different dimen-sions. These are called additivity or more generally summarizability issuesand may result in erroneous aggregations, for which a taxonomy is pro-posed by Horner et al. [HS05]. Our aim is not to be exhaustive regardingsummarizability issues here but rather to introduce and mention them, asthey have been thoroughly reviewed by Mazon et al. in [MLT09]. Brieflythough, Pedersen et al. present three classes of measures based on how theyaggregate, additive, semi-additive and non-additive measures [PJ01]. Addi-tive measures can be aggregated along any dimension whereas semi-additivemeasures can only be aggregated against certain dimensions. Eventually,there are also non-additive measures which cannot be aggregated at higherlevel. In particular, Mazon et al. discuss the fact that summarizabilityissues have to be taken into account at modeling time and compatibilityof measures and dimensions may be addressed using functional dependen-cies [MLT09, RA09].
4.1.2 OLAP - On-Line Analytical Processing
OLAP tools and applications aim at enabling interactive yet powerful dataanalysis. Analaysis can be performed thanks to a set of core operations thatare exposed by OLAP servers, resulting in actual queries over the material-ized DW.
OLAP servers and querying. Chaudhuri presents in detail the twomain server approaches that have been adopted to provide BI clients with an-alytical capabilities [CDG01]. First, ROLAP – for relational OLAP – serversexploit relational databases as storage backends. This support is importantsince relational databases are common in the industry and already handlelarge amounts of data. If relational databases may be used for storage pur-poses in some DW implementations, Pedersen et al. argue that “the onlyrobust solution is to use database technology that offers inherent supportfor the full range of multidimensional data modeling” [PJ01]. MOLAP –for multi-dimensional OLAP – have thus been proposed and offer native op-timized multi-dimensional storage. Eventually, these two types are oftencombined into hybrid OLAP (HOLAP) servers. Indeed, ROLAP servers often
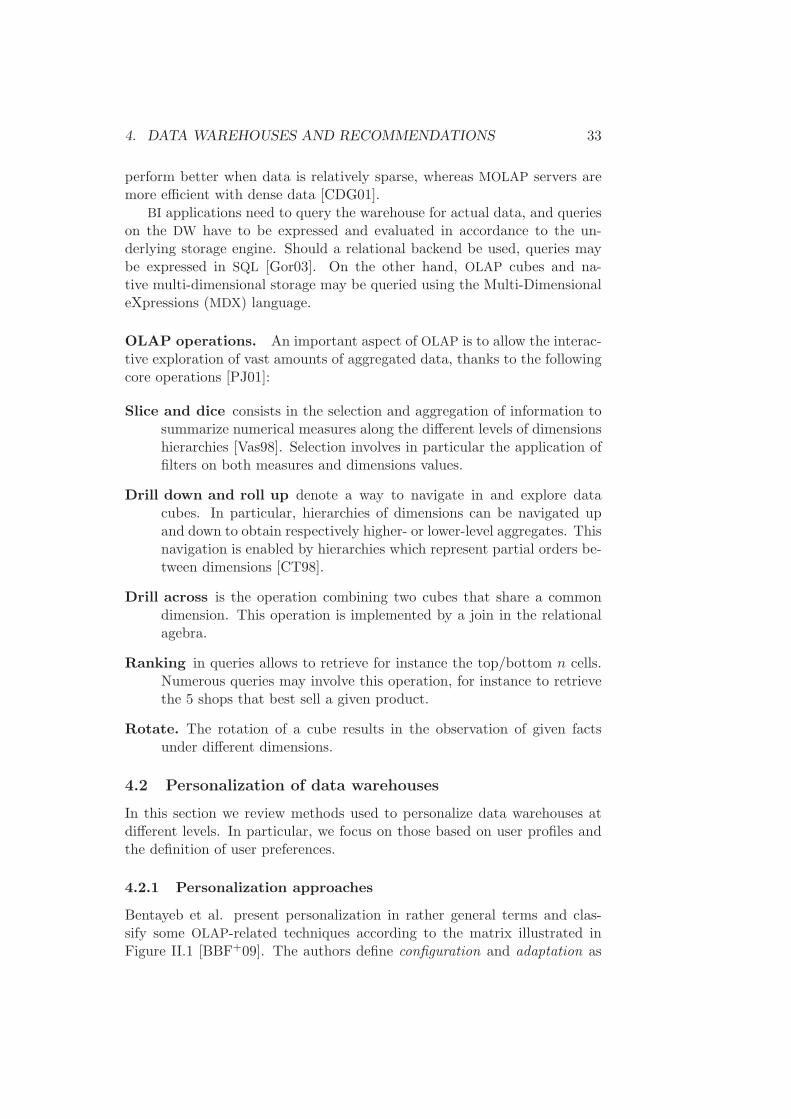
4. DATA WAREHOUSES AND RECOMMENDATIONS 33
perform better when data is relatively sparse, whereas MOLAP servers aremore efficient with dense data [CDG01].
BI applications need to query the warehouse for actual data, and querieson the DW have to be expressed and evaluated in accordance to the un-derlying storage engine. Should a relational backend be used, queries maybe expressed in SQL [Gor03]. On the other hand, OLAP cubes and na-tive multi-dimensional storage may be queried using the Multi-DimensionaleXpressions (MDX) language.
OLAP operations. An important aspect of OLAP is to allow the interac-tive exploration of vast amounts of aggregated data, thanks to the followingcore operations [PJ01]:
Slice and dice consists in the selection and aggregation of information tosummarize numerical measures along the different levels of dimensionshierarchies [Vas98]. Selection involves in particular the application offilters on both measures and dimensions values.
Drill down and roll up denote a way to navigate in and explore datacubes. In particular, hierarchies of dimensions can be navigated upand down to obtain respectively higher- or lower-level aggregates. Thisnavigation is enabled by hierarchies which represent partial orders be-tween dimensions [CT98].
Drill across is the operation combining two cubes that share a commondimension. This operation is implemented by a join in the relationalagebra.
Ranking in queries allows to retrieve for instance the top/bottom n cells.Numerous queries may involve this operation, for instance to retrievethe 5 shops that best sell a given product.
Rotate. The rotation of a cube results in the observation of given factsunder different dimensions.
4.2 Personalization of data warehouses
In this section we review methods used to personalize data warehouses atdifferent levels. In particular, we focus on those based on user profiles andthe definition of user preferences.
4.2.1 Personalization approaches
Bentayeb et al. present personalization in rather general terms and clas-sify some OLAP-related techniques according to the matrix illustrated inFigure II.1 [BBF+09]. The authors define configuration and adaptation as
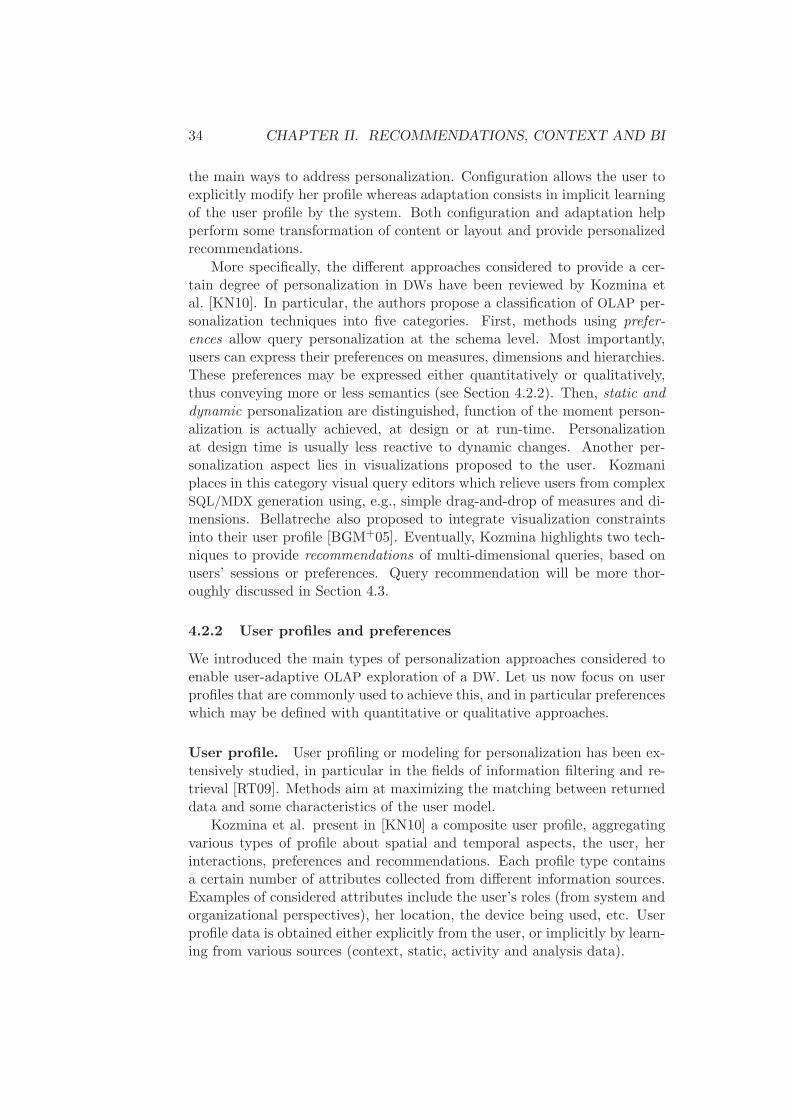
34 CHAPTER II. RECOMMENDATIONS, CONTEXT AND BI
the main ways to address personalization. Configuration allows the user toexplicitly modify her profile whereas adaptation consists in implicit learningof the user profile by the system. Both configuration and adaptation helpperform some transformation of content or layout and provide personalizedrecommendations.
More specifically, the different approaches considered to provide a cer-tain degree of personalization in DWs have been reviewed by Kozmina etal. [KN10]. In particular, the authors propose a classification of OLAP per-sonalization techniques into five categories. First, methods using prefer-ences allow query personalization at the schema level. Most importantly,users can express their preferences on measures, dimensions and hierarchies.These preferences may be expressed either quantitatively or qualitatively,thus conveying more or less semantics (see Section 4.2.2). Then, static anddynamic personalization are distinguished, function of the moment person-alization is actually achieved, at design or at run-time. Personalizationat design time is usually less reactive to dynamic changes. Another per-sonalization aspect lies in visualizations proposed to the user. Kozmaniplaces in this category visual query editors which relieve users from complexSQL/MDX generation using, e.g., simple drag-and-drop of measures and di-mensions. Bellatreche also proposed to integrate visualization constraintsinto their user profile [BGM+05]. Eventually, Kozmina highlights two tech-niques to provide recommendations of multi-dimensional queries, based onusers’ sessions or preferences. Query recommendation will be more thor-oughly discussed in Section 4.3.
4.2.2 User profiles and preferences
We introduced the main types of personalization approaches considered toenable user-adaptive OLAP exploration of a DW. Let us now focus on userprofiles that are commonly used to achieve this, and in particular preferenceswhich may be defined with quantitative or qualitative approaches.
User profile. User profiling or modeling for personalization has been ex-tensively studied, in particular in the fields of information filtering and re-trieval [RT09]. Methods aim at maximizing the matching between returneddata and some characteristics of the user model.
Kozmina et al. present in [KN10] a composite user profile, aggregatingvarious types of profile about spatial and temporal aspects, the user, herinteractions, preferences and recommendations. Each profile type containsa certain number of attributes collected from different information sources.Examples of considered attributes include the user’s roles (from system andorganizational perspectives), her location, the device being used, etc. Userprofile data is obtained either explicitly from the user, or implicitly by learn-ing from various sources (context, static, activity and analysis data).
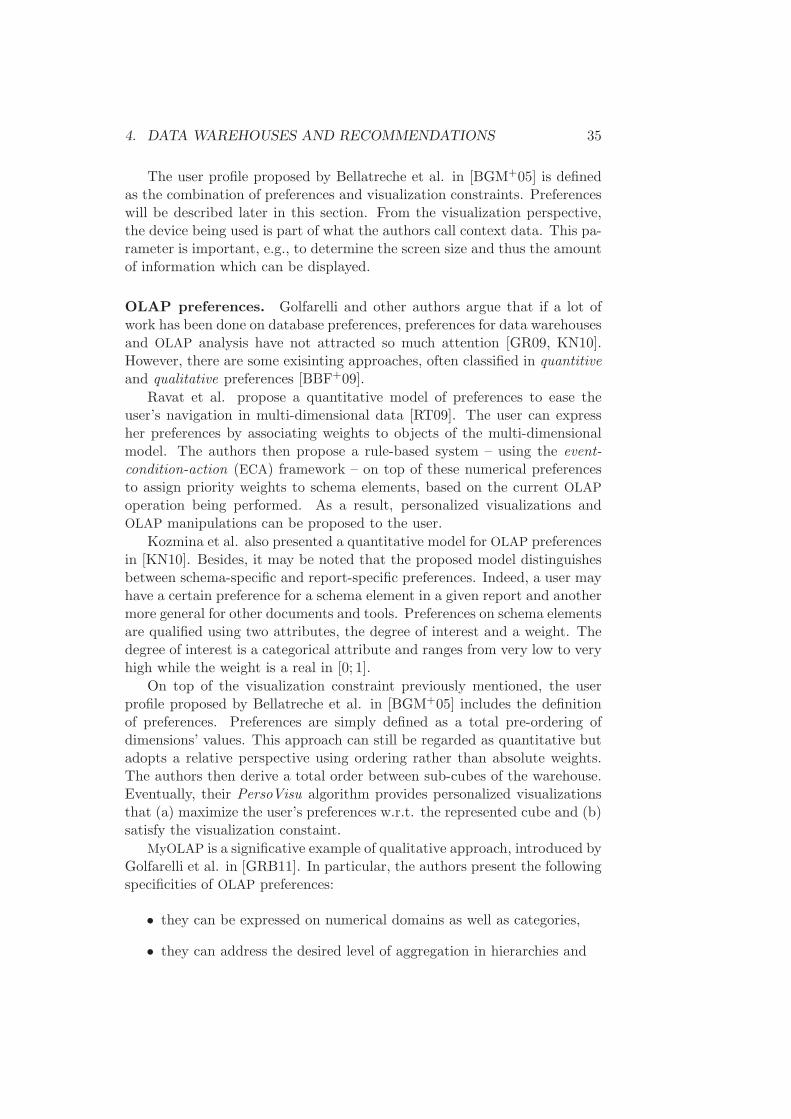
4. DATA WAREHOUSES AND RECOMMENDATIONS 35
The user profile proposed by Bellatreche et al. in [BGM+05] is definedas the combination of preferences and visualization constraints. Preferenceswill be described later in this section. From the visualization perspective,the device being used is part of what the authors call context data. This pa-rameter is important, e.g., to determine the screen size and thus the amountof information which can be displayed.
OLAP preferences. Golfarelli and other authors argue that if a lot ofwork has been done on database preferences, preferences for data warehousesand OLAP analysis have not attracted so much attention [GR09, KN10].However, there are some exisinting approaches, often classified in quantitiveand qualitative preferences [BBF+09].
Ravat et al. propose a quantitative model of preferences to ease theuser’s navigation in multi-dimensional data [RT09]. The user can expressher preferences by associating weights to objects of the multi-dimensionalmodel. The authors then propose a rule-based system – using the event-condition-action (ECA) framework – on top of these numerical preferencesto assign priority weights to schema elements, based on the current OLAP
operation being performed. As a result, personalized visualizations andOLAP manipulations can be proposed to the user.
Kozmina et al. also presented a quantitative model for OLAP preferencesin [KN10]. Besides, it may be noted that the proposed model distinguishesbetween schema-specific and report-specific preferences. Indeed, a user mayhave a certain preference for a schema element in a given report and anothermore general for other documents and tools. Preferences on schema elementsare qualified using two attributes, the degree of interest and a weight. Thedegree of interest is a categorical attribute and ranges from very low to veryhigh while the weight is a real in [0; 1].
On top of the visualization constraint previously mentioned, the userprofile proposed by Bellatreche et al. in [BGM+05] includes the definitionof preferences. Preferences are simply defined as a total pre-ordering ofdimensions’ values. This approach can still be regarded as quantitative butadopts a relative perspective using ordering rather than absolute weights.The authors then derive a total order between sub-cubes of the warehouse.Eventually, their PersoVisu algorithm provides personalized visualizationsthat (a) maximize the user’s preferences w.r.t. the represented cube and (b)satisfy the visualization constaint.
MyOLAP is a significative example of qualitative approach, introduced byGolfarelli et al. in [GRB11]. In particular, the authors present the followingspecificities of OLAP preferences:
• they can be expressed on numerical domains as well as categories,
• they can address the desired level of aggregation in hierarchies and
36 CHAPTER II. RECOMMENDATIONS, CONTEXT AND BI
• they can refer to atomic as well as aggregated data.
Taking these into account, Golfarelli et al. introduce MyOLAP as analgebra to express preferences as soft constraints. Preference-specific opera-tors and keywords are used to extend MDX queries, for instance to mentionthe user prefers data such that the aggregated value of a given measure fallsin a certain window.
Jerbi et al. also introduced a qualitative model for preferences in multi-dimensional databases [JRTZ08, JRTZ09a]. These preferences only addressdimensions but base on strict partial orders (s.p.o.) at two levels. The firsts.p.o. is used to compare two dimensions whereas the second one compares,inside a given dimension, two attributes or values. Remarkably, the authorsalso model the analysis context in order to define context-aware preferences.This specific notion of context will be further discussed in the next section.
4.3 Query recommendations
As a particular use case of personalization, we review in this section tech-niques for query recommendation. Such techniques can be used to easeuser-adaptive exploration of a DW and reduce the time taken by analysts toget to data of interest.
4.3.1 Recommendation types
Various types of OLAP recommendations can be considered and have beenclassified by Jerbi et al. as follows [JRTZ09b]:
Anticipatory recommendations. These recommendations aim at deter-mining, given the current state of an OLAP analyis, what is most likelythe next step or operation to perform.
Alternative results. Alternative results can be provided to the user tosuggest other related data. These results may or may not be relatedto the last operations performed by the user. Concretely, these resultshelp explore areas of cubes that had not necessarily been visited before.
Interactive assistance for query design. Last, interactive assistanceaims at helping the user in the query design process with suggestions,for instance to build queries and ad-hoc reports. Jerbi et al. mentionthat this recommendation scenario has attracted little attention fromthe research community, compared to the first two [JRTZ09b].
4.3.2 Query recommendation
Stefanidis et al. proposed a taxonomy to categorize database recommen-dation techniques in (a) current-state, (b) history-based and (c) external
4. DATA WAREHOUSES AND RECOMMENDATIONS 37
sources approaches [SDP09]. Methods (a) exploit data as well as metadata(schema), be it from the current query being performed or the databaseitself. Methods (b) leverage the history of users’ queries contained in logs,which may be structured in analysis sessions. Eventually, methods (c) mayexploit data from sources other than the database to perform further per-sonalization, e.g., by building more complete profiles.
More precisely focused on data warehouses, techniques employedfor query recommendations have been recently reviewed by Marcel etal. [MN11]. In particular, the authors provide a formal framework to repre-sent query recommendation techniques as a function of various parameters,Recommend(L, cs, I, P, f). L is a log or set of sessions, cs is the currentstate of the current session, I the data warehouse instance, P the user pro-file and f an expectation function. The expectation is a function associatinga real number to (or scoring) data of the warehouse. Marcel et al. dividedmethods for query recommendations in those (a) based on user profiles, (b)using query logs, (c) based on expectations and (d) hybrid ones.
Methods based on user profiles. Marcel et al. define this category formethods that take the user profile (e.g., preferences) into account, on topof the common current analysis session. Such techniques can be formallyrepresented as Recommend(∅, cs, I, P, ∅). They include the user profile (e.g.,preferences) in the recommendation process to maximize the user’s interestfor suggested queries [GRB11, KN10]. User profiles and preferences havebeen presented in more details in Section 4.2.2. It may be noted thoughthat preferences or the profile may define visualization-related constraints,which prove valuable since queried data eventually aims at being displayedto the user [BGM+05].
Methods based on query logs. Methods in this category are repre-sented as Recommend(L, cs, I, ∅, ∅). Techniques involved build on logs ofqueries in various analysis sessions and mainly address predictive recom-mendations of forthcoming queries. Logs are composed of queries posed byusers of the system (through different clients) and are stored by the server.
Analysis sessions are positioned as first-class citizens of these rec-ommendation approaches. Jerbi et al. used the definition of OLAP
analysis as a sequence of contexts which represent successive states orqueries [JRTZ09b, JRTZ09a]. More precisely, the analysis is modeled asa graph where nodes denote contexts and edges represent OLAP operationsperformed to go from one to the other. A context stands for a query andis represented using a tree structure. Root nodes are measures and dimen-sions used in the analysis, while leaves of the tree represent their values, bethey numerical or categorical. The authors apply these notions in particu-lar to provide query recommendations leveraging the user’s preferences, as

38 CHAPTER II. RECOMMENDATIONS, CONTEXT AND BI
previously discussed.
Sapia et al. proposed to model query logs using a probabilistic Markovmodel [Sap99]. The authors then exploit this to determine probabilities offorthcoming queries. Clearly, query recommendations consist in selectingthose that maximize the probability in the chain model.
Another approach is to use a distance metric between sessions to ex-tract recommended queries from past sessions similar to the current one.Giacometti et al. mention that the log can be extremely large and“sparse”, in the sense that many queries may not be posed several timesby users [GMN08]. Therefore, the authors propose to first group queriesinto clusters called partitions of the log. Each query is associated to a givenclass or cluster, and generalized sessions are determined by replacing queriesin sessions with their attached classes. The current and former sessions arematched using an adaptation of approximate string matching principles.Candidate query recommendations are selected and ranked among queriesof past sessions.
Methods based on expectations. Methods for query recommendationthat fall in this category are represented as Recommend(∅, cs, I, ∅, f). Theybase on discovery-driven analysis and rely on two models, one for data theuser has already visited in the past and another one for unseen data [MN11].The major assumption of these techniques is that the user will be interestedby parts of data where the two models most significantly differ. The lastparameter f of the Recommend function, is the expectation function andmay represent this deviation.
Sarawagi et al. introduced the discovery-driven analysis of multi-dimensional data [SAM98] and proposed two different types of operatorsto guide users toward zones of a cube that present unexpected data. Thefirst type tries to find either higher-level data that confirms an observedtrend or lower-level data to explain differences. Sathe et al. further discussthese aspects in [SS01]. Second, techniques based on an adaptation of themaximum entropy principle present the user with most unexpected datacompared to what she has already seen [Sar00].
More recently and to renew with the discovery-driven approach of OLAP
analysis, Giacometti et al. propose in [GMNS09] to model current andpast analysis sessions using pairs of cells (i.e. at the data level) containingsignificant and unexpected differences. If the current session leads the userto observe the same difference as a former session, the latter is used torecomend other significant and related differences.
Hybrid methods. To conclude on query recommendation techniques,previously described approaches may be combined in various ways withhybrid methods [GMNS09]. Methods in this category are represented as
5. SUMMARY AND DISCUSSION 39
the complete recommendation function Recommend(L, cs, I, P, f). To thebest of our knowledge and according to Marcel et al., the only really hy-brid method described in previous work was proposed by Giacometti etal. in [GMNS09]. Indeed, the presented technique processes query logs todetermine analysis sessions and associate a goal to them. Eventually, rec-ommended queries are those that pertain to past sessions sharing the samegoal with the current one.
5 Summary and discussion
In this chapter we presented our review of previous work in three differentbut somehow connected areas: recommender systems (RS), context-awaresystems and multi-dimensional data analysis. We want to highlight the factthat our aim was not to be exhaustive in any of these directions, but ratherto identify zones for possible synergies.
RS are designed to provide users with suggestions of items bound to beinteresting to them. The two major recommendation techniques are content-based (CB) and collaborative filtering (CF). CB methods rely on the vectorspace model and represent both items and users with vectors of weightedkeywords. They thus present the great advantage of being easily config-urable with queries. However, a CB approach requires content analysis onitems which implies to develop potentially sophisticated feature extractiontechniques. On the other hand, collaborative techniques have mainly basedon superficial information (like ratings) gathered from a large number ofusers, thus reducing the need for feature extraction. CF methods usuallybuild on ratings matrices to determine various distance or similarity met-rics. For instance, the user-based approach first determines users similaritybased on users’ ratings pattern. Then, a rating is computed for items theactive user has not yet seen, aggregated from ratings given by similar users.CF methods are extremely interesting since, at minima, they require noknowledge of items content. This makes them easily re-usable with variedtypes of resources. However, collaborative techniques suffer from so calledcold-start issues, be it new item or new user problems. On the other hand,CB methods avoid the new item case using content extraction. Eventually,recent work have addressed the need to integrate more context sensitivityin recommendation algorithms. In particular, semantic-based approachesare promising in this regard but do not seem to have reached the maturity,scalability and stability levels of CB or CF techniques.
A lot of work has also been done on context-aware systems which aredesigned to adapt to various characteristics of the user and her environ-ment, physical as well as virtual. Context-aware systems have often focusedon more dynamic aspects of personalization and aim at taking more thanthe user herself into accout. Researchers in this field commonly agree on
40 CHAPTER II. RECOMMENDATIONS, CONTEXT AND BI
a definition of the context provided by Dey et al., which considers it as“any information the can characterize the situation of an entity” [DA99].This definition – which is arguably said operational – reveals how broadthe notion is. Therefore, it is no surprise that researchers did not seemto converge towards a commonly accepted model of context. Many differ-ent models have thus emerged, using formalisms with more or less flexibil-ity and expressivity, mainly key-value pairs, object models and ontologies.In particular, it has been argued that semantic technologies are the mostappropriate to meet heterogeneity and reasoning requirements imposed bycontext-aware systems [SLP04]. Remarkably, this is also a promising di-rection for future recommender systems integrating more and more contextknowledge [CGF07, CBC08].
The important influence of mobile and more generally ubiquitous com-puting in research on context-aware systems brought interesting challenges.In particular, ubiquitous systems often involve hardware elements like de-vices or physical sensors, e.g., in so called intelligent environments [CFJ03].Unfortunately, this proves rarely useful when designing adaptive applica-tions in a pure software environment for knowledge workers or businessusers. Besides, several proposed context models intend to go extremelyfar in personalization, e.g., by representing the user’s psychological state.Again, this kind of settings raises serious doubts as to their applicabilityin business environments since information (a) needs to be captured and(b) needs to be interpreted in a useful and meaningful way, not to mentionobvious security and privacy issues.
In Section 4.1 we presented the multi-dimensional model used in datawarehouses (DW) and OLAP analysis tools. In particular, we presented thecore concepts of dimensions, facts and measures which compose the com-mon star schema of the warehouse. Measures are numerical indicators ofa fact table and they can be analyzed against a certain number of dimen-sions. Queries can be built to query for actual of the DW and usuallydepend on the underlying storage engine, be it relational or purely multi-dimensional. Modern DW solutions propose query design tools which enablethe formulation of queries by non-expert users and hide the complexity ofSQL/MDX generation [PMT08]. A way to ease the query design process isto simply let the user select measures and dimensions from a list to com-pose his queries, and eventually add some sort/filtering criteria. However,many real-life production systems define complex multi-dimensional modelswhich may involve up to thousands of obejcts, measures and dimensions.Consequently, it is thus difficult for users to navigate this data and find theappropriate information. Therefore, query designers could be significantlyimproved by using personalization and recommendation techniques. Thismost likely generalizes to other analysis tools.
Different disciplines and areas produced varying definitions of context.multi-dimensional data analysis in BI is no exception. The notion of analysis

6. CONCLUSION 41
context is considered in the field of multi-dimensional modeling and OLAP
analysis. An analysis session is defined as a sequence of contexts, whereOLAP operations (drill-down, etc.) are used to go from one to the other.This leads to a graph representation of sessions. Nodes of this graph are con-texts or queries, and edges denote OLAP operations. This notion of contextis interesting and allows for instance to recommend the most likely forth-coming query given the current session. However, this definition is obviouslymuch more limited than generic context models presented in Section 3.
Eventually, it is worth noting that recommendation techniques for multi-dimensional queries presented in Section 4.3 only poorly leverage genericmethods developed in the field of RS. To the best of our knowledge, therehas been no previous work using content-based or collaborative filtering. Wethus consider that query recommendation and more generally access to BI
tools and data could significantly benefit from RS techniques. Besides, mostwork have proposed language-specific approaches, e.g., using MDX opera-tors to express preferences in queries [GRB11]. On the other hand and froma commercial standpoint, BusinessObjects (now SAP) has from its originadopted a source-agnostic approach, based on so called universes or seman-tic layer. This layer stands for the multi-dimensional model and isolatesclients from underlying storage and connection issues. We thus consider itis important to provide techniques for personalization and recommendationthat are platform-independant.
6 Conclusion
In this chapter we reviewed work related to three research areas: (a) RS,(b) context-aware systems and (c) data warehouses and OLAP analysis. Weidentified interesting connections between RS and context-aware systems, inparticular at the modeling point of view since both types of system rely onuser modeling. Context-aware systems are more generic from the knowl-edge representation perspective and encompass broader sets of information,about the user and her environment. Besides, context-aware systems adopt amore dynamic position which makes them interesting in scenarios involvinginteractive personalization. However, traditional RS techniques have provedhighly scalable and can provide valuable results, in particular in situations ofexploration or discovery. Last but not least, we presented data warehousesand the multi-dimensional model, which organizes data in cubes. Facts arerepresented as points in the multi-dimensional space and refer to numericalmeasures and dimensions. Dimensions can be organized into hierarchies todefine navigation paths and are used, e.g., in roll-up/drill-down OLAP opera-tions. We observed that only recently techniques for query recommendationsemerged and that most approaches are platform- or language-specific. Toconclude and to the best of our knowledge, techniques considered so far for

42 CHAPTER II. RECOMMENDATIONS, CONTEXT AND BI
query recommendations have not explored the use of traditional RSmethods,namely content-based and collaborative filtering.
Chapter III
Graph-based Situation
Modeling
Contents
1 Introduction and requirements . . . . . . . . . . 43
2 A graph-based situation model . . . . . . . . . . 45
2.1 Situation statements . . . . . . . . . . . . . . . . . 45
2.2 Graph Repository . . . . . . . . . . . . . . . . . . 47
3 Situation model characteristics . . . . . . . . . . 52
3.1 Situation model overview . . . . . . . . . . . . . . 52
3.2 Agent profile and core dimensions . . . . . . . . . 54
3.3 Personalization-related dimensions . . . . . . . . . 57
4 Summary and discussion . . . . . . . . . . . . . . 59
4.1 Modeled aspects . . . . . . . . . . . . . . . . . . . 59
4.2 Representation features . . . . . . . . . . . . . . . 59
4.3 Context management and usage . . . . . . . . . . 60
5 Conclusion . . . . . . . . . . . . . . . . . . . . . . 61
1 Introduction and requirements
We underlined in the review of related work (see Chapter II) that person-alization commonly bases on some – more or less dynamic – user modeling.Modeling the user and her context or situation is key in many applicationsto serve timely and personalized recommendations of data or services.
This section presents our graph-based situation model leveraging a se-cure and modular Graph Repository (GR) of heterogeneous resources. Be-fore going in any further detail, we first describe requirements imposed onsuch system, in the context of corporate deployments regarded as our mainapplication scenario.
43

44 CHAPTER III. GRAPH-BASED SITUATION MODELING
Applications inter-operability. As opposed to the experience of a userlimited to Web sites inside a browser, a business user evolving inside acompany’s network may interact in varied ways with several commu-nicating applications. Ideally, these applications would share the sameknowledge and representation of the user’s interests and intentions tobetter assist her and ease inter-operability. Such user-centric applica-tions are called situational applications and they emphasize the needto inter-operate on the basis of a shared situation model.
Information heterogeneity. Several modeling approaches have been con-sidered to address the context representation issue and were discussedin more details in Chapter II, Section 3. Definitions of both contextand situation reveal the important variety of resources and facts whichmay contribute to the description of a user’s environment. The needto handle heterogeneous resources and relations between them leadsto graphs as a natural representation.
Security and privacy. Situation modeling and monitoring is about cap-turing and interpreting users’ personal characteristics and interactions,which means the underlying data is particularly sensitive. Users’ pri-vacy thus needs to be respected and enforced by the system. If userdata has to be protected, security also has to be observed from a differ-ent angle. Indeed, a given user may not be allowed to see all resourcesavailable in her corporate network. This is the case, for instance, withcritical HR or financial information.
Dynamic adaptation. Eventually, our aim with situation modeling is dy-namic adaptation to serve timely and personalized recommendationsof resources to end-users. Therefore, we need to take into considera-tion the fact that users’ interests or goals may evolve rapidly as theyinteract with various applications. Time-dependency thus has to beintegrated at the heart of the representation of situation-related knol-wedge.
To conclude, various requirements push for an expressive model for sit-uation knowledge, allowing a homogeneous representation of heterogeneousresources. Therefore, a graph-based model seems particularly adapted, inparticular to represent and operate on semantics of such information. Dif-ferent formalisms – from simple key-value pairs to ontology-based models –have been introduced for context modeling and were discussed in Section 3.2of Chapter II. Strang et al. summarized their analysis of these formalismsand placed more hope in ontology-based approaches [SLP04], arguing thatthey are best suited to handle characteristics of context information.
The rest of this chapter is organized as follows. Section 2 presents thegraph-based situation model and the underlying graph repository framework
2. A GRAPH-BASED SITUATION MODEL 45
that we propose. Further characteristics of our model are then introducedin Section 3, in particular situation dimensions. Last, we discuss in Sec-tion 4 the proposed model according to the analysis framework presentedby Bolchini et al. [BCQ+07].
2 A graph-based situation model
The requirements previously introduced impose constraints on our system,which lead to graphs as a natural and homogeneous representation. Graphsare indeed very well suited to handle information diversity and representa variety of resources and relations between them. For instance, this wasa major argument in favor of the rich typed graph model RDF, to handledistributed sources of heterogeneous resources. In this section, we first in-troduce situation statements which are a major component of our graphmodel.
2.1 Situation statements
Sitting on top of raw context data, situation models aim at characterizingthe user and her environment, or interactions between her and the “rest ofthe world”. For this purpose, Heckmann introduced situation statements asa homogeneous data structure used to represent the unit of information insituation modeling [Hec05b], based on Semantic Web technologies. State-ments offer an appropriate answer to handle the heterogeneity of resourcesand interactions as well as time-dependency and privacy aspects.
2.1.1 Definition and notations
Our work bases on the statement structure proposed by Heckmann to elabo-rate on an aggregated and dynamically maintained view of users’ situations.Situation statements are extended triples representing assertions formed ofa subject S, a predicate P and an object O, like Marge read document1.Table III.1 presents other examples of such statements.
Basic triples are augmented with additional metadata M to take intoaccount temporal constraints, privacy settings, origin (or source) and con-fidence of the information. A statement can then be noted as a tuple(S, P,O,M), with M = (origin, t, l, sowner, s, c). We describe below thesemetadata:
Timestamp t and lifetime l. The timestamp t and the expected lifetimel are used to handle time-related validity constraints. In a first approx-imation, the timestamp can be seen as the date and time the statementwas created. The lifetime indicates during how much time the state-ment holds valid. Statements may be flagged with an infinite lifetimeto indicate they are always true, regardless of time constraints.

46 CHAPTER III. GRAPH-BASED SITUATION MODELING
♯ Subject Predicate Object Origin
S1 Marge read document1 EmailClient
S2 document1 mention Country EntityExtractor
S3 document1 mention Q3 EntityExtractor
S4 Q3 instanceOf Quarter EntityExtractor
. . .Sk Marge hasLocation Paris MobileApp
Sk+1 Marge reportsTo Bruno SocialNetwork
. . .
Table III.1: Examples of (partial) statements, some of which constituteMarge’s situation as represented by the graph in Figure III.1.
Figure III.1: Example of situation graph for the user Marge.
Privacy and ownership. The privacy setting s in combination with theownership sowner indicates whether this statement is public, private orhas custom access authorizations. By default, all situation statementsare owned by the concerned user/agent and are strictly private. Shar-ing some information with other users has to be, here again, the resultof the user opting in explicitly.
Origin and confidence. We define agents as resources of the systemwhich can create statements (providers, users, operators, client ap-plications, etc.). The origin refers to the agent that created the state-ment. Finally, the confidence attribute c allows agents to qualify thereliability level of the statement, which is key in distributed environ-ments involving situational applications inside a corporate network.
2. A GRAPH-BASED SITUATION MODEL 47
2.1.2 Situation graphs
At a certain point in time, the situation model can be seen as a collectionof valid facts or statements which takes the form of a graph. Such a graphis illustrated in Figure III.1, it can be centered on the concerned user oragent to reflect its particular importance. In this figure, the agent Marge isrepresented by the green node in the top left corner. This graph is formedthanks to a certain number of statements, some of which are enumerated asexamples in Table III.1. These statements reveal for instance that Marge isreading document1, an unstructured document mentionning a certain num-ber of entities. This example is going to be discussed in depth in Chapter VI,Section 2 with the description of the Text-To-Query system. Text-To-
Query analyzes text documents the user is to suggest related queries onmulti-dimensional data warehouses.
In the definition proposed by Heckmannn, statements reference resourcesgenerally available and described in shared ontologies. Even if statementsintroduce ownership and visibility attributes, it is unclear how security is go-ing to be ensured by the system. Indeed, a situation management platformmay require the definition and development of various components. Heck-mann et al. do not propose a mechanism to let users control what data canbe consumed by these components. However, ontology-based models andsemantic technologies are well suited to offer a shared representation andunderstanding of heterogeneous resources. We thus present our approach tobase statements – and more generally graph data – on a secure and modulargraph repository (GR). The GR is a user-centric framework for personalizedgraph data management, enabling in particular the isolation of users’ datafor security and privacy purposes.
2.2 Graph Repository
We introduced situation statements that we use as a data structure to rep-resent the unit of information in situation modeling. As said before, state-ments can be seen as qualified relations (or edges) in graphs where nodesdescribes various available resources. These resources may come from a greatvariety of source systems, which leads us to define a modular and extensibleGraph Repository.
2.2.1 Source systems and personalized providers
Various information systems available inside a corporate network may con-tribute to general knowledge about available resources, and users in partic-ular. For instance, an LDAP directory can describe employees and relationsbetween them. Although other popular online social networks may alsobe used, this wasn’t the focus of our work as they seem less appropriatewhen dealing with private resources of an organization and users that are

48 CHAPTER III. GRAPH-BASED SITUATION MODELING
employees of the same organization. Other classic examples of enterpriseapplications include ERP, CRM and BI platforms. A CRM system could beused to extract relations between account managers and customers. Such in-formation may be useful in various scenarios, for instance with an automaticmessage redirection system in a support center. Moreover, BI platforms arean important kind of system that we leverage in several personalization andrecommendation scenarios, as described in Chapters V and VI.
As many applications and systems may contribute to background knowl-edge about users and available resources, our aim is to define an modulargraph repository (GR), enabling progressive using modules called providers,e.g., by connecting to source systems. The modularity of providers – andmore generally the GR – will be further discussed from an architecture stand-point, later in Chapter IV, Section 3.1.
Most source systems impose their own security constraints like access-control rules. Duplicating their data and maintaining security policies overduplicated data would be particularly complex and costly. This leads us toopt for a delegated security enforcement policy. Users of our platform canthus choose (or refuse) to give their credentials to leverage connections toexisting systems through dedicated providers. This opt-in approach is keyto minimize privacy issues and ensure users control what data is collectedand manipulated in their situation model. By construction, the GR is aninherently personalized structure and may contain private data. Securityis therefore a key aspect and the access to the GR requires agents to beauthenticated.
2.2.2 Definitions
Being a personalized structure, the GR is dedicated to one user u and shouldbe noted GRu. For the sake of clarity, the user indication is omitted in thefollowing definition. The GR can be defined as an aggregation of severalgraphs Gi = (Ni, Si, Pi), defining sets of nodes Ni and statements (or edges)Si identified by URIs. Each graph Gi is populated and maintained by aprovider Pi, and a provider may manage any number of graphs.
Available types of nodes and statements are defined in the GR schema.The GR initially provides a core schema Tbase, defining basic types of nodesand statements. A provider Pi has the ability to declare a custom schemaTi when registering to the repository. The provider-specific schema Ti hasto extend Tbase to define new types of nodes and statements. To enableschema-level reasoning, the complete type schema T is obtained by mergingcore and provider-specific schemas: T = Tbase ∪ (
⋃mi=1 Ti). Eventually, with
G =⋃m
i=1Gi, the graph repository can be noted GR = (G, T ).
The base type schema Tbase initially describes core types of nodes andrelations (or edges) but may be enriched by providers. The three main typesdefined in Tbase are Node, Statement and Agent. The Agent type is used
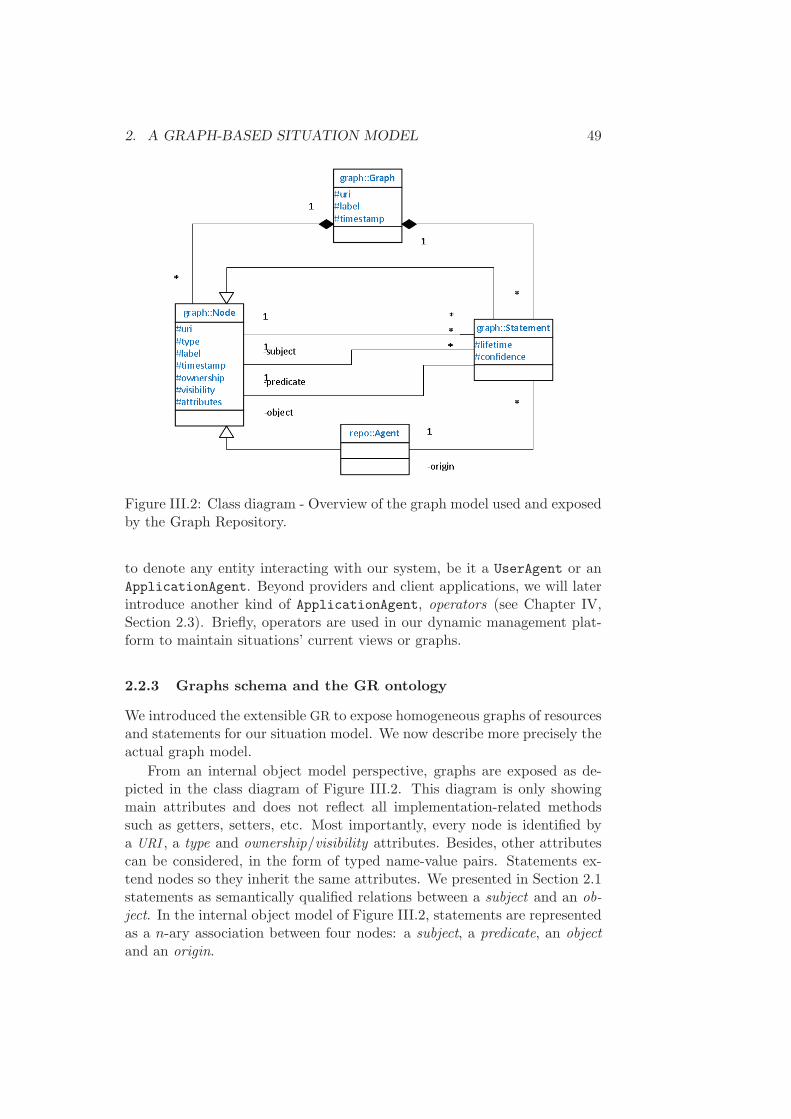
2. A GRAPH-BASED SITUATION MODEL 49
Figure III.2: Class diagram - Overview of the graph model used and exposedby the Graph Repository.
to denote any entity interacting with our system, be it a UserAgent or anApplicationAgent. Beyond providers and client applications, we will laterintroduce another kind of ApplicationAgent, operators (see Chapter IV,Section 2.3). Briefly, operators are used in our dynamic management plat-form to maintain situations’ current views or graphs.
2.2.3 Graphs schema and the GR ontology
We introduced the extensible GR to expose homogeneous graphs of resourcesand statements for our situation model. We now describe more precisely theactual graph model.
From an internal object model perspective, graphs are exposed as de-picted in the class diagram of Figure III.2. This diagram is only showingmain attributes and does not reflect all implementation-related methodssuch as getters, setters, etc. Most importantly, every node is identified bya URI , a type and ownership/visibility attributes. Besides, other attributescan be considered, in the form of typed name-value pairs. Statements ex-tend nodes so they inherit the same attributes. We presented in Section 2.1statements as semantically qualified relations between a subject and an ob-ject. In the internal object model of Figure III.2, statements are representedas a n-ary association between four nodes: a subject, a predicate, an objectand an origin.

50 CHAPTER III. GRAPH-BASED SITUATION MODELING
The graph model previously introduced is meant to be source agnostic.Therefore, it does not require a specific storage facility, be it a relationaldatabase or a triple store. However, for serialization and exchange purposes,an RDF representation proves useful and well adapted. We thus defined asimple ontology for the GR schema. An RDF-S ontology enables schemamerging and simple hierarchical reasoning on types, for instance to infersub-classes and sub-properties chains. It is also possible to consider OWL
ontologies to define schema with, for instance, transitive properties or rela-tions. An example of transitive relations will be discussed with functionaldependencies in multi-dimensional modeling, in Chapter V, Section 2.2. Wepresent below an example of an individual document1 in the Email nodeclass:
<rdf:RDF
xmlns:rdf="http://www.w3.org/1999/02/22-rdf-syntax-ns#"
xmlns:grepo="http://www.sap.com/situation/grepo/0.97#"
xmlns:rdfs="http://www.w3.org/2000/01/rdf-schema#">
<rdf:Description rdf:about="http://.../document1">
<rdf:type rdf:resource="http://...#Email"/>
<rdfs:label>Meeting this afternoon</rdfs:label>
<grepo:timestamp>12345</grepo:timestamp>
</rdf:Description>
</rdf:RDF>
In RDF, statements are simple triples (subject-predicate-object) but theycan be further qualified using reified statements. A reified statements is itselfa resource (thus identified by a URI) of type rdf:Statement. It has threemain properties, a subject, a predicate and an object. The statement meta-data can be represented using additional properties. We illustrate below astatement of the assertion “Marge read document1”, e.g., originating froma plugin in an EmailClient:
<rdf:RDF
xmlns:rdf="http://www.w3.org/1999/02/22-rdf-syntax-ns#"
xmlns:grepo="http://www.sap.com/situation/grepo/0.97#"
xmlns:rdfs="http://www.w3.org/2000/01/rdf-schema#">
<rdf:Description rdf:about="http://.../statement123">
<rdf:type rdf:resource="http://...#Statement"/>
<rdf:subject rdf:resource="http://.../users/marge"/>
<rdf:predicate rdf:resource="http://.../read"/>
<rdf:object rdf:resource="http://.../document1"/>
<grepo:origin rdf:resource="http://.../EmailClient"/>
<grepo:ownership rdf:resource="http://.../users/marge"/>
<grepo:visibility>private</grepo:visibility>

2. A GRAPH-BASED SITUATION MODEL 51
<grepo:timestamp>12345</grepo:timestamp>
<grepo:lifetime>5</grepo:lifetime>
</rdf:Description>
</rdf:RDF>
The use of reified statements is not mandatory since another custom typeof node could have been defined to denote statements. However, it happensto be particularly useful to deal with implementation- and performance-related concerns. For instance, the Jena API for Semantic Web technologiesmakes use of reified statements to limit the important overhead introducedby additional statements properties.
For extensibility purposes, the schema ontology can be enriched by regis-tered providers. For instance, providers can define additional types of nodesand statements. These types may integrate specific attributes. In the ex-ample above, an Email type could be defined as a sub-class of Document,defining in particular “from”, “to” and “body” attributes (or properties inthe RDF terminology). Below is the previous description of document1 withthese additional attributes:
<rdf:RDF ...
xmlns:gr-mail="http://www.sap.com/situation/grepo/mail#">
<rdf:Description rdf:about="http://.../document1">
...
<gr-mail:from>[email protected]</gr-mail:from>
<gr-mail:to>[email protected]</gr-mail:to>
<gr-mail:body>Hi, I’m not going to be available this
afternoon, can we re-schedule later?</gr-mail:body>
</rdf:Description>
</rdf:RDF>
Already existing ontologies may be used under the condition of a smalldata transformation, in particular for statements which will have to be ex-tended with appropriate metadata. Besides, individuals defined in theseontologies will also have to correspond to types defined in the aggregatedschema.
2.2.4 Graphs factories
The actual architecture and implementation of the graph repository will bemore precisely discussed in Chapter IV, Section 3.1. Briefly though, graphsare populated thanks to specific modules which can be used to connectto various source systems. These modules, called providers, may re-useor define new graph factories for actual graph creation and more generallygraph data management. Our aim is to isolate graph capabilities from actual
52 CHAPTER III. GRAPH-BASED SITUATION MODELING
data storage. Examples of possible implementations of graph factories arebriefly presented below:
RDF database. The graph is originally represented as RDF triples andthese triples are stored either in a dedicated triple store or in a rela-tional databse.
RDF in-memory. The graph is originally represented as RDF triples anda priori only held in-memory.
XML/RDF file. The graph is originally represented as RDF triples andtriples are stored in a file.
Custom. Graph data are stored in a custom format (for instance in a re-lational database) and transposed in the GR model by the provider.
Clearly, it is possible to form hybrid strategies to connect and adapt tovarious remote systems. As an example, a provider may use Web servicesto query a remote system, convert data to the GR model on the fly andpopulate RDF graphs held in-memory, e.g., for caching purposes.
3 Situation model characteristics
We introduced the graph foundations of our situation model with the per-sonal and extensible GR. In this section, we present our approach to structurethis information and present (a) comprehensible dimensions to applicationsconsuming the exposed model and (b) utility methods for components con-suming the internal model.
3.1 Situation model overview
At a given point in time, the user’s situation is represented by a collectionof statements. These statements represent raw facts or assertions, possiblyat different granularity levels. Therefore, it is important to also enable ex-ploitation of the situation model at a higher level of abstraction and expose,e.g., information structured in categories of specific interest.
A situation is a graph centered on the concerned agent, augmented witha simple profile and a certain number of dimensions. Figure III.3 illus-trates these main components of the internal object model, hiding lowerlevel graphs, nodes and statements. We present below a short descriptionof these different elements:
Agent. A situation concerns a specific user or agent and is centered on thisparticular node. Most times, the agent is going to be a user. However,it may be interesting in some scenarios to monitor and automate tasksfor applicative agents.

3. SITUATION MODEL CHARACTERISTICS 53
Figure III.3: Class diagram - Overview of the internal object-based situationmodel, including core dimensions and personalization-related dimensions.
Profile. The AgentProfile class associated to a situation is a simple con-tainer for typed key-value attributes. It may be used to store andretrieve simple literal values like the user’s organization name, her jobtitle, phone number, email addresses, etc.
Dimensions. A SituationDimension defines a group of selected situ-ation statements, and aims at representing coherent sets or cate-gories. The following categories will be defined in more details inSection 3.2: core dimensions of our model (social and geographicalaspects) and personalization-related dimensions (preferences and rec-ommendations).
3.1.1 Current view
The time aspect is an inherent part of our model thanks to statements meta-data which express time-dependant validity (timestamp and lifetime). Froma dynamic point of view, situation graphs evolve to reflect users’ interactionsand changes in their environment.
54 CHAPTER III. GRAPH-BASED SITUATION MODELING
At a given time tnow, the situation graph exposes statements that arecurrently valid and part of the user’s situation. However, deprecated state-ments may still reside in the underlying data as they can be kept for his-tory purposes. To cope with the separation between currently valid andoutdated statments and ease data querying, Situation objects expose thegetCurrentView() method on top of usual graph operations. This methodfilters out deprecated statements.
Dynamic aspects of our system are further discussed in Chapter IV.In particular, so called operators are components responsible for ongoingsituation maintenance. We now describe how our homogeneous model canbe used to reconciliate current and history data.
3.1.2 History management
Statements generated by the system are managed and stored using GR fac-tories previously described and can be regarded as “knowledge of the past”.Metadata related to time allow to query for statements that were valid ata certain time in the past tpast ≤ tnow. On top of this core functionality toquery raw data, our situation structure may also expose specific history ele-ments which may be helpful to various applications. Clearly, such elementsare largely dependant on the use case being considered. An example ofapplication will be presented (along with other experimentations) in Chap-ter VI, Section 3. Among possible history elements, the presented federatedsearch system could use previous queries or questions posed by the user withlearning approaches.
To sum up, history of past context information can be fully exploitedwith queries on the GR. On the other hand, from a more dynamic per-spective, the platform continuously maintains a view of currently relevantcontext information.
3.2 Agent profile and core dimensions
Predicates play a central role in determining the semantics of characteris-tics and interactions reflected by statements. Based on this observation, asimple categorization of statements enables us to expose consolidated andstructured dimensions in the situation model. This structure may be usefulat two levels. First, internal modules of our dynamic situation monitoringplatform can leverage utility methods exposed by dimension objects of ourmodel. Second, from an external client perspective, this allows for situa-tion data to be queried in a more fine-grained manner. For instance, clientapplications may query for situation data present in one given dimension.

3. SITUATION MODEL CHARACTERISTICS 55
3.2.1 User profile
Although it is not precisely a dimension in the sense of the internal objectmodel previously presented (i.e. a collection of statements), the user profileis an important component of an agent’s situation.
An AgentProfile instance is associated to each Situation object cre-ated and monitored by the system. This profile can be used to store andretrieve typed key-value attributes meant to describe various characteristicsof the agent with literal values. Examples of such attributes can be any-thing like the user’s birth date, her first and last names, her job title andcompany name, etc. Besides, additonal contact information like the user’semail addresses or phone numbers may be of interest.
In the RDF terminology, attributes values are denoted as literals and canbe of different types (int, date, etc.). Each resource can have any numberof attributes, represented by data properties, as opposed to object propertieswhich stand for relations between two resources.
3.2.2 Social dimension
Knowledge about the user’s social environment is key to further person-alize information and services. Therefore, the SocialDimension is amongmajor dimensions of our model. It has been briefly presented in previoussections that relations making up the user’s social network may be obtainedfrom various sources. First, popular online social networks may be used. Inour case, focused on corporate deployment scenarios, users are employeesof a same organization and they may share private resources of this orga-nization. Therefore, a minimal view of the user’s social network is derivedfrom an LDAP directory or, more generally, any enterprise directory. Forinstance, such directories may contain information about hierarchical rela-tions between employees. The construction and maintenance of the user’ssocial network is not really the focus of our work and will not be further dis-cussed. We leverage an existing prototype called Social Network Analyzer1.This prototype enables the exploration of multiple relations between peoplewhich can be represented using various predicates like reportsTo, hasBusi-nessContact, worksWith, etc. To sum up, any kind of statement betweentwo UserAgent nodes is a potential candidate for the social dimension, apriori independant of the precise predicate. As an example, Figure III.4illustrates Marge’s social network, including different relations with users ata maximum distance of 2.
In this particular dimension, the following commodity functions can bedefined:
• getNetwork(depth, relations) is the most generic method. It gets
1http://sna-demo.ondemand.com/
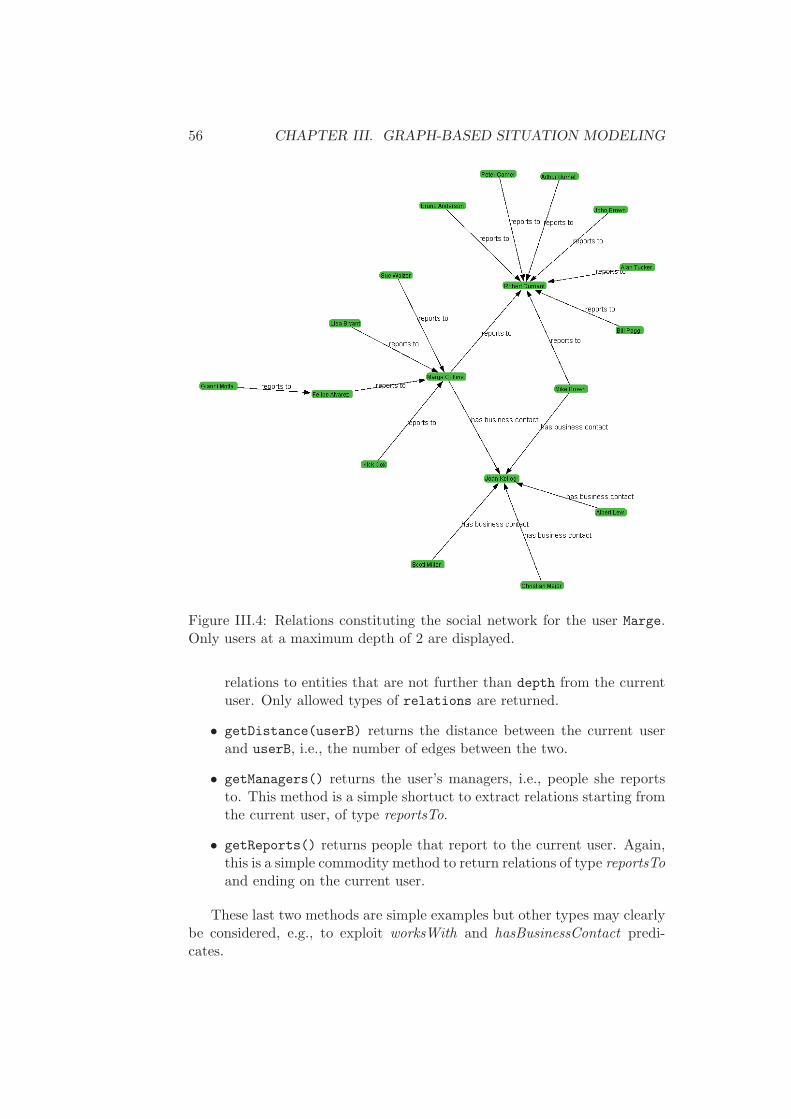
56 CHAPTER III. GRAPH-BASED SITUATION MODELING
Figure III.4: Relations constituting the social network for the user Marge.Only users at a maximum depth of 2 are displayed.
relations to entities that are not further than depth from the currentuser. Only allowed types of relations are returned.
• getDistance(userB) returns the distance between the current userand userB, i.e., the number of edges between the two.
• getManagers() returns the user’s managers, i.e., people she reportsto. This method is a simple shortuct to extract relations starting fromthe current user, of type reportsTo.
• getReports() returns people that report to the current user. Again,this is a simple commodity method to return relations of type reportsToand ending on the current user.
These last two methods are simple examples but other types may clearlybe considered, e.g., to exploit worksWith and hasBusinessContact predi-cates.

3. SITUATION MODEL CHARACTERISTICS 57
3.2.3 Geography dimension
The GeographyDimension is another key dimension exposed in our model.We define the hasLocation predicate to handle geographical context infor-mation. It can be used to describe the user’s location in statements likeMarge hasLocation (45.194, 5.733) or Marge hasLocation India. The ob-ject (or target) of such statements are nodes of the Geography type whichcan be subclassed to define different granularity levels (Country, Region,City, etc.). In the GeographyDimension, two simple commodity methodsmay be used to retrieve – among all possible geography statements – thosethat describe the user’s location:
• getLocation(granularity) can be used to get the agent’s currentlocation at the desired level of granularity, should it be available.
• getFinestLocation() is a shortcut to directly retrieve informationabout the user’s location, at the finest granularity level available.
This dimension ensures consistency at different levels. Consider for in-stance a new statement that informs the system about the current user’scity. If previous knowledge is conflicting with the new information, thenother more fine-grained statements will be re-evaluated. Besides, in thenext chapter, we will introduce operators responsible for dynamic situationmanagement. In particular, a ReverseGeocoding operator may be usedto determine the country, state, region, city and address from GPS coor-dinates. Such precise position is now very commonly available on modernmobile devices.
3.3 Personalization-related dimensions
Our aim with this model is to enable personalization in various situationalapplications and eventually provide recommendations of potentially heterog-neous resources.
3.3.1 Preference dimension
First, different applications may be willing to exploit personal user prefer-ences in order to adapt their content and/or design. It is worth noting,here again, that so called preferences are often dependant on the applica-tion scenario considered. For instance, a news reader aggregating RSS feedsmay store preference scores associated to various sources of information. Amusic delivery platform may be interested by the user’s favorite artists andalbums, etc.
Concretely, users’ preferences may be described using specific prefer-ence statements, that is a relation between the current user and a specific
58 CHAPTER III. GRAPH-BASED SITUATION MODELING
resource, based on predicates like prefers, rates, likes, dislikes, etc. For in-stance, the user’s favorite language for proposed content could be defined us-ing a statement like Marge prefers Locale-EN, indicating that Marge prefersto read English RSS feeds. The origin of the statement can be used todistinguish preferences expressed by and for different applications.
The PreferenceDimension presents the main methodgetPreferences(node), which returns all statements indicating (pos-itive or negative) preferences regarding a given node. An additional weightattribute can be used with these statements to weigh or simply orderpreferences. Like all context information, preference statements can beeither explicitly given by the user or implicit, e.g., derived from the analysisof the user’s history.
Explicit preferences. Forms may be used, e.g., to let the user express herpreference for different data sources. Users’ feedback can be capturedwith statements like userA rates item123 (weight = 0.8) or Marge
likes item123.
Implicit preferences. Preferences of the user regarding certain resourcesmay also be obtained implicitly, for instance derived from the anal-ysis of the user’s interactions (browsing history, click-through data,etc.). Derived preference statements usually have a lower confidenceattribute than explicit ones. In Chapter V, Section 3, we define im-plicit preferences for OLAP entities like measures and dimensions. Inthis scenario, implicit preferences are determined using occurrences ofthese entities in charts or tables the user commonly uses.
3.3.2 Recommendation dimension
In the situation management framework which we will present in the nextchapter, operators are components responsible for dynamic maintenance ofsituation graphs (see Chapter IV, Section 2.3). In particular, operators ben-efit from an access to the user’s situation model to provide personalized anddynamically adapted recommendations, in response to events. The situationmodel we propose thus integrates recommendations as a core dimension.
Recommendation statements may be used by dynamic components likeoperators to present varied suggestions to the user. Recommendationscan, for instance, be described thanks to recommends or hasRecomenda-tion predicates, in statements like operator1 recommends item123 (ori-gin = operator1) or userA hasRecommendation GoToSleep (origin =operatorHealthCare). Operators may use (or not) the confidence attributeto assign a score to the recommendation statement. Other simple descriptivestatements may be added by operators to provide explanations or furtherinformation on the item being recommended, be it a document, an action,etc. For instance, in the previous example, operator1 could have mentioned
4. SUMMARY AND DISCUSSION 59
the fact that item123 hasAuthor userB, and userB happens to be a frequentcollaborator.
The RecommendationDimension mainly exposes the methodgetRecommendations(types, n). This method returns the n bestranked recommendation statements, suggesting resources of desired types.
4 Summary and discussion
We have seen how the aggregated situation model can be built out of atomicstatements thanks to generic statement and graph structures. Statementsmay be grouped for convenience purposes in different dimensions. In thissection, we discuss our graph-based situation model against the analysisframework proposed by Bolchini et al. [BCQ+07].
4.1 Modeled aspects
Key aspects of our model have been described in Section 3.2. In this section,we discuss these with the categorization proposed in the analysis frameworkpreviously mentionned.
Geography and time. These two aspects are often considered of partic-ular importance. The hasLocation predicate can be used with variousGeography nodes to describe the user’s location at different granular-ity levels. The time aspect in an inherent part of our model throughstatements metadata which express time-dependent validity (times-tamp and lifetime).
Subject and user profile. The subject of the model is the point of viewadopted to represent information which, in our case, is user-centric.The user’s profile is built from statements which describe her charac-teristics (personal features and preferences) and interactions. Bolchiniet al. also mention the possibility for the model to expose user classes.As of today, we do not expose such classes in the proposed model.
Context history. Generated statements are managed by the GraphRepository, which acts as a memory and vehicle for context knowledge.Statements have time-related attributes and enable the reconstructionof a user’s situation graph at any given point in time. Therefore,the current user’s situation may depend on past context information,based on the application needs.
4.2 Representation features
Representation features are general characteristics of the model itself.

60 CHAPTER III. GRAPH-BASED SITUATION MODELING
Type for formalism. The proposed model relies on a graph-based formal-ism. The choice of representation formalism is driven by its appropri-ateness to serve the application needs. Our main application is datatailoring with recommendations. Recommendations are meant to helpinformation exploration and we consider graphs are not only applica-ble but also very well suited to back this scenario with semantics andhigh level of expressiveness.
Flexibility and formality. Our model flexibility lies in the possibility todefine custom types of nodes and statements. Besides, predicates pre-side statements semantics and new ones can be created, e.g., to de-scribe application-specific knowledge. However, non-formally definedpredicates will be difficult to interpret and discourage informationsharing.
Context granularity and constraints. Our model allows the represen-tation of context information at different levels of granularity. Thiswas in particular illustrated on the example of the hasLocation pred-icate used with different geographical nodes like Country, City, etc.Finally, context constraints can be expressed and continuously evalu-ated at runtime. For this purpose, activation rules will be presentedwith dynamic aspects in Chapter IV, Section 2.
4.3 Context management and usage
This section discusses the way the model is built, managed and exploited.However, these aspects are mostly addressed in our work thanks to com-ponents responsible for the dynamic maintenance of the platform. Theseaspects will be covered in more details in chapter IV.
Construction. The situation model is centrally maintained in the situ-ation platform, by aggregating relevant knowledge from potentiallydistributed source systems (through providers).
Reasoning. Reasoning is considered by Bolchini et al. as the ability to“infer properties or more abstract context information” [BCQ+07]. Inour framework, custom operators can be developed to interpret thesemantics of specific entities and statements. These operators mayproduce additional knowledge by creating new statements. In thatsense, the proposed framework allows reasoning on context data. As anexample, an operator could determine the city from GPS coordinateswith reverse geo-coding techniques or services.
Information quality, ambiguity and incompleteness. Quality moni-toring is particularly critical when context information is acquiredfrom physical sensors. However, it is not as crucial in our application

5. CONCLUSION 61
scenario (recommendations for business users in situational applica-tions). This is why our framework delegates various tasks of qualitymonitoring to operators. For instance, an operator could be activatedin case two ambiguous statements are detected, e.g., Marge hasLocationposition1 and Marge hasLocation position2, such that position1and position2 are distant.
Automatic learning features. Machine learning techniques could be em-ployed on history data, e.g., to detect interaction patterns and helpperform an automatic categorization of situations. However, our workdoes not fully addres this possibility and could be considered in futureresearch.
Multi-context modeling. Bolchini et al. define it as the representa-tion“in a single instance of the model all the possible contexts of thetarget application”. Our situation model exposes a single homoge-neous graph of currently valid statements, categorized in major dimen-sions. Applications consuming this model (e.g., operators or platformclient applications) are free to query and filter data to keep only factsof interest and adapt accordingly.
5 Conclusion
In this chapter, we introduced the requirements imposed on context or situ-ation modeling systems, in particular in our use case dedicated to corporatedeployment scenarios. These major requirements are meant to handle (a)applications inter-operability, (b) resources heterogeneity, (c) security andprivacy and (d) dynamic adaptation. They impose conditions on the kindof system we are considering and led us to propose a graph-based situationmodel.
The unit of information in this model is represented by a homogeneousdata structure called situation statements and first introduced by Heckmannet al. [Hec05b]. Situation statements extend simple subject-predicate-objecttriples – common with Semantic Web technologies like RDF – with additionalmetadata to capture time dependency, security and privacy, etc. We pre-sented the graph repository (GR) framework to handle and manage graphdata for different users, taking into account security aspects with actual userdata isolation. The GR is populated thanks to an extensible set of providerswhich can connect and adapt to various remote systems.
Besides, we presented a higher level and more structured situation model.On top of the GR structure which represents a personalized knowledge con-tainer, an agent situation is composed of a graph of interactions, a profileand a certain number of dimensions. Various dimensions are exposed byour model and present categories of situation knowledge. Core dimensions

62 CHAPTER III. GRAPH-BASED SITUATION MODELING
describe social and geographical aspects, whereas personalization-related di-mensions capture the user’s preferences and recommendations provided tothe user.
In the next chapter, we will focus in particular on dynamic aspects ofsituation modeling and management. In particular, we will introduce ex-tensions to the GR framework to define active components like activationrules and operators. Activation rules can be used to trigger appropriateoperations in response to certain types of business events, under varyingconditions.
Chapter IV
Dynamic Situation
Management Framework
Contents
1 Introduction . . . . . . . . . . . . . . . . . . . . . 63
1.1 Buisness events and situation dynamics . . . . . . 64
1.2 The ECA framework . . . . . . . . . . . . . . . . . 65
2 Activation rules and operators . . . . . . . . . . 66
2.1 Rules expression . . . . . . . . . . . . . . . . . . . 66
2.2 Rules evaluation . . . . . . . . . . . . . . . . . . . 69
2.3 Operators . . . . . . . . . . . . . . . . . . . . . . . 71
3 Situation framework and services . . . . . . . . . 73
3.1 Graph repository framework . . . . . . . . . . . . . 73
3.2 Situation management framework . . . . . . . . . 77
3.3 Client situation services . . . . . . . . . . . . . . . 82
4 Summary and discussion . . . . . . . . . . . . . . 83
5 Conclusion . . . . . . . . . . . . . . . . . . . . . . 84
1 Introduction
In the previous chapter we introduced our graph-based situation model,relying on the homogeneous statement structure of the Graph Repository(GR). Besides, we defined situation dimensions to expose aggregated andstructured sets of statements. We presented in particular social, geography,preferences and recommendations dimensions but others may be consideredfor specific use cases.
In this chapter, we focus on dynamic situation management, that is howto continuously monitor agents’ interactions and help maintain situation
63

64 CHAPTER IV. DYNAMIC SITUATION MANAGEMENT
Figure IV.1: Architecture overview of the situation management platformand its major components: events, activation rules and operators.
graphs as events occur in their environments. For this purpose, we proposea modular and extensible framework based on the following key notions:business events, activation rules and operators. These components are rep-resented in the general architecture diagram of Figure IV.1.
This section presents business events and the event-condition-action(ECA) model, used to define active rules in event-driven architectures. Sec-tion 2 discusses our implementation of this model, in particular the expres-sion and evaluation of activation rules to trigger operators. Then, we reviewin Section 3 the modular architecture of our framework, from the underlyingGR to more dynamic components.
1.1 Buisness events and situation dynamics
Business events are at the core of dynamic situation management. Eventsmay describe characteristics of the user’s environment – for instance theuser’s location in a statement like Marge hasLocation India – or interactionswith existing resources – like Marge read document1. Events can be raisedby internal components of the platform or sent by client applications tocontribute to the aggregated view of a user’s situation. Figure IV.7 showsexamples of client applications. As an example, an add-in for a commonlyused email client could be designed to submit events similar to Marge read

1. INTRODUCTION 65
document1. In the end, the situation management component needs to reactto these events to take appropriate actions in impacted situation graphs.
The examples above seem to indicate that an event is fairly similar to astatement, that is a qualified interaction between resources. In some casesthough, an event may need to convey more semantics to be meaningful, e.g.,in the form of background knowledge. For instance, the statement Marge
read document1 could be completed with additional information about theauthor of the document, as with the statement document1 hasAuthor Nick.
Therefore, we can distinguish between atomic (or simple) events andcomplex events. An atomic business event is composed of a single statement.On the other hand, we define a complex business event as the graph formedby a collection of statements which represent an interaction plus additionalinformation. The RDF listing below presents a sample business event whichactually contains two statements, Marge read document1 and document1
hasAuthor Nick:
<rdf:RDF xmlns...>
<rdf:Description rdf:about="http://.../statement123">
<rdf:type rdf:resource="http://...#Statement"/>
<rdf:subject rdf:resource="http://.../marge"/>
<rdf:predicate rdf:resource="http://.../read"/>
<rdf:object rdf:resource="http://.../document1"/>
<grepo:origin rdf:resource="http://.../EmailClient"/>
<grepo:timestamp>12345</grepo:timestamp>
<grepo:lifetime>5</grepo:lifetime>
</rdf:Description>
...
<rdf:Description rdf:about="http://.../statement127">
<rdf:type rdf:resource="http://...#Statement"/>
<rdf:subject rdf:resource="http://.../document1"/>
<rdf:predicate rdf:resource="http://.../hasAuthor"/>
<rdf:object rdf:resource="http://.../Nick"/>
<grepo:origin rdf:resource="http://.../EmailClient"/>
<grepo:timestamp>12346</grepo:timestamp>
<grepo:lifetime>500</grepo:lifetime>
</rdf:Description>
</rdf:RDF>
1.2 The ECA framework
In event-driven architectures, the event-condition-action (ECA) struc-ture can be used to define active rules, with clear declarative seman-tics [BFMS06]:
ON event IF condition DO action.

66 CHAPTER IV. DYNAMIC SITUATION MANAGEMENT
Rules are used to react to specific events and trigger additional process-ing (action), assuming some other conditions are met. We use this ECA
framework to define active rules in our system. Let us briefly introduce thethree components of such rules:
Event. The event part is used to filter events the activation rule will reactto. For instance, a given rule could react to events which match theinteraction pattern “a user is reading an unstructured document”.
Condition. The condition part allows to express additional conditionswhich can be evaluated thanks to queries on the GR. The GR thusserves as a vehicle for contextual information. Various conditions maybe expressed, for instance dependencies between agents as in “agentBapplies if agentA hasProcessed document1”.
Action. Eventually, the action part is used to determine which operationsor modifications should be applied to situations (and more generallygraphs), in response to the event being interpreted.
We define in our framework two important components to react to busi-ness events, activation rules and operators. The actual expression of rulesand their evaluation is further discussed in Section 2. A rule positivelyevaluated triggers the execution of an operator (see Section 2.3).
2 Activation rules and operators
In this section, we present activation rules which are the application of theECA framework previously presented to define rules in our dynamic situationsituation management framework.
2.1 Rules expression
We introduce the semantics and expressiveness of activation rules basedon the ECA framework, meant to help define active rules in event-drivensystems.
2.1.1 E - Filtering events
In an ECA rule, the event part enables a first level of filtering on eventsthe rule may react to. Events may represent very different types of inter-actions plus potential background knowledge, and it is likely that only fewrules are concerned by a given business event. Event filtering is thus animportant aspect during the rule evaluation process as it helps dismiss somerules in an efficient way, by reducing actual evaluations to the minimumnecessary. Rules evaluation may indeed become costly when the number of

2. ACTIVATION RULES AND OPERATORS 67
rules increases or complex querying is involved. The rule evaluation processis further described in Section 2.2.
Therefore, the first part of an activation rule is an event filtering pattern.An event filtering pattern is defined as a combination of four conditions im-posed on the subject, the predicate, the object and the origin of statements,noted CsubjectCpredicateCobject, Corigin. Let us consider a first event filteringpattern, which keeps only those that introduce the geographic location of aentity, for instance in a statement like Marge hasLocation India:
ANY hasLocation #GeographyNode, ANY
In this example, the reserved keyword ANY is used to denote an absenceof condition imposed on the subject and the origin. The only acceptedpredicate will be hasLocation. It may be noted that we leave out full URIs inexamples for the sake of clarity. The object condition filters out nodes whichtype is not GeographyNode. This type is one of those accessible through theglobal Graph Repository schema, introduced in Chapter III, Section 2.2.3.In particular, this schema may be augmented by providers of the GR andenables the definition of hierarchies of types. Country and City are twoexamples of types defined as children of the GeographyNode type.
Let us now consider a more precise event filtering pattern to only reactto events that describe the location of the current user. For this purpose,we introduce the USER keyword which refers to the current for whom a ruleis being evaluated:
USER hasLocation #GeographyNode
In this example and because there is no specific constraint on the origin,the corresponding condition can be omitted. When the condition on theorigin is not omitted, it is possible to restrict, e.g., to information emergingfrom mobile application agents:
USER hasLocation #GeographyNode, #MobileApp
2.1.2 C - Condition expression
On top of conditions imposed on the event itself, an activation rule maydefine additional constraints for the execution of a given operator. Letus present briefly examples of conditions that may be used to define suchconstraints in our framework.
An execution guard is a simple condition preventing the execution ofthe operator. Execution guards can be manifold, from simple authorizationto more complex dynamic operationalconstraint. Below is a first conditionexample that enables the execution of an operator if and only if the currentuser explicitly authorized it:
68 CHAPTER IV. DYNAMIC SITUATION MANAGEMENT
USER authorizes operatorA, USER
This example is particular since rules do not have to make it explicit. Theauthorization control is indeed taken care of by the dynamic managementframework before the operator is executed. Another example of conditionmay be used to avoid an operator being executed twice in a situation, inresponse to a single event.
NOT(operatorA hasProcessed EVENT.object, operatorA)
The EVENT keyword is used to denote the event being evaluated or in-terpreted. The four parts of the corresponding statement are obtainedthrough the following accessors: EVENT.subject, .predicate, .object and.origin. It is also worth noting that using this kind of condition to expressa dependency is inherently dependant on the assumption that operatorA
will create such a statement when it has finished its processing.Similarly, activation rules may also be used to define constraints in the
sense of operators dependencies. For instance, if an operatorB requires theexecution of a previous operatorA to first perform some operations on theevent target (or object):
operatorA hasProcessed EVENT.object
2.1.3 A - Taking action
In the ECA framework, the action part of a rule is meant to determineactions to be taken in response to the initial triggering event. These actionscan be manifold but often, in the fields of active databases or Semantic Webtechnologies, the action consists in data insertion, modification or deletion.In our framework, activation rules are meant to trigger the execution ofoperators which will be presented in further details in Section 2.3
As we previously presented, activation rules are continuously evaluatedin response to events thanks to queries executed on the GR. An activationrule triggers the execution of a given operator with additional parameters.
To define the action part of our rules, we introduce two reserved key-words, CALL and WITH, used with the following syntax:
CALL operator WITH parameters. . .
Should a rule be positively evaluated, the specified operator is executedwith the following parameters. Parameters of this list (separated by com-mas) result from the event filtering and condition evaluation process, usingbound variables. Rules evaluation is discussed in the next section.
Considering the previous ongoing rule example, we now illustrate thecall to a stemming operator, taking as single parameter the unstructureddocument mentioned by the event (in the corresponding statement object):
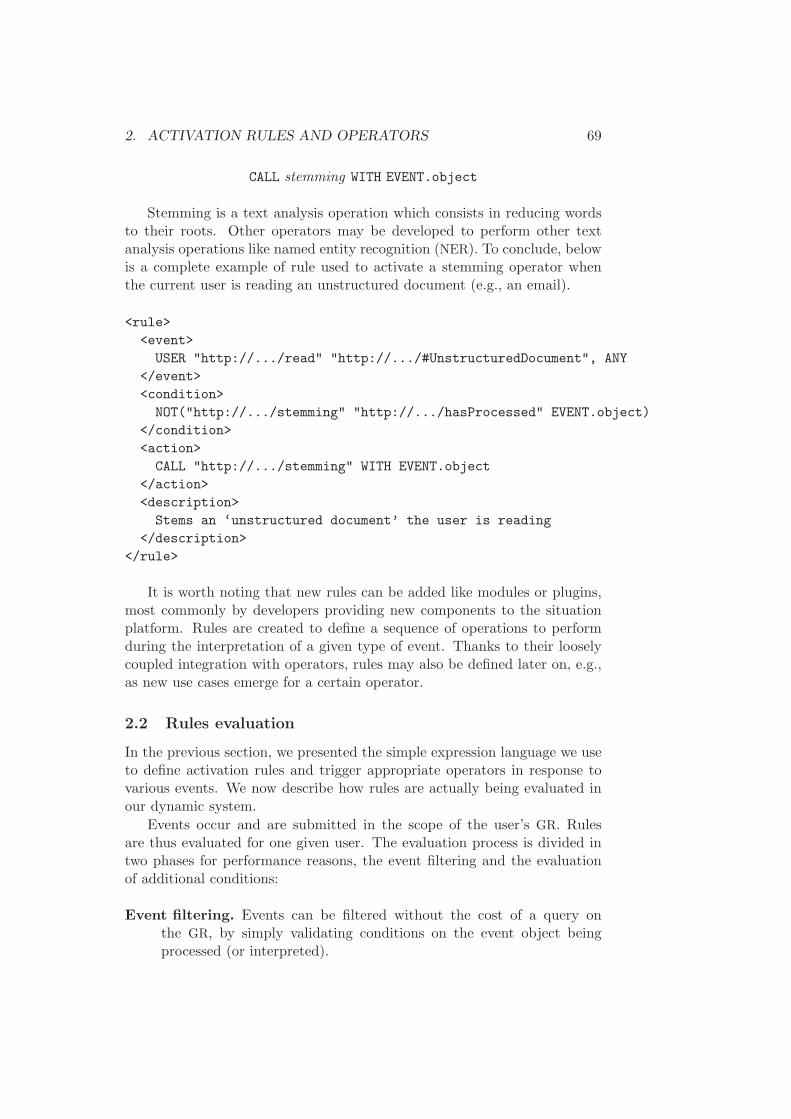
2. ACTIVATION RULES AND OPERATORS 69
CALL stemming WITH EVENT.object
Stemming is a text analysis operation which consists in reducing wordsto their roots. Other operators may be developed to perform other textanalysis operations like named entity recognition (NER). To conclude, belowis a complete example of rule used to activate a stemming operator whenthe current user is reading an unstructured document (e.g., an email).
<rule>
<event>
USER "http://.../read" "http://.../#UnstructuredDocument", ANY
</event>
<condition>
NOT("http://.../stemming" "http://.../hasProcessed" EVENT.object)
</condition>
<action>
CALL "http://.../stemming" WITH EVENT.object
</action>
<description>
Stems an ‘unstructured document’ the user is reading
</description>
</rule>
It is worth noting that new rules can be added like modules or plugins,most commonly by developers providing new components to the situationplatform. Rules are created to define a sequence of operations to performduring the interpretation of a given type of event. Thanks to their looselycoupled integration with operators, rules may also be defined later on, e.g.,as new use cases emerge for a certain operator.
2.2 Rules evaluation
In the previous section, we presented the simple expression language we useto define activation rules and trigger appropriate operators in response tovarious events. We now describe how rules are actually being evaluated inour dynamic system.
Events occur and are submitted in the scope of the user’s GR. Rulesare thus evaluated for one given user. The evaluation process is divided intwo phases for performance reasons, the event filtering and the evaluationof additional conditions:
Event filtering. Events can be filtered without the cost of a query onthe GR, by simply validating conditions on the event object beingprocessed (or interpreted).
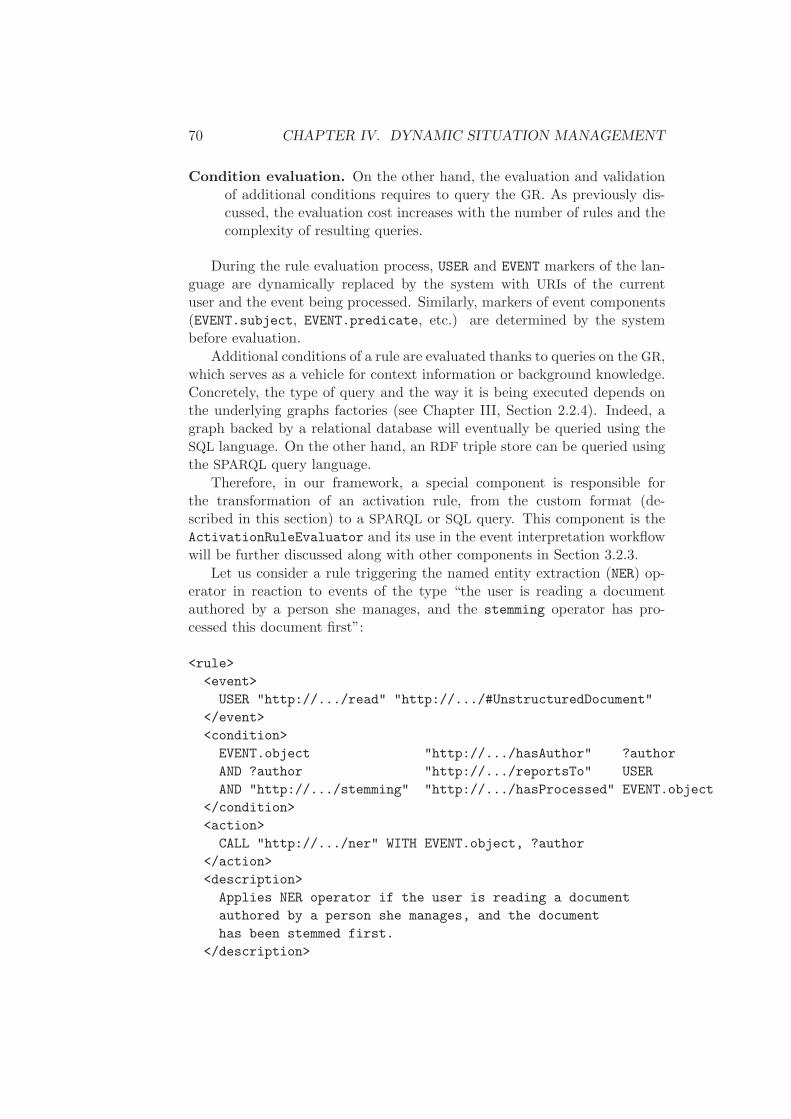
70 CHAPTER IV. DYNAMIC SITUATION MANAGEMENT
Condition evaluation. On the other hand, the evaluation and validationof additional conditions requires to query the GR. As previously dis-cussed, the evaluation cost increases with the number of rules and thecomplexity of resulting queries.
During the rule evaluation process, USER and EVENT markers of the lan-guage are dynamically replaced by the system with URIs of the currentuser and the event being processed. Similarly, markers of event components(EVENT.subject, EVENT.predicate, etc.) are determined by the systembefore evaluation.
Additional conditions of a rule are evaluated thanks to queries on the GR,which serves as a vehicle for context information or background knowledge.Concretely, the type of query and the way it is being executed depends onthe underlying graphs factories (see Chapter III, Section 2.2.4). Indeed, agraph backed by a relational database will eventually be queried using theSQL language. On the other hand, an RDF triple store can be queried usingthe SPARQL query language.
Therefore, in our framework, a special component is responsible forthe transformation of an activation rule, from the custom format (de-scribed in this section) to a SPARQL or SQL query. This component is theActivationRuleEvaluator and its use in the event interpretation workflowwill be further discussed along with other components in Section 3.2.3.
Let us consider a rule triggering the named entity extraction (NER) op-erator in reaction to events of the type “the user is reading a documentauthored by a person she manages, and the stemming operator has pro-cessed this document first”:
<rule>
<event>
USER "http://.../read" "http://.../#UnstructuredDocument"
</event>
<condition>
EVENT.object "http://.../hasAuthor" ?author
AND ?author "http://.../reportsTo" USER
AND "http://.../stemming" "http://.../hasProcessed" EVENT.object
</condition>
<action>
CALL "http://.../ner" WITH EVENT.object, ?author
</action>
<description>
Applies NER operator if the user is reading a document
authored by a person she manages, and the document
has been stemmed first.
</description>

2. ACTIVATION RULES AND OPERATORS 71
</rule>
In the example above, the event filter assumes that the event itself doesnot contain information regarding the author of the document. The eventfilter can thus simply be validated without the cost of a query to the GR.However, the condition validation imposes to query the GR and the exampleillustrates the use of a bound variable ?author to form a complex pattern,in an approach similar to SPARQL queries. We illustrate below the SPARQL
query which can be obtained by transforming the condition of the previousactivation rule:
PREFIX rdf : <http://www.w3.org/1999/02/22-rdf-syntax-ns#>
PREFIX grepo : <http://www.sap.com/graphrepo#>
SELECT ?author
WHERE {
EVENT.object grepo:hasAuthor ?author
?author grepo:reportsTo USER
grepo:operatorA grepo:hasProcessed EVENT.object
}
The result of the evaluation for this query is a value (or set of values)for the ?author variable. The evaluation fails if there is the result set isempty. Otherwise, the NER operator is invoked with parameters resultingfrom both event filtering and condition validation phases.
2.3 Operators
We presented in details the language used to express rules and how theyare evaluated on the GR in reaction to events, with actual queries. In thissection, we define and discuss operators, which execution is triggered byactivation rules with parameters resulting the rule evaluation process.
2.3.1 Definition
Operators are key components which maintain situations graphs (and moregenerally graphs of the GR) by adding, updating or deleting statements.These operations represent either explicitly declared facts (e.g., Maggie read-ing document1) or knowledge resulting of additional processing (for instancea NER result, like document1 mentions entity1).
An operator op takes as input a situation graph Gsit, an event e andparameters params to return the updated situation G′sit:
op : (Gsit, e, params) −→ G′sit

72 CHAPTER IV. DYNAMIC SITUATION MANAGEMENT
Table IV.1: Examples of operators. This include system operators andspecific ones related to some of our experimentations (see Chapter VI).Operator Description
Expiry checker (sys-tem)
Checks statements of a given situation to determineand remove those that are outdated. Outdated state-ments are simply removed from the current view butpersisted to constitute historical data.
Geolocalize Determines the approximate GPS coordinates (lat-itude and longitude) of a given geographic entity,which can be a precise address, a city, a country, etc.
GeoIP Determines the city from an IP address. Various ex-ternal web services can easily be used for this purpose.
ReverseGeocoder Reverses GPS coordinates to determine the closestaddress or more simply the city, department, state,etc.
Stemmer Applies stemming to unstructured resources. Stem-ming consists in text normalization and reduceswords to their roots. For instance, the sentence “itis raining cats and dogs” would be reduced to “it berain cat and dog”.
NER Performs Named Entity Recognition on text re-sources, extracting entities with various dictionaries.Extracted entities are mapped to objects of the datawarehouse the user can see.
Query recommen-dation
Combines results of entity extraction with the se-mantics of a business domain to suggest meaningfulqueries. These last 3 operators will be further dis-cussed with the Text-To-Query system, in Chap-ter VI, Section 2.
From the framework standpoint, similar to providers for the GR, op-erators are defined in a modular way. The situation platform manages apool of registered operators which can be developed to interpret the specificsemantics of various providers and/or events. Implementation wise, new op-erators can easily be developed and registered as plugins, according to thearchitecture presented in Section 3.2.2.
2.3.2 Examples of operators
Many operators can be considered to perform a broad range of tasks. Ta-ble IV.1 lists examples of operators implemented throughout our variousexperimentations, further described in Chapter VI. Operators can be com-bined and reused so that more complex operations can be divided and im-
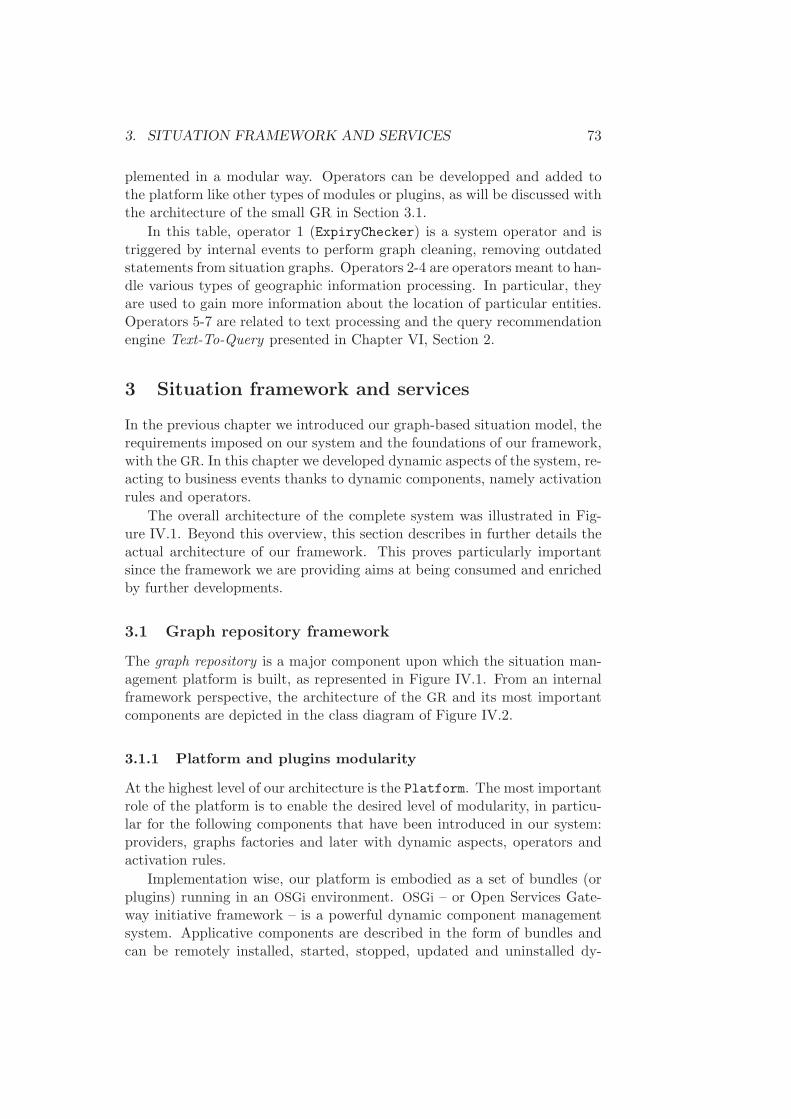
3. SITUATION FRAMEWORK AND SERVICES 73
plemented in a modular way. Operators can be developped and added tothe platform like other types of modules or plugins, as will be discussed withthe architecture of the small GR in Section 3.1.
In this table, operator 1 (ExpiryChecker) is a system operator and istriggered by internal events to perform graph cleaning, removing outdatedstatements from situation graphs. Operators 2-4 are operators meant to han-dle various types of geographic information processing. In particular, theyare used to gain more information about the location of particular entities.Operators 5-7 are related to text processing and the query recommendationengine Text-To-Query presented in Chapter VI, Section 2.
3 Situation framework and services
In the previous chapter we introduced our graph-based situation model, therequirements imposed on our system and the foundations of our framework,with the GR. In this chapter we developed dynamic aspects of the system, re-acting to business events thanks to dynamic components, namely activationrules and operators.
The overall architecture of the complete system was illustrated in Fig-ure IV.1. Beyond this overview, this section describes in further details theactual architecture of our framework. This proves particularly importantsince the framework we are providing aims at being consumed and enrichedby further developments.
3.1 Graph repository framework
The graph repository is a major component upon which the situation man-agement platform is built, as represented in Figure IV.1. From an internalframework perspective, the architecture of the GR and its most importantcomponents are depicted in the class diagram of Figure IV.2.
3.1.1 Platform and plugins modularity
At the highest level of our architecture is the Platform. The most importantrole of the platform is to enable the desired level of modularity, in particu-lar for the following components that have been introduced in our system:providers, graphs factories and later with dynamic aspects, operators andactivation rules.
Implementation wise, our platform is embodied as a set of bundles (orplugins) running in an OSGi environment. OSGi – or Open Services Gate-way initiative framework – is a powerful dynamic component managementsystem. Applicative components are described in the form of bundles andcan be remotely installed, started, stopped, updated and uninstalled dy-
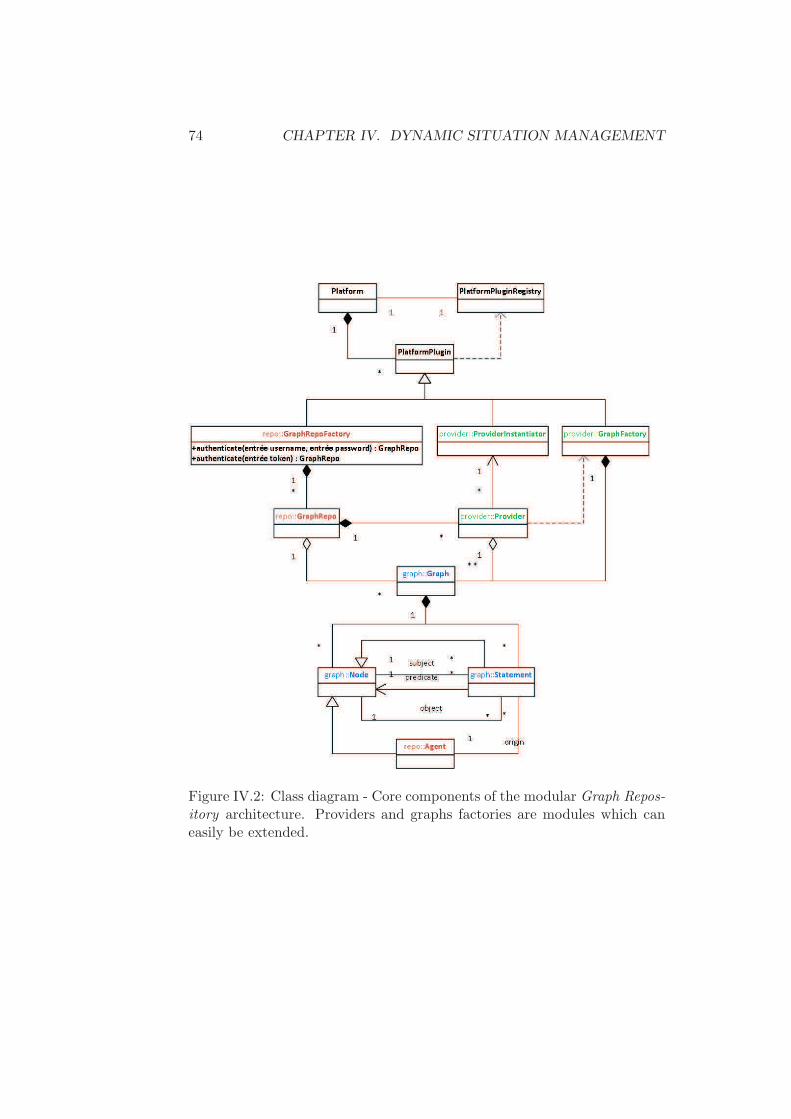
74 CHAPTER IV. DYNAMIC SITUATION MANAGEMENT
Figure IV.2: Class diagram - Core components of the modular Graph Repos-itory architecture. Providers and graphs factories are modules which caneasily be extended.
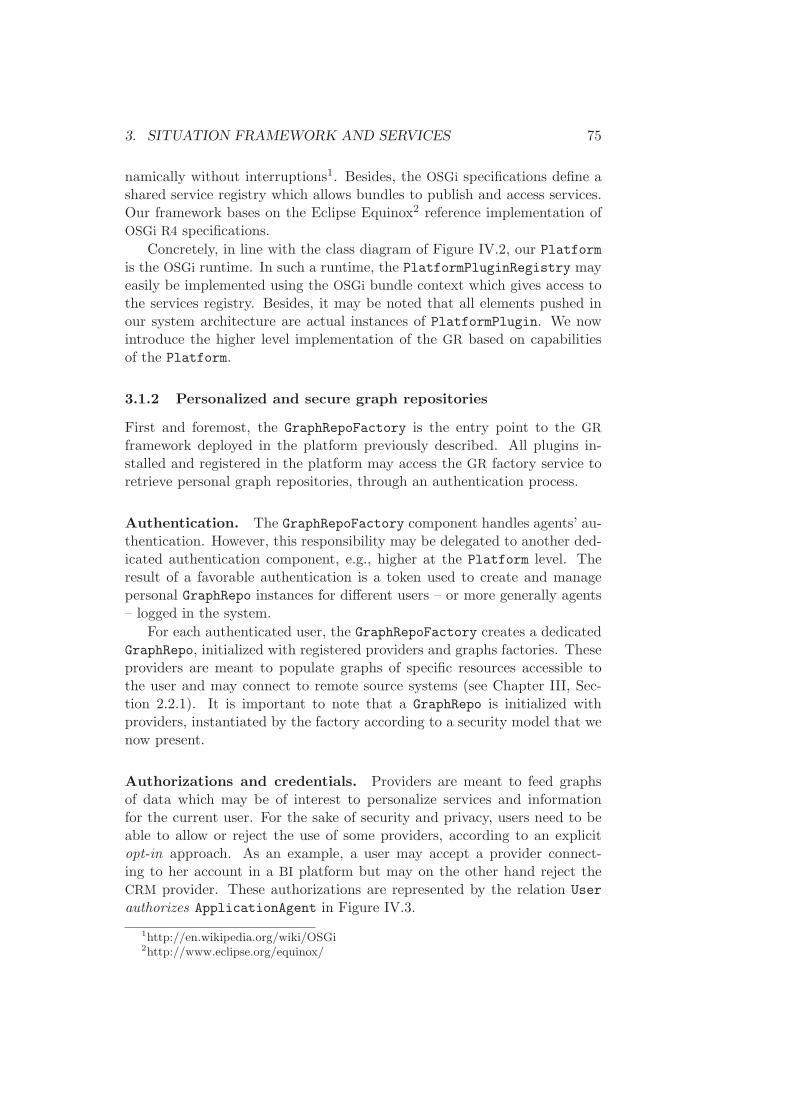
3. SITUATION FRAMEWORK AND SERVICES 75
namically without interruptions1. Besides, the OSGi specifications define ashared service registry which allows bundles to publish and access services.Our framework bases on the Eclipse Equinox2 reference implementation ofOSGi R4 specifications.
Concretely, in line with the class diagram of Figure IV.2, our Platformis the OSGi runtime. In such a runtime, the PlatformPluginRegistry mayeasily be implemented using the OSGi bundle context which gives access tothe services registry. Besides, it may be noted that all elements pushed inour system architecture are actual instances of PlatformPlugin. We nowintroduce the higher level implementation of the GR based on capabilitiesof the Platform.
3.1.2 Personalized and secure graph repositories
First and foremost, the GraphRepoFactory is the entry point to the GR
framework deployed in the platform previously described. All plugins in-stalled and registered in the platform may access the GR factory service toretrieve personal graph repositories, through an authentication process.
Authentication. The GraphRepoFactory component handles agents’ au-thentication. However, this responsibility may be delegated to another ded-icated authentication component, e.g., higher at the Platform level. Theresult of a favorable authentication is a token used to create and managepersonal GraphRepo instances for different users – or more generally agents– logged in the system.
For each authenticated user, the GraphRepoFactory creates a dedicatedGraphRepo, initialized with registered providers and graphs factories. Theseproviders are meant to populate graphs of specific resources accessible tothe user and may connect to remote source systems (see Chapter III, Sec-tion 2.2.1). It is important to note that a GraphRepo is initialized withproviders, instantiated by the factory according to a security model that wenow present.
Authorizations and credentials. Providers are meant to feed graphsof data which may be of interest to personalize services and informationfor the current user. For the sake of security and privacy, users need to beable to allow or reject the use of some providers, according to an explicitopt-in approach. As an example, a user may accept a provider connect-ing to her account in a BI platform but may on the other hand reject theCRM provider. These authorizations are represented by the relation User
authorizes ApplicationAgent in Figure IV.3.
1http://en.wikipedia.org/wiki/OSGi2http://www.eclipse.org/equinox/
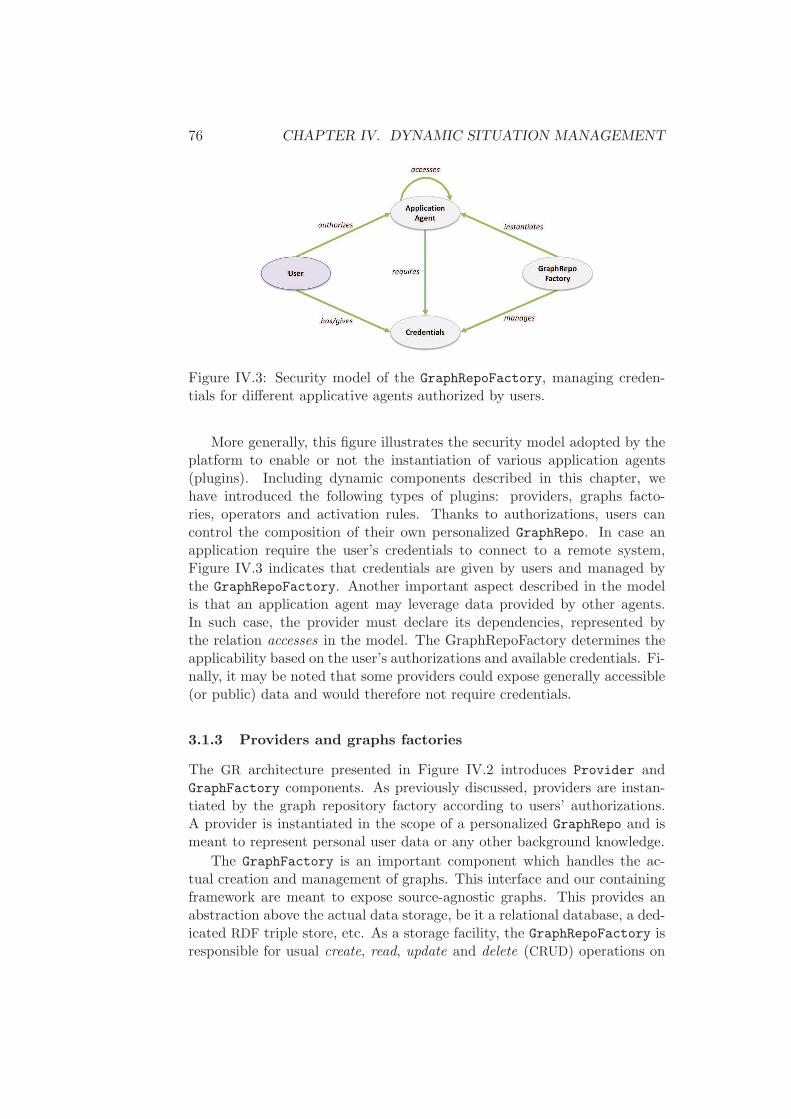
76 CHAPTER IV. DYNAMIC SITUATION MANAGEMENT
Figure IV.3: Security model of the GraphRepoFactory, managing creden-tials for different applicative agents authorized by users.
More generally, this figure illustrates the security model adopted by theplatform to enable or not the instantiation of various application agents(plugins). Including dynamic components described in this chapter, wehave introduced the following types of plugins: providers, graphs facto-ries, operators and activation rules. Thanks to authorizations, users cancontrol the composition of their own personalized GraphRepo. In case anapplication require the user’s credentials to connect to a remote system,Figure IV.3 indicates that credentials are given by users and managed bythe GraphRepoFactory. Another important aspect described in the modelis that an application agent may leverage data provided by other agents.In such case, the provider must declare its dependencies, represented bythe relation accesses in the model. The GraphRepoFactory determines theapplicability based on the user’s authorizations and available credentials. Fi-nally, it may be noted that some providers could expose generally accessible(or public) data and would therefore not require credentials.
3.1.3 Providers and graphs factories
The GR architecture presented in Figure IV.2 introduces Provider andGraphFactory components. As previously discussed, providers are instan-tiated by the graph repository factory according to users’ authorizations.A provider is instantiated in the scope of a personalized GraphRepo and ismeant to represent personal user data or any other background knowledge.
The GraphFactory is an important component which handles the ac-tual creation and management of graphs. This interface and our containingframework are meant to expose source-agnostic graphs. This provides anabstraction above the actual data storage, be it a relational database, a ded-icated RDF triple store, etc. As a storage facility, the GraphRepoFactory isresponsible for usual create, read, update and delete (CRUD) operations on
3. SITUATION FRAMEWORK AND SERVICES 77
graphs.
In particular, we provide an RDF-based implementation which enablesthe creation of graphs managed in-memory, in files or by a relationaldatabase. Besides, data can be queried using the SPARQL language butwe also expose a certain number of convenience methods to iterate over fil-tered nodes or statements. This implementation is enabled by the popularlibrary for the Semantic Web, Jena3.
3.2 Situation management framework
In Section 2 of Chapter III, we defined the user’s situation as a collectionof currently valid statements. The time aspect is an important aspect andtherefore, situation graphs are meant to evolve at a possibly rapid pace, inresponse to events.
We previously discussed the foundations of the GR framework. Let usnow elaborate more on dynamic components of our situation managementframework. Figure IV.1 illustrates the three building blocks of the archi-tecture of our situation platform: situations, operators with activation rulesand events. In this section, we describe these aspects, with respect to theclass diagram of the framework depicted in Figure IV.4.
Let us briefly remind the roles of components responsible for dynamicmaintenance of the situation model described in Chapter III:
Events. An Event is a statement (or collection of statements) raised ina given situation, representing interactions plus additional knowl-edge. Events are queued to be processed asynchronously by anEventProcessor.
Activation rules. An activation rule triggers an operator in response to anevent, assuming some other conditions are met. Rules can be definedin any plugin and are mainly evaluated thanks to queries on the GR.
Operators. As a result of rules evaluation, an operator may be executedwith certain parameters. The operator is then able to update thesituation graph in response to the triggering event.
3.2.1 Situation provider
We defined situations as specific graphs centered on the concerned agent.As all graphs in the GR framework, a Situation is therefore created andmanaged by a particular provider, the SituationProvider. This providercreates situation graphs using the RDF-based factory, backed by a relationaldatabase for data storage or simply by a pure in-memory model. These
3http://jena.sourceforge.net/
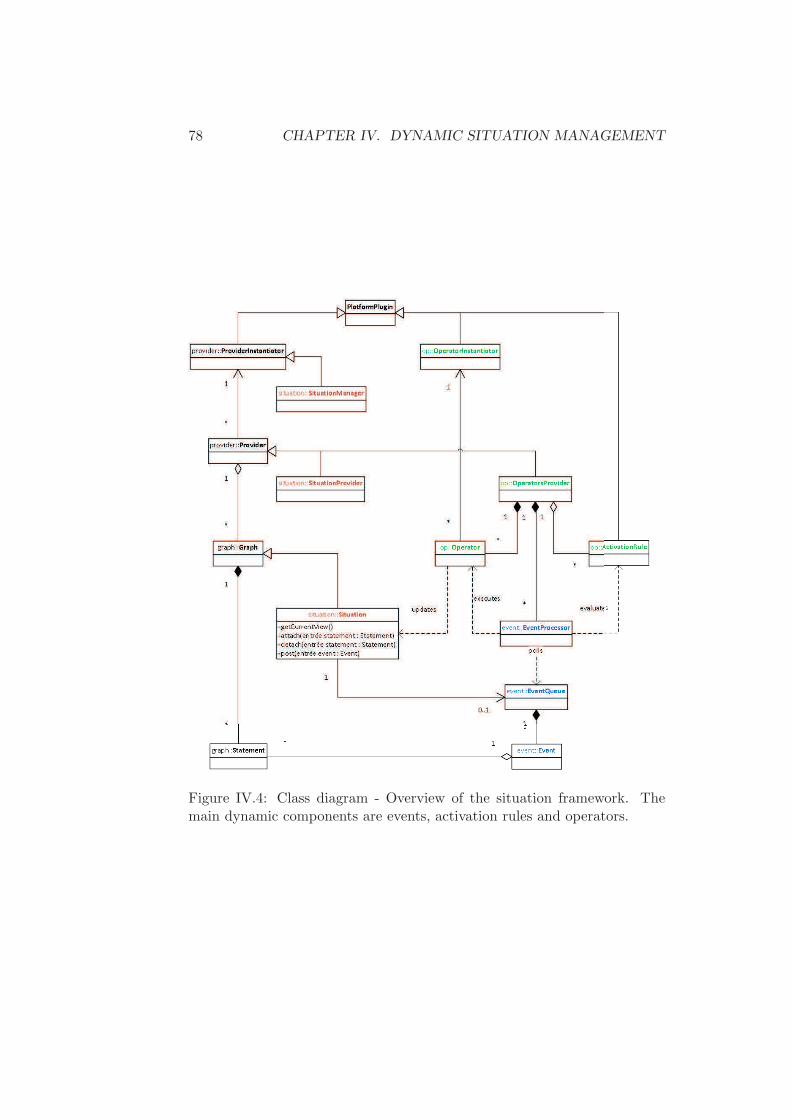
78 CHAPTER IV. DYNAMIC SITUATION MANAGEMENT
Figure IV.4: Class diagram - Overview of the situation framework. Themain dynamic components are events, activation rules and operators.
3. SITUATION FRAMEWORK AND SERVICES 79
graphs contain all nodes and statements that contribute to define the dy-namic view of situations, obtained through the getCurrentView() methodexposed in our object model (see Chapter III, Section 3).
The current view is dynamically mainted by operators which add, ud-pate or remove statements from situations. The term remove matters hereas statements are not actually deleted. Instead, the situation provider man-ages statements lifetime accordingly and old statements are stored for his-tory purposes. In our homogeneous model, it is possible to query for bothcurrently valid and historical data. Concretely, it is possible to evaluate acertain query at any time (now or in the past) using dedicated timestampand lifetime attributes.
Among operators that dynamically maintain situation graphs, theExpiryChecker introduced in Table IV.1 scans statements of the currentview to determine and remove outdated ones. The SituationProvider isresponsible to trigger this operator by raising internal events at a determinedfrequency, e.g., every minute. An example of such event could be expressedas follows:
SituationProvider requires ExpiryChecker
For the sake of completeness, we illustrate below the complete rule thattriggers the ExpiryChecker operator in response to this event. The operatordoes not require any parameter so WITH parameters is omitted in the actionpart of the rule:
<rule>
<event>
"http://.../situation-provider" "http://.../requires"
"http://.../expiry-checker", "http://.../situation-provider"
</event>
<condition/>
<action>
CALL "http://.../expiry-checker"
</action>
<description>
Calls expiry checker upon request by situation provider
</description>
</rule>
3.2.2 Operators and activation rules
Operators are very similar to providers in that their instantiation is handledby the GraphRepoFactory according to the previously discussed securitymodel, illustrated in Figure IV.3. Operators are implemented as modulesor plugins and they are instantiated in the scope of a given GraphRepo, so
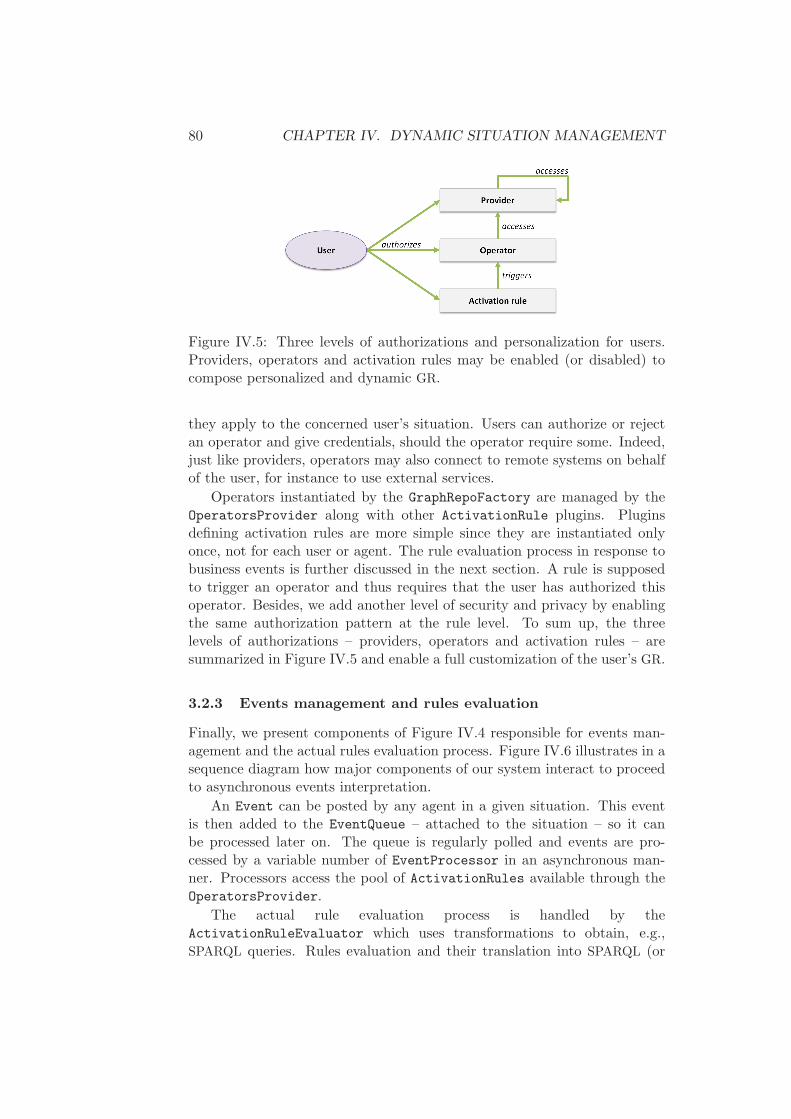
80 CHAPTER IV. DYNAMIC SITUATION MANAGEMENT
Figure IV.5: Three levels of authorizations and personalization for users.Providers, operators and activation rules may be enabled (or disabled) tocompose personalized and dynamic GR.
they apply to the concerned user’s situation. Users can authorize or rejectan operator and give credentials, should the operator require some. Indeed,just like providers, operators may also connect to remote systems on behalfof the user, for instance to use external services.
Operators instantiated by the GraphRepoFactory are managed by theOperatorsProvider along with other ActivationRule plugins. Pluginsdefining activation rules are more simple since they are instantiated onlyonce, not for each user or agent. The rule evaluation process in response tobusiness events is further discussed in the next section. A rule is supposedto trigger an operator and thus requires that the user has authorized thisoperator. Besides, we add another level of security and privacy by enablingthe same authorization pattern at the rule level. To sum up, the threelevels of authorizations – providers, operators and activation rules – aresummarized in Figure IV.5 and enable a full customization of the user’s GR.
3.2.3 Events management and rules evaluation
Finally, we present components of Figure IV.4 responsible for events man-agement and the actual rules evaluation process. Figure IV.6 illustrates in asequence diagram how major components of our system interact to proceedto asynchronous events interpretation.
An Event can be posted by any agent in a given situation. This eventis then added to the EventQueue – attached to the situation – so it canbe processed later on. The queue is regularly polled and events are pro-cessed by a variable number of EventProcessor in an asynchronous man-ner. Processors access the pool of ActivationRules available through theOperatorsProvider.
The actual rule evaluation process is handled by theActivationRuleEvaluator which uses transformations to obtain, e.g.,SPARQL queries. Rules evaluation and their translation into SPARQL (or
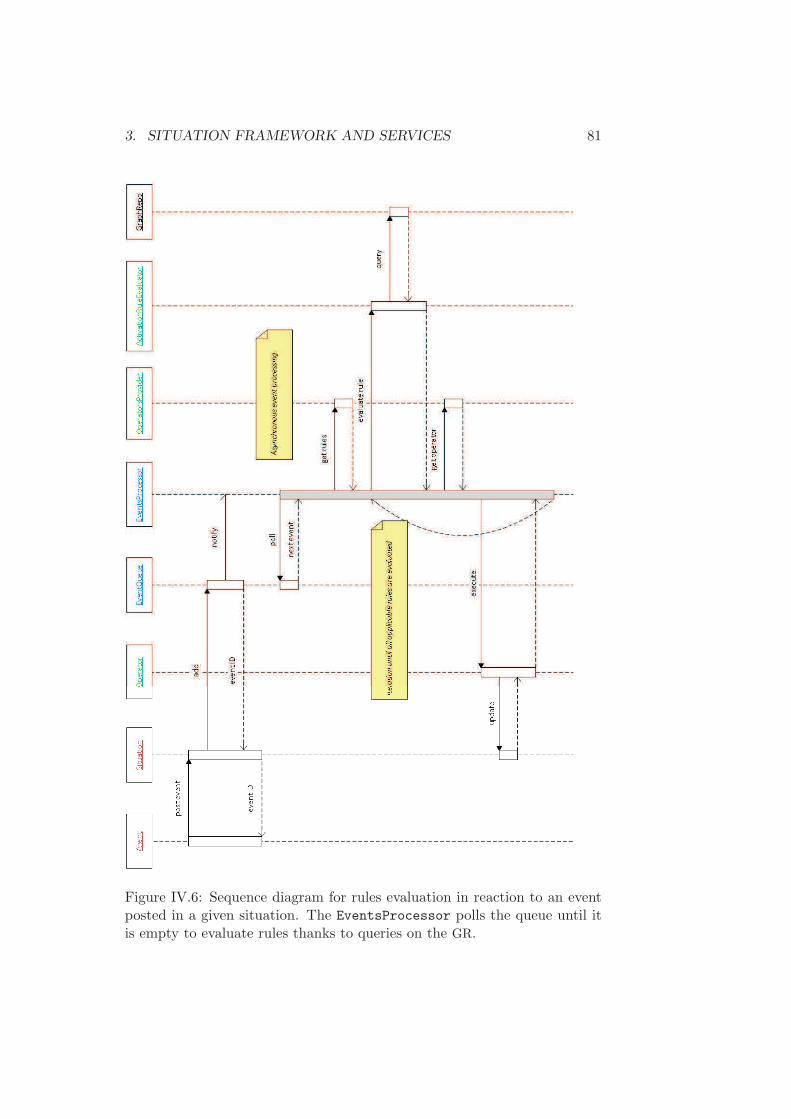
3. SITUATION FRAMEWORK AND SERVICES 81
Figure IV.6: Sequence diagram for rules evaluation in reaction to an eventposted in a given situation. The EventsProcessor polls the queue until itis empty to evaluate rules thanks to queries on the GR.
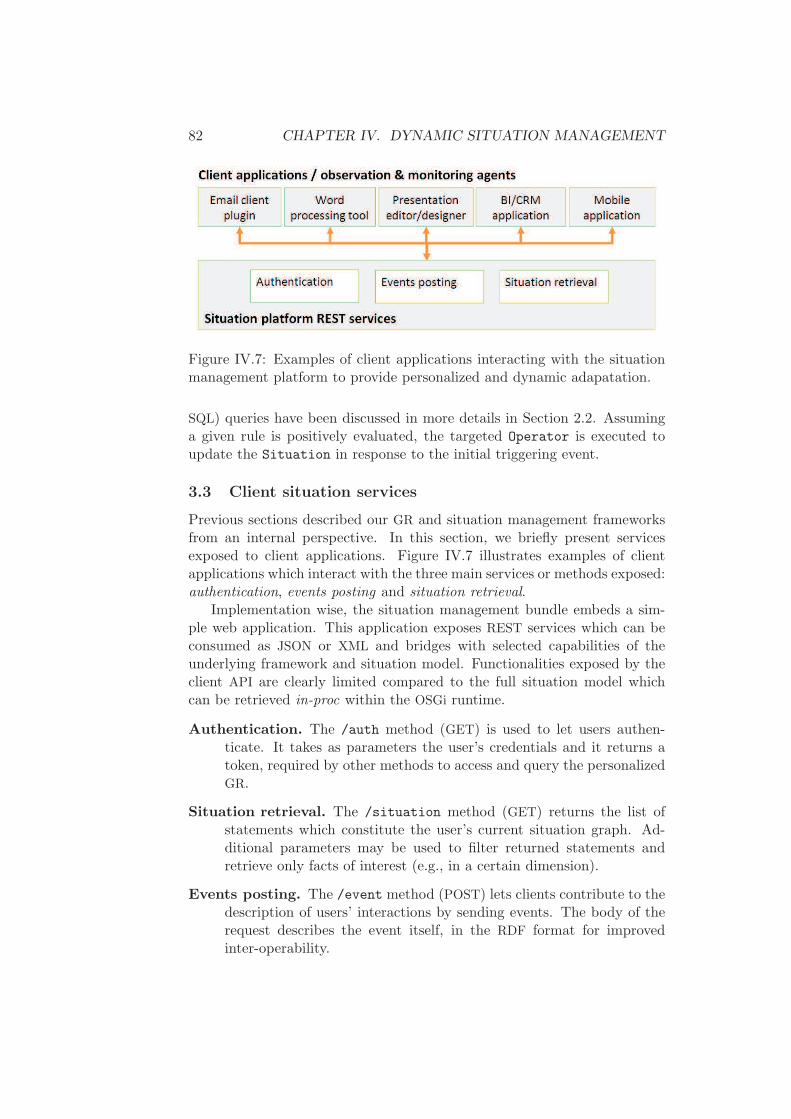
82 CHAPTER IV. DYNAMIC SITUATION MANAGEMENT
Figure IV.7: Examples of client applications interacting with the situationmanagement platform to provide personalized and dynamic adapatation.
SQL) queries have been discussed in more details in Section 2.2. Assuminga given rule is positively evaluated, the targeted Operator is executed toupdate the Situation in response to the initial triggering event.
3.3 Client situation services
Previous sections described our GR and situation management frameworksfrom an internal perspective. In this section, we briefly present servicesexposed to client applications. Figure IV.7 illustrates examples of clientapplications which interact with the three main services or methods exposed:authentication, events posting and situation retrieval.
Implementation wise, the situation management bundle embeds a sim-ple web application. This application exposes REST services which can beconsumed as JSON or XML and bridges with selected capabilities of theunderlying framework and situation model. Functionalities exposed by theclient API are clearly limited compared to the full situation model whichcan be retrieved in-proc within the OSGi runtime.
Authentication. The /auth method (GET) is used to let users authen-ticate. It takes as parameters the user’s credentials and it returns atoken, required by other methods to access and query the personalizedGR.
Situation retrieval. The /situation method (GET) returns the list ofstatements which constitute the user’s current situation graph. Ad-ditional parameters may be used to filter returned statements andretrieve only facts of interest (e.g., in a certain dimension).
Events posting. The /event method (POST) lets clients contribute to thedescription of users’ interactions by sending events. The body of therequest describes the event itself, in the RDF format for improvedinter-operability.

4. SUMMARY AND DISCUSSION 83
4 Summary and discussion
In the previous chapter we introduced a graph-based situation model to en-able a homogeneous representation and exploitation of varied resources andinteractions. We presented the foundations of the GR framework to meetour requirements, in particular in terms of security and modularity. In thischapter, we first introduced dynamic components that compose our situationmanagement framework, implemented as extensions of the GR framework.Most importantly, activation rules and operators are active components usedto react to business events, be they submitted by client applications (e.g.,using REST services) or raised internally. Moreover, we discussed the ex-pression and evaluation of activation rules in Section 2. These rules aredescribed in a specific format and are used to trigger various operators. Op-erators can be developed to perform a broad range of operations in orderto maintain situations (or more generally graphs). Then, we described inmore details the actual architecture of our GR and situation managementframeworks. In particular, we implemented the GR foundations in an OSGi
runtime to enable a high level of modularity, with plugins that can be dy-namically installed, started and stopped.
In Section 2.1, we described the expression of activation rules, using aspecific format then translated into queries for the GR. This custom formatstructures rules using the ECA approach. In particular and beyond the ini-tial event filtering, the condition part of a rule defines additional constraintsthat need to be verified to perform the action, implemented as an operator.Our aim was to maintain the storage independance and define an interme-diary format for rules, in particular the condition part. However, it rapidlyappeared that rules would greatly benefit from an expressive graph querylanguage, for instance using bound variables, very briefly introduced in thelast example of Section 2.2. Should the graph storage be implemented as atriple store, the SPARQL query language is particularly well adapted. Ourinitial attempt to define an intermediary language appeared to be an imped-iment for rapid and iterative improvements, as our reference implementationof the GR was RDF-based. It would have been more productive and less re-dundant to leverage to SPARQL queries and use the full expressivity of thislanguage from the very beginning.
The continuous rules evaluation process described in Section 3.2.3 en-ables both linear (or deterministic) and non-linear evolution scenarios. Lin-ear evolution scenarios are those which produce a determined sequence ofoperations in response to a given event. As a simple example, a linearevaluation scenario will be illustrated by the combination of several oper-ators in Chapter VI, Section 2. In this example, three operators are ac-tivated in a pre-determined order in response to events of the type Marge
read document1. The mentioned document is first stemmed before entityextraction techniques can be applied and these results are eventually com-
84 CHAPTER IV. DYNAMIC SITUATION MANAGEMENT
bined to recommend queries related to document1. In non-linear evolutionscenarios, operations performed may not be determined in advance as con-tinuous rules evluation may not give the same result twice, assuming someconditions changed during the evaluation. Although non-linear evolutionscenarios would be extremely interesting to consider, it appeared difficult toshowcase interesting real-life scenarios. Indeed, such a scenario would mostlikely involve an important degree of integration with a variety of sourcesystems, and thus lead to important development and demonstration costs.
Even though it was not precisely discussed in this chapter, reasoning isan important feature enabled and exposed by the GR framework. Compo-nents developed in the context of this framework may use various capabili-ties like transitive closure or custom rule-based reasoning. Reasoning can behelpful in some case, e.g., to infer additional knowledge from existing state-ments which may be incomplete. However, we do not enable systematicreasoning on generated graphs since it can be extremely costly and repre-sent an important burden for scalability. Therefore, the framework allowsthe construction of graphs extending existing ones in order to control thor-oughly the reasoning process, for instance using volatile (purely in-memory)graphs. As an example, in Section 2.3 of Chapter V, we will present theuse of minimal OWL and rule-based reasoning techniques in the context ofmulti-dimensional domain models (OLAP). Besides, we will discuss the rea-soning performance with regards to two different implementations to insiston the importance of performance-related considerations.
5 Conclusion
In conclusion, we presented in this chapter extensions of the GR frameworkintroduced in Chapter III. These extensions provide a set of extensiblecomponents to enrich the GR with dynamic behavior in an event-driven ap-proach. Activation rules are used to react to varied business events andtrigger appropriate operators. Business events are composed of one or morestatements (in a graph) and may describe an interaction plus related knowl-edge. Activation rules are expressed according to the ECA framework anddefined using a specific format. These rules are interpreted at runtime dur-ing the evaluation process and translated into queries on the GR. Should theGR reference implementation base on RDF graphs, queries may be expressedusing the SPARQL graph query language. Positively evaluated rules triggerwith resulting parameters the execution of appropriate operators. Operatorsare components responsible for the dynamic maintenance and adapation ofsituations (and more generally graphs). Like providers, the exploitation ofactivation rules and operators is controlled by the security model of the GR
framework. Users’ authorizations apply at these three different levels toeventually allow the definition of personalized and active graph repositories.
5. CONCLUSION 85
We reckon that the combination of the core GR framework with dynamiccomponents brings a very interesting perspective, for personalization and dy-namic adaptation in heterogeneous environments. As part of future work, weconsider the following two directions are of particular interest and should beinvestigated. First, if linear evolution scenarios are already valuable, non-linear ones would more extensively demonstrate the range of capabilitiesoffered by our dynamic situation management framework. We thus consideran important focus of future research should be on the definition and valida-tion of such scenarios. Secondly, as a result of more complex scenarios beingconsidered, the language used to express activation rules should be enrichedand simplified, for instance by basing on regular SPARQL syntax. Besides,given the aggregagted nature of the GR, conditions of rules may have to beverified thanks to queries on multiple graphs. We did not investigate moreclosely on this issue as it is already a feature of SPARQL specifications4 withnamed graphs (the FROM NAMED syntax).
4http://www.w3.org/TR/rdf-sparql-query/

86 CHAPTER IV. DYNAMIC SITUATION MANAGEMENT
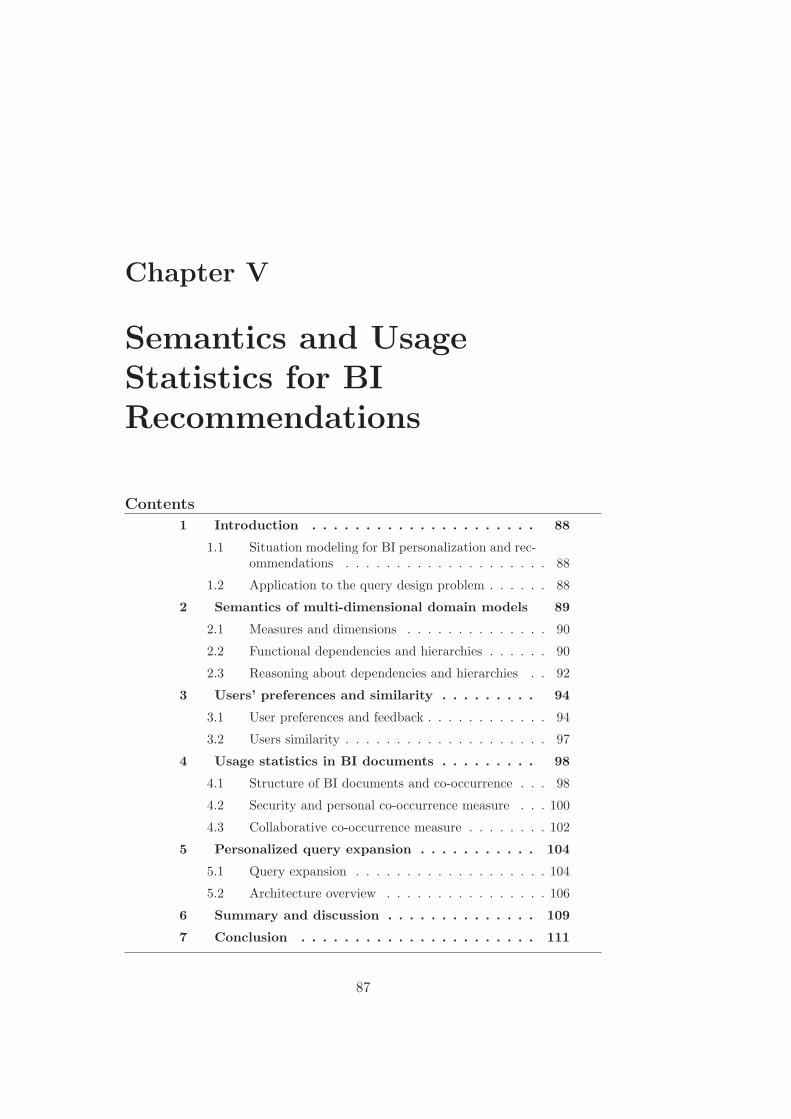
Chapter V
Semantics and Usage
Statistics for BI
Recommendations
Contents
1 Introduction . . . . . . . . . . . . . . . . . . . . . 88
1.1 Situation modeling for BI personalization and rec-ommendations . . . . . . . . . . . . . . . . . . . . 88
1.2 Application to the query design problem . . . . . . 88
2 Semantics of multi-dimensional domain models 89
2.1 Measures and dimensions . . . . . . . . . . . . . . 90
2.2 Functional dependencies and hierarchies . . . . . . 90
2.3 Reasoning about dependencies and hierarchies . . 92
3 Users’ preferences and similarity . . . . . . . . . 94
3.1 User preferences and feedback . . . . . . . . . . . . 94
3.2 Users similarity . . . . . . . . . . . . . . . . . . . . 97
4 Usage statistics in BI documents . . . . . . . . . 98
4.1 Structure of BI documents and co-occurrence . . . 98
4.2 Security and personal co-occurrence measure . . . 100
4.3 Collaborative co-occurrence measure . . . . . . . . 102
5 Personalized query expansion . . . . . . . . . . . 104
5.1 Query expansion . . . . . . . . . . . . . . . . . . . 104
5.2 Architecture overview . . . . . . . . . . . . . . . . 106
6 Summary and discussion . . . . . . . . . . . . . . 109
7 Conclusion . . . . . . . . . . . . . . . . . . . . . . 111
87

88 CHAPTER V. BI SEMANTICS AND USAGE STATISTICS
1 Introduction
Data warehouses are designed to integrate and prepare data from productionsystems - the Extract Transform and Load (ETL) process - to be analyzedwith Business Intelligence (BI) tools. These tools now enable users to navi-gate through and analyze large amounts of data thanks to a significant effortfrom IT and domain experts to first model domains of interests. However,exploiting these multi-dimensional models may become challenging in im-portant deployments of production systems. Indeed, domain models cangrow extremely complex with thousands of BI entities, measures and dimen-sions used, e.g., to build OLAP cubes.
1.1 Situation modeling for BI personalization and recom-
mendations
In Chapters III and IV we introduced our graph-based situation model andcomponents for continuous monitoring and maintenance in response to busi-ness events, which may be used to describe users’ interactions or more gen-erally dynamic behaviors.
This chapter aims at presenting the application of our graph repository(GR) and situation management frameworks to BI concepts, to facilitatepersonalized data access. This personalization comes in various forms butwe focus in particular on the assistance that can be given to users during thequery design process, which is key to help them reach data they are lookingfor.
Personalization and recommendations involve a broad range of tech-niques, some of which were discussed in the review of related work, in par-ticular in Chapter II, Section 2. In this chapter, we elaborate for instance onoccurrences of BI entities and matrices of co-occurrences, users’ preferencesand users’ similarity.
1.2 Application to the query design problem
In common reporting and analysis tools, users can design data queries usingsome kind of query panel. For instance, a user may drag and drop measuresand dimensions she wants to use to create a new visualization or report,e.g., showing the Sales revenue aggregated by City. Given the number ofavailable measures and dimensions, this selection can be tedious and helpingthe user to build her query rapidly becomes crucial. Therefore, our aim isto address the problem of query construction, through iterative suggestionsand selection of measures and dimensions.
We define the query expansion problem as a function QE taking as inputa user u, the current query q and additional parameters params. Thisfunction returns a collection of scored queries (qi, si) such that, for i from 1
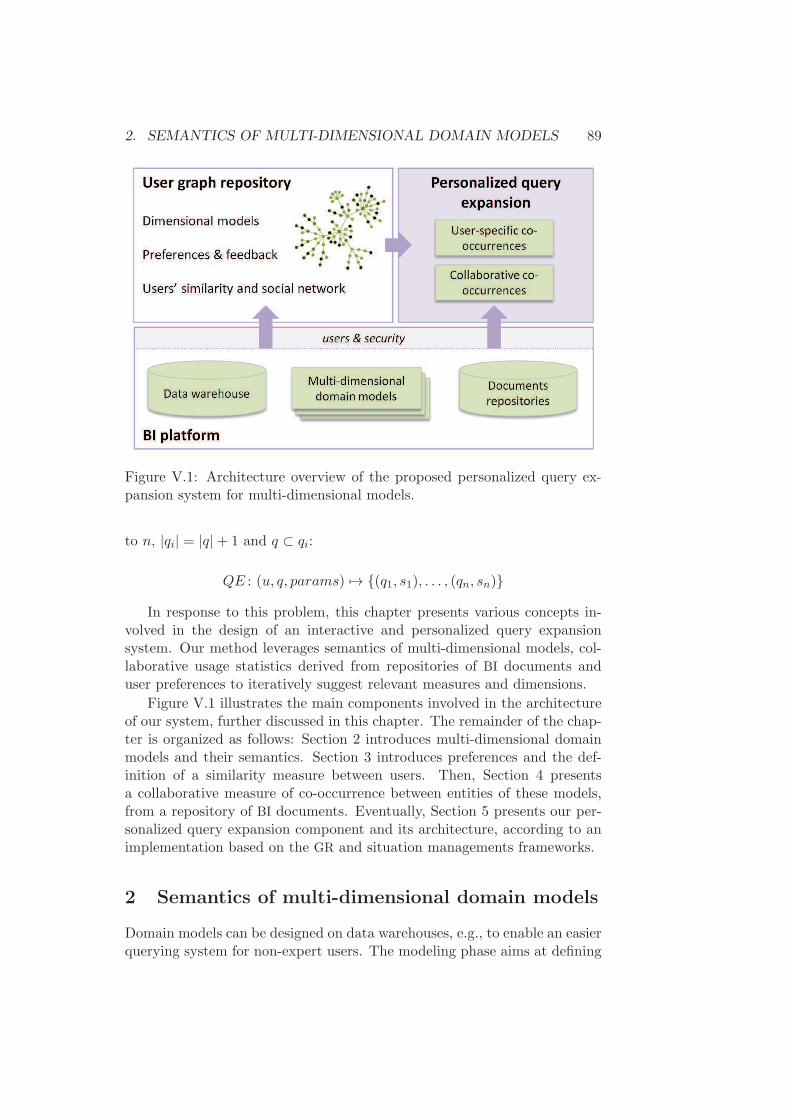
2. SEMANTICS OF MULTI-DIMENSIONAL DOMAIN MODELS 89
Figure V.1: Architecture overview of the proposed personalized query ex-pansion system for multi-dimensional models.
to n, |qi| = |q|+ 1 and q ⊂ qi:
QE : (u, q, params) 7→ {(q1, s1), . . . , (qn, sn)}
In response to this problem, this chapter presents various concepts in-volved in the design of an interactive and personalized query expansionsystem. Our method leverages semantics of multi-dimensional models, col-laborative usage statistics derived from repositories of BI documents anduser preferences to iteratively suggest relevant measures and dimensions.
Figure V.1 illustrates the main components involved in the architectureof our system, further discussed in this chapter. The remainder of the chap-ter is organized as follows: Section 2 introduces multi-dimensional domainmodels and their semantics. Section 3 introduces preferences and the def-inition of a similarity measure between users. Then, Section 4 presentsa collaborative measure of co-occurrence between entities of these models,from a repository of BI documents. Eventually, Section 5 presents our per-sonalized query expansion component and its architecture, according to animplementation based on the GR and situation managements frameworks.
2 Semantics of multi-dimensional domain models
Domain models can be designed on data warehouses, e.g., to enable an easierquerying system for non-expert users. The modeling phase aims at defining

90 CHAPTER V. BI SEMANTICS AND USAGE STATISTICS
concepts of the business domain with key indicators (measures) and axis ofanalysis (dimensions) [JM06, chap. 1].
2.1 Measures and dimensions
Domain models are defined and used to query the warehouse for actual dataand perform calculations. A warehouse may be materialized as a relationaldatabase, and queries thus have to be expressed accordingly, for instanceas SQL. From a calculation point of view, it is also possible to build multi-dimensional OLAP cubes on top of a business domain model. Dimensions arerepresented as axis of a cube and measures are aggregated inside the differentcells. It may be noted that the term “cube” refers to a convenient imagebut these structures are not limited to three dimensions. Queries can beexpressed on these cubes, e.g., with Multi-Dimensional eXpressions (MDX).In modern warehouses, business domain models provide a predefined spaceof aggregates that reflects the organizational structure, key performanceindicators, and other important information for a company’s line of business.Furthermore, they provide SQL/MDX generation algorithms to enable non-expert users to formulate ad-hoc queries. End users can manipulate objectsof these models (measures and dimensions) using common business terms(such as “customer” or “revenue”), rather than technical query languages.
Measures are numerical facts that can be aggregated against variousdimensions ([BCG+08]). For instance, the measure Sales revenue couldbe aggregated (e.g., from unit sales) on the dimension Country to get therevenue in different countries. When analyzing data, e.g., for reporting,users can go deeper in a hierarchy of dimensions or aggregate at a higherlevel dimension to summarize data. These two operations are respectivelycalled drill down and roll up. Data can also be filtered on some specific valuesof a dimension (keep only or selection) to restrict the scope of analysis.
To sum up, multi-dimensional domain models define measures and di-mensions which are key business entities used to explore and query a datawarehouse. Additionally, these domain models may also define hierarchies ofdimensions and functional dependencies between measures and dimensions.
2.2 Functional dependencies and hierarchies
A functional dependency between two objects A and B (measures or dimen-sions) of a multi-dimensional model is a structural – and thus schema-related– relation, noted A determines B. As a simple example, a given instance ofCity determines a related instance at the higher State level. Another ex-ample that involves a measure and a dimension is to say that knowing aCustomer, the Sales revenue he generates can be determined (e.g., aggre-gated from unit sales in a fact table). Functional dependencies are transitive:if City determines State which determines Country, then City determines
2. SEMANTICS OF MULTI-DIMENSIONAL DOMAIN MODELS 91
Figure V.2: Hierarchies and functional dependencies between some measures(purple nodes) and dimensions (yellow), described in an Island Resorts Mar-keting domain model (red) of a data warehouse.
Country.
Figure V.2 illustrates various hierarchies and dependency chains betweenobjects of a multi-dimensional domain model. The most simple case ofdependencies is when all measures are determined by all dimensions. Thishappens for instance when using a minimal dataset, e.g., reduced to one flatfact table like a spreadsheet. In such a case though, there is no dependencyknown before hand between dimensions, because of the lack of structuringschema.
The knowledge of functional dependencies is important when designingqueries. For instance, they can be used to ensure queries do not containincompatible objects, which would eventually prevent their execution. Letus consider an example of tourism-related domain model which defines aReservation year dimension. This dimension may be used to query for thenumber of upcoming reservations in different places. On the other hand, itcannot determine the Sales revenue since this measure depends on billingrather than reservation dates. As an illustrating use case, the query ex-pansion system presented later in this chapter (see Section 5) makes use offunctional dependencies during the construction of its iterative suggestions.

92 CHAPTER V. BI SEMANTICS AND USAGE STATISTICS
In particular, objects incompatibility is used to filter the set of candidateentities before scoring.
Even though functional dependencies are important, multi-dimensionaldomain models do not necessarily capture and expose this metadata. Hierar-chies of dimensions are more common though, usually exploited in reportingand analysis tools to enable drill down and roll up operations. For instance,if a Year - Quarter hierarchy is defined, the result of a user drilling downon Year 2010 is a similar query with the Quarter dimension, filtered onYear = 2010.
2.3 Reasoning about dependencies and hierarchies
If hierarchies of dimensions can be used to determine minimal dependencychains, techniques are required to help with automatic detection of func-tional dependencies. We now present our semi-automatic approach to easea partly manual definition of functional dependencies, enriching existing do-main models.
2.3.1 Transitivity and custom rules
The approach presented by [RCARM09] is to create domain-specific con-ceptual schemas in the form of ontologies and use DL-Lite inferencing ca-pabilities. However, the definition of multi-dimensional business domainmodels is a costly process in which many BI users have already invested.Therefore, our method is different and meant to sit on top of already ex-isting multi-dimensional models, in particular using defined measures anddimensions. We assume hierarchies are already represented in these models.Besides, our aim is to minimize as much as possible the manual definition ofsome functional dependencies, and infer additional relations using reasoningcapabilities.
For this purpose, we mainly exploit the fact that functional dependenciesare transitive plus two additional rules, noted R1 and R2. Figure V.3 illus-trates derived knowledge resulting from the application of these two rules,described as follows:
R1. Hierarchies imply functional dependencies. As an example, knowingthat Week hasParent Quarter, it can easily be deduced that Week
determines Quarter.
R2. If a dimension D1 determines a measure M1 and another dimensionD2, then D2 determines M1. For instance, in Figure V.3, Store de-termines both the measure Quantity Sold and the dimension City.As a result, it can be inferred that City determines Quantity Sold.
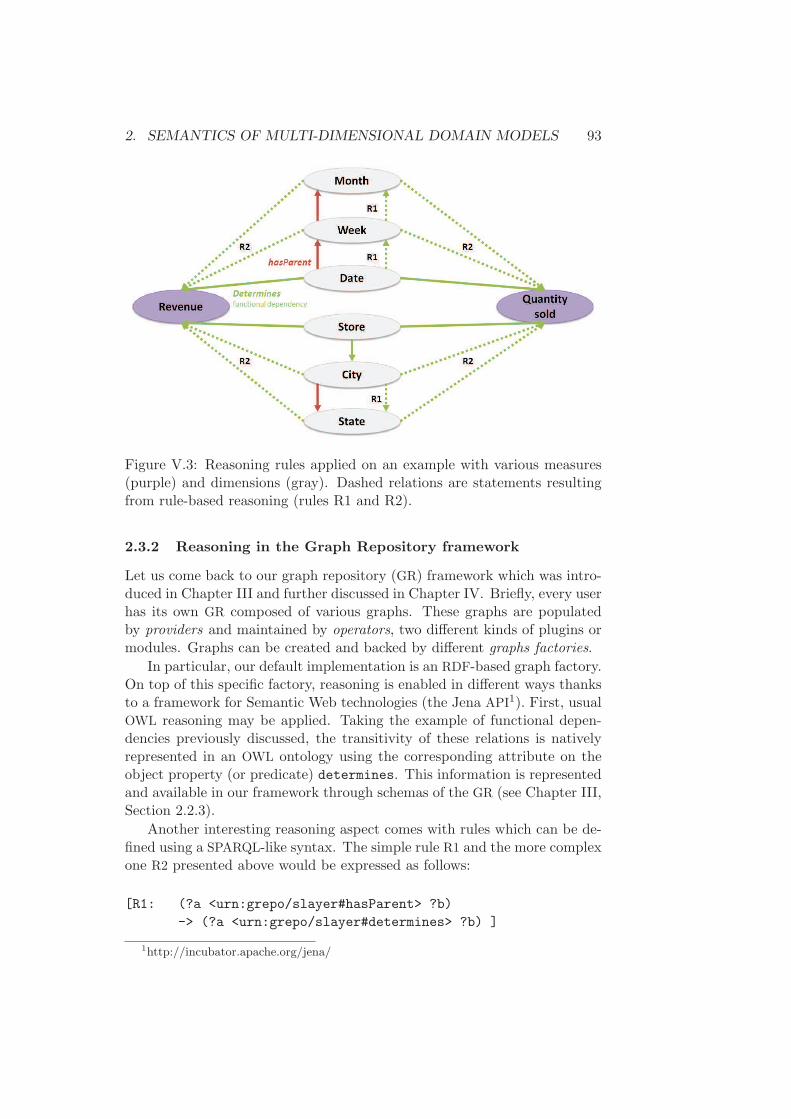
2. SEMANTICS OF MULTI-DIMENSIONAL DOMAIN MODELS 93
Figure V.3: Reasoning rules applied on an example with various measures(purple) and dimensions (gray). Dashed relations are statements resultingfrom rule-based reasoning (rules R1 and R2).
2.3.2 Reasoning in the Graph Repository framework
Let us come back to our graph repository (GR) framework which was intro-duced in Chapter III and further discussed in Chapter IV. Briefly, every userhas its own GR composed of various graphs. These graphs are populatedby providers and maintained by operators, two different kinds of plugins ormodules. Graphs can be created and backed by different graphs factories.
In particular, our default implementation is an RDF-based graph factory.On top of this specific factory, reasoning is enabled in different ways thanksto a framework for Semantic Web technologies (the Jena API1). First, usualOWL reasoning may be applied. Taking the example of functional depen-dencies previously discussed, the transitivity of these relations is nativelyrepresented in an OWL ontology using the corresponding attribute on theobject property (or predicate) determines. This information is representedand available in our framework through schemas of the GR (see Chapter III,Section 2.2.3).
Another interesting reasoning aspect comes with rules which can be de-fined using a SPARQL-like syntax. The simple rule R1 and the more complexone R2 presented above would be expressed as follows:
[R1: (?a <urn:grepo/slayer#hasParent> ?b)
-> (?a <urn:grepo/slayer#determines> ?b) ]
1http://incubator.apache.org/jena/

94 CHAPTER V. BI SEMANTICS AND USAGE STATISTICS
[R2: (?a <urn:grepo/slayer#determines> ?m)
(?m rdf:type <urn:grepo/slayer#Measure>)
(?a <urn:grepo/slayer#determines> ?c)
(?c rdf:type <urn:grepo/slayer#Dimension>)
-> (?c <urn:grepo/slayer#determines> ?m) ]
To sum up, full-flavored OWL and rule-based reasoning capabilities areexposed through the GR framework, assuming the underlying RDF graphfactory is used. It is important to highlight the fact that the complexity andcost of reasoning can in some cases make it inapplicable, even with rathersmall underlying datasets. However, well selected reasoning rules may beused with controlled datasets to obtain very valuable results or inferencesin reasonable time. Section 5.2.1 further discusses these performance issuesthat need to be taken into consideration. In particular, the discussion baseson a comparison of two possible implementations for the set of reasoningtechniques previously described.
We present in Section 5 our personalized query expansion component.For this purpose, we need to ensure suggested queries contain compatibleobjects so as to allow their execution. Functional dependencies allow usto determine compatible measures and dimensions. From the consumptionpoint of view, hierarchies and dependencies that result from the reasoningprocess can be queried like any other graph of the GR.
3 Users’ preferences and similarity
Preferences are more and more common to help personalize informationand services for users. However, the problem of expressing preferences formulti-dimensional query entities has only recently been approached. In thissection we discuss the possibility to express user preferences at the level ofmulti-dimensional models. This approach differs from the previous work byGolfarelli et al. [GRB11] since we do not go down to the underlying querylanguage, be it SQL (on top of a relational database) or MDX (on top ofOLAP cubes). Besides, our discussion focuses on simple numerical valueswhich are applied to BI entities but could easily be considered with otherscenarios and datasets. On top of these preferences, we use the Pearsoncorrelation to define a similarity measure between users. This metric waspresented with other usual techniques for recommender systems (RS), inChapter II, Section 2.
3.1 User preferences and feedback
We call general preferences simple numeric values that indicate the user’spreference for a given resource or entity. Even though this approach could
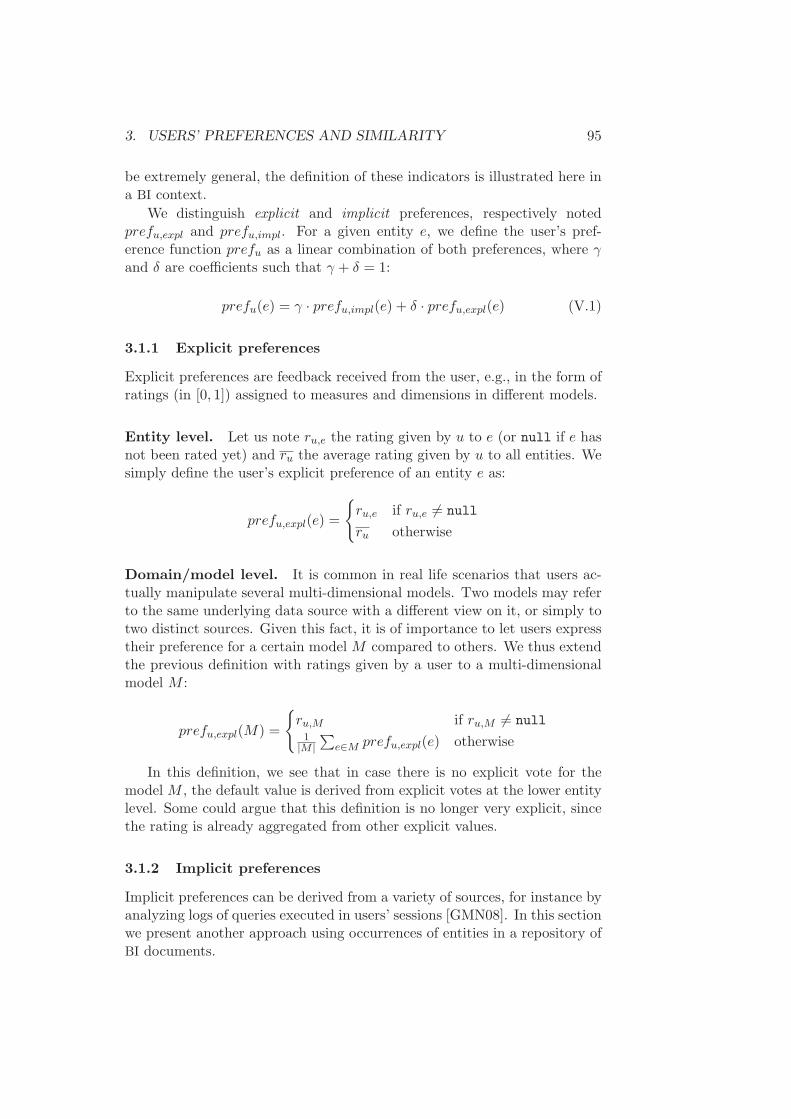
3. USERS’ PREFERENCES AND SIMILARITY 95
be extremely general, the definition of these indicators is illustrated here ina BI context.
We distinguish explicit and implicit preferences, respectively notedprefu,expl and prefu,impl. For a given entity e, we define the user’s pref-erence function prefu as a linear combination of both preferences, where γ
and δ are coefficients such that γ + δ = 1:
prefu(e) = γ · prefu,impl(e) + δ · prefu,expl(e) (V.1)
3.1.1 Explicit preferences
Explicit preferences are feedback received from the user, e.g., in the form ofratings (in [0, 1]) assigned to measures and dimensions in different models.
Entity level. Let us note ru,e the rating given by u to e (or null if e hasnot been rated yet) and ru the average rating given by u to all entities. Wesimply define the user’s explicit preference of an entity e as:
prefu,expl(e) =
{
ru,e if ru,e 6= null
ru otherwise
Domain/model level. It is common in real life scenarios that users ac-tually manipulate several multi-dimensional models. Two models may referto the same underlying data source with a different view on it, or simply totwo distinct sources. Given this fact, it is of importance to let users expresstheir preference for a certain model M compared to others. We thus extendthe previous definition with ratings given by a user to a multi-dimensionalmodel M :
prefu,expl(M) =
{
ru,M if ru,M 6= null1|M |
∑
e∈M prefu,expl(e) otherwise
In this definition, we see that in case there is no explicit vote for themodel M , the default value is derived from explicit votes at the lower entitylevel. Some could argue that this definition is no longer very explicit, sincethe rating is already aggregated from other explicit values.
3.1.2 Implicit preferences
Implicit preferences can be derived from a variety of sources, for instance byanalyzing logs of queries executed in users’ sessions [GMN08]. In this sectionwe present another approach using occurrences of entities in a repository ofBI documents.

96 CHAPTER V. BI SEMANTICS AND USAGE STATISTICS
If hierarchies and functional dependencies are structural or navigationalrelations, they are not specific to a given user and they do not convey anyinformation regarding the way users actually explore available data. Onthe contrary, repositories of documents mainly bring usage statistics. Ouraim is thus to leverage these statistics – combined with semantics of multi-dimensional models – to provide personalized assistance and recommenda-tions. The structure of BI documents will be more precisely discussed inSection 4. Briefly though, reports and dashboards may contain chart ortables and BI entities may be referenced by these charts.
Entity level. From this perspecitve, we consider that occurrences of BI
entities in documents manipulated by the user can be an interesting andsimple indicator of her preferences. Let us note occu(e) the set of charts andtables which reference an entity e, in u’s personal collection of documents.We define implicit preferences of the user u for the entity e as the normalizedfrequency of e in documents:
prefu,impl(e) =|occu(e)|
maxe′ |occu(e′)|
The notions of entities occurrences and frequency in documents canclearly be linked to content-based recommender systems and at its root toinformation retrieval techniques. A more sophisticated formula may thus useTF-IDF-like weights for entities. In particular, as discussed in Section 2.2.1of Chapter II, the inverse document frequency (IDF) part of a TF-IDF weightis meant to reduce the importance of entities that appear very often. Suchentities are indeed less discriminatory in the filtering process. However,we do not adopt this approach since we prefer to keep simple normalizedscores which can more easily be interpreted and linearly combined (aggre-gated). Besides, we do not consider occurrences (and co-cooccurrences) atthe document level (e.g., dashboard) but rather at the chart/table level,which represents more fine-grained units of sense. This point will be furtherdiscussed in the next section.
Domain/model level. Similar to what we did with explicit preferences,we now define implicit preferences at the model level. First, it should benoted that the formula above is computed for each entity inside a givenmodel, noted M . In particular, the term maxe′ |occu(e
′)| refers to the max-imum number of occurrences among all entities of M . In the following twoequations, we extend the definitions of implicit and then general preferencesat the model level:

3. USERS’ PREFERENCES AND SIMILARITY 97
prefu,impl(M) =1
|M |
∑
e∈M
prefu,impl(e)
prefu(M) = γ · prefu,impl(M) + δ · prefu,expl(M)
3.2 Users similarity
We previously defined numerical preferences which take into account explicitfeedback from the user as well as implicit indicators derived from usageanalysis. Based on this, we now introduce users’ similarity in terms of BI
data consumption.
In Chapter II, Section 2.2.2, we presented various definitions of sim-ilarity measures between users for recommender systems. In particular,the most commonly used with collaborative filtering systems is the Pear-son correlation. Usually, this metric is used with a matrix of ratingsR = User × Item. To minimize cold-start issues and increase the cover-age of our measure, we use the matrix of numeric preferences (Pi,j), suchthat Pi,j = prefui
(ej). Given the set of users U = {u1, . . . , um} and the setof entities E = {e1, . . . , en}:
(Pi,j) =
prefu1(e1) prefu1
(e2) · · · prefu1(en)
prefu2(e1) prefu2
(e2) · · · prefu2(en)
......
. . ....
prefum(e1) prefum
(e2) · · · prefum(en)
Let us consider two users u and u′ and let Eu,u′ denote the set of entitiesaccessible to both u and u′. We define the similarity measure between thesetwo users, sim(u, u′), using the Pearson correlation as follows:
sim(u, u′) =
∑
e∈Eu,u′
(prefu(e)− prefu)(prefu′(e)− prefu′)
√
∑
e∈Eu,u′
(prefu(e)− prefu)2
∑
e∈Eu,u′
(prefu′(e)− prefu′)2
(V.2)
Table V.1 illustrates a sample of 5 users with their (randomly generated)preferences regarding a partial set of the measures and dimensions. Based onthese preferences, Figure V.4 represents the computation of users similaritymatrices using the Pearson correlation and the cosine similarity.
The Pearson correlation takes values in [−1; 1] and thus brings a senseof polarity. Positive values indicate users that tend to rate the same itemsin the same way, relative to their average rating. Conversely, negative val-ues show users that often react in opposite directions. For instance, the
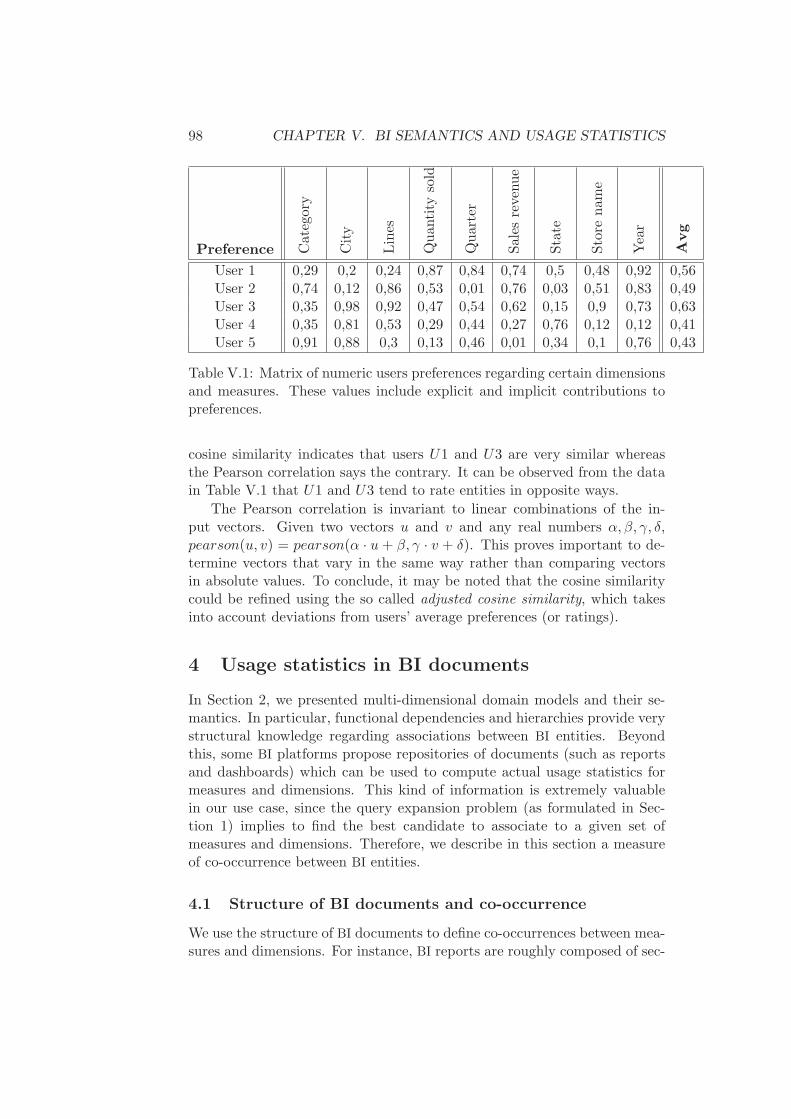
98 CHAPTER V. BI SEMANTICS AND USAGE STATISTICS
Preference Category
City
Lines
Quantity
sold
Quarter
Sales
revenue
State
Store
name
Year
Avg
User 1 0,29 0,2 0,24 0,87 0,84 0,74 0,5 0,48 0,92 0,56User 2 0,74 0,12 0,86 0,53 0,01 0,76 0,03 0,51 0,83 0,49User 3 0,35 0,98 0,92 0,47 0,54 0,62 0,15 0,9 0,73 0,63User 4 0,35 0,81 0,53 0,29 0,44 0,27 0,76 0,12 0,12 0,41User 5 0,91 0,88 0,3 0,13 0,46 0,01 0,34 0,1 0,76 0,43
Table V.1: Matrix of numeric users preferences regarding certain dimensionsand measures. These values include explicit and implicit contributions topreferences.
cosine similarity indicates that users U1 and U3 are very similar whereasthe Pearson correlation says the contrary. It can be observed from the datain Table V.1 that U1 and U3 tend to rate entities in opposite ways.
The Pearson correlation is invariant to linear combinations of the in-put vectors. Given two vectors u and v and any real numbers α, β, γ, δ,pearson(u, v) = pearson(α · u + β, γ · v + δ). This proves important to de-termine vectors that vary in the same way rather than comparing vectorsin absolute values. To conclude, it may be noted that the cosine similaritycould be refined using the so called adjusted cosine similarity, which takesinto account deviations from users’ average preferences (or ratings).
4 Usage statistics in BI documents
In Section 2, we presented multi-dimensional domain models and their se-mantics. In particular, functional dependencies and hierarchies provide verystructural knowledge regarding associations between BI entities. Beyondthis, some BI platforms propose repositories of documents (such as reportsand dashboards) which can be used to compute actual usage statistics formeasures and dimensions. This kind of information is extremely valuablein our use case, since the query expansion problem (as formulated in Sec-tion 1) implies to find the best candidate to associate to a given set ofmeasures and dimensions. Therefore, we describe in this section a measureof co-occurrence between BI entities.
4.1 Structure of BI documents and co-occurrence
We use the structure of BI documents to define co-occurrences between mea-sures and dimensions. For instance, BI reports are roughly composed of sec-

4. USAGE STATISTICS IN BI DOCUMENTS 99
Figure V.4: Comparison of users similarity matrices obtained with Pear-son correlation and cosine similarity. Computation is based on users andpreferences described in Table V.1.
tions which may contain charts, tables, text areas for comments, etc. Chartsand tables define important units of sense. Measures and dimensions associ-ated in a same table/chart are likely to be strongly related and represent ananalysis of specific interest to the user, which she may have created herself.
Similarly, dashboards can be composed of different pages or views. Theseviews can also contain charts and tables. Figure V.5 illustrates an exampleof dashboard presenting three charts in a view:
1. Sales Revenue, Quantity Sold by Quarter,
2. Sales Revenue by Category and
3. Sales Revenue by City, Lines.
Reports and dashboards are examples but, more generally, any BI doc-ument with visualizations referencing measures and dimensions could beused to derive consolidated co-occurrences or usage statistics. The graphmodel introduced in Chapter III enables a homogeneous representation ofthese documents’ structure. For instance, Figure V.6 illustrates the graphrepresentation of the dashboard USA Sales View and its associated charts.A chart can be used in one or more dashboards and these relations arerepresented by the hasDashboard predicate. Besides, hasDimension andhasMeasure predicates are used to indicate BI entities a chart relates to.

100 CHAPTER V. BI SEMANTICS AND USAGE STATISTICS
Figure V.5: A sample dashboard view, USA Sales View. This view defines 3charts presenting analysis of sales revenue according to various dimensions.
4.2 Security and personal co-occurrence measure
Security is an important aspect to take into consideration since BI platformsprovide access control rules to business domain models and documents builton top of them. Consequently, different users may not have access to thesame models and at a more fine-grained level to the same measures anddimensions. Besides, repositories contain reports or dashboards generatedby and shared (or not) between different users of the system. As a result,the measure of co-occurrence that we define in this section is inherentlypersonalized.
Let us consider a user u and let occu(e) denote the set of charts and tables– in documents visible to the user u – referencing a BI entity e (measureor dimension). We define the co-occurrence of two entities ei and ej as theJaccard index of the sets occu(ei) and occu(ej). The Jaccard index is asimple but commonly used measure of the similarity between two samplesets:
coocu(ei, ej) = J(occu(ei), occu(ej)) =|occu(ei) ∩ occu(ej)|
|occu(ei) ∪ occu(ej)|(V.3)
Table V.2 presents a matrix of co-occurrences that can be computedwith measures and dimensions appearing in charts, in a collection of dash-boards. This matrix (Ci,j)(u) is symetric and defined as follows for all
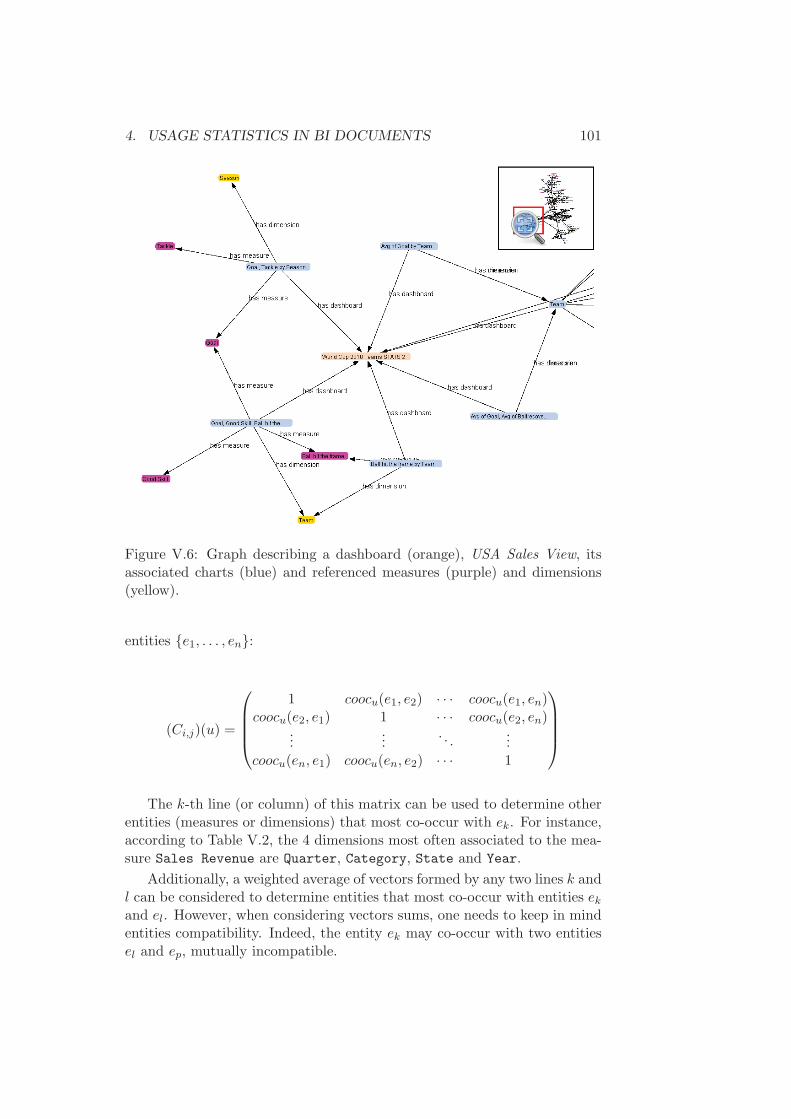
4. USAGE STATISTICS IN BI DOCUMENTS 101
Figure V.6: Graph describing a dashboard (orange), USA Sales View, itsassociated charts (blue) and referenced measures (purple) and dimensions(yellow).
entities {e1, . . . , en}:
(Ci,j)(u) =
1 coocu(e1, e2) · · · coocu(e1, en)coocu(e2, e1) 1 · · · coocu(e2, en)
......
. . ....
coocu(en, e1) coocu(en, e2) · · · 1
The k-th line (or column) of this matrix can be used to determine otherentities (measures or dimensions) that most co-occur with ek. For instance,according to Table V.2, the 4 dimensions most often associated to the mea-sure Sales Revenue are Quarter, Category, State and Year.
Additionally, a weighted average of vectors formed by any two lines k andl can be considered to determine entities that most co-occur with entities ekand el. However, when considering vectors sums, one needs to keep in mindentities compatibility. Indeed, the entity ek may co-occur with two entitiesel and ep, mutually incompatible.
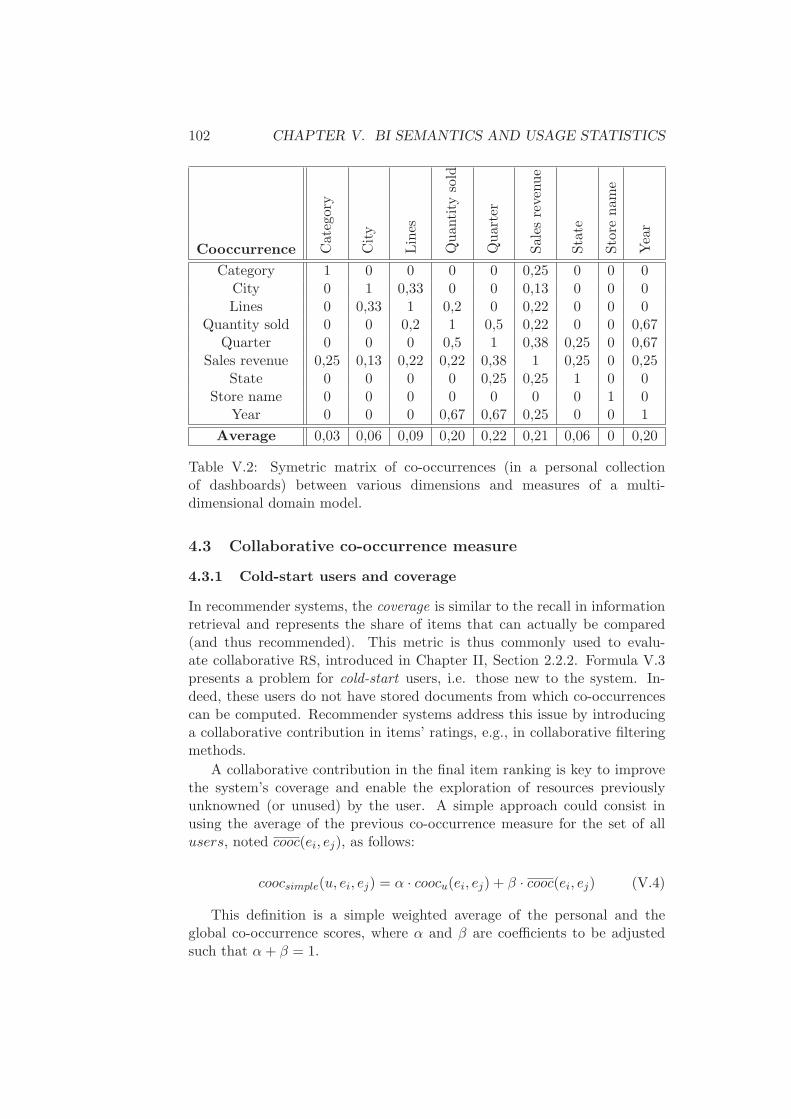
102 CHAPTER V. BI SEMANTICS AND USAGE STATISTICS
Cooccurrence Category
City
Lines
Quantity
sold
Quarter
Sales
revenue
State
Store
name
Year
Category 1 0 0 0 0 0,25 0 0 0City 0 1 0,33 0 0 0,13 0 0 0Lines 0 0,33 1 0,2 0 0,22 0 0 0
Quantity sold 0 0 0,2 1 0,5 0,22 0 0 0,67Quarter 0 0 0 0,5 1 0,38 0,25 0 0,67
Sales revenue 0,25 0,13 0,22 0,22 0,38 1 0,25 0 0,25State 0 0 0 0 0,25 0,25 1 0 0
Store name 0 0 0 0 0 0 0 1 0Year 0 0 0 0,67 0,67 0,25 0 0 1
Average 0,03 0,06 0,09 0,20 0,22 0,21 0,06 0 0,20
Table V.2: Symetric matrix of co-occurrences (in a personal collectionof dashboards) between various dimensions and measures of a multi-dimensional domain model.
4.3 Collaborative co-occurrence measure
4.3.1 Cold-start users and coverage
In recommender systems, the coverage is similar to the recall in informationretrieval and represents the share of items that can actually be compared(and thus recommended). This metric is thus commonly used to evalu-ate collaborative RS, introduced in Chapter II, Section 2.2.2. Formula V.3presents a problem for cold-start users, i.e. those new to the system. In-deed, these users do not have stored documents from which co-occurrencescan be computed. Recommender systems address this issue by introducinga collaborative contribution in items’ ratings, e.g., in collaborative filteringmethods.
A collaborative contribution in the final item ranking is key to improvethe system’s coverage and enable the exploration of resources previouslyunknowned (or unused) by the user. A simple approach could consist inusing the average of the previous co-occurrence measure for the set of allusers, noted cooc(ei, ej), as follows:
coocsimple(u, ei, ej) = α · coocu(ei, ej) + β · cooc(ei, ej) (V.4)
This definition is a simple weighted average of the personal and theglobal co-occurrence scores, where α and β are coefficients to be adjustedsuch that α+ β = 1.
4. USAGE STATISTICS IN BI DOCUMENTS 103
4.3.2 Using the social/trust network
Formula V.4 broadens the collaborative contribution to “the whole world”.In this case, all users have an equal contribution, even though some maynot relate at all to the current user. Jamali et al. suggest that this couldbe significantly improved by considering the user’s social network and, e.g.,favoring users close to her [JE09]. The benefits of narrowing the collab-orative contribution down to close users reside at two levels: (a) resultsare more precisely personalized (b) potential pre-computation can be mademore resource-efficient (memory, CPU, etc.).
Let us note SN(u) the set of users in u’s social network, which canbe filtered, e.g., to keep only users up to a given maximum distance. Wepropose the following refined co-occurrence measure:
cooc(u, ei, ej) = α · coocu(ei, ej)
+β
|SN(u)|·
∑
u′∈SN(u)
1
d(u, u′)coocu′(ei, ej) (V.5)
This measure cooc(u, ei, ej) is only defined for entities ei and ej exposedto the user u by access control rules. However, it may be extended forconvenience to all entities, e.g., by considering a default value of 0. In thisco-occurrence measure, the contribution of each user u′ is weighted by theinverse of the distance d(u, u′).
The knowledge of relations between users can be obtained from a varietyof sources, including popular social networks on the Web. However, this doesnot necessarily match corporate requirements since users of the system areactual employees of a same company. Therefore, we consider the use ofenterprise directories (LDAP, Active Directory, etc.) to extract relationsbetween users. For instance, such directories usually contain informationregarding the company’s hierarchical organization, that is relations of thetype “A reports to B”. If the social network and its actual constructionare not the main focus of our work, it was discussed along with the socialdimension of our situation model, in Chapter III, Section 3.
4.3.3 Similarity-based and hybrid approaches
We now investigate the usage of the users’ similarity measure defined inthe previous section to propose an alternative collaborative approach. InFormula V.5, the collaborative contribution is weighted function of the dis-tance between users. However, it could be argued that close users (in termsof their distance in the social graph) are not necessarily those with the mostcommon habits when it comes to data consumption. Two sales managers indifferent countries under different hierarchical chains may be distant of, say,5 degrees. Even if their interests were similar, the inverse distance factor
104 CHAPTER V. BI SEMANTICS AND USAGE STATISTICS
would considerably reduce the importance of the second user in the finalscoring function of the first.
In line with traditional techniques used in user-based collaborative RS
(described in Chapter II, Section 2.2.2), we thus propose the following al-ternative co-occurrence measure:
cooc(u, ei, ej) = α · coocu(ei, ej)
+β
|U ′|·∑
u′∈U ′
sim(u, u′) · coocu′(ei, ej) (V.6)
In Formula V.6, U ′ denotes the set of users most similar to the currentuser u, determined using the similarity function as follows: U ′ = {u′ ∈U, sim(u, u′) ≥ K}, where K is a constant threshold. This step filtering thenearest users may be used to reduce the computation cost and improve itsprecision. However, in a first approximation it is possible to simply considerU ′ = U . To conclude, it would also be possible to consider hybrid approaches– using a similarity function combining users’ distance and their preferences– but we did not investigate this aspect further due to lack of time.
5 Personalized query expansion
So far we presented in this chapter particular semantics of multi-dimensionalmodels and examples of usage statistics that can be derived from existingrepositories of BI documents.
In this section, we describe our approach to design a personalized queryexpansion component leveraging models semantics, co-occurrences and userpreferences previously defined. Besides, we discuss the architecture of oursystem using the GR and situation management frameworks described inChapters III and IV.
5.1 Query expansion
The aim of our system is to assist the user in the query design phase by of-fering suggestions of measures and dimensions she could use to explore data.When she selects a measure or a dimension, it is added to the query beingdesigned and suggestions are refreshed to form new consistently augmentedqueries. For instance, if the user selects the measure Sales revenue, thesystem proposes to add dimensions to form queries like Sales revenue byYear, Sales revenue by Category, etc.
5.1.1 Ranking candidate entities
To complete a given a query q = {e1, . . . , en} with an additional measureor dimension, we need to find candidate entities and rank them. In a first

5. PERSONALIZED QUERY EXPANSION 105
Algorithm 1 Query expansion: expands an initial query q for a given useru with additional parameters params.
1: QueryExpansion(q, u, params)2: candidates← getCandidates(q, params)3: rankedQueries← initialize list{Rank each candidate entity}
4: for j = 1 to |candidates| do5: q′ ← q ∪ {candidates[j]}6: rank ← ranku(candidates[j], q)
{Append generated query}7: rankedQueries.add(q′)8: end for9: return sort(rankedQueries)
approximation, candidate entities, cj , j = 1..p, are those defined in the samedomain and compatible with every ei, determined using functional depen-dencies (see Section 2.2).
We then use the following personalized function to rank each candidatecj , using one of the co-occurrence measures defined in Section 4 and notedcooc:
ranku(cj , q) =
{
prefu(cj) if q = ∅
prefu(cj) ·1n
∑ni=1 cooc(u, cj , ei) otherwise
(V.7)
To conclude with the notation of the query expansion problem introducedin Section 1, we define our component QE as:
QE : (u, q, params) 7→ {(q1, ranku(c1, q)), . . . , (qp, ranku(cp, q))}
The complete query expansion process is summarized in Algorithm 1.This algorithm is pretty straightforward and mainly meant to present moreformally the steps required towards final suggestions. In particular, thewhole method begins line 2 with the selection of candidate entities. Thisselection depends on the inital query q to deal with compatibility issues andalso additional parameters.
5.1.2 Candidates filtering and parameters
Beyond ranking, suggestions of the query expansion component can be fine-tuned using various parameters. In particular, the following parameters maybe used to filter the set of entities which are candidates to expand the initialquery:
106 CHAPTER V. BI SEMANTICS AND USAGE STATISTICS
• The maximum number of results can be configured to limit the num-ber of variant queries that will be generated as recommendations orsuggestions. Assuming this number is set to 3, the output of the ex-pansion component will be the list of the 3 best-ranked queries.
• The type of suggested entities can be limited to measures and/or di-mensions. This aspect is interesting to drastically filter the set of en-tities in some cases. For instance, it seems reasonable to assume thatonce the user has selected a measure, she is going to expect dimensionsto be suggested rather than other measures.
• The domain can be restricted to a given list of dimensional models.The initial selection or configuration of this parameter should not beimposed on the user since it requires one more manual step beforesuggestions can take place. However, it is possible to determine itautomatically when the initial query q is not empty, using the factthat queries can be executed in the scope of one given model.
• Suggested dimensions can be grouped by and limited to certain hier-archies. This may be used to reduce the number of suggestions andencourage the user explore varied axis of analysis.
5.2 Architecture overview
In Section 1, Figure V.1 gave an overview of the architecture of our queryexpansion component. In this section, we present this architecture morespecifically with the integration of the GR and situation frameworks pre-sented in Chapters III and IV.
Figure V.7 illustrates this framework-based implementation of the con-cepts described in this chapter. Providers are important components in thisframework which allow the creation of graphs with user-related data. Forinstance, the social provider was presented with the definition of the socialdimension in our situation model, in Chapter III, Section 3.3. Let us nowdescribe other providers involved.
5.2.1 Multi-dimensional models provider
First and foremost, the multi-dimensional models provider is responsible forthe creation of graphs which describe models available to the current user.Entities represented in these graphs are measures and dimensions, linked byrelations (or statements) of two types: hasParent and determines.
Hierarchies and functional dependencies represent structural relationswhich semantics were introduced in Section 2. Among other points, wediscussed the use of two reasoning techniques to augment existing models ina semi-automatic approach and help complete these graphs. At this point,
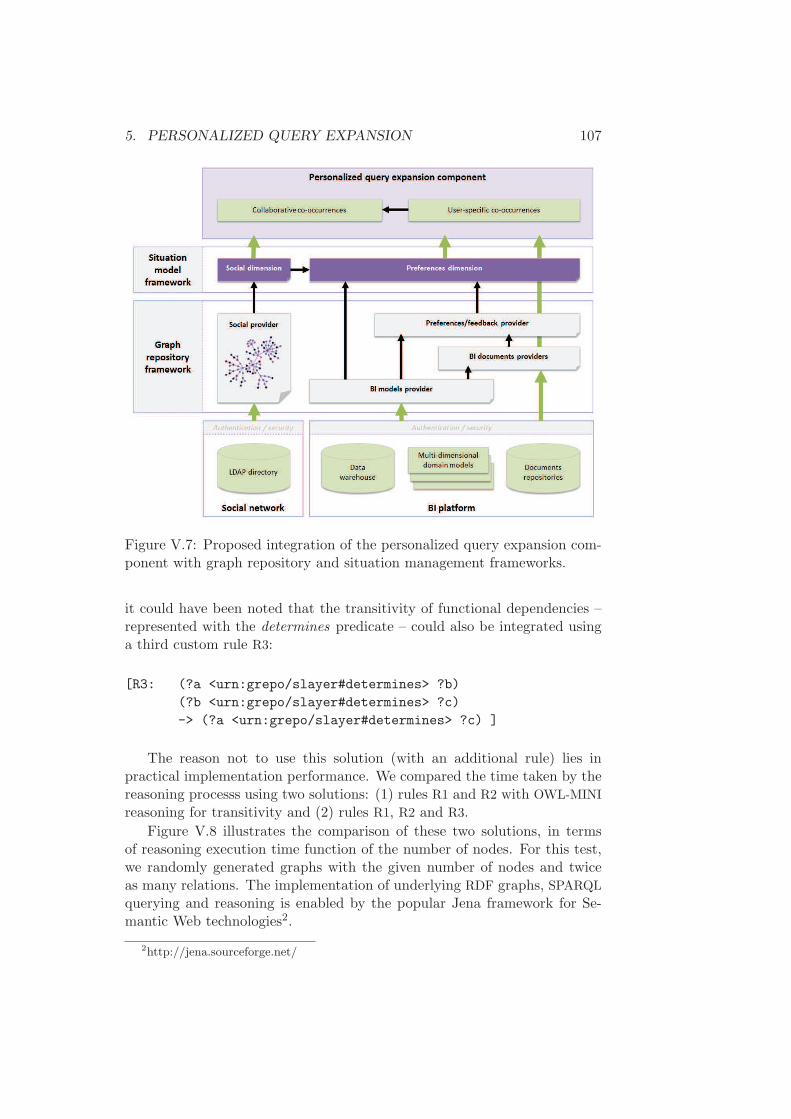
5. PERSONALIZED QUERY EXPANSION 107
Figure V.7: Proposed integration of the personalized query expansion com-ponent with graph repository and situation management frameworks.
it could have been noted that the transitivity of functional dependencies –represented with the determines predicate – could also be integrated usinga third custom rule R3:
[R3: (?a <urn:grepo/slayer#determines> ?b)
(?b <urn:grepo/slayer#determines> ?c)
-> (?a <urn:grepo/slayer#determines> ?c) ]
The reason not to use this solution (with an additional rule) lies inpractical implementation performance. We compared the time taken by thereasoning processs using two solutions: (1) rules R1 and R2 with OWL-MINI
reasoning for transitivity and (2) rules R1, R2 and R3.
Figure V.8 illustrates the comparison of these two solutions, in termsof reasoning execution time function of the number of nodes. For this test,we randomly generated graphs with the given number of nodes and twiceas many relations. The implementation of underlying RDF graphs, SPARQL
querying and reasoning is enabled by the popular Jena framework for Se-mantic Web technologies2.
2http://jena.sourceforge.net/

108 CHAPTER V. BI SEMANTICS AND USAGE STATISTICS
Figure V.8: Comparison of two proposed reasoning solutions to determinefull dependencies in graphs populated from multi-dimensional models.
To conclude we evaluated the cost of reasoning using the first solution(which happens to be the most efficient) when the number of dimensions andmeasures grows. The result of this evaluation is presented in Figure V.9.In particular, we observe that the reasoning time augments almost linearly(below the second) for up to 13000 entities. This cost is easily acceptableand covers most real-life scenarios with large models.
5.2.2 BI documents provider
Next comes the BI documents provider. This component connects to existingrepositories of the BI platform in order to describe dashboards, reports andtheir content in graphs. Documents may reference table or charts, whichthemselves reference measures and dimensions as discussed in Section 4.1.Figure V.6 illustrates the graph representation of a dashboard with refer-enced charts, measures and dimensions.
One thing we did not discuss previously with the provider for multi-dimensional models is the security aspect. Indeed, the BI platform requiresuser credentials to allow authentication. For this purpose, the graph reposi-tory framework allows users to enter required credentials, should they decideto enable the corresponding provider. In this context, the BI documentsprovider leverages this feature and exploits the user’s credentials to log in a(remote) BI platform. Credentials – and more generally the security modelapplied to components of the GR – have been described more thoroughly inChapter IV, Section 3.1.
To conclude, we leveraged in our experimentations the connection to

6. SUMMARY AND DISCUSSION 109
Figure V.9: Evaluation of the reasoning time function of the size of themulti-dimensional model (number of nodes, measures or dimensions).
Exploration Views, a dashboarding solution which used to be a prototypeand is now included with SAP Business Objects Explorer. A demonstrationversion of this solution is available online3.
5.2.3 Preferences provider
The last provider that needs to be presented in the architecture diagram ofFigure V.1 is the preferences provider. This provider manages users’ prefer-ences which come with explicit and implicit contributions (see Section 3.1).
At least, this provider includes dependencies on the multi-dimensionalmodels provider, to enumerate available measures and dimensions. On topof this, a dependency on the BI documents provider allows implicit prefer-ences to be computed using occurrences of these measures and dimensionsin documents.
Finally, the user’s feedback (or explicit preferences) is maintained thanksto a graph, created and persisted using the appropriate graph factory (seeChapter III, Section 2.2.4).
6 Summary and discussion
In Section 2, we presented multi-dimensional domain models defined in datawarehouses to enable the exploration of large amounts of data thanks to ded-icated BI analysis tools. These models introduce in particular measures and
3http://exploration-views.ondemand.com
110 CHAPTER V. BI SEMANTICS AND USAGE STATISTICS
dimensions which inter-relations – hierarchies and functional dependencies –carry specific semantics. These dependencies are key in a query generationprocess and help for instance to determine objects compatibility. Besides,we described the use of BI documents repositories to derive valuable us-age statistics for entities of these models. This allowed us to define severalpersonalization-related indicators like users’ preferences and users’ similar-ity (in Section 3) and co-occurrences between entities (in Section 4). Severalvariants of the co-occurrence measure were proposed, from the most simpleand personal to more elaborate ones, introducing for instance a collaborativecontribution. Eventually, Section 5 discussed the utilization of these con-cepts, applied for the design of a personalized query expansion component.Such a component proves useful in various BI experimentation scenarios, aswill be discussed in Chapter VI.
Repositories of BI documents are at the root of a certain number of indi-cators presented in this chapter. In our approach, we leverage the structureof these documents to define occurrences (and co-occurrences) in the scopeof a table or a chart. We illustrated the exploitation of repositories of BI
documents as one source of usage statistics. Besides, other sources of usagedata could clearly be used, the most common example being logs of users’sessions and queries. More generally, personalization and recommendationsfor multi-dimensional queries have been discussed in the review of relatedwork, in Chapter II, Section 4.
Golfarelli et al. described MyOLAP to express BI-specific preferences, ina qualitative approach. The authors define these preferences as soft con-straints used to improve the scoring of most similar data. Interestingly,preferences can be expressed on both numerical and categorical domains,that is on measures and dimensions. For instance, it is possible with My-
OLAP to define preferred aggregation levels (in a hierarchy of dimensions)and intervals (for values of a measure). These preferences are defined asMDX operators which enable the expression of soft constraints in potentiallycomplex queries. The reverse side of the coin is the increased complexity ofthe query design process which assumes a certain know-how from end-users,in particular the ability to write MDX queries.
To sum up, we reckon that our quantitative approach presented hereoffers an interesting trade-off between the generality of the model and theexpressivity of recommended queries. Simple numerical indicators allow usto easily integrate social contributions and rely on efficient and scalablemethods, emerging from traditional recommendation techniques. On theother hand, our approach does not leverage the full expressivity of querylanguages, be it SQL or MDX. This introduces limitations to the complex-ity of queries that can be recommended by our system but presents thesignificant advantage of being source agnostic.
7. CONCLUSION 111
7 Conclusion
In conclusion, we presented in this chapter a personalized query expansionsystem that leverages (a) semantics of multi-dimensional domain models, (b)usage statistics derived from (co-)occurrences of measures and dimensionsin repositories of BI documents and (c) users’ preferences and similarity.This system and its experimentation with a prototype of interactive querydesigner will be presented in further details in Chapter VI, Section 3.
This chapter introduced a certain number of concepts for personalizationand recommendations in a BI context. It would be interesting and particu-larly valuable to concentrate future work on the evaluation of the proposedquery expanson system. In particular, an extensive study and comparisonof the measures presented in Sections 3 and 4 would help determine andrefine the most appropriate ones. To do so, the first step would consistin the acquisition (or generation) of an appropriate dataset. This datasetshould at least include the definition of multiple users and a sufficient num-ber of documents (reports or dashboards), to ensure that occurrences andco-occurrences defined are meaningful. Ideally, these users would also bedescribed in a social graph so the collaborative contribution can be evalu-ated based on distances in the graph. This would for instance enable thecomparison of the two co-occurrence measures propsoed in Formulas V.5and V.6.
Importantly, our approach bases on statistical indicators derived fromoccurrences of entities in BI documents. On one hand, such indicators provevaluable and offer a rather generic model – in particular because they aresource agnostic – but on the other hand, this limits the expressivity ofqueries that can actually be personalized or recommended. We illustratedthe use of these concepts with a query expansion component. However, it isworth noting that users’ preferences and their similarity (in terms of BI dataconsumption) could be employed in diversified scenarios. Therefore, as partof future work, we would like to investigate other promising applicationslike, for instance, a question answering system allowing the expression ofbusiness queries in natural language [KBA11]. This system could exploitusers’ preferences to help with the entity disambiguation process or queryreformulation. Besides, the users’ similarity measure would be valuable tointroduce a social scoring function for answers brought by the system.
Finally, we reckon that recommendations in the context of data ware-houses and BI platforms could benefit much further from techniques devel-oped in the area of recommender systems. However, taking into accountthe specific semantics of multi-dimensional models is key to provide relevantstructured analytics.

112 CHAPTER V. BI SEMANTICS AND USAGE STATISTICS

Chapter VI
Experimentations with BI
Recommendations and
Personalization
Contents
1 Introduction . . . . . . . . . . . . . . . . . . . . . 113
1.1 Exploratory recommendation scenarios . . . . . . . 114
1.2 Search-related recommendations and personaliza-tion . . . . . . . . . . . . . . . . . . . . . . . . . . 115
2 Text-to-query . . . . . . . . . . . . . . . . . . . . . 115
2.1 Dictionary generation for entity extraction . . . . . 116
2.2 Query generation from a text . . . . . . . . . . . . 118
2.3 Experimental results . . . . . . . . . . . . . . . . . 123
3 Personalization in search . . . . . . . . . . . . . . 127
3.1 An open architecture for search . . . . . . . . . . . 127
3.2 BI queries and charts search . . . . . . . . . . . . . 129
3.3 Plugins personalization . . . . . . . . . . . . . . . 132
4 Summary and discussion . . . . . . . . . . . . . . 135
5 Conclusion . . . . . . . . . . . . . . . . . . . . . . 135
1 Introduction
The work that we presented in Chapters III to V aims at defining a frame-work – or set of re-usable and extensible components – to help build per-sonalized and context-sensitive applications.
We introduced our graph-based situation model in Chapter III, in par-ticular the underlying graph repository (GR). The GR serves as a container
113

114 CHAPTER VI. EXPERIMENTATION: BI RECOMMENDATIONS
for personal background knowledge and a vehicle for context-related infor-mation. Besides, dimensions are built on top of the situation, representedas a graph centered on the current user. Dimensions help expose categorizedand aggregated information with additional convenience methods. For in-stance, social and geography dimensions can be used to retrieve respectivelythe user’s social network and her current location.
The situation management framework presented in Chapter IV describedactive components for continuous monitoring and dynamic adaptation ofsituation graphs. In short, business events can be sent to the situationplatform (or raised internally), which queues them to perform asynchronousprocessing. In response to these events, activation rules are used tro triggerspecific operators, responsible for graphs adaptation.
Then, Chapter V presented semantics of multi-dimensional models com-monly used in data warehouses and BI tools. Besides, we defined usagemetrics or statistics that can be derived from repositories of documents likedashboards and reports. These indicators represent (a) occurrences and co-occurrences of measures and dimensions, (b) users’ preferences according tothese entities and (c) users’ similarity.
To conclude, the aim of this chapter is to show case and evaluate ourapproach using different BI-related experimentation scenarios. These sce-narios were implemented as proof-of-concepts to evaluate the applicabilityof our GR and situation management frameworks, and its effectiveness forpersonalization and recommendations. We distinguish two types of experi-mentations, exploratory and search-related scenarios.
1.1 Exploratory recommendation scenarios
The first kind of scenario we consider is said exploratory in that it is meantto suggest to the user resources which are related to what she is currentlyreading, writing, etc. The aim is to enable a certain form of exploration ofresources available to the user and likely of interest.
In line with this approach, we will present Text-To-Query (T2Q), a sys-tem suggesting structured analytics that are dynamically generated to illus-trate a textual content. For instance, the user might get charts and tablesbuilt from data in her corporate warehouse to illustrate an email she isreading or enrich a presentation she is working on.
In the T2Q example, the entry point for the user to get suggestionsof analytics is a text (an unstructured document). On the other hand,assuming a user is currently interested in a given analysis, we will presenta method leveraging our framework to suggest related visualizations amongthose already defined in a collection (or repository) of BI documents likedashboards and reports.
To conclude with exploratory recommendation scenarios, we will illus-trate our approach with simple examples of recommendations exploiting the
2. TEXT-TO-QUERY 115
user’s location. This information is obtained through a mobile application.
1.2 Search-related recommendations and personalization
We described exploratory recommendation scenarios which contribute tobroaden the user’s vision on a given topic and help her discover resources.We now introduce search-related scenarios meant to assist the user to for-mulate her queries and to respond to them.
We will present a case study around an ongoing federated search projectand describe the use of our GR and situation management frameworks toenable personalization and recommendations at different levels. In particu-lar, techniques developed in Chapter V led to the definition of personalizedquery expansion component, which we use to enable auto-completion in aninteractive query designer. Besides, federated search involves the aggrega-tion of multiple sources of information which may introduce confusion forend-users. We present how our framework contributes to the personalizationof search results thanks to simple user preferences.
The rest of this chapter is organized as follows: Section 2 presents theT2Q system and a set of clients in the form of add-ins for office applications.Finally, Section 3 presents personalization in the federated search projectmentioned above.
2 Text-to-query
The description of the knowledge worker’s environment by Schwarz high-lights the fact that most of the information generated within companies isunstructured data [Sch05]. The amount of knowledge available in a companyin unstructured form has been estimated to 80-85% by business analysts.Moreover, the Internet has become a fundamental source of information forbusiness users, mostly unstructured as well.
An important share of unstructured data is not going to change insidecompanies and on the Web, because it is a natural communication means.Therefore, it can often be helpful to bring relevant structured data to auser, based on unstructured content she’s manipulating, like emails, reports,presentations, web pages, etc. Next-generation Business Intelligence (BI)platforms should allow a smooth transition in both directions: unstructured- structured and structured - unstructured data. Given that most users arenot database or BI experts, we focus on bringing structured data based onan unstructured users’ input. This can serve to broaden the user’s view ona given topic, or provide more insight on mentioned concepts.
The T2Q system we present in this section is a step to tackle this chal-lenge in the context of large data warehouses. Our aim is to provide userswith relevant aggregated content from a data warehouse based on unstruc-tured textual content. In particular we investigate how to generate multi-
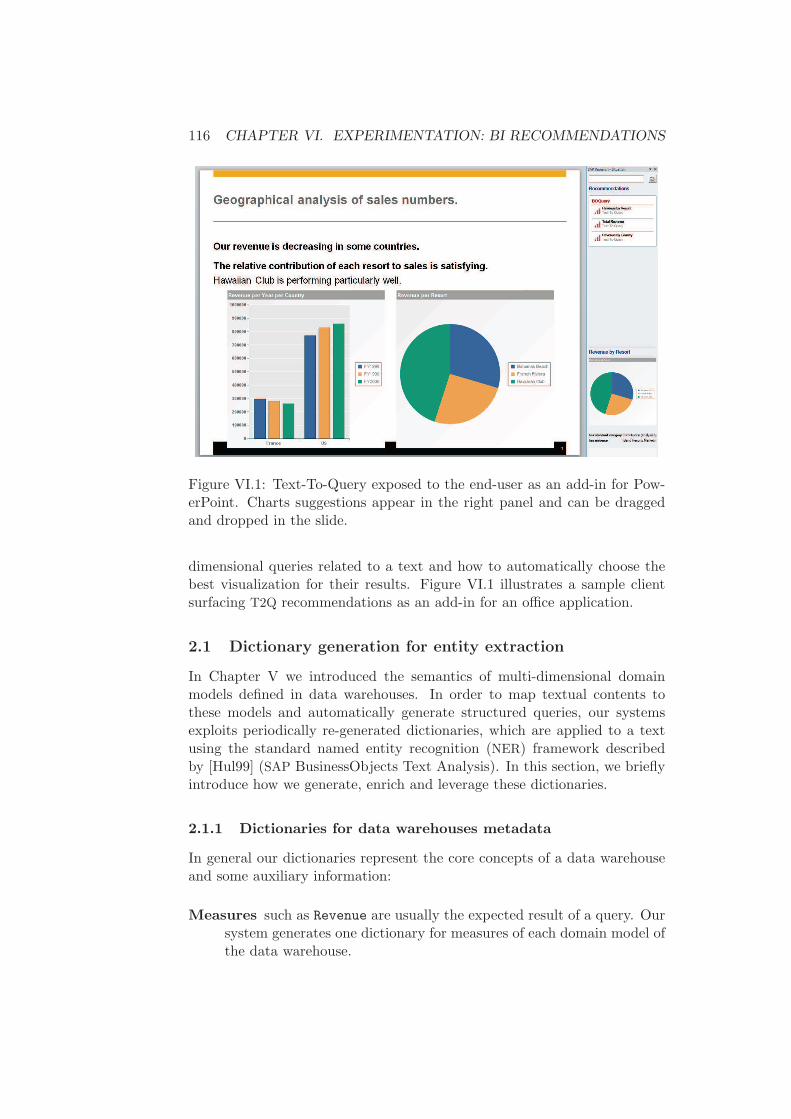
116 CHAPTER VI. EXPERIMENTATION: BI RECOMMENDATIONS
Figure VI.1: Text-To-Query exposed to the end-user as an add-in for Pow-erPoint. Charts suggestions appear in the right panel and can be draggedand dropped in the slide.
dimensional queries related to a text and how to automatically choose thebest visualization for their results. Figure VI.1 illustrates a sample clientsurfacing T2Q recommendations as an add-in for an office application.
2.1 Dictionary generation for entity extraction
In Chapter V we introduced the semantics of multi-dimensional domainmodels defined in data warehouses. In order to map textual contents tothese models and automatically generate structured queries, our systemsexploits periodically re-generated dictionaries, which are applied to a textusing the standard named entity recognition (NER) framework describedby [Hul99] (SAP BusinessObjects Text Analysis). In this section, we brieflyintroduce how we generate, enrich and leverage these dictionaries.
2.1.1 Dictionaries for data warehouses metadata
In general our dictionaries represent the core concepts of a data warehouseand some auxiliary information:
Measures such as Revenue are usually the expected result of a query. Oursystem generates one dictionary for measures of each domain model ofthe data warehouse.

2. TEXT-TO-QUERY 117
Dimensions such as Country are the core primitives that are used in tech-nical queries. They specify the level of granularity that measures canbe aggregated on (e.g., Revenue per Country). Again, we generateone dictionary with dimensions for each domain model.
Dimension values are used to filter the output of a query (e.g., Revenuein Germany). For each dimension, our system maintains a separatedictionary with its values (or instances). Therefore, when analyzingtextual contents, we can also infer from the occurrence of a value thecorresponding dimension.
Standard analysis categories define fixed terms that are used frequentlyin certain contexts and provide hints on the intention of the query. Inparticular, this dictionary contains weak time and geographic mentionssuch as “here”, “there”, “before”, “year”. Standard analysis categoriesand their usage are presented in detail in Section 2.2.
2.1.2 Relaxing dictionaries for entity extraction
Previous work has stressed the fact that entities in a text are very often refer-enced in a form that is not exactly the one present in the dictionary [ACK09].This is a well known issue for entity extraction but also an important con-cern in the duplicate detection and record matching research areas, surveyedby [EIV07]. For this reason, [CGX09] presents a developed method to facil-itate approximate entity matching by automatically generating variants fora reference entity from a collection of documents.
The issue of syntactical heterogeneity is an important challenge but notthe main focus of our work. However, we facilitate two techniques for relax-ing the dictionaries. First, our system leverages synonyms and orthographicvariants, which are maintained in resources like WordNet and EuroWord-Net. Therefore, we can identify dimension values such as United States ofAmerica (in a Country dimension) by terms like “US”. Second, we applystemming on the dictionary tokens, such that we can identify the dimensionCountry in a text like “the revenue in countries that...”. Both, synonymsand stems are compiled into dictionaries.
We exploit metadata generated in the pre-processing phase – data ware-house dictionaries and trigger words associated to standard analysis cate-gories – to analyze incoming texts, and return potential technical queries.Therefore, the text is passed to the NER framework which applies all neces-sary pre-processing such as stemming and dictionary matching. As result,we derive per sentence a set of identified measures, dimensions, dimensionvalues and trigger words for standard analysis categories.
We introduced the use of NER techniques in conjunction with data andmetadata from warehouses to recognize business entities mentioned in text
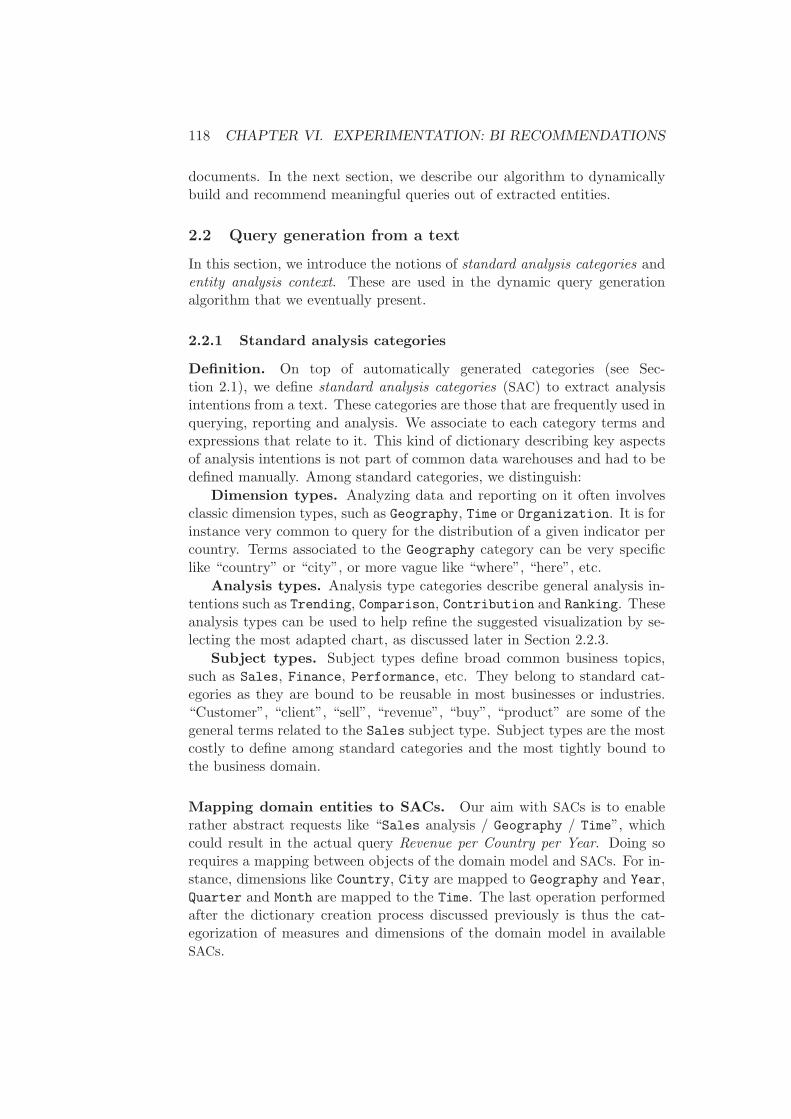
118 CHAPTER VI. EXPERIMENTATION: BI RECOMMENDATIONS
documents. In the next section, we describe our algorithm to dynamicallybuild and recommend meaningful queries out of extracted entities.
2.2 Query generation from a text
In this section, we introduce the notions of standard analysis categories andentity analysis context. These are used in the dynamic query generationalgorithm that we eventually present.
2.2.1 Standard analysis categories
Definition. On top of automatically generated categories (see Sec-tion 2.1), we define standard analysis categories (SAC) to extract analysisintentions from a text. These categories are those that are frequently used inquerying, reporting and analysis. We associate to each category terms andexpressions that relate to it. This kind of dictionary describing key aspectsof analysis intentions is not part of common data warehouses and had to bedefined manually. Among standard categories, we distinguish:
Dimension types. Analyzing data and reporting on it often involvesclassic dimension types, such as Geography, Time or Organization. It is forinstance very common to query for the distribution of a given indicator percountry. Terms associated to the Geography category can be very specificlike “country” or “city”, or more vague like “where”, “here”, etc.
Analysis types. Analysis type categories describe general analysis in-tentions such as Trending, Comparison, Contribution and Ranking. Theseanalysis types can be used to help refine the suggested visualization by se-lecting the most adapted chart, as discussed later in Section 2.2.3.
Subject types. Subject types define broad common business topics,such as Sales, Finance, Performance, etc. They belong to standard cat-egories as they are bound to be reusable in most businesses or industries.“Customer”, “client”, “sell”, “revenue”, “buy”, “product” are some of thegeneral terms related to the Sales subject type. Subject types are the mostcostly to define among standard categories and the most tightly bound tothe business domain.
Mapping domain entities to SACs. Our aim with SACs is to enablerather abstract requests like “Sales analysis / Geography / Time”, whichcould result in the actual query Revenue per Country per Year. Doing sorequires a mapping between objects of the domain model and SACs. For in-stance, dimensions like Country, City are mapped to Geography and Year,Quarter and Month are mapped to the Time. The last operation performedafter the dictionary creation process discussed previously is thus the cat-egorization of measures and dimensions of the domain model in availableSACs.

2. TEXT-TO-QUERY 119
Figure VI.2: Mapping of some measures (purple) and dimensions (yellow)to Standard Analysis Categories (blue).
We use the dictionary of SACs to extract entities in the names of mea-sures and dimensions (using previously discussed text normalization tech-niques). As an example, dimensions like Reservation year, Quarter orEvent month are associated to the standard dimension type Time. Objectsare associated to all SACs that could be extracted and, as a result, the associ-ation domain object – SAC is a one-to-many relation. Figure VI.2 illustratesthe results of this mapping applied to some dimensions and measures of thewarehouse we used for test and demonstration purposes.
The method presented here is extremely simple and poses two main is-sues. First, the dictionary of SACs is key but enriching it to cover newstandard subjects and dimension types requires some domain knowledge.The second difficulty regarding this process is that it is error-prone. In par-ticular, polysemous words may result in incorrect associations [BHH+10].To deal with such erroneous associations, administrators have the ability tomanually validate results using, e.g., Protege1 since graphs of associationsare serialized as a simple RDF file. Even though this appears as an ex-tremely simple method, we reckon this mapping does not necessarily inducean excessive knowledge-design phase since we operate in the context of thecontrolled (thus limited) vocabulary defined in models of a data warehouse.
1http://protege.stanford.edu/

120 CHAPTER VI. EXPERIMENTATION: BI RECOMMENDATIONS
Figure VI.3: Graph view of entities extracted in document1 (left part),which corresponds to the presentation slide illustrated in VI.1.
2.2.2 Entities analysis and query completion
In previous sections, we presented our approach to create dictionaries frommulti-dimensional models. Then, we introduced SACs which are artifactsused to help infer analysis intentions thanks to a pre-defined dictionary. Inthis section, we describe the actual query generation process which startsby performing entity extraction on the input text.
The entity analysis context. In Section 2.1 we indicated that the outputof the NER phase is a collection of entities which can be grouped by sentence(and by paragraph). Let E = NER(text) = {e1, . . . , ep} denote the set ofentities – domain models’ entities as well as SACs – extracted in the inputtext, containing n sentences. In the graph of Figure VI.3, extracted entitiesare represented by edges starting from the node document1 (on the lefthand side). This document stands for the presentation page depicted inFigure VI.1.
We define the entity analysis context (EAC) at document and sentencelevels. At the document level, we simply have EAC(text) = E, that is theset of all entities. Then, at the sentence level, we consider the followingsubsets:
• entities explicitly mentioned in sentence j and
• entities mentioned in previous sentences, filtered and flagged as propa-gated by the propagate method which we discuss later in this section.
Eventually, with Ej = {e ∈ E, sentence(e) = j} ⊆ E, we define succes-sive EACs as follows:
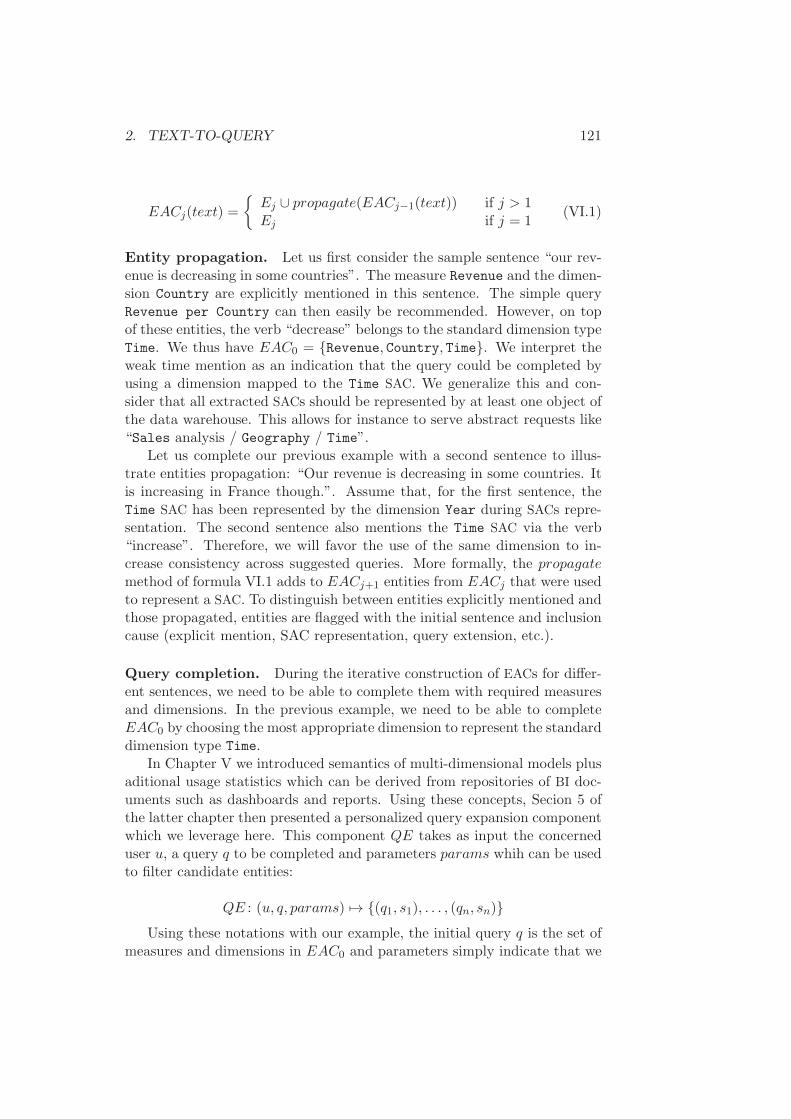
2. TEXT-TO-QUERY 121
EACj(text) =
{
Ej ∪ propagate(EACj−1(text)) if j > 1Ej if j = 1
(VI.1)
Entity propagation. Let us first consider the sample sentence “our rev-enue is decreasing in some countries”. The measure Revenue and the dimen-sion Country are explicitly mentioned in this sentence. The simple queryRevenue per Country can then easily be recommended. However, on topof these entities, the verb “decrease” belongs to the standard dimension typeTime. We thus have EAC0 = {Revenue, Country, Time}. We interpret theweak time mention as an indication that the query could be completed byusing a dimension mapped to the Time SAC. We generalize this and con-sider that all extracted SACs should be represented by at least one object ofthe data warehouse. This allows for instance to serve abstract requests like“Sales analysis / Geography / Time”.
Let us complete our previous example with a second sentence to illus-trate entities propagation: “Our revenue is decreasing in some countries. Itis increasing in France though.”. Assume that, for the first sentence, theTime SAC has been represented by the dimension Year during SACs repre-sentation. The second sentence also mentions the Time SAC via the verb“increase”. Therefore, we will favor the use of the same dimension to in-crease consistency across suggested queries. More formally, the propagate
method of formula VI.1 adds to EACj+1 entities from EACj that were usedto represent a SAC. To distinguish between entities explicitly mentioned andthose propagated, entities are flagged with the initial sentence and inclusioncause (explicit mention, SAC representation, query extension, etc.).
Query completion. During the iterative construction of EACs for differ-ent sentences, we need to be able to complete them with required measuresand dimensions. In the previous example, we need to be able to completeEAC0 by choosing the most appropriate dimension to represent the standarddimension type Time.
In Chapter V we introduced semantics of multi-dimensional models plusaditional usage statistics which can be derived from repositories of BI doc-uments such as dashboards and reports. Using these concepts, Secion 5 ofthe latter chapter then presented a personalized query expansion componentwhich we leverage here. This component QE takes as input the concerneduser u, a query q to be completed and parameters params whih can be usedto filter candidate entities:
QE : (u, q, params) 7→ {(q1, s1), . . . , (qn, sn)}
Using these notations with our example, the initial query q is the set ofmeasures and dimensions in EAC0 and parameters simply indicate that we

122 CHAPTER VI. EXPERIMENTATION: BI RECOMMENDATIONS
require a dimension mapped to the Time SAC. In short, this adds up to findthe dimension that:
• is mapped to the standard dimension type Time,
• is compatible with all business entities of EAC0, as determined usingfunctional dependencies (see Chapter V, Section 2.2),
• is preferred by the user (see preferences in Chapter V, Section 3),
• maximizes the co-occurrence with business entities of EAC0 (see Chap-ter V, Section 4).
The query expansion component may also be used to return the top k
candidates, which leads to offer suggestions of aternative queries. An imme-date way to do so is to clone the current EAC for each of the k candidates.This technique may be paricularly useful in the case of limited entity ex-traction results. For instance, assume only the Revenue measure could bedetected, leading to the simple query for the total aggregated value of thismeasure. It is interesting to consider the suggestion of related queries to helpthe user explore related analytics, like Revenue per Country, Revenue per
Year, etc.
2.2.3 Text-To-Query algorithm
We introduced the notions of standard analysis categories and entity analysiscontext, which we use in conjunction with our query expansion componentto compose queries related to a text document. In this section we presentthe final Text-To-Query (T2Q) algorithm.
In Algorithm 2, lines 1-12 correspond to query generation and completiontechniques previously discussed. Beyond this, lines 13-17 provide additionaloptimizations to queries and associated visualizations. First, extracted busi-ness entities can relate to a measure, a dimension or a value of a dimension.Values of dimensions are particularly interesting for building more meaning-ful queries, with filters for instance. In the sample sentence “our revenueis increasing in France”, “France” is recognized as a value of the dimensionCountry. We can use this to propose the filtered query Revenue per Year
[Country = France]. The application of filters is realized at line 14.Lines 15 and 16 perform further visualization-related optimizations
thanks to standard analysis types (Comparison, Contribution, Rankingand Trending, see Section 2.2.1). Line 15 uses extracted analysis typesto determine the most significant and influence the selection of an adaptedchart. In the previous sample sentence, the verb “increasing” refers to thedimension type Trending, which indicates that a trend line would probablybe more appropriate than a pie chart. However, we do not elaborate more onthe complete chart selection algorithm as we rely on a proprietary technology
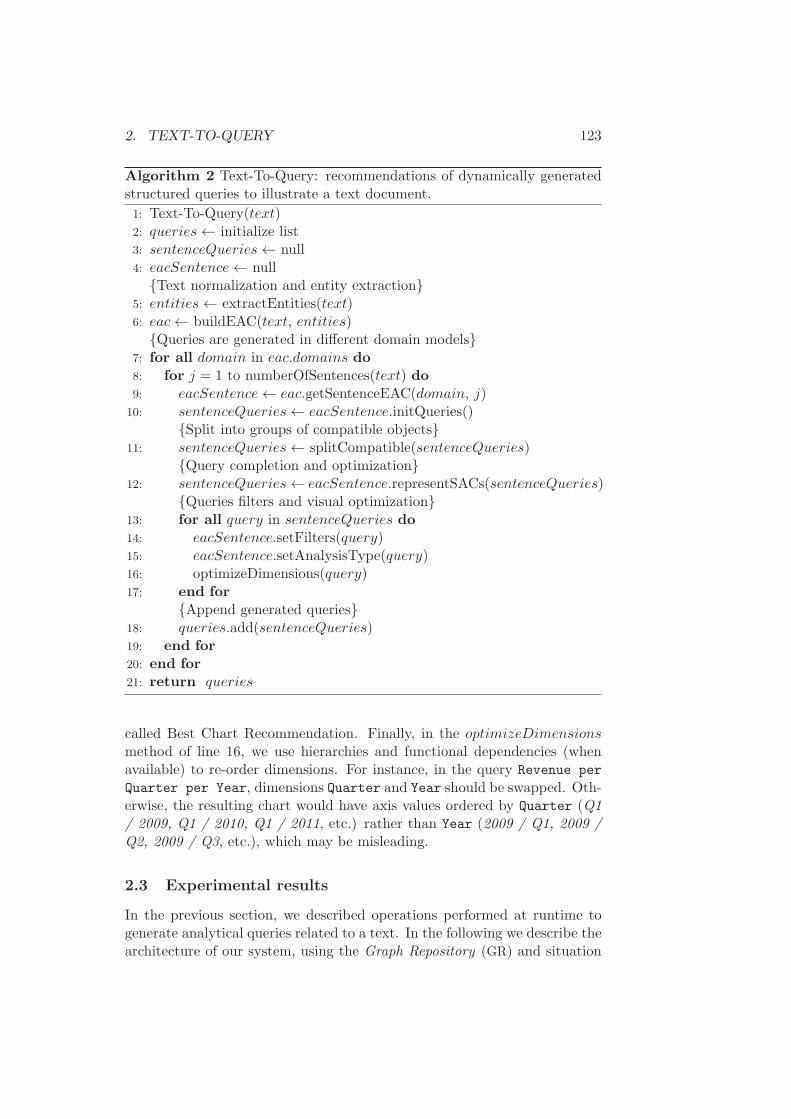
2. TEXT-TO-QUERY 123
Algorithm 2 Text-To-Query: recommendations of dynamically generatedstructured queries to illustrate a text document.
1: Text-To-Query(text)2: queries← initialize list3: sentenceQueries← null4: eacSentence← null{Text normalization and entity extraction}
5: entities← extractEntities(text)6: eac← buildEAC(text, entities){Queries are generated in different domain models}
7: for all domain in eac.domains do8: for j = 1 to numberOfSentences(text) do9: eacSentence← eac.getSentenceEAC(domain, j)
10: sentenceQueries← eacSentence.initQueries(){Split into groups of compatible objects}
11: sentenceQueries← splitCompatible(sentenceQueries){Query completion and optimization}
12: sentenceQueries← eacSentence.representSACs(sentenceQueries){Queries filters and visual optimization}
13: for all query in sentenceQueries do14: eacSentence.setFilters(query)15: eacSentence.setAnalysisType(query)16: optimizeDimensions(query)17: end for
{Append generated queries}18: queries.add(sentenceQueries)19: end for20: end for21: return queries
called Best Chart Recommendation. Finally, in the optimizeDimensions
method of line 16, we use hierarchies and functional dependencies (whenavailable) to re-order dimensions. For instance, in the query Revenue per
Quarter per Year, dimensions Quarter and Year should be swapped. Oth-erwise, the resulting chart would have axis values ordered by Quarter (Q1/ 2009, Q1 / 2010, Q1 / 2011, etc.) rather than Year (2009 / Q1, 2009 /Q2, 2009 / Q3, etc.), which may be misleading.
2.3 Experimental results
In the previous section, we described operations performed at runtime togenerate analytical queries related to a text. In the following we describe thearchitecture of our system, using the Graph Repository (GR) and situation
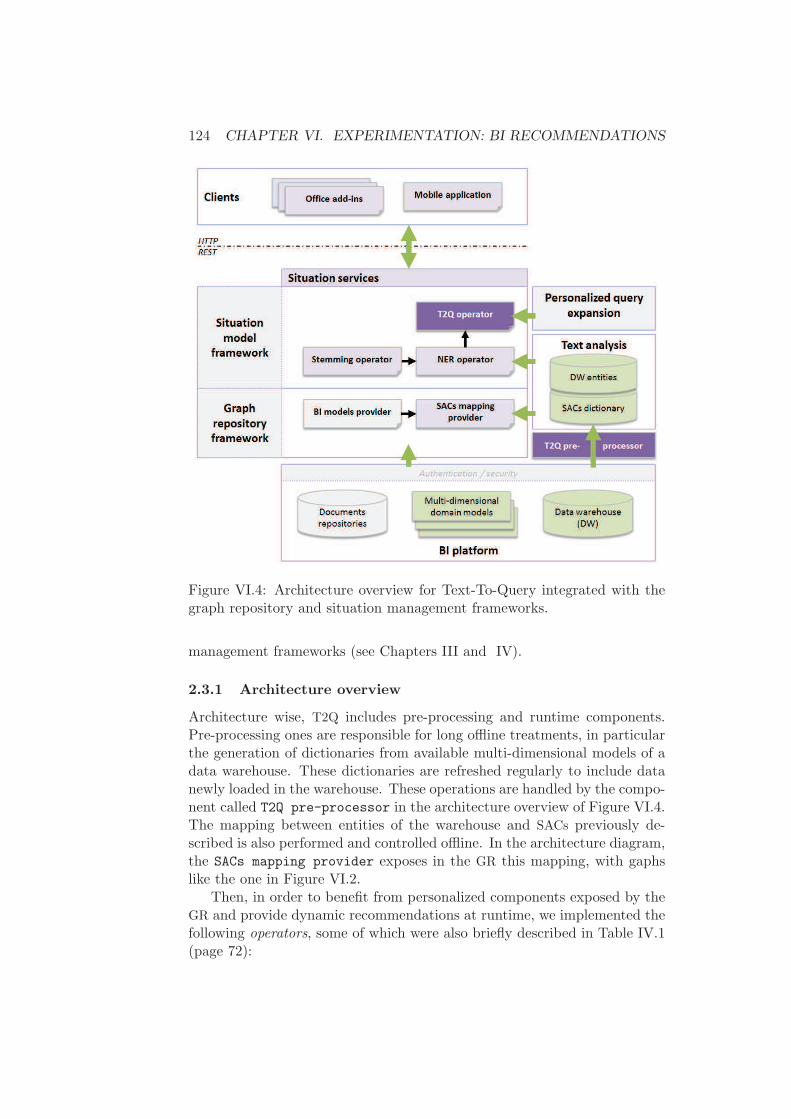
124 CHAPTER VI. EXPERIMENTATION: BI RECOMMENDATIONS
Figure VI.4: Architecture overview for Text-To-Query integrated with thegraph repository and situation management frameworks.
management frameworks (see Chapters III and IV).
2.3.1 Architecture overview
Architecture wise, T2Q includes pre-processing and runtime components.Pre-processing ones are responsible for long offline treatments, in particularthe generation of dictionaries from available multi-dimensional models of adata warehouse. These dictionaries are refreshed regularly to include datanewly loaded in the warehouse. These operations are handled by the compo-nent called T2Q pre-processor in the architecture overview of Figure VI.4.The mapping between entities of the warehouse and SACs previously de-scribed is also performed and controlled offline. In the architecture diagram,the SACs mapping provider exposes in the GR this mapping, with gaphslike the one in Figure VI.2.
Then, in order to benefit from personalized components exposed by theGR and provide dynamic recommendations at runtime, we implemented thefollowing operators, some of which were also briefly described in Table IV.1(page 72):
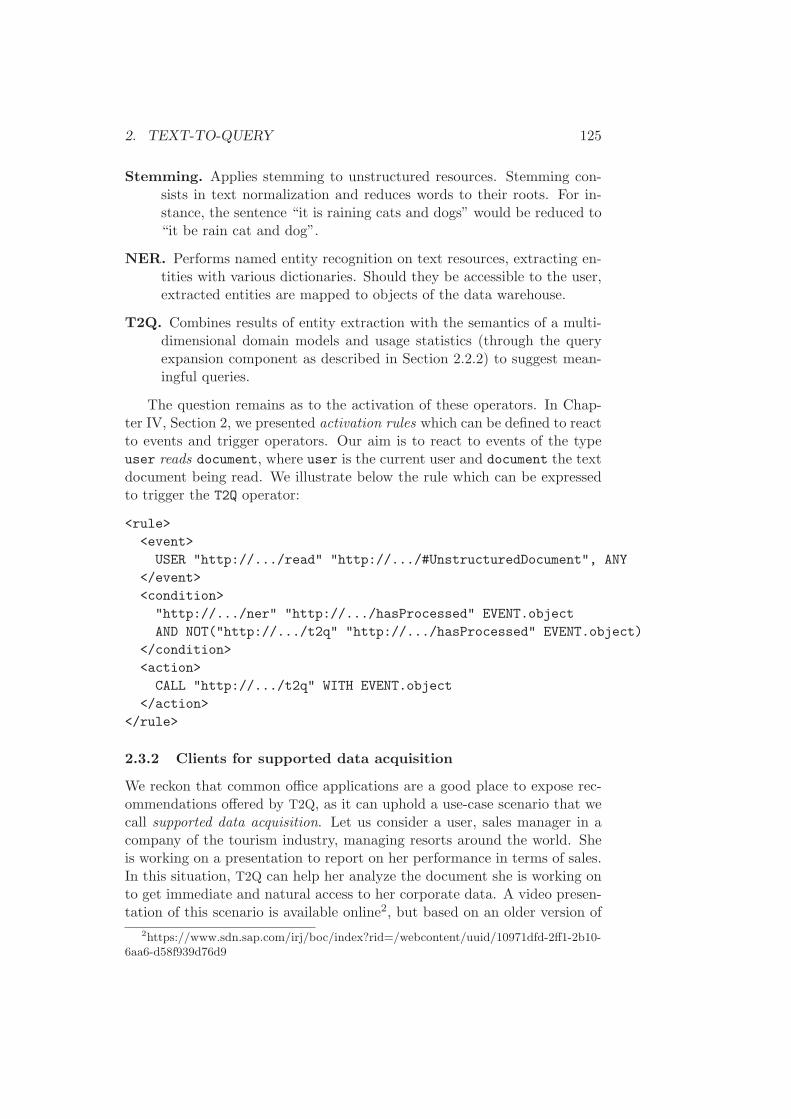
2. TEXT-TO-QUERY 125
Stemming. Applies stemming to unstructured resources. Stemming con-sists in text normalization and reduces words to their roots. For in-stance, the sentence “it is raining cats and dogs” would be reduced to“it be rain cat and dog”.
NER. Performs named entity recognition on text resources, extracting en-tities with various dictionaries. Should they be accessible to the user,extracted entities are mapped to objects of the data warehouse.
T2Q. Combines results of entity extraction with the semantics of a multi-dimensional domain models and usage statistics (through the queryexpansion component as described in Section 2.2.2) to suggest mean-ingful queries.
The question remains as to the activation of these operators. In Chap-ter IV, Section 2, we presented activation rules which can be defined to reactto events and trigger operators. Our aim is to react to events of the typeuser reads document, where user is the current user and document the textdocument being read. We illustrate below the rule which can be expressedto trigger the T2Q operator:
<rule>
<event>
USER "http://.../read" "http://.../#UnstructuredDocument", ANY
</event>
<condition>
"http://.../ner" "http://.../hasProcessed" EVENT.object
AND NOT("http://.../t2q" "http://.../hasProcessed" EVENT.object)
</condition>
<action>
CALL "http://.../t2q" WITH EVENT.object
</action>
</rule>
2.3.2 Clients for supported data acquisition
We reckon that common office applications are a good place to expose rec-ommendations offered by T2Q, as it can uphold a use-case scenario that wecall supported data acquisition. Let us consider a user, sales manager in acompany of the tourism industry, managing resorts around the world. Sheis working on a presentation to report on her performance in terms of sales.In this situation, T2Q can help her analyze the document she is working onto get immediate and natural access to her corporate data. A video presen-tation of this scenario is available online2, but based on an older version of
2https://www.sdn.sap.com/irj/boc/index?rid=/webcontent/uuid/10971dfd-2ff1-2b10-6aa6-d58f939d76d9
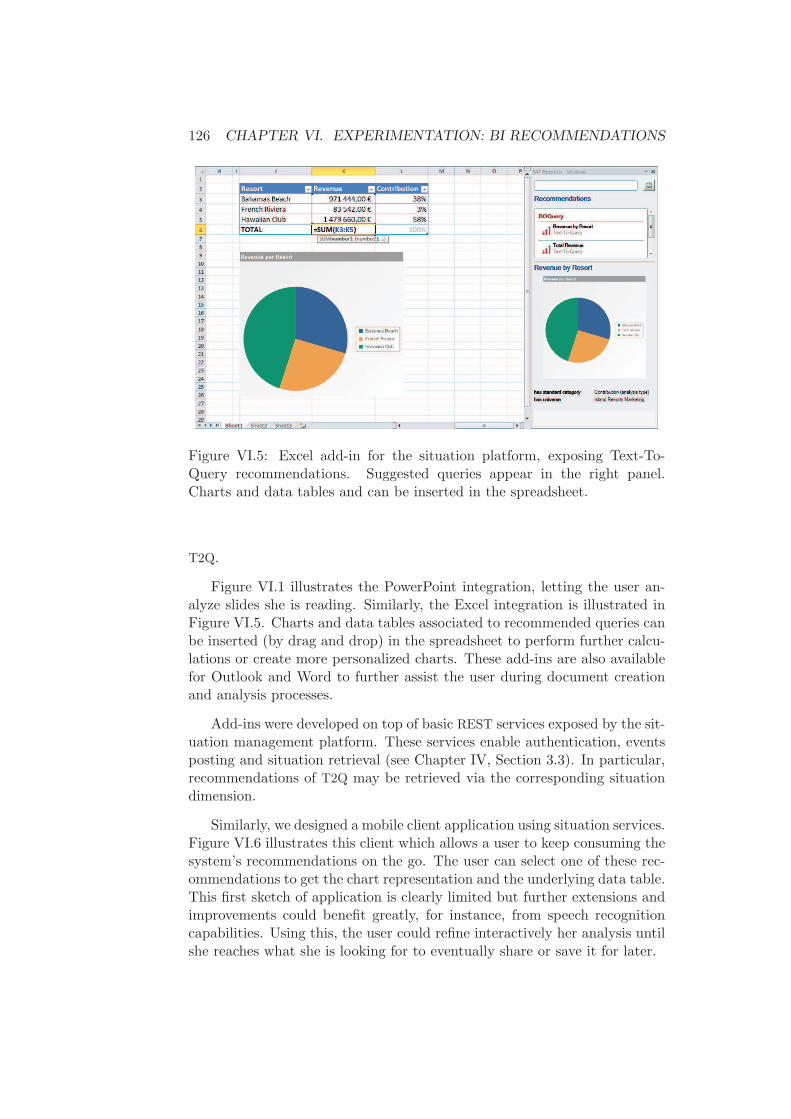
126 CHAPTER VI. EXPERIMENTATION: BI RECOMMENDATIONS
Figure VI.5: Excel add-in for the situation platform, exposing Text-To-Query recommendations. Suggested queries appear in the right panel.Charts and data tables and can be inserted in the spreadsheet.
T2Q.
Figure VI.1 illustrates the PowerPoint integration, letting the user an-alyze slides she is reading. Similarly, the Excel integration is illustrated inFigure VI.5. Charts and data tables associated to recommended queries canbe inserted (by drag and drop) in the spreadsheet to perform further calcu-lations or create more personalized charts. These add-ins are also availablefor Outlook and Word to further assist the user during document creationand analysis processes.
Add-ins were developed on top of basic REST services exposed by the sit-uation management platform. These services enable authentication, eventsposting and situation retrieval (see Chapter IV, Section 3.3). In particular,recommendations of T2Q may be retrieved via the corresponding situationdimension.
Similarly, we designed a mobile client application using situation services.Figure VI.6 illustrates this client which allows a user to keep consuming thesystem’s recommendations on the go. The user can select one of these rec-ommendations to get the chart representation and the underlying data table.This first sketch of application is clearly limited but further extensions andimprovements could benefit greatly, for instance, from speech recognitioncapabilities. Using this, the user could refine interactively her analysis untilshe reaches what she is looking for to eventually share or save it for later.

3. PERSONALIZATION IN SEARCH 127
Figure VI.6: Mobile client for the situation platform, exposing Text-To-Query recommendations. The user can select suggested queries in a list tolook at the generated chart and underlying data.
3 Personalization in search
In this section, we present another important experimentation for the con-cepts that we developed in our work. In particular, we illustrate how thegraph repository (GR) and situation management frameworks can be usedto enable various levels of personalization in a federated search project.
3.1 An open architecture for search
This project for a federated search engine has been initiated in 2011 as part ofa broader project inside SAP, called Business Web3. We now briefly presentthe open modular architecture that was defined to allow contributions atdifferent levels in the search platform.
3.1.1 Architecture overview
Figure VI.7 depicts the overall architecture that was set-up. In particular,the search platform handles four main types of extension points or plugins:
3http://www.sap.com/corporate-en/our-company/innovation/research/business-web/index.epx
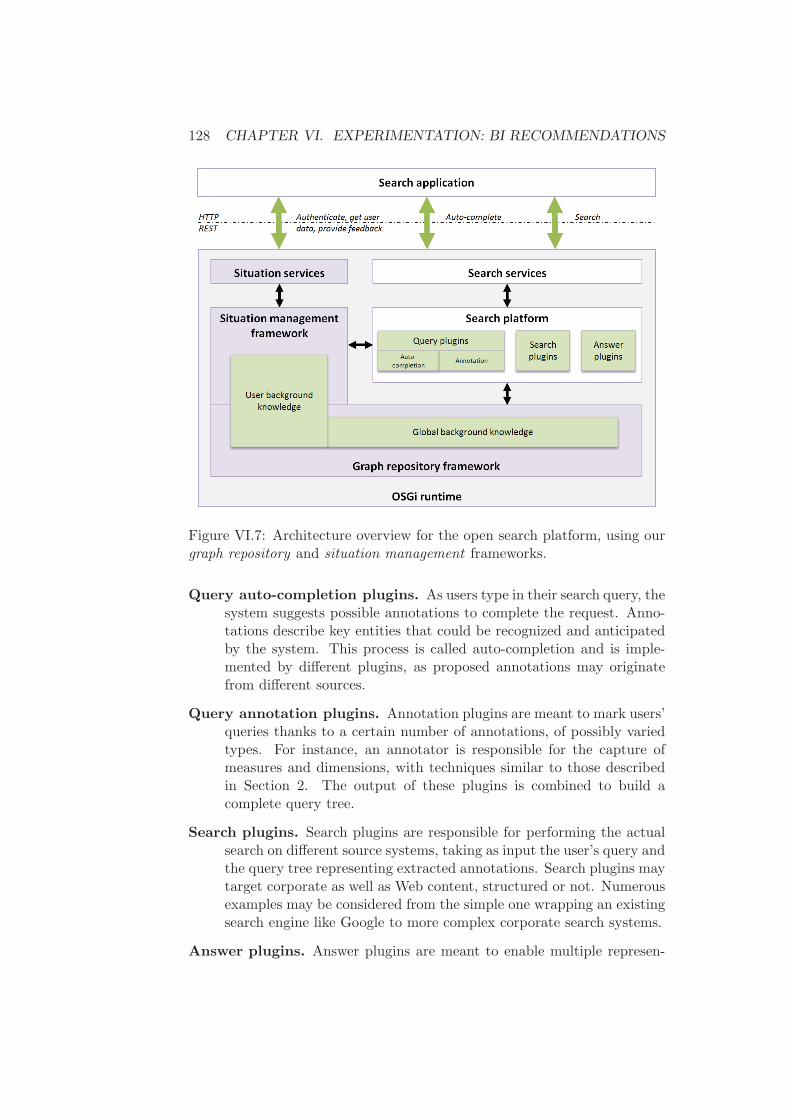
128 CHAPTER VI. EXPERIMENTATION: BI RECOMMENDATIONS
Figure VI.7: Architecture overview for the open search platform, using ourgraph repository and situation management frameworks.
Query auto-completion plugins. As users type in their search query, thesystem suggests possible annotations to complete the request. Anno-tations describe key entities that could be recognized and anticipatedby the system. This process is called auto-completion and is imple-mented by different plugins, as proposed annotations may originatefrom different sources.
Query annotation plugins. Annotation plugins are meant to mark users’queries thanks to a certain number of annotations, of possibly variedtypes. For instance, an annotator is responsible for the capture ofmeasures and dimensions, with techniques similar to those describedin Section 2. The output of these plugins is combined to build acomplete query tree.
Search plugins. Search plugins are responsible for performing the actualsearch on different source systems, taking as input the user’s query andthe query tree representing extracted annotations. Search plugins maytarget corporate as well as Web content, structured or not. Numerousexamples may be considered from the simple one wrapping an existingsearch engine like Google to more complex corporate search systems.
Answer plugins. Answer plugins are meant to enable multiple represen-

3. PERSONALIZATION IN SEARCH 129
tations of a single result. For instance, this is useful when dealing withresults in the form of BI queries, which can be represented either as adata table or as a chart. Answer plugins will not be further discussedhere though.
It is worth noting that an OSGi4 runtime is used to enable a high level offlexibility and real modularity. The GR and situation management frame-works were implemented in this runtime as well (see Chapter IV, whichenabled a loosely coupled and progressive integration.
In particular, the OSGi runtime offers a service registry which enablesbundles to dynamically declare and consume services. The four types of plu-gins previously described for the search architecture are dynamically regis-tered to the search platform using this registry. Similarly, the GR is exposedas an OSGi service so that search-related plugins can consume users’ repos-itories and situation graphs to personalize their results. For this purpose,user authentication is performed in the search application thanks to the cor-responding situation service and the token is passed through as a parameterof the search request. In the context of the search Web application, sessioncookies may also be used.
3.1.2 Query parsing and annotations
User queries are parsed and annotated to build query trees. A query treerepresents annotations in a hierarchical manner and is produced by aggregat-ing results of the different query annotation plugins available in the searchplatform.
Briefly, annotations are simple metadata indicating chunks of the userquery that correspond to identified entities. Simple annotations usuallyindicate the entity ID, its name, type, offset (in the query) and length.These entities can be extremely varied and are meant to help with the queryanalysis process. For instance, in the query “revenue 2008”, “revenue” maybe used to recognize the measure Sales revenue and the term “2008” maybe recognized as a value of the dimension Year. Entity extraction techniqueshave been discussed in more details in Section 2 with the Text-To-Querysystem.
3.2 BI queries and charts search
In Section 5 of Chapter V, we presented a personalized query expansion com-ponent, based on semantics of multi-dimensional models and usage statisticsof BI entities derived from repositories of reports and dashboards. In thissection, we illustrate results obtained with this component to implement an
4http://www.osgi.org
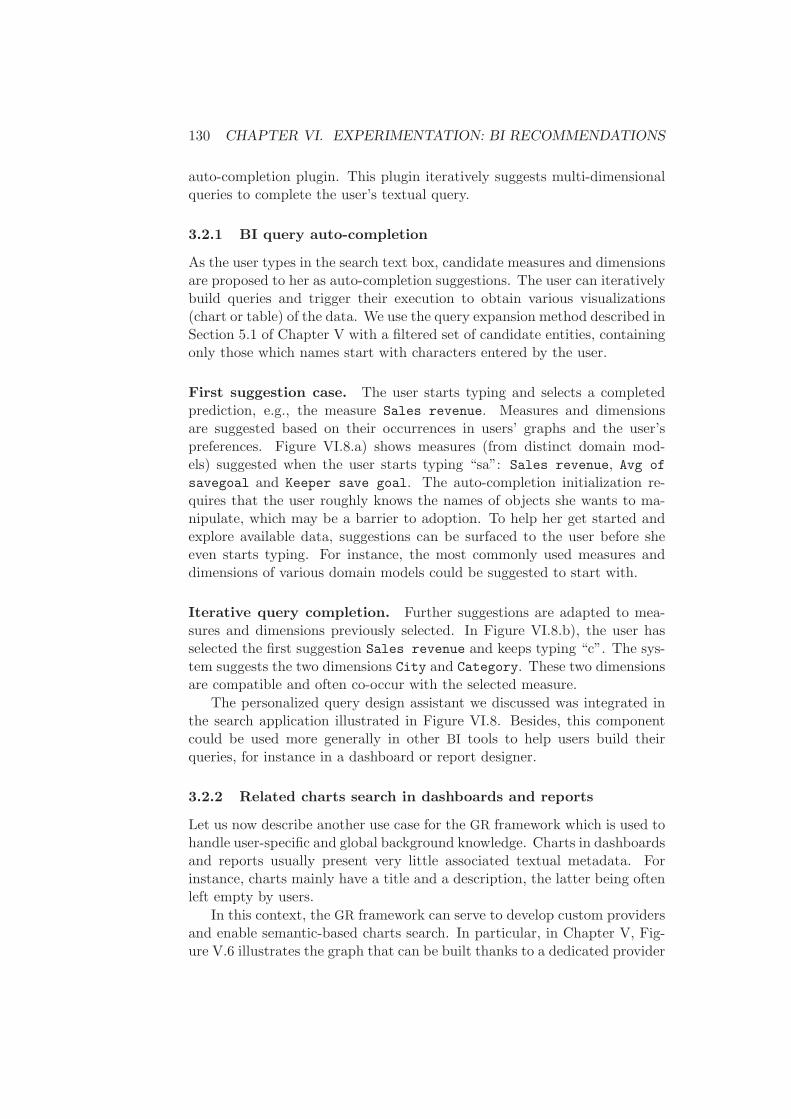
130 CHAPTER VI. EXPERIMENTATION: BI RECOMMENDATIONS
auto-completion plugin. This plugin iteratively suggests multi-dimensionalqueries to complete the user’s textual query.
3.2.1 BI query auto-completion
As the user types in the search text box, candidate measures and dimensionsare proposed to her as auto-completion suggestions. The user can iterativelybuild queries and trigger their execution to obtain various visualizations(chart or table) of the data. We use the query expansion method described inSection 5.1 of Chapter V with a filtered set of candidate entities, containingonly those which names start with characters entered by the user.
First suggestion case. The user starts typing and selects a completedprediction, e.g., the measure Sales revenue. Measures and dimensionsare suggested based on their occurrences in users’ graphs and the user’spreferences. Figure VI.8.a) shows measures (from distinct domain mod-els) suggested when the user starts typing “sa”: Sales revenue, Avg of
savegoal and Keeper save goal. The auto-completion initialization re-quires that the user roughly knows the names of objects she wants to ma-nipulate, which may be a barrier to adoption. To help her get started andexplore available data, suggestions can be surfaced to the user before sheeven starts typing. For instance, the most commonly used measures anddimensions of various domain models could be suggested to start with.
Iterative query completion. Further suggestions are adapted to mea-sures and dimensions previously selected. In Figure VI.8.b), the user hasselected the first suggestion Sales revenue and keeps typing “c”. The sys-tem suggests the two dimensions City and Category. These two dimensionsare compatible and often co-occur with the selected measure.
The personalized query design assistant we discussed was integrated inthe search application illustrated in Figure VI.8. Besides, this componentcould be used more generally in other BI tools to help users build theirqueries, for instance in a dashboard or report designer.
3.2.2 Related charts search in dashboards and reports
Let us now describe another use case for the GR framework which is used tohandle user-specific and global background knowledge. Charts in dashboardsand reports usually present very little associated textual metadata. Forinstance, charts mainly have a title and a description, the latter being oftenleft empty by users.
In this context, the GR framework can serve to develop custom providersand enable semantic-based charts search. In particular, in Chapter V, Fig-ure V.6 illustrates the graph that can be built thanks to a dedicated provider
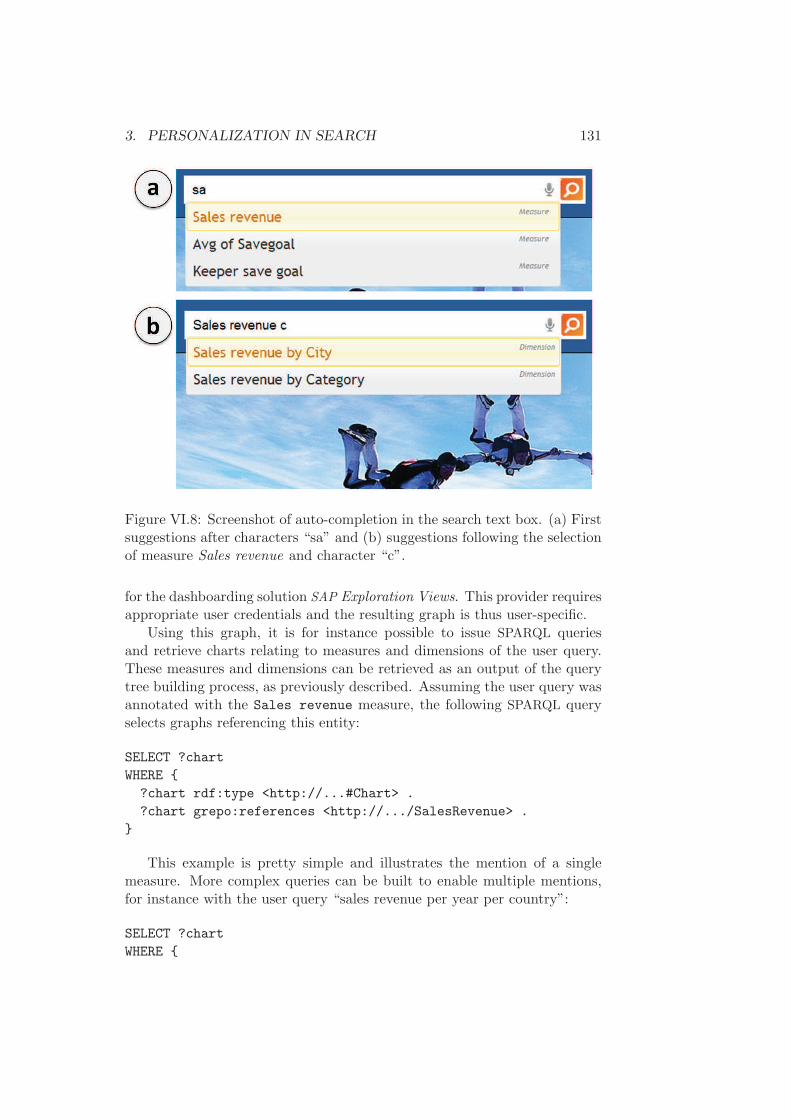
3. PERSONALIZATION IN SEARCH 131
Figure VI.8: Screenshot of auto-completion in the search text box. (a) Firstsuggestions after characters “sa” and (b) suggestions following the selectionof measure Sales revenue and character “c”.
for the dashboarding solution SAP Exploration Views. This provider requiresappropriate user credentials and the resulting graph is thus user-specific.
Using this graph, it is for instance possible to issue SPARQL queriesand retrieve charts relating to measures and dimensions of the user query.These measures and dimensions can be retrieved as an output of the querytree building process, as previously described. Assuming the user query wasannotated with the Sales revenue measure, the following SPARQL queryselects graphs referencing this entity:
SELECT ?chart
WHERE {
?chart rdf:type <http://...#Chart> .
?chart grepo:references <http://.../SalesRevenue> .
}
This example is pretty simple and illustrates the mention of a singlemeasure. More complex queries can be built to enable multiple mentions,for instance with the user query “sales revenue per year per country”:
SELECT ?chart
WHERE {
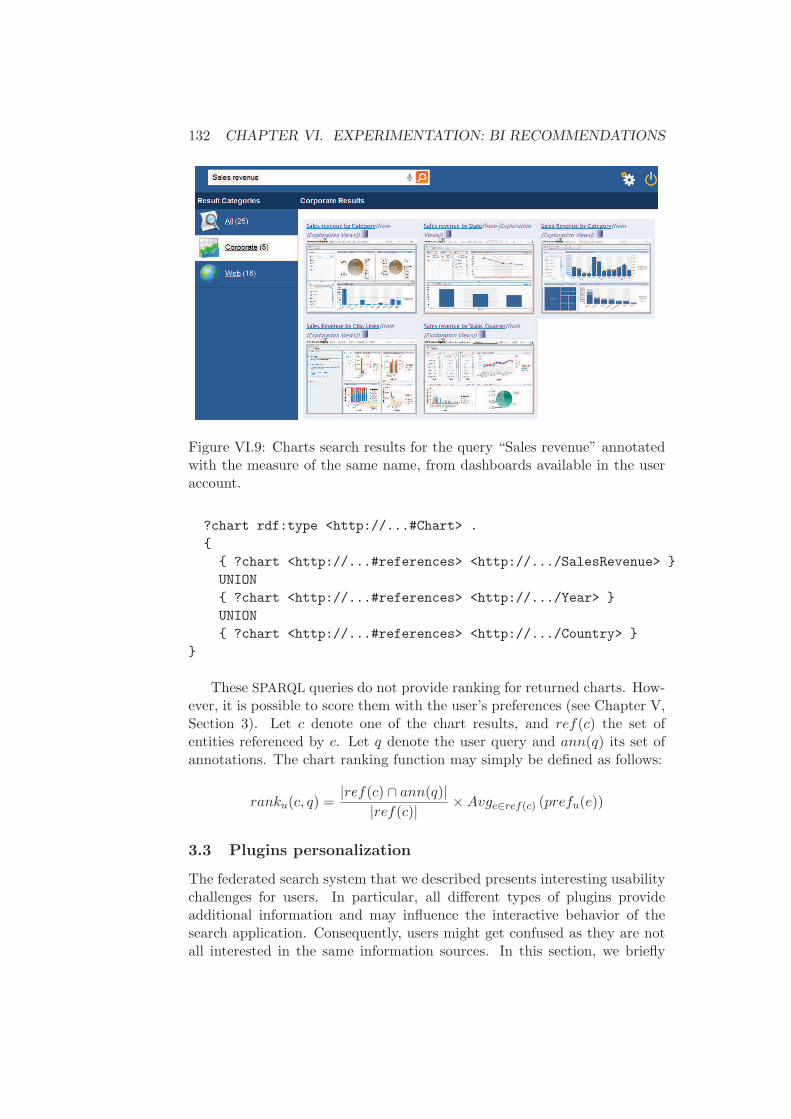
132 CHAPTER VI. EXPERIMENTATION: BI RECOMMENDATIONS
Figure VI.9: Charts search results for the query “Sales revenue” annotatedwith the measure of the same name, from dashboards available in the useraccount.
?chart rdf:type <http://...#Chart> .
{
{ ?chart <http://...#references> <http://.../SalesRevenue> }
UNION
{ ?chart <http://...#references> <http://.../Year> }
UNION
{ ?chart <http://...#references> <http://.../Country> }
}
These SPARQL queries do not provide ranking for returned charts. How-ever, it is possible to score them with the user’s preferences (see Chapter V,Section 3). Let c denote one of the chart results, and ref(c) the set ofentities referenced by c. Let q denote the user query and ann(q) its set ofannotations. The chart ranking function may simply be defined as follows:
ranku(c, q) =|ref(c) ∩ ann(q)|
|ref(c)|×Avge∈ref(c) (prefu(e))
3.3 Plugins personalization
The federated search system that we described presents interesting usabilitychallenges for users. In particular, all different types of plugins provideadditional information and may influence the interactive behavior of thesearch application. Consequently, users might get confused as they are notall interested in the same information sources. In this section, we briefly

3. PERSONALIZATION IN SEARCH 133
Figure VI.10: Graph of plugins available in the search platform, of differenttypes: search, answer and auto-completion plugins.
introduce custom user preferences to personalize the system’s behavior andthus the user’s search experience.
3.3.1 Authorizations and ranking
Figure VI.10 illustrates the graph of plugins available in the search platform.On top of these plugins, we define simple preferences in the form of state-ments like user prefers BIQueryAutoCompletionPlugin. Since statementsare defined as extended nodes (see Chapter III, Section 2.1) they enable thedefinition of custom attributes. From the RDF perspective, this implies towork with reified statements.
We use this capability to add a score attribute to preference statements.This allows users to rank their plugins by defining numerical preferencesbetween 0 and 1. Plugins with a preference of 0 could be disabled for thisuser. This approach can help improve performance for users who require very

134 CHAPTER VI. EXPERIMENTATION: BI RECOMMENDATIONS
specific information, for instance from a single source. Scores determinedby the user’s preferences can also be used in the results scoring process, forinstance by weighting a plugin’s contribution in search results.
3.3.2 Other forms of personalization
Let us conclude with other possible illustrations of personalization capabil-ities enabled by our frameworks.
Personal filters and self-references. We want to be enable the resolu-tion by some query processing plugins of self-references in users’ queries. Asan example, in the query “revenue of my store”, the pronoun “my” refers tothe user herself (a sales manager responsible for a given store). This illustra-tion is a simple example but more generally, advanced query interpretationtechniques may be developed, e.g., using linguistic patterns [KBA11].
We now simply introduce user preferences that can be defined to indicatethat users have personal filters for particular dimensions. In the exampleabove, the user can have a personal filter on the dimension Store for thevalue New York. The query processing plugin could access the user’s situ-ation model – through the situation provider in the GR framework – anddetermine if and how the query Sales revenue by Store needs to be fil-tered. Such a personal filter can very simply be represented with statementslike user hasPersonalFilter New York and New York isValueOf Store.
User’s location and social network. Similarly, search plugins can ex-ploit the geography dimension of our situation model to enable location-aware search results. Location is a simple yet extremely valuable contextinformation and is therefore frequently used by various services, in particularwith the advent of pervasive computing and GPS-enabled smartphones. Asimple experimentation was made using the API provided by TellMeWhere5.We developed a minimal operator using these services, triggered by an ac-tivation rule that reacts to events of the type user asks Restaurant (orpetrol station, etc.). Practically, the user’s location can be retrieved eitherfrom the mobile application of Figure VI.6 (GPS coordinates) or throughthe Web application of Figures VI.8 and VI.9 (IP address).
Eventually, the user’s social network – accessible through the correspond-ing dimension of the situation model – can be used to simply implement anauto-completion plugin for the user’s contacts. For instance, when the userstarts typing “ni”, she receives suggestions of users like Nick Cox .
5http://www.tellmewhere.com/

4. SUMMARY AND DISCUSSION 135
4 Summary and discussion
In this chapter, we illustrated the use of our GR and situation managementframeworks in two projects, to enable recommendations and personalizationat different levels. First, the Text-To-Query system was presented to rec-ommend structured analytics, dynamically generated to illustrate a textualcontent. This system was mainly show-cased using add-ins integrated incommon office applications, to back a scenario that we call supported dataacquisition. Then, we described the open and modular architecture of a fed-erated search project which enabled us to bring a significant contribution interms of personalization and more generally background knowledge manage-ment. In particular, we introduced a plugin for BI query auto-completion toease the user querying process and another one to search for related chartsin the user’s collection of dashboards (or reports).
First, we would like to discuss the fact that we did not come up with aproper evaluation for recommendations made, be it with Text-To-Query orthe auto-completion plugin. The point is that we have been relying on twoprototypes, SAP Exploration Views for the dashboarding solution and SocialNetwork Analyzer for users’ social network management. Therefore, we didnot have access at this time to important repositories of dashboards withenough different users and created dashboards. Second, users of the firstsolution were not yet tied to users of the second which make it complicatedto design a joint dataset for evaluation.
To conclude, we reckon that the GR and situation management frame-works are particularly valuable and proved effective to enable multiple con-tributions in a distributed project. For instance, preferences can be freelyexpressed with rich semantics which allow precise, application-specific andadaptive personalization scenarios. Beyond rather static preferences, dy-namic aspects enabled by the situation management framework have onlypartially been exploited and experimented, due to lack of time and resources.However, business events should be further leveraged to enable, for instance,dynamic scoring. This may be achieved by assigning dynamic “boost” fac-tors to nodes of the situation graph, depending on the user’s interactionswith close resources.
5 Conclusion
In this chapter we elaborated on various experimentations realized thanks toGR and situation management frameworks, previously introduced in Chap-ters III and IV.
We first presented T2Q, a dedicated RS dynamically generating multi-dimensional queries related to a text document. Measures, dimensions andtheir values are extracted from the text thanks to a NER phase. Recognized

136 CHAPTER VI. EXPERIMENTATION: BI RECOMMENDATIONS
entities are combined to form meaningful queries using in particular thequery expansion component introduced in Chapter V.
Then, further experimentations were proposed in the context of an openfederated search platform. The search platform enables the definition ofvarious plugins to cover tasks as varied as auto-completion, query pars-ing and search. We presented a certain number of providers and operatorsimplemented in these frameworks, in this chapter as well as Chapter V, Sec-tion 5.2.1. Besides, our work could be integrated to the search platform toprovide various capabilities. Most importantly, the GR framework is usedfor global and user-specific data or knowledge management. Examples ofsuch data include (but are not limited to) users’ preferences, which usagefor plugins personalization was briefly illustrated in Section 3.3.
T2Q proved extremely interesting to help users reach specific informationin a data warehouse, using a first level of content analysis. However, itcannot be denied that text analysis operations performed by T2Q remainquite superficial and as a result, only simple queries can be suggested to theuser. There is an ongoing research effort – in the context of the federatedsearch project previously mentioned – to further encourage natural languageprocessing and improve the interpretation of users’ queries. This effort isbased, among other things, on the pattern-based question answering systemproposed by Kuchmann-Beauger et al. [KBA11]. The user’s question canbe expressed using natural language. Patterns are then used to determinecombinations of entities recognized in the question. Patterns that match thequestion can then be translated into a query expressed in the appropriatelanguage.
To conclude, we reckon that GR and situation management frameworksdescribed in our work present a significant potential to enable diverse per-sonalization scenarios. Spontaneous recommendations and dynamic aspectsof these frameworks proved more difficult to illustrate though. Therefore, wereckon that future efforts should first focus on a first phase of re-engineering,meant to take the GR framework to a more stable state. Then, users’ global-and application-specific preferences should be more formally defined so theybenefit in a more general way, for instance to search plugins. Further, generictechniques inherited from RS could be exposed through the framework,encouraging GR plugins to define or re-use personalization-related indica-tors. Important examples of recommendation techniques were introduced inChapter II, Section 2 and a proposed application to BI entities was presentedin Chapter V, Sections 3 and 4.

Chapter VII
Conclusion and perspectives
Contents
1 Summary . . . . . . . . . . . . . . . . . . . . . . . 137
2 Discussion and perspectives . . . . . . . . . . . . 140
1 Summary
As the amount and complexity of data generated and maintained by informa-tion systems and their users keep increasing, information overload becomesa problem of utmost importance. In response to this issue, personalizedsystems have emerged and aim at proposing more relevant information andservices to their users.
Recommender systems (RS) are an interesting kind of personalized sys-tems, designed to help users explore vasts spaces of available information.If RS have grown extremely popular in a Web context, we believe such sys-tems could also be valuable in corporate environments, dealing with privatesresources of an organization. Numerous techniques were developed and areoften combined to form hybrid recommendation strategies, as discussed inChapter II, Section 2. We presented for instance the two most common rec-ommendation techniques, with content-based (CB) and collaborative RS. CBsystems stem from information retrieval and information filtering fields, re-lying on a keyword representation of items and users’ preferences in a vectorspace model. Collaborative filtering (CF) systems do not perform contentanalysis on items to recommend but rather exploit the so called collectiveintelligence, e.g., with ratings. CF systems assume that a user is bound tobe interested by items that other users with similar tastes liked.
Perosnalized systems usually rely on some model of the user and herpreferences to serve better selected and more adapted information. RS areno exception and involve a certain amount of user modeling, centered around
137

138 CHAPTER VII. CONCLUSION AND PERSPECTIVES
users’ interactions with the collection of resources (or items) being consid-ered for recommendation. However, RS often involve an important pre-computation phase which may limit their ability to dynamically adapt to achanging user environment. Context-aware (CA) systems represent anotherimportant area related to personalization. Remarkably, the approach ofCA systems is mainly targeting dynamic adaptation in heterogeneous envi-ronments, encouraging model sharing and re-usability accross applications.Context modeling is a key issue in this area and most recent work arguethat graph-based systems are better suited for knowledge representation.In particular, Semantic Web technologies like RDF and SPARQL seem welladapted to handle information heterogeneity and enable a high level of ex-pressiveness. Besides, reasoning on context knowledge may also be useful todeal with incomplete information.
Our work focuses on personalization and recommendations related to BI
tools. BI analytics rely on an important phase of multi-dimensional modelingto enable an easier exploration of data warehouses by non-expert users.Multi-dimensional models mainly define measures and dimensions to queryfor available data. Measures are numerical facts that can be aggregatedagainst a certain number of dimensions, e.g., to get the Revenue generatedby a given Product in some Countries. In real-life production deploymentsof BI platforms, multi-dimensional models can grow extremely complex withthousands of measures and dimensions, leaving users with the difficult taskof finding the information they are looking for. However, we observe thatvery few techniques of RS and CA systems have been employed so far todevelop personalized BI solutions. Our work thus targets the exploration ofsyneriges between RS and CA systems to develop personalized data accesssolutions, suited for users of BI platforms and data warehouses (DW).
Chapter III first introduced the requirements imposed on the user situ-ation monitoring platform that we consider. Model sharing and re-usabilityacross different applications seems particularly important in our case. In-deed, modern BI platforms provide different tools and model sharing couldgreatly benefit to all these applications, e.g., by reducing the amount of re-dundant user modeling. Besides, security and privacy are two key aspectsto enforce in a user monitoring system, in particular in corporate settings.Privacy is crucial and the system must ensure that user data is not going tobe accessible by others. Security on the other hand must also be observedfrom a system perspective. Indeed, most corporate systems impose accesscontrol rules and users may not have access to the same data, leading forinstance to different views of the DW. In response to these challenges, wepresented a graph-based situation model relying on situation statements,the unit of information in situation modeling. These statements are triples(subject-predicate-object) extended with additional metadata to capture forinstance the fact that context knowledge is inherently time dependent. Thesituation is defined as a collection of statements and takes the form of a
1. SUMMARY 139
graph centered on the concerned user. On top of this graph view, we de-fined a certain number of situation dimensions meant to offer a structuredand categorized view of lower level information. Examples of such dimen-sions include (but are not limited to) social and geographical aspects as wellas preferences and recommendations.
Graphs involved in the description of a user’s situation are managed inour system thanks to a framework called graph repository (GR). This modu-lar framework gives developers the ability to define new information sourceswith an extensible set of providers. Providers may connect to remote sys-tems thanks to users’ credentials, assuming users authorized it in the firstplace. The security model of the GR thus makes it possible for users to de-fine and customize their own GR. Moreover, Chapter IV further elaboratedon dynamic aspects of situation monitoring. Situations are indeed evolvingas users interact with various applications and systems. The GR frameworkis extended with active components like activation rules and operators. Inresponse to business events sent to the platform (or raised internally), acti-vation rules are evaluated and may trigger appropriate operators to updategraphs according to the event being interpreted. Rules are defined in theevent-condition-action (ECA) framework and can be evaluated thanks toqueries on the user’s GR. Should graphs be managed using a RDF factory,rules evaluation is performed with a translation to SPARQL queries. Chap-ter IV introduced these active components and discussed more extensivelythe GR framework, which proves important to enable a certain adoption andencourage additional developments.
We introduced the GR and situation management frameworks to forma rather generic personalization platform. Later, Chapter V focused on thedefinition of BI-related components. This chapter presented in particular thesemantics of multi-dimensional models which we expose in our frameworkthanks to a specific provider. Besides, we discussed the use of reposito-ries of BI documents like dashboards and reports to derive additional usagestatistics. For instance, measures and dimensions occur in these documentsand we exploit this fact to define implicit preferences and a measure of co-occurrence. We defined user preferences related to BI entities according toa quantitative approach, combining explicit and implicit scores. Numericpreferences then allowed us to exploit the traditional Pearon correlationand define users’ similarity. In application of these indicators, we discusseda personalized query expansion component, meant to help users iterativelybuild more complete data queries.
Eventually, we presented in Chapter VI various experimentations real-ized with our situation management platform. First, we introduced Text-To-Query (T2Q), a system dynamically generating and recommending ana-lytics to illustrate an unstructured text document. T2Q combines semanticsof multi-dimensional models and usage statistics – thanks to the query ex-pansion component previously described – to offer meaningful queries and

140 CHAPTER VII. CONCLUSION AND PERSPECTIVES
visualizations. T2Q was show-cased using add-ins for popular office appli-cations. This scenario demonstrated the ability for users to further analyzeand enrich documents they are working on, thanks to recommendations ofrelated structured analytics. This supported data acquisition scenario re-sponds to the need for modern BI platforms to enable a smooth transitionbetween structured and unstructured content. To conclude, Chapter VI in-troduced a federated search project which leverages the GR and situationmanagement frameworks to propose various forms of personalization. Thequery expansion component was for instance used to offer an interactivequery designer through the usual search text box, using an auto-completionapproach. Besides, we discussed other possible personalization strategies forvarious plugins of this federated search project. Federated search involvesmultiple information sources may lead to confusion for end-users. Thanks toour situation management platform, users may express their preferences forsome sources compared to others, leading to less noisy and more personalizedresults.
2 Discussion and perspectives
First and foremost, we would like to discuss the importance of the GR frame-work in our contribution. The GR is indeed a key component of our platform,meant to provide graph management capabilities ranging from simple rep-resentation to complex querying and reasoning. However, the GR is muchmore than a simple storage system for graph data since it can also define ac-tive components, developed in the form of plugins. The personalization andsecurity model for these plugins enables users to fully customize their owngraph repositories, defining what is accessible and how it can be used. Thisaspect proves crucial to ensure users keep control of what data is collectedfrom various systems by providers. Besides, plugins are more generic thanproviders and may implement extremely varied capabilites. To sum up, welike to see the GR as a container for both data and applicative components,all of them being fully dedicated to a given user. We reckon this aspect isextremely interesting and presents a drastic change compared to traditionalapplications which are designed to serve multiple users. On the contrary,every piece of data and every action performed inside a GR instance areentirely focused on the assistance to provide to the concerned user. As aconsequence, we believe that the GR framework deserves further efforts topush its development and take it to a more stable state. The industrializa-tion of the GR could for instance base on an important refactoring of theexisting code and lean towards a cleaner and simpler architecture. In partic-ular, we argued in Chapter III for the abstraction of the graph storage andquerying engine, leading to the definition of specific graphs factories. Facto-ries are used to back graphs data using dedicated triple stores or traditional
2. DISCUSSION AND PERSPECTIVES 141
relational databases. Even if this abstraction has its interest, it providedlittle value since even reasonably complex queries require to go down to theappropriate language, be it SPARQL or SQL. The graph storage abstractionthus induced too much complexity in the development and provided limitedadded value. As a result, we consider that future developments related tothe GR should base on a single reference implementation, ideally using adedicated triple store and SPARQL querying.
Among points that we developed in our work are the dynamic compo-nents described in Chapter IV, more specifically activation rules and opera-tors. As previously discussed, activation rules are used to react to businessevents and trigger appropriate operations and update situation graphs inresponse. A rule defines conditions that need to be validated before trigger-ing the execution of an operator. Rule validation therefore requires queriesto be executed and evaluated on the GR. Assuming a high number of eventscould have to be processed, this may lead to significant performance prob-lems. For this reason, rules contain a first event filtering part which is usedto limit the amount of queries that will actually have to be evaluated andthus limit performance issues. However, we have to admit that we werenot able to perform an extensive evaluation regarding this aspect. Besides,the continuous rule evaluation process that we described in Section 1.1 ofChapter IV enables the definition of linear and non-linear evolution scenar-ios. If linear scenarios are simple to set up and demonstrate, non linearones induce undeterministic behaviors and are thus more complex to showcase in a reproducible way. To conclude on dynamic components, we reckonthat they bring a significant contribution to make our frameworks suited fordynamic adaptation. However, to further validate their usage, one wouldhave to conduct an extensive study of performance-related issues and prob-ably optimize rules evaluation in the mean time. On top of that, non linearscenarios should be the focus of future work in this area since they wouldlikely bring more value than simple pre-determined linear scenarios.
The last point that we would like to discuss lies in the balance betweenthe genericity of methods employed and application-specific optimizations.In Chapter V, we introduced a certain number of indicators useful for per-sonalization and recommendations in the context of BI tools. Our workin this regard bases on multi-dimensional models designed for data ware-houses, enabling non-expert users to perform ad-hoc query and reportingwith key business entities (measures and dimensions). We remain at thebusiness entity level and do not go down to the specific query language.This differs from other work related to query personalization since we donot intend to extend and enrich queries by providing language-specific op-erators. As a result, our approach undeniably brings less expressivity butit is usable regardless of the actual data warehouse materialization. At theentity level, we defined users’ preferences and similarity as numerical indica-tors which can be used to determine items of interest in various conditions.
142 CHAPTER VII. CONCLUSION AND PERSPECTIVES
The user similarity measure helps define a social contribution in collabora-tive systems, for instance using other ratings given by users that are similarenough. Although metrics defined in Chapter V aim at being generic andreusable with varied domain models, they are still specific to BI and datawarehouses. More generally, this poses the problem of recommendationsrelying on heavy pre-computations and often made application specific dueto advanced optimizations. As part of future work, we would like to ex-tend the work we did to define our collaborative metrics and expose moregeneral computing capabilities through our situation management frame-work, for instance using the popular Apache Mahout API. However, doingso presents a certain number of challenges, in particular around scalabilityand data management. Indeed, should developers using our framework de-fine their own metrics, this could lead to important hurdles and impact theperformance of the whole platform.
To conclude on perspectives for our work, we would like to see furtherimprovements brought to BI platforms and we reckon that they offer animportant potential for personalization and recommendations. Doing socould for instance base on the industrialization and extension of techniqueslike those described in Chapter V.

Bibliography
[AAH+02] Heikki Ailisto, Petteri Alahuhta, Ville Haataja, V. Kyllonen,and Mikko Lindholm. Structuring context aware applica-tions: Five-layer model and example case. In Proceedings ofthe Workshop on Concepts and Models for Ubiquitous Com-puting, pages 1–5. Citeseer, 2002.
[ABL09] Sofiane Abbar, M. Bouzeghoub, and S. Lopez. Context-Aware Recommender Systems: A Service Oriented Ap-proach. In VLDB PersDB Workshop, pages 1–6, 2009.
[ACK09] Arvind Arasu, Surajit Chaudhuri, and Raghav Kaushik.Learning string transformations from examples. PVLDB,2(1):514–525, 2009.
[Ala08] Satnam Alag. Collective Intelligence in Action. ManningPublications, 2008.
[AS97] Varol Akman and Mehmet Surav. The Use of SituationTheory in Context Modeling. Computational Intelligence,13(3):427–438, August 1997.
[AT01] Gediminas Adomavicius and Alexander Tuzhilin. Multidi-mensional recommender systems: A data warehousing ap-proach. In Ludger Fiege, Gero Mhl, and Uwe Wilhelm, edi-tors, Electronic Commerce, volume 2232 of Lecture Notes inComputer Science, pages 180–192. Springer Berlin / Heidel-berg, 2001.
[AT05] Gediminas Adomavicius and Alexander Tuzhilin. Towardthe next generation of recommender systems: A survey ofthe state-of-the-art and possible extensions. IEEE Trans.Knowl. Data Eng., 17(6):734–749, 2005.
[ATZ05] Gediminas Adomavicius, Alexander Tuzhilin, and RongZheng. Rql: A query language for recommender systems.Information Systems Working Papers Series, 2005.
143
144 BIBLIOGRAPHY
[BBF+09] Fadila Bentayeb, Omar Boussaid, Cecile Favre, Franck Ra-vat, and Olivier Teste. Personnalisation dans les entrepotsde donnees: bilan et perspectives. In Entrepots de Donneeset l’Analyse en ligne (EDA 09), Montpellier, France, pages7–22, 2009.
[BBH+10] Claudio Bettini, Oliver Brdiczka, Karen Henricksen, Jad-wiga Indulska, Daniela Nicklas, Anand Ranganathan, andDaniele Riboni. A survey of context modelling and reason-ing techniques. Pervasive Mob. Comput., 6:161–180, April2010.
[BCG+08] Manish Bhide, V. Chakravarthy, Ajay Gupta, HimanshuGupta, Mukesh K. Mohania, Kriti Puniyani, Prasan Roy,Sourashis Roy, and Vibhuti S. Sengar. Enhanced businessintelligence using erocs. In ICDE, pages 1616–1619. IEEE,2008.
[BCQ+07] Cristiana Bolchini, Carlo Curino, Elisa Quintarelli, Fabio A.Schreiber, and Letizia Tanca. A data-oriented survey of con-text models. SIGMOD Record, 36(4):19–26, 2007.
[BDR07] Matthias Baldauf, Schahram Dustdar, and Florian Rosen-berg. A survey on context-aware systems. IJAHUC,2(4):263–277, 2007.
[BFMS06] Erik Behrends, Oliver Fritzen, Wolfgang May, and FranzSchenk. Combining eca rules with process algebras for thesemantic web. In Thomas Eiter, Enrico Franconi, RalphHodgson, and Susie Stephens, editors, RuleML, pages 29–38. IEEE Computer Society, 2006.
[BFPAGS+08] Yolanda Blanco-Fernndez, Jos J. Pazos-Arias, Alberto Gil-Solla, Manuel Ramos-Cabrer, Martn Lpez-Nores, JorgeGarca-Duque, Ana Fernndez-Vilas, Rebeca P. Daz-Redondo,and Jess Bermejo-Muoz. A flexible semantic inferencemethodology to reason about user preferences in knowledge-based recommender systems. Knowledge-Based Systems,21(4):305 – 320, 2008.
[BGM+05] Ladjel Bellatreche, Arnaud Giacometti, Patrick Marcel, Has-sina Mouloudi, and Dominique Laurent. A personalizationframework for olap queries. In Proceedings of the 8th ACMinternational workshop on Data warehousing and OLAP,DOLAP ’05, pages 9–18, New York, NY, USA, 2005. ACM.
BIBLIOGRAPHY 145
[BHH+10] Falk Brauer, Michael Huber, Gregor Hackenbroich, UlfLeser, Felix Naumann, and Wojciech M. Barczynski. Graph-based concept identification and disambiguation for enter-prise search. In Proceedings of the 19th international con-ference on World wide web, WWW ’10, pages 171–180, NewYork, NY, USA, 2010. ACM.
[Bur00] Robin Burke. Knowledge-based recommender systems. InEncyclopedia of Library and Information Systems, page2000. Marcel Dekker, 2000.
[CB07] Sylvain Castagnos and Anne Boyer. Personalized commu-nities in a distributed recommender system. In Proceedingsof the 29th European conference on IR research, ECIR’07,pages 343–355, Berlin, Heidelberg, 2007. Springer-Verlag.
[CBC08] Ivan Cantador, Alejandro Bellogın, and Pablo Castells.Ontology-Based Personalised and Context-Aware Recom-mendations of News Items. IEEE/WIC/ACM InternationalConference on Web Intelligence and Intelligent Agent Tech-nology, pages 562–565, December 2008.
[CD97] Surajit Chaudhuri and Umeshwar Dayal. An overview ofdata warehousing and OLAP technology. ACM SIGMODRecord, 26(1):65–74, March 1997.
[CDG01] S. Chaudhuri, U. Dayal, and V. Ganti. Database technologyfor decision support systems. Computer, 34(12):48–55, 2001.
[CFJ03] Harry Chen, Tim Finin, and Anupam Joshi. An ontologyfor context-aware pervasive computing environments. TheKnowledge Engineering Review, 18(3):197–207, September2003.
[CFV07] Pablo Castells, Miriam Fernandez, and David Vallet. Anadaptation of the vector-space model for ontology-based in-formation retrieval. IEEE Transactions on Knowledge andData Engineering, 19:261–272, 2007.
[CGF07] A.C.M. Costa, R.S.S.G.G. Guizzardi, and J.G.P. Filho.COReS: Context-aware, Ontology-based Recommender sys-tem for Service recommendation. In Proceedings of the 19thInternational Conference on Advanced Information SystemsEngineering, CAiSE’07, 2007.
[CGX09] Surajit Chaudhuri, Venkatesh Ganti, and Dong Xin. Min-ing document collections to facilitate accurate approximateentity matching. PVLDB, 2(1):395–406, 2009.
146 BIBLIOGRAPHY
[CHW01] Sonny Chee, Jiawei Han, and Ke Wang. Rectree: An effi-cient collaborative filtering method. In Yahiko Kambayashi,Werner Winiwarter, and Masatoshi Arikawa, editors, DataWarehousing and Knowledge Discovery, volume 2114 of Lec-ture Notes in Computer Science, pages 141–151. SpringerBerlin / Heidelberg, 2001.
[CK00] Guanling Chen and David Kotz. A survey of context-awaremobile computing research. Technical report, Hanover, NH,USA, 2000.
[CT98] Luca Cabibbo and Riccardo Torlone. Querying multidi-mensional databases. In Database Programming Languages,pages 319–335. Springer, 1998.
[DA99] Anind K. Dey and Gregory D. Abowd. Towards a betterunderstanding of context and context-awareness. In In HUC99: Proceedings of the 1st international symposium on Hand-held and Ubiquitous Computing, pages 304–307. Springer-Verlag, 1999.
[DAS01] Anind K. Dey, Gregory D. Abowd, and Daniel Salber. Aconceptual framework and a toolkit for supporting the rapidprototyping of context-aware applications. Hum.-Comput.Interact., 16:97–166, December 2001.
[Dey01] Anind K. Dey. Understanding and using context. Personaland Ubiquitous Computing, 5(1):4–7, 2001.
[DKDA07] Li Ding, Pranam Kolari, Zhongli Ding, and Sasikanth Avan-cha. Using ontologies in the semantic web: A survey. In RajSharman, Rajiv Kishore, and Ram Ramesh, editors, Ontolo-gies, volume 14 of Integrated Series in Information Systems,pages 79–113. Springer US, 2007. 10.1007/978-0-387-37022-4 4.
[DSP09] Marina Drosou, Kostas Stefanidis, and Evaggelia Pitoura.Preference-aware publish/subscribe delivery with diversity.Proceedings of the Third ACM International Conference onDistributed Event-Based Systems - DEBS ’09, page 1, 2009.
[EGCB09] Guillaume Ereteo, Fabien Gandon, Olivier Corby, andMichel Buffa. Semantic Social Network Analysis. In WebScience, Athenes, Grece, 2009.
[EIV07] Ahmed K. Elmagarmid, Panagiotis G. Ipeirotis, and Vassil-ios S. Verykios. Duplicate record detection: A survey. IEEETrans. Knowl. Data Eng., 19(1):1–16, 2007.
BIBLIOGRAPHY 147
[EPR08] J.E.O. Euzenat, J.E.O. Pierson, and Fano Ramparany. Dy-namic context management for pervasive applications. TheKnowledge Engineering Review, 23(1):21–49, 2008.
[FC04] Patrick Fahy and Siobhan Clarke. CASS - Middleware forMobile Context-Aware Applications. Workshop on ContextAwareness, MobiSys, 2004.
[Gha02] Rayid Ghani. Building recommender systems using a knowl-edge base of product semantics. Hypermedia and AdaptiveWeb based Systems, 2002.
[GMN08] Arnaud Giacometti, Patrick Marcel, and Elsa Negre. Aframework for recommending olap queries. In Proceeding ofthe ACM 11th international workshop on Data warehousingand OLAP, DOLAP ’08, pages 73–80, New York, NY, USA,2008. ACM.
[GMNS09] Arnaud Giacometti, Patrick Marcel, Elsa Negre, and Ar-naud Soulet. Query recommendations for olap discoverydriven analysis. In Proceeding of the ACM twelfth interna-tional workshop on Data warehousing and OLAP, DOLAP’09, pages 81–88, New York, NY, USA, 2009. ACM.
[Gor03] Narasimhaiah Gorla. Features to consider in a data ware-housing system. Communications of the ACM, 46(11):111–115, November 2003.
[GPZ05] Tao Gu, Hung Keng Pung, and Daqing Zhang. A service-oriented middleware for building context-aware services.Journal of Network and Computer Applications, 28(1):1–18,2005.
[GR09] Matteo Golfarelli and Stefano Rizzi. Expressing OLAP Pref-erences. Scientific and Statistical Database Management,5566/2009:83–91, 2009.
[GRB11] Matteo Golfarelli, Stefano Rizzi, and Paolo Biondi. myolap:An approach to express and evaluate olap preferences. IEEETransactions on Knowledge and Data Engineering, 23:1050–1064, 2011.
[GS01] Tom Gross and Marcus Specht. Awareness in context-awareinformation systems. In Mensch & Computer, volume 1,pages 173–182, 2001.

148 BIBLIOGRAPHY
[GWPZ04] Tao Gu, Xiao Hang Wang, Hung Keng Pung, and Da QingZhang. An ontology-based context model in intelligent en-vironments. In In Proceedings of Communication Networksand Distributed Systems, Modeling and Simulation confer-ence, pages 270–275, 2004.
[Hec05a] Dominik Heckmann. Distributed user modeling for situatedinteraction. In Armin B. Cremers, Rainer Manthey, PeterMartini, and Volker Steinhage, editors, GI Jahrestagung (1),volume 67 of LNI, pages 266–270. GI, 2005.
[Hec05b] Dominik Heckmann. Situation modeling and smart contextretrieval with semantic web technology and conflict resolu-tion. In Roth-Berghofer et al. [RBSL06], pages 34–47.
[HI04] Karen Henricksen and Jadwiga Indulska. Modelling and us-ing imperfect context information. pages 33–37, 2004.
[HIMB05] Karen Henricksen, Jadwiga Indulska, T. McFadden, andS. Balasubramaniam. Middleware for distributed context-aware systems. On the Move to Meaningful Internet Systems2005: CoopIS, DOA, and ODBASE, pages 846–863, 2005.
[HIR02] Karen Henricksen, Jadwiga Indulska, and Andry Rakotoni-rainy. Modeling context information in pervasive computingsystems. In Proceedings of the First International Confer-ence on Pervasive Computing, Pervasive ’02, pages 167–180,London, UK, 2002. Springer-Verlag.
[HKTR04] Jonathan L. Herlocker, Joseph a. Konstan, Loren G. Ter-veen, and John T. Riedl. Evaluating collaborative filteringrecommender systems. ACM Transactions on InformationSystems, 22(1):5–53, January 2004.
[HS05] John Horner and Il-Yeol Song. A taxonomy of inaccuratesummaries and their management in olap systems. In LoisM. L. Delcambre, Christian Kop, Heinrich C. Mayr, JohnMylopoulos, and Oscar Pastor, editors, ER, volume 3716 ofLecture Notes in Computer Science, pages 433–448. Springer,2005.
[Hul99] David A. Hull. Xerox trec-8 question answering track report.In TREC, 1999.
[IS03] Jadwiga Indulska and Peter Sutton. Location managementin pervasive systems. In Proceedings of the Australasian in-formation security workshop conference on ACSW frontiers

BIBLIOGRAPHY 149
2003 - Volume 21, ACSW Frontiers ’03, pages 143–151, Dar-linghurst, Australia, Australia, 2003. Australian ComputerSociety, Inc.
[JE09] Mohsen Jamali and Martin Ester. TrustWalker: a randomwalk model for combining trust-based and item-based recom-mendation. In John F. Elder IV, Francoise Fogelman-Soulie,Peter A. Flach, and Mohammed Javeed Zaki, editors, KDD,pages 397–406. ACM, 2009.
[JM06] Reed Jacobson and Stacia Misner. Microsoft SQLServer(TM) 2005 Analysis Services Step by Step. MicrosoftPress, Redmond, WA, USA, 2006.
[JRTZ08] Houssem Jerbi, Franck Ravat, Olivier Teste, and Gilles Zur-fluh. Management of context-aware preferences in multidi-mensional databases. 2008 Third International Conferenceon Digital Information Management, pages 669–675, Novem-ber 2008.
[JRTZ09a] Houssem Jerbi, Franck Ravat, Olivier Teste, and Gilles Zur-fluh. Applying recommendation technology in OLAP sys-tems. Enterprise Information Systems, pages 220–233, 2009.
[JRTZ09b] Houssem Jerbi, Franck Ravat, Olivier Teste, and Gilles Zur-fluh. Preference-based recommendations for olap analysis.In Torben Pedersen, Mukesh Mohania, and A Tjoa, editors,Data Warehousing and Knowledge Discovery, volume 5691 ofLecture Notes in Computer Science, pages 467–478. SpringerBerlin / Heidelberg, 2009.
[KBA11] Nicolas Kuchmann-Beauger and Marie-Aude Aufaure. Anatural language interface for data warehouse question an-swering. In Proceedings to the 16th International Confer-ence on Applications of Natural Language to InformationSystems, 2011. to be published.
[KK07] Sungrim Kim and Joonhee Kwon. Effective Context-awareRecommendation on the Semantic Web. Journal of Com-puter Science and Network Security, 7(8):154–159, 2007.
[KN10] Natalija Kozmina and Laila Niedrite. Olap personalizationwith user-describing profiles. In Peter Forbrig, Horst Gnther,Will Aalst, John Mylopoulos, Norman M. Sadeh, Michael J.Shaw, and Clemens Szyperski, editors, Perspectives in Busi-ness Informatics Research, volume 64 of Lecture Notes in
150 BIBLIOGRAPHY
Business Information Processing, pages 188–202. SpringerBerlin Heidelberg, 2010.
[Kob07] Alfred Kobsa. Generic user modeling systems. In PeterBrusilovsky, Alfred Kobsa, and Wolfgang Nejdl, editors, TheAdaptive Web, volume 4321 of Lecture Notes in ComputerScience, pages 136–154. Springer, 2007.
[KPC06] Anders Kofod-Petersen and Jorg Cassens. Using activity the-ory to model context awareness. In Thomas Roth-Berghofer,Stefan Schulz, and David Leake, editors, Modeling and Re-trieval of Context, volume 3946 of Lecture Notes in ComputerScience, pages 1–17. Springer Berlin / Heidelberg, 2006.10.1007/11740674 1.
[KPVOGM05] Manuele Kirsch-Pinheiro, Marlene Villanova-Oliver, JeromeGensel, and Herve Martin. Context-aware filtering for collab-orative web systems: adapting the awareness information tothe user’s context. In Hisham Haddad, Lorie M. Liebrock,Andrea Omicini, and Roger L. Wainwright, editors, SAC,pages 1668–1673. ACM, 2005.
[Lai07] Juhani Laitakari. Dynamic context monitoring for adaptiveand context-aware applications. PhD thesis, 2007.
[LCCH10] C.-H. Liu, K.-L. Chang, Jason J.-Y. Chen, and S.-C. Hung.Ontology-based context representation and reasoning usingowl and swrl. In CNSR, pages 215–220. IEEE ComputerSociety, 2010.
[LD06] Antonis Loizou and Srinandan Dasmahapatra. Recom-mender systems for the semantic web. In ECAI 2006 Rec-ommender Systems Workshop, 2006.
[MA04] Paolo Massa and Paolo Avesani. Trust-aware collaborativefiltering for recommender systems. In Robert Meersman andZahir Tari, editors, On the Move to Meaningful Internet Sys-tems 2004: CoopIS, DOA, and ODBASE, volume 3290 ofLecture Notes in Computer Science, pages 492–508. SpringerBerlin / Heidelberg, 2004.
[MB04] Paolo Massa and Bobby Bhattacharjee. Using trust in rec-ommender systems: An experimental analysis. In Chris-tian Jensen, Stefan Poslad, and Theo Dimitrakos, editors,Trust Management, volume 2995 of Lecture Notes in Com-puter Science, pages 221–235. Springer Berlin / Heidelberg,2004.
BIBLIOGRAPHY 151
[MLT09] Jose-Norberto Mazon, Jens Lechtenborger, and Juan Tru-jillo. A survey on summarizability issues in multidimensionalmodeling. Data Knowl. Eng., 68(12):1452–1469, 2009.
[MMN02] Prem Melville, Raymond J. Mooney, and Ramadass Nagara-jan. Content-boosted collaborative filtering for improved rec-ommendations. In in Eighteenth National Conference on Ar-tificial Intelligence, pages 187–192, 2002.
[MN11] Patrick Marcel and Elsa Negre. A survey of query recommen-dation techniques for datawarehouse exploration. In Proceed-ings of 7th Conference on Data Warehousing and On-LineAnalysis (Entrepts de Donnes et Analyse), EDA’11, 2011.
[MRS08] Christopher D. Manning, Prabhakar Raghavan, and HinrichSchutze. Introduction to Information Retrieval. CambridgeUniversity Press, July 2008.
[NNT01] Tapio Niemi, Jyrki Nummenmaa, and Peter Thanisch. Con-structing OLAP cubes based on queries. In Proceedings ofthe 4th ACM international workshop on Data warehousingand OLAP, pages 9–15, New York, New York, USA, 2001.ACM.
[OA97] P. Ozturk and Agnar Aamodt. Towards a model of contextfor case-based diagnostic problem solving. In Context-97;Proceedings of the interdisciplinary conference on modelingand using context, pages 198–208. Citeseer, 1997.
[OS05] John O’Donovan and Barry Smyth. Trust in recommendersystems. In Proceedings of the 10th international conferenceon Intelligent user interfaces, IUI ’05, pages 167–174, NewYork, NY, USA, 2005. ACM.
[PBMW97] Michael Pazzani, Daniel Billsus, S. Michalski, and JanuszWnek. Learning and revising user profiles: The identificationof interesting web sites. InMachine Learning, pages 313–331,1997.
[PdCDL08] E Peis, JMM del Castillo, and JA Delgado-Lopez. Seman-tic recommender systems. analysis of the state of the topic.Hipertext, pages 1–9, 2008.
[PHG00] David M. Pennock, Eric Horvitz, and C. Lee Giles. Socialchoice theory and recommender systems: Analysis of the ax-iomatic foundations of collaborative filtering. In Proceedings
152 BIBLIOGRAPHY
of the Seventeenth National Conference on Artificial Intelli-gence and Twelfth Conference on Innovative Applications ofArtificial Intelligence, pages 729–734. AAAI Press, 2000.
[PJ01] Torben Bach Pedersen and Christian S. Jensen. Multidimen-sional database technology. Computer, 34:40–46, 2001.
[PMT08] Jesus Pardillo, Jose-Norberto Mazon, and Juan Trujillo.Bridging the semantic gap in OLAP models: platform-independent queries. In Proceeding of the ACM 11th inter-national workshop on Data warehousing and OLAP, pages89–96. ACM, 2008.
[RA09] Oscar Romero and Alberto Abello. A survey of multidimen-sional modeling methodologies. IJDWM, 5(2):1–23, 2009.
[RBSL06] Thomas Roth-Berghofer, Stefan Schulz, and David B. Leake,editors. Modeling and Retrieval of Context, Second Interna-tional Workshop, MRC 2005, Edinburgh, UK, July 31 - Au-gust 1, 2005, Revised Selected Papers, volume 3946 of LectureNotes in Computer Science. Springer, 2006.
[RCARM09] Oscar Romero, Diego Calvanese, Alberto Abello, and Mari-ano Rodrıguez-Muro. Discovering functional dependenciesfor multidimensional design. In Proceeding of the ACMtwelfth international workshop on Data warehousing andOLAP, DOLAP ’09, pages 1–8, New York, NY, USA, 2009.ACM.
[Riz11] Stefano Rizzi. New Frontiers in business intelligence: distri-bution and personalization. In Advances in Databases andInformation Systems, pages 23–30. Springer, 2011.
[RT09] Franck Ravat and Olivier Teste. Personalization and olapdatabases. In Stanislaw Kozielski and Robert Wrembel, ed-itors, New Trends in Data Warehousing and Data Analy-sis, volume 3 of Annals of Information Systems, pages 1–22.Springer US, 2009. 10.1007/978-0-387-87431-9 4.
[Sal88] Gerald Salton, editor. Automatic text processing. Addison-Wesley Longman Publishing Co., Inc., Boston, MA, USA,1988.
[SAM98] Sunita Sarawagi, Rakesh Agrawal, and Nimrod Megiddo.Discovery-driven Exploration of OLAP Data Cubes. Tech-nical report, IBM, 1998.
BIBLIOGRAPHY 153
[Sap99] Carsten Sapia. On modeling and predicting query behav-ior in olap systems. In Stella Gatziu, Manfred A. Jeusfeld,Martin Staudt, and Yannis Vassiliou, editors, DMDW, vol-ume 19 of CEUR Workshop Proceedings, page 2. CEUR-WS.org, 1999.
[Sar00] Sunita Sarawagi. User-adaptive exploration of multidimen-sional data. In Proceedings of the 26th Conference on VeryLarge DataBases (VLDB), Cairo, Egypt, 2000., 2000.
[SAW94] Bill Schilit, Norman Adams, and Roy Want. Context-awarecomputing applications. In In Proceedings of the Workshopon Mobile Computing Systems and Applications, pages 85–90. IEEE Computer Society, 1994.
[SBG99] Albrecht Schmidt, Michael Beigl, and Hans-W Gellersen.There is more to context than location. Computers & Graph-ics, 23(6):893 – 901, 1999.
[Sch02] Albrecht Schmidt. Ubiquitous computingcomputing in con-text. PhD thesis, 2002.
[Sch05] Sven Schwarz. A context model for personal knowledge man-agement applications. In Roth-Berghofer et al. [RBSL06],pages 18–33.
[Sch06a] Andreas Schmidt. A layered model for user context man-agement with controlled aging and imperfection handling.Modeling and Retrieval of Context, pages 86–100, 2006.
[Sch06b] Sven Schwarz. A context model for personal knowledge man-agement applications. In Thomas Roth-Berghofer, StefanSchulz, and David Leake, editors, Modeling and Retrieval ofContext, volume 3946 of Lecture Notes in Computer Science,pages 18–33. Springer Berlin / Heidelberg, 2006.
[SDP09] Kostas Stefanidis, Marina Drosou, and E. Pitoura. You MayAlso Like Results in Relational Databases. Proc. PersDB,Lyon, France, 2009.
[SK09] Xiaoyuan Su and Taghi M. Khoshgoftaar. A survey of col-laborative filtering techniques. Advances in Artificial Intel-ligence, 2009:4:2–4:2, January 2009.
[SKKR00] Badrul M. Sarwar, George Karypis, Joseph A. Konstan, andJohn T. Riedl. Application of dimensionality reduction inrecommender systemsa case study. In In ACM WebKDDWorkshop, 2000.

154 BIBLIOGRAPHY
[SKKR01] Badrul Sarwar, George Karypis, Joseph Konstan, and JohnReidl. Item-based collaborative filtering recommendation al-gorithms. In Proceedings of the 10th international conferenceon World Wide Web, WWW ’01, pages 285–295, New York,NY, USA, 2001. ACM.
[SLP04] Thomas Strang and C. Linnhoff-Popien. A context model-ing survey. In Workshop on Advanced Context Modelling,Reasoning and Management as part of UbiComp, pages 1–8.Citeseer, 2004.
[SMB07] Ahu Sieg, Bamshad Mobasher, and Robin Burke. Ontologi-cal User Profiles as the Context Model in Web Search, 2007.
[SS01] Gayatri Sathe and Sunita Sarawagi. Intelligent Rollups inMultidimensional OLAP Data. In Proceedings of the 27thVLDB Conference, Rome, Italy, 2001.
[Tat06] E I Tatli. Context data model for privacy. Department ofComputer Science University of Mannheim, page 0607, 2006.
[TSM01] Thomas Thalhammer, Michael Schrefl, and Mukesh Moha-nia. Active data warehouses: complementing olap with anal-ysis rules. Data amp; Knowledge Engineering, 39(3):241 –269, 2001. ¡ce:title¿Data warehousing¡/ce:title¿.
[Vas98] Panos Vassiliadis. Modeling multidimensional databases,cubes and cube operations. In Scientific and StatisticalDatabase Management, 1998. Proceedings. Tenth Interna-tional Conference on, pages 53–62. IEEE, 1998.
[Vas09] Panos Vassiliadis. A survey of ExtracttransformLoad tech-nology. IJDWM, 5(3):1–27, 2009.
[WFG92] Roy Want, Veronica Falcao, and Jon Gibbons. The activebadge location system. ACM Transactions on InformationSystems, 10:91–102, 1992.
[WS07] Wolfgang Woerndl and Johann Schlichter. Introducing con-text into recommender systems. In Short Paper, Proc. AAAI2007 Workshop on Recommender Systems in e-Commerce,pages 138–140, 2007.
[YL06] S.S. Yau and Junwei Liu. Hierarchical situation model-ing and reasoning for pervasive computing. In SoftwareTechnologies for Future Embedded and Ubiquitous Systems,2006 and the 2006 Second International Workshop on Col-laborative Computing, Integration, and Assurance. SEUS

BIBLIOGRAPHY 155
2006/WCCIA 2006. The Fourth IEEE Workshop on, page 6pp., april 2006.
[Zie05] Cai-Nicolas Ziegler. Semantic web recommender systems.In Wolfgang Lindner, Marco Mesiti, Can Trker, YannisTzitzikas, and Athena Vakali, editors, Current Trends inDatabase Technology - EDBT 2004 Workshops, volume3268 of Lecture Notes in Computer Science, pages 521–521. Springer Berlin / Heidelberg, 2005. 10.1007/978-3-540-30192-9 8.
[ZL07] Andreas Zimmermann and Andreas Lorenz. A.: An opera-tional definition of context. In: CONTEXT, 2007.
[ZStL04] Cai-nicolas Ziegler, Lars Schmidt-thieme, and Georg Lausen.Exploiting Semantic Product Descriptions for RecommenderSystems Categories and Subject Descriptors. In Proceedingsof the ACM SIGIR Semantic Web and Information RetrievalWorkshop, SWIR’04, 2004.

156 BIBLIOGRAPHY
List of Figures
I.1 Overview of the proposed situation management platformwhich aggregates information from different sources and ex-poses consolidated situation models. . . . . . . . . . . . . . . 2
II.1 Classification of personalization techniques proposed by Ben-tayeb et al. [BBF+09], according to user involvement and sys-tem functions. . . . . . . . . . . . . . . . . . . . . . . . . . . . 6
II.2 When a user adds an item in her shopping cart, Amazon.comproposes recommendations of the form “users who boughtthis also bought. . . ”. . . . . . . . . . . . . . . . . . . . . . . . 12
II.3 The five layers of context-aware systems high-level architecture. 27
II.4 Simple example of a Sales fact table defining two measuresRevenue and Quantity sold. These measures can be analyzedagainst 3 dimensions (at the finest level): Product, Date andShop. . . . . . . . . . . . . . . . . . . . . . . . . . . . . . . . . 31
III.1 Example of situation graph for the user Marge. . . . . . . . . 46
III.2 Class diagram - Overview of the graph model used and ex-posed by the Graph Repository. . . . . . . . . . . . . . . . . . 49
III.3 Class diagram - Overview of the internal object-based situ-ation model, including core dimensions and personalization-related dimensions. . . . . . . . . . . . . . . . . . . . . . . . . 53
III.4 Relations constituting the social network for the user Marge.Only users at a maximum depth of 2 are displayed. . . . . . . 56
IV.1 Architecture overview of the situation management platformand its major components: events, activation rules and oper-ators. . . . . . . . . . . . . . . . . . . . . . . . . . . . . . . . 64
IV.2 Class diagram - Core components of the modular GraphRepository architecture. Providers and graphs factories aremodules which can easily be extended. . . . . . . . . . . . . . 74
IV.3 Security model of the GraphRepoFactory, managing creden-tials for different applicative agents authorized by users. . . . 76
157
158 LIST OF FIGURES
IV.4 Class diagram - Overview of the situation framework. Themain dynamic components are events, activation rules andoperators. . . . . . . . . . . . . . . . . . . . . . . . . . . . . . 78
IV.5 Three levels of authorizations and personalization for users.Providers, operators and activation rules may be enabled (ordisabled) to compose personalized and dynamic GR. . . . . . 80
IV.6 Sequence diagram for rules evaluation in reaction to an eventposted in a given situation. The EventsProcessor polls thequeue until it is empty to evaluate rules thanks to queries onthe GR. . . . . . . . . . . . . . . . . . . . . . . . . . . . . . . 81
IV.7 Examples of client applications interacting with the situationmanagement platform to provide personalized and dynamicadapatation. . . . . . . . . . . . . . . . . . . . . . . . . . . . . 82
V.1 Architecture overview of the proposed personalized query ex-pansion system for multi-dimensional models. . . . . . . . . . 89
V.2 Hierarchies and functional dependencies between some mea-sures (purple nodes) and dimensions (yellow), described inan Island Resorts Marketing domain model (red) of a datawarehouse. . . . . . . . . . . . . . . . . . . . . . . . . . . . . 91
V.3 Reasoning rules applied on an example with various measures(purple) and dimensions (gray). Dashed relations are state-ments resulting from rule-based reasoning (rules R1 and R2). 93
V.4 Comparison of users similarity matrices obtained with Pear-son correlation and cosine similarity. Computation is basedon users and preferences described in Table V.1. . . . . . . . 99
V.5 A sample dashboard view, USA Sales View. This view de-fines 3 charts presenting analysis of sales revenue accordingto various dimensions. . . . . . . . . . . . . . . . . . . . . . . 100
V.6 Graph describing a dashboard (orange), USA Sales View, itsassociated charts (blue) and referenced measures (purple) anddimensions (yellow). . . . . . . . . . . . . . . . . . . . . . . . 101
V.7 Proposed integration of the personalized query expansioncomponent with graph repository and situation managementframeworks. . . . . . . . . . . . . . . . . . . . . . . . . . . . . 107
V.8 Comparison of two proposed reasoning solutions to determinefull dependencies in graphs populated from multi-dimensionalmodels. . . . . . . . . . . . . . . . . . . . . . . . . . . . . . . 108
V.9 Evaluation of the reasoning time function of the size of themulti-dimensional model (number of nodes, measures or di-mensions). . . . . . . . . . . . . . . . . . . . . . . . . . . . . . 109

LIST OF FIGURES 159
VI.1 Text-To-Query exposed to the end-user as an add-in for Pow-erPoint. Charts suggestions appear in the right panel and canbe dragged and dropped in the slide. . . . . . . . . . . . . . . 116
VI.2 Mapping of some measures (purple) and dimensions (yellow)to Standard Analysis Categories (blue). . . . . . . . . . . . . 119
VI.3 Graph view of entities extracted in document1 (left part),which corresponds to the presentation slide illustrated in VI.1. 120
VI.4 Architecture overview for Text-To-Query integrated with thegraph repository and situation management frameworks. . . . 124
VI.5 Excel add-in for the situation platform, exposing Text-To-Query recommendations. Suggested queries appear in theright panel. Charts and data tables and can be inserted inthe spreadsheet. . . . . . . . . . . . . . . . . . . . . . . . . . . 126
VI.6 Mobile client for the situation platform, exposing Text-To-Query recommendations. The user can select suggestedqueries in a list to look at the generated chart and under-lying data. . . . . . . . . . . . . . . . . . . . . . . . . . . . . . 127
VI.7 Architecture overview for the open search platform, using ourgraph repository and situation management frameworks. . . . 128
VI.8 Screenshot of auto-completion in the search text box. (a)First suggestions after characters “sa” and (b) suggestionsfollowing the selection of measure Sales revenue and character“c”. . . . . . . . . . . . . . . . . . . . . . . . . . . . . . . . . 131
VI.9 Charts search results for the query “Sales revenue” annotatedwith the measure of the same name, from dashboards avail-able in the user account. . . . . . . . . . . . . . . . . . . . . . 132
VI.10Graph of plugins available in the search platform, of differenttypes: search, answer and auto-completion plugins. . . . . . . 133

160 LIST OF FIGURES
List of Tables
III.1 Examples of (partial) statements, some of which constituteMarge’s situation as represented by the graph in Figure III.1. 46
IV.1 Examples of operators. This include system operators andspecific ones related to some of our experimentations (seeChapter VI). . . . . . . . . . . . . . . . . . . . . . . . . . . . 72
V.1 Matrix of numeric users preferences regarding certain dimen-sions and measures. These values include explicit and implicitcontributions to preferences. . . . . . . . . . . . . . . . . . . . 98
V.2 Symetric matrix of co-occurrences (in a personal collection ofdashboards) between various dimensions and measures of amulti-dimensional domain model. . . . . . . . . . . . . . . . . 102
161